 Megan E. Hanna1,2*
 Erin M. Chandler3*
 Brice X. Semmens1
 Tomoharu Eguchi2Garrett E. Lemons2
 Jeffrey A. Seminoff2
- 1Scripps Institution of Oceanography, University of California, San Diego, San Diego, CA, United States
- 2Marine Turtle Ecology & Assessment Program, NOAA-Southwest Fisheries Science Center, La Jolla, CA, United States
- 3Deepwater Horizon Gulf Restoration Office, US Fish and Wildlife Service, Fairhope, AL, United States
East Pacific (EP) green turtles (Chelonia mydas) have undergone substantial population recovery over the last two decades owing to holistic protection at nesting beaches and foraging areas. At the northern end of their range in southern California United States, green turtles have been seen in more areas and in greater numbers since 2014 than before as a result. A resident population of green turtles has established near La Jolla Shores (LJS), a protected site with daily marine tourism (e.g., kayakers, snorkelers, divers). To study this local aggregation, innovative and non-invasive methods were required because the traditional capture-recapture methods were infeasible due to public relations sensitivities. Green turtle habituation to humans at this site has created a unique opportunity for citizen-based science using underwater photography to document turtles and their surroundings. We obtained 309 usable photographs of local green turtles from members of the dive/snorkel community in LJS. Photos were taken from April 2016 to June 2019. Images were processed in Hotspotter—a patterned species instance recognition software—to identify seven individuals, five of which were consistently photographed throughout that period. These images helped infer minimum residency duration (MRD), seasonal differences in algal coverage on the carapace, habitat association, behavioral patterns, and diet. Mean MRD was 424 days (SE = 131 days, calculated from entire population, n = 7), during which turtles were active in 82.8% of the photographs; the remainder of the photographs depicted foraging (14.9%) or resting behavior (2.3%). Green turtles were seen foraging in water temperatures as low as 15.8°C, the lowest recorded temperature for foraging green turtles documented in literature. Additional opportunistic observational platforms were used to look at trends of increasing green turtle abundance in southern California since 2015 that supported the arrival of a new aggregation of green turtles in LJS. Our use of citizen-sourced photographs confirms the presence of a resident aggregation of green turtles in LJS. Existence of green turtles and other protected species in highly populated areas provide excellent opportunities to educate beachgoers and seafarers about conservation of these species. This study also highlights the value of citizen-based science in areas where traditional research techniques are ill-suited.
Introduction
Citizen-based science is a method of data collection that requires engaging with local citizens through public outreach, thus bridging the gap between community awareness and scientific research (Dickinson et al., 2010). This method of data collection can be useful by providing more eyes in more places, increasing the likelihood of detecting ecological patterns that could otherwise be overlooked (Pattengill-Semmens and Semmens, 2003; Tulloch et al., 2013). Also known as “community-based science,” this approach can provide large datasets and help with data collection in hard-to-access areas or when organisms are difficult to find. Citizen-based science can also provide an opportunity to utilize interested citizens in order to generate data useful for scientific inquiry that would otherwise be unattainable for scientists or agencies with limited funding and resources. Such projects can guide public contributors on how best to collect scientific information while also educating the public on societal impacts and the value of their efforts, which provides opportunities for social awareness (Pattengill-Semmens, 2001; Dickinson et al., 2012).
With the growth of wildlife photography, due in part to advanced camera and mobile technology, the role of local communities in scientific data collection via photography has expanded (e.g., Azzurro et al., 2013; Baumbach et al., 2019). Participating citizens can now download various applications onto their mobile devices allowing them to submit photographs along with time and GPS location data (Michonneau and Paulay, 2015; Baumbach and Dunbar, 2017; Papafitsoros et al., 2020; Dunbar et al., 2021). Citizens are able to contribute to scientific research as they go about their daily life, while exploring local ecosystems, or when traveling to remote locations (Graham et al., 2011; Read and Jean, 2021). Further, advances in action cameras have allowed photographing for citizen-based science to become simple, low cost, user friendly and portable such that digital images can be collected in both terrestrial and marine environments (Raoult et al., 2016).
There are many elusive species in the marine realm that are difficult to observe. Sea turtles in particular are highly migratory taxon that occupy several different marine habitats over the course of their lives and are often elusive for visual observation and photographing (Carr et al., 1978; Plotkin, 2002). Scientists may use tracking techniques such as satellite and acoustic telemetry to monitor movements in these areas (Hussey et al., 2015; Jeffers and Godley, 2016), yet these techniques are expensive and require appropriate permitting and physical contact with turtles. In addition, there are many sea turtle foraging sites (e.g., Great Barrier Reef, Cayman Islands) that overlap with areas that have high amounts of recreational activities such as snorkeling, diving, kayaking and paddle boarding (Baumbach et al., 2019), and are thus may be inappropriate for hosting invasive turtle capture efforts. In these areas, citizen science has provided unique opportunities to gather large amounts of data in a minimally intrusive way while also educating the public about local species and their ecology (Bell et al., 2008; Hof et al., 2017; Nordstrom et al., 2019; Dunbar et al., 2021). However, maximizing the value of citizen science requires some level of engagement with professional scientists or researchers to help orient and inform best practices for data collection. Scientists that study these local species typically possess a wealth of knowledge on the ecology and biology of these species and their habitats. For example, scientists can provide information on diet, behavior, abundance, and distribution to citizens that are interested in learning more about the species that they observe. Scientists can also educate the public on the appropriate methods for observing local species which can help to improve conservation and protection of these species and their habitats (Papafitsoros et al., 2020). Thus, citizen-based science can provide a symbiotic relationship between interested citizens and scientists.
Green turtle (Chelonia mydas) juveniles demonstrate high levels of site fidelity to coastal foraging areas, often residing at the same site for years while growing to maturity (Broderick et al., 2007; Eguchi et al., 2010). Green turtles in the eastern Pacific Ocean reside in coastal foraging areas from the United States to Chile and are considered a genetically distinct regional management unit (RMU; Wallace et al., 2010). This RMU has demonstrated substantial population recovery in recent decades due to a combination of nesting beach protection and reduction of illegal hunting and incidental mortality in foraging areas (Seminoff et al., 2015). For example, green turtle nesting abundance at Colola Beach, Michoacán Mexico—the primary nesting beach for this RMU—has increased from a mean of ca. 230 females/nesting season in the early 1980s to more than 7,500 females/year from 2014 to 2017 (Delgado-Trejo and Alvarado-Figueroa, 2012; Seminoff et al., 2015). There has been a commensurate increase in green turtle abundance in foraging areas throughout the region, especially in northwestern Mexico and southern California United States (Grupo Tortuguero, unpubl. data, NOAA unpubl. data).
Along the southern California coast green turtles have been studied at two foraging aggregations, San Diego Bay and Seal Beach National Wildlife Refuge/San Gabriel river, the latter considered the putative northern-most year-round foraging aggregation for the population (Crear et al., 2016, 2017). Green turtles have also been seen in many areas outside of these two research sites by a variety of marine stakeholders (e.g., surfers, fishers, boaters, kayakers, etc.; REEF (Reef Environmental Education Foundation) database, NOAA unpubl. data). In San Diego County, for example, recent opportunistic observations indicate that La Jolla Shores (Figure 1) is a site where green turtles have regularly occurred since at least 2015. Throughout the year, swimmers, snorkelers, divers, kayakers and paddle boarders are on or in the water daily at this location. Because of the high human traffic in the area, the resident green turtles at La Jolla Shores have become habituated to humans such that they will not swim away when approached, and some individual turtles display curiosity toward divers and snorkelers (E. Chandler and M. Hanna, pers. obs.). This habituation has offered opportunities for citizens to become involved with data collection via underwater photography to contribute to ongoing green turtle research in the region.
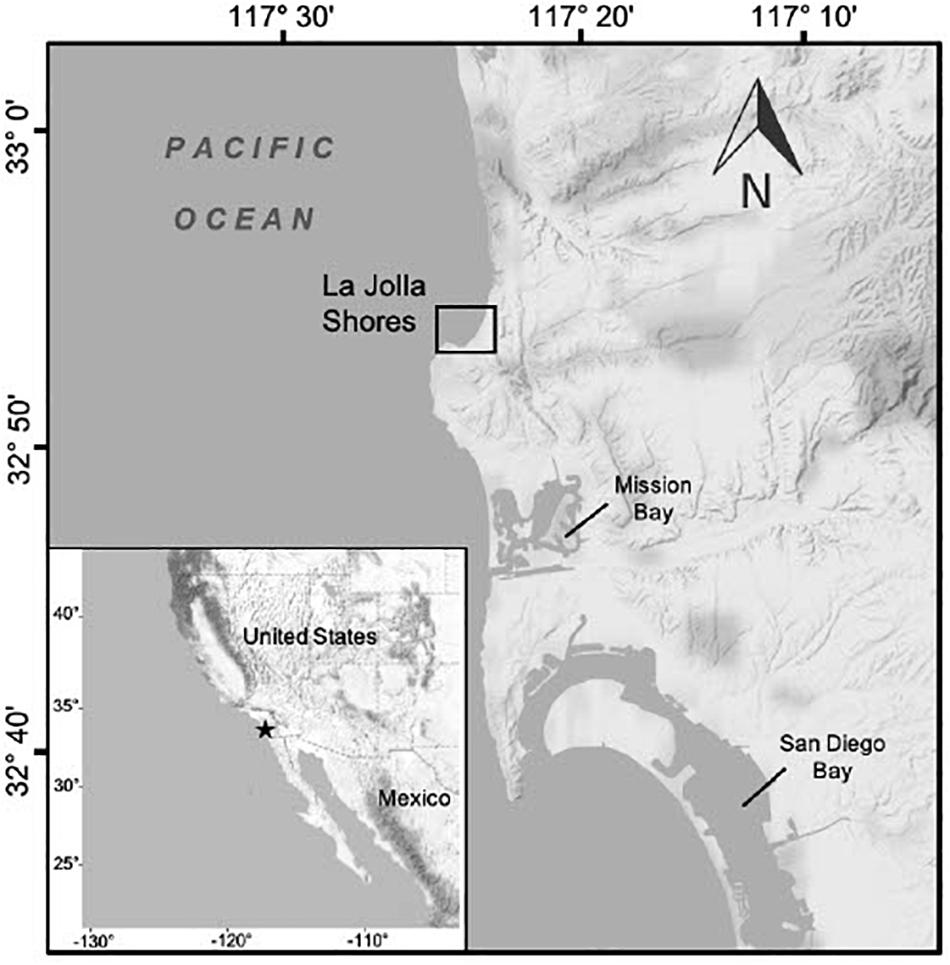
Figure 1. Shows an inset with a map of the west coast of North America from California to Baja California, and a background map featuring the coastline of San Diego, California. Noted on the inset map are the United States and Mexico with a black star detailing the geographic location of San Diego on the western coastline. The larger background map details the geographic location of La Jolla Shores, the main study area, with a black square. The background map also features Mission Bay and San Diego Bay.
In this study, we engaged with local amateur marine photographers to amass a green turtle image library that, when analyzed, provided information about green turtle population biology and ecology. We augmented these data with opportunistic reports from the public via a NOAA-managed sea turtle sightings hotline and by accessing a public database organized by Reef Environmental Education Foundation (REEF, 2020) that contains sighting information of marine megafauna throughout southern California. Our goals were to (1) identify individual green turtles in the area via facial recognition software to establish minimum abundance, (2) examine occurrence patterns via timing of sequential photographs for each turtle, (3) explore their diet and habitat use via prey associations and seafloor characteristics depicted in each photograph, and (4) investigate the expansion of east Pacific green turtle distribution in southern California and the relative timeframe of this expansion using opportunistic observations and reports. Our analyses provide a baseline understanding of green turtle biology within La Jolla Shores, and provide insights that will help in the development of effective conservation practices for local green turtles, which is especially relevant in light of the burgeoning human and green turtle populations in the region. Our findings will also add to the growing body of information that is derived from citizen-based science.
Materials and Methods
Study Site
La Jolla Shores is a semi-protected cove located along the coast of San Diego County, California (32.858° N, 117.253° W; Figure 1). This area lies within the San Diego-Scripps Coastal Marine Conservation Area and Matlahuayl State Marine Reserve which together span ca. 269.36 hectares of marine habitats and prohibit recreational and commercial take of all marine resources. Water depth ranges from 1.5 to 10 m, and the area has high wave action and surge that provides a constant influx of cool, nutrient-rich water that promotes high marine productivity (Brueggeman, 2009). Benthic habitats are characterized by rocky reefs covered in surf grass (Phyllospadix spp.), as well as red, green, and brown algae (Fenical and Norris, 1975; Gunnill, 1980; Druehl, 2000), some of which are invasive (e.g., sargassum, Sargassum muticum). The area also includes large patches of California giant kelp (Macrocystis pyrifera). In addition to its protected status, La Jolla Shores is a high-traffic area for ecotourism and recreational ocean activities. On a daily basis local marine stakeholders and tourists engage in snorkeling, scuba diving, paddle boarding and more, while several ecotourism businesses conduct kayak, snorkeling, and dive tours throughout the LJS area.
Photography and Digital Image Recognition
Photographs used for the project were collected from several local photographers that frequented the study site. Initially, photographs were accepted from all willing contributors that had photographed a turtle in the area. However, as the project progressed, contributions coalesced around three primary individuals who regularly visited the study site. The three primary photographers used in this study were selected because these individuals provided consistent communication and were known to visit the site more frequently than other photographers that submitted photos. Most importantly, these three photographers were able to provide accurate date and time stamp information for the photos used in this study. We do, however, acknowledge that using only three select photographers may have caused potential bias in the study as these photographers likely had cumulatively less time in the study area compared to the local underwater photography community at large. All three photographers used Sony model ICLE-6000, Canon model 80d, or GoPro cameras in waterproof housings. Adobe Lightroom® was used in some cases to enhance photographs making it easier for turtle identification. Photographers were instructed to focus on capturing the left and right head profiles of each individual in order to target the post-orbital scales, which are the primary focal point of most sea turtle individual recognition software packages (e.g., Dunbar et al., 2014, 2021). Photographs that incorporated portions of the head, flippers or carapace were also useful to distinguish individuals. Both video and still shots were gathered during the collection process and sorted as “usable” and “unusable” based on image quality, clarity, and orientation of the turtle. Safe and responsible viewing procedures followed practices outlined in the NOAA Marine Life Viewing Guidelines (photographers were asked to remain at distance, and to never make physical contact with the turtles, or otherwise alter their behavior).
Photographs were run through pattern recognition software called “Hotspotter” that digitally identified individual turtles (Crall et al., 2013a). Briefly, Hotspotter uses two algorithms (“one-vs.-one” and “one-vs.-many”) to determine and extract key landmark points and patterns within in an image and compare these with the same attributes from all other photographs contained within the image database. The “one-vs.-one” algorithm takes a single image and compares it to all other images within the database, assigning a similarity score to each comparison and providing a ranked list of possible matches. The “one-vs.-many” algorithm takes only the key points from a single image and compares them to all other key points from images contained within the database (Crall et al., 2013a, b). In all cases, a cropping tool is used to select an area of interest (a “chip”; Figure 2) within each image: for this research, the side profile of the head for each individual was selected. Chips were then run through a “query” and the six best image matches based on similarity scores were provided. Human-assisted review of the autonomous output was conducted to decide which, if any, of the images contained the same turtle. The chips were then assigned to a specific turtle; each turtle was assigned a field ID (CM1-CM8) that corresponded to a specific individual.
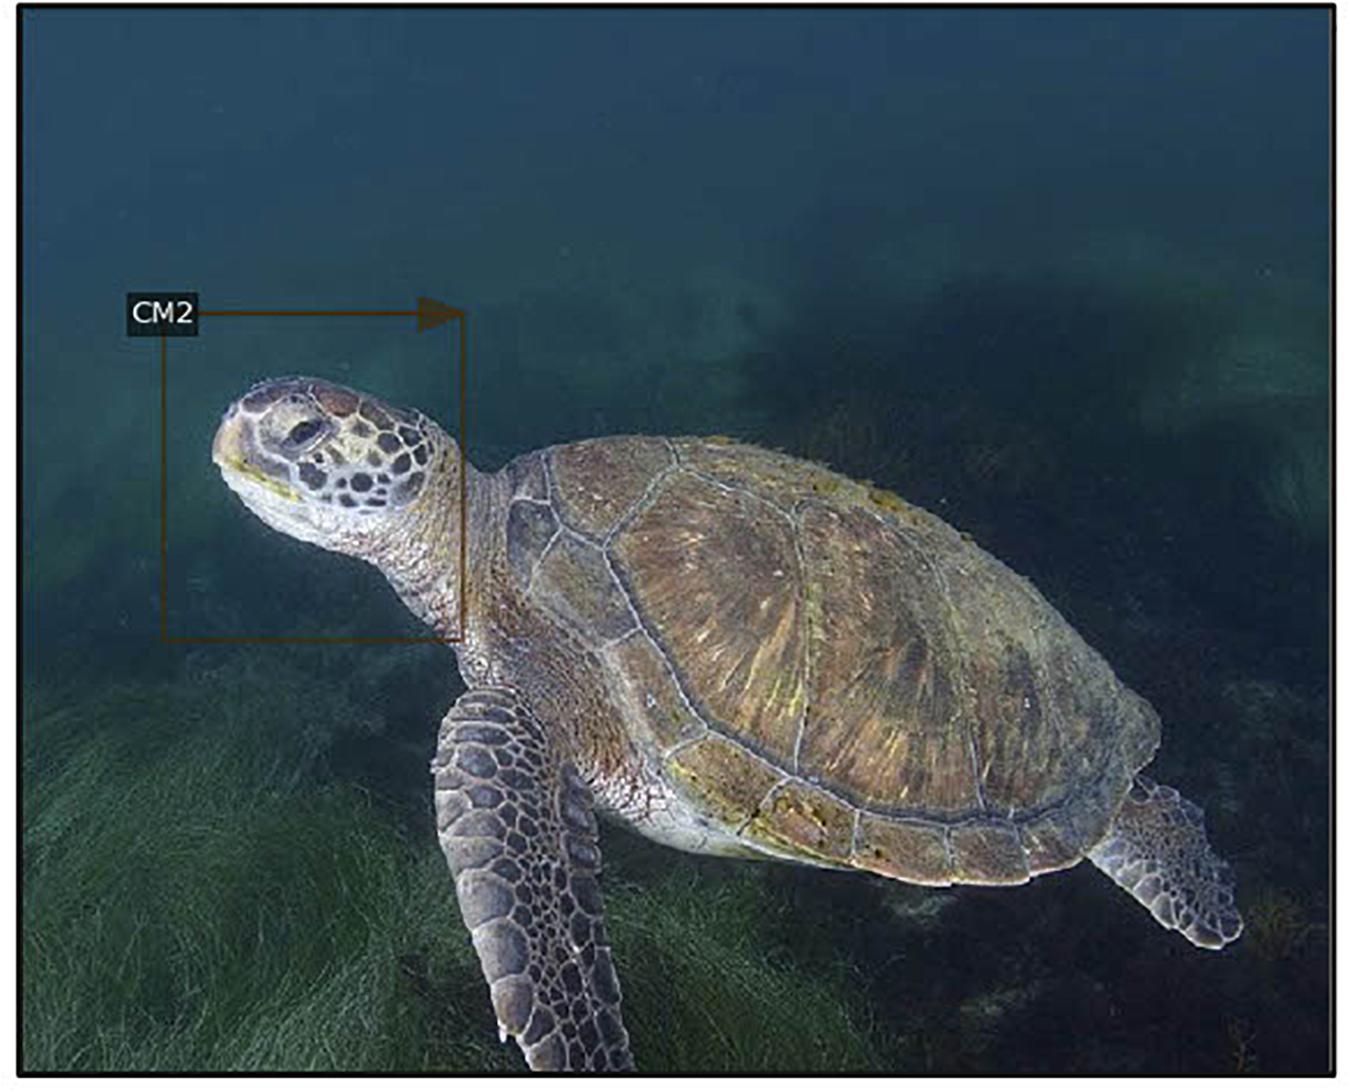
Figure 2. Demonstrates a “Chip” manually placed on the image to encompass the left post-ocular scutes of individual CM2 using the Hotspotter software. Photo taken by Jami Leslie Feldman.
Sea Surface Temperature
Green turtle sightings were associated with sea surface temperature (SST) data throughout the study. Temperature data from 2016 to 2018 were provided by the Scripps Institution of Oceanography’s Shore Stations Program, which records SST (0.5-m depth) each day off the Ellen Browning Scripps Memorial Pier (32.867° N, 117.257° W), within 0.5 km of La Jolla Shores. SST data from 2019 were obtained from the “Station 46254–SCRIPPS Nearshore, CA (201)” Buoy deployed and monitored by the Coastal Data Information Program (CDIP). This buoy is a Datawell Directional Waverider located nearshore just off of the Scripps Pier (32.868° N 117.267° W) and has a temperature sensor that is approximately 45 cm below the surface that records SST every 30 min each day. Two SST datasets were necessary as the Scripps Institution of Oceanography’s Shore Stations Program had not yet uploaded SST data for 2019 at the time this study was conducted. Thus, 2019 SST data were augmented using the CDIP SST data.
Carapace Algal Growth
Accumulated algae growth on the carapace of each turtle was categorized using a coding system based on% algae coverage. The categories included: None/Very Low (0–25% coverage), Low (25–50% coverage), Medium (50–75% coverage), and High (75–100% coverage). Example images of turtles in each category can be seen in Figure 3. Algal growth was compared among seasons: Fall (1 September–30 November), Winter (1 December–28/29 February), Spring (1 March–31 May), and Summer (1 June–31 August).
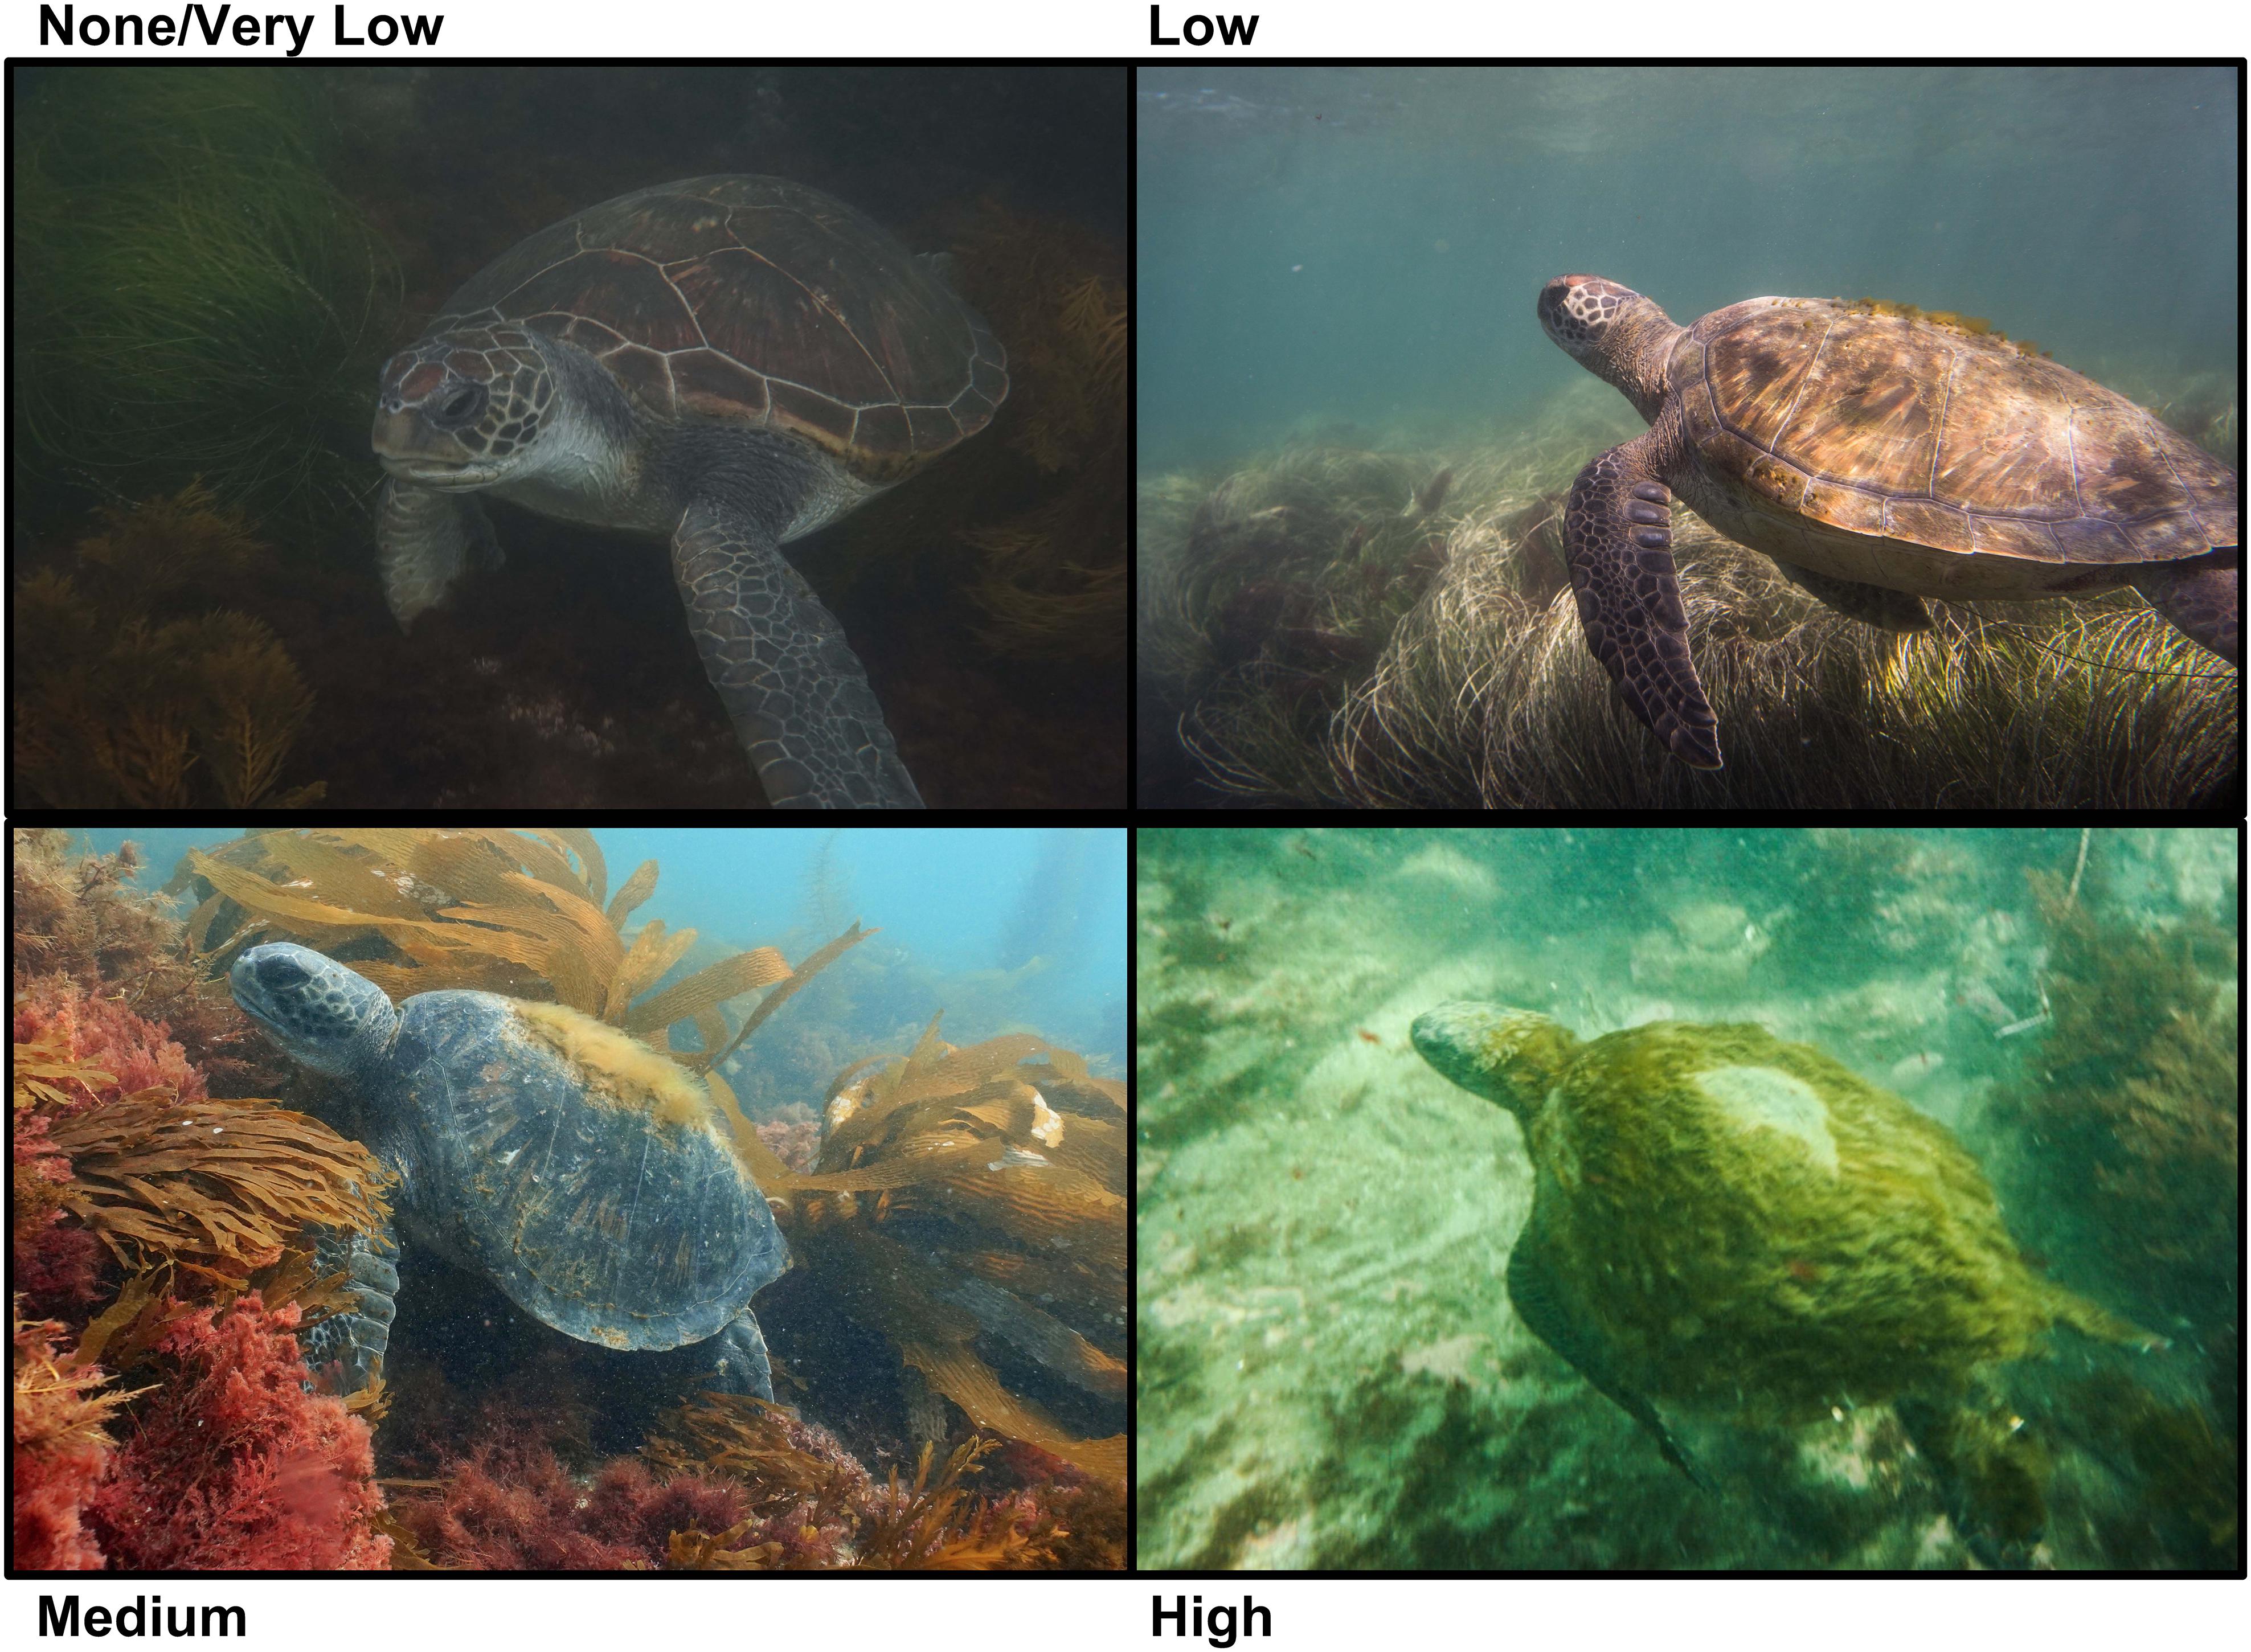
Figure 3. Shows examples of the four different algae codes that indicate None/Very Low,” “Low,” “Medium,” and “High” algae accumulation on the carapace. Photographs taken by Jamie Leslie Feldman, Erin M. Chandler, and Trystan Snodgrass.
Habitat Association
Habitat type was determined via in situ observations and photographic evidence. Habitat was divided into four categories: seagrass, rocky-reef, sandy bottom, or mixed habitat (i.e., including two or more of the habitat types in close proximity to the turtle). In addition, interactions and adjacent movements between green turtles and other vertebrate species were recorded. The presence of these species was separated into two categories, “interaction” or “presence.” “Interaction” was only observed between multiple individual green turtles using video sequences. Photographs depicting other vertebrate species in same frame as the focal green turtle were noted as “present” as video surveillance of interactions or engagements with other vertebrate species was not captured. “Presence” was used when other species were captured within the same frame as the focal green turtle. “Interaction” was used when there was clear video evidence of engagement between two green turtles within the same frame (e.g., swimming together, physical contact).
Activity and Foraging
We used a behavior code to categorize the turtle activities depicted in each photograph. Three behaviors were identified: resting, active, or foraging. Resting was characterized by turtles that were stationary on the seafloor, in patches of seagrass, or nestled under boulders; during these observations turtles often had their front flippers tucked underneath their plastron. Turtles were considered “active” when they were off of the seafloor or visibly swimming or breathing, and were described as “foraging” when prey species were inside the turtle’s mouth and/or fragments of prey were floating in the water column in close proximity to the turtle’s mouth. When foraging was observed, diet items were identified by the authors to the lowest possible taxonomic unit using local species reference guides (Druehl, 2000).
Minimum Residency Duration
Minimum residency duration (MRD) for each turtle was calculated based on the total duration (in days) from the first to last photograph captured for each respective turtle. Date and time data were retrieved from each digital photograph’s metadata registry. Photographs for which dates were unable to be determined and accurately verified were not used in the study. The date of the earliest photograph in our database was 12 April 2016 and that of the last photograph was 16 June 2019, a total of 1,253 days. We recognize turtles may have departed the area between photo events; however, our knowledge about strong site fidelity in juvenile green turtles in southern California (Eguchi et al., 2010; MacDonald et al., 2013) suggests that turtles likely remained in the area during days on which they were not photographed.
Opportunistic Sightings
Opportunistic sightings of green turtles along the southern California coastline were compiled for this study. A marine turtle sightings hotline email address (the SWFSC Marine Turtle Sightings Hotline,c3dmc2MudHVydGxlLXNpZ2h0aW5nc0Bub2FhLmdvdg==) was created on 1 April 2015 for the public to report sightings of marine turtles along the United States West Coast, which increased the number of sightings; additional sightings were reported to SWFSC prior to the official launch of the hotline. The public provided sighting data via email and included location, date, species, behavior, and/or digital photographs. Species were confirmed by the reporting party, when deemed reliable, or identified through digital photographs when available. When species identifications were not possible, the sighted turtle was recorded as “unidentified species.” When approximate locations were provided, e.g., state park name or city, latitude and longitude were assigned using Google Map or Google Earth to nearest 0.1 or 0.01 degrees depending on the specificity of the description. Green turtle sightings along the southern California coast (Santa Barbara, Ventura, Los Angeles, Orange, and San Diego counties) were extracted from the database.
We also accessed the Reef Environmental Education Foundation (REEF) database to provide additional citizen-based green turtle observations within the southern California region. REEF is a public database that collects voluntary biodiversity and abundance data from recreational divers, snorkelers and swimmers around the world. The REEF database has been a useful resource of data to citizen science projects with abundance and biodiversity reports dating back to 1993 (REEF, 2020). REEF launched its sea turtle monitoring program in 2001, this data is now housed in REEF’s online database. We queried this database by visiting the main REEF website, selecting “distribution report,” selecting the “California, Pacific Northwest and Alaska” region, and then selecting “Green Sea Turtle-Sea Turtles” (Chelonia mydas) from the species list. The date range was set to 1 January 2001 to 5 September 2019 for the search. Once the distribution report was generated, data were sorted by area of California coastline into “California” and “S\southern California” and further sub categorized into “S\southern Channel Islands” and “S. Dana Point–N. La Jolla.”
Statistical Analysis
To determine the effects of different seasons on algae accumulation on the carapace, we used an ordinal logistic regression using “polr()” function in the MASS package using R (2019, version 3.5.3, R Development team) via RStudio Team (2018, version 1.1.463). Algae accumulation on the carapace was the dependent variable with ordered categories “None,” “Low,” and “Medium.” The algae code “high” was considered an outlier and excluded from the model as this algae code was only recorded on two separate occasions (4 April 2018 and 5 April 2018) on individual CM3. Only individuals CM1, CM2, and CM3 were used in the model. CM4, CM5, CM6, and CM7 were the newest recruits to the study with the fewest number of photographs, and thus had minimal photographs depicting algae accumulation (n = 3, n = 3, n = 1, and n = 3). Season was the independent variable with codes “Fall,” “Winter,” “Spring,” and “Summer.” Season was used in the model as a method for interpreting the effects of variable temperature across seasons on carapace algal growth. To account for potential effects of season on algal growth and differences in individual turtles regarding algal accumulation, season was treated as a fixed effect and individuals were treated as a random effect in the ordinal logistic regression.
Results
Summary of Photographs
This study examined a total of 388 photographs taken from 12 April 2016 to 16 June 2019. Of the 388 images, 309 were associated with a verified date of photographic capture. For these 309 photographs, each was assigned a field ID, a date, SST, activity code, and an algae/carapace code. Hotspotter identified seven different individual green turtles (Figure 3).
Green Turtle Behavior
In 82.8% (n = 256) of the photos, turtles were classified as active, 14.9% (n = 46) were foraging, and 2.3% (n = 7) were resting (Figure 4). Water temperatures during seasons when photographs depicted active green turtles ranged from 13 to 24°C (Mean: 18.1°C, SD: 2.8°), whereas temperatures associated with foraging ranged from 15.8 to 23.7°C (Mean:17.5°C, SD: 2.1°), and with resting ranged from 16.2 to 23.8°C (Mean: 20.1°C, SD: 2.5°). Figures 4, 5 show visual representations of each behavioral category by temperature and season.
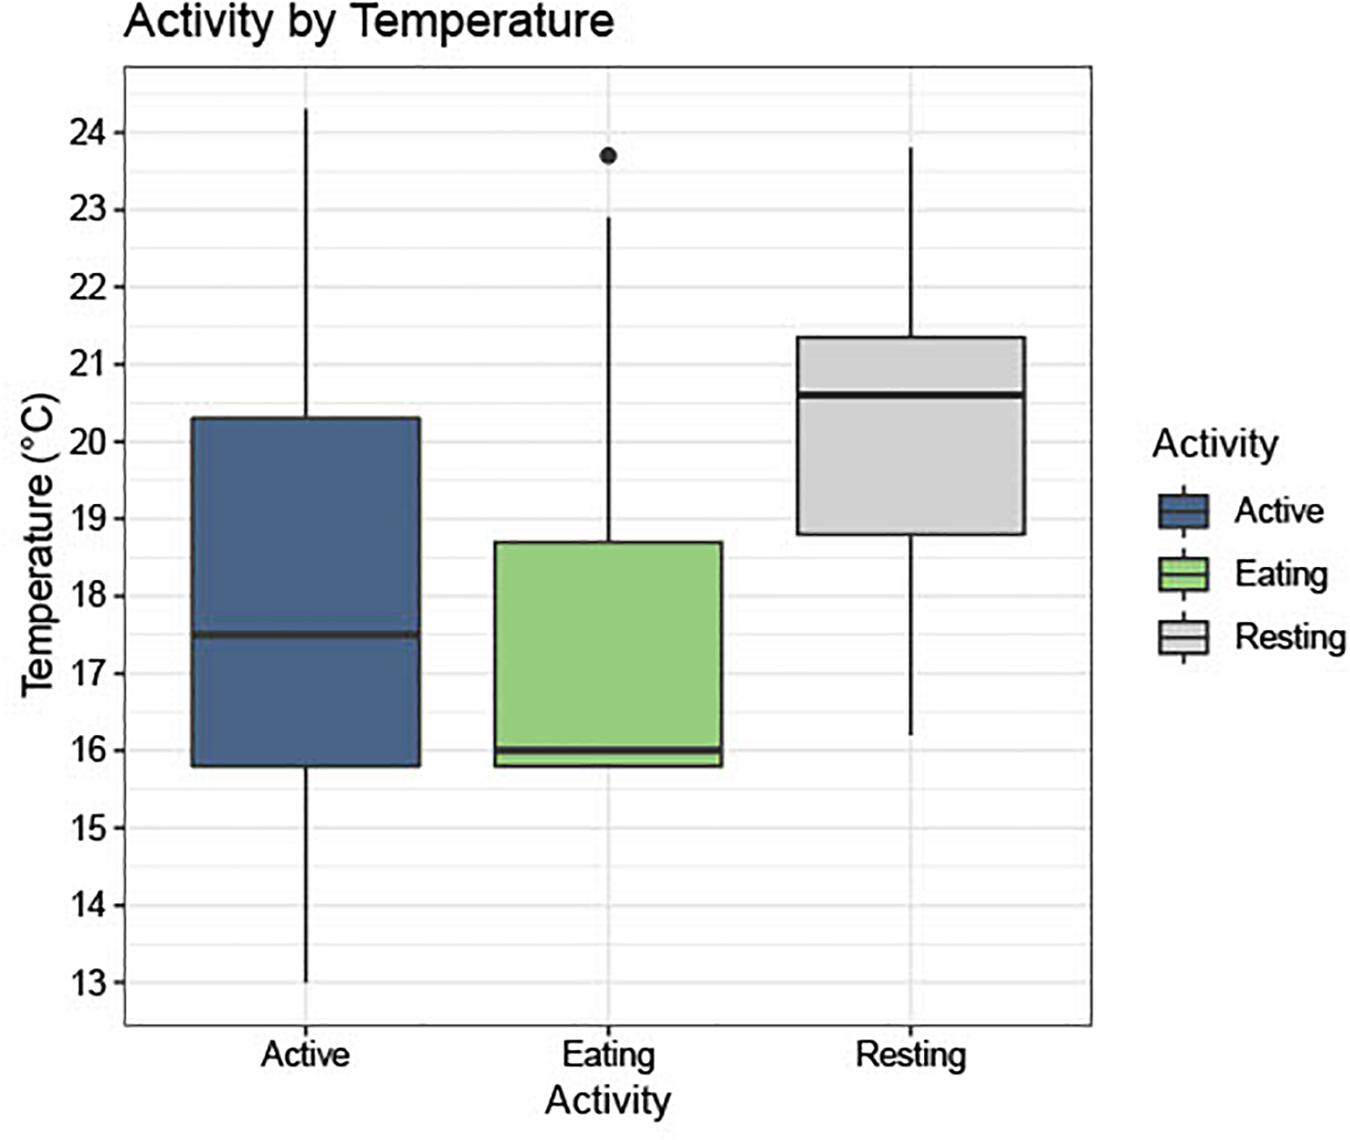
Figure 4. Shows a boxplot with photographs separated into three activity categories, “Active (Active),” “Eating (Foraging),” and “Resting,” and the frequency of these activities across the range of temperatures seen in the study site (13.0–23.7°C).
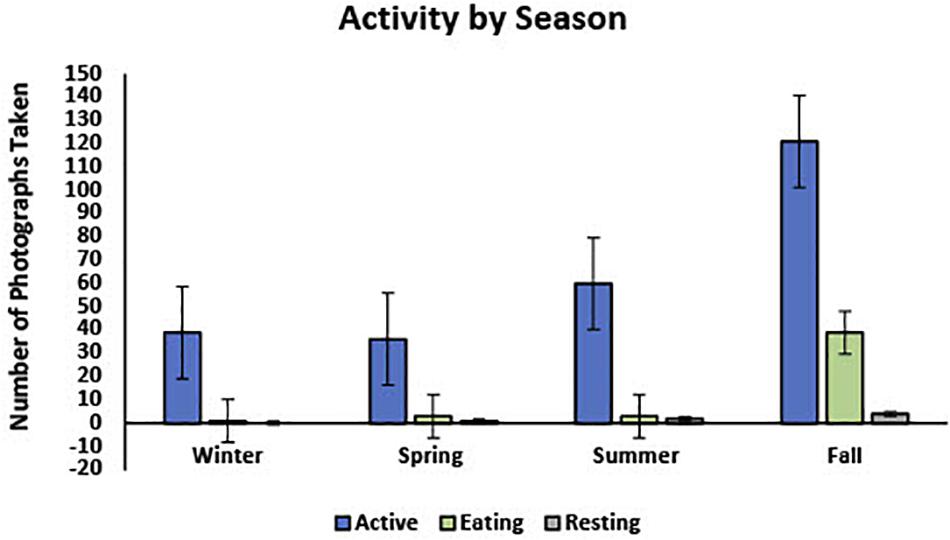
Figure 5. Shows the proportion of photos taken during each season separated into three activity categories, “Active,” “Eating (Foraging),” and “Resting.”
Carapace Algal Growth
The statistical analysis indicates the probability of mean algal coverage differed among seasons. Medium algal growth had the highest probability in the winter with a probability of 0.735 (95% CI [0.136, 0.980]), during which water temperatures typically ranged from 15.1 to 17.3°C. The highest probability for zero to very low algae accumulation on the carapace occurred in the fall with a probability of 0.581 (95% CI [0.157, 0.912], when water temperatures typically ranged from 15.8 to 22.1°C (Table 1). Results from the statistical analysis showed a large overlap in confidence intervals across all four algal categories. While the model suggests greater algal accumulation on the carapace in the winter, this analysis is strictly suggestive. This analysis simply provided a preliminary look into algal growth on the carapace as a potential indicator for resting behavior at cold water temperatures.
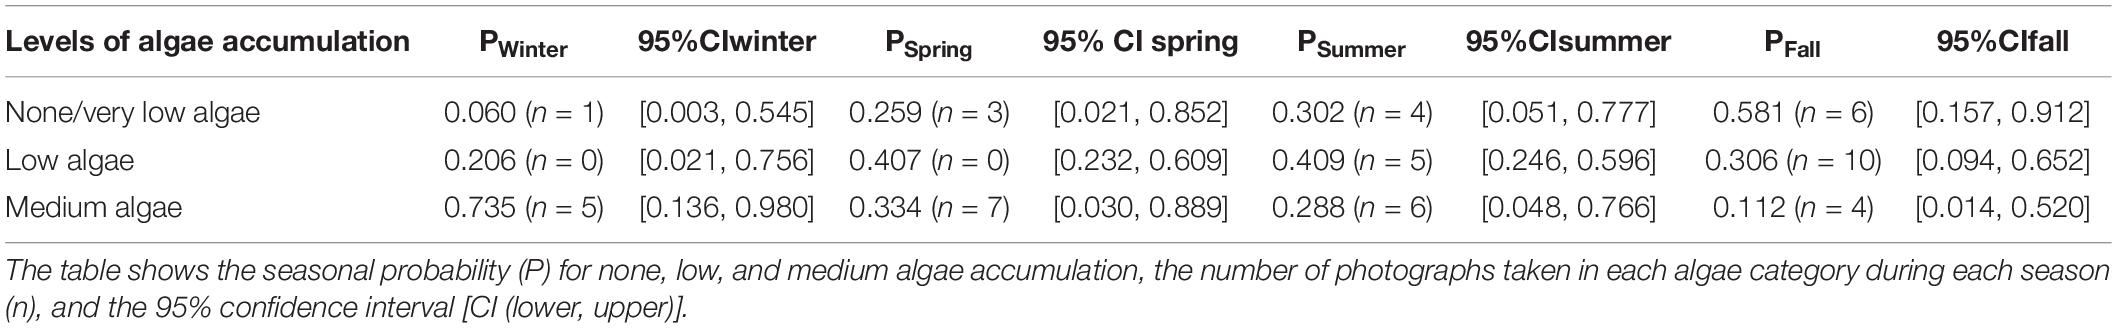
Table 1. Shows results of RStudio ordinal logistic regression comparing fixed effects of season, and random effects of individuals, on accumulation of algae on the carapace.
Habitat Association and Diet Intake
Photographs documented the presence of different vertebrate species within the same photographic frame as green turtles in the study site. Video imagery also depicted more than one green turtle individual within the same field of view on three occasions in the images included in this dataset. Different vertebrate species documented within the same photographic frame included leopard sharks (Triakis semifasciata), banded guitar fish (Zapteryx exasperata), Pacific harbor seals (Phoca vitulina), and several local fish species (Figure 6). In video imagery depicting two sea turtles, the turtles show a high degree of interaction with one another and can be seen swimming with one another and also engaging in physical contact. Specifically, CM1 and CM2 were captured swimming together on many separate occasions by different photographers.
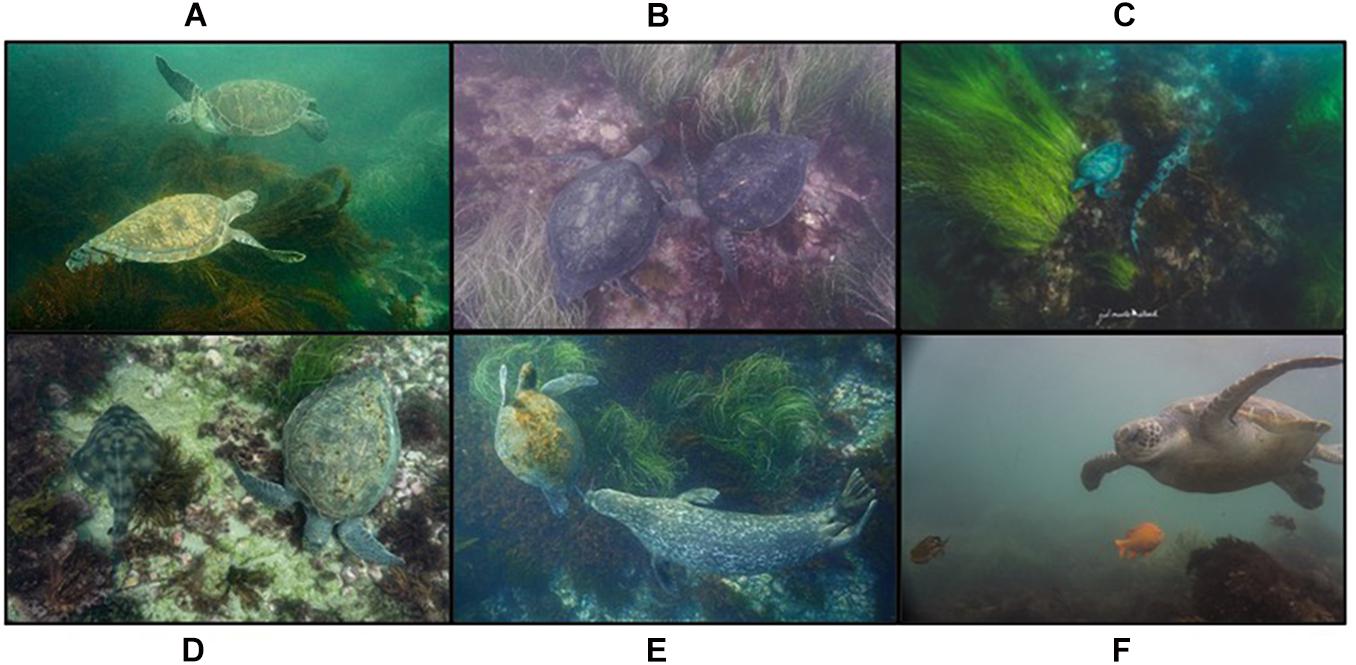
Figure 6. Illustrates green turtles and the presence of several different species. (A,B) Green turtles and other green turtles (Chelonia mydas). (C) Leopard sharks (Triakis semifasciata). (D) Banded guitar fish (Zapteryx exasperata). (E) Pacific harbor seals (Phoca vitulina). (F) Several local fish species. Photographs taken by Jamie Leslie Feldman, Erin M. Chandler, and Trystan Snodgrass.
The main prey item consumed was a filamentous species of Rhodophyta. Three algae in particular resemble the common prey item, Antithamnionella sp., Callithamnion sp., and Ceramium sp.; however, further classification of Rhodophyta in the photographs was not possible using field guides alone.
Minimum Residency Duration (MRD)
Individual CM1 was the first documented turtle in the photograph database and had a MRD of 748 days. Individual CM2 was first documented on 13 August 2016, was the most frequently photographed individual in the database and had an MRD of 796 days. CM3 also showed an extended MRD in the area with its first sighting on 12 September 2016 and MRD of 710 days. CM4 was first-photographed on 3 April 2018 and had an MRD of 166 days; this turtle was easily identified by a severed rear flipper in addition to the photo-ID method. CM5 was initially photographed on 13 December 2017 and had an MRD of 503 days. CM6 was photographed on only one occasion (26 August 2018). CM7 was the most recent turtle to enter the area. This turtle was first photographed on 29 April 2019, with and MRD of 48 days this turtle has the shortest MRD in the study group. The number of days between photography efforts, and thus sightings, ranged from 1 to 194 (mean: 25.77 days, SE: 5.95 days, n = 46). Details about the total number of days and dates on which each turtle was photographed is provided in Figure 7 and Supplementary Figure 1.
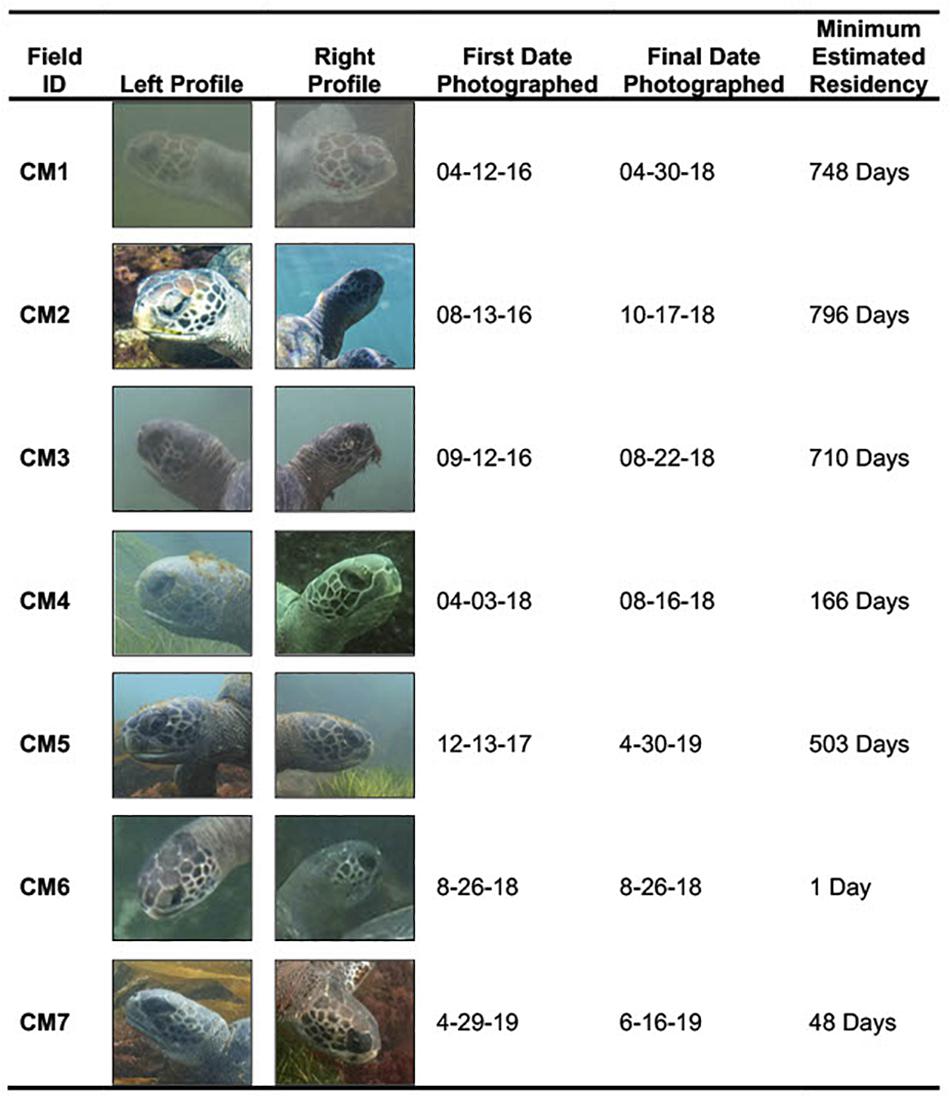
Figure 7. Shows all seven individuals that were digitally tagged in the study site with their corresponding field ID, left and right profiles for each individual, first date photographed in database, most recent date photographed in database, and minimum estimated residency (MRD) in study site. Photographs taken by Jamie Leslie Feldman, Erin M. Chandler, and Trystan Snodgrass.
Opportunistic Sightings
A total of 66 green turtle sightings along the southern California coast was reported to the SWFSC sightings hotline. The oldest sighting was from 29 September 2013 and the latest 31 October 2019. The number of sightings per county increased from north to south (Santa Barbara = 0, Ventura = 1, Los Angeles = 13, Orange = 17, and San Diego = 35). The number of sightings per year increased when the hotline was established in 2015 but declined in the last 2 years (2013 = 3, 2014 = 7, 2015 = 16, 2016 = 15, 2017 = 15, 2018 = 7, and 2019 = 3; Figure 8).
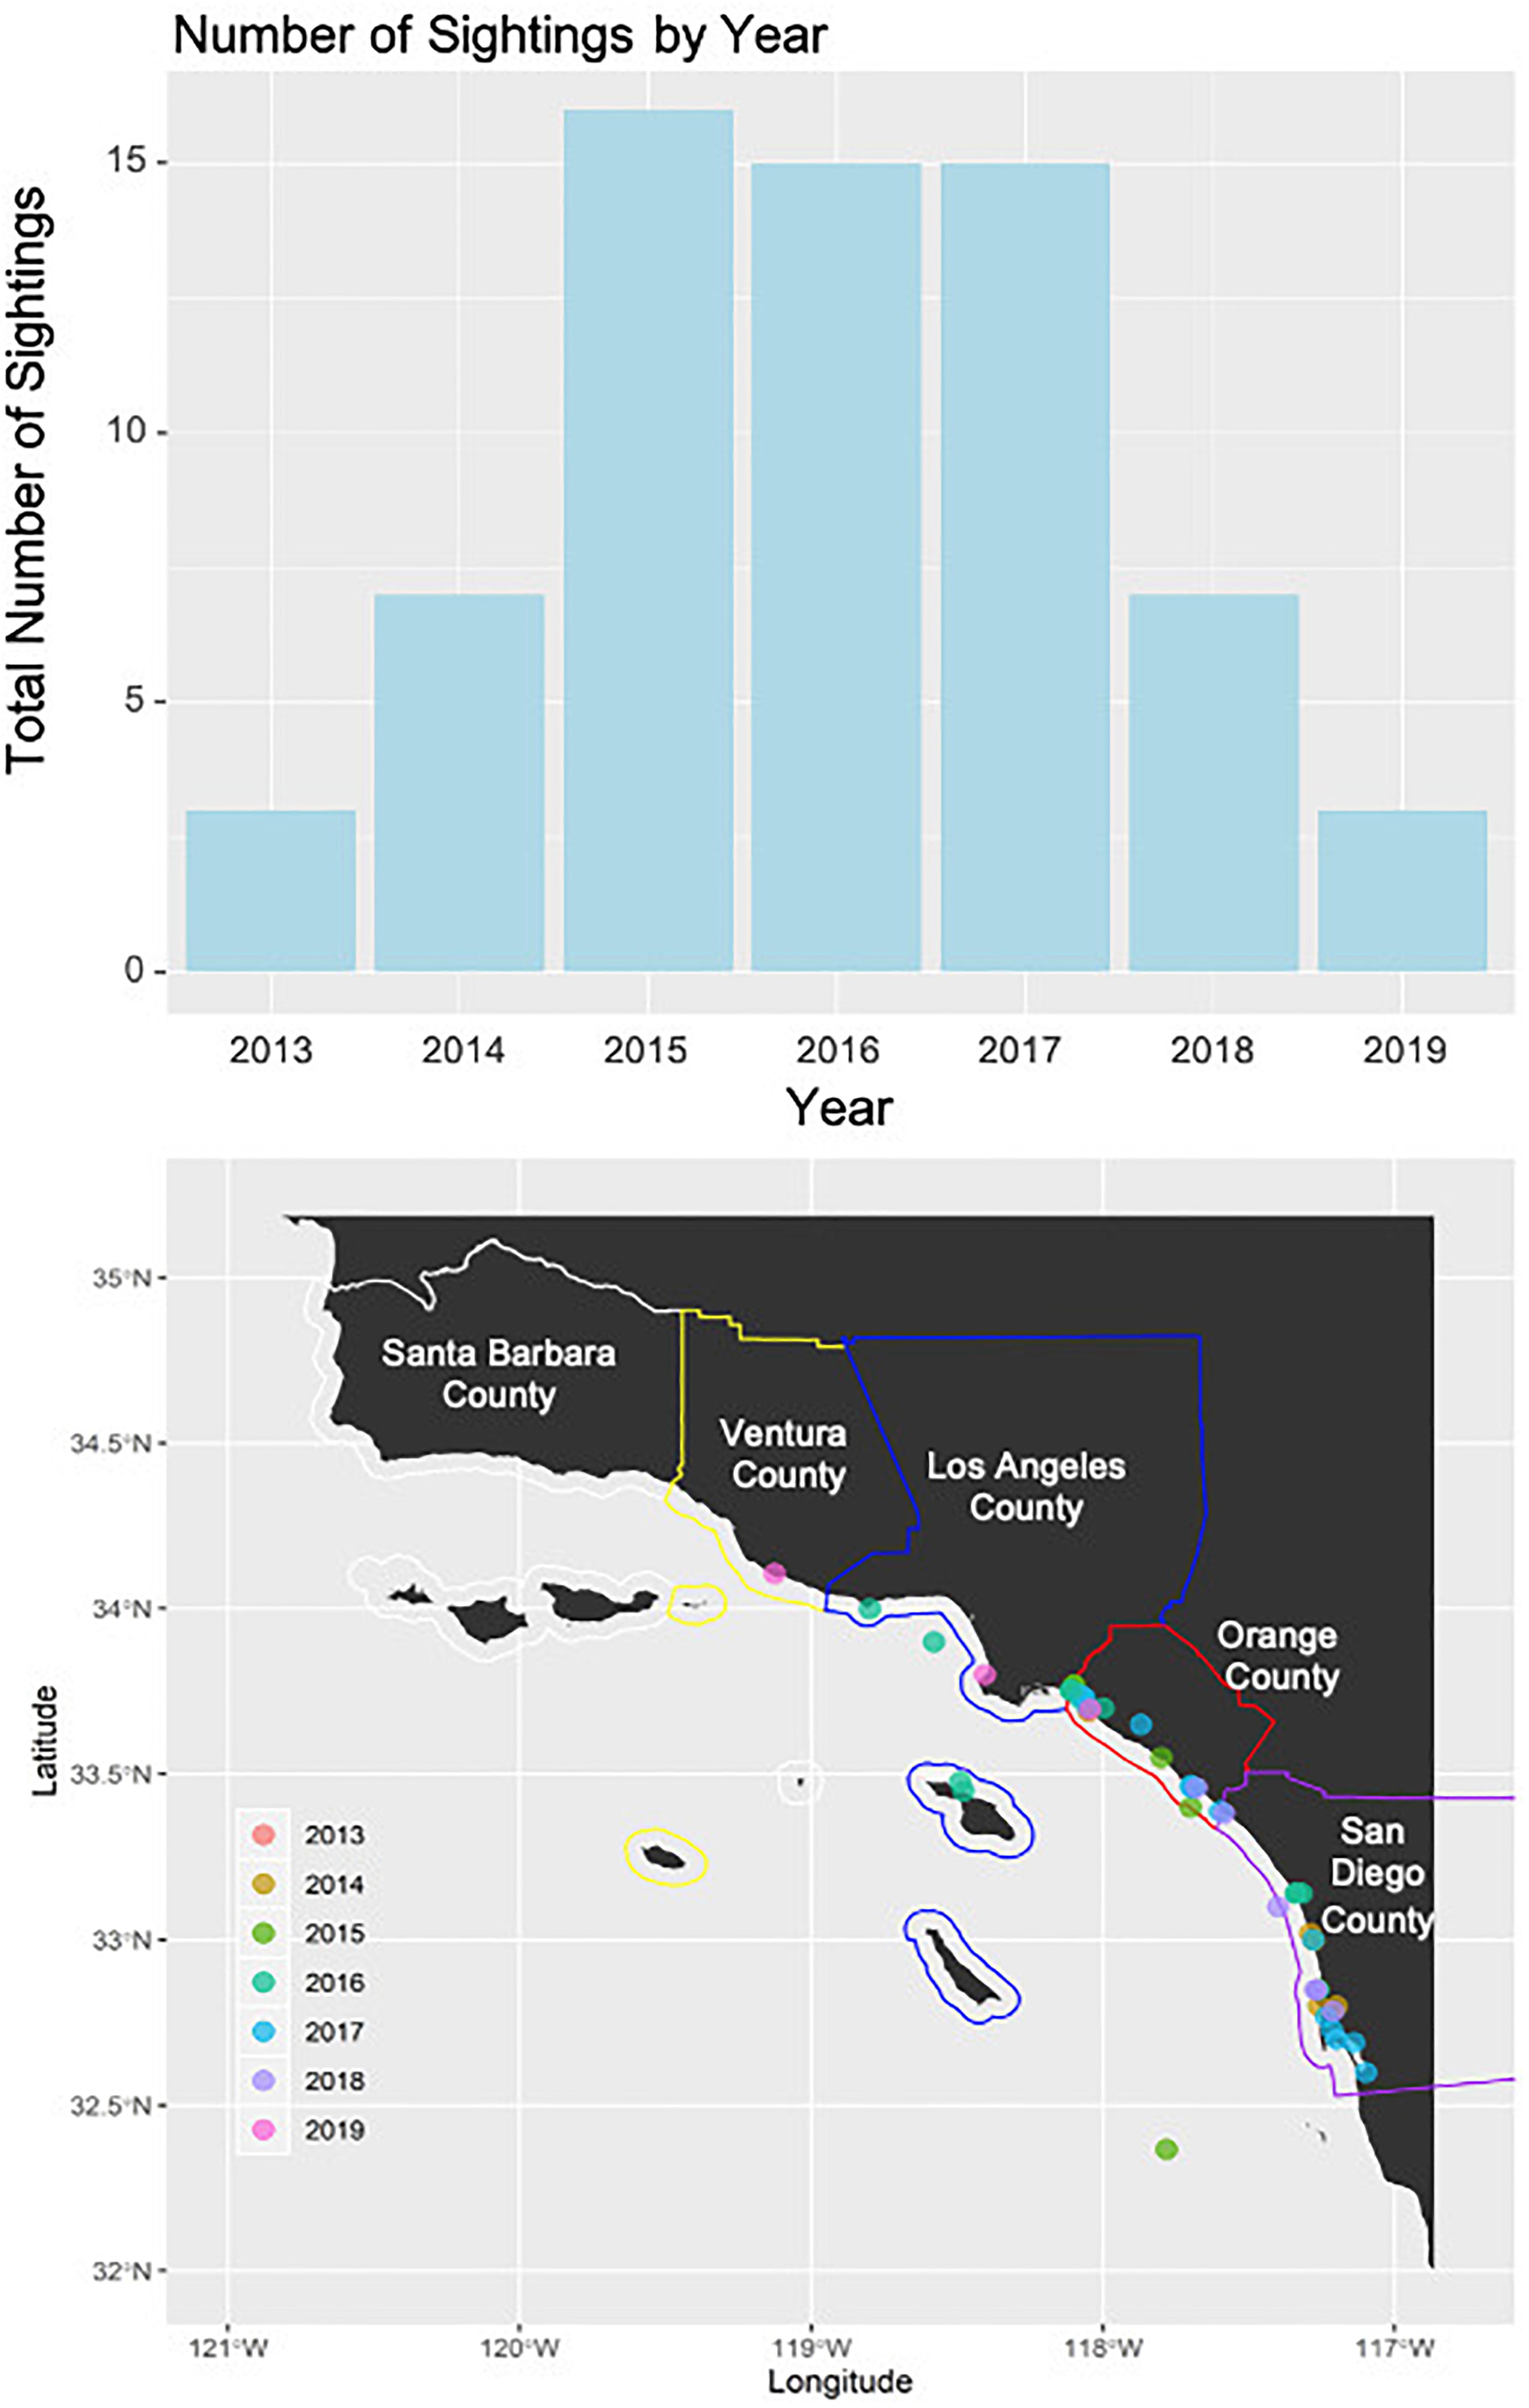
Figure 8. The top panel displays the total overall number of green turtle reported from the NOAA sea turtle sightings hotline separated by year. The bottom panel displays the county borders (white = Santa Barbara, yellow = Ventura, blue = Los Angeles, red = Orange County, and purple = San Diego) on the southern California coastline with sightings reported by year in different colors.
For the REEF database, from 1 January 2001 to 5 September 2019 participants have conducted 12,097 surveys in the California region, and 7,951 in southern California. Of the 2,667 surveys completed in the south Dana Point/northern La Jolla region, seven of the surveys resulted in sightings of green turtles. In the southern Channel Islands region, 1,748 surveys were reported with four sightings of green turtles. The REEF program began taking reported sea turtle sightings in 2001, no reported sightings of green turtles occurred in California until 2015. In 2015, there were three reported sightings in the southern Channel Islands region. The following year in 2016, four sightings occurred in the south Dana Point, north La Jolla region. One more sighting occurred in the Southern Channel Islands region in 2017 and three more sightings occurred in the south Dana Point north La Jolla region in 2018. No new sightings were reported from 2018 until 5 September 2019 (the end of data collection for the study). There was a total of 11 sightings in the Southern California region from 2001 to 5 September 2019. REEF sightings increased on a roughly 10-year time scale in the California region with the greatest increase occurring from 2000 to 2010. In 1993 to 2000 a total of 898 REEF reports were submitted, 6754 reports were created from 2000 to 2010 and finally 7182 reports were created from 2010 to 2020. The habitats in the areas with reported sightings have very similar habitats to the study site in La Jolla Shores and are characterized by sandy bottoms with patches of rocky reef and large patches of California giant kelp (Lowe et al., 2003).
Discussion
Green turtles have been reported in coastal waters of southern California since at least the early 1960s (Stinson, 1984), and they have been studied via traditional mark-recapture methods in San Diego Bay since the late 1980s (Dutton and McDonald, 1990) and in San Gabriel River and Seal Beach NWR since 2010 (Crear et al., 2016, 2017; Barraza et al., 2019). The present study is the first to look at the apparent behaviors and condition of green sea turtles observed in the La Jolla Shores area and the first to provide information about green turtle distribution throughout southern California based on opportunistic sightings by the general public. The use of citizen-based science and photo-ID provided a non-traditional method for studying green turtles in La Jolla Shores given the MPA (Marine Protected Area) restrictions on invasive research such as physical captures of turtles. While this study only utilized data from three citizens for analyses, a large number of local photographers continue to contribute photographs of green turtles to the growing image database for future studies. Thus, the high number of marine stakeholders in the area provided an advantage for maximizing data collection. This study underscores the value of citizen-based science in areas where traditional methods for data collection are difficult, or where engaged and abundant marine stakeholders can contribute to data collection.
Sea Surface Temperature, Behavior, and Carapace Algae Growth
To our knowledge, La Jolla green turtles remain active and forage at water temperatures that are among the lowest ambient temperatures recorded for the species. This is a notable finding for the study, considering that green turtles elsewhere become inactive or dormant at water temperatures below 15°C (Seminoff, 2000; Milton and Musick, 2002). However, perhaps the consistently and relatively low temperatures experienced by green turtles living in southern California waters have resulted in thermal acclimation. For example, green turtles in San Diego Bay were found to remain active in 14.5°C waters (Madrak et al., 2016), and turtle-borne video depicted low levels of foraging by individuals in these cool waters (Okuyama, unpubl. data). The fact that green turtles are active and foraging at temperatures as low as 15.8°C shifts the paradigm regarding green turtle ecology and raises new questions about green turtle thermal minimal tolerance that warrant further study. For example, it is important to elucidate whether or not green turtles have the ability to acclimate to critically low water temperatures that until now have been considered lethal minimums. Further, studies of digestive efficiency at varying temperatures can help identify the extent to which foods consumed at such low temperatures are assimilated.
During cold winter periods green turtles often lay dormant on the sea floor and algal growth accumulates on their carapace (Felger et al., 1976). This was the first study to look at algal growth on the carapace as a potential indication for resting behavior in response to cool water temperatures. In this study, photographic depictions of heavy algae accumulation on carapaces of turtles in the colder months indicate that they lay dormant on the seafloor during these periods, although only 2.3% of all photos depicted this behavior. Perhaps turtles were resting in areas less frequented by photographers. Alternatively, it is possible that inactive turtles are more difficult to encounter in the study area when they are at the seafloor. This is certainly a possibility considering that green turtles likely have greater algal coverage on the carapace during winter periods, which may camouflage their presence in the study area. Only 2.1% of photographs (n = 1) depicting foraging turtles (N = 46) occurred during winter (temperature range: 15.1–17.3°C), when algae accumulation was highest. Given that only 46 photos were taken in the winter while 263 photos were taken during other seasons, another possibility to consider is that marine stakeholders were less active in the study site during the winter months. Although citizen scientists are still actively photographing in the study site during winter months (Chandler and Hanna, pers. obs.), future studies could benefit from having greater knowledge of the relative level of effort by citizen-scientists across seasons.
In addition, differences in frequency of photographer visitation to the study site, personal preference in photographing at certain locations within the study site, limited visibility on certain days, and weather conditions are all examples of factors that likely influenced the results of this study. Finally, differences amongst individual turtles in the study site such as differences in behavior, preferred foraging areas within the study site, and overall preferences were also likely influential on the results of this study. Thus, future studies of this population using a citizen-based science approach would benefit from a more-structured experimental design for photographers. However, this was not possible for the present study, as the photographs that were used and analyzed had been collected during past photography ventures prior to the commencement of the study.
CM1, CM2, and CM3 were the first three individuals to enter the study site with the longest mean residency durations in the study (n = 748, n = 796, and n = 710), and thus the greatest depictions of algae accumulation. The analysis was based solely on these three individuals (CM1, CM2, and CM3) providing a very small sample size for analysis. In addition, sampling was likely highly biased by large seasonal differences in photography efforts. This led to overlap in confidence intervals of the results across all four algal categories. While the model suggests greater algal accumulation on the carapace in the winter, the overlap in confidence intervals and small sample size created limitations in the analysis. Although our inferences are based on relatively few photographs, it remains likely that algal accumulation on the carapace is greater in the winter months; additional photographs for the winter months would help clarify this possibility. With continuing photography of turtles in the study site, newer recruits in the aggregation (CM4, CM5, and CM7) are likely to contribute more photographic evidence of algae growth on the carapace. As photographic data of all turtles continues to accumulate, and new recruits continue to enter the aggregation, it is likely that the trend of algae accumulation on the carapace will be easier to detect in the future and will better represent the foraging aggregation as a whole.
Habitat Association and Diet Intake
Green turtles were primarily observed feeding on a filamentous red algae. Although the exact species of Rhodophyta was unclear, this diet intake was consistent with green turtles in other areas of the Eastern Pacific. For example, green turtles in the Gulf of California have been documented most frequently consuming the red alga Gracilariopsis lemaneiformis as well as other algae genera including Gracilaria, Codium, Ulva, and Chaetomorpha (Seminoff et al., 2002). Green turtles along the Pacific coast of Baja California Mexico in Bahía Magdalena also consumed the filamentous red algae Gracilaria sp. (López-Mendilaharsu et al., 2005).
The number of photographs (stills taken from video surveillance) depicting green turtle interactions that were submitted to this study was low (n = 3). However, turtles have been documented interacting with one another in the study site regularly in photographs that were not included in this dataset. Only the 309 photographs that included a verified date were included in this dataset. Nevertheless, videos and images frequently shared on social media by other local photographers in the area and personal in-water observations, depict interactive behavior between turtles and indicate that this is likely a regular behavior between study animals (E. Chandler and M. Hanna, pers. obs.).
In the study site there is a mixed habitat composed of rocky reef, sandy bottom, kelp beds, and large areas of surf grass. Turtles were often observed in shallow water (1.5–7 m) among the reef areas, and less often found in deeper areas of water along the rocky reef boundaries (7–10-m water depth). This perhaps due to turtles’ efforts to minimize energetic output by staying closer to diet items found on reef substrates. Such affinity to the shallowest waters may also relate to slightly warmer water temperature in these areas that occur due to solar warming and periodic low mixing. Similar green turtle habitat use has been observed in Laguna San Ignacio, Baja California Sur, Mexico where turtles were seen mostly between 1.5 and 3.5 m of water in areas abundant in seagrass and infrequently seen in waters greater than 3 m (Senko et al., 2010).
Opportunistic Observations
Opportunistic sightings by the public provided valuable information about the distribution and occurrence of turtles that are otherwise unavailable. For example, information from the SWFSC sightings hotline has been used to complement survey sightings of loggerhead sea turtles (Caretta caretta) in the Southern California Bight (Eguchi et al., 2018). With respect to green turtles, the sighting reports yielded valuable information about foraging aggregations outside of La Jolla Shores, such as in Agua Hedionda a lagoon ca. 25 km to the north. It is interesting that despite the continued population increase for the EP green turtle DPS, the annual number of reports has remained relatively stable in recent years. Perhaps this reflects lesser community interest in reporting because green turtle sightings along the southern California coastline are less of a novelty today, relative to earlier years.
Considering the extremely high number of surveys in the southern California regions from 1993 to 2020 (13,842 reports in California with 9,240 reports in southern California specifically), it is surprising that so few green turtles (n = 11 reported sightings) were sighted. Looking at overall REEF sightings from a decadal standpoint, the greatest increase in number of reports occurred from 2000 to 2010 followed by a smaller increase from 2010 to 2020. In addition, REEF launched their sea turtle monitoring program in 2001, during which REEF was experiencing its largest decadal increase in overall survey efforts (2000–2010). Perhaps the historic nature of the majority of REEF surveys meant that most surveying efforts occurred prior to the large increase in green turtles in the region occurring around 2015. A smaller increase in REEF sightings began to occur around the same time that green turtles were first sighted in La Jolla in 2015. In addition, the first REEF reports of sea turtles in southern California also occurred in 2015. Similarly, sightings per year increased when the NOAA sightings hotline was established in 2015 but declined in the last 2 years. It is possible that the recent increase in REEF-based sightings is due to the recovery of green turtles in the region (Delgado-Trejo and Alvarado-Figueroa, 2012; Seminoff et al., 2015) that has caused sea turtle populations to expand their habitat range northward into areas where green turtles had not been seen in the past.
Abundance and Minimum Residency Duration
With a total of seven individuals observed in La Jolla Shores over nearly 4 years, this foraging site hosts a small resident aggregation of green turtles. The number of days between photography efforts ranged from 1 to 194 days with a mean of roughly 26 days. This large range between efforts demonstrates the significant amount of variability and limitations that can accompany citizen-based science methods. Photographer availability, personal preference, weather conditions, and visibility are all potential factors that can influence a photographer’s willingness or ability to collect data. However, several weeks passed between some observations, yet the same individuals remained in the area, were sighted, and photographed when photographers returned to collect data. The current knowledge of green turtle foraging ecology suggests that turtles maintain strong fidelity to their foraging grounds and overwintering sites in southern California (Eguchi et al., 2010, 2012; MacDonald et al., 2012, 2013). Given this knowledge, it is likely that the six turtles consistently recorded in LJS are a resident foraging aggregation with a high degree of site fidelity. The photographic histories for turtles found in this study (Figure 2 and Supplementary Figure 1) supports this as turtles were commonly photographed multiple days in a row throughout the course of their estimated residency. Turtles present in the study site, other than the six consistently recorded residents, were considered transient in the area, as was the case with CM6, which was photographed on only one occasion during the study. The near-daily presence of divers, snorkelers, and local photographers, in the study site makes it unlikely that turtles, other than the six recorded in this study, habituated the study site regularly without being recorded. Excluding CM6, the remaining six individuals were concurrent residents to varying degrees. CM1 was the first and only sea turtle documented in the La Jolla area until CM2 joined later in 2016 initiating a small resident foraging aggregation. After 2016, 4 other turtles joined the area making for a total of six turtles that displayed apparent residency in La Jolla Shores. However, CM 1 was last recorded in April 2018 and at the close of this study there was a local aggregation of five individuals (CM2, CM3, CM4, CM5, and CM7). The residency durations reported in this study are a conservative estimate considering the ca. 3-year duration of this study. There is evidence that these residency durations were truncated due to the closure of this study, as the turtles continued to be documented in the area after the data collection period for this study ended (Hanna, unpubl. data). These turtles only recently began to inhabit the study site in 2015. Comparing the residency times in similar habitats in the United States, it is likely that this is a new aggregation in the southern California region such as San Diego Bay and the San Gabriel River in Long Beach (Eguchi et al., 2010; Crear et al., 2016).
This study largely coincides with the widely available and high-quality image hardware and sharing tools. Waterproof action cameras and image sharing tools have increased in abundance, availability, quality, and cost-effectiveness in recent years (Papafitsoros et al., 2020; Read and Jean, 2021). It is likely that these technological advances have led to an increase in engaged marine stakeholders and a higher volume of photographic contributions to this study and future studies. Although the data collection period for this study concluded in 2019, censorship of green turtles in La Jolla continues.
We believe it is unlikely that there was a resident population of turtles prior to the first photographic documentation in 2015 or prior to the start of this study in 2016 given the numerous stakeholders that used LJS prior to this timeframe. This suggests that if turtles were present sooner, they would likely have been observed and photographed prior to 2015. Given this information the estimated residency durations should be considered minimum residency estimates. The specific timing of colonization in La Jolla Shores by green turtles is unclear but is likely related to the growing green turtle population at the source rookeries in Mexico.
It is possible that some of the resident turtles may have departed the area between photographs. Such short-term departures have been reported for green turtles in El Ñuro, Peru, that were found to either stay in the study site or depart and come back after some time (Velez-Zuazo et al., 2014). However, short-term departures would have no effect on individual MRD’s for turtles in the area.
Green turtle foraging aggregations in southern California are typically larger than found in this study (Eguchi et al., 2010, NOAA unpublished data). Why are there so few turtles at La Jolla Shores when there is suitable habitat for foraging green turtles? Perhaps the marginal habitat of this area plays a role. A similar, but larger local aggregation found in San Diego Bay forages in a sheltered habitat that has 4,262 hectares of open water and 431 hectares of eelgrass beds (primary diet item for San Diego Bay green turtles; Eguchi et al., 2010). Considering the size of the sheltered foraging habitat in La Jolla Shores (269.36 hectares) compared to other local aggregations such as San Diego Bay, it is possible that this new foraging site might be tailored toward smaller foraging aggregations. Or, perhaps we are seeing the early stages of colonization of this site by green turtles. La Jolla Shores is located within the Southern California Bight, an area characterized by high rates of upwelling of cool nutrient rich water (McClatchie, 2014) and the study site receives a near-constant influx of this cool water brought in by shoreward mass transport from incoming waves (Shepard and Inman, 1950). Perhaps the relative cold temperatures and high wave energy create sub-optimal conditions and, regardless of the regional abundance, La Jolla Shores will never host more than a small number of turtles. If so, this would be a prime example of the “edge effect,” a phenomenon in which changes in population or community structure occur on the boundaries of preferred habitats (Murcia, 1995). The edge effect demonstrates how populations can extend beyond traditional habitat boundaries into new areas that contain small habitat fragments suitable for survival (Levin, 2009), as has been reported for juvenile loggerhead turtles that inhabited new “hotspots” in the Mediterranean (Casale et al., 2012). It’s possible that recent expansion in the green turtle population has caused green turtle recruits to expand toward the edge of their traditional habitat boundary into a new habitat that may have sub-optimal conditions but is suitable for foraging.
Regarding growing population size, the possibility of the edge effect is supported by the fact that, despite consistent and high use of the area by marine stakeholders, green turtles were only first observed 2015. Similarly, the first reports of green turtle sightings in Agua Hedionda (a lagoon approximately 40 km north of La Jolla shores) were in 2016. Indeed, the recent establishment of resident green turtles in La Jolla is likely the result of population growth and foraging range expansion in the Eastern Pacific due to successful conservation efforts that began in the early 1980s. La Jolla shores may have sub-optimal conditions influenced by influxes of cool water and high wave energy, however, the abundance of filamentous red algae make this habitat suitable for foraging green turtles. In addition, this aggregation forages in a highly urbanized area encompassed by evolving coastline and frequent recreational in-water activities. Understanding abundance and ecology of green turtles at this recently colonized and unique foraging area will help to inform management efforts aimed at reducing anthropogenic impacts such as fishing or harmful human interactions. Further, this knowledge can help to educate interested marine stakeholders on how to safely view resident green turtles in the study site. Ongoing censorship of this aggregation provides a wealth of data for future studies on the abundance, behavior, and overall status of this foraging aggregation in La Jolla Shores.
Data Availability Statement
The raw data supporting the conclusions of this article will be made available by the authors, without undue reservation.
Ethics Statement
Ethical review and approval was not required for the animal study because there was no physical contact with sea turtles in this study. There was no human interaction with sea turtles in this study. Natural sea turtle behavior was NOT altered in anyway during this study.
Author Contributions
JS and TE designed the research plan. MH and EC conducted the field work. MH analyzed the data and wrote the manuscript. All authors contributed critically to the drafts and gave final approval for publication.
Conflict of Interest
The authors declare that the research was conducted in the absence of any commercial or financial relationships that could be construed as a potential conflict of interest.
Acknowledgments
We gratefully acknowledge Trystan Snodgrass, Jami Feldman, Kyle Henderson, and Amy Baldwin-Granger for providing photographs examined during this study and used in this publication. We thank REEF surveyors for contributing valuable citizen science data. Near shore temperature data were furnished by the Coastal Data Information Program (CDIP), Integrative Oceanography Division, operated by the Scripps Institution of Oceanography, under the sponsorship of the United States Army Corps of Engineers and the California Department of Parks and Recreation. Scripps Pier measurements collected by the Birch Aquarium at Scripps staff and volunteers. Data provided by the Shore Stations Program sponsored at Scripps Institution of Oceanography by California State Parks, Division of Boating and Waterways. The findings and conclusions in this article are those of the author(s) and do not necessarily represent the views of the United States Fish and Wildlife Service.
Supplementary Material
The Supplementary Material for this article can be found online at: https://www.frontiersin.org/articles/10.3389/fmars.2021.671061/full#supplementary-material
Supplementary Figure 1 | Shows green turtle residency in the study site for each individual over the course of 1253 ordinal days (3.4 years) based on dates that each individual was photographed. On the x-axis is 1253 consecutive ordinal days from 2016 to 2019. The y-axis shows field ID’s CM1-CM8. The blue dots represent photographic evidence of presence of an individual on that ordinal date. The gaps between dates do not imply that individuals left the study site, but rather that no photographs were taken of that individual during that time period.
References
Azzurro, E., Broglio, E., Maynou, F., and Bariche, M. (2013). Citizen science detects the undetected: the case of Abudefduf saxatilis from the Mediterranean Sea. Manage. Biol. Invasions 4, 167–170. doi: 10.3391/mbi.2013.4.2.10
Barraza, A., Komoroske, L., Allen, C., Eguchi, T., Gossett, R., Holland, E., et al. (2019). Trace metals in green sea turtles (Chelonia mydas) inhabiting two southern California coastal estuaries. Chemosphere 223, 342–350. doi: 10.1016/j.chemosphere.2019.01.107
Baumbach, D., and Dunbar, S. G. (2017). Animal mapping using a citizen-science web-based GIS in the Bay Islands, Honduras. Mar. Turtle Newslett. 152, 16–19.
Baumbach, D. S., Anger, E. C., and Dunbar, S. G. (2019). Identifying sea turtle home ranges utilizing data from novel web-based and smartphone GIS applications. Chelonian Conserv. Biol. 18, 133–144. doi: 10.2744/CCB-1355.1
Bell, C. D., Blumenthal, J. M., Austin, T. J., Ebanks-Petrie, G., Broderick, A. C., and Godley, B. J. (2008). Harnessing recreational divers for the collection of sea turtle data around the Cayman Islands. Tour. Mar. Environ. 5, 245–257. doi: 10.3727/154427308788714768
Broderick, A. C., Coyne, M. S., Fuller, W. J., Glen, F., and Godley, B. J. (2007). Fidelity and over- wintering of sea turtles. Proc. Biol. Sci. 274, 1533–1538. doi: 10.1098/rspb.2007.0211
Brueggeman, P. (2009). La Jolla Canyon and Scripps Canyon Bibliography. San Diego, CA: Library – Scripps Digital Collection.
Carr, A., Carr, M. H., and Meylan, A. B. (1978). The ecology and migrations of sea turtles, 7. The west Caribbean green turtle colony. Bull. Am. Mus. Nat. Hist. 162, 1–46.
Casale, P., Broderick, A. C., Freggi, D., Mencacci, R., Fuller, W. J., Godley, B. J., et al. (2012). Long- term residence of juvenile loggerhead turtles to foraging grounds: a potential conservation hotspot in the Mediterranean. Aquat. Conserv. Mar. Freshw. Ecosyst. 22, 144–154. doi: 10.1002/aqc.2222
Crall, J. P., Parham, P., and Stewart, C. V. (2013a). Hotspotter User Guide. Troy, NY: Department of Computer Science. Renssealer Polytechnic Institute.
Crall, J. P., Stewart, C. V., Berger-Wolf, T. Y., Rubenstein, D. I., and Sundaresan, S. R. (2013b). HotSpotter-patterned species instance recognition. Proc. IEEE Workshop Appl. Comp. Vis. 1, 1–8. doi: 10.1109/WACV.2013.6475023
Crear, D. P., Lawson, D. D., Seminoff, J. A., Eguchi, T., LeRoux, R., and Lowe, C. G. (2016). Seasonal shifts in the movement & distribution of green sea turtles Chelonia mydas in response to anthropogenically altered water temperatures. Mar. Ecol. Prog. Ser. 548, 219–232. doi: 10.3354/meps11696
Crear, D. P., Lawson, D. D., Seminoff, J. A., Eguchi, T., LeRoux, R. A., and Lowe, C. G. (2017). Habitat use and behavior of the East Pacific green turtle, Chelonia mydas, in an urbanized system. Bull. South. Calif. Acad. Sci. 116, 17–32. doi: 10.3160/soca-116-01-17-32.1
Delgado-Trejo, C., and Alvarado-Figueroa, J. (2012). “Current conservation status of the black sea turtle in Michoacán, Mexico,” in Sea Turtles of the Eastern Pacific, eds J. A. Seminoff and B. P. Wallace (Tucson, AZ: University of Arizona Press), 364–378.
Dickinson, J. L., Shirk, J., Bonter, D., Bonney, R., Crain, R. L., Martin, J., et al. (2012). The current state of citizen science as a tool for ecological research and public engagement. Front. Ecol. Environ. 10, 291–297. doi: 10.1890/110236
Dickinson, J. L., Zuckerberg, B., and Bonter, D. N. (2010). Citizen science as an ccological research tool: challenges and benefits. Annu. Rev. Ecol. Evol. Syst. 41, 149–172. doi: 10.1146/annurev-ecolsys-102209-144636
Druehl, L. (2000). Pacific Seaweeds: A Guide to Common Seaweeds of the West Coast. Pender Harbour: Harbour Publishing.
Dunbar, S. G., Anger, E. C., Parham, J. R., Kingen, C., Wright, M. K., Hayes, C. T., et al. (2021). HotSpotter: using a computer-driven photo-id application to identify sea turtles. J. Exp. Mar. Biol. Ecol. 535:151490. doi: 10.1016/j.jembe.2020.151490
Dunbar, S. G., Ito, H., Bahjri, K., Dehom, S., and Salinas, L. (2014). Recognition of juvenile hawksbills (Eretmochelys imbricata) through face scale digitization and automated searching. Endanger. Species Res. 26, 137–146. doi: 10.3354/esr00637
Dutton, P. H., and McDonald, D. L. (1990). “Sea turtles present in San Diego Bay,” in Proceedings of the Tenth Annual Workshop on Sea Turtle Biology and Conservation, eds T. H. Richardson, J. I. Richardson, and M. Donnelly (Washington, DC: NOAA), 139–141.
Eguchi, T., McClatchie, S., Wilson, C., Benson, S. R., LeRoux, R. A., and Seminoff, J. A. (2018). Loggerhead turtles (Caretta caretta) in the California current: abundance, distribution, and anomalous warming of the North Pacific. Front. Mar. Sci. 5:452. doi: 10.3389/fmars.2018.00452
Eguchi, T., Seminoff, J. A., LeRoux, R., Dutton, P. H., and Dutton, D. M. (2010). Abundance and survival rates of green turtles in an urban environment: coexistence of humans and an endangered species. Mar. Biol. 157, 1869–1877. doi: 10.1007/s00227-010-1458-9
Eguchi, T., Seminoff, J. A., LeRoux, R. A., Prosperi, D., Dutton, P. H., and Dutton, D. L. (2012). Morphology and growth rates of the green turtle (Chelonia mydas) in San Diego Bay. Herpetologica 68, 76–87. doi: 10.1655/HERPETOLOGICA-D-11-00050.1
Felger, R. S., Cliffton, K., and Regal, P. J. (1976). Winter dormancy in sea turtles: independent discovery and exploitation in the Gulf of California, Mexico, by two local cultures. Science 191, 283–285. doi: 10.1126/science.191.4224.283
Fenical, W., and Norris, J. N. (1975). Chemotaxonomy in marine algae: chemical separation of some Laurencia species (Rhodophtya) from the Gulf of California. J. Phycol. 11, 104–108. doi: 10.1111/j.1529-8817.1975.tb02755.x
Graham, E. A., Henderson, S., and Schloss, A. (2011). Using mobile phones to engage citizen scientists in research. EOS Trans. Am. 92, 313–315. doi: 10.1029/2011EO380002
Gunnill, F. C. (1980). Recruitment and standing stocks in populations of one green alga and five brown algae in the intertidal zone near La Jolla, California during 1973–1977. Mar. Ecol. Prog. Ser. 3, 231–243.
Hof, C., Smallwood, E., Meager, J., and Bell, I. P. (2017). First citizen-science population abundance and growth rate estimates for green sea turtles Chelonia mydas foraging in the northern Great Barrier Reef, Australia. Mar. Ecol. Prog. Ser. 574, 181–191. doi: 10.3354/meps12173
Hussey, N. E., Kessel, S. T., Aarestrup, K., Cooke, S. J., Cowley, P. D., Fisk, A. T., et al. (2015). Aquatic animal telemetry: a panoramic window into the underwater world. Science 348, 1255642–1255642. doi: 10.1126/science.1255642
Jeffers, V. F., and Godley, B. J. (2016). Satellite tracking in sea turtles: how do we find our way to the conservation dividends? Biol. Conserv. 199, 172–184. doi: 10.1016/j.biocon.2016.04.032
López-Mendilaharsu, M., Gardner, S., Seminoff, J. A., and Riosmena-Rodriguez, R. (2005). Identifying critical foraging habitats of the green turtle (Chelonia mydas) along the Pacific coast of the Baja California peninsula, Mexico. Aquat. Conserv. Mar. Freshw. Ecosyst. 15, 259–269. doi: 10.1002/aqc.676
Lowe, C. G., Topping, D. T., Cartamil, D. P., and Papastamatiou, Y. P. (2003). Movement patterns, home range, and habitat utilization of adult kelp bass Paralabrax clathratus in a temperate no-take marine reserve. Mar. Ecol. Prog. Ser. 256, 205–216. doi: 10.3354/meps256205
MacDonald, B. D., Lewison, R. L., Madrak, S. V., Seminoff, J. A., and Eguchi, T. (2012). Home ranges of East Pacific green turtles, Chelonia mydas, in a highly urbanized foraging ground. Mar. Ecol. Prog. Ser. 461, 211–221. doi: 10.3354/meps09820
MacDonald, B. D., Lewison, R. L., Madrak, S. V., Seminoff, J. A., and Eguchi, T. (2013). Fine scale diel movement of the East Pacific green turtle, Chelonia mydas, in a highly urbanized foraging environment. J. Exp. Mar. Biol. Ecol. 443, 56–64. doi: 10.1016/j.jembe.2013.02.033
Madrak, S. V., Lewison, R. L., Seminoff, J. A., and Eguchi, T. (2016). Characterizing response of east Pacific green turtles to changing temperatures: using acoustic telemetry in a highly urbanized environment. Anim. Biotelem. 4:22. doi: 10.1186/s40317-016-0114-7
McClatchie, S. (2014). “Oceanography of the Southern California current system relevant to fisheries,” in Regional Fisheries Oceanography of the California Current System, ed. S. McClatchie (Dordrecht: Springer), 13–60.
Michonneau, F., and Paulay, G. (2015). Using iNaturalist to learn more about echinoderms. REEF Encounter 30, 29–31.
Milton, S. L., and Musick, J. A. (2002). “Physiological and genetic responses to environmental stress,” in The Biology of Sea Turtles, eds P. Lutz, J. Wyneken, and J. Musick (Boca Raton, FL: CRC Press), 166–169.
Murcia, C. (1995). Edge effects in fragmented forests: implications for conservation. Trends Ecol. Evol. 10, 58–62.
Nordstrom, B., James, M. C., Martin, K., and Worm, B. (2019). Tracking jellyfish and leatherback sea turtle seasonality through citizen science observers. Mar. Ecol. Prog. Ser. 620, 15–32. doi: 10.3354/meps12978
Papafitsoros, K., Panagopoulou, A., and Schofield, G. (2020). Social media reveals consistently disproportionate tourism pressure on a threatened marine vertebrate. Anim. Conserv. [Epub ahead of print]. doi: 10.1111/acv.12656
Pattengill-Semmens, C. V., and Semmens, B. X. (2003). “Conservation and management applications of the reef volunteer fish monitoring program,” in Coastal Monitoring Through Partnerships, eds B. D. Melzian, V. Engle, M. McAlister, and S. S. Sandhu (Dordrecht: Springer), 43–50.
Plotkin, P. T. (2002). “Adult migrations and habitat use,” in The Biology of Sea Turtles, eds P. Lutz, J. Wyneken, and J. Musick (Boca Raton, FL: CRC Press), 232–241.
Raoult, V., David, P. A., Dupont, S. F., Mathewson, C. P., O’Neill, S. J., Powell, N. N., et al. (2016). GoProsTM as an underwater photogrammetry tool for citizen science. PeerJ 4:e1960. doi: 10.7717/peerj.1960
Read, T., and Jean, C. (2021). Using social media and photo-identification for sea turtles of new caledonia. Mar. Turtle Newslett. 162, 25–29.
REEF (2020). Reef Environmental Education Foundation Volunteer Fish Survey Project Database. Geneva: World Wide Web electronic publication.
RStudio Team (2018). RStudio: Integrated Development for R. RStudio, PBC. Boston, MA. Available online at: http://www.rstudio.com/
Seminoff, J. A. (2000). Biology of the East Pacific Green Turtle, Chelonia Mydas Agassizii, at a Warm Temperate Feeding area in the Gulf of California, Mexico. Ph.D. Thesis. Tucson: University of Arizona, 249.
Seminoff, J. A., Allen, C. D., Balazs, G. H., Dutton, P. H., Eguchi, T., Haas, H. L., et al. (2015). Status Review of the Green Turtle (Chelonia mydas) Under the U.S. Endangered Species Act. NOAA Technical Memorandum, NOAA-NMFS-SWFSC-539. Washington, DC: NOAA.
Seminoff, J. A., Resendiz, A., and Nichols, W. J. (2002). Diet of east Pacific green turtles (Chelonia mydas) in the Central Gulf of California, México. J. Herpetol. 36, 447–453.
Senko, J., Volker, K., William, M. M., Carthy, R. R., Templeton, R. P., and Nichols, W. J. (2010). Fine scale daily movements and habitat use of East Pacific green turtles at a shallow coastal lagoon in Baja California Sur, Mexico. J. Exper. Mar. Biol. Ecol. 391, 92–100. doi: 10.1016/j.jembe.2010.06.017
Shepard, F. P., and Inman, D. L. (1950). Nearshore circulation. Proc. First Conf. Coast. Eng. 5, 50–99.
Stinson, M. L. (1984). Biology of Sea Turtles in San Diego Bay, California, and in northeastern Pacific Ocean. Unpubl. M.S. Thesis. California: San Diego State University, 578.
Tulloch, A. I. T., Possingham, H. P., Joseph, L. N., Szabo, J., and Martin, T. G. (2013). Realising the full potential of citizen science monitoring programs. Biol. Conserv. 165, 128–138. doi: 10.1016/j.biocon.2013.05.025
Velez-Zuazo, X., Quiñones, J., Pacheco, A. S., Klinge, L., Paredes, E., and Quispe, S. (2014). Fast growing, healthy and resident green turtles (Chelonia mydas) at two neritic sites in the central and northern coast of Peru: implications for conservation. PLoS One 9:e113068. doi: 10.1371/journal.pone.0113068
Keywords: citizen science, Chelonia mydas, eastern pacific, sea surface temperature, behavior, community-based science
Citation: Hanna ME, Chandler EM, Semmens BX, Eguchi T, Lemons GE and Seminoff JA (2021) Citizen-Sourced Sightings and Underwater Photography Reveal Novel Insights About Green Sea Turtle Distribution and Ecology in Southern California. Front. Mar. Sci. 8:671061. doi: 10.3389/fmars.2021.671061
Received: 22 February 2021; Accepted: 13 April 2021;
Published: 12 May 2021.
Edited by:
Michele Thums, Australian Institute of Marine Science (AIMS), AustraliaReviewed by:
Tyffen Read, South Province, New CaledoniaNicolas James Pilcher, Marine Research Foundation, Malaysia
Copyright © 2021 Hanna, Chandler, Semmens, Eguchi, Lemons and Seminoff. This is an open-access article distributed under the terms of the Creative Commons Attribution License (CC BY). The use, distribution or reproduction in other forums is permitted, provided the original author(s) and the copyright owner(s) are credited and that the original publication in this journal is cited, in accordance with accepted academic practice. No use, distribution or reproduction is permitted which does not comply with these terms.
*Correspondence: Megan E. Hanna, bWVoMDc4QHVjc2QuZWR1; Erin M. Chandler, Y2hhbmRsZXIuZXJpbm1hcmllQGdtYWlsLmNvbQ==