 Suzanne J. Painting1*
 Paul Nelson1
 Andy J. Smith1
 Carolyn A. Graves1,2
 Andy Powell2
 Philippe Bersuder1
 Samuel Bullen3
 Simeon Archer-Rand1
- 1Centre for Environment, Fisheries and Aquaculture Science (Cefas), Lowestoft, United Kingdom
- 2Weymouth Laboratory, Centre for Environment, Fisheries and Aquaculture Science (Cefas), Weymouth, United Kingdom
- 3British Indian Ocean Territory Administration, London, United Kingdom
Diego Garcia is the largest atoll within the Chagos Archipelago in the Indian Ocean. Since the 1960s it has been a military base, populated only by military and support personnel. Infrastructure includes sewage treatment works, a waste disposal facility and an airbase. Lagoon use includes boating and large vessel anchorage. Current pollution levels by inorganic nutrients and other contaminants are unknown. A field study was undertaken in March 2019 to obtain baseline information on key environmental parameters and pollutants for assessing the state of marine water quality. Outside the atoll, three stations were sampled where human impacts were likely to be lowest (two off the north coast, considered as ‘near-pristine’; one on the east coast); one station was sampled in the lagoon mouth; 10 stations were sampled downstream from two sewage outflows. Inside the lagoon, 10 stations were sampled at near-shore sites likely to be directly impacted by activities such as boating and waste management; six stations were sampled in the central or eastern lagoon. In situ sensors were used to estimate temperature, salinity, chlorophyll (as fluorescence) and dissolved oxygen. Discrete water samples were analyzed for nutrients, chemical contaminants, heavy metals and fecal indicator bacteria. Sea surface temperatures were highest (29.5–35 °C) inside the lagoon; salinities were generally higher (> 34.1) outside the lagoon (vs 33.8–34.1 inside). Surface nutrient concentrations at near-pristine stations were undetectable for nitrate and phosphate and averaged 1.39 μM for dissolved inorganic nitrogen (DIN) and 1.73 μM for silicate. Concentrations were higher at most other stations (maximum 5.7 μM DIN, 0.38 μM phosphate, and 9.93 μM silicate), with ammonium contributing most to DIN. In the lagoon, chlorophyll concentrations were relatively low (0.3 – 0.6 μg chl l–1) near the surface and higher (max 0.9 μg chl l–1) at depth. Results suggested low levels of pollution overall. However, levels of nutrients, oxygen deficiency, chemical contaminants (e.g., solvents and DEET) and heavy metals (cadmium, nickel, zinc and copper) at some sites inside the lagoon are a concern due to slow flushing rates and will be used to inform future monitoring and assessment of environmental health at Diego Garcia.
Introduction
The UK’s Overseas Territories are home to over 90% of the UK’s biodiversity and are important to regional and international marine conservation efforts. The British Indian Ocean Territory (BIOT), comprising the atolls of the Chagos Archipelago (Figure 1), lies around 500 km south of the Maldives and consists of five low lying coral atolls (58 islands in total) surrounded by a 640,000 km2 maritime zone which was declared a ‘no-take’ marine protected area (MPA) in 2010 (Sand, 2010; Sheppard et al., 2013). The archipelago includes around 6,000 km2 of shallow reef zones with the remainder being of bathyal and abyssal depth (> 2,000 m). The largest atoll, Diego Garcia, is located to the south east of the archipelago (Figure 1; Purkis et al., 2016). A large proportion of the atoll area (approximately 70%) is comprised of an extensive lagoon (11 km2), which is enclosed by one of the most continuous land rims of all coral atolls.
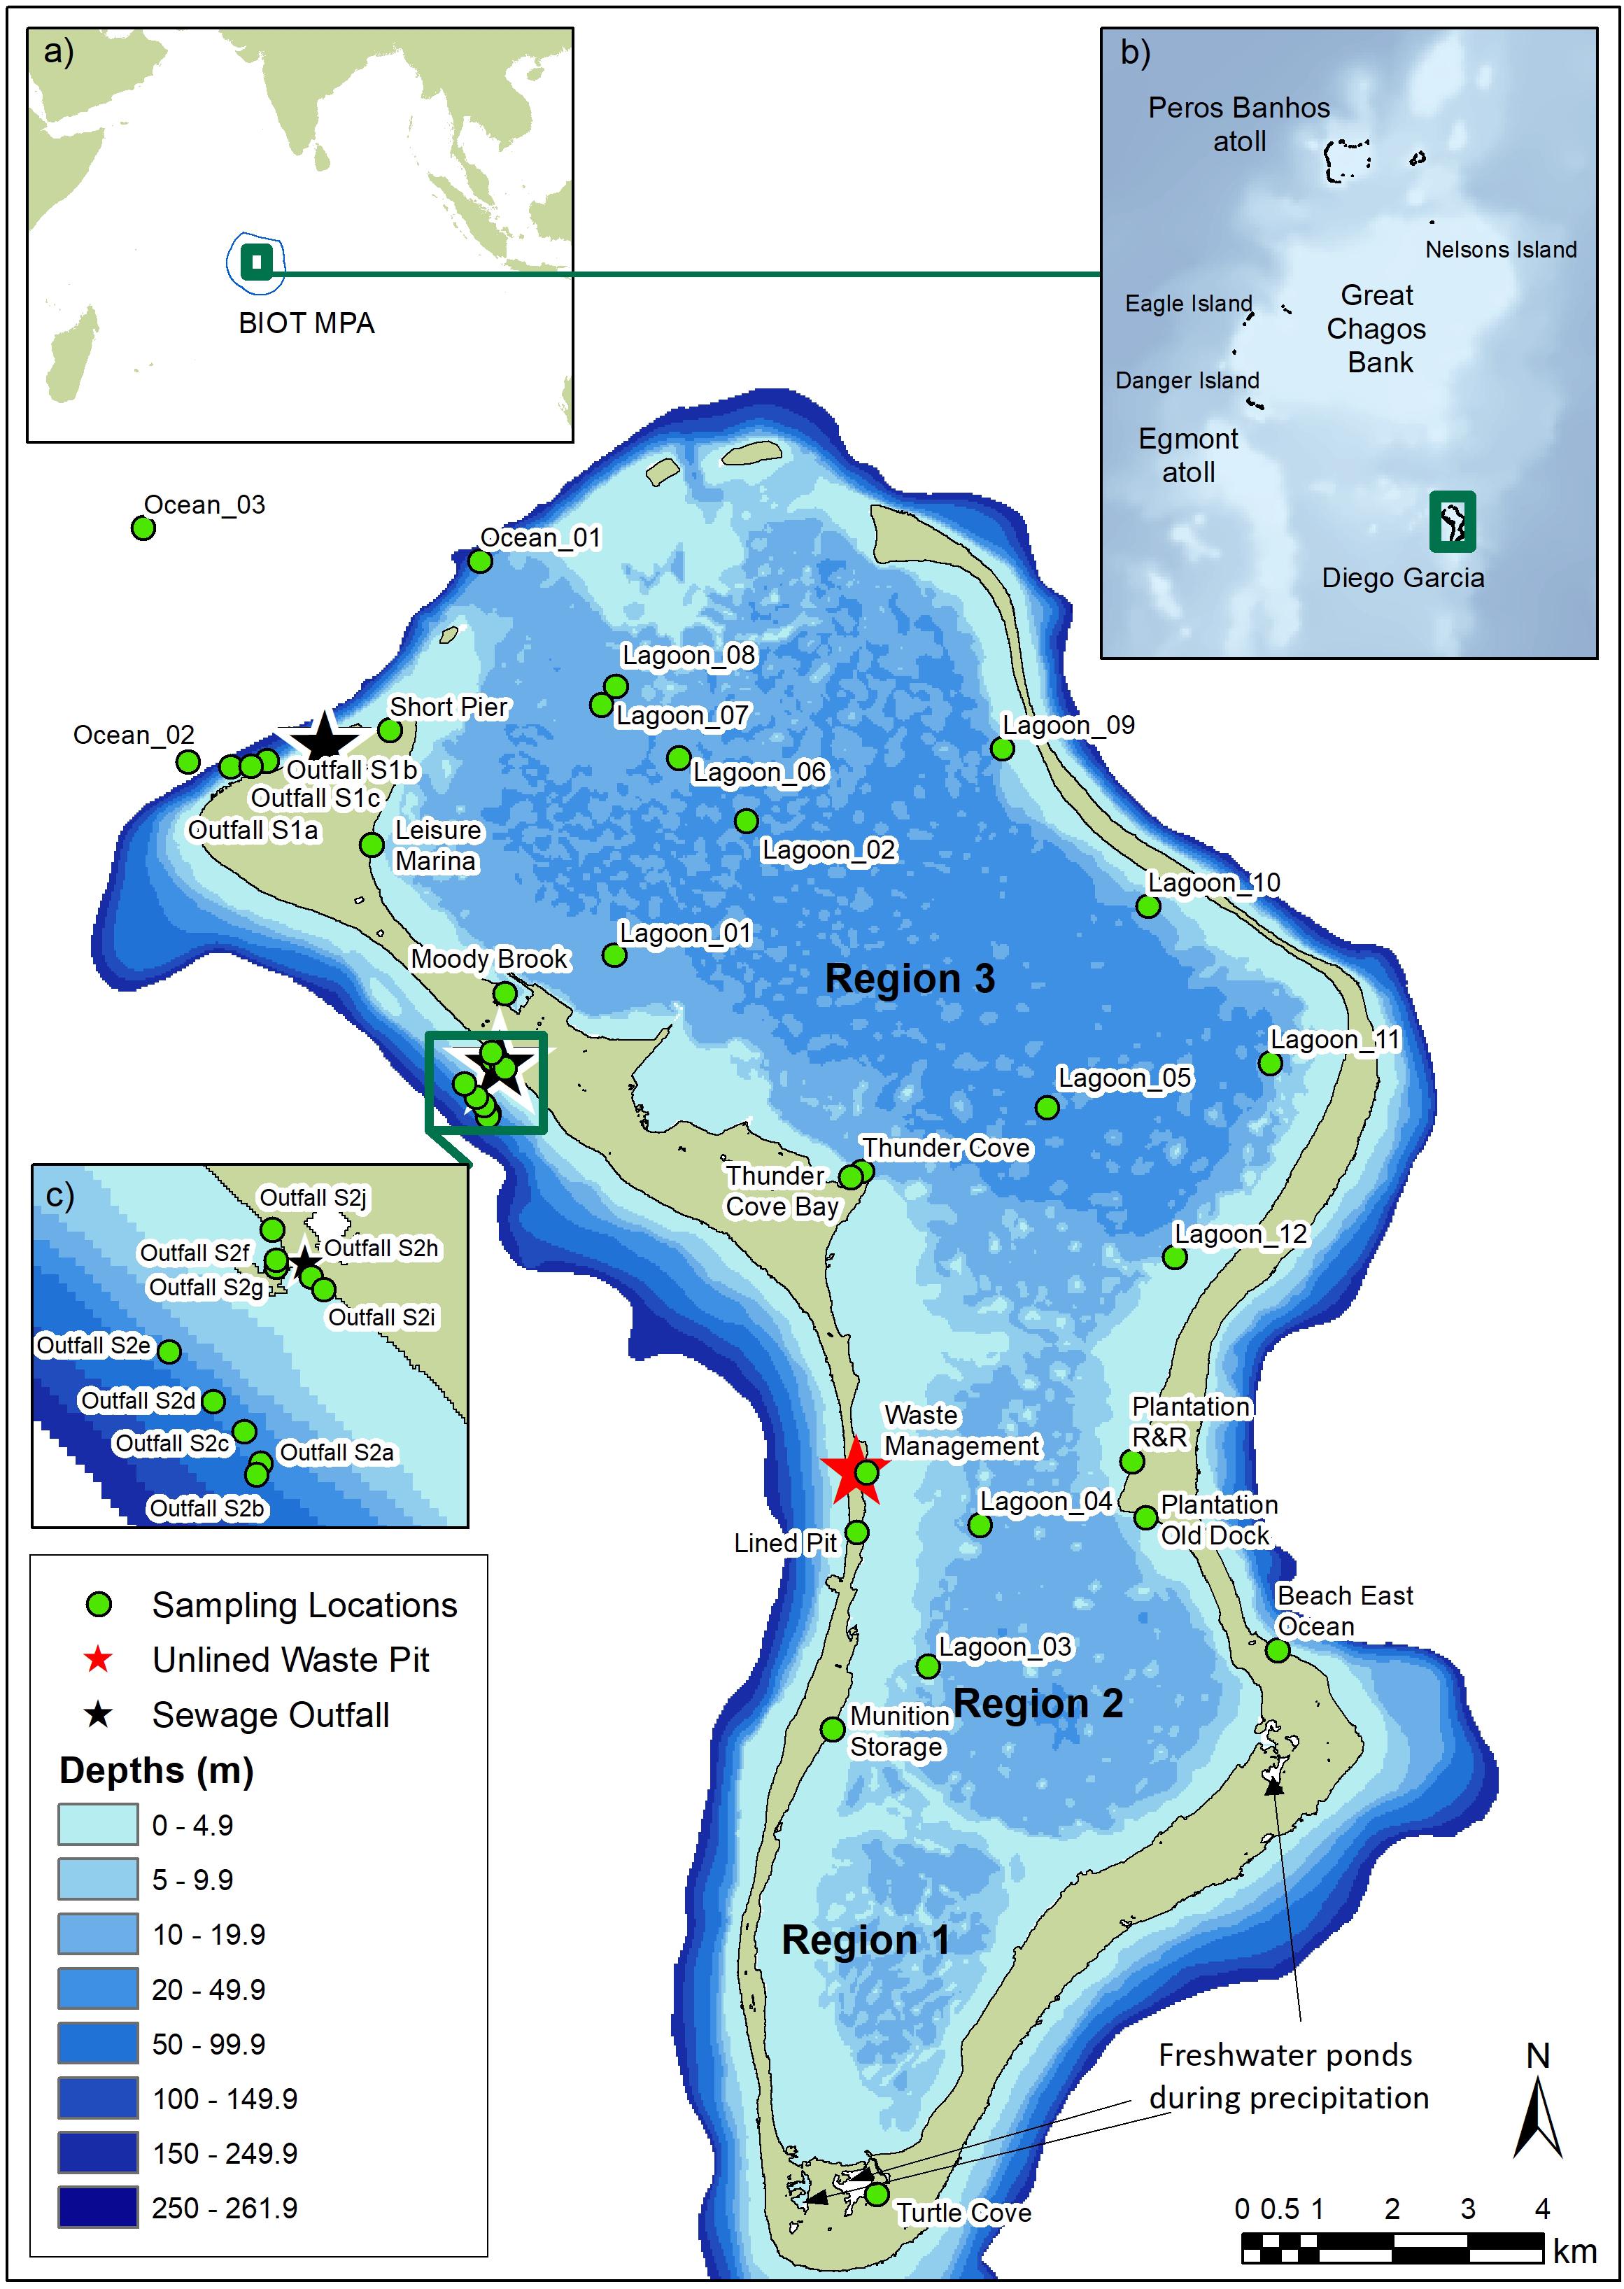
Figure 1. Map of Diego Garcia showing sampling stations in Regions 1 to 3 in the lagoon, the location of lined and unlined waste pits, and freshwater ponds in Regions 1 and 2 which flow into the lagoon (Wang et al., 2014). Turtle Cove is a turtle breeding and hatching area. Insets indicate (a) the location of the British Indian Ocean Territory (BIOT) and extent of the Marine Protected Area (MPA; blue line), (b) atolls of the central Chagos Archipelago, and (c) sampling stations at sewage outfall 2.
Due to the location of the Archipelago in the tropical southwest Indian Ocean, the marine environment is considered to be low in nutrients (Sheppard and Seaward, 1999; Resplandy et al., 2009). Broadscale oceanographic processes are influenced by atmospheric processes, regional currents and bathymetry (including seamounts and the Seychelles-Chagos Thermocline Ridge; Hermes and Reason, 2008; Xue et al., 2014; Masner et al., 2017), with seasonal winds and Ekman transport driving upwelling of nutrient-rich waters and sustaining plankton productivity (Fasolo, 2013; George et al., 2013; Dilmahamod et al., 2016). Surface waters are often nutrient depleted (Rayner and Drew, 1984; McCreary et al., 2009; Harms et al., 2019) with low chlorophyll (chl) concentrations (< 0.2 μg chl l–1; Resplandy et al., 2009; George et al., 2018). Higher concentrations (>5 μM nitrate, > 1 μg chl l–1) are typically found at or below the thermocline which can vary in depth from about 20 to 120 m (George et al., 2013). Fasolo (2013) observed values of around 0.25 to 1.5 μg chl l–1 at depth on seamounts and transects across the Chagos archipelago.
At Diego Garcia, the forereef slopes steeply down to depths of 400 m within a short distance (< 1 km) of the exposed atoll rim (Hamylton and East, 2012). The lagoon reaches a maximum depth of approximately 31 m in the center (Sheppard and Sheppard, 2019) and can be broadly divided into three north-south basins that get progressively shallower and have more intricate topography, including coral knolls and limestone ridges (Hamylton and East, 2012). The southernmost basin (Region 1, Figure 1) is the smallest and has an average water depth of ∼7 m; to the north, Region 2 is slightly larger and has water depths averaging ∼9 m; Region 3 is the largest basin and generally has the deepest water (averaging ∼13 m, Wang et al., 2014). The flushing time (i.e., the time required to flush 90–95% of the initial water mass out of the lagoon) has been estimated to be long. Wang et al. (2014) estimated that the flushing time of the entire lagoon was 24–32 days, with the outer part of Region 3 (closest to the lagoon mouth) characterized by strong tidal flushing (19–25 days), weak estuarine circulation and cool saline water. The inner lagoon (Region 1), which receives freshwater inflows during precipitation, was estimated to have the longest flushing time (38–43 days) and be characterized by warmer, fresher water with moderate estuarine circulation and weak tidal influence. Between these outer and inner parts of the lagoon, transitional characteristics include moderate tidal flushing (34–41 days in Region 2, 22–28 days in the southern parts of Region 3) and estuarine circulation (Wang et al., 2014). Tidal forcing of oceanic water into inner regions of the lagoon through deep water channels may occur but has not yet been demonstrated (Sheehan et al., 2019). The carbonate limestone land rim has the highest levels of rainfall in the Indian Ocean (Stoddart, 1971; Hamylton and East, 2012). Since the 1950s, rainfall has increased significantly with heaviest rain typically from November to April (austral summer, Sheppard and Sheppard, 2019), when light north-westerly winds prevail. A considerable proportion of the rainfall may accumulate in large freshwater ponding areas located along the shoreline of the southern-most lagoon region and contribute toward freshwater inflows to the lagoon (Wang et al., 2014; Sheehan et al., 2019).
In 1966 an agreement was signed between the United Kingdom and the United States (UN, 1976) for the setting up of a military installation on Diego Garcia. There is no permanent population on Diego Garcia, but between three and five thousand US and British military and contract civilian personnel are stationed on the atoll at any time. To meet the needs of this population, facilities for the disposal of waste include two sewage processing plants which discharge into coastal waters outside the atoll and a series of lined and unlined waste pits on land (Spalding, 2018). Moored vessels, stationed within the lagoon, currently dispose of their waste water outside of the lagoon, although there is some anecdotal evidence of accidental release of gray and bilge water in the lagoon.
Diego Garcia is susceptible to natural environmental stressors and impacts of human activities on the marine environment. Cumulative stressors can lead to reduced resilience of species and habitats, making them more susceptible to climate change and damage from storms and other natural events (Gibbs, 2009; Wiedenmann et al., 2013; Johnston et al., 2015; Lauvset et al., 2015; Sheppard et al., 2017; Dougan et al., 2020; Hays et al., 2020; Laffoley et al., 2020).
Sewage discharges and other inputs of nutrients to the marine environment are a global concern (Cloern, 2001; Smith, 2003) due to undesirable impacts such excessive algal growth (phytoplankton and/or macroalgae), oxygen deficiency and mortality of benthic fauna and fish (Painting et al., 2007; Tett et al., 2007; Devlin et al., 2011). In corals, nutrient enrichment may result in reduced resistance to pathogens (Dougan et al., 2020). Sewage discharges have the potential to increase concentrations of pathogenic microbes, particularly through fecal contamination (e.g., World Health Organization (WHO), 2003). The presence of Escherichia coli (E. coli) in environmental water samples indicates an elevated risk of fecal-borne pathogens. These could include other bacteria such as Salmonella spp., viruses such as hepatitis A, protozoa, or parasites.
Common man-made chemical contaminants which find their way into marine ecosystems can be hazardous to marine life. Their impacts can be measured though specific effects such as interaction with steroid receptors (Kirby et al., 2004; Smith et al., 2015) and effects on molting (Macken et al., 2015). Impacts can also be measured via whole organism or population responses, including reduced productivity and increased respiration (Johnston et al., 2015) or chronic effects on growth and hatching rate in individuals and populations (Law and Hii, 2006; Barron et al., 2020). Many chemicals, including certain metals, pesticides and polycyclic aromatic hydrocarbons (PAHs), have been identified as priority substances (EU, 2008, 2013). Significant levels of PAHs may occur due to incomplete combustion of diesel fuel, fuel spills, and aircraft fuel dumping (Nasher et al., 2013) and widespread use in commercial products, such as pharmaceuticals, agricultural products, and lubricating materials. Sixteen PAH compounds have been identified as priority pollutants due to their toxic, mutagenic, and carcinogenic characteristics (see Nasher et al., 2013). Their low water solubility and high lipophilicity means that PAHs are easily and rapidly absorbed by organisms, adsorbed onto the surface of suspended matter, deposited on the sea floor or passed into the marine food chain (Nasher et al., 2013).
Direct impacts of human activities in the Chagos Archipelago are likely to be low as it is largely uninhabited (Readman et al., 2013; Sheppard and Sheppard, 2019). However, reviews of the state of the environment at Diego Garcia indicate that human activities may have some impacts on marine water quality (Everaarts et al., 1999; BIOT Administration, 2017; Spalding, 2018). Current levels of pollution by nutrients, man-made chemical contaminants and heavy metals are unknown. The aim of this study was to obtain baseline information and data on key environmental parameters and pollutants for assessing the current state of marine water quality and inform future monitoring and assessment of environmental health at Diego Garcia.
Materials and Methods
A field survey was carried out between 26th March and 2nd April 2019. Discrete water samples were collected for analysis of nutrients, chemical contaminants, E. coli and whole sample toxicity. Sensors were used to measure physical parameters, dissolved oxygen, and fluorescence (as a proxy for chlorophyll and therefore algal biomass). Passive samplers were used to sample heavy metals. All samples were returned to an on-island laboratory for analysis or preservation depending on analyses required.
Study Sites
Figure 1 shows the location of all sampling sites. At two sewage treatment plants on the north-west land rim, sewage and wastewater are treated biologically in large settling ponds and disinfected with chlorine (Readman et al., 2013) prior to discharge onto the forereef. Shipping and boating activities in the lagoon are largely confined to the northernmost basin (Region 3) where the water is deeper, and the popular Plantation recreational area in Region 2. Lined and unlined waste pits are located on the south-west land rim (Region 2), with the main unlined waste pit at the Waste Management site.
Sampling Stations
Outside the atoll (Figure 1), three stations were sampled where human impacts were likely to be lowest (two off the north coast [Ocean_02 and _03], considered as ‘near-pristine’; one on the east coast [Beach East Ocean]); one station was sampled in the lagoon mouth (Ocean_01). Ten stations were sampled downstream from two sewage outflows (Outfall S1 and S2). Inside the lagoon (Figure 1), 10 stations were sampled at near-shore sites likely to be directly impacted by activities, such as boating (e.g., a marina, jetties), vessel anchorage, and waste management, and six were in areas in the central or eastern lagoon likely to have lower human impacts.
Sampling
At stations in shallow water (< 0.5 m), surface water samples were collected from the shore. At stations outside the atoll and in deeper waters of the lagoon, sampling was carried out from a small open vessel. Water samples were collected from just below the surface using a 2-liter Niskin bottle on a weighted (5 kg) hand-held cable, deployed alongside a CTD (Conductivity, Temperature and Depth) profiler. Sensors used to obtain data on physico-chemical and biological parameters are described below.
Physico-Chemical and Biological Parameters
Surface temperature, salinity, and dissolved oxygen
A handheld multi-meter sensor (a WTW Multi3630 IDS meter with pH, conductivity and optical DO probes, referred to as ‘surface probe’) was used to obtain measurements of temperature, salinity, pH and dissolved oxygen in surface waters at very shallow stations.
Vertical profiles
At deeper stations, a hand-held CTD instrument package (RBR Maestro CTD, Canada) was deployed to obtain profiles of water column structure. The instrument was fitted with sensors to measure: depth (D, m); temperature (T, °C); practical salinity; chlorophyll fluorescence, using a Seapoint sensor; turbidity (nephelometric turbidity unit, NTU, using a Seapoint sensor); and dissolved oxygen (μM, using the RBRcodaODO| fast8 sensor).
The CTD was deployed by hand and left at a depth of 1 m for approximately 1 min for sensors to stabilize. The instrument was then lowered slowly to approximately 0.5–5 m off the seabed, before being raised slowly back to the surface and retrieved. Sensor measurements (from ∼2 m) are reported as near-surface measurements.
Nutrients
Surface sea water samples were filtered through 25 mm diameter glass microfiber syringe filters into 60 ml polypropylene sample pots and preserved with 0.1 ml of 16 g l–1 mercuric chloride solution (sample concentration approximately 28 mg l–1).
Fecal Indicator Bacteria
Fecal indicator bacteria, Escherichia coli, were used to estimate microbiological water quality. Water samples (200 ml) were collected in sterile 500 ml bags and stored in cool boxes (3–5°C) during sampling. Samples were returned to the on-island laboratory and analyzed immediately.
Organic Chemical Contaminants
Pre-prepared clean glass sample bottles (1 liter) were used to collect samples for organic contaminant screening. Samples were taken from just below the water surface, stored in cool boxes in the field and transferred to refrigerators on-island as soon as possible.
Heavy Metals
Sampling for metals was carried out using Diffuse Gradients in Thin films (DGT) passive sampling devices (LSNM-NP Loaded device, DGT® Research Ltd., Lancaster, United Kingdom). The DGTs were placed in an acid cleaned plastic cage, attached to a structure or buoy below the water line, and recovered after 3–5 days. These were deployed in five locations within the lagoon: the number of DGTs deployed varied from one at Thunder Cove, to two at Plantation R&R and Moody Brook, three at the Waste Management site, and five at Leisure Marina (see Figure 1).
Passive samplers and blank/control samplers were prepared following guidance supplied by DGT® Research Ltd. Blanks were exposed to the environment during deployment and recovery.
Whole Sample Toxicity
Samples of water were collected in sterile 15 ml polypropylene centrifuge tubes and stored in cool boxes (3–5°C). They were returned to the on-island laboratory and analyzed immediately.
Sample Storage
Passive samplers and nutrient, toxicity and microbiology samples were all stored in cool boxes under ice in the field, then transferred to a refrigerator in the Diego Garcia laboratory as soon as possible once fieldwork was completed each day. The samples for GC-MS screening did not require specialist storage but were kept in a refrigerator as best practice.
Where required, cool boxes and ice packs were used during transport of samples to the United Kingdom. However, there was some risk of sample degradation in the passive samplers. For nutrient samples, the addition of mercuric chloride as a preservative reduced the risks. However, use of preservatives may affect the analysis of ammonium concentrations in sea water samples (Kirkwood, 1996), and confidence in the results of the ammonium analyses is therefore lower than for other dissolved inorganic nutrients. Contaminant samples were transported in strong transport boxes.
Data and Sample Analysis
CTD Sensor Parameters
Sensor data obtained from the CTD were analyzed using RBR Ruskin Desktop software and RBR’s RSKtools Matlab post-processing tool kit. Near-surface values were extracted manually using RBR Ruskin Desktop software by selecting data immediately following deployment but after sensor response had stabilized. Readings were averaged over 100 data points (approximately 12 s at instrument sampling rate of 8 Hz). Depth profiles were extracted in Matlab using the RSKtools package (RSKtools v3.5.0; RBR Ltd., Ottawa, ON, Canada; 2020-06-26). Processing included: removing salinity spiking by calculating and applying a correction for the time-shift between conductivity and temperature sensors; recalculation of practical salinity and calculation of density anomaly (sigma0, presented here as ‘density’) using the integrated tools from the TOES-10 GSW toolbox; removing loops in profile ascent and descent (identified by reversed sensor velocity); bin averaging in 0.1 dbar intervals; and smoothing (boxcar) with a filter window of 3. Anomalous values at the top and bottom of profiles were manually removed for all channels, where present (stations Lagoon_04, 05, 08 and 11). Very high chlorophyll values at the bottom of the profiles for stations Lagoon_05 and 08 were removed. While these may have been due to the sensor approaching high chlorophyll particles near the seafloor, they represented discontinuities from the rest of the profiles.
All sensors were operated using their factory calibration. The oxygen sensor calibration was checked by measuring 0 and 100% saturation upon return to the United Kingdom to produce the following correction which was applied to all observations:
Oxygen percentage saturation was recalculated from the corrected concentrations and in situ temperature and salinity measurements as per Garcia and Gordon (1992, using Benson and Kraus data). Oxygen concentrations in micromoles per liter (μM) were converted to mg l–1 by multiplying by the molecular weight for oxygen (∼ 32 g mol–1).
Ideally, calibration checks of the oxygen optode would have been carried out daily in the field. The values presented are therefore to be taken as approximate. Similarly, the factory calibration of the chlorophyll fluorescence sensor is not expected to be appropriate for the specific phytoplankton communities of the study area and data therefore indicate relative changes in chlorophyll only.
Oxygen values below 6 mg l–1 are considered to indicate oxygen deficiency (Best et al., 2007) and possible undesirable disturbances due to nutrient enrichment or organic loading, e.g., due to decay of plants or other organic waste (Tett et al., 2007; Devlin et al., 2011; Foden et al., 2011).
Nutrients
Samples were returned to the United Kingdom for analysis and stored in a refrigerator until they were analyzed. Analysis was performed on a Skalar San + + Continuous Flow Analyzer (CFA; Skalar Analytical B.V., Breda, Netherlands) running channels for nitrite, total phosphate, phosphate, silicate and ammonium with photometric detection using methods described by Bendschneider and Robinson (1952); Murphy and Riley (1962), Grasshoff (1976) and Treguer and LeCorre (1975).
Limits of detection (LOD) were 0.07 μM for nitrite, 0.43 μM for ammonium, 0.14 μM for phosphate, and 0.09 μM for silicate. Results were given as total oxidized nitrogen (TOxN, where TOxN = nitrate + nitrite, also referred to hereafter as nitrate), ammonium-N, phosphate-P and silicate-Si. Total dissolved inorganic nitrogen (DIN) was calculated by summing TOxN and ammonium. Where TOxN values were < LOD, DIN was ammonium only.
Results are shown per station sampled, and as average values at locations inside and outside the lagoon. Average values were used to compare nutrient ratios against Redfield ratios for N:P (16:1) and N:Si (∼1:1) (Downing, 1997; Lefevre et al., 2003; Burson et al., 2016). Where P was < LOD, N:P ratios were not calculated.
Fecal Indicator Bacteria
Samples were analyzed using a Wagtech Potatest II mobile microbiology laboratory, a stand-alone field lab with its own incubators, sterilization equipment and ancillary kit. Analysis was carried out using Merck Chromocult® nutrient pad medium. This medium was supplied sterile, dehydrated, on pads inside Petri dishes which fit inside the incubators. The medium was prepared by aseptic addition of 3.5 ml sterilized water to each pad. Once this was done, 10 or 100 ml of each sample was filtered through a 0.45 μm cellulose nitrate filter which was placed onto the Chromocult® pad, covered with the petri dish lid and incubated at 37°C for 21 ± 3 h. After incubation, pads were removed, visually inspected and E. coli colonies counted. This method is specific and accurate for both tropical and temperate samples (Byamukama et al., 2000) and relatively simple to run in a mobile laboratory.
To evaluate bacterial risk, standards for recreational water use (Table 1) from the EU Bathing Waters Directive (EU, 2006a) were used. Examples of other similar standards are given in FAO and WHO (2018) and Environment Agency (EA) (2000, 2019).
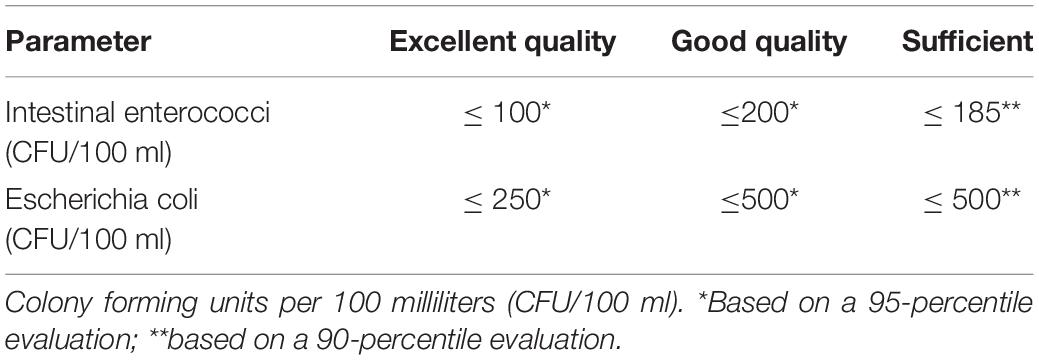
Table 1. Microbiological standards for coastal and estuarine (transitional) waters (EU, 2006a) (Bathing Waters Directive).
Organic Chemical Contaminants
Samples were analyzed using a full-scan gas chromatography-mass spectrometry (GC-MS) screening technique for non-polar organic environmental pollutants. The technique allows for a target based, multi-residue screening of volatile organic compounds (VOCs) and semi-volatile organic compounds (SVOCs). The method uses a retention time locked, custom built target mass spectrometric database with over 1050 compounds, allowing for the identification and measurement of a wide range of organic pollutants in any given water body. It includes deconvolution reporting software to provide increased confidence in identifying the chemical peaks in each sample. For each contaminant detected in the screening process, a chemical database was used to describe the possible sources and/or use of the chemicals (see Supplementary Table 1).
Screening results are semi-quantitative and are useful for flagging the presence of chemicals at relatively high concentrations (in the μg l–1 range) that may need further investigation and quantification. Estimated concentrations are indicative only and it is not generally considered appropriate to use the results to ascertain if chemicals present are at acceptable or unacceptable concentrations. Nonetheless, international assessment standards were used to estimate potential risks from chemical contaminants, particularly substances of very high concern (SVHC; EU, 2006c) and priority substances (EU, 2008, 2013, 2016).
Heavy Metals
The gel in each passive sampler was carefully removed from the DGT housing under clean laboratory conditions and acidified with 1 M nitric acid for at least 24 h. The acidified sample was analyzed by inductively coupled plasma mass spectrometry (ICP-MS) and inductively coupled plasma optical emission spectrometry (ICP-OES). Environmental concentrations were accounted for using the results from the blanks collected during sampling.
To estimate potential risks to marine life from heavy metals, Environmental Quality Standards (EQS) established by Directive 2008/105/EC (EU, 2008), subsequently amended by Directive 2013/39/EU, EU, 2013; see also EC, 1976; EU, 2006b) and the associated Specific Pollutants for long-term exposure in saltwater (seawater) developed in collaboration with EU Member States (UKTAG, 2013; UK, 2015) were used. In the case of metals, the EQS refer to a dissolved concentration, as measured in a water sample filtered through a 0.45 μm filter or subject to any equivalent treatment. DGT samplers in contrast measure free metal ions and easily dissociable metal complexes, and time weighted averaged concentration of metals measured by DGT are expected to be lower or equal to that of an equivalent “dissolved concentration” measurement. Although they were developed for European waters, these standards are likely to be applicable to marine organisms in other areas.
Whole Sample Toxicity
A Microtox® in vitro test system, designed to test samples in the field under ambient temperatures (0–40°C), was used to detect whole sample toxicity at all sites apart from Leisure Marina, Thunder Cove and Lagoon _06 and _07. The method followed has been described by previous authors (Jarque et al., 2016; Masner et al., 2017; Rotini et al., 2017; see Faria et al., 2004 and Abbas et al., 2018). The Microtox FX test system (previously Deltatox) comprises a highly sensitive luminometer, liquid reagents and freeze-dried bioluminescent Aliivibrio fischeri bacteria. The test is initiated by reactivating colonies of bacteria in an ideal medium. Aliquots (900 μl) of each field sample are added to control and test vials and left to incubate for 15 min at ambient temperature. The amount of light produced by bacteria growing in each vial is measured. The luminosity in control vials is considered to represent 100% of that expected from a bacterial population growing at that temperature and incubation time. Differences in luminosity between the sample and control are expressed as a percentage change.
Results
This study took place toward the end of the austral summer. Prior to and during the fieldwork, weather conditions were good. Precipitation, wind speeds and currents were not measured; records published online show that precipitation and wind speeds were low (< 0.02 inches and 0–10 mph respectively, 21st March – 2nd April1) and that tidal currents near the mouth of the atoll were slow (25th March – 2nd April2).
Physico-Chemical and Biological Parameters
Surface Probe Measurements
Surface probe measurements (Table 2) showed salinity ranges from 33.3 to 34.1 and temperature ranges from 30.9°C to 33.6°C. Temperatures were higher than measurements from the CTD (29.5–31°C, Table 2), probably because they were closer to the surface where there was more solar/atmospheric warming. Dissolved oxygen concentrations were all > 6 mg l–1. Values for pH ranged from 8.1 to 8.4.
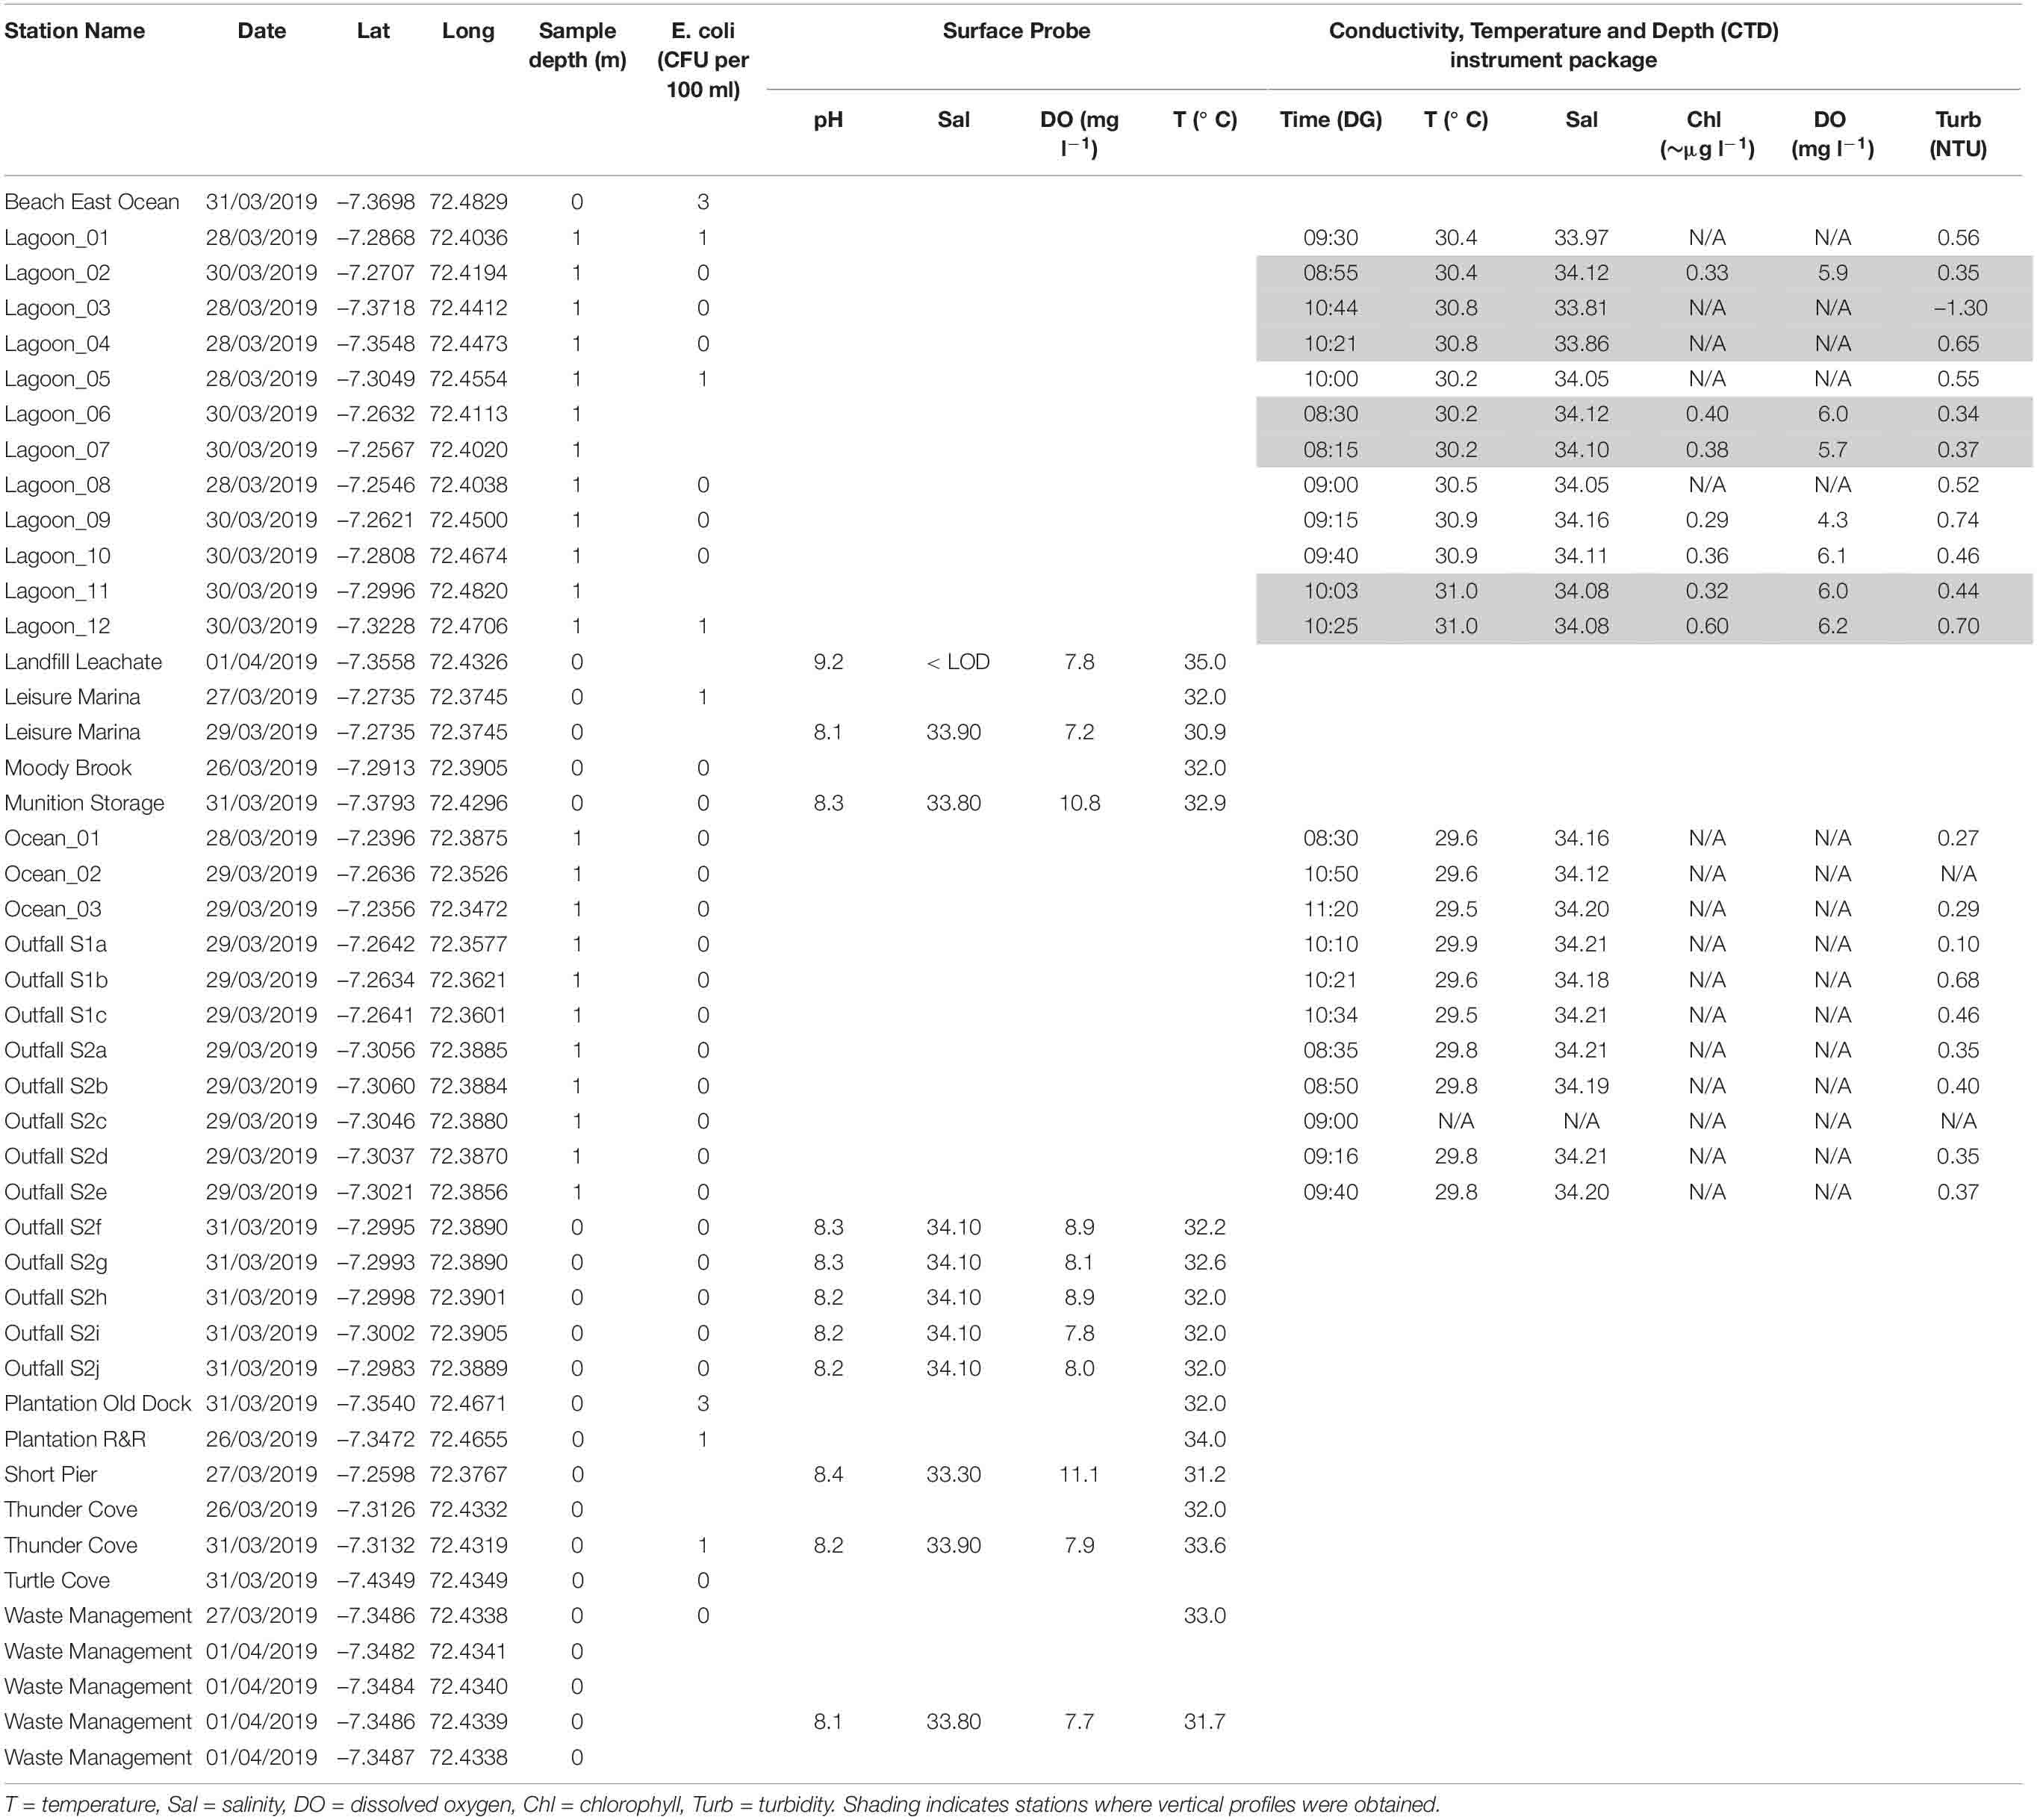
Table 2. Surface measurements from sensors (surface probe and CTD) and counts for fecal indicator bacteria (colony forming units, CFU, per 100 ml).
CTD Measurements
The CTD was deployed at 23 stations for near-surface measurements of physical and chemical parameters (Table 2). Vertical profiles were obtained at 7 stations where the water column was deep enough.
Near-Surface Measurements
In general, near-surface sea water outside the lagoon had lower temperatures (< 30°C, Table 2) and higher salinities (> 34.1) than surface sea water inside the lagoon (> 30°C, Table 2; salinity 33.8–35.0, Figure 2 and Table 2). Inside the lagoon, temperatures were generally highest (> 30.6°C) where water was shallow (e.g., near-shore and in Region 2). Turbidity values (Table 2) were also generally higher inside the lagoon, especially in shallower locations (> 0.4 NTU). At ocean stations _01, _02 and _03, average near-surface values were 29.55 ± 0.06°C, 34.16 ± 0.04 salinity and 0.28 ± 0.01 NTU (Table 2).
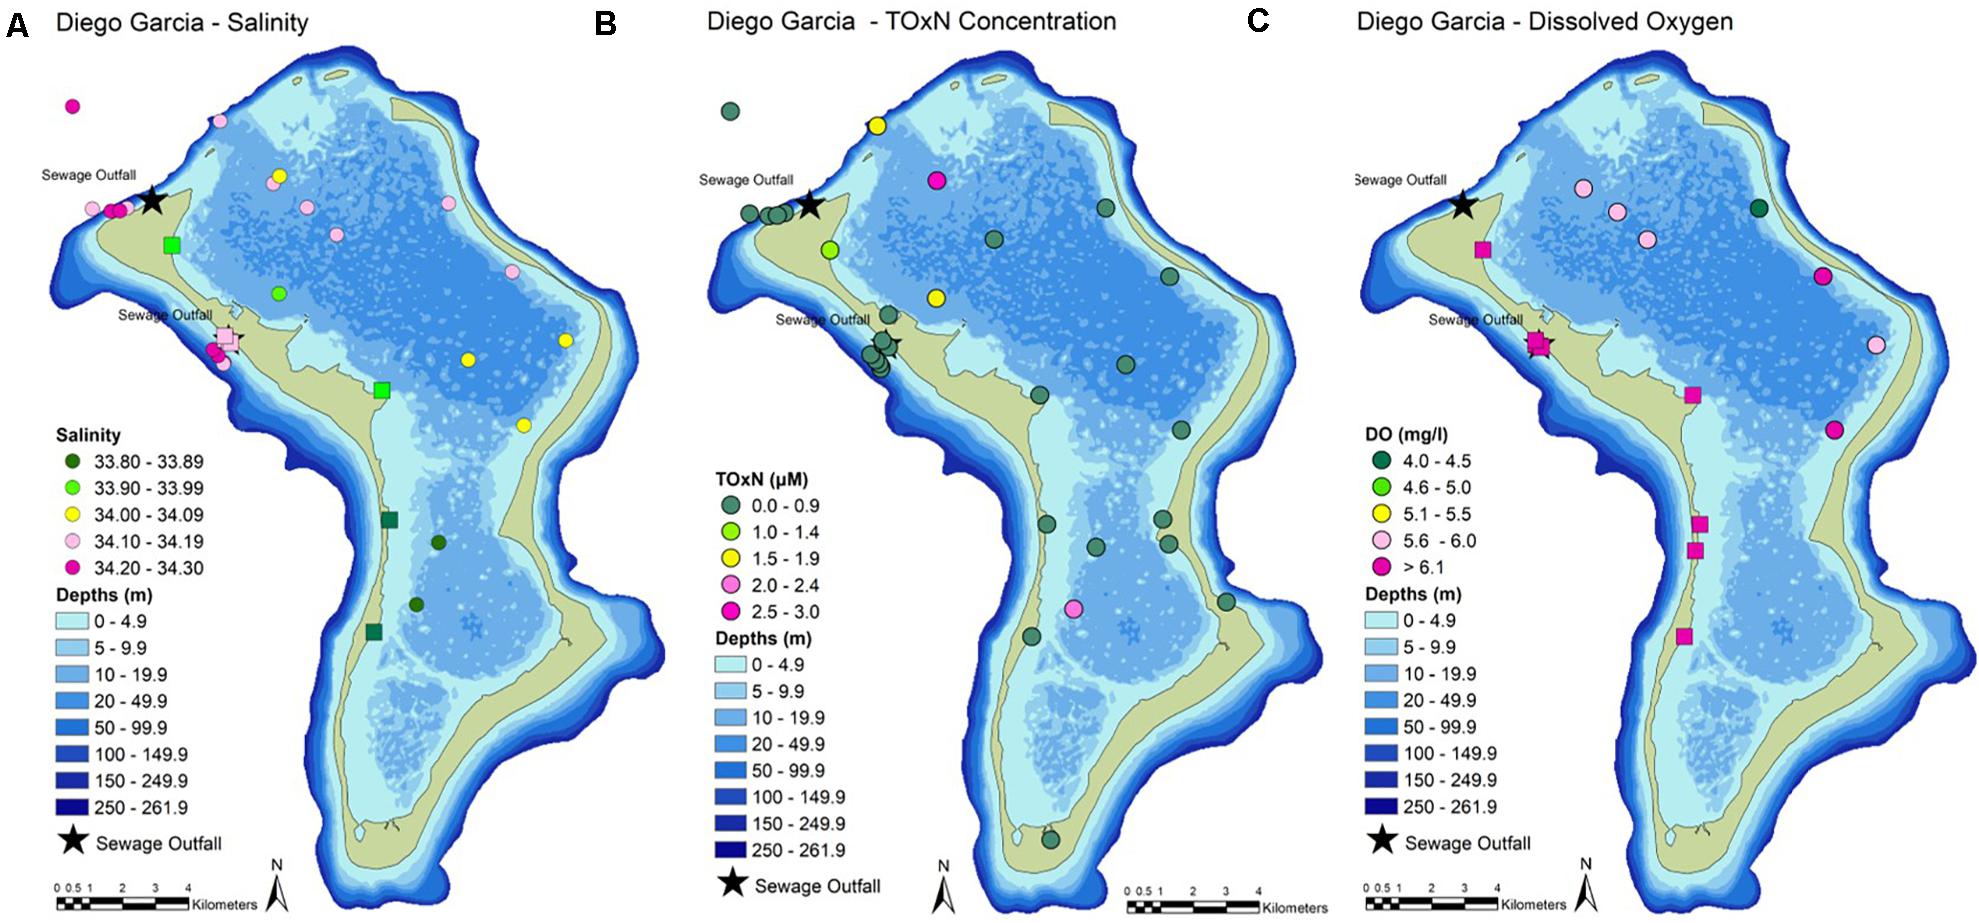
Figure 2. Near-surface measurements of (A) salinity, (B) nutrient concentrations (as TOxN, total oxidizable nitrogen = nitrate + nitrite), and (C) dissolved oxygen. Oxygen levels below 6 mg l–1 indicate oxygen deficiency. Circles = results from the CTD. Squares = results from the surface probe.
Temperature and salinity at the two outfall sites (29.7 ± 0.15°C, salinity 34.20 ± 0.01) did not show significant differences (Welch 2-sample t-test). Water was more turbid (up to 0.8 NTU) at sewage outfall 1.
Near-surface chlorophyll in the center of the lagoon (Lagoon_02, 06 and 07) and at near-shore stations in Region 3 (Lagoon_09, 10, 11 and 12) was between 0.3 and 0.4 μg chl l–1 at all stations except Lagoon_12 where it reached 0.6 μg chl l–1 (Table 2). Benthic vegetation was observed here, but not at the other near-shore stations. Surface dissolved oxygen levels were near 100% saturation (5.7–6.2 mg l–1, Table 2) at all stations except at near-shore Lagoon_09 where only 70% saturation (4.3 mg l–1) was observed, corresponding with the highest turbidity value.
Vertical Profiles
Lagoon stations 2, 6, 7 (Region 3)
Vertical profiles of water column structure at stations near the entrance to the lagoon (Figure 3) showed temperature, salinity and density stratification. The upper layer (approx. 8 m) of water was warmer (∼ 30.2°C) with lower salinity (∼ 34.1). The deeper layer (below ca 13 m) was colder and more saline. Between these two layers, the water was more mixed indicating the presence of a gradual thermocline.
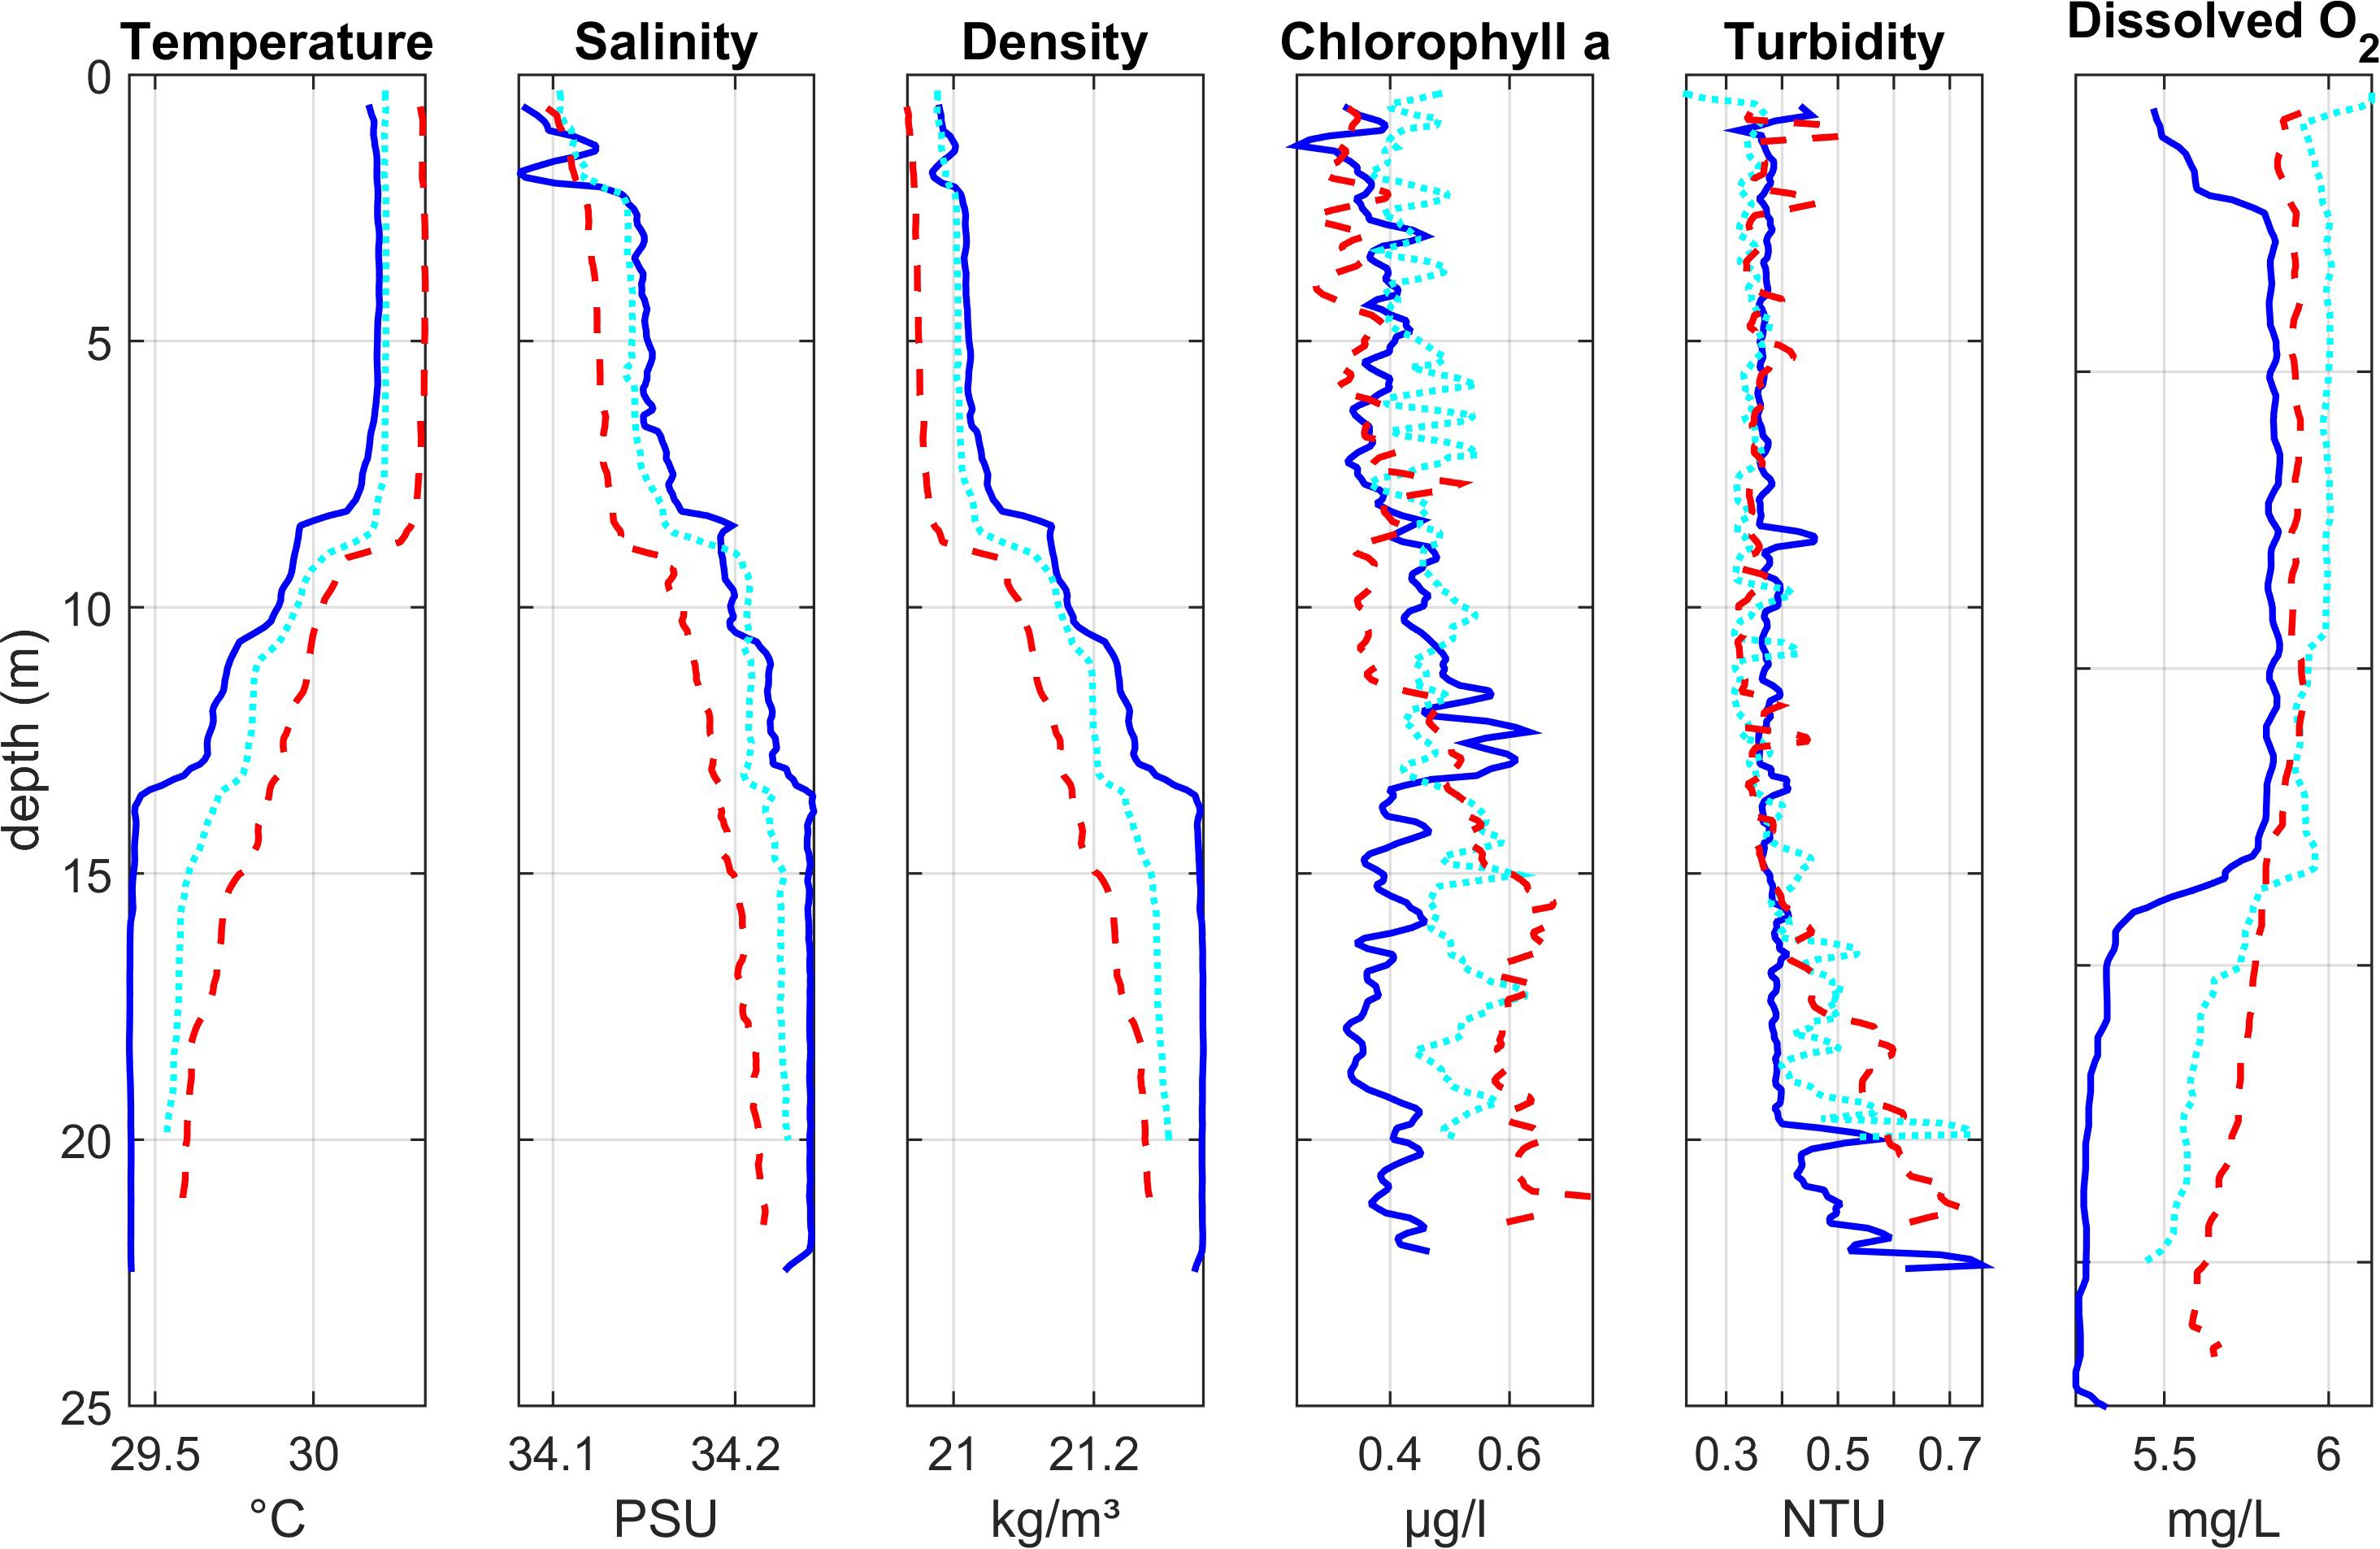
Figure 3. Depth profiles of water column properties at three lagoon stations close to the lagoon mouth (Region 3): Lagoon_07 (dark blue solid line) closest to the open ocean, Lagoon_06 (light blue dotted line), and Lagoon_02 (red dashed line) furthest into the lagoon. See Figure 1 for station locations.
Chlorophyll values were generally low, with higher concentrations (up to 0.75 μg l–1) at depth. At Lagoon_07 (nearest the lagoon entrance), the chlorophyll peak was at the base of the thermocline. At Lagoon_02 (furthest into the lagoon), chlorophyll levels were highest in deeper water below the thermocline. At Lagoon_06 there was no clear peak. Turbidity was generally low in the upper and mixed layers of the water column (< 0.5 NTU), with highest values near the bed (up to 0.76 NTU) where the sensor deployment may have disturbed soft bottom sediments.
Oxygen concentrations were low (< 6 mg l–1) throughout the water column. Lowest values (5.3–5.7 mg l–1) were observed at the bottom of the water column, below the thermocline, particularly at Lagoon_07.
Lagoon stations 11 and 12 (Region 3)
Depth profiles at two stations (Lagoon_11 and Lagoon_12, Figure 4) at the eastern edge of the lagoon in Region 3 also showed a stratified water column, with a warm layer (∼31°C) in the upper 5 m of the water column and a gradual thermocline extending to around 8 m. Colder, more saline water was present below the thermocline at Lagoon_11, but not at Lagoon_12 which was closer to shore and in shallower water. Compared with the three stations near the entrance to the lagoon, salinity gradients were steeper with slightly lower surface salinity (ca 34) and higher surface temperature.
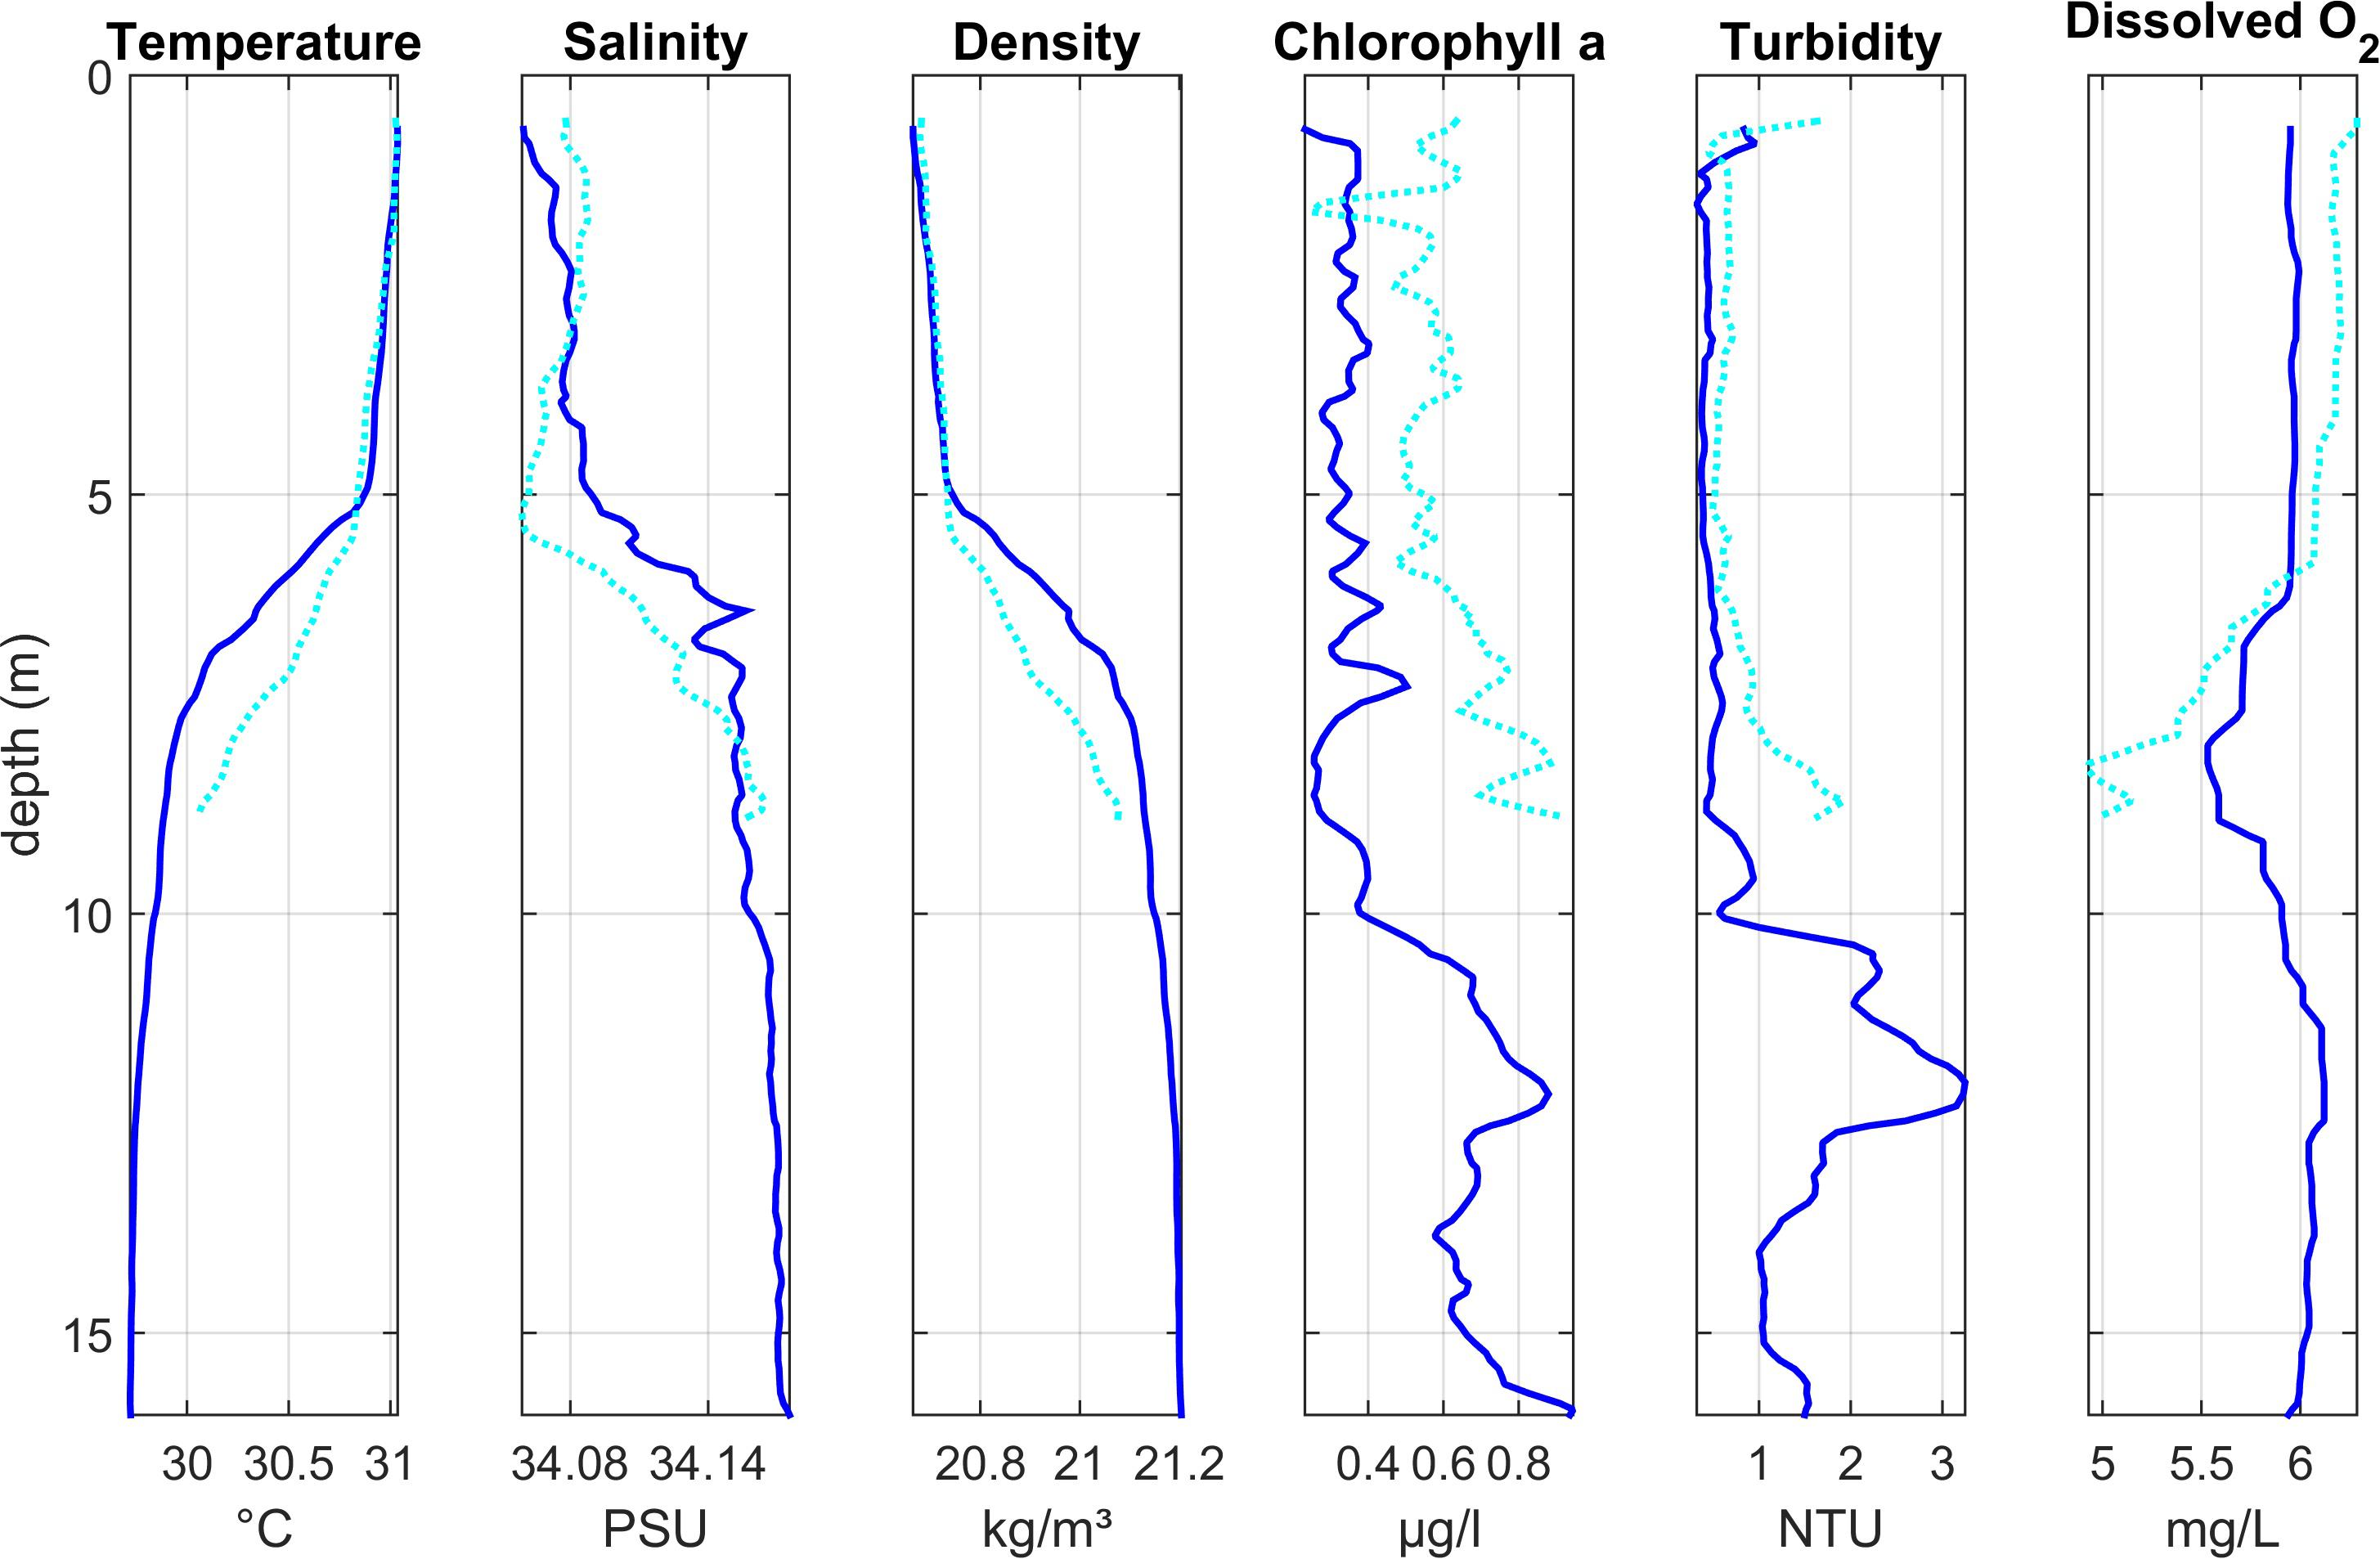
Figure 4. Depth profiles of water column properties at two stations at the eastern edge of the lagoon (Region 3): Lagoon_11 (dark blue solid line) and Lagoon_12 (light blue dotted line). See Figure 1 for station locations.
Chlorophyll concentrations were highest toward the bottom of the water column, with the highest value observed during this study (∼ 0.9 μg l–1) at Lagoon_11.
At Lagoon_11, oxygen concentrations were approximately 6 mg l–1 through most of the water column, with a band of oxygen deficient water (min: 5.5 mg l–1) just below the thermocline. At Lagoon_12, oxygen decreased sharply at the thermocline to < 5 mg l–1 at the maximum depth sampled (8.8 m).
Lagoon stations 3 and 4 (Region 2)
Vertical profiles in the shallower Region 2 (Lagoon_03 and Lagoon _04, Figure 5) also showed stratification, with warmer (∼30.8°C), lower salinity (∼33.8) water in the upper 3–4 m and cooler, more saline water below the thermocline at 4–5 m. Surface salinity was lower here than at most stations. Both stations showed low turbidity in the upper layer and an increase in deeper waters, though the increase was much more significant at station Lagoon_03. No chlorophyll or oxygen measurements were made here.
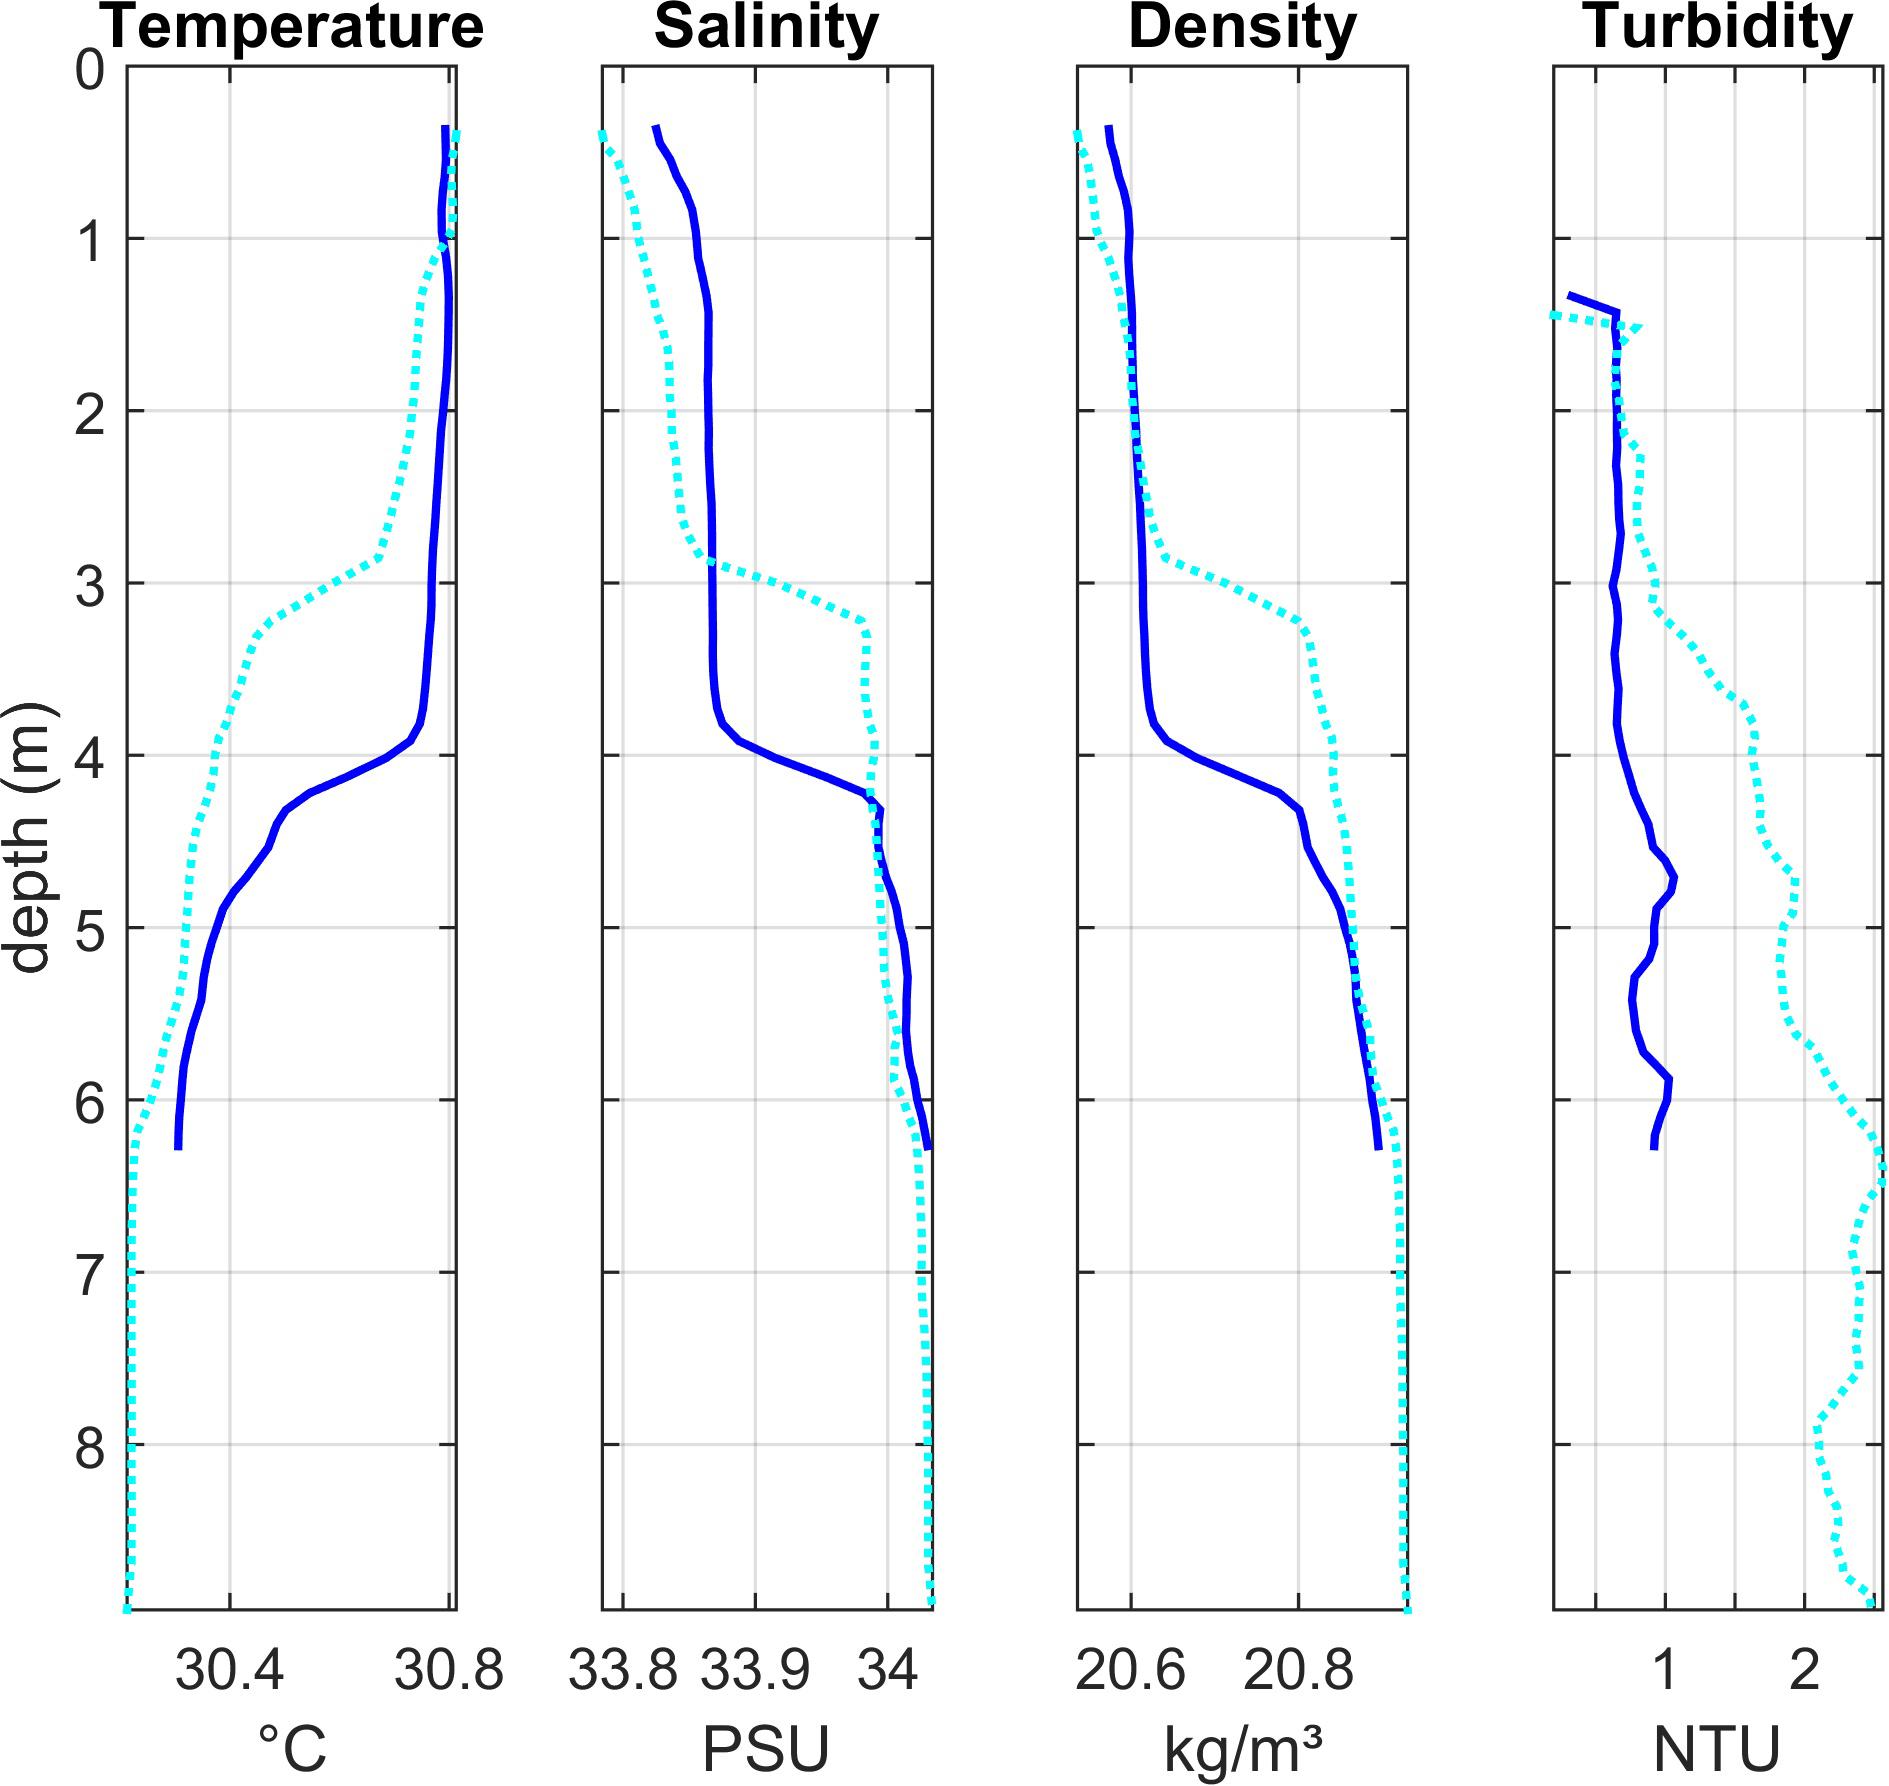
Figure 5. Depth profiles of water column properties at two stations in the shallower central area of the lagoon (Region 2): Lagoon_04 (dark blue solid line) and Lagoon_03 (light blue dotted line). See Figure 1 for station locations.
Nutrients
Stations Ocean_02 and Ocean_03 are likely to be the most representative of near-pristine nutrient levels in offshore waters at Diego Garcia. Concentrations of nitrate (TOxN) and phosphate were below the limit of detection (LOD) of the analytical instrument (Table 3). Average surface concentrations here were higher for DIN (1.39 μM) and silicate (1.73 μM, Table 3). Ammonium was the only nutrient contributing to DIN. The ratio of DIN to silicate (0.8:1, Table 3) was close to the Redfield ratio (∼1:1). At Ocean_01, at the lagoon entrance, nutrient levels were higher than at the near-pristine stations. The DIN:P and DIN:Si ratios (34.4:1 and 2:1, respectively, Table 3) were approximately two times higher than the Redfield ratios (16:1 and ∼1:1).
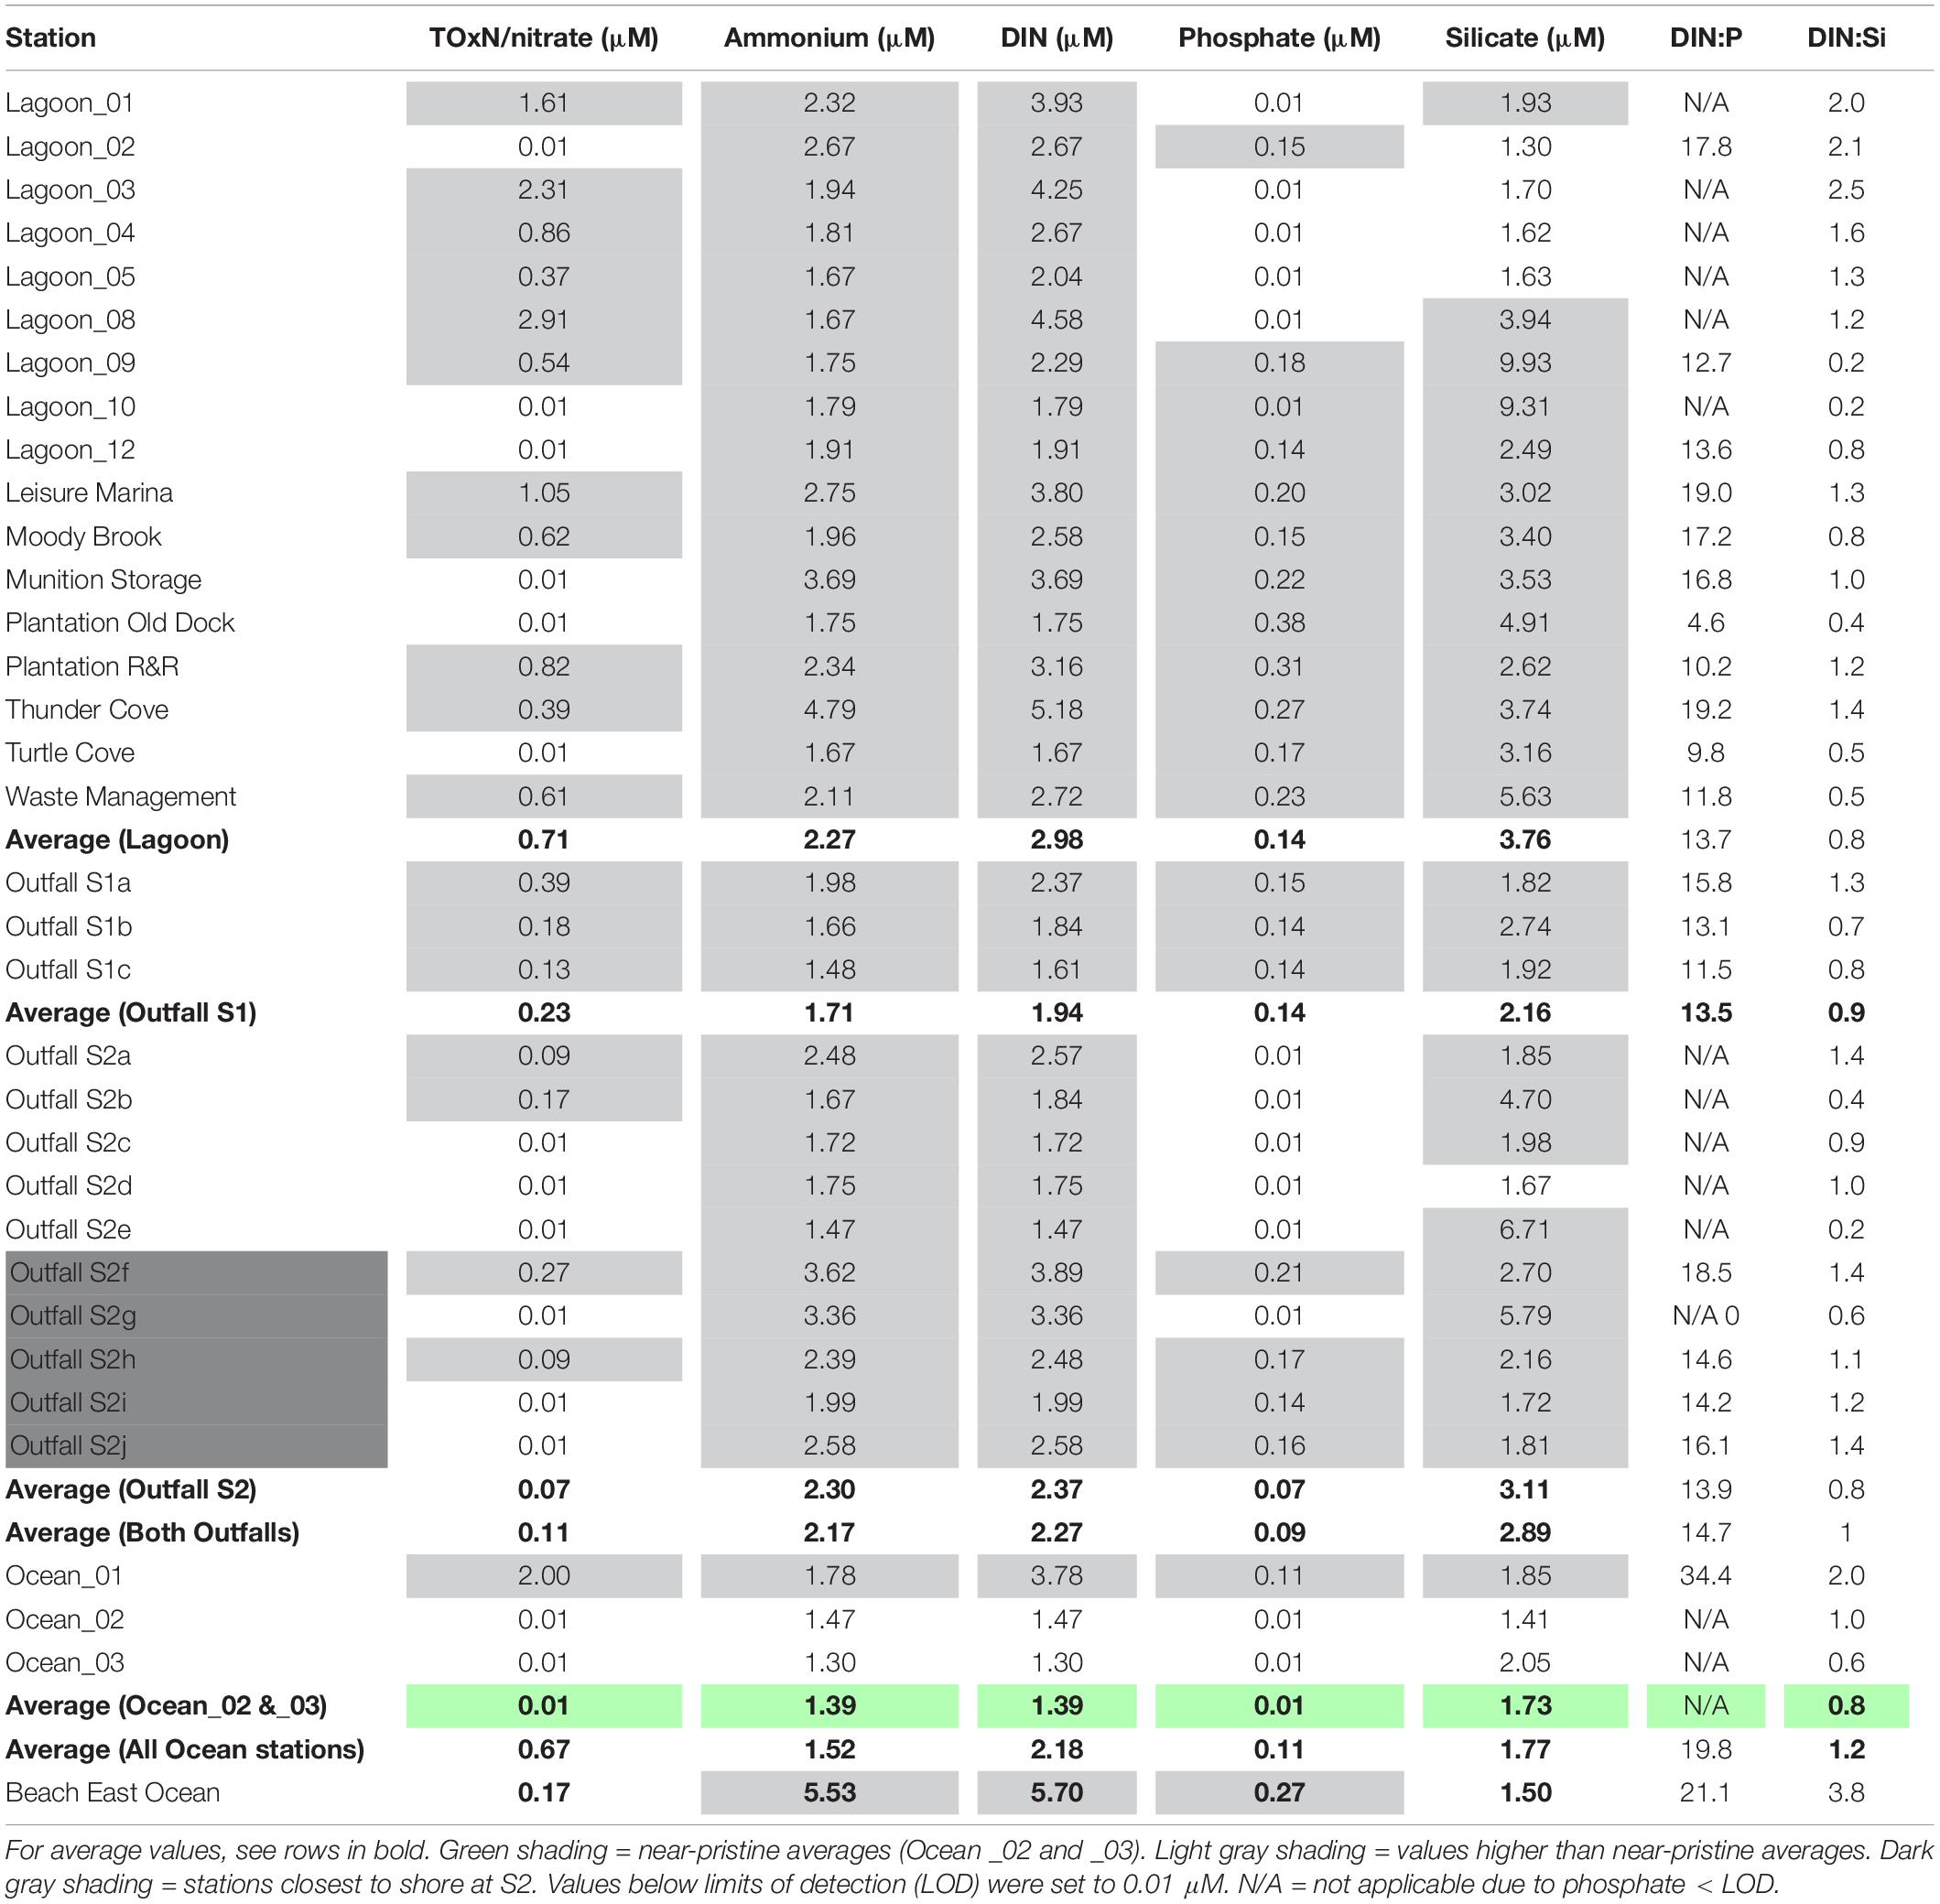
Table 3. Concentrations of dissolved inorganic nutrients (μM) at all stations sampled.
At all stations, concentrations of dissolved inorganic nitrogen (DIN, up to 5.7 μM at Beach East Ocean, Table 3) were higher than the near-pristine averages (1.39 μM). Ammonium concentrations (1.47 to 5.53 μM, Table 3) were high and appeared to account for most of the DIN; highest values were estimated at Thunder Cove (4.79 μM) and Beach East Ocean (5.53 μM). At many stations, particularly those in the lagoon, concentrations of nitrate/TOxN (up to 2.91 μM, Lagoon_08, Table 3) were higher than at the near-pristine stations (< LOD, Table 3).
At most stations inside the lagoon, concentrations of phosphate (up to 0.38 μM, Plantation Old Dock, Table 3) were higher than the near-pristine averages (< LOD). At almost all stations sampled, silicate concentrations (up to 9.93 μM, Lagoon_09, Table 3) were higher than near-pristine averages (1.73 μM). Variable DIN:P ratios (4.6–21.1, Table 3) indicate imbalances in nutrient levels, for example due to low phosphate concentrations and relatively high nitrate/TOxN concentrations (e.g., Lagoon_03 and Lagoon_08) and/or ammonium concentrations (e.g., Thunder Cove). DIN:Si ratios were also variable, ranging from 0.2 to 3.8 (Table 3).
Fecal Indicator Bacteria
Very few samples showed the presence of E. coli colonies (Table 2). A maximum of 3 colony forming units (CFU) per 100 ml was recorded at two stations. All results were well below 250 CFU/100 ml (Table 1), indicating ‘excellent’ water quality.
Organic Chemical Contaminants
Contaminants were detected at all sampling stations (Figure 6). Up to five contaminants were detected at five stations (Lagoon_09, Lagoon_10, Leisure Marina, Munition Storage and Outfall S2g). Overall, 41 chemical contaminants were detected (Figure 7; Supplementary Table 1).
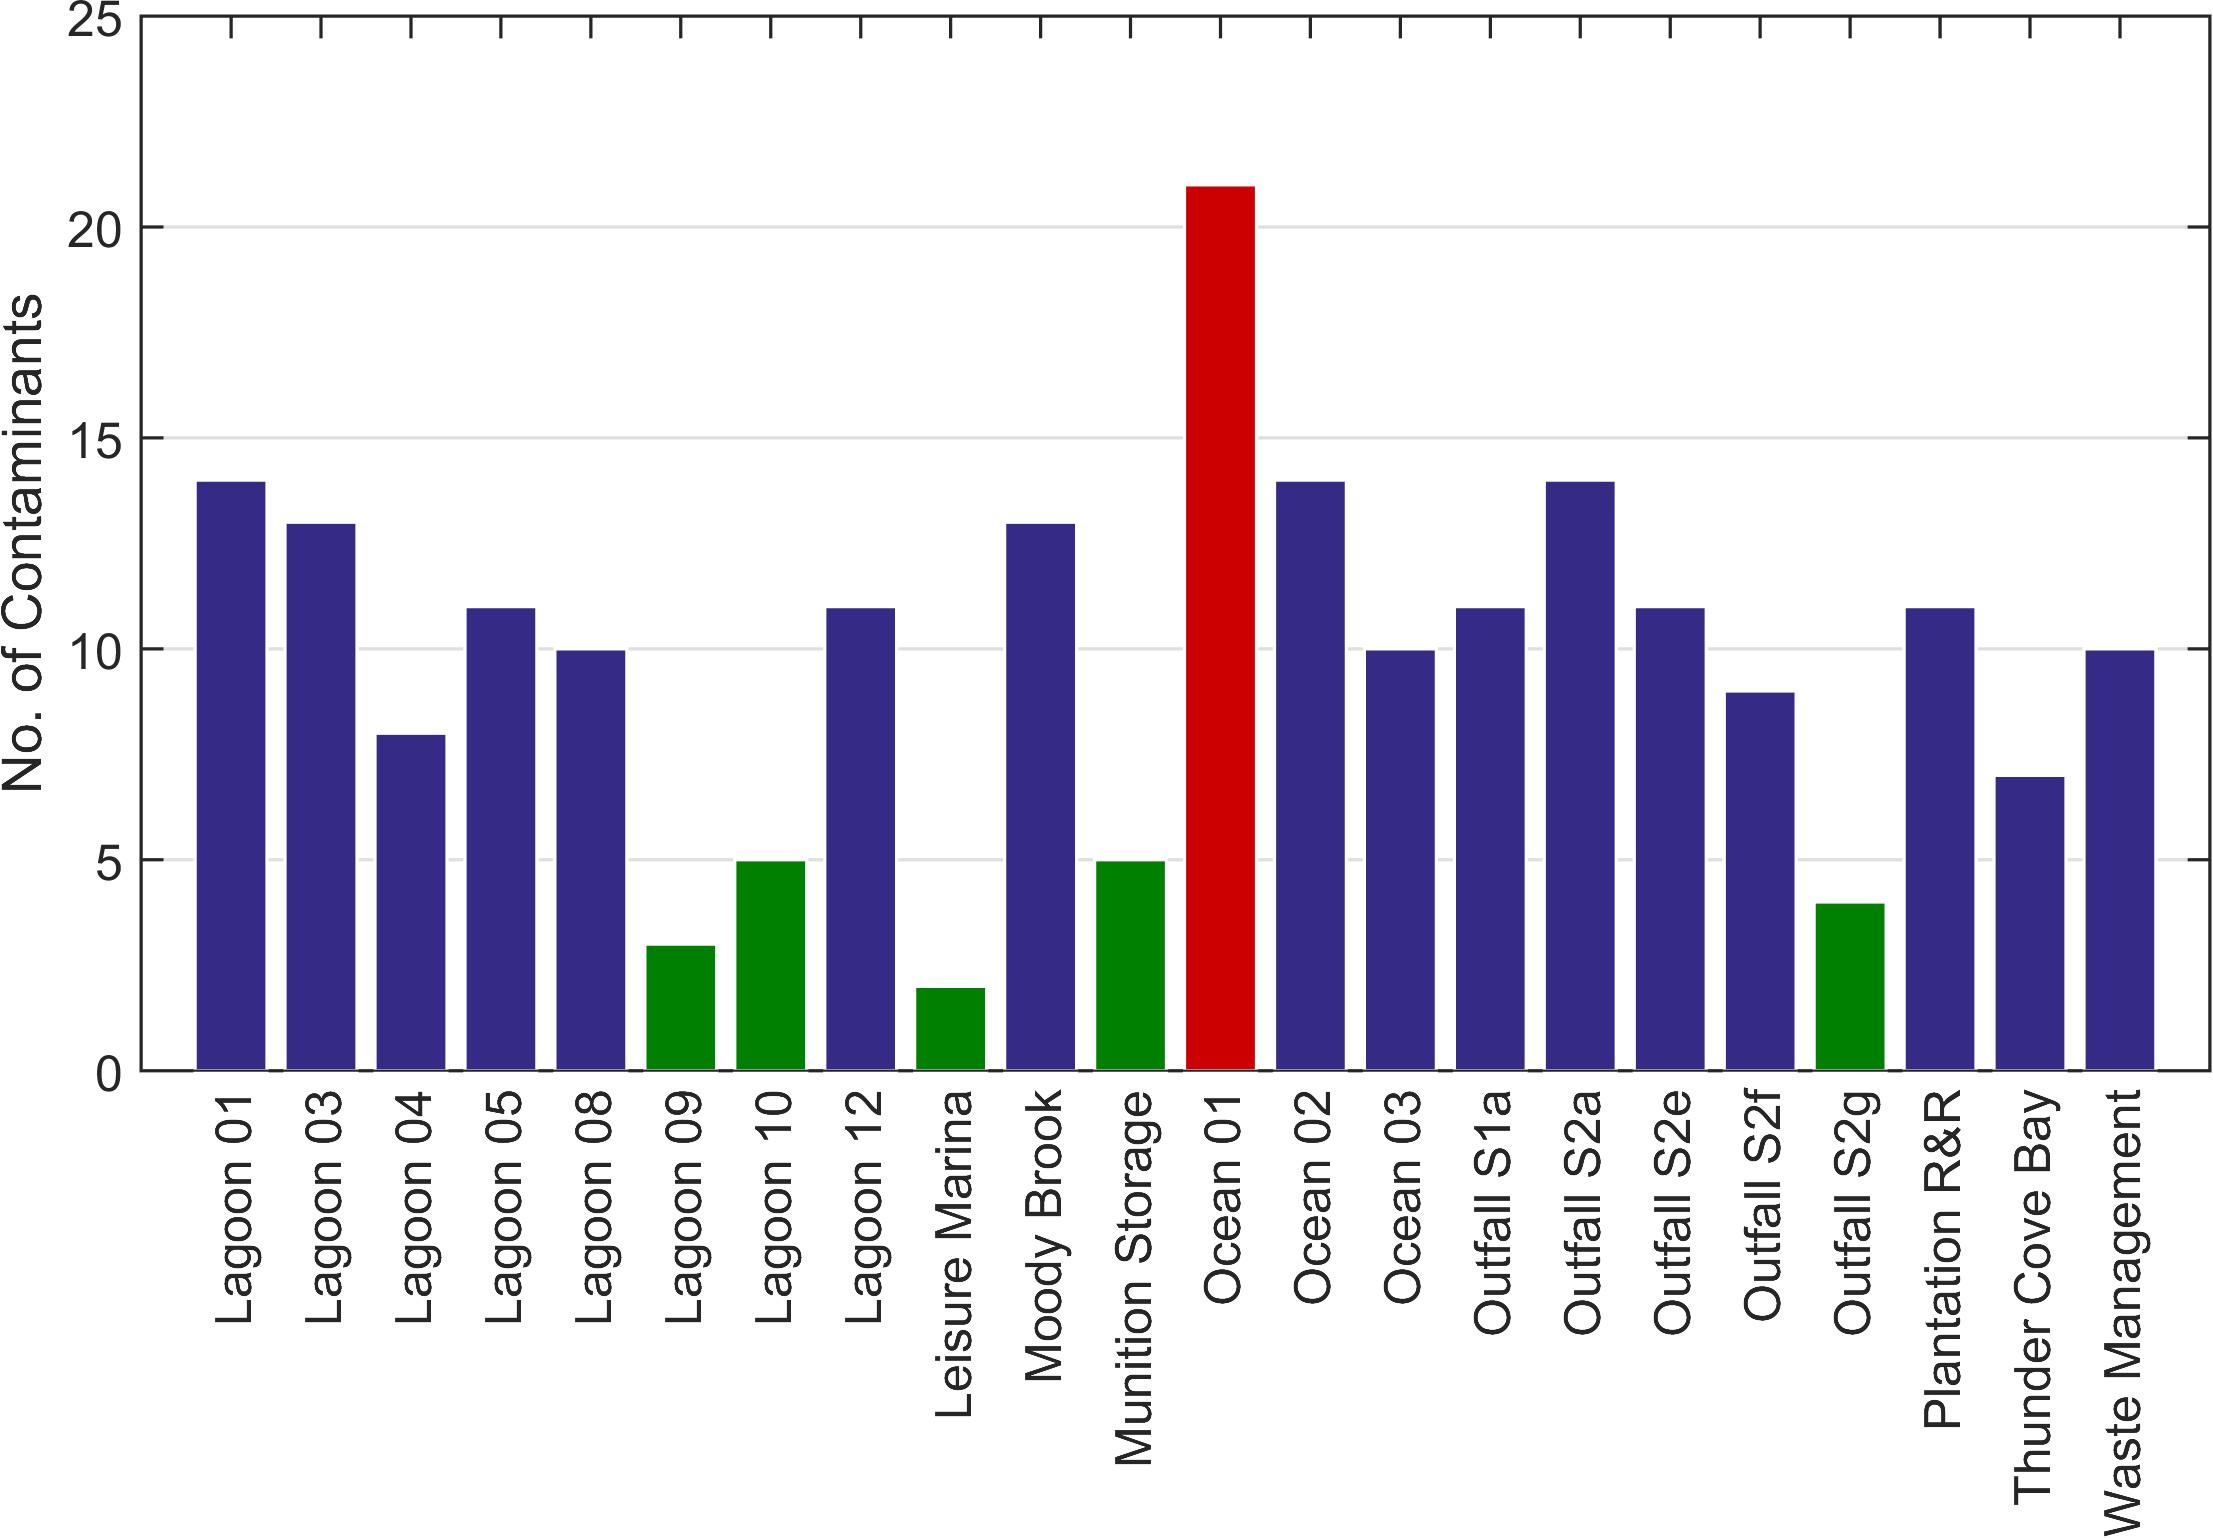
Figure 6. Total number of chemicals of interest identified at each station using the GCMS screen. Green bars = stations with ≤ 5 contaminants. Red bar = > 20 contaminants.
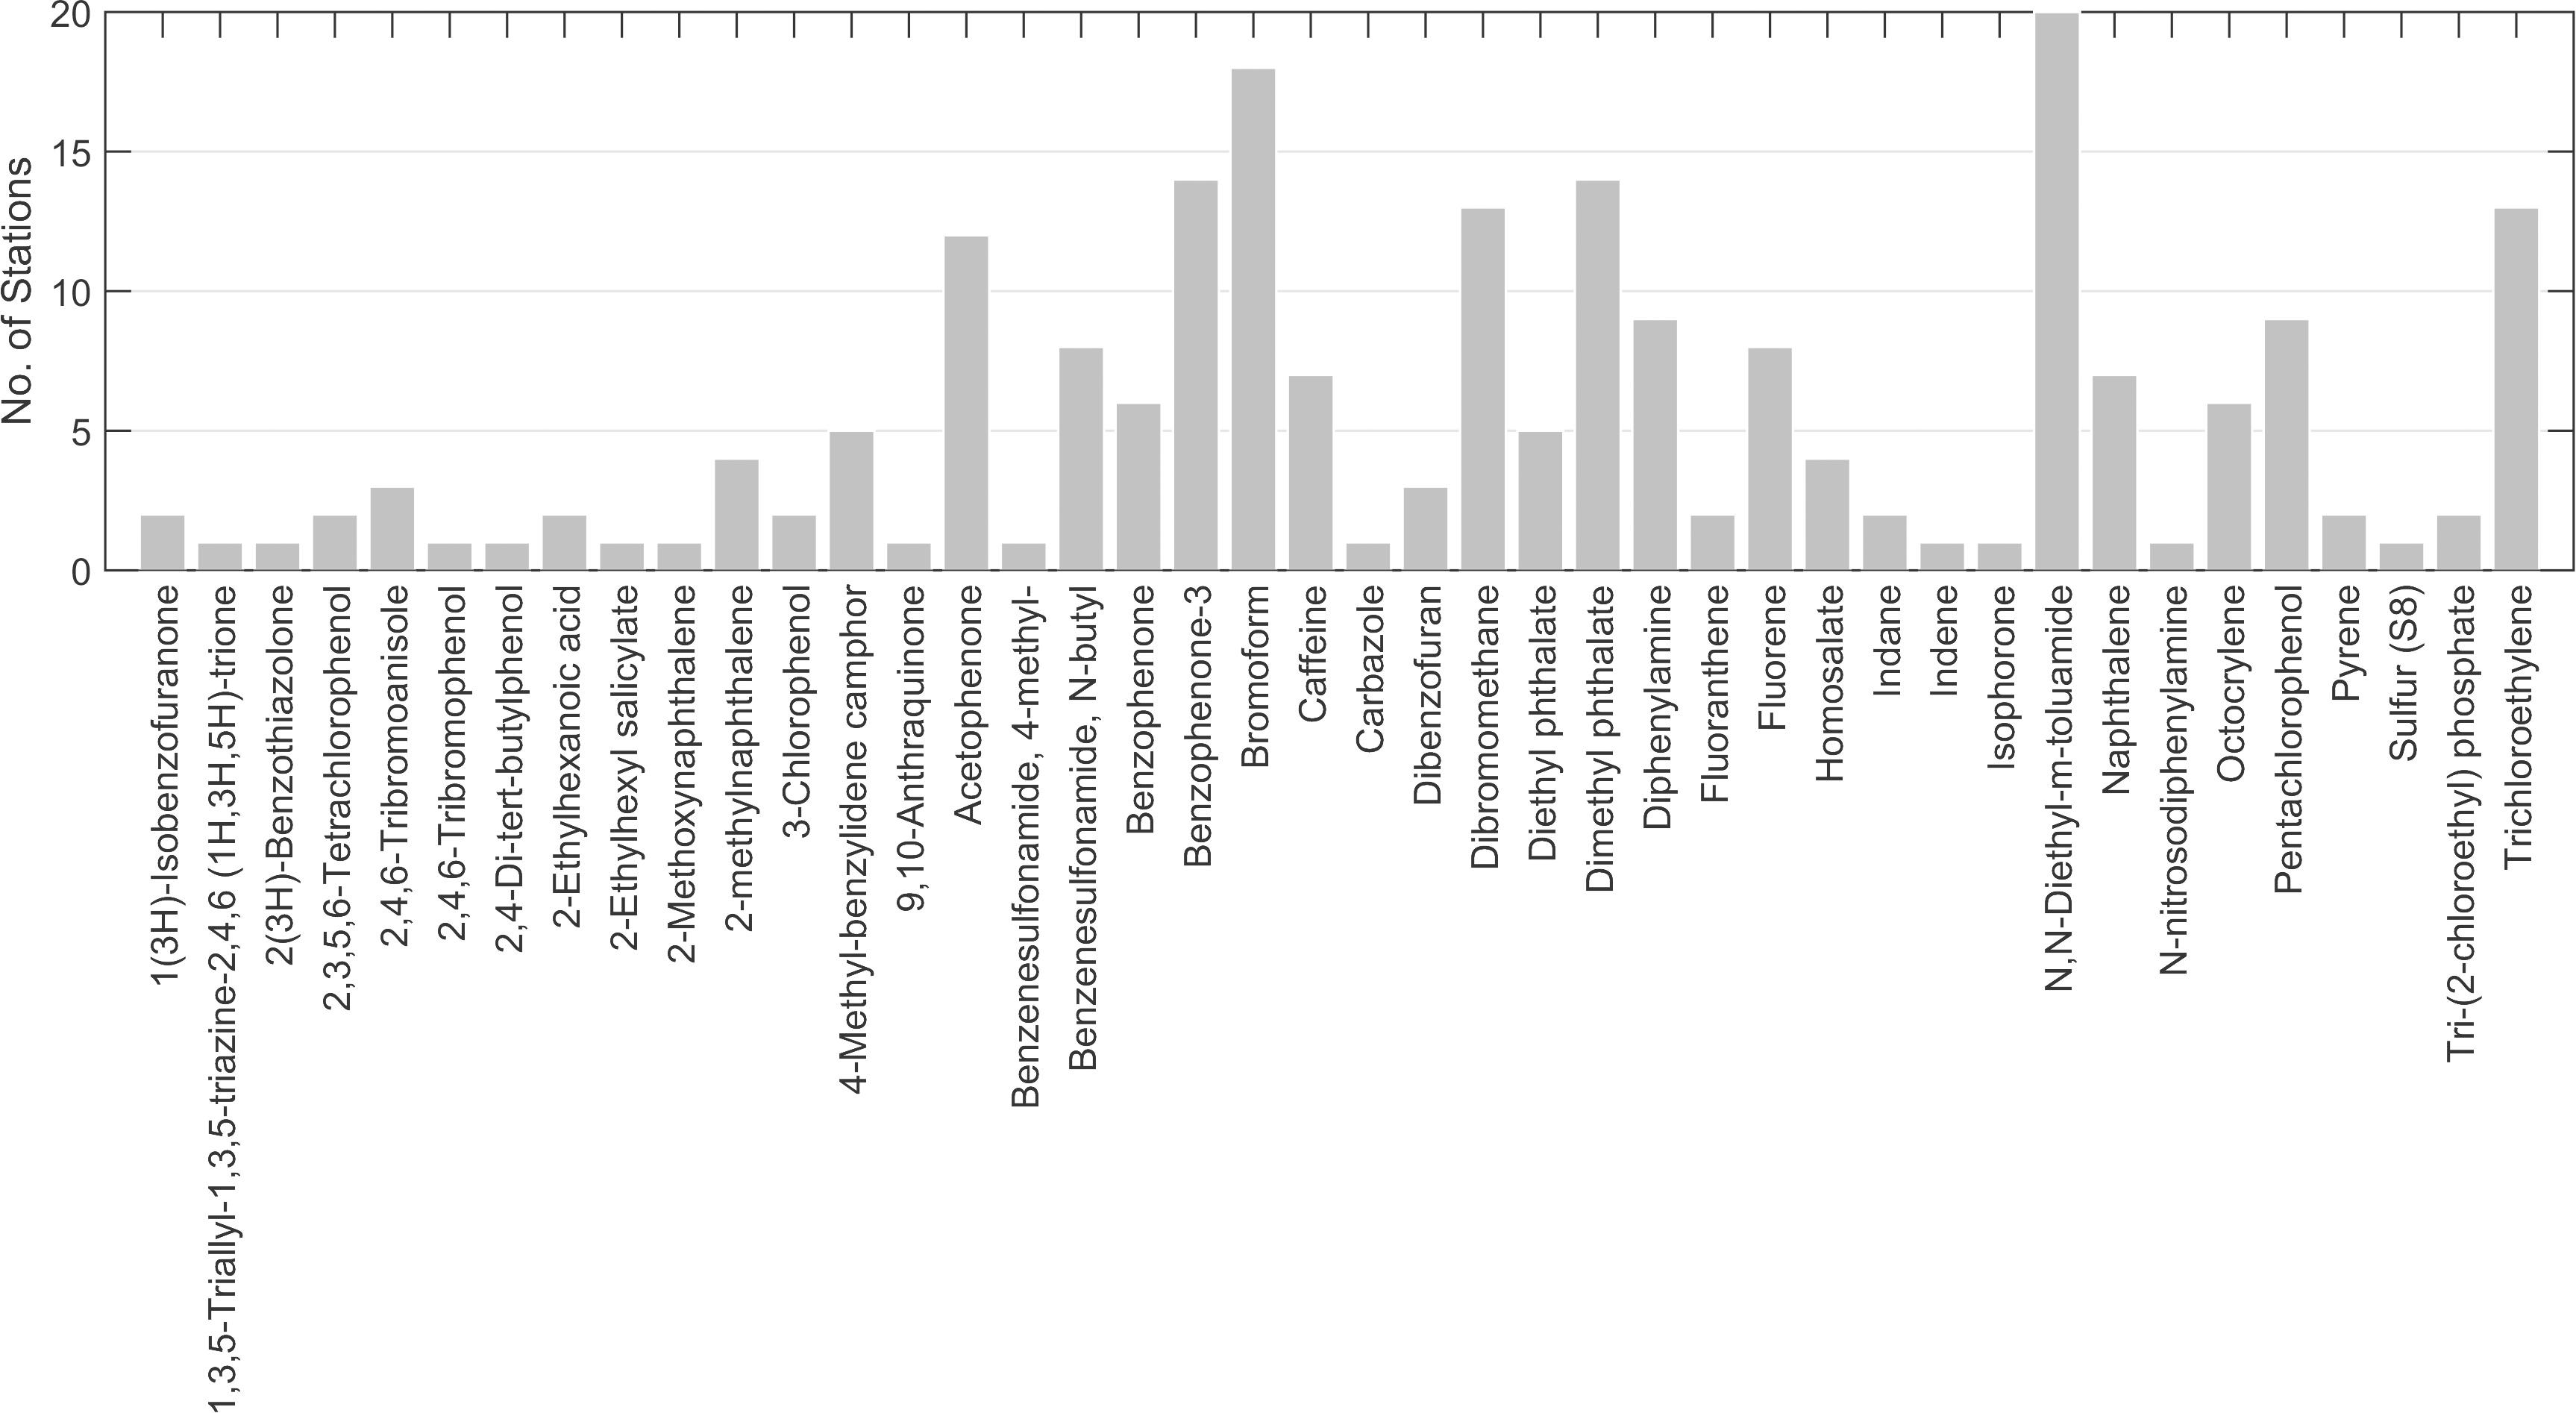
Figure 7. Contaminants detected and the total number of stations where they were found.
The most frequently occurring contaminant was the insecticide, N,N-Diethyl-meta-toluamide (DEET), found at 12 stations in the lagoon, five stations at the sewage outfalls, and at all Ocean stations (Figure 7). The highest concentration (∼7.7 μg l–1, Supplementary Table 1) was detected at Thunder Cove. This was the highest concentration recorded for any of the chemicals assessed.
Bromoform (at 18 stations), dibromomethane (at 13 stations) and trichloroethylene (at 13 stations) were the other frequently occurring chemicals (Figure 7). These solvents usually occurred at low concentrations, e.g., at Leisure Marina (∼0.21 μg l–1 bromoform and 0.016 μg l–1 dibromomethane, Supplementary Table 1) and at Munition Storage (∼0.09 μg l–1 bromoform and ∼0.021 μg l–1 dibromethane).
The plasticizer, diethyl phthalate, was detected at five stations: Ocean _02 and _03, and at Outfalls 1a, 2a and 2e. All had estimated concentrations of ∼1 μg l–1 (Supplementary Table 1).
The greatest number of contaminants (21, Figure 6) was detected at Ocean_01 at the entrance to the lagoon. These included fluoranthene and pyrene at low concentrations (∼ 0.001 and 0.002 μg l–1, respectively; Supplementary Table 1). Tris-(2-chloroethyl) phosphate was found at a concentration of ∼0.062 μg l–1. Benzenesulfonamide, N-butyl (also known as N-butyl benzenesulfonamide, NBBS), a neurotoxic plasticizer, was found at relatively high concentrations (∼1.3 μg l–1). At the near-pristine stations, 14 contaminants were detected at Ocean_02, and 10 at Ocean_03 (Figure 6). Fourteen contaminants were detected at Lagoon_01 (Figure 6) where highest indicative concentrations were for benzenesulfonamide, N-butyl (∼0.291 μg l–1) and acetophenone (∼0.153 μg l–1).
At the Waste Management site, 10 contaminants were detected (Figure 6). Contaminants with the highest concentrations were personal care products homosalate (∼0.463 μg l–1), bromoform (∼0.2 μg l–1) and octocrylene (0.158 μg l–1, Supplementary Table 1).
At the sewage outfalls, the main chemical of concern was the flame retardant and plasticizer, Tris-(2-chloroethyl) phosphate, found at a concentration of ∼0.021 μg l–1 at Outfall 2a (Supplementary Table 1).
Heavy Metals
Concentrations of heavy metals across the sampling sites were generally low with most samplers returning concentrations below environmental quality standards (EQS, Table 4). However, several sites showed elevated concentrations (Table 4), particularly for nickel and copper, which were more than double the maximum allowable concentration EQS (MAC-EQS) at some sites. The results for Marina Sample B (3 of 4) (see highlight in Table 4) are clear outliers, possibly due to a sampler deployment issue or contamination and results are not evaluated here.
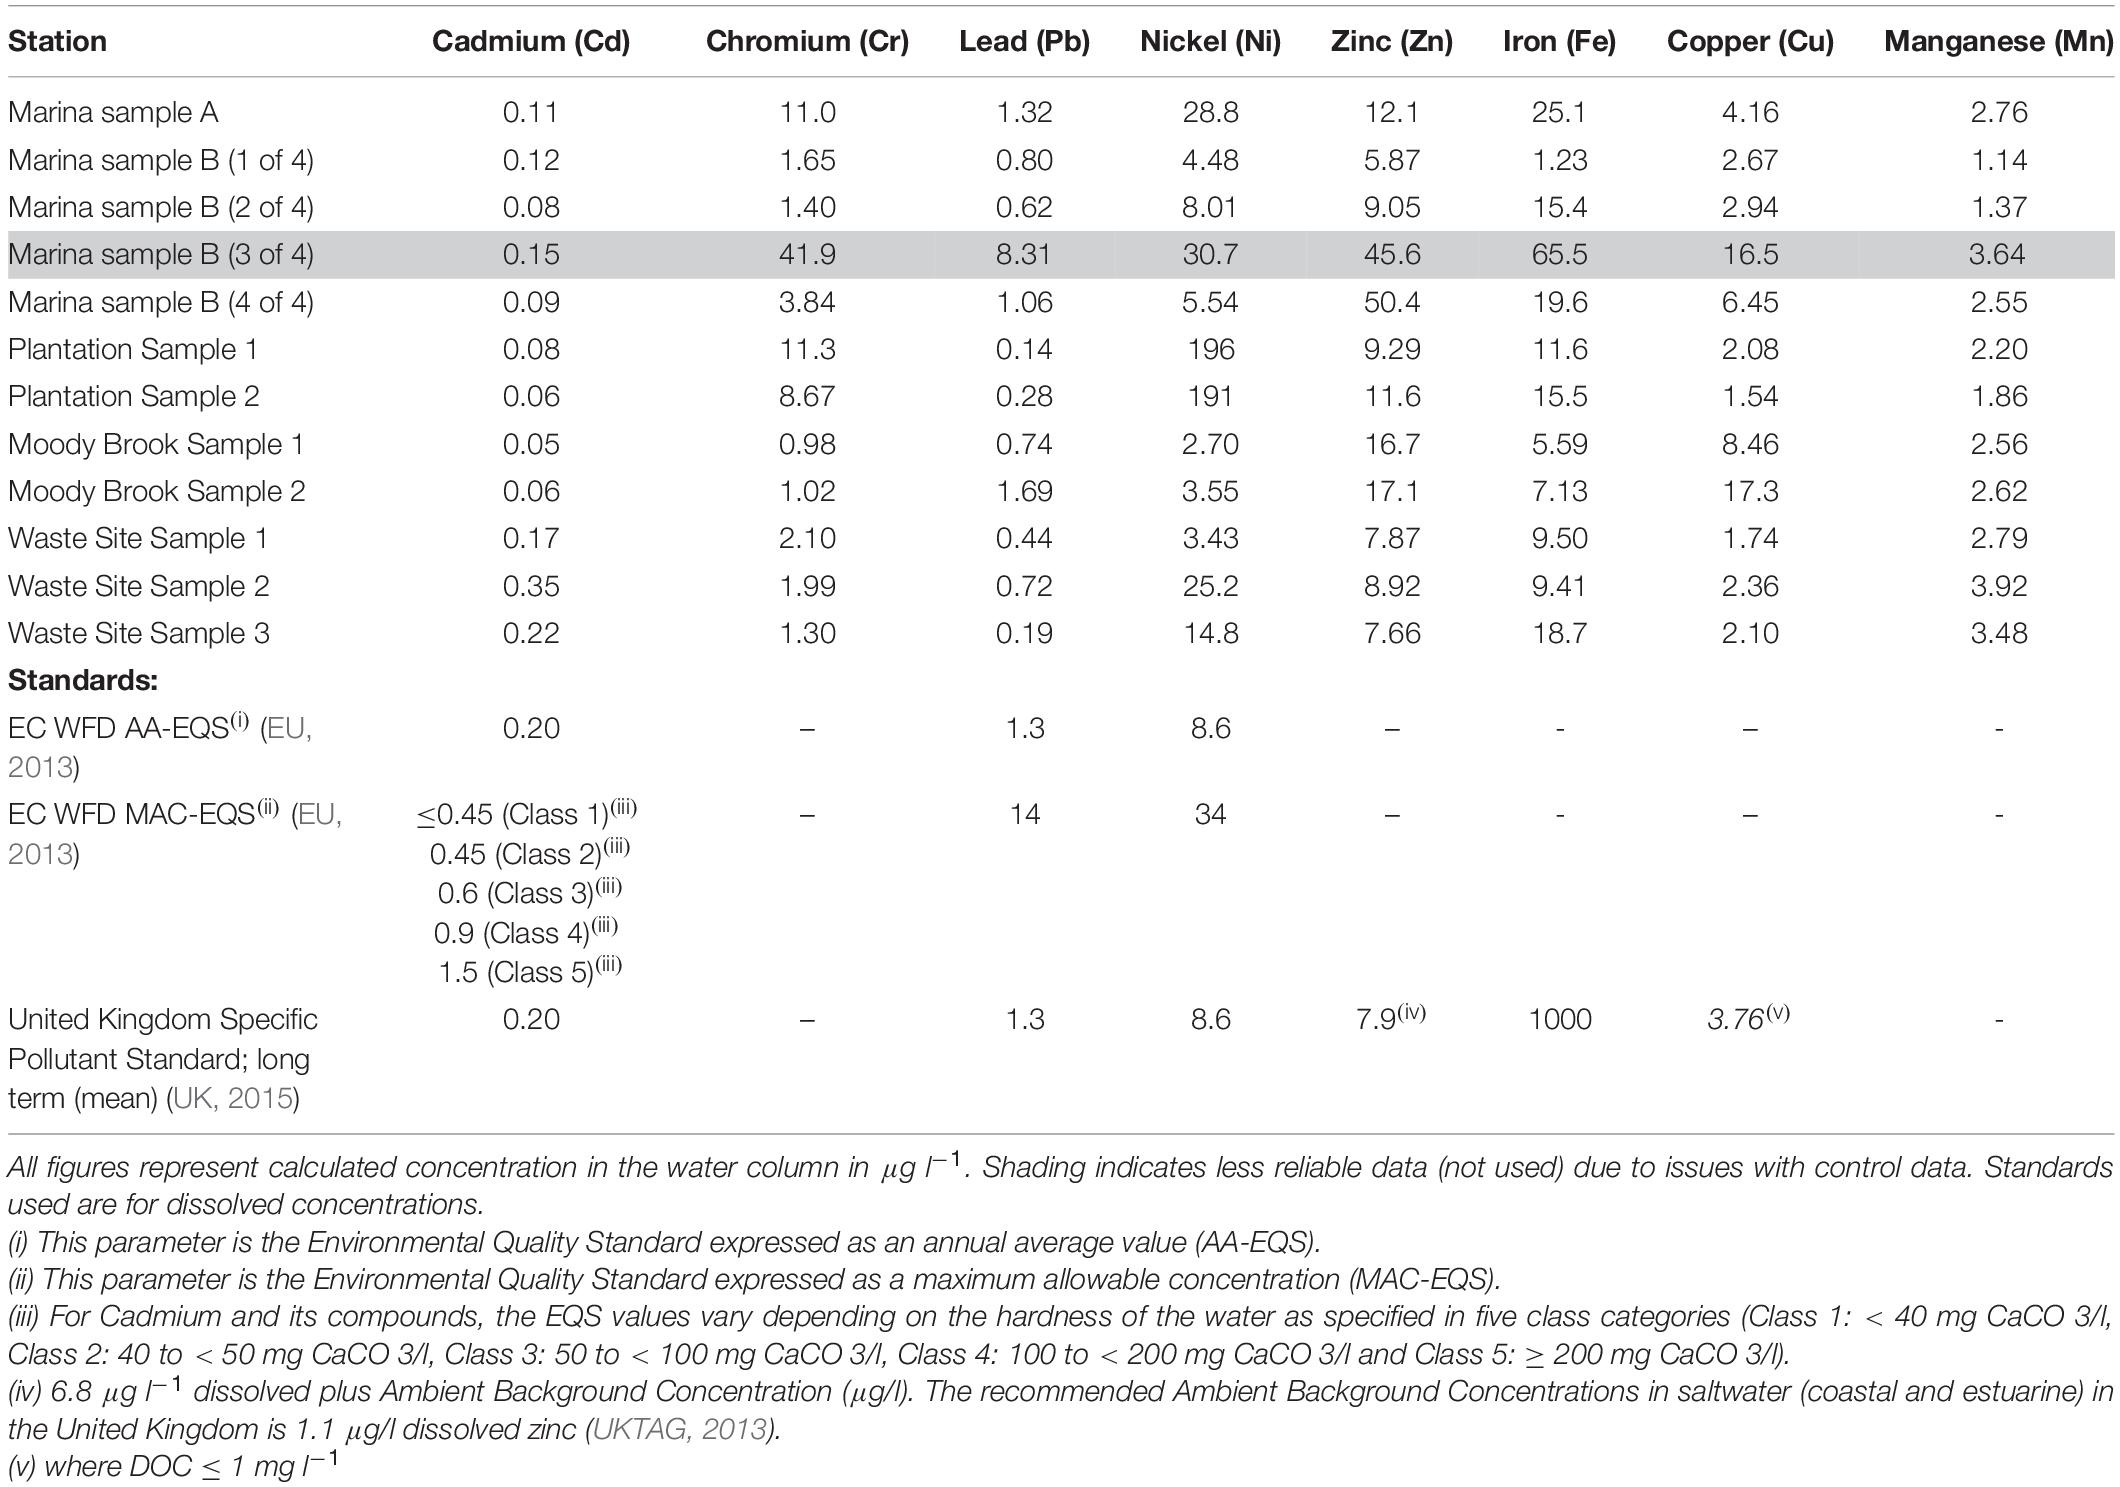
Table 4. Results from metal analysis of samples collected using DGT passive samplers.
Particularly high values of nickel were recorded from the two samplers placed at the Plantation sampling sites. Concentrations of 196 and 191 μg l–1 were recorded by the two samplers, compared to concentrations of between 2.70 and 28.8 μg l–1 for the other samplers deployed in the lagoon (Table 4). The high concentrations at the Plantation site far exceed the Water Framework Directive (WFD) MAC-EQS for Nickel (34 μg l–1, Table 4).
Concentrations of copper ranged from 1.54 to 17.3 μg l–1 across the lagoon with the highest concentration occurring at Moody Brook. Four of the 11 samplers returned concentrations above the annual average EQS (AA-EQS) of 3.76 μg l–1 (Table 4; UK, 2015), two from Leisure Marina and two from Moody Brook. The annual mean concentration of dissolved organic carbon (DOC) used to determine the EQS was not available but was assumed to be < 1 mg l–1.
Zinc concentrations ranged from 5.87 μg l–1 to 50.4 μg l–1 at Leisure Marina. Eight samplers returned concentrations above the AA-EQS of 7.9 μg l–1. It is worth noting that the EQS for zinc was specifically derived for United Kingdom coastal and estuarine waters (see Table 4 (iv)) and different Ambient Background Concentrations are likely to prevail in Diego Garcia.
Cadmium concentrations varied from 0.05 to 0.35 μg l–1. The lowest concentrations were found at Moody Brook and at the Plantation sampling sites. No concentration was found to be above the lowest MAC-EQS of 0.45 μg l–1, but two samples from the Waste Management Site were above the AA-EQS of 0.20 μg l–1 (EU, 2013).
Concentrations of iron were low across the lagoon and well below the EQS of 1000 μg l–1. Small variations in the concentrations of lead across the site were observed with most estimates around or below the current WFD EQS (1.3 μg l–1, Table 4). No EQS have been derived for total chromium and manganese in the EU or United Kingdom. Chromium concentrations varied from 0.98 to 11.3 μg l–1 with the highest concentrations occurring at the Plantation site and Marina A. Manganese concentrations were consistently < 4 μg l–1 and show little variation across all sites.
Whole Sample Toxicity
None of the samples showed evidence of a reduction in luminosity that would indicate an overall toxic impact from the chemicals in the sample. Most samples showed relatively similar normal growth for seawater samples, with one or two high and low outliers that fell within the normal variability of the test. Normal growth in seawater tends to be 120–130% of the growth in the supplied media.
Discussion
Observations of key oceanographic parameters during this study are consistent with descriptions of the broadscale oceanography and trends in the Chagos Archipelago.
Temperature values on the ocean side of the atoll (< 30°C) were comparable with values from previous studies (see Sheppard and Sheppard, 2019). Although pH was measured at very few (11) locations, the average value (pH 8.3, from Table 2) across all stations was typical for sea water (Sheppard, pers. comm). It was, however, higher than an average value (pH 8.095) we calculated using data (1956–2005) from a location close to Diego Garcia (NOAA Climate Change Web Portal, 2021). Due to the scarcity of field measurements in the region (Lam et al., 2019), an observing network is currently being established in the western Indian Ocean (GOA-ON, 2019; Mwachireya et al., 2018) for studies on ocean acidification. Long-term data and trends in both temperature and pH will be needed to determine future impacts on coral health (Orr et al., 2005; Pandolfi et al., 2011) due to the combined impacts of acidification, which lowers aragonite levels required by corals to construct their skeletons, and ocean warming (Ateweberhan et al., 2013).
Temperature and salinity estimates inside the lagoon were similar to those observed by Sheehan et al., 2019 (< 30.4–31.05, salinity 33.1–34.9) although all our profiles indicated stratification whereas only their density profiles did. Salinity values in this study were lower (33.8–34.1) than those reported by Wang et al. (i.e., 36–38). Reasons for these differences are unclear but are likely to be affected by relative inputs of freshwater, as salinity and density values in Region 2 (where freshwater inputs are likely to be highest) were lower than in Region 3. Rainfall is highly variable and annual averages have shown a significant increase in rainfall since the early 1950s (Sheppard and Sheppard, 2019). Wang et al. (2014) suggested that the inner lagoon waters tend to warm by about 2 °C above the adjacent ocean waters due to the long residence time of the water in the lagoon (due to long flushing times) and the isolation of these waters from cooler ocean waters at depth.
Chlorophyll concentrations in surface waters during this study were low and consistent with other studies (e.g., Resplandy et al., 2009; George et al., 2018). A deep chlorophyll maximum has been observed frequently in the Chagos Archipelago (Fasolo, 2013; George et al., 2013; Dilmahamod et al., 2016). Sheehan et al. (2019) observed a deep chlorophyll maximum in the lagoon itself, in the larger lagoon basin (Region 3), during field work in May 2019. These authors found homogeneous vertical distributions of temperature and salinity and density stratification in the deeper waters. They proposed that these observations might be attributable to ocean flushing with cold, saline, dense water (Sheehan et al., 2019; see also Green et al., 2019). This could also contribute toward natural sources of nutrient input into the lagoon.
Chlorophyll concentrations are generally used as a proxy for biomass of phytoplankton (algal) communities. Where conditions are suitable (e.g., in terms of light levels, water residence times, nutrient concentrations; Painting et al., 2007; Sheehan et al., 2019), they grow rapidly and sustain marine food webs (e.g., Sheehan et al., 2019). However, excess growth may settle out to near the seabed, potentially decomposing there and resulting in oxygen depletion (Painting et al., 2007; Tett et al., 2007). The highest value recorded (0.9 μg l–1 at depth of 8 m) was seen at station Lagoon_12 to the east of the lagoon, possibly due to growth or settlement of primary producers. Good light levels in the lagoon would make it possible for growth at depth, particularly if nutrients are available. Higher turbidity levels at depth may reflect higher concentrations of phytoplankton and other particulate material. The chlorophyll and turbidity levels may also represent re-suspended material, particularly if the sediment here is fine, and vertical fluxes are high due to wind effects or currents. The shallow nature of this station compared to the other stations along the shore means that the mixed layer is close to the bed allowing for easier mixing of chlorophyll from near the bed (perhaps benthic algae) into surface waters compared with deeper stations. Google Earth images (Google Earth, 2020) indicated vegetation underlying station Lagoon_12 and surrounding area. Similarities with verified images from Kiribati (Graves et al., 2021) suggest this may have been seagrass, an important food source for hawksbill and green turtles in the region (Esteban et al., 2018). Although seagrass was found in the lagoon in early studies (Drew, 1980), more recent studies show seagrass to be largely absent, especially near Turtle Cove (Esteban and Mortimer, 2018; Esteban et al., 2018).
Sheehan et al. (2019) observed oxygen deficiency in water below the pycnocline or near the sea bed, suggesting that low oxygen levels are a frequent occurrence and potentially linked with ocean flushing. Low oxygen levels are a concern due to increasing occurrence of hypoxic waters in the region (SenGupta, 1976; Naqvi, 2019) and increasing global frequency of hypoxic hotspots (Diaz and Rosenberg, 2008; Breitburg et al., 2018). During this study, lowest values were recorded in near-surface waters at Lagoon_09 (4.3 mg l–1) and at depth at Lagoon_12 (4.9 mg l–1). Percentage saturation was around 70 and 80%, respectively, at these stations. These levels are above the threshold of 4 mg l–1 (and 40–60% saturation) below which there are likely to be biological effects (Best et al., 2007). Nonetheless, values below 6 mg l–1 are considered to indicate oxygen deficiency (Best et al., 2007). Possible causes of the low oxygen levels include ocean flushing, high water temperatures and decomposition of organic material where the input of nutrients is high, e.g., due to sewage discharges, or high egestion and/or excretion rates by large populations of animals in or near the water.
Nutrients
Surface concentrations of nitrates and phosphates at the near-pristine sites were very low (below the limits of detection), as described by previous authors (e.g., McCreary et al., 2009; Harms et al., 2019; Sheehan et al., 2019). Deeper water masses of different origins are likely to provide the main sources of new nutrients which sustain primary production in the upper mixed layer or in the vicinity of the thermocline (e.g., Lévy et al., 2007; Dilmahamod et al., 2016; George et al., 2018). Insufficient data were obtained during this study to investigate sources and cycling of nutrients, which has been reviewed elsewhere (e.g., Rayner and Drew, 1984; Sardessai et al., 2010; Garcia et al., 2018; Green et al., 2019; Harms et al., 2019; Twining et al., 2019). Observations from the non-pristine study sites suggest that nutrient levels were higher than concentrations that might be expected from the broadscale oceanography, particularly in the lagoon. High nutrient ratios for DIN:P suggest imbalances in nutrients available to primary producers, and phosphate limitation. High levels of DIN were largely due to high levels of ammonium observed in this study, which may be due to human inputs (e.g., sewage) or marine and terrestrial biological communities and processes. These may include high egestion and/or excretion rates by large populations of marine or terrestrial animals such as turtles, seabirds and rats, which are found in relatively high abundances (Rayner and Drew, 1984; Hays et al., 2020; Mortimer et al., 2020). A recent study at the Palmyra atoll, south of Hawaii, for example, suggests that sharks may provide an important source of nutrients to coral reefs (Williams et al., 2018). The lagoon may also accumulate nutrients for other reasons, including high levels of nitrogen-fixing bacteria and input from terrestrial plants (Charpy, 1996; Alongi, 2014; Gove et al., 2016). Ammonium results need to be interpreted with some degree of caution as measurements in preserved samples may be unreliable (Riemann and Schierup, 1978). Establishing improved confidence levels in these measurements and the links between nutrient concentrations and human activities (such as sewage or other waste disposal) will be essential for determining if further management measures need to be put in place and will require monitoring of the frequency and volume of direct and indirect discharges into the marine environment. While undesirable effects of elevated nutrient levels such as excessive algal growth, were not measured during this study, they may contribute toward low oxygen levels observed (see above).
Very low counts of E. coli colony forming units at all sites sampled during this study indicate low levels of sewage contamination at Diego Garcia. The outfalls themselves are relatively well extended from the beach and are very well mixed and diluted as they reach the ocean. Assessments of risks to water quality from bacterial pathogens require relatively frequent monitoring. For example, to meet the requirements of the Bathing Waters Directive (EU, 2006a; see Environment Agency (EA), 2000), sampling is recommended to take place monthly during the season when recreational activities are likely to occur. As a minimum, four samples a year over a 4-year period at each location are recommended, or eight samples within one annual cycle. For future monitoring and assessment of fecal indicator bacteria, sampling frequencies and analytical costs need to be considered. The in-island analytical laboratory could be well placed to undertake such monitoring and assessment in the interest of human health, particularly in the main swimming areas.
Chemical Contaminants and Heavy Metals
The situation of Diego Garcia is fairly unique in that although there is a relatively large population on the island there is none of the usual industry which is typically associated with it, such as farming or manufacturing. Previous investigations into contaminants within BIOT have focused on the concentrations in sediments with samples collected across Diego Garcia and some of the outer islands of BIOT (Readman et al., 2013). Although not directly comparable, their findings showed an environment with minimal human disturbance with the majority of contaminants being below limits of detection (see also Everaarts et al., 1999; Readman et al., 1999).
The Naval Base Guam at Apra Harbor, in the western Pacific, has some similarities to Diego Garcia with a high number of service personnel living and working within close vicinity of sensitive coral reef habitats. Although there is a resident population on Guam, Apra Harbor is mostly used by the US Navy and its enclosed waters would make it a useful comparison for the lagoon at Diego Garcia. As for Diego Garcia, only limited studies have been carried out to assess the levels of contaminants within the harbor. Through analysis of sediments, increased levels of copper and zinc were found within the harbor (Denton et al., 2005) whilst other contaminants were found to be very low (Denton et al., 2006). The Apra Harbor data mirror what was identified here in water samples from the main boating areas at Diego Garcia. Although further investigation into the long-term release of contaminants into the lagoon at Diego Garcia is needed, the low levels seen during this investigation and the results from similar US facilities indicates that at present the measures being put in place by the US military and the BIOT Administration are reducing the impact of these large facilities.
Organic Chemical Contaminants
None of the chemical contaminants detected during this study were at levels suggested to be toxic although a few were within a factor of 10 of accepted standards. This was supported by the lack of toxic response in the toxicity assays. Contaminants listed as Priority Substances were largely absent from the results. The exceptions were the PAHs fluoranthene and pyrene, detected at the lagoon mouth (Ocean_01) and at Moody Brooks below levels indicating concern. Both fluoranthene and pyrene are listed as candidate Substances of Very High Concern (SVHCs) under the EU REACH regulations. Fluoranthene has a Maximum Allowable Concentration (MAC) Environmental Quality Standard (EQS) of 0.12 μg l–1 in surface waters (Directive 2013/39/EU). It is possible that other PAHs could be detected using targeted analyses, rather than a screening approach which does not detect all contaminants regulated in the European aquatic environment.
Substances classed as volatile solvents were the principal contaminant in samples. The most common was bromoform, which was detected at concentrations (0.06 to 0.21 μg l–1) well below the predicted no-effect concentrations (PNEC, i.e., 1.3 μg l––1 evaluated at a 95 percentile3). Disinfection of drinking water and release of waste water into the marine environment are possible sources of both bromoform and dibromomethane. Both are also naturally occurring chemicals, for example bromoform can be synthesized by phytoplankton, particularly in coastal waters (Stemmler et al., 2015).
The most frequently occurring contaminant was N,N-Diethyl-meta-toluamide (DEET) which is widely used an insect repellent and may enter the marine environment in many ways, e.g., through washing off swimmers and through wastewater discharges from showering and laundry (Weeks et al., 2012). It does, however, biodegrade in seawater, and is considered to have a low bioaccumulation potential. DEET is considered to be acutely toxic to some aquatic species at concentrations ranging from 4 to 388 mg l–1 (Weeks et al., 2012), which is orders of magnitude higher than the highest concentration (7.7 μg l–1) found in this study.
Benzenesulfonamide, N-butyl (or NBBS) is commonly used as a plasticizer, producing films, transparent coating, and plastic resins. In terms of industrial uses, NBBS can be released into the environment from machining of materials and use in long-life outdoor and indoor materials e.g., furniture. NBBS is not readily biodegradable and is considered to be persistent and mobile, particularly when discharged after sewage treatment (Blum et al., 2018). There is a general paucity of studies on the acute and chronic toxicity of NBBS to different marine species. It is considered that an accidental release to sea water may pose a danger to fish (low toxicity), invertebrates (low toxicity) and aquatic plants (low toxicity) prior to degradation.
Heavy Metals
Elevated copper levels at the Marina and Moody Brook were likely to be related to boat activity and copper from antifouling paints. These were above European standards set to prevent negative impacts particularly on juvenile and larval mollusks. The slightly elevated zinc in these areas could also be due to zinc sacrificial anodes, used on boats to reduce metal corrosion.
The Waste Site samples, which were taken adjacent to metal waste that had collapsed into the water, showed surprisingly low metal concentrations, although there was some evidence of elevated nickel on two of the three samplers deployed.
The most obvious variations seen were for the Plantation site where passive samplers picked up higher concentrations of chromium and nickel compared to other sites sampled. Although the site is now relatively quiet and secluded from human activity, it used to be the largest of four working coconut plantations on the island. Any use of inorganic fertilizers might be a potential source of heavy metals, e.g., from run-off due to high precipitation levels or from freshwater ponds located nearby. The Plantation site used to be the largest civilian settlement in the archipelago and was the administrative capital until the depopulation of the territory, so there may be a range of legacy contaminants in the area. The site was also where coal resupply barges were moored, and transport ships were loaded with supplies of coconuts. Perhaps more critical was the use of the area as a seaplane base, with at least one wrecked flying boat in the jungle nearby. Aeronautical alloys feature large amounts of chromium and nickel so it’s possible that metals are leaching into the water from this wreck or other pieces of metal wreckage in the vicinity.
Direct comparison of DGT data against EQS levels need to be treated with caution, particularly where DGT levels were just below EQS values. The EQS levels were derived from total dissolved concentrations whereas DGTs measure only the metal labile fraction. In the cases where DGT levels exceeded the EQS (e.g., nickel, zinc, copper), the findings are clear. Nonetheless, no toxic response was observed in the toxicity assays.
Conclusion
Background levels of nutrients and pollutants at Diego Garcia are poorly understood but are essential for assessing human impacts on water quality. Concentrations of dissolved inorganic nutrients (nitrate and phosphate) were low at near-pristine sites. Concentrations of total dissolved inorganic nitrogen (DIN) were high at all sites due to ammonium and may be attributable to biological communities in the region rather than anthropogenic waste discharges, as fecal indicator bacteria were below detectable levels. Inside the lagoon, oxygen deficiency observed in some locations may be a consequence of broadscale oceanographic processes rather than nutrient pollution. At some sites, heavy metals (cadmium, nickel, zinc and copper) were higher than environmental quality standards (EQS) but did not show toxicity effects. Results indicate low levels of pollution overall. However, levels of nutrients, oxygen deficiency, chemical contaminants and heavy metals at some sites inside the lagoon may be a concern given the slow flushing rates of the lagoon and will inform future monitoring and assessment of environmental health at Diego Garcia. Interpretations and conclusions from the field work need to take account of limitations to the sampling and analyses undertaken, including the number and location of sites sampled, and the remote location. A similar study in another UK Overseas Territory (St Helena Island; Painting et al., 2021) highlights growing concern and commitment to investigating potential water quality issues in these remote locations. Establishing baseline environmental conditions is essential for future management and conservation of these areas, which are likely to be under increased threat from global changes and increasing development.
Data Availability Statement
The original contributions presented in the study are included in the article/Supplementary Material, further inquiries can be directed to the corresponding author/s.
Author Contributions
All authors contributed toward the planning, preparation and implementation of the fieldwork, data analysis and interpretation, and writing the manuscript. SP was the Principal Investigator and lead author. PN and AS carried out the fieldwork and led on the nutrient analyses and ecotoxicology, respectively. CG led on all CTD work. AP provided microbiological expertise. PB was the expert on chemical contaminants. SA-R was the overall lead on the Cefas work package under the UK Blue Belt Programme. SB was the BIOT Administration lead.
Funding
The work described here was funded under the Blue Belt Programme by UK Government through the Foreign Commonwealth and Development Office (FCDO, previously FCO) and Defra. The Program supports the delivery of the Government’s commitment to enhance marine protection of over four million square kilometers of marine environment across UK Overseas Territories.
Conflict of Interest
The authors declare that the research was conducted in the absence of any commercial or financial relationships that could be construed as a potential conflict of interest.
Acknowledgments
We would like to thank the BIOT Administration, Harri Morrall (the Environment Officer), members of the UK Armed Forces stationed in BIOT and facilities management staff for their support. We are grateful to our Cefas colleagues who supported technical aspects of this work (Thi Bolam and Lee Warford – metals, Benjamin Cowburn – mapping; Frances Mynott – contaminant effects), the Environment Agency’s National Laboratory Service for contaminant analyses, and the University of East Anglia for nutrient analyses.
Supplementary Material
The Supplementary Material for this article can be found online at: https://www.frontiersin.org/articles/10.3389/fmars.2021.671319/full#supplementary-material
Footnotes
- ^ See https://www.wunderground.com/history/daily/io/diego-garcia/FJDG/date/2019-3-31. Confirmed by BIOTA, pers. comm.
- ^ See https://www.findtide.com/1185-2021-04-01.html
- ^ https://echa.europa.eu/registration-dossier/-/registered-dossier/27552/6/1
References
Abbas, M., Adil, M., Ehtisham-ul-Haque, S., Munir, B., Yameen, M., Ghaffar, A., et al. (2018). Vibrio fischeri bioluminescence inhibition assay for ecotoxicity assessment: a review. Sci. Total Environ. 626, 1295–1309. doi: 10.1016/j.scitotenv.2018.01.066
Alongi, D. M. (2014). Carbon cycling and storage in mangrove forests. Ann. Rev. Mar. Sci. 6, 195–219. doi: 10.1146/annurev-marine-010213-135020
Ateweberhan, M., Feary, D. A., Keshavmurthy, S., Chen, A., Schleyer, M. H., Sheppard, C. R., et al. (2013). Climate change impacts on coral reefs: synergies with local effects, possibilities for acclimation, and management implications. Mar. Pollut. Bull. 74, 526–539. doi: 10.1016/j.marpolbul.2013.06.011
Barron, M. G., Vivian, D. N., Heintz, R. A., and Yim, U. H. (2020). Long-term ecological impacts from oil spills: comparison of Exxon Valdez, Hebei Spirit, and Deepwater Horizon. Environ. Sci. Technol. 54, 6456–6467. doi: 10.1021/acs.est.9b05020
Bendschneider, K., and Robinson, R. (1952). A new spectrophotometric method for the determination of nitrite in seawater. J. Mar. Res. 1, 87–96.
Best, M., Wither, A. W., and Coates, S. (2007). Dissolved oxygen as a physico-chemical supporting element in the Water Framework Directive. Mar. Pollut. Bull. 55, 53–64. doi: 10.1016/j.marpolbul.2006.08.037
Blum, K. M., Andersson, P. L., Ahrens, L., Wiberg, K., and Haglund, P. (2018). Persistence, mobility and bioavailability of emerging organic contaminants discharged from sewage treatment plants. Sci. Total Environ. 612, 1532–1542.
Breitburg, D., Levin, L. A., Oschlies, A., Grégoire, M., Mansour, L., Courjault-Radé, P., et al. (2018). Declining oxygen in the global ocean and coastal waters. Science 359:eaam7240. doi: 10.1126/science.aam7240
Burson, A., Stomp, M., Akil, L., Brussaard, C. P. D., and Huisman, J. (2016). Unbalanced reduction of nutrient loads has created an offshore gradient from phosphorus to nitrogen limitation in the North Sea. Limnol. Oceanogr. 61, 869–888. doi: 10.1002/lno.10257
Byamukama, D., Kansiime, F., Mach, R., and Farnleitner, A. (2000). Determination of Escherichia coli contamination with Chromocult coliform agar showed a high level of discrimination efficiency for differing fecal pollution levels in tropical waters of Kampala, Uganda. Environ. Microbiol. 66, 864–868.
Charpy, L. (1996). Phytoplankton biomass and production in two Tuamotu atoll lagoons (French polynesia). Mar. Ecol. Prog. Ser. 145, 133–142. doi: 10.3354/meps145133
Cloern, J. (2001). Our evolving conceptual model of the coastal eutrophication problem. Mar. Ecol. Prog. Ser. 210, 223–253. doi: 10.3354/meps210223
Denton, G. R. W., Concepcion, L. P., Wood, H. R., and Morrison, R. J. (2005). Trace metals in sediments of four harbours in Guam. Mar. Pollut. Bull. 50, 1133–1141. doi: 10.1016/j.marpolbul.2005.06.050
Denton, G. R. W., Concepcion, L. P., Wood, H. R., and Morrison, R. J. (2006). Polycyclic aromatic hydrocarbons (PAHs) in small island coastal environments: a case study from harbours in Guam, Micronesia. Mar. Pollut. Bull. 52, 1090–1098. doi: 10.1016/j.marpolbul.2006.05.002
Devlin, M., Bricker, S., and Painting, S. (2011). Comparison of five methods for assessing impacts of nutrient enrichment using estuarine case studies. Biogeochemistry 106, 177–205. doi: 10.1007/s10533-011-9588-9
Diaz, R. J., and Rosenberg, R. (2008). Spreading Dead Zones and consequences for marine ecosystems. Science 321, 926–929. doi: 10.1126/science.1156401
Dilmahamod, A. F., Hermes, J. C., and Reason, C. J. C. (2016). Chlorophyll-a variability in the seychelles-chagos thermocline ridge: analysis of a coupled biophysical model. J. Mar. Syst. 154, 220–232. doi: 10.1016/j.jmarsys.2015.10.011
Dougan, K. E., Ladd, M. C., Fuchs, C., Thurber, R. V., Burkepile, D. E., Rodriguez-Lanetty, M., et al. (2020). Nutrient pollution and predation differentially affect innate immune pathways in the coral porites porites. Front. Mar. Sci. 7:563865. doi: 10.3389/fmars.2020.563865
Downing, J. A. (1997). Marine nitrogen: phosphorus stoichiometry and the global N:P cycle. Biogeochemistry 37, 237–252. doi: 10.1023/A:1005712322036
Drew, E. A. (1980). Seagrasses in the Chagos archipelago. Aquat. Bot. 9, 179–184. doi: 10.1016/0304-3770(80)90019-4
Environment Agency (EA) (2000). The Microbiology of Recreational and Environmental Waters (2000). Methods for the examination of waters and associated materials. Report by Standing Comittee of Analysts. Redwood, CA: Environment Agency (EA).
Environment Agency (EA) (2019). Bathing Water Quality. Available online at: https://environment.data.gov.uk/bwq/profiles/help-understanding-data.html (accessed December 20, 2019).
EC (1976). Council directive of 4 May 1976 on pollution caused by certain caused by certain dangerous substances discharged into the aquatic environment of the community. Off. J. Eur. Commun. 21, 196–196. doi: 10.1039/AP9842100196
Esteban, N., and Mortimer, J. A. (2018). Sea Turtle Conservation Research: Diego Garcia, British Indian Ocean Territory, 21 November - 11 December 2018. Expedition Report to the Foreign and Commonwealth Office, 21. Available online at: https://biot.gov.io/science/2018-science-expeditions/1466-2/ (accessed December, 2018)
Esteban, N., Unsworth, R. K. F., Gourlay, J. B. Q., and Hays, G. C. (2018). The discovery of deep-water seagrass meadows in a pristine Indian Ocean wilderness revealed by tracking green turtles. Mar. Pollut. Bull. 134, 99–105. doi: 10.1016/j.marpolbul.2018.03.018
EU (2006a). Directive 2006/7/EC of the European Parliament and of the Council of 15 February 2006 concerning the management of bathing water quality and repealing Directive 76/160/EEC. Off. J. Eur. Union 64, 37–51. doi: 10.1016/j.jclepro.2010.02.014
EU (2006b). Directive 2006/11/EC of the European Parliament and of the Council of 15 February 2006 on pollution caused by certain dangerous substances discharged in to the aquatic environment of the Community. Brussels: EU.
EU (2006c). Regulation (EC) No 1907/2006 of the European Parliament and of the Council of 18 December 2006 concerning the Registration, Evaluation, Authorisation and Restriction of Chemicals (REACH), establishing a European Chemicals Agency, amending Directive 1999/4. Brussels: EU, 520.
EU (2008). Directive 2008/105/EC of the European Parliament and of the Council of 16 December 2008 on environmental quality standards in the field of water policy, amending and subsequently repealing Council Directives 82/176/EEC, 83/513/EEC, 84/156/EEC, 84/491/EEC. Off. J. Eur. Union 348, 84–97.
EU (2013). Directive 2013/39/EU of the European Parliament and of the Council of 12 August 2013 amending Directives 2000/60/EC and 2008/105/EC as regards priority substances in the field of water policy. Off. J. Eur. Union 226, 1–17.
EU (2016). Priority Substances and Certain Other Pollutants according to Annex II of Directive 2008/105/EC. Available online at: https://ec.europa.eu/environment/water/water-framework/priority_substances.htm (accessed January 6, 2021).
Everaarts, J., Booij, K., Fischer, C., Mass, Y. E., and Nieuwenhuize, J. (1999). “Assessment of the environmental health of the Chagos Archipelago,” in Ecology Chagos Archipelago, eds C. Sheppard and M. Seaward (London: Linnean Society Occasional Publications), 305–326.
FAO, and WHO (2018). Technical Guidance for The Development Of The Growing Area Aspects Of Bivalve Mollusc Sanitation Programmes. Food Safety and Quality Series No. 5. Rome: FAO, 292. Licence: CC BY-NC-SA 3.0 IGO.
Faria, E. C., Treves Brown, B. J., and Snook, R. D. (2004). Water toxicity monitoring using Vibrio fischeri: a method free of interferences from colour and turbidity. J. Environ. Monit. 6, 97–102. doi: 10.1039/b311137g
Fasolo, L. (2013). A Baseline Study of the Oceanography of the Chagos Archipelago. Honours Dissertation. Perth: The University of Western Australia.
Foden, J., Devlin, M. J., Mills, D. K., and Malcolm, S. J. (2011). Searching for undesirable disturbance: an application of the OSPAR eutrophication assessment method to marine waters of England and Wales. Biogeochemistry 106, 157–175. doi: 10.1007/s10533-010-9475-9
Garcia, C. A., Baer, S. E., Garcia, N. S., Rauschenberg, S., Twining, B. S., Lomas, M. W., et al. (2018). Nutrient supply controls particulate elemental concentrations and ratios in the low latitude eastern Indian Ocean. Nat. Commun. 9:4868. doi: 10.1038/s41467-018-06892-w
Garcia, H. E., and Gordon, L. I. (1992). Oxygen solubility in seawater: better fitting equations. Limnol. Oceanogr. 37, 1307–1312.
George, J. V., Nuncio, M., Anilkumar, N., Chacko, R., and Rajashekhar, D. (2018). Seasonal Surface Chlorophyll a variability in the seychelles-chagos thermocline ridge. Curr. Sci. 114:868. doi: 10.18520/cs/v114/i04/868-878
George, J. V., Nuncio, M., Chacko, R., Anilkumar, N., Noronha, S. B., Patil, S. M., et al. (2013). Role of physical processes in chlorophyll distribution in the western tropical Indian Ocean. J. Mar. Syst. 113–114, 1–12. doi: 10.1016/j.jmarsys.2012.12.001
Gibbs, M. T. (2009). Resilience: what is it and what does it mean for marine policymakers? Mar. Policy 33, 322–331. doi: 10.1016/j.marpol.2008.08.001
Global Ocean Acidfication Observing Network (GOA-ON) Implementation Strategy (2019). Available online at: http://www.goa-on.org/news/news.php.http://goa-on.org
Google Earth (2020). Google Earth Pro Image information: Data SIO, NOAA, U.S. Navy, NGA, GEBCO. Westminster: Maxar Technologies.
Gove, J. M., McManus, M. A., Neuheimer, A. B., Polovina, J. J., Drazen, J. C., Smith, C. R., et al. (2016). Near-island biological hotspots in barren ocean basins. Nat. Commun. 7, 1–8. doi: 10.1038/ncomms10581
Graves, C. A., Powell, A., Stone, M., Redfern, F., Biko, T., Devlin, M., et al. (2021). Marine water quality of a densely populated Pacific atoll (Tarawa, Kiribati): cumulative pressures and resulting impacts on ecosystem and human health. Mar. Pollut. Bull. 163:111951. doi: 10.1016/j.marpolbul.2020.111951
Green, R. H., Jones, N. L., Rayson, M. D., Lowe, R. J., Bluteau, C. E., Ivey, G. N., et al. (2019). Nutrient fluxes into an isolated coral reef atoll by tidally driven internal bores. Limnol. Oceanogr. 64, 461–473. doi: 10.1002/lno.11051
Hamylton, S., and East, H. (2012). A geospatial appraisal of ecological and geomorphic change on Diego Garcia atoll, Chagos Islands (British Indian Ocean Territory). Remote Sens. 4, 3444–3461. doi: 10.3390/rs4113444
Harms, N. C., Lahajnar, N., Gaye, B., Rixen, T., Dähnke, K., Ankele, M., et al. (2019). Nutrient distribution and nitrogen and oxygen isotopic composition of nitrate in water masses of the subtropical southern Indian Ocean. Biogeosciences 16, 2715–2732. doi: 10.5194/bg-16-2715-2019
Hays, G. C., Koldewey, H. J., Andrzejaczek, S., Attrill, M. J., Barley, S., Bayley, D. T. I., et al. (2020). A review of a decade of lessons from one of the world’s largest MPAs: conservation gains and key challenges. Mar. Biol. 167:22. doi: 10.1007/s00227-020-03776-w
Hermes, J. C., and Reason, C. J. C. (2008). Annual cycle of the South Indian Ocean (Seychelles-Chagos) thermocline ridge in a regional ocean model. J. Geophys. Res. Ocean 113:10. doi: 10.1029/2007JC004363
Jarque, S., Masner, P., Klánová, J., Prokeš, R., and Bláha, L. (2016). Bioluminescent vibrio fischeri assays in the assessment of seasonal and spatial patterns in toxicity of contaminated river sediments. Front. Microbiol. 7:1738. doi: 10.3389/fmicb.2016.01738
Johnston, E. L., Mayer-Pinto, M., and Crowe, T. P. (2015). Chemical contaminant effects on marine ecosystem functioning. J. Appl. Ecol. 52, 140–149. doi: 10.1111/1365-2664.12355
Kirby, M. F., Allen, Y. T., Dyer, R. A., Feist, S. W., Katsiadaki, I., Matthiessen, P., et al. (2004). Surveys of plasma vitellogenin and intersex in male flounder (Platichthys flesus) as measures of endocrine disruption by estrogenic contamination in United Kingdom estuaries: temporal trends, 1996 to 2001. Environ. Toxicol. Chem. 23:748. doi: 10.1897/03-166
Kirkwood, D. (1996). Nutrients: practical notes on their determination in sea water. ICES Tech. Mar. Environ. Sci. 17:29.
Laffoley, D., Baxter, J. M., Amon, D. J., Curri, D. E. J., Downs, C. A., Hall-Spencer, J. M., et al. (2020). Eight urgent, fundamental and simultaneous steps needed to restore ocean health, and the consequences for humanity and the planet of inaction or delay. Aquat. Conserv. Mar. Freshw. Ecosyst. 30, 194–208. doi: 10.1002/aqc.3182
Lam, V. W., Chavanich, S., Djoundourian, S., Dupont, S., Gaill, F., Holzer, G., et al. (2019). Dealing with the effects of ocean acidification on coral reefs in the Indian Ocean and Asia. Reg. Stud. Mar. Sci. 28:100560. doi: 10.1016/j.rsma.2019.100560
Lauvset, S. K., Gruber, N., Landschützer, P., Olsen, A., and Tjiputra, J. (2015). Trends and drivers in global surface ocean pH over the past 3 decades. Biogeosciences 12, 1285–1298. doi: 10.5194/bg-12-1285-2015
Law, A., and Hii, Y. (2006). Status, impacts and mitigation of hydrocarbon pollution in the Malaysian seas. Aquat. Ecosyst. Health Manag. 9, 147–158. doi: 10.1080/14634980600701583
Lefevre, D., Minas, H., Minas, M., Robinson, C., Williams, B., Woodward, E. M. S., et al. (2003). Review of gross community production, primary production, net community production and dark community respiration in the Gulf of Lions. Deep Sea Res. II 3–4, 801–832.
Lévy, M., Shankar, D., André, J. M., Shenoi, S. S. C., Durand, F., de Boyer Montégut, C., et al. (2007). Basin-wide seasonal evolution of the Indian Ocean’s phytoplankton blooms. J. Geophys. Res. Ocean 112:JC004090. doi: 10.1029/2007JC004090
Macken, A., Lillicrap, A., and Langford, K. (2015). Benzoylurea pesticides used as veterinary medicines in aquaculture: risks and developmental effects on nontarget crustaceans. Environ. Toxicol. Chem. 34, 1533–1542. doi: 10.1002/etc.2920
Masner, P., Javůrková, B., and Bláha, L. (2017). Rapid in situ toxicity testing with luminescent bacteria Photorhabdus luminescens and Vibrio fischeri adapted to a small portable luminometer. Environ. Sci. Pollut. Res. 24, 3748–3758. doi: 10.1007/s11356-016-8096-9
McCreary, J. P., Murtugudde, R., Vialard, J., Wiggert, J. D., Hood, R. R., Shankar, D., et al. (2009). Biophysical processes in the Indian Ocean. Geophys. Monogr. Ser. 185, 9–32. doi: 10.1029/2008GM000768
Mortimer, J. A., Esteban, N., Guzman, A. N., and Hays, G. C. (2020). Estimates of marine turtle nesting populations in the south-west Indian Ocean indicate the importance of the Chagos Archipelago. Oryx 54, 332–343. doi: 10.1017/S0030605319001108
Murphy, J., and Riley, J. (1962). A modified single solution method for the determination of phosphate in natural waters. Anal. Chim. Acta 27, 31–36.
Mwachireya, S. A., Ndagala, J., Moorgawa, S. M., Ali, H., Randrianandrasana, J., Kimirei, I., et al. (2018). Draft ocean acidification paper for Western Indian Ocean Region. Paper Presented at UNEP Ocean Acidification White Papper, London, 5.
Naqvi, S. (2019). “Evidence for ocean deoxygenation and its patterns: Indian Ocean,” in Ocean Deoxygenation: Everyone’s Problem - Causes, Impacts, Consequences and Solutions, eds D. Laffoley and J. M. Baxter (Gland: IUCN), 51–71.
Nasher, E., Heng, L. Y., Zakaria, Z., and Surif, S. (2013). Concentrations and sources of polycyclic aromatic hydrocarbons in the seawater around Langkawi Island, Malaysia. J. Chem. 2013:975781. doi: 10.1155/2013/975781
NOAA Climate Change Web Portal (2021). NOAA Climate Change Web Portal CMIP5. Available online at: https://psl.noaa.gov/ipcc/ocn/ (accessed January 29, 2021).
Orr, J. C., Fabry, V. J., Aumont, O., Bopp, L., Doney, S. C., Feely, R. A., et al. (2005). Anthropogenic ocean acidification over the twenty-first century and its impact on calcifying organisms. Nature 437, 681–686. doi: 10.1038/nature04095
Painting, S., Devlin, M., Malcolm, S., Parker, E. R., Mills, D. K., Mills, C., et al. (2007). Assessing the impact of nutrient enrichment in estuaries: susceptibility to eutrophication. Mar. Pollut. Bull. 55, 74–90.
Painting, S. J., Haigh, E. K., Graham, J. A., Morley, S., Henry, L., Clingham, E., et al. (2021). St Helena marine water quality: background conditions and development of assessment levels for coastal pollutants. Front. Mar. Sci. 8:655321. doi: 10.3389/fmars.2021.655321
Pandolfi, J. M., Connolly, S. R., Marshall, D. J., and Cohen, A. L. (2011). Projecting coral reef futures under global warming and ocean acidification. Science 333, 418–422. doi: 10.1126/science.1204794
Purkis, S. J., Gardiner, R., Johnston, M. W., and Sheppard, C. R. C. (2016). A half-century of coastline change in Diego Garcia - The largest atoll island in the Chagos. Geomorphology 261, 282–298. doi: 10.1016/j.geomorph.2016.03.010
Rayner, R. F., and Drew, E. A. (1984). Nutrient concentrations and primary productivity at the Peros Banhos and Salomon atolls in the Chagos Archipelago. Estuar. Coast Shelf Sci. 18, 121–132. doi: 10.1016/0272-7714(84)90100-8
Readman, J., Tolosa, I., Bartocci, J., Cattini, C., Andrew, P., Jolliffe, A., et al. (1999). “Contaminant levels and the use of molecular organic markers to characterise the coastal environment of the Chagos Archipelago,” in Ecology Chagos Archipelago, eds C. Sheppard and M. Seaward (London: Linnean Society Occasional Publications), 297–304.
Readman, J. W., DeLuna, F., Ebinghaus, R., Nestor, A., Price, G. A. R. G., Readman, E. E., et al. (2013). “Anthropogenic impacts in Chagos / BIOT,” in Coral Reefs United Kingdom Overseas Territ. Coral Reefs World 4, ed. C. R. C. Sheppard (Dordrecht: Springer), 283–298.
Resplandy, L., Vialard, J., Lévy, M., Aumont, O., and Dandonneau, Y. (2009). Seasonal and intraseasonal biogeochemical variability in the thermocline ridge of the southern tropical Indian Ocean. J. Geophys. Res. Ocean 114, 1–13. doi: 10.1029/2008JC005246
Riemann, B., and Schierup, H.-H. (1978). Effects of storage and conservation on the determination of ammonia in water samples from four lake types and a sewage plant. Water Res. 12, 849–853. doi: 10.1016/0043-1354(78)90037-4
Rotini, A., Manfra, L., Spanu, F., Pisapia, M., Cicero, A. M., Lu, M., et al. (2017). Ecotoxicological method with marine bacteria Vibrio anguillarum to evaluate the acute toxicity of environmental contaminants. J. Vis. Exp. 2017, 1–5. doi: 10.3791/55211
Sand, P. (2010). The Chagos Archipelago: footprint of empire, or world heritage? Environ. Policy Law 40, 232–242.
Sardessai, S., Shetye, S., Maya, M. V., Mangala, K. R., and Kumar, S. P. (2010). Nutrient characteristics of the water masses and their seasonal variability in the eastern equatorial Indian Ocean. Mar. Environ. Res. 70, 272–282. doi: 10.1016/j.marenvres.2010.05.009
SenGupta, R. (1976). Relationship between dissolved oxygen and nutrients in the north-western Indian Ocean. Indian J. Geo. Mar. Sci. 05, 201–211.
Sheehan, E. V., Hosegood, P., Game, C. A., and Martin, A. (2019). The effect of deep oceanic flushing on water properties and ecosystem functioning within atolls in the British Indian ocean territory. Front Mar Sci 6:512. doi: 10.3389/fmars.2019.00512
Sheppard, C., and Seaward, M. (1999). Ecology of the Chagos Archipelago. West Yorkshire: Westbury academic & Scientific Publishing.
Sheppard, C., and Sheppard, A. (2019). “British Indian Ocean Territory (Chagos Archipelago),” in World Seas: An Environmental Evaluation: Volume II: The Indian Ocean to the Pacific, 2nd Edn, Vol. 2, ed. C. Sheppard (Amsterdam: Elsevier Ltd), 237–252.
Sheppard, C., Sheppard, A., Mogg, A., Bayley, D., Dempsey, A. C., Purkis, S. J., et al. (2017). Coral bleaching and mortality in the Chagos Archipelago. Atoll. Res. Bull. 2017, 1–26. doi: 10.5479/si.0077-5630.613
Sheppard, C. R. C., Bowen, B. W., Chen, A. C., Craig, M. T., Eble, J., Fitzsimmon, N., et al. (2013). “British Indian Ocean Territory (the Chagos Archipelago): Setting, Connections and the Marine Protected Area,” in Coral Reefs United Kingdom Overseas Territories. Coral Reefs World, Vol. 4, ed. C. Sheppard (Dordrecht: Springer), 223–240.
Smith, A. J., McGowan, T., Devlin, M. J., Massoud, M. S., Zaidan, A., Lyons, B. P., et al. (2015). Screening for contaminant hotspots in the marine environment of Kuwait using ecotoxicological and chemical screening techniques. Mar. Pollut. Bull. 100, 681–688. doi: 10.1016/j.marpolbul.2015.08.043
Smith, V. H. (2003). Eutrophication of freshwater and coastal marine ecosystems a global problem. Environ. Sci. Pollut. Res. 10, 126–139. doi: 10.1065/espr2002.12.142
Spalding, M. (2018). 2017 Annual Report Chief Science Advisor, BIOT Administration. Available online at: http://biot.gov.io.
Stemmler, I., Hense, I., and Quack, B. (2015). Marine sources of bromoform in the global open ocean - Global patterns and emissions. Biogeosciences 12, 1967–1981. doi: 10.5194/bg-12-1967-2015
Tett, P., Gowen, R., Mills, D., Fernandes, T., Gilpin, L., Huxham, M., et al. (2007). Defining and detecting undesirable disturbance in the context of marine eutrophication. Mar. Pollut. Bull. 55, 282–297. doi: 10.1016/j.marpolbul.2006.08.028
Treguer, P., and LeCorre, P. (1975). Manuel D’analyse Des sels Nutritifs Dans l’eau de mer. Ph. D thesis. Brest: Universite de Bretagne Occidentale.
Twining, B. S., Rauschenberg, S., Baer, S. E., Michael, W., Olga, A., Adam, C., et al. (2019). A nutrient limitation mosaic in the eastern tropical Indian Ocean. Deep Sea Res. Part II Top. Stud. Oceanogr. 166, 125–140. doi: 10.1016/j.dsr2.2019.05.001
UK (2015). The water framework directive (Standards and Classification) directions (England and Wales) 2015. Water Framew. Dir. 40:66.
UKTAG (2013). UK Technical Advisory Group on the Water Framework Directive. Updated Recommendations on Environmental Standards. River Basin Management (2015-21). 80. Final Report November 2013. Minor amendments in January 2014.
UN (1976). UN Treat Series No 8737. Exchange of notes constituting an agreement between the government of the United Kingdom of Great Britain and Northern Ireland and the government of the United States of America concerning the availability for defence purposes of United Nations Treaty Series. New York, NY: United Nations, 372–382.
Wang, P., Katz, C., Chadwick, B., and Barua, R. (2014). Hydrodynamic Modeling of Diego Garcia Lagoon. Final Report. Technical report to FCO UK. Space and Naval Warfare Systems Center Pacific (SSC Pacific), San Diego, California. Available online at: https://www.researchgate.net/publication/321368518_Hydrodynamic_Modeling_of_Diego_Garcia_Lagoon_Final_Report (accessed August, 2014).
Weeks, J., Guiney, P., and Nikiforov, A. (2012). Assessment of the environmental fate and ecotoxicity of N,N-diethyl-m-toluamide (DEET). Integr. Environ. Assess. Manag. 8, 120–134. doi: 10.1002/ieam.1246
World Health Organization (WHO) (2003). Guidelines for Safe Recreational Water Environments. Geneva: World Health Organization.
Wiedenmann, J., D’Angelo, C., Smith, E. G., Hunt, A. N., and Legiret, F.-E. (2013). Nutrient enrichment can increase the susceptibility of reef corals to bleaching. Nat. Clim. Chang. 3, 160–164. doi: 10.1038/nclimate1661
Williams, J. J., Papastamatiou, Y. P., Caselle, J. E., Bradley, D., and Jacoby, D. M. P. (2018). Mobile marine predators: an understudied source of nutrients to coral reefs in an unfished atoll. Proc. R. Soc. B Biol. Sci. 285:20172456. doi: 10.1098/rspb.2017.2456
Keywords: baseline, nutrients, indicators, microbiology, fecal, contaminant, metals, oxygen
Citation: Painting SJ, Nelson P, Smith AJ, Graves CA, Powell A, Bersuder P, Bullen S and Archer-Rand S (2021) Marine Water Quality at Diego Garcia: A Preliminary Study of Pollution Levels in Coastal and Lagoon Waters. Front. Mar. Sci. 8:671319. doi: 10.3389/fmars.2021.671319
Received: 23 February 2021; Accepted: 03 June 2021;
Published: 21 July 2021.
Edited by:
David Andrew Feary, MRAG Ltd., United KingdomReviewed by:
Benjamin Green, Environment Agency, United KingdomMonica F. Costa, Federal University of Pernambuco, Brazil
Copyright © 2021 Painting, Nelson, Smith, Graves, Powell, Bersuder, Bullen and Archer-Rand. This is an open-access article distributed under the terms of the Creative Commons Attribution License (CC BY). The use, distribution or reproduction in other forums is permitted, provided the original author(s) and the copyright owner(s) are credited and that the original publication in this journal is cited, in accordance with accepted academic practice. No use, distribution or reproduction is permitted which does not comply with these terms.
*Correspondence: Suzanne Painting, c3V6YW5uZS5wYWludGluZ0BjZWZhcy5jby51aw==