 T. E. Angela L. Quiros1*
 Kenji Sudo1
 Reynante V. Ramilo2
 Helbert G. Garay2Muammar Princess G. Soniega2
 Alvin Baloloy3
 Ariel Blanco4Ayin Tamondong5,4Kazuo Nadaoka6
 Masahiro Nakaoka1
- 1Akkeshi Marine Station, Field Science Center for Northern Biosphere, Hokkaido University, Hokkaidô, Japan
- 2C3 Philippines, Busuanga, Philippines
- 3Training Center for Applied Geodesy and Photogrammetry, University of the Philippines Diliman, Quezon City, Philippines
- 4Department of Geodetic Engineering, University of the Philippines, Quezon City, Philippines
- 5Department of Transdisciplinary Science and Engineering, Tokyo Institute of Technology, Tokyo, Japan
- 6School of Environment and Society, Tokyo Institute of Technology, Tokyo, Japan
Ecosystem services (ES) are benefits nature provides to humans; these services change in space and time and are largely dependent on context. Coastal habitat that provides key ES are blue carbon ecosystems, namely seagrass and mangroves. One important ES they provide is the provisioning of seafood, which benefits coastal populations with livelihoods and food security. We employed a social-ecological approach that draws from the vulnerability literature for social, ecological, and economic criteria to map ES provision in ten communities on Busuanga Island, Palawan Province, Philippines. We assess the spatial dynamics of ES provision for small-scale fisheries in seagrass and mangroves, in relation to local beneficiaries. Using a mixed-methods approach with ecological assessments of seagrass beds, spatial analysis, landing surveys, household and key informant interviews, we overlaid biophysical variables on social data, mapping sensitivities and adaptive capacities to compare communities’ social vulnerabilities. Spatial analysis revealed healthy blue carbon ecosystems in ten local communities (barangays) as measured by proportion of coastline covered, low patchiness and high continuity along the coastline, and the presence of adjacent habitat. We found seagrass ecosystems were more vulnerable than mangroves. Rural barangays had less exposure and lower sensitivity to blue carbon ecosystem loss than urban barangays. Blue carbon ecosystem fisheries are highly sensitive fisheries, due to their catch composition and low catch per unit effort, with mangrove fisheries having a slightly lower sensitivity than seagrass fisheries due to greater catch per unit effort. Diversified livelihoods and the presence of NGOs and People’s Organizations (POs) increased adaptive capacity and reduced overall vulnerability. We aim to highlight a coastal human community’s relationship with blue carbon ecosystems using context-specific vulnerability criteria. Our site-specific social vulnerability assessment may be adapted for use in other coastal communities within the coral triangle. This work suggests opportunities for conservation interventions to manage local communities’ sensitivities and adaptive capacity around the use of blue carbon ecosystems.
Introduction
Ecosystem services (ES) are benefits nature provides to humans; these services change in space and time and are largely dependent on context (Millennium Ecosystem Assessment, 2005). In coastal areas, seagrass meadows and mangroves provide key ecosystem services, including carbon sequestration and climate mitigation. The carbon sequestered in coastal and marine vegetated ecosystems is known as blue carbon, and the ecosystems are usually referred to as blue carbon ecosystems (Howard et al., 2014). Mangroves are coastal tropical forests that are regularly flooded by tidal water (Spalding et al., 2010). Seagrasses are marine flowering plants found in coastlines all over the world except Antarctica (Green and Short, 2003). Both ecosystems capture carbon from the atmosphere and store it at rates more effective than counterparts on land, such as boreal, temperate and tropical forests (Mcleod et al., 2011; Fourqurean et al., 2012). Most of the carbon stored in coastal blue carbon ecosystems remain in their soils (Donato et al., 2011). Interactions between mangroves and seagrasses show the supporting role that adjacent habitats’ carbon storage plays within the seascape (Huxham et al., 2018).
Blue carbon has become a rallying call to mitigate climate change (Crooks et al., 2014; Wylie et al., 2016). Global calls to action for blue carbon ecosystem conservation use the ecosystem services framework. This framework helps to reach key sustainable development goals (SDGs) to balance environmental, social, and economic dimensions (Mironenko et al., 2015). Mangrove ecosystem services include provisioning services such as timber and fisheries, supporting services such as habitat for biodiversity and juvenile life stages, regulating services such as coastal protection, shoreline stabilization, climate regulation and water quality, and their recreational, spiritual and cultural values (UNEP, 2014). Seagrass ecosystem services include supporting functions like biodiversity maintenance, regulating functions like water filtration, climate regulation, buffering against ocean acidification, and coastal protection, provisioning functions such as seafood, and cultural services like tourism (United Nations Environment Programme (UNEP), 2020). The services cross scales, with carbon sequestration at the global scale, to tourism benefits and shoreline protection at national scales, then providing local ecosystem services such as provisioning seafood, improving water quality, and improving human well-being (Barbier et al., 2011).
Southeast Asia is a blue carbon hotspot, or area of concentrated carbon extraction and permanent burial (Thorhaug et al., 2020). Despite their value to society and the biosphere, blue carbon ecosystems are being lost - seagrass are being lost at a rate of 7% year–1 globally (Waycott et al., 2009), and mangroves are being lost at a rate of 1-3% year–1 globally (FAO, 2007) largely due to human stressors such as land use change (Goldberg et al., 2020). In Southeast Asia, seagrass loss is between 2.82% yr–1 (Stankovic et al., 2021) and 10.9% yr–1 (Sudo et al., 2021) due to coastal development, fisheries and storms. Philippine seagrasses have among the greatest extent in Southeast Asia at 2.7 million has (Fortes et al., 2018), but around 76,897 ha yr–1 is being lost (Stankovic et al., 2021), and in a single site, authors found a rate of decline of 1.7% year–1 (Blanco et al., 2014). Thirty five percent of original Philippine mangroves were lost by the end of the 20th century (Valiela et al., 2001), and Philippine mangroves decreased by half from 1918-2010, declining at a rate of 10.5% from 1990 to 2010 (Long et al., 2014).
In Southeast Asia mangroves sequester more organic carbon than seagrasses (Thorhaug et al., 2020), but these ecosystems can also be a major source of carbon emissions when they are converted or degraded, because carbon stored in the soils is released back into the atmosphere and the ocean, releasing as much as 0.15 to 1.02 billion tons of carbon into the atmosphere each year (Pendleton et al., 2012). Carbon stocks in seagrass beds are vulnerable to climate change and the increased frequency of extreme events such as marine heatwaves cause damage to seagrass sediments, releasing carbon into the atmosphere (Arias-Ortiz et al., 2018).
Blue carbon ecosystems are part of a complex social-ecological system that is particularly important to the food security of coastal human populations (McClanahan et al., 2009; Cullen-Unsworth et al., 2014; Unsworth et al., 2018). Small-scale fisheries rely heavily on nearshore marine habitat (de la Torre-Castro et al., 2014). Fishing in mangroves and seagrass is ubiquitous in the tropics due to these ecosystems’ proximity to the shore and ease of access (De La Torre-Castro and Rönnbäck, 2004; Beitl, 2015; Nordlund et al., 2018; Quiros et al., 2018).
There are 200 million people in the world that engage in small-scale fisheries, which are commercial fisheries with limited technology and economic security (De La Torre-Castro and Rönnbäck, 2004; FAO and WFP, 2009). In developing countries, fishing is the main source of livelihood when there are limited alternatives (Béné et al., 2016). Small-scale fisheries employ 90% of people who work in capture fisheries and are particularly important in supporting rural livelihoods, which are characterized by part-time work in many sectors, including seasonal, occasional, and part-time labor (FAO, 2016). In the Philippines, small scale fishers make up 85% of the fisher population and are its poorest sector (Green et al., 2003).
Under this context, we examine the social vulnerability of fishing communities that rely on blue carbon ecosystems. We define social vulnerability as a community’s ability to resist and recover from exposure events (Buckle et al., 2001; Cutter et al., 2008). The small-scale fishery system is “intimately connected with the economic, social and cultural life in local communities” (Jentoft, 2014). Data from fisheries and habitats are crucial when assessing vulnerability (Birkmann et al., 2014), especially when examining the relationship between social vulnerability and resource use (Berkes et al., 2001).
Vulnerability studies have been used to assess communities and fisheries’ vulnerability to climate change (Mamauag et al., 2013; Licuanan et al., 2015; Ekstrom et al., 2015). Ekstrom et al. (2015) conducted a spatially explicit multidisciplinary vulnerability analysis of human coastal communities in the United States, integrating the natural and social sciences with biochemical, economic and social indicators. Tan et al. (2018) used vulnerability analyses combined with ecosystem service flows to prioritize conservation planning in Southeast Asian seagrass meadows with country-level single site-specific analysis, using threat criteria based on the literature. Quiros et al. (2018) assessed social vulnerability in two communities and their fisher sectors, comparing their sensitivity and adaptive capacity, using natural capital, socio-economic and demographic indicators. Siegel et al. (2019) compared social-ecological vulnerability across islands in the Caribbean using climatic threats, and ecological and socio-economic sensitivity and adaptive capacity.
Here, we use a place-based concept of vulnerability to see how fishing communities respond to the loss or degradation of blue carbon ecosystems, examining vulnerability of human communities due to social processes, and the vulnerability of natural ecosystems due to environmental processes (IPCC, 2012). Using a social vulnerability framework (Cutter et al., 2008; Ekstrom et al., 2015), we define exposure as loss or degradation of blue carbon ecosystems due to site-specific threats, and perturbations from the socio-economic context, including land conversion and degradation due to urban development and tourism. We define sensitivity in two parts: people’s dependency on the blue carbon ecosystems, which is affected by the loss of habitat, or in other words, the “local societal importance” of seagrass and mangroves, and a community’s present ability to respond to threats (Ekstrom et al., 2015). We define adaptive capacity as the “assets available” to help prepare for or avoid impacts of the loss or degradation of habitat, or in other words, their ability to change in the face of current and future threats (Ekstrom et al., 2015; Figure 1). All three contribute to overall risk, or social vulnerability (Cutter et al., 2008).
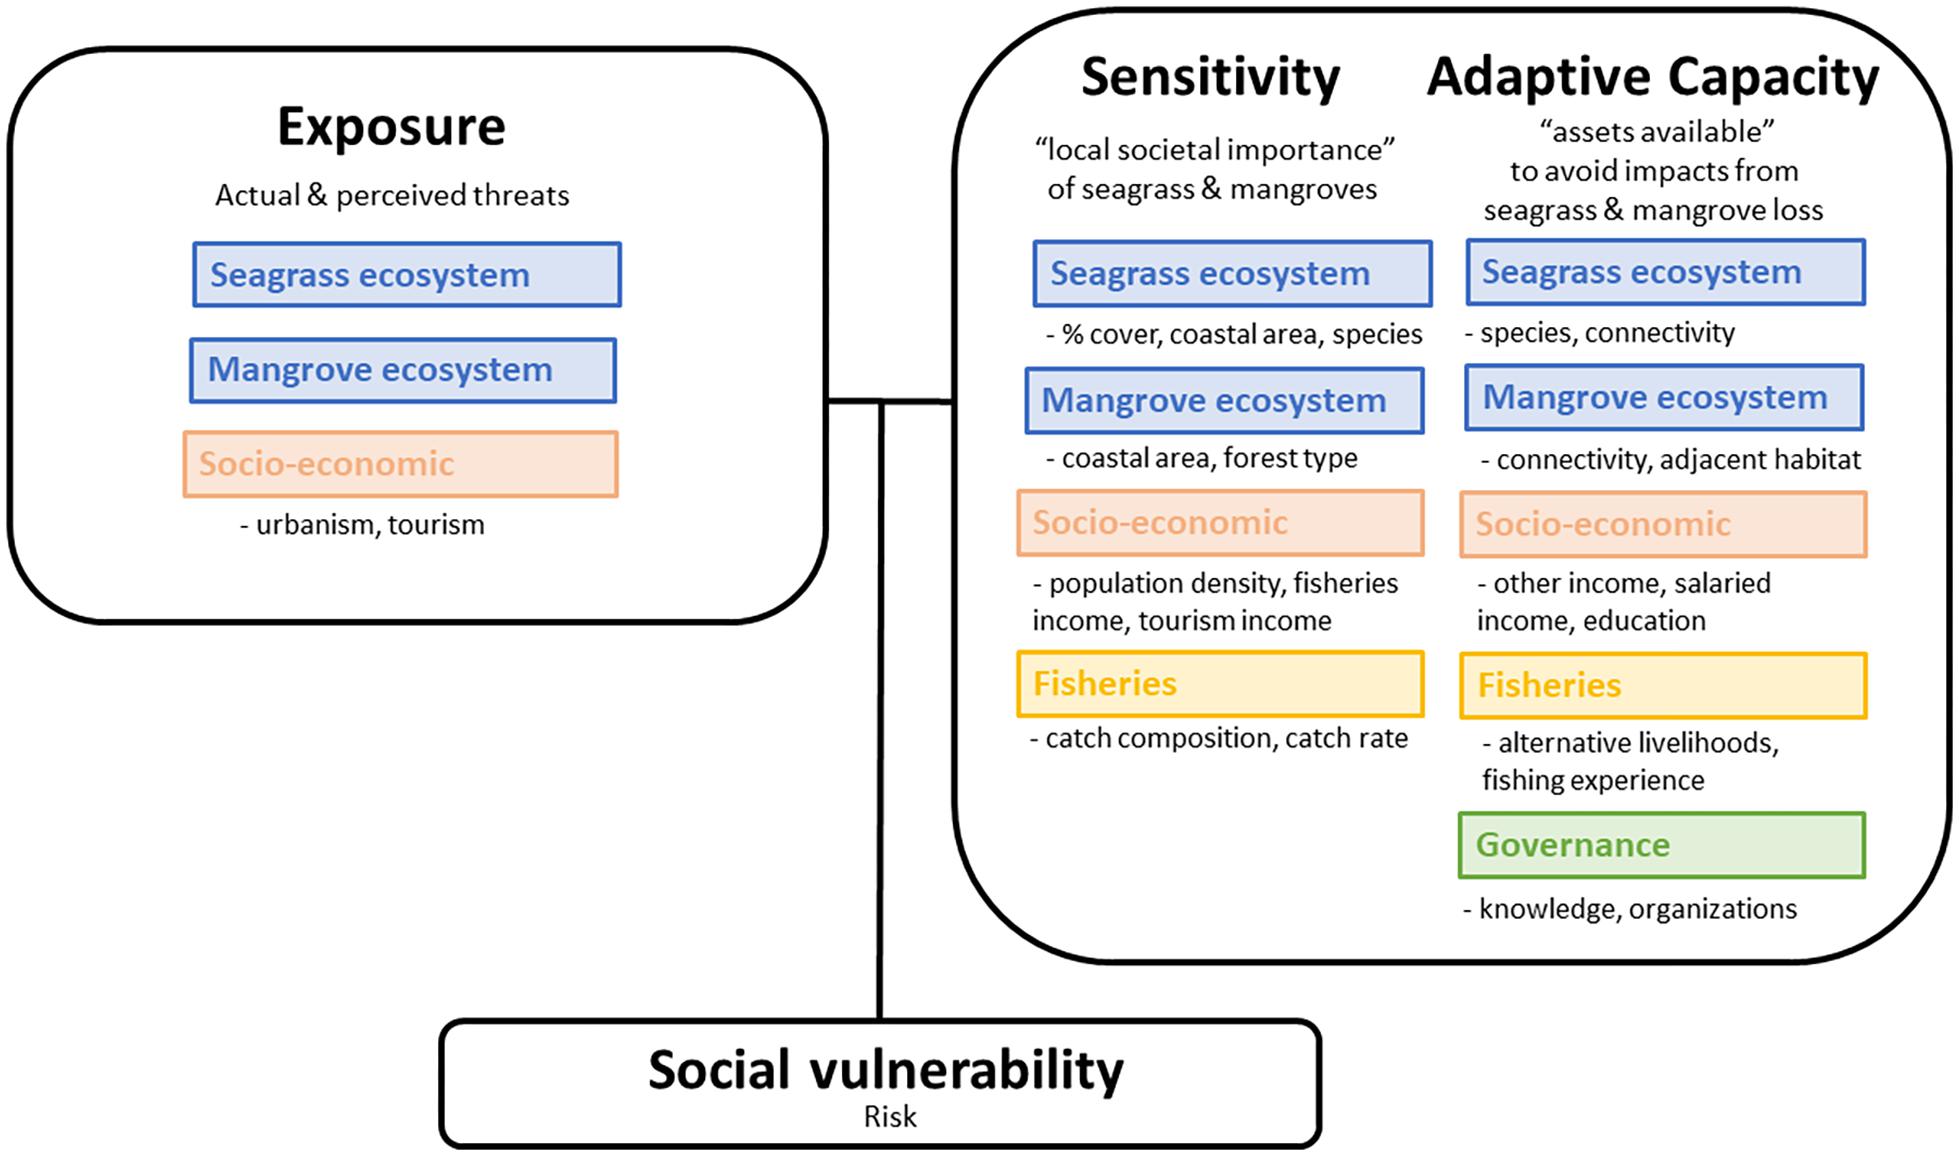
Figure 1. Conceptual diagram of the vulnerability framework. Exposure are the actual and perceived threats to the seagrass and mangrove ecosystems and exposure due to socio-economic context. Sensitivity is the community’s present ability to respond to the threat, or the “local societal importance” of seagrass and mangroves. Adaptive capacity is the ability of communities to change in the face of current and future threats, or the “assets available” to avoid impacts from threats. Adapted from Cutter et al. (2008) and Ekstrom et al. (2015). All three contribute to overall risk, or social vulnerability.
Vulnerability analyses can help evaluate coastal communities’ reliance on blue carbon ecosystems while examining risk to those ecosystems (Figure 1). Looking at the social-ecological system with a vulnerability framework, we can address natural resource management concerns and human community risk. This is important because some international interventions for climate mitigation may not acknowledge the actual needs of local communities (Plan Vivo, 2015). Therefore, by acknowledging the importance of both human and natural systems, we can have more equitable solutions.
In this paper, we aim to highlight a coastal human community’s relationship with blue carbon ecosystems, using context-specific vulnerability criteria. We create a site-specific vulnerability assessment that aims to assist policymakers in resource management in Busuanga Island, Philippines, which may be adapted for use in other coastal communities within the coral triangle.
Materials and Methods
Site Description
Among the Calamianes Group of islands in Palawan, Philippines, Busuanga is the largest and is divided into two municipalities: “Busuanga” in the west and “Coron” in the east. In Busuanga, our study sites include barangays Concepcion, New Busuanga, Quezon, Salvacion, and Turda. In Coron, our sites include barangays Borac, Barangay 5, Decalachao, San Jose and Tagumpay (Figure 2). Busuanga Island is diverse in natural resources. The pristine mangrove areas and existing MPAs are considered the strengths of Busuanga Island due to their diversity. However, the richness and vastness of its natural resources are slowly vanishing and exploited due to upland human-related activities which affects the coastal ecosystems. Unsustainable human activities occurring simultaneously in marine ecosystems of Busuanga are threatening the island’s biodiversity (C3 Philippines personal communication, February 3, 2021).
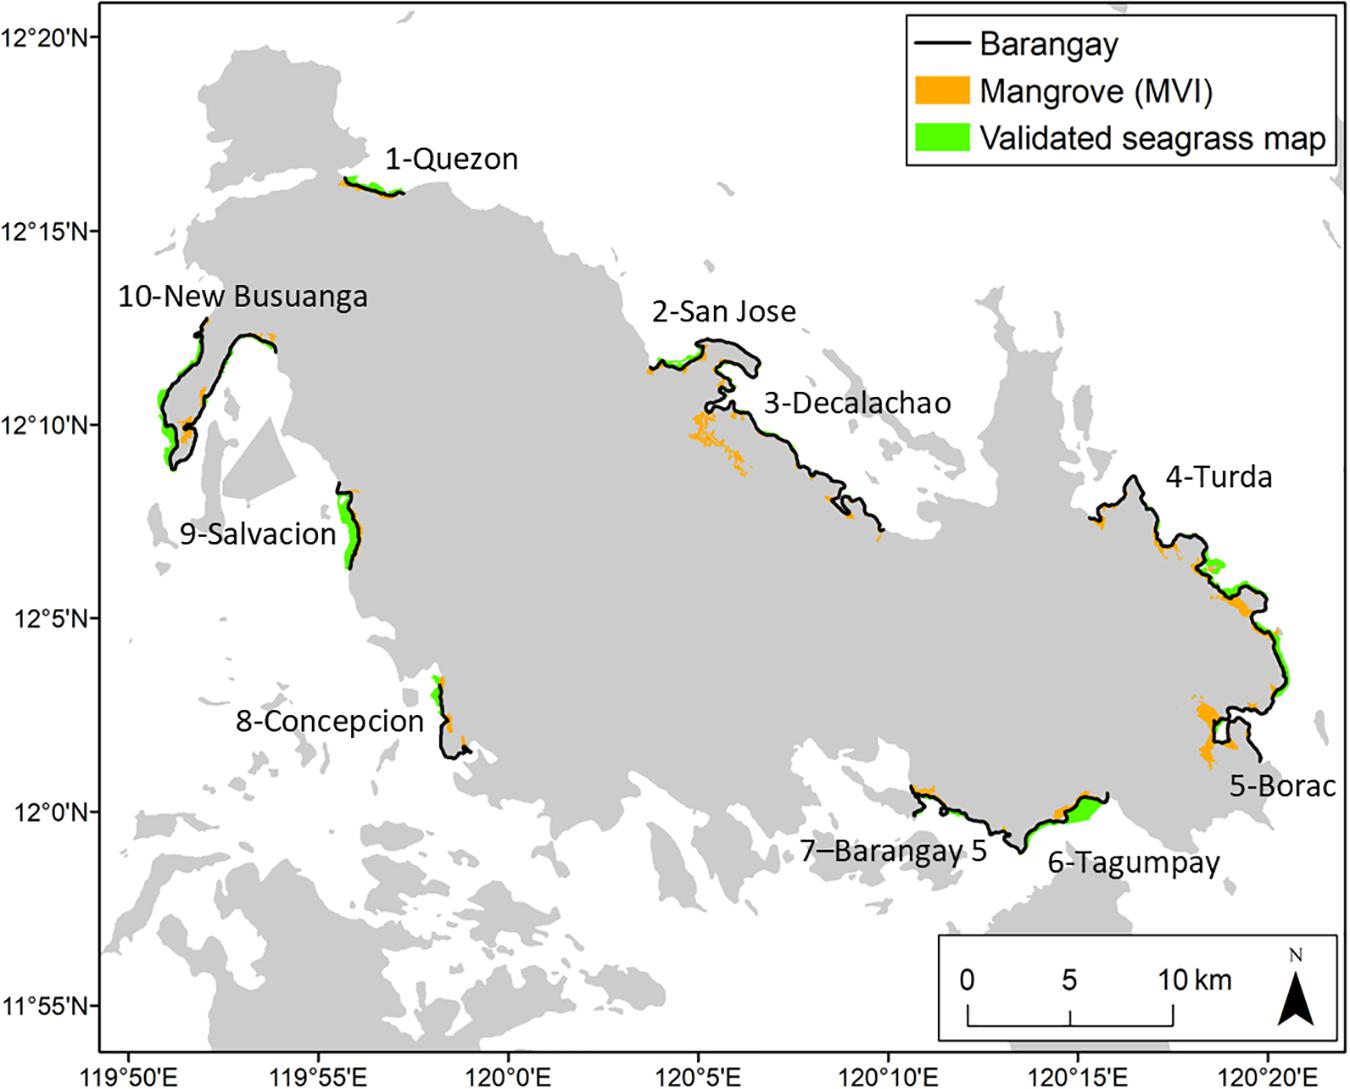
Figure 2. Mangrove and seagrass coverage in Busuanga Island. Municipality of Busuanga: 1- Quezon, 10- New Busuanga, 9- Salvacion, 8- Concepcion; Municipality of Coron: 2- San Jose, 3- Decalachao, 4- Turda, 5- Borac, 6- Tagumpay, 7- Barangay 5.
Almost 70% of protected mangroves in the Philippines are found in Palawan (74,267 has). In Busuanga Island, there are 24 true and 28 associate mangrove species, with the most abundant mangroves Rhizophora spp. and Xylocarpus granatum. However, these mangroves have been heavily exploited, especially those within easy access to roads for charcoal, fuel and building materials. Busuanga Island seagrass beds are dense and speciose (up to 8 species of seagrass) and serve as feeding grounds for dugong (PCSD, 2006), but have been declining since the 1980s (Tamondong et al., 2021).
Vulnerability Assessment Framework for Fishing Communities
Our place-based social vulnerability assessment for fishing communities adapted several vulnerability assessment tools and approaches (Allison et al., 2009; Mamauag et al., 2013; Orencio and Fujii, 2013; Jacinto et al., 2015; Licuanan et al., 2015; Quiros et al., 2018).
We chose criteria based on availability of data, the literature, and the ease of explaining criteria to non-specialist stakeholders (Licuanan et al., 2015). We used four criteria: ecosystem, socio-economic, fisheries, and governance (Figure 1). Variables for these criteria were modified from tools to assess fisheries ecosystem vulnerabilities to climate change impacts, and we kept the number of criteria low, for ease of uptake by stakeholders (Mamauag et al., 2013; Jacinto et al., 2015; Licuanan et al., 2015). The scale of assessment is the coastal community or the barangay, the smallest political unit in the Philippines. We limited our study to 10 barangays from two municipalities (Busuanga and Coron) within Busuanga Island.
Scoring was based on a simple, semi-quantitative approach, where scores ranged from 1 to 5, with 1 or 2, categorized as low, 3 to 4 categorized as medium, and 5 as high (Tables 1–3; Mamauag et al., 2013; Licuanan et al., 2015). Threshold values were based on Philippines specific conditions from the literature (Tables 1–3; Licuanan et al., 2015). The numerical values for each criteria were summed, then converted to a rank system with point class intervals of low, medium, or high (Table 4; Jacinto et al., 2015).
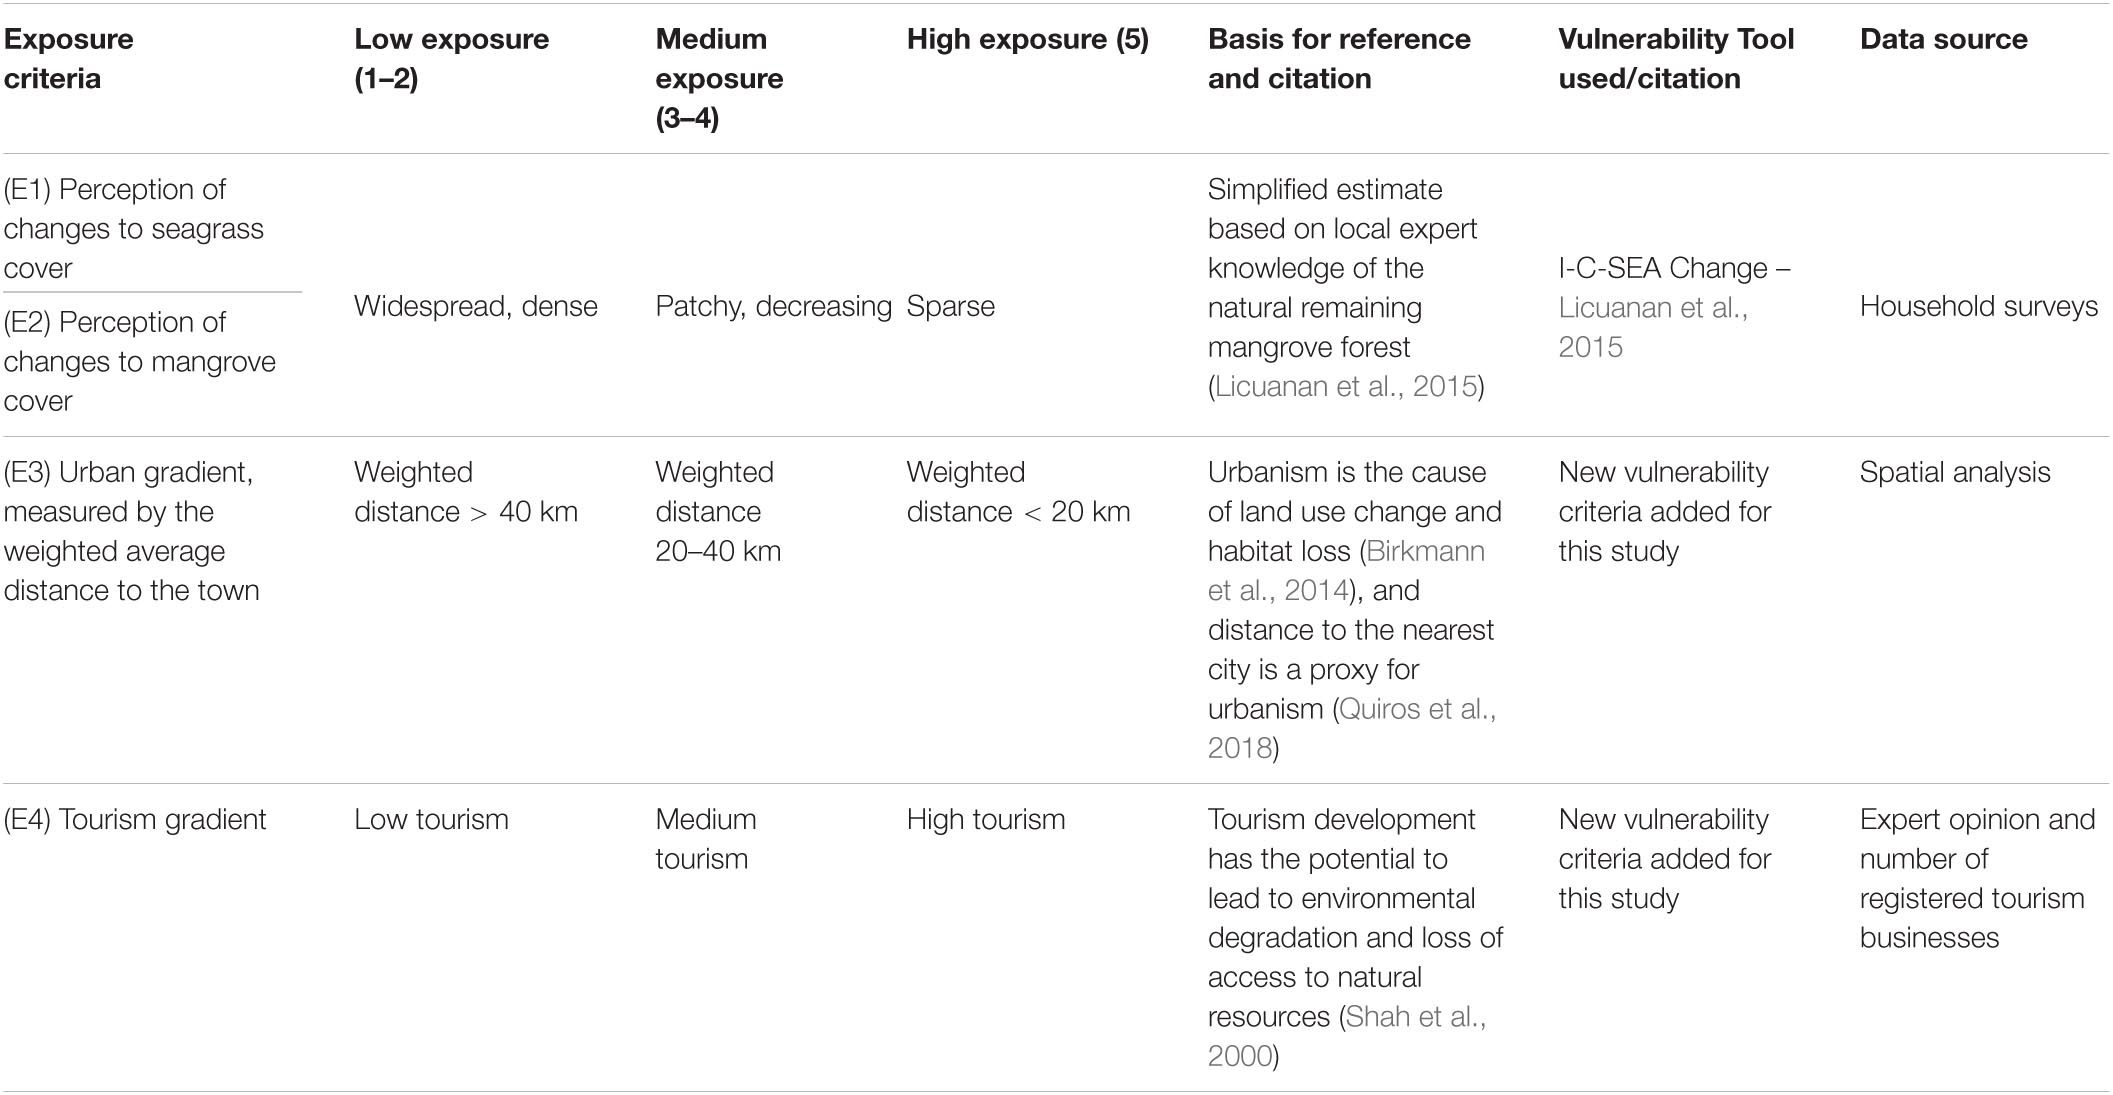
Table 1. Exposure criteria.
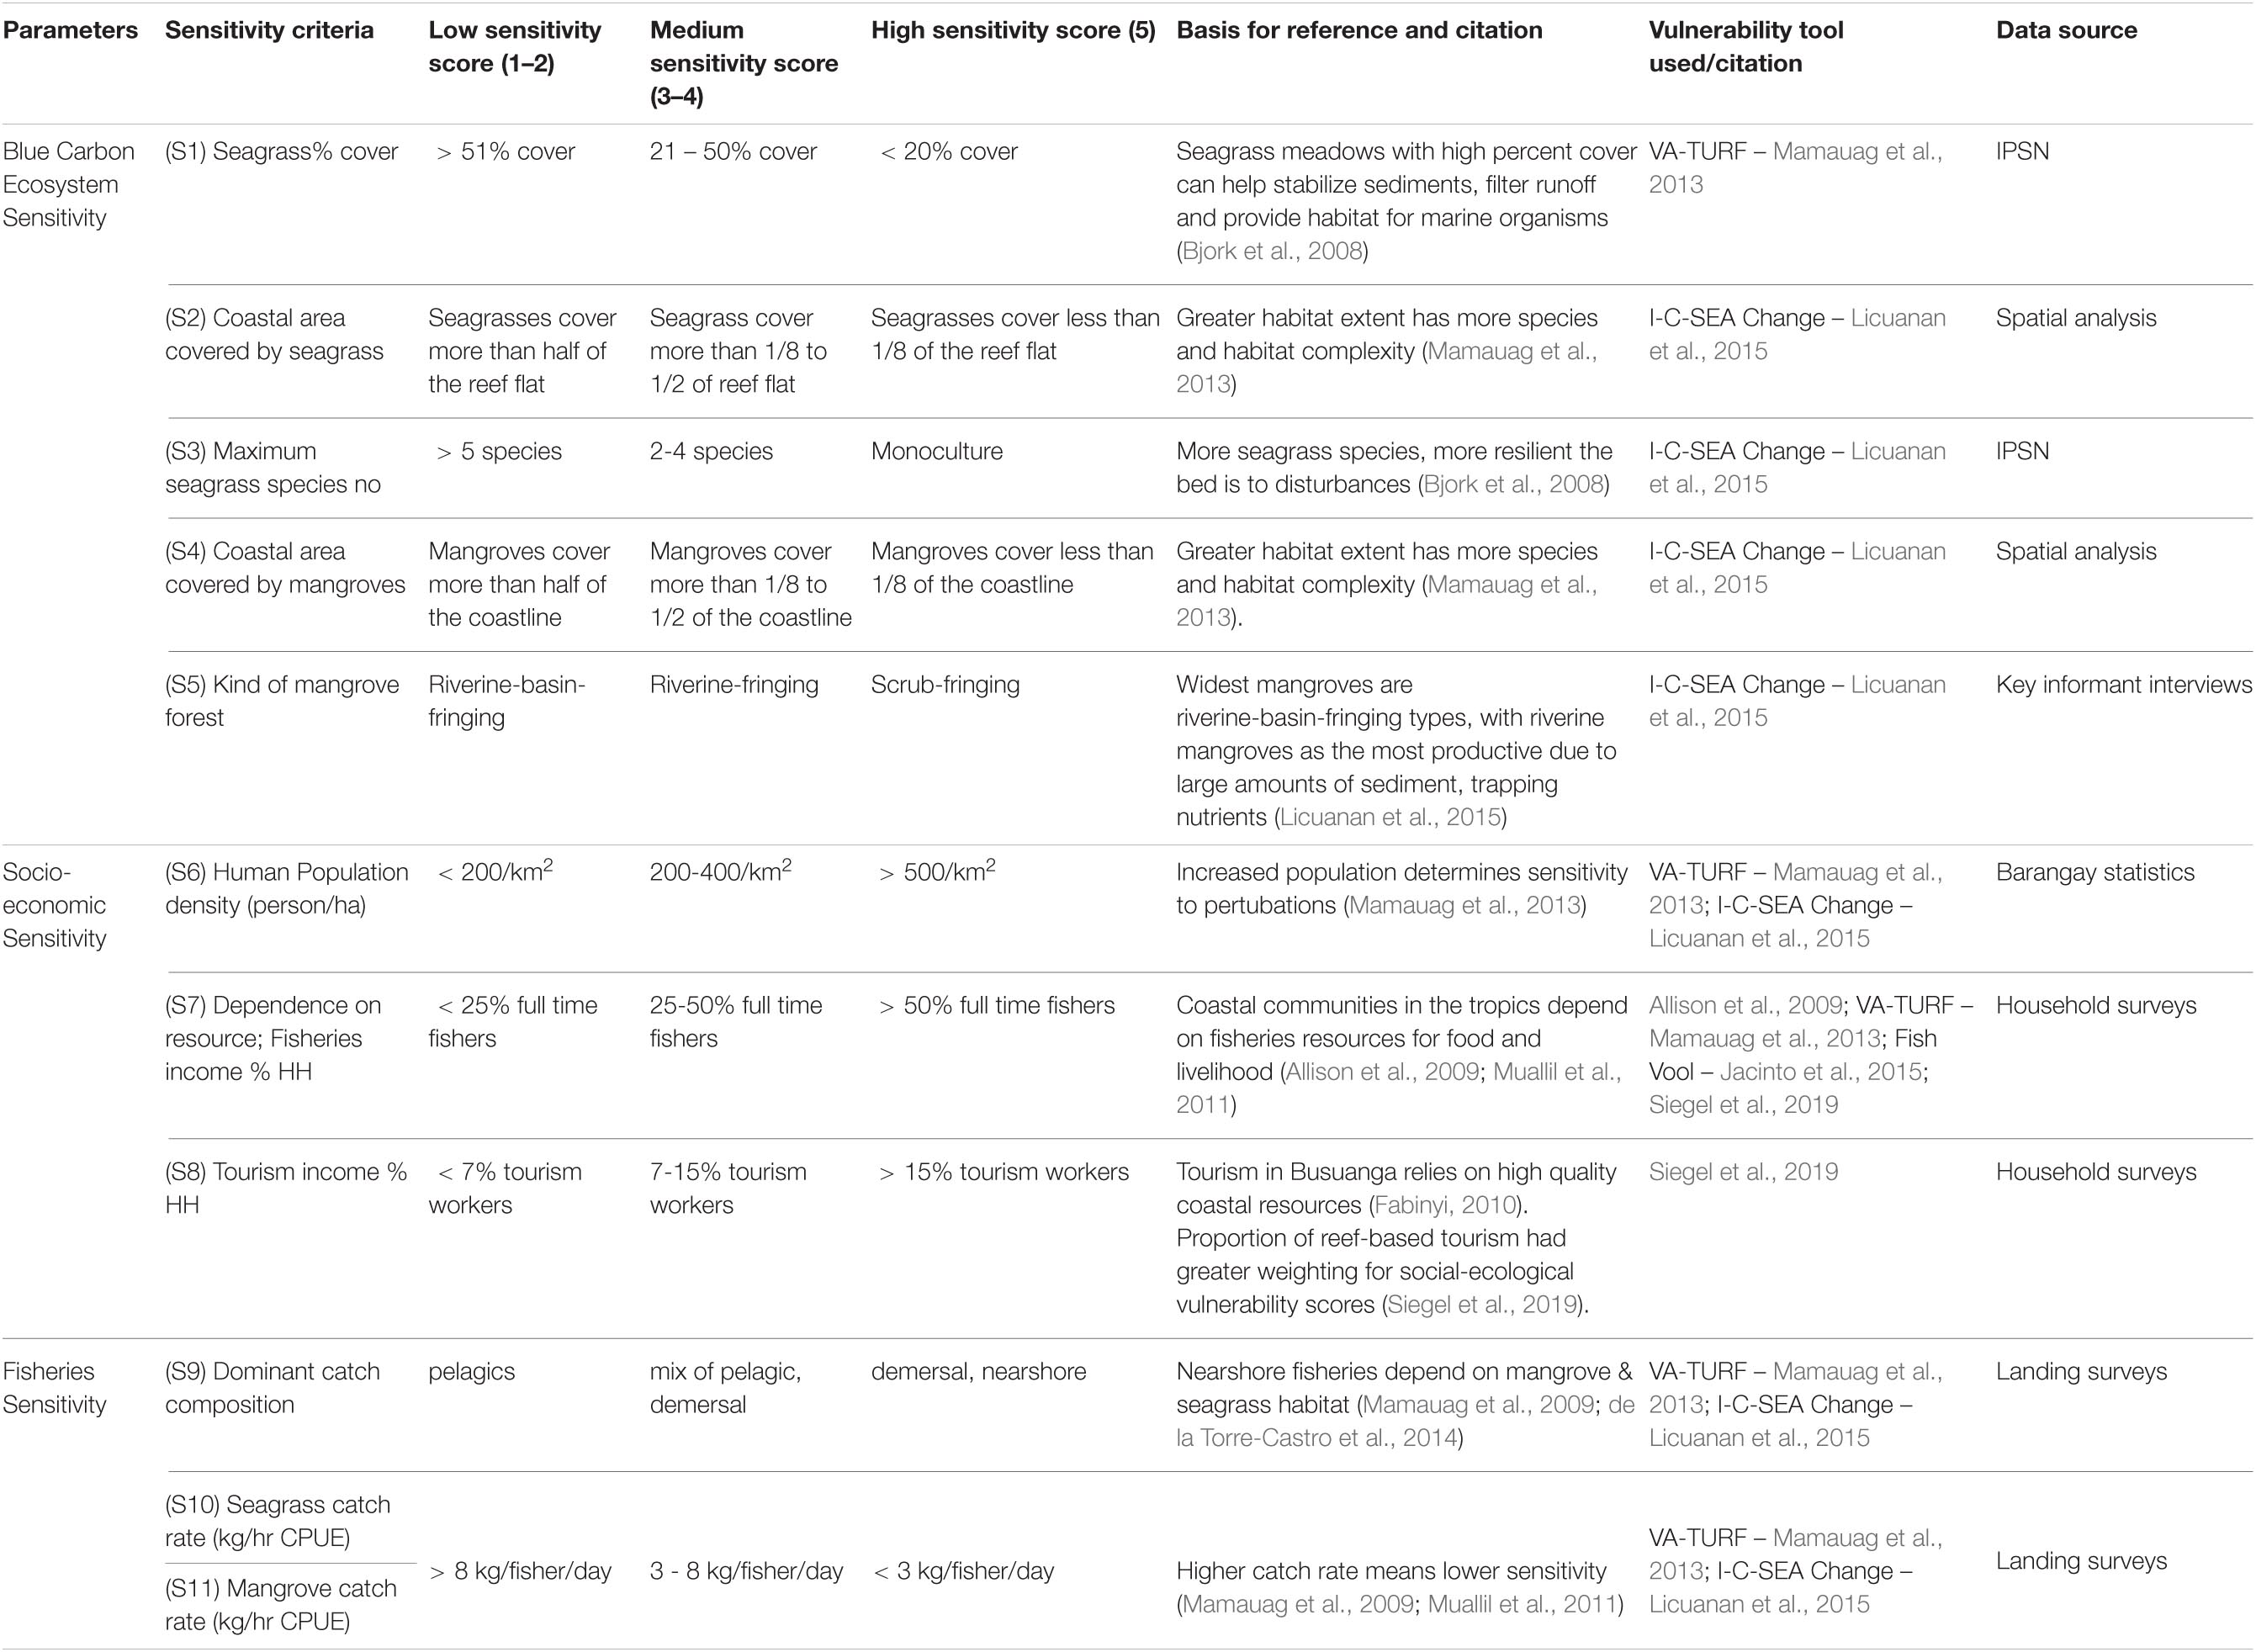
Table 2. Sensitivity criteria.
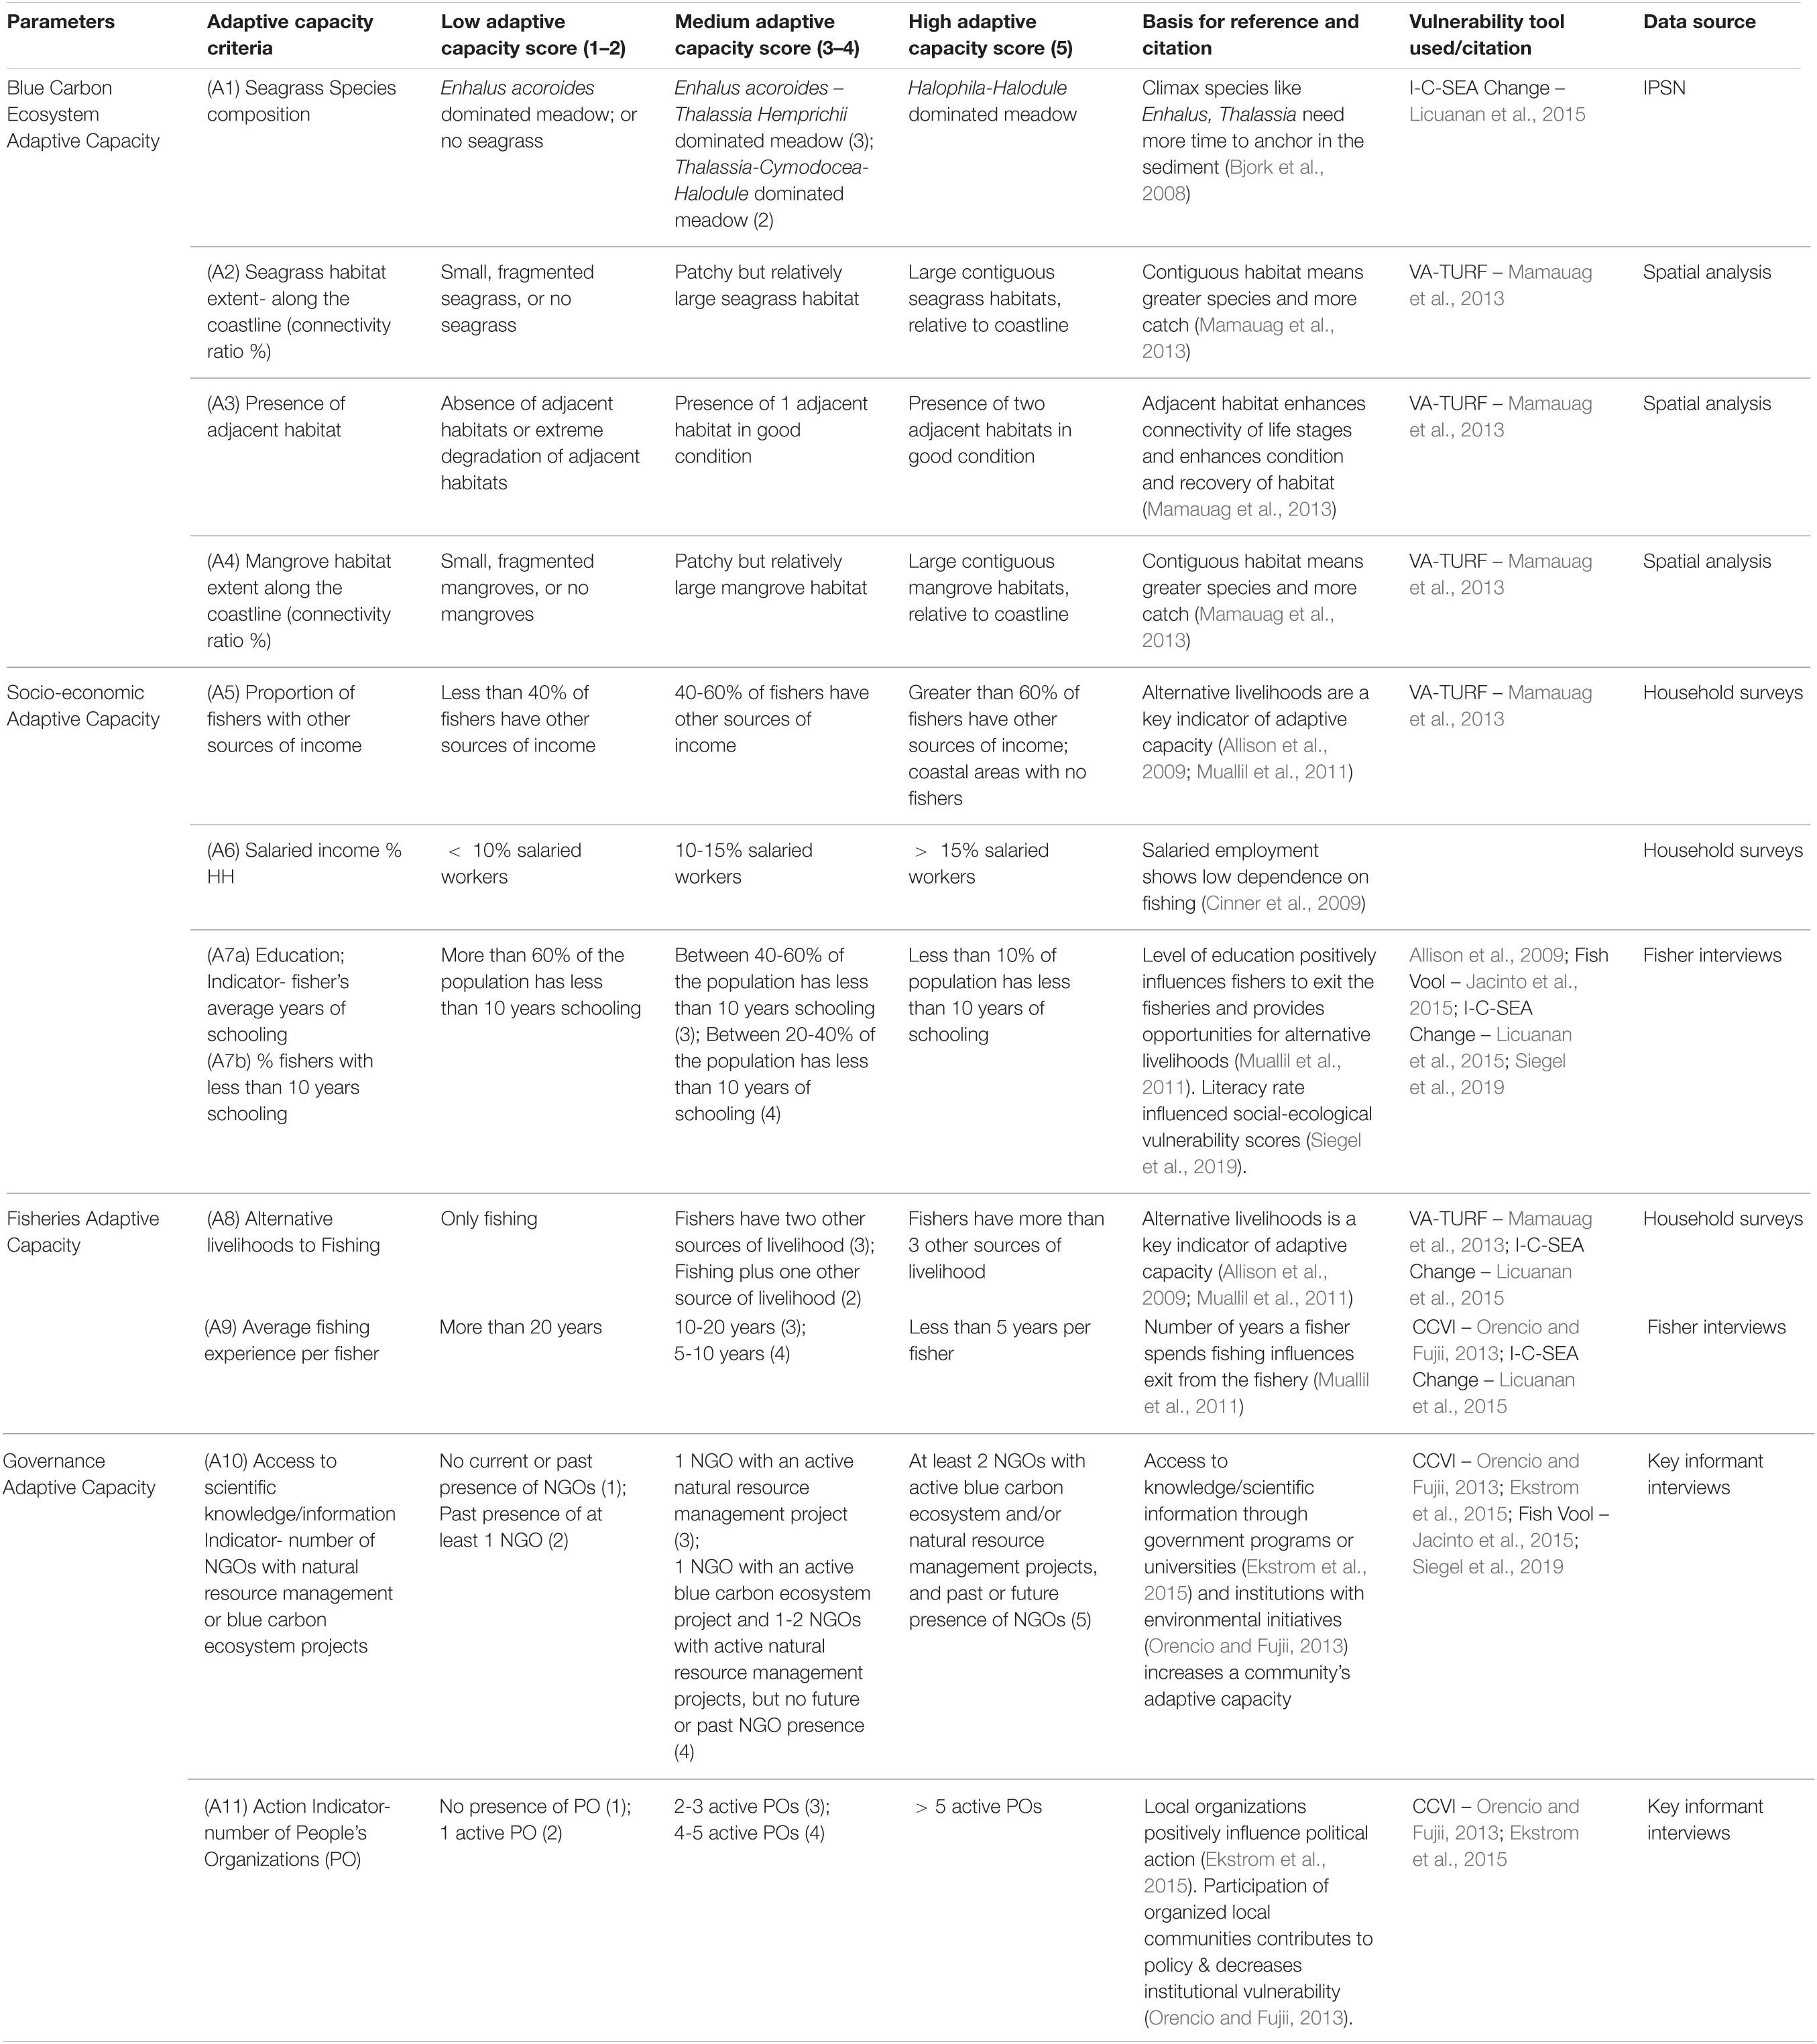
Table 3. Adaptive capacity criteria.
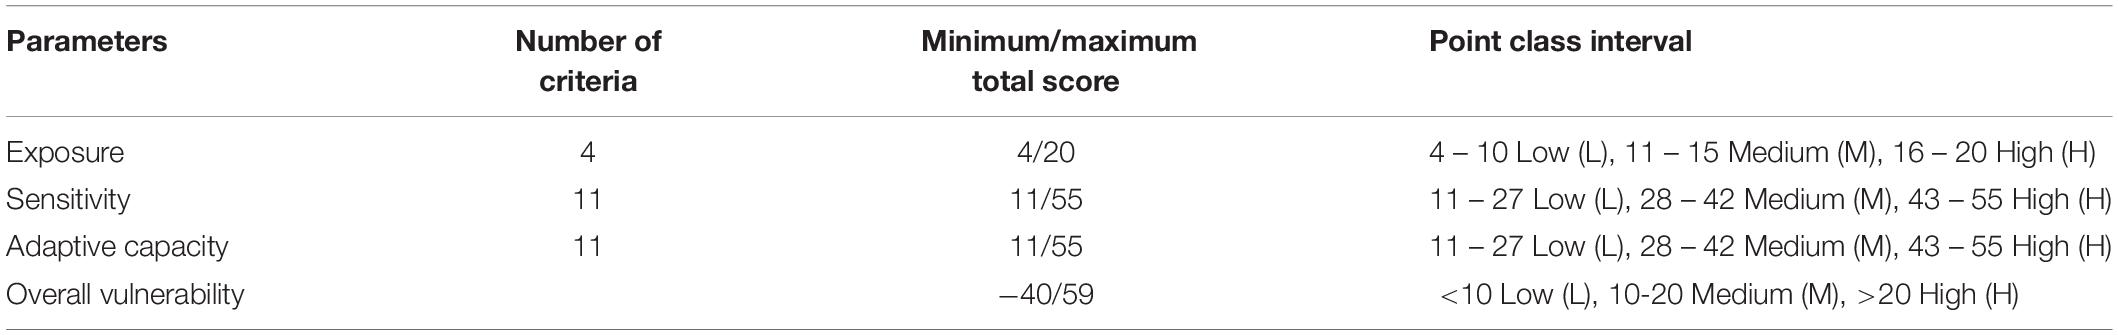
Table 4. Ranking classification for vulnerability parameters, adapted from Jacinto et al. (2015).
We gathered field data and engaged in participant observation between February 2019 and October 2020 in 10 barangays in Busuanga Island, Palawan Province in the Philippines.
Exposure to Threats
We define Exposure as actual and perceived threats that result in the loss or degradation of blue carbon ecosystems (Table 1, Figure 2). We gathered qualitative data from fishers’ perceptions to assess the exposure of environmental resources (i.e., coastal ecosystems and fishing grounds) to threats (i.e., land use changes due to development) (Jacinto et al., 2015) and context specific socio-economic criteria (Quiros et al., 2018). Threats to blue carbon ecosystems in Coron are due to illegal and unsustainable forest practices, illegal cutting of mangroves, changes in land use, and improper waste disposal (Abrenica et al., 2013). In Busaunga, the major threats are unsustainable agricultural and forest practices, timber poaching, and conflicting knowledge about marine protected areas (Bautista et al., 2017). Coastal development has a significant negative impact on seagrass condition (Quiros et al., 2017), while it is the biggest threat to mangroves (Spalding et al., 2010).
Socio-economic context influences a barangay’s exposure (Quiros et al., 2018). For the first Exposure variable, a weighted distance to the towns (Table 1 and Supplementary Table 3) is a proxy for urbanism (Birkmann et al., 2014; Quiros et al., 2018). We used the distance to Coron, the major town of Busuanga Island and the capital of the Coron municipality, and the distance to Salvacion, the capital of Busuanga municipality for this calculation.
The second Exposure variable is the presence of tourism defined by combining expert opinion and counting the number of registered establishments from the Coron Tourism Office (Table 1 and Supplementary Table 3). Many development initiatives, road building and land conversion projects are due to tourism development, which in some cases leads to environmental degradation and loss of access to natural resources (Shah et al., 2000).
The third and fourth Exposure variables use qualitative data from household surveys about the perceived condition of blue carbon ecosystems, rating seagrass and mangroves separately on a 5-point scale (low, medium, high exposure). Low exposure of blue carbon ecosystems is defined as widespread, dense coverage, medium exposure is patchy and/or decreasing coverage, and high exposure is sparse coverage (Table 1 and Supplementary Table 3).
We choose not to include physical variables like wave exposure, temperature, or sea level height as Exposure variables because these physical stressors operated at spatial scales larger than the barangay, and other studies found the same exposure level for adjacent barangays (Licuanan et al., 2015). Instead, we used local perceptions of mangrove and seagrass ecosystem condition as a basis to compare Exposure across different barangays, in addition to the socio-economic context of urbanism and tourism. The benefits of this type of analysis are to manage for the social vulnerabilities of individual barangays, while their Exposure to larger scale physical variables remains the same.
Sensitivity
Sensitivity variables fall under ecosystem, socio-economic and fisheries criteria (Figure 1 and Table 2). We collected field data and conducted spatial analysis on seagrass and mangrove fisheries and habitats separately, and for socio-economic variables, we obtained household interview data and barangay statistics.
Blue Carbon Ecosystem Sensitivity
To assess ecosystem sensitivity, we collected data on the quality and extent of blue carbon ecosystems. We conducted spatial analysis to estimate the coverage of mangroves and seagrasses along the coastline. We conducted field surveys of seagrass habitat and due to fieldwork constraints, we held key informant interviews to determine mangrove habitat categories.
As part of the Indo Pacific Seagrass Network (IPSN), we collected complete IPSN data for one of the barangays (Concepcion), then we simplified the IPSN methodology for the 9 other barangays, collecting only a subset of data needed for the vulnerability analysis. The IPSN methodology was carried out using SeagrassWatch methods, wherein three 50 m transects were laid out parallel to each other and perpendicular to the shore, and 25 m apart on each site. Seagrass percent cover was estimated at 5-meter intervals within 0.25 m2 quadrats along the transects (McKenzie and Campbell, 2002; Indo-Pacific Seagrass Network (IPSN), 2021). We collected seagrass species and percent cover data from within each quadrat.
Mangrove forest types have different ecosystem vulnerabilities with riverine mangroves, the least vulnerable and most productive due to high nutrient input and sediment trapping (McLeod and Salm, 2006). We categorized each mangrove forest using Licuanan et al. (2015) mangrove categories (Table 2). Seagrass meadows with high percent cover can help stabilize sediment, filter run-off and provide habitat for marine organisms. The more seagrass species a meadow has, the less sensitive and more resilient it is to disturbances due to a higher range of responses to change (Bjork et al., 2008).
Socio-Economic Sensitivity
We obtained barangay level population statistics for human population density (Abrenica et al., 2013; Bautista et al., 2017) and conducted household interviews (n = 30 per barangay) to assess dependence on blue carbon ecosystems (Pollnac and Crawford, 2000; Cinner et al., 2009; Quiros et al., 2018). We defined households by a group of people living in the same house and contributing income toward the household. We surveyed every fifth house along paved and unpaved roads and spoke to the head of the household present. If a house was empty, we skipped that house and moved to the next one.
Population density is an indicator of the pressure on natural resources evidenced by increases in fishing pressure (Licuanan et al., 2015) and tourism by increasing coastal development (Fabinyi, 2010). Since coastal communities in the tropics largely depend on fisheries resources for food and income (Allison et al., 2009; Muallil et al., 2011), we chose income sources from fisheries and tourism income as indicators of reliance on blue carbon ecosystems.
Fisheries Sensitivity
We used landing surveys to determine the dominant catch composition and the catch rate as measured by kilograms per fisher per day in seagrass and mangrove habitats, separately (Supplementary Table 1). For our classification, we used Licuanan et al. (2015) catch categories (Table 2). Catch associated with nearshore habitat is more sensitive to habitat degradation (i.e., habitat loss) than those found in the water column (Mamauag et al., 2009, 2013). Catch per unit effort is a proxy for standing biomass of fish stocks, with high standing biomass less sensitive (Mamauag et al., 2013).
We trained fisheries observers to collect seagrass and mangrove landing data at landing sites. We considered a single fisher landing as what arrived after a single fishing trip, from a boat or on foot. We recorded as many landings at each landing site as possible for each observation day unless the fisher did not agree to be interviewed. These landing forms recorded Barangay name, date, a generic gleaner ID number, gender of the fisher, their age, the weight of each catch item, location of where the catch was taken and time spent fishing (Supplementary Table 1).
Adaptive Capacity
Adaptive capacity variables fall within ecosystem, socio-economic, fisheries, and governance criteria (Table 3 and Figure 2). For fisheries, socio-economic, and governance criteria, we used household and fisher interviews, and barangay statistics, while for ecosystem criteria, we used field survey data and spatial analysis of seagrass and mangroves.
Blue Carbon Ecosystem Adaptive Capacity
To assess blue carbon ecosystem adaptive capacity, we determined habitat patchiness along the coastline and the presence of adjacent habitat. We conducted field surveys for seagrass species composition in specific beds in each barangay. Mangrove resilience and recovery potential are largely due to close their proximity and connectivity with neighboring stands of healthy mangroves (McLeod and Salm, 2006). Seagrass recovery potential is based on species’ life-history strategies, with climax species like Enhalus acoroides and Thalassia hemprichii growing slower because they need more time to anchor in the sediment (Bjork et al., 2008).
Socio-Economic Adaptive Capacity
To assess socio-economic adaptive capacity, we collected data from household interviews to ascertain the proportion of fishers with other sources of income and the proportion of households with salaried income. Households with salaried income have less reliance on fisheries resources (Cinner et al., 2009). We used fisher interviews to determine the level of schooling of fishers. The level of education positively influences fishers to exit the fisheries (Muallil et al., 2011), is positively related to more diverse livelihood opportunities (Pauly, 1997), and literacy rate contributes to an islands’ social-ecological vulnerability score (Siegel et al., 2019).
Fisheries Adaptive Capacity
To assess blue carbon ecosystem fisheries adaptive capacity, we used household interviews to ascertain alternative livelihoods to fishing, and used fisher interviews to obtain the average years fishing experience per fisher. Alternative livelihoods are a key indicator of adaptive capacity (Allison et al., 2009; Muallil et al., 2011).
Governance Adaptive Capacity
For governance criteria, we conducted key informant interviews to get data on access to scientific knowledge and community-level organization. Access to scientific knowledge was measured by the presence of an active NGO project. Greater weight was given to projects working specifically with blue carbon ecosystems versus more general natural resource management. Access to scientific information through government programs or universities affects adaptive capacity (Ekstrom et al., 2015), as do institutions with environmental initiatives (Orencio and Fujii, 2013). We determined community-level action by counting the number of active People’s Organizations (POs). Local organizations influences potential political action (Ekstrom et al., 2015), and organization and participation in action within communities works to reduce policy & institutional vulnerability (Orencio and Fujii, 2013).
Spatial Analysis
We limited our spatial analysis of seagrass and mangroves within the boundaries of the 10 barangays in Busuanga Island. We used Barangay boundaries from the latest Environmentally Critical Areas Network (ECAN) reports (Abrenica et al., 2013; Bautista et al., 2017), but when they did not overlap with the mapped barangay boundaries from household interviews, we adjusted the barangay boundaries to encompass the individual households surveyed.
Busuanga Island has two municipal capitals, Coron and Salvacion, which correspond to the municipalities of Coron and Busuanga, respectively. To calculate the impact of urban centers on each of the 10 barangays, we calculated the weighted average distance to the nearest municipal capital, using human population as the weighted measure. Urban living increases Exposure due to overcrowded living conditions, lack of services for adequate housing, nutrition and healthcare (Baker, 2012). The population of Coron is projected at 18,883 (a) in 2020, while the population in Salvacion is projected at 3,639 (b) in 2020 (Abrenica et al., 2013; Bautista et al., 2017). To calculate the “weight” of each population center, we divided the population of that capital by the total population of both municipal capitals. Coron had a weight of 0.84 (a/(a + b)) while Salvacion had a weight of 0.16 (b/(a + b)). We then multiplied the distance from each barangay center to each municipal capital and its weight to get the weighted average distance. We calculated the distance between barangays and municipal capitals using the main transportation network roads.
To calculate the coastline covered by blue carbon ecosystems, we used a hybrid approach, using remotely sensed data, on the ground assessments and expert opinion. For mangrove cover, we used the Mangrove Vegetation Index (MVI), implemented in Google Earth Engine to create a mangrove extent map of the Philippines (Baloloy et al., 2020). For seagrass cover, we used a linear spectral unmixing method on Landsat 8 images, with pure spectra or endmembers from August to December 2019. To validate the remotely sensed seagrass images, we used ground assessments of seagrasses and expert opinion to increase the reliability of the maps, because accuracy depends on the environmental conditions of the study area (Veettil et al., 2020). We did not validate the mangrove coverage map because it was well validated with field data and drone images, with an accuracy ranging from 94% in Calauit Island, to 96% in Binguan, Coron and 100% in Sagrada and Bugtong, Busuanga (Baloloy et al., 2020).
To calculate the proportion of mangroves covering each barangay’s coastline, we overlaid Busuanga’s MVI map on the Philippine Barangay boundary map and calculated the length of coastline with mangroves (considering a 100-m buffer distance) using ArcGIS 10.7.1. We divided the length of the mangrove forest by the total length of each barangay’s coastline to get a proportion of mangroves covering the coastline. This approach however ignores the width and hence the area, for simplicity.
To calculate the proportion of seagrass covering the reef flat, we obtained the coral reef base layer from UNEP (UNEP-WCMC et al., 2018) and overlaid it with the validated seagrass map. To calculate the proportion of the reef flat (area covered by the coral reef) covered by seagrasses, we divided the seagrass area in each barangay by the reef flat area.
To calculate the patchiness versus connectivity of seagrass and mangroves along the coastline, we created a continuous grid of 500-meter cells of mangrove forest and seagrass beds, averaging around 500 – 1000 meters from the coastline, with a maximum of 2.5 km from the coastline because some riverine mangrove forests were distributed inland. We used the focal statistics function of ArcGIS to calculate the contiguous area of 3 cells with seagrass or mangroves, separately. We divided the focal analysis score per barangay by the number of 500-meter cells covered by that barangay’s coastline to create a ratio of connectivity for seagrass and mangroves along the coast. We rated small, fragmented habitats with focal analysis ratios of less than 25% as patchy, ratios of between 25% and 60% as medium patchiness, and ratios greater than 60% as contiguous.
To calculate presence of adjacent habitat, the same 500-meter cells were assigned a connectivity score between zero and two, with one habitat (seagrass, mangrove or coral) found present in a cell, given a score of zero, two habitats (seagrass/mangrove, seagrass/coral or coral/mangrove), given a score of one, and all three habitats present, given a score of two. Like the patchiness ratio, we divided the total cells in that barangay’s grid by the cumulative connectivity score to get a connectivity score. We rated low connectivity as a score of less than 1, medium connectivity with a score between 1 and 1.5, and high connectivity if the score was greater than 1.5.
Results
Status of Blue Carbon Ecosystems
Mangroves covered greater than 50% of all barangay coastlines, while seagrasses covered around 50% and greater of barangays’ coastlines (Figure 2). Mangrove forests did not stay within barangay boundaries but extended beyond individual barangay coastlines into adjacent barangays. Patchiness of seagrass and mangrove habitat was low, with at least 40% of the coastline with contiguous habitat. Blue carbon ecosystems were relatively well-connected with adjacent habitat such as coral reefs and other mangroves and seagrasses. These results show that blue carbon ecosystems are relatively intact in Busuanga Island. Perceived conditions of seagrasses and mangroves varied, ranging from low exposure to high exposure of both habitats. The results of our spatial analysis (Figure 2) and household interviews concerning perceived condition of blue carbon ecosystems (Figure 3 and Supplementary Tables 3, 4) showed that in some locations, past blue carbon ecosystems were more extensive than current conditions, with households referring to significant damage due to typhoon Yolanda/Haiyan in 2013.
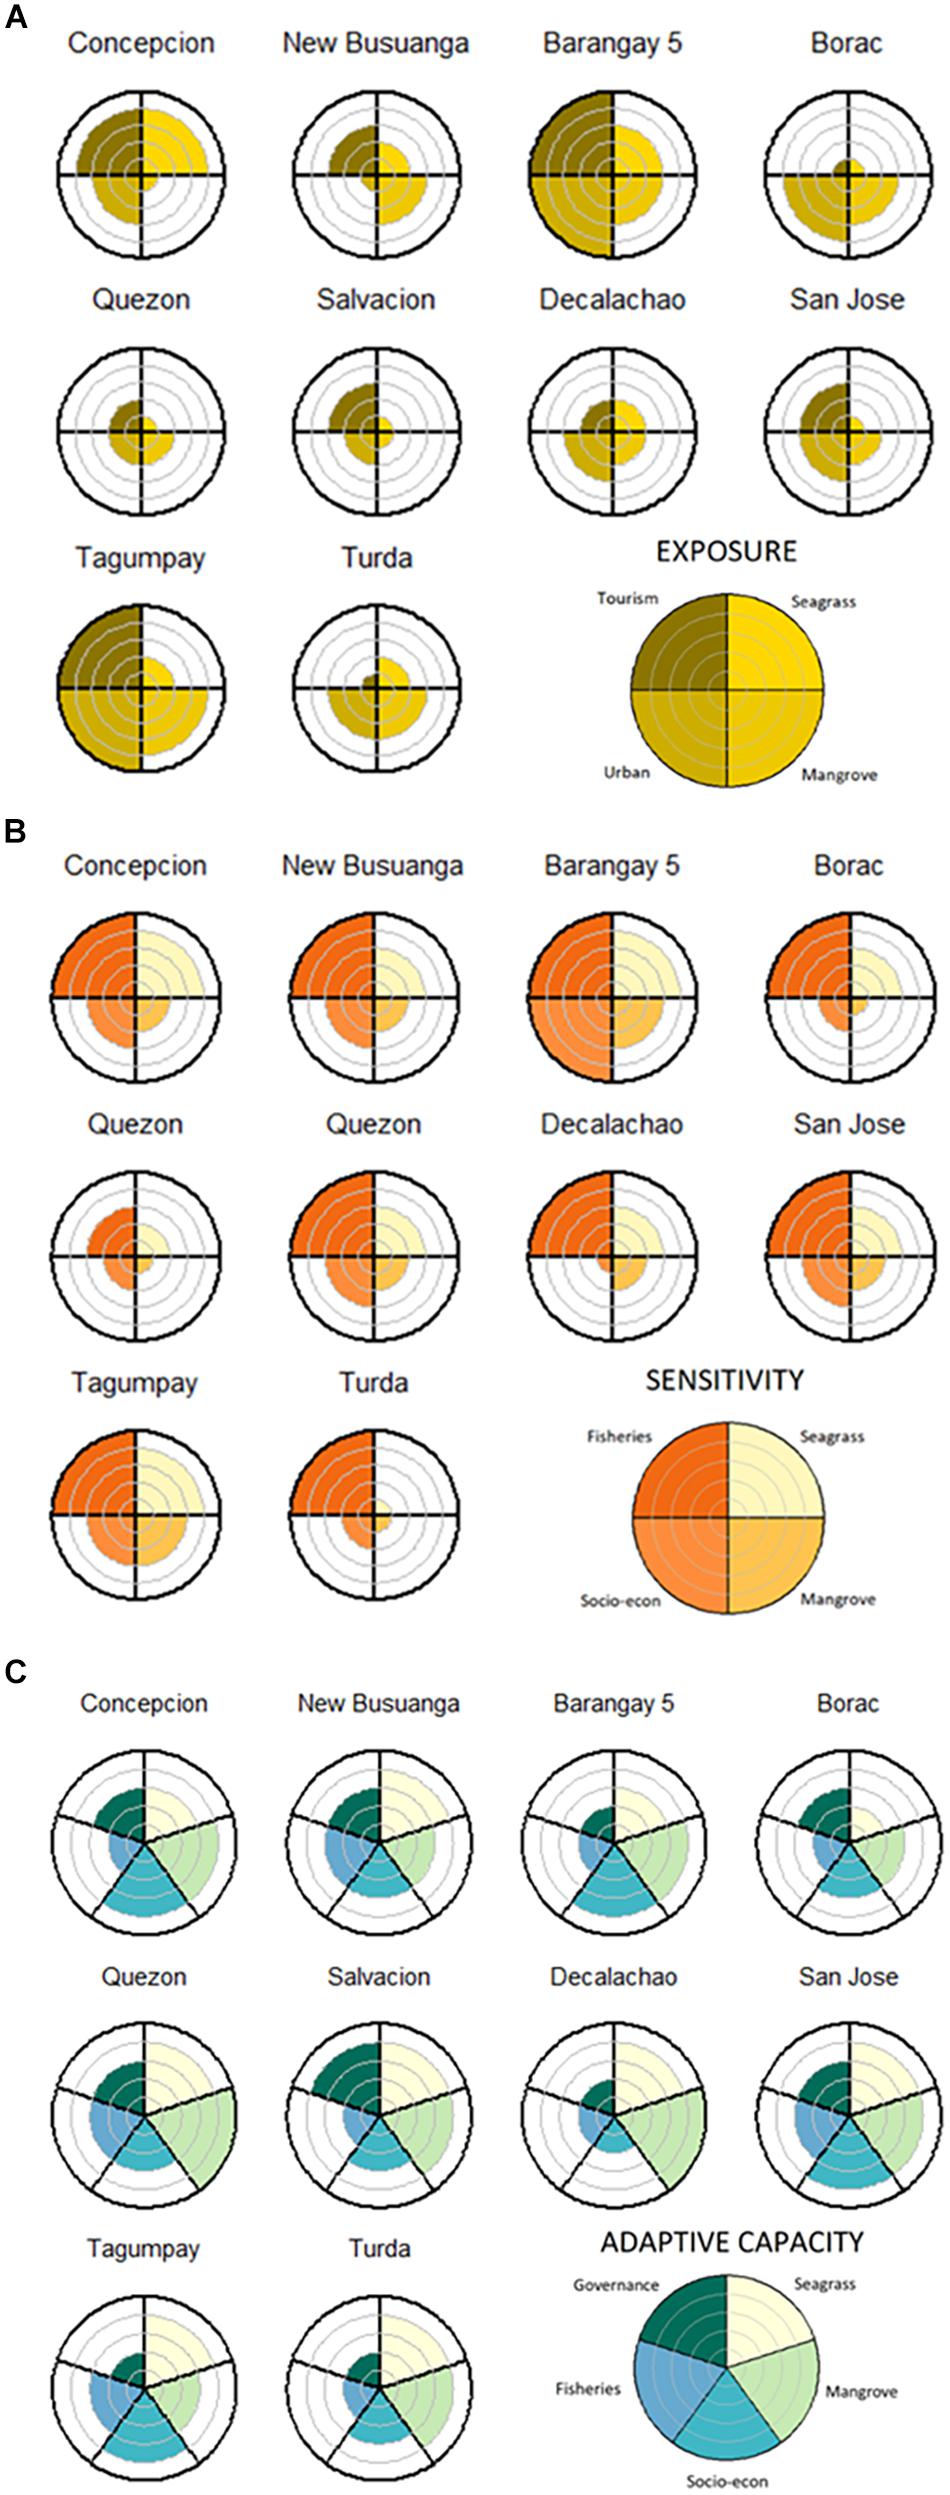
Figure 3. Radar plots showing cumulative scores of criteria scaled to values between 0 and 5, indicated by the gray concentric lines. Criteria are separated by black radial lines. (A) Exposure criteria: (1) Perception of changes to seagrass cover, (2) Perceptions of changes to mangrove cover, (3) Urban gradient, (4) Tourism gradient. (B) Sensitivity criteria (1) Seagrass Sensitivity (seagrass cover, seagrass species number, coastal area covered with seagrass), (2) Mangrove Sensitivity (coastal area covered with mangroves, mangrove forest type), (3) Socio-economic Sensitivity (fishing income, human population density, tourism income), (4) Fisheries Sensitivity (catch composition, seagrass catch rate, mangrove catch rate). (C) Adaptive Capacity criteria: (1) Seagrass Adaptive Capacity (seagrass species composition, seagrass habitat connectivity), (2) Mangrove Adaptive Capacity (presence of adjacent habitat, mangrove habitat connectivity), (3) Socio-economic Adaptive Capacity (fishers with other sources of income, salaried income, fisher education level), (4) Fisheries Adaptive Capacity (alternative livelihoods to fishing, average fishing experience), (5) Governance Adaptive Capacity (non-governmental organizations, people’s organizations).
Exposure
Our exposure variables were based on the perceived condition of blue carbon ecosystems and the degree of indirect threats or perturbations from the socio-economic influence of urbanism and tourism. Peri-urban barangays in Busuanga are Salvacion and New Busuanga, and urban barangays in Coron are Barangay Poblacion, Barangays 1 through 6, and Tagumpay. Barangays with the greatest exposure were more urbanized and exposed to tourism (Barangay 5 and Tagumpay), while rural barangays and barangays with little or no tourism had less exposure (Quezon and Borac). Rural barangays influenced by tourism (Concepcion, New Busuanga and San Jose) had greater exposure than rural barangays that not influenced by tourism (Figures 3, 4, Table 5, and Supplementary Tables 3, 4, Figure 5A).
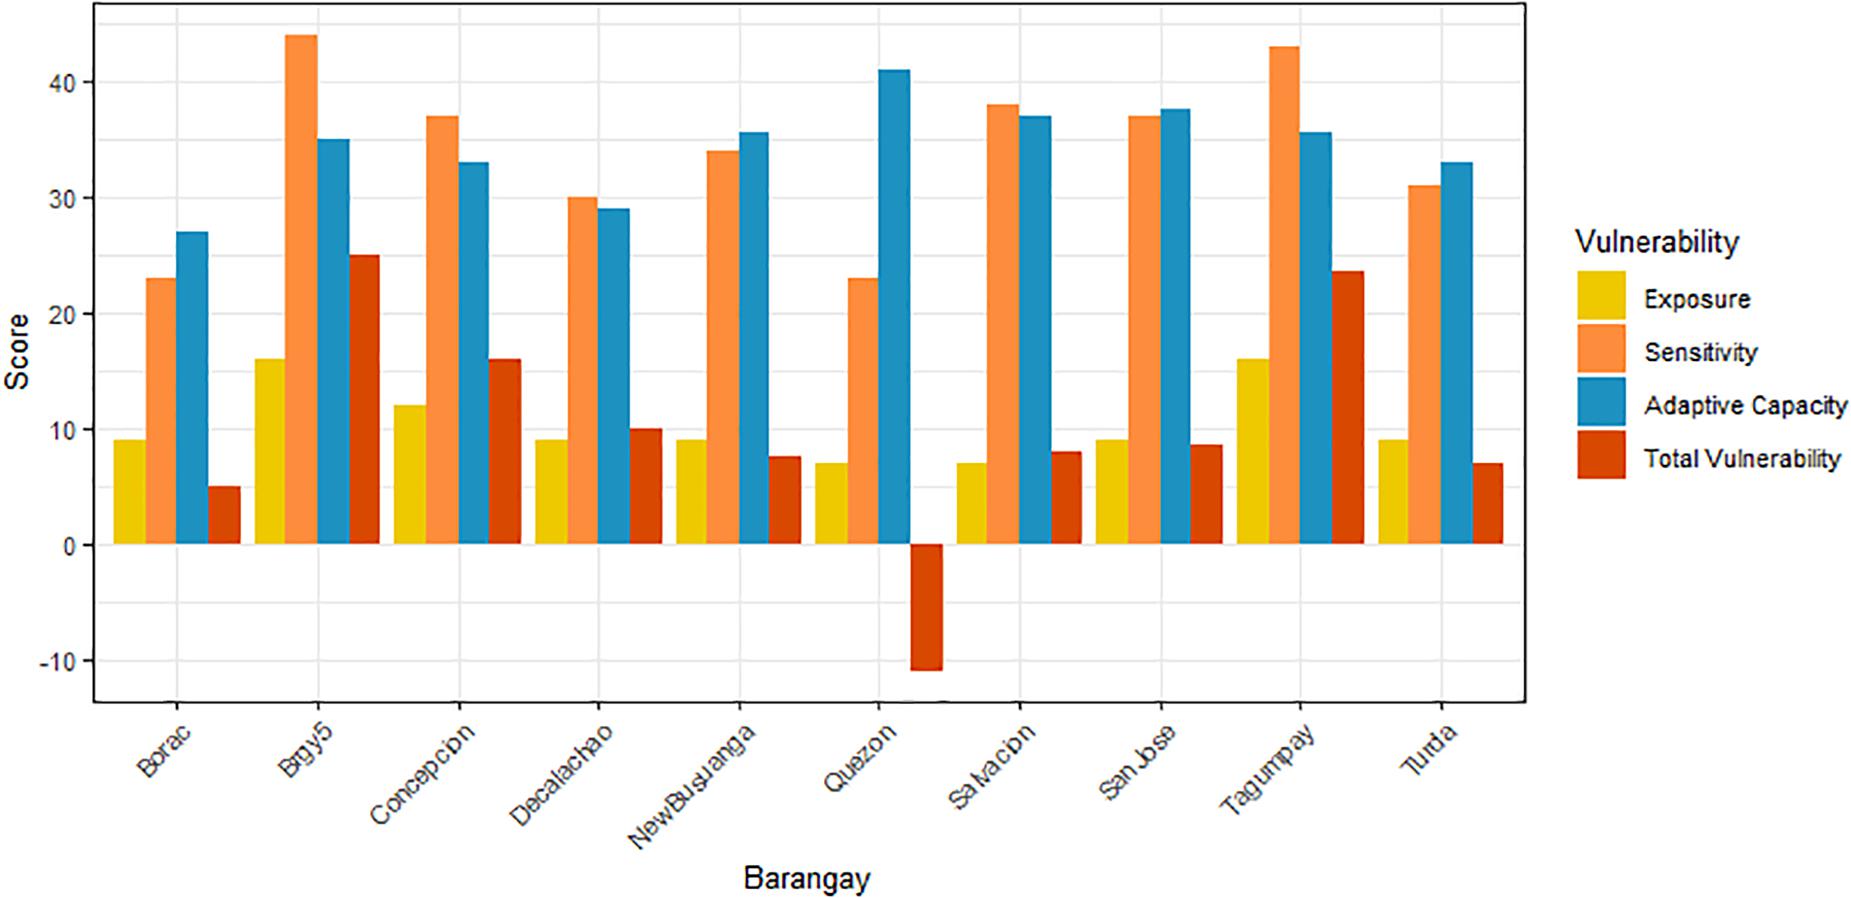
Figure 4. Bar plots showing the sum of all scores for Exposure (E), Sensitivity (S) and Adaptive Capacity (AC) criteria, and the total Vulnerability score (V = E + S-AC) in 10 barangays. The 10 barangays include in the Municipality of Busuanga: Quezon, Concepcion, Salvacion, New Busuanga, in the Municipality of Coron: San Jose, Decalachao, Turda, Borac, Tagumpay, Barangay 5.
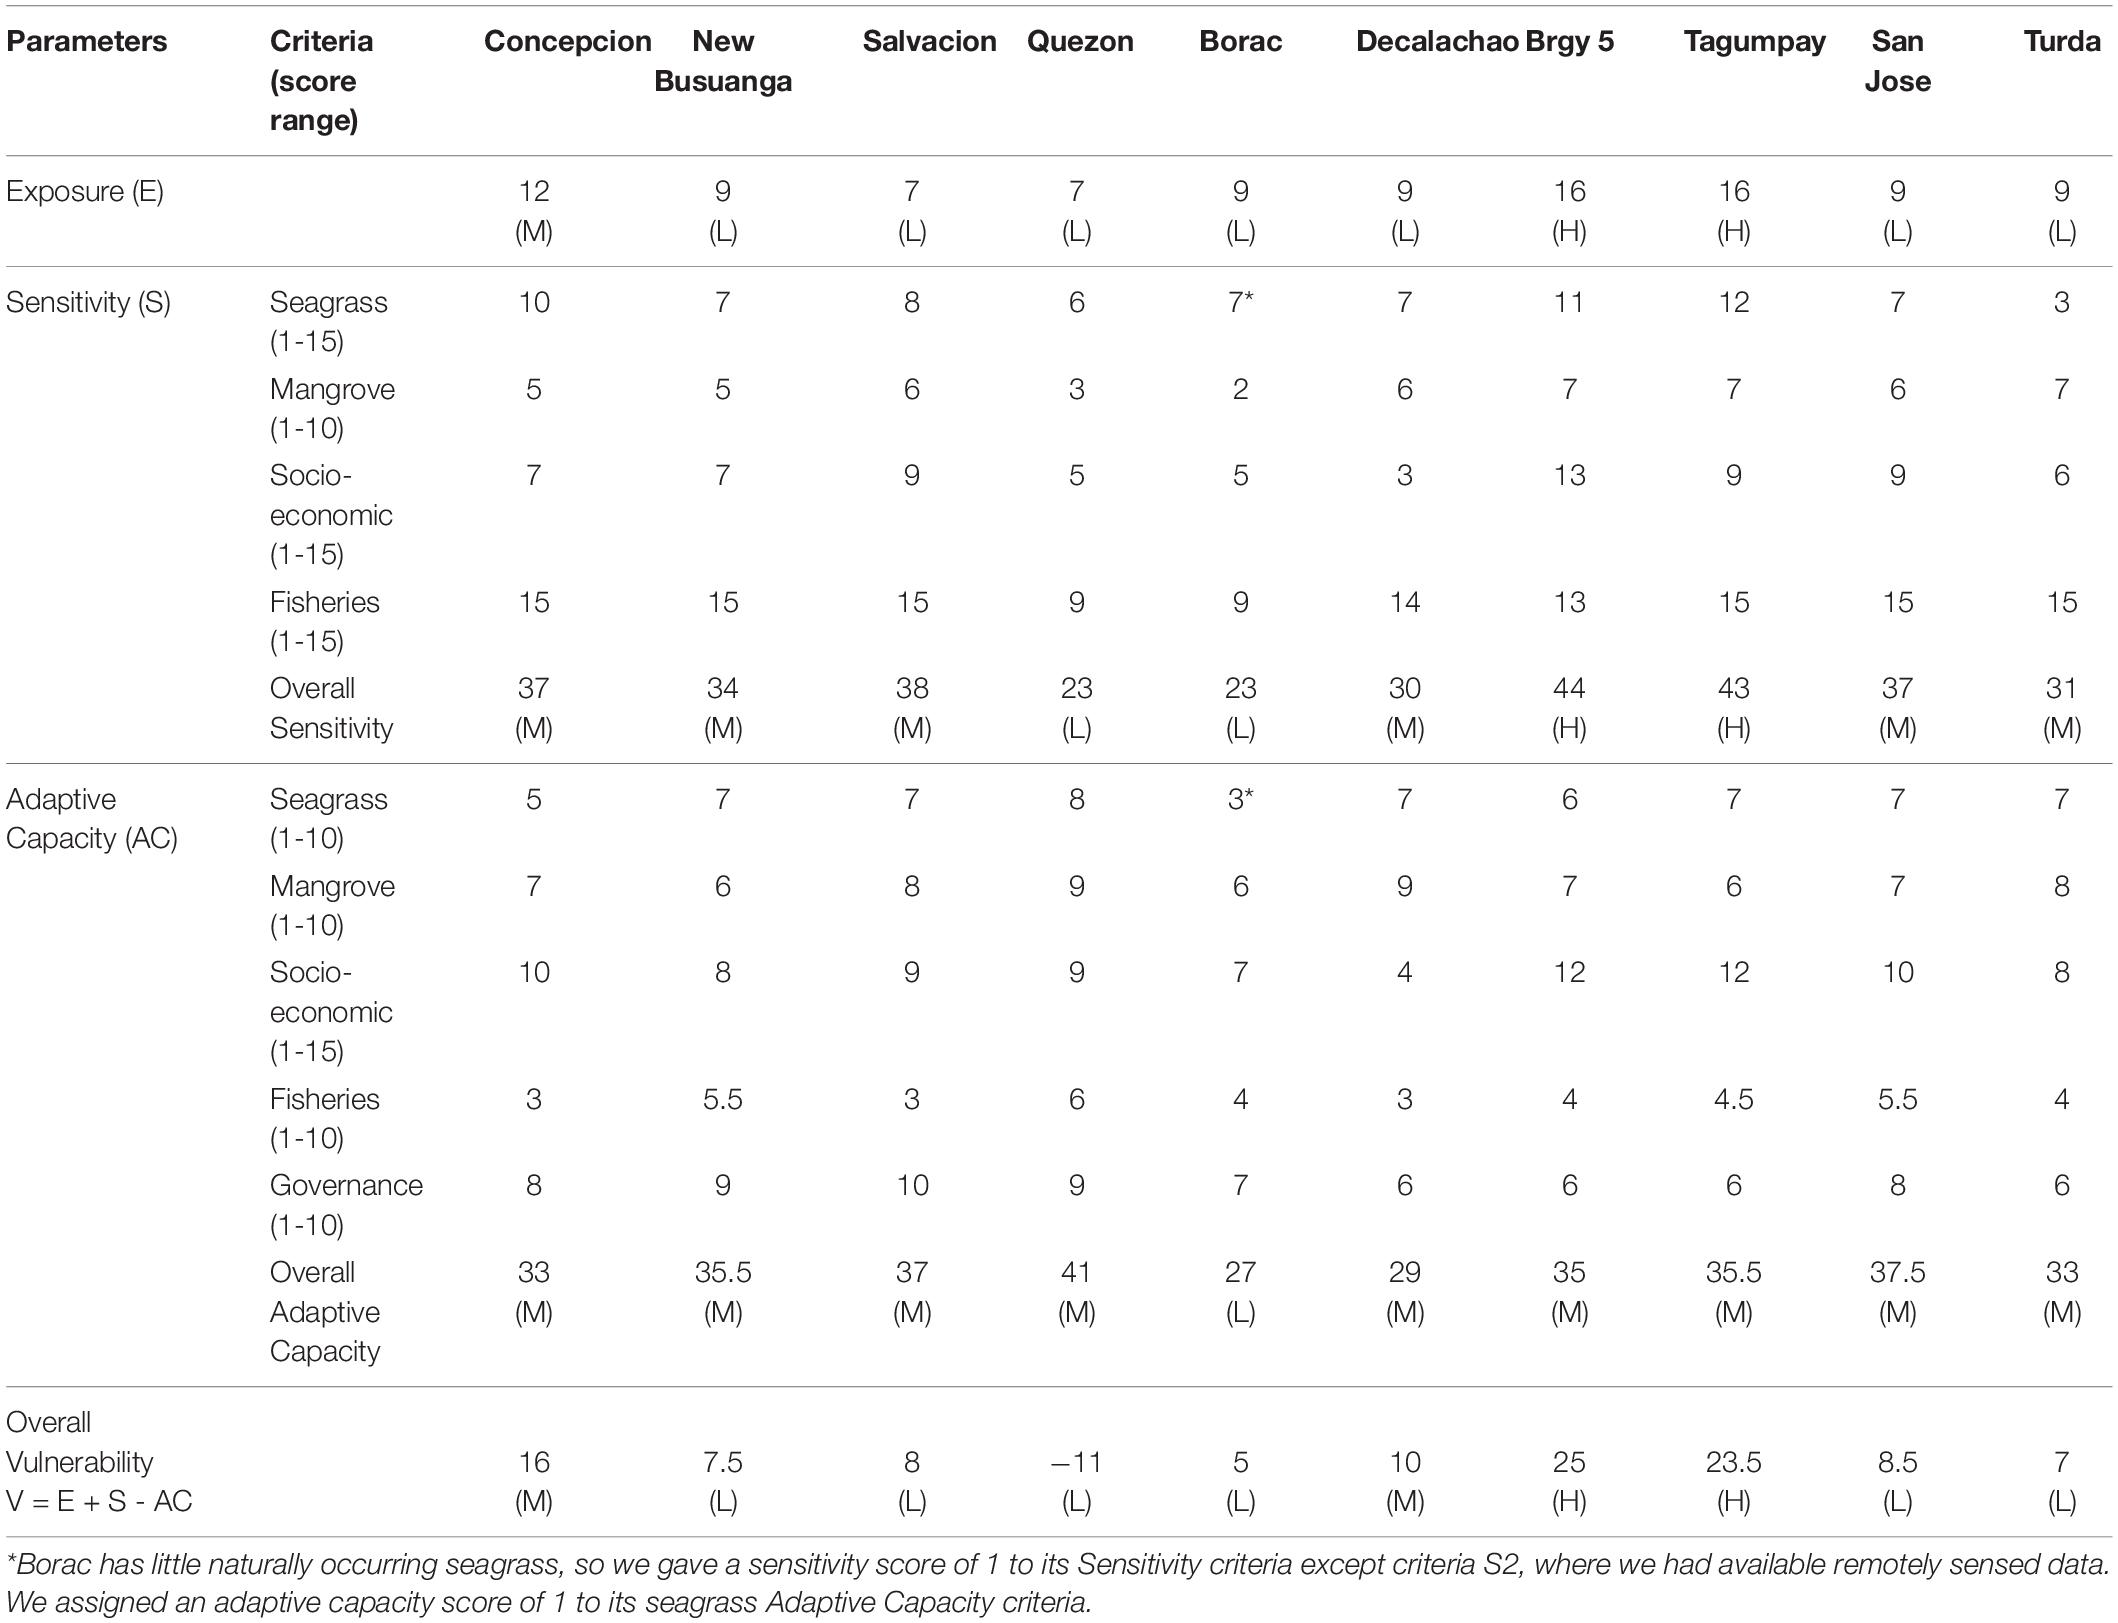
Table 5. Raw vulnerability scores, summed for each criteria, ranked using Table 4 with low (L), medium (M) and high (H) scores.
Sensitivity
The most sensitive barangays were urban barangays Barangay 5 and Tagumpay, and the least sensitive was rural barangay Quezon. Borac, Turda and Quezon had lower blue carbon ecosystem sensitivity than Barangay 5, Tagumpay and Concepcion. Quezon had lower fisheries and socio-economic sensitivity than the other barangays. Barangays with high sensitivities had coastal fringing mangroves, seagrass beds with low seagrass cover, reliance on nearshore seagrass and mangrove fisheries catch, and more tourism income. Barangays with low sensitivities had extensive seagrass and mangroves along their coastlines, low human population density and alternative incomes to fishing (Table 5, Figures 3, 4 and Supplementary Table 5, 6, Figure 5B).
Blue carbon ecosystem sensitivity was medium to high due to relatively low seagrass percent cover in some barangays and the presence of scrub-fringing mangroves, which is the mangrove forest type more sensitive to changes. Seagrass sensitivity was higher in monocultures and lower in multi-species seagrass meadows. Urban barangays like Barangay 5 and Tagumpay had higher seagrass sensitivity due to degraded seagrass habitat. Rural barangays like Quezon and Turda had less seagrass sensitivity due to high seagrass percent cover and diverse seagrass species present (Figure 3 and Supplementary Tables 5, 6, Figures 1A, 3B).
Mangrove sensitivity was defined by mangrove forest type with scrub-fringing mangroves, the most sensitive but also the most common mangrove forest type found in Salvacion, Barangay 5, Tagumpay and Turda. Rural barangays like Concepcion, New Busuanga, Quezon and Borac had less mangrove sensitivity because they were dominated by riverine-basin-fringing forests, the least sensitive mangrove forest type. The mangrove types with medium sensitivity were the riverine-fringing and scrub fringing mangroves found in Decalachao and San Jose (Figure 3 and Supplementary Tables 5, 6, Figures 1A, 3B).
Socio-economic sensitivity was medium for most barangays. The exceptions were due to greater reliance on tourism income and greater population densities in urbanized barangays. The rural barangay, San Jose also had high socio-economic sensitivity due to a greater reliance on tourism income. Socio-economic sensitivity ranged from a minimum sensitivity score of 3 for Decalachao, with low population density, low reliance on tourism income and low reliance on fisheries, to a maximum sensitivity score of 13 for Barangay 5, with high population density, high reliance on tourism income but low reliance on fisheries (Figure 3 and Supplementary Figures 1B, 3B, Tables 5, 6).
Blue carbon ecosystem fisheries are highly sensitive fisheries due to their nearshore catch composition and low catch per unit effort, with mangrove fisheries having a slightly lower sensitivity due to greater catch per unit effort. Fisheries sensitivity was high for all barangays except for Quezon, due to its high catch per unit effort for both seagrass and mangrove catch. Since there was minimal natural seagrass habitat in Borac and no seagrass fisheries, we assigned Borac’s seagrass fishery and seagrass species sensitivity variables with the lowest possible score, 1 (Figure 3 and Supplementary Figures 1B, 3B, Tables 5, 6).
Adaptive Capacity
The barangay with the greatest adaptive capacity was Quezon, while the barangays with the least adaptive capacity were Concepcion and Turda. Borac and Tagumpay had relatively lower blue carbon ecosystem and fisheries adaptive capacity than the rest of the barangays, while Barangay 5, Tagumpay and Decalachao had relatively lower socio-economic and governance adaptive capacity than the rest of the barangays. Barangays with low adaptive capacity did not have alternative livelihoods to fishing, had fishers with low education and a high average fishing experience per fisher. Barangays with high adaptive capacity had high connectivity between seagrass and mangrove patches, the presence of adjacent habitats, had fishers with other sources of income, and the presence of NGOs and POs (Table 5, Figures 3, 4, and Supplementary Tables 7, 8, and Figure 5C).
Mangrove adaptive capacity was higher than seagrass adaptive capacity (Supplementary Figure 4C). Mangrove adaptive capacity was medium to high due to medium to high connectivity of mangrove patches along the coast and the presence of adjacent habitat (Figure 4 and Supplementary Figures 2A, 3C, 4C). Seagrass adaptive capacity was low in Enhalus acoroides dominated meadows, and medium in mixed meadows with Enhalus-Thalassia dominated and Thalassia-Cymodocea-Halodule seagrasses. Seagrass adaptive capacity was medium to low, due to medium to low connectivity of seagrass patches along the reef flat and the predominance of Enhalus and Enhalus-Thalassia dominated seagrass beds, which are climax species and need more time to grow and recover from loss (Bjork et al., 2008). While Borac does not have a significant amount of naturally occurring seagrass, remote sensing analysis predicted a small patch of seagrass, so we were able to assign a low adaptive capacity score for Borac’s seagrass habitat extent (Figure 3 and Supplementary Figures 2A, 3C, 4C).
Each barangay’s socio-economic adaptive capacity was constrained by low fisher education (<10 years of education), but adaptive capacity increased with diversified livelihoods (Muallil et al., 2011; Licuanan et al., 2015) (Figure 3 and Supplementary Figures 2B, 3C, 4C). Among socio-economic variables, education had the lowest scores across all barangays (Supplementary Table 8). Decalachao had the lowest socio-economic adaptive capacity score because fishers did not have other sources of income besides fishing and had low education levels (Table 5 and Supplementary Table 8). We found a low proportion of households with salaried income in the urban barangays, Barangay 5 and Tagumpay. Rural barangays New Busuanga, Borac and Turda also had little or no households with salaried income (Figure 3 and Supplementary Figures 2B, 3C, 4C).
The fisheries sector variables had the lowest adaptive capacity due to high average fishing experience. However, the presence of alternative livelihoods to fishing helped to increase adaptive capacity. The exceptions were Concepcion and Decalachao, where fishers had few alternative livelihoods to fishing. Across all barangays, average fishing experience was high (>20 years of fishing experience) showing a low likelihood of exiting the fishery, therefore a lack of adaptive capacity (Figure 3 and Supplementary Figures 2A, 3C, 4C).
Governance adaptive capacity was medium due to the presence of NGOs and POs (especially for Concepcion, New Busuanga, and Salvacion), which increased the information available to communities and the capacity for community organization and action. The exceptions were the urban barangays of Barangay 5 and Tagumpay, and Turda because they had lower numbers of POs (Figure 3 and Supplementary Figures 2B, 3C).
Overall Vulnerability
Overall, rural barangays had less exposure and lower sensitivity to blue carbon ecosystem loss than urban barangays. Across all barangays, diversified livelihoods increased adaptive capacity. The barangays with the highest exposure and sensitivity were the urban barangays of Barangay 5 and Tagumpay, while the barangays with lowest exposure and sensitivity were rural Quezon and Borac. All barangays had medium overall adaptive capacity. The lowest overall vulnerability was Quezon, followed by Borac, and the highest overall vulnerabilities were Barangay 5 and Tagumpay (Table 5 and Figure 4).
Discussion
Overview
Our analyses revealed a range in coastal barangay social vulnerabilities, showing the complex relationship between blue carbon ecosystems and human communities, even within one island. We found that seagrass and mangrove ecosystems in Busuanga Island were relatively intact. This is a good sign for coastal communities in Busuanga.
The main factors contributing to community vulnerability in other contexts were food security factors, followed by economic/livelihood, policy and institutional factors (Orencio and Fujii, 2013). Our work differed from previous studies because it combined methodologies that were used to examine climate change vulnerabilities of fisheries (Mamauag et al., 2013; Licuanan et al., 2015) with an examination of social vulnerability (Cutter et al., 2008; Ekstrom et al., 2015; Quiros et al., 2018). While there are vulnerability studies on mangroves that combine environmental criteria with human management criteria, these focused mostly on physical processes (Ellison, 2015). Multi-criteria vulnerability studies on seagrass are scarce, with most focusing on environmental criteria (Waycott et al., 2007) or compiling expert knowledge from workshops (Grech et al., 2012; Tan et al., 2018). Our study is novel because it used vulnerability analysis on empirical data for both mangroves and seagrasses and human communities, highlighting these links in the social-ecological system.
Blue Carbon Ecosystem Vulnerability
Healthy blue carbon ecosystems can mitigate against social vulnerabilities in human communities by being less sensitive to threats and better able to recover from loss. Our spatial analysis revealed healthy blue carbon ecosystems, as measured by proportion of coastline covered, low patchiness and high continuity of mangroves along the coastline, the presence of adjacent habitat, and type of seagrass bed and mangrove forest present. Interestingly, mangrove fisheries occurred in both riverine-basin-fringing forests (least sensitive) as well as the scrub-fringing (most sensitive) mangrove forests. Certain mangrove forest types are more sensitive than others, and certain spatial contexts (low connectivity with other mangrove forest habitats and limited extent) result in more sensitive mangrove ecosystems. For sensitive mangroves like scrub-fringing mangroves or mangroves with low connectivity and low extent along the coastline, managers can impose risk averse policies such as limiting use by fishers and coastal developers.
Seagrass habitat sensitivity ranged from low to high, which is evidence that among blue carbon ecosystems in Busuanga, seagrasses were more vulnerable. Field collected data and local perceptions showed there were greater negative changes to seagrasses. Seagrass habitat percent cover within quadrats ranged from low (11% in Concepcion) to high (95% in Quezon). This data corroborated with local perceptions of changes to seagrass with 77% of Concepcion respondents saying seagrass in their barangay was patchy, and 80% of Quezon respondents saying seagrass in their barangay was widespread. While the link between tourism and urbanism’s effect on blue carbon ecosystems is indirect and our purpose was not to describe the mechanism, we must note that Concepcion is one of the barangays with growing tourism development and relatively close to a peri-urban town, Salvacion, while Quezon is a remote, rural barangay with very little tourism development (Quevedo et al., 2021). This is evidence of tourism’s indirect impact on seagrass ecosystems. Furthermore, threats in Busuanga such as unsustainable agricultural and forest practices (Bautista et al., 2017) also play a role in blue carbon ecosystem health, but we did not investigate this relationship.
Socio-Economic Vulnerability
Busuanga households diversified their income sources beyond fishing, increasing their adaptive capacity. They engaged in farming, tourism, construction, transportation and salaried employment including working for pearl farms, schools, the service industry and retail. Salaried jobs mitigate a barangay’s sensitivity to blue carbon ecosystem loss because salaried jobs do not rely on the health of the habitat, unlike tourism or fishing. One cause for concern was the low proportion of households with salaried income in the urban barangays, Barangay 5 and Tagumpay, which is opposite of what one may expect from an urban area, which should provide more reliable employment.
Education is a limiting criteria for socio-economic adaptive capacity. Poor educational attainment of fishers limits the livelihoods available to them in the future (Pauly, 1997). The rural barangays San Jose and Quezon do not have high schools. Residents attend high schools in neighboring barangays, making it more difficult to travel to school, especially during the rainy season with rough roads connecting barangays.
Tourism in Busuanga island is largely nature-based tourism, relying on healthy coastal ecosystems. With the degradation or loss of blue carbon ecosystems, the very base upon which Busuanga Island’s tourism relies on is endangered. Tourism is the leading source of livelihoods in Coron (Abrenica et al., 2013), while in Busuanga, access to tourism is a problem (Bautista et al., 2017). Quevedo et al. (2021) found greater perceived tourism benefits in urban versus rural dwellers; these benefits were moderate overall, with slightly positive socio-cultural impacts and slightly negative economic and environmental impacts. In general, urban barangays had greater reliance on tourism income and hence, greater sensitivity, but greater reliance on tourism was also found in the rural barangay San Jose. These findings show that sensitivities are not only based on the rural-urban gradient but also on other aspects of the socio-economic context, such as tourism development.
Fisheries Sector Vulnerability
Our research revealed the highly sensitive nature of the seagrass and mangrove fisheries sectors. Seagrass fisheries are very important for coastal communities as evidenced by the high participation in gleaning activities around the world (Cullen-Unsworth et al., 2014; Quiros et al., 2018; Nordlund et al., 2018; Unsworth et al., 2018). However, seagrass and mangrove fisheries are highly sensitive and inherently vulnerable fisheries due to their low catch per fisher per day (Mamauag et al., 2009; Muallil et al., 2011). Seagrass and mangrove fisheries are largely unregulated in Busuanga Island. While gleaners are required to register as fishers, most are not registered and since most do not use boats, their gleaning activities go unseen by natural resource managers. This is cause for concern because Siegel et al. (2019) found that fisheries regulations increase socio-economic adaptive capacity due to more environmental monitoring and adaptive management.
Another issue with blue carbon fisheries is the low catch rate, which is an indicator of fishing effort and fishing pressure (Licuanan et al., 2015) on the seagrass and mangrove ecosystems. A policy intervention is establishing equitable fisheries regulations for blue carbon ecosystem fisheries. An exception to the low catch rates was the Quezon mangrove fishery which relies on Quezon’s riverine-basin-fringing mangrove forest, which extends further west to Buluag’s extensive riverine-basin-fringing mangrove forest and is bordered to the north by the mangroves of Calauit Island. Quezon’s rich mangrove forest connected with the mangroves of neighboring barangays and islands provided the community with excellent catch.
Seagrass and mangrove fisheries have low adaptive capacity due to the high average fishing experience per fisher (Muallil et al., 2011). While more than 20 years fishing experience shows a decreased likelihood to exit the fishery (Muallil et al., 2011), we found that fishers exit the fishery when seagrass and mangrove habitat is degraded (Barangay 5 and Tagumpay), due to either low catch per unit effort or poor quality (“dirty”) catch. Fishers in these barangays reported completely leaving the fishery and only glean recreationally in distant islands where the habitat is not degraded. Alternative incomes in retail, tourism and construction are available to fishers in these urban barangays.
Vulnerability in Governance
Access to information and community organization help improve governance (Orencio and Fujii, 2013; Ekstrom et al., 2015). Busuanga island has a healthy mix of NGOs dedicated to blue carbon ecosystems and relatively abundant community organizations (POs). Notable exceptions with low NGO and POs presence were urban Barangay 5 and Tagumpay, and rural Turda. We suggest a policy intervention to establish NGO programs in these urban barangays for blue carbon ecosystem management, hopeful that ease of access to these areas will make starting projects possible. Establishing NGO programs in remote Turda, however, will be a challenge. Since POs are not as dependent as NGOs on outside influence and funding, capacity building to enhance PO activities can be led by local barangay officials in both urban and rural settings.
Overall Conclusion
The vulnerability framework allows us to address multiple SDGs simultaneously, such as alleviating poverty and hunger, while tackling environmental issues, specifically the sustainable management of marine and terrestrial resources. Lessons learned from this vulnerability analysis revealed that good education and governance, along with proper natural resource management are multiple paths to achieve SDGs. Our multi-faceted look at coastal communities supports the need for an integrated approach to reach SDGs by managing socio-economic and livelihood concerns while conserving biodiversity and ecosystems (Mironenko et al., 2015).
Fine-scale analyses of this kind are important because the results can assist policymakers in identifying specific factors that influence vulnerability in individual coastal barangays (Mamauag et al., 2013). In other words, certain criteria may consistently increase vulnerability in communities, and therefore, can be targeted by policy makers as “low hanging fruit.” One example are governance criteria, because in Busuanga Island, access to information (NGO presence) and organization by the community (PO presence) are open to interventions. Another intervention could be establishing a high school in each barangay, or providing reliable and equitable transportation (buses, road improvement) to neighboring barangays so children can have easier access to education beyond elementary school. A third intervention includes capacity building for equitable blue carbon ecosystem fisheries management.
Environmental factors, however, are not as easily open to interventions. The specific nature of blue carbon ecosystems, such as mangrove forest type or seagrass bed type, cannot be changed. Habitat types have inherent vulnerabilities, with some habitats having greater adaptive capacity (riverine mangrove forests or seagrass beds made of colonizing species). From our analysis, we suggest maintaining a portion of the coastline with intact habitat under protected area management to decrease sensitivity and increase adaptive capacity. We also suggest prioritizing sensitive mangrove habitat (scrub-fringing mangroves) under protected area management, managing fishing, and limiting tourism development in those habitats. Other interventions include mangrove conservation through planting and community-based mangrove forest management, blue carbon initiatives, and integrated coastal zone management (Carter et al., 2015; Song et al., 2021). A working example is the Busuanga Coastal Forest Project by the NGO, C3 Philippines, which rehabilitated and protected a total of 1,652.2 hectares of mangrove forests through successful community engagement in 2018.
Scaling up from community-level analyses with context-specific criteria, we can link local to global benefits. In Busuanga Island, Philippines, it appears that blue carbon ecosystems are healthy, and socio-economic conditions are medium, while the nearshore fisheries and governance criteria need improvement. It would be useful to compare the lessons learned in Busuanga to other sites in the coral triangle that may not have such healthy blue carbon ecosystems.
Overall, we found blue carbon ecosystem service provision depends on the socio-economic and environmental context. Reliance on blue carbon ecosystems for provisioning services occurred in both rural and urban settings, and diversified income across all sites has shown to be a pervasive and successful livelihood strategy. Since reliance on provisioning services of blue carbon ecosystems was ubiquitous across sites, maintaining healthy habitats are crucial to continuing these fisheries, but efforts must be made to negotiate equitable fisheries management. Using a vulnerability framework to compare coastal communities enabled us to find opportunities for potential conservation interventions that are applicable to local conditions.
Data Availability Statement
The original contributions presented in the study are included in the article/Supplementary Material, further inquiries can be directed to the corresponding author/s.
Author Contributions
TQ, MN, and KS designed the study. TQ analyzed the vulnerability data and wrote the manuscript. TQ, MN, RR, HG, and MS collected the data in the field. TQ, HG, and MS designed the landing surveys, fisher interviews and household surveys. HG and MS translated the surveys. KS analyzed the spatial data. ABa, ABl, AT, and KN provided the remote sensing data sets. MN, KS, RR, ABa, ABl, AT, and KN helped improve the manuscript. All authors contributed to the article and approved the submitted version.
Funding
Funding for this research came from the project entitled ‘The Project for Comprehensive Assessment and Conservation of Blue Carbon Ecosystems and their Services in the Coral Triangle (BlueCARES) funded by Japan International Cooperation Agency (JICA) and Japan Science and Technology Agency (JST) under the SATREPS Program.
Conflict of Interest
The authors declare that the research was conducted in the absence of any commercial or financial relationships that could be construed as a potential conflict of interest.
Publisher’s Note
All claims expressed in this article are solely those of the authors and do not necessarily represent those of their affiliated organizations, or those of the publisher, the editors and the reviewers. Any product that may be evaluated in this article, or claim that may be made by its manufacturer, is not guaranteed or endorsed by the publisher.
Acknowledgments
The authors thank field research assistants Gay Go, Joy Marie Jamilla, and Mikko Garcia of the University of the Philippines. C3 Philippine staff Roverose C. Chipotao and Crisander M. Bayos. Research assistants Rench Zeus Ramos, Chiawen Chiang, and Mariel B. Quiros. Field assistants from Busuanga Wilfred Salvacion, Joey Ormido, Baby Jane Villareal, Vincent Valera, Angel de los Angeles, and Dodong Castano. Key informants Tommy Bebing Cruz, Carlito Lopez, Vicky Hefti, Edgar Villareal, Erlito Labadan, Alan Tabale, Cliff Richard Astor, Jose Mazo, Marjorie Bayos and Roldan dela Cruz, The barangay captains, barangay tanods and kagawads of Concepcion, New Busuanga, Salvacion, Quezon, Borac, Decalachao, Barangay 5, Tagumpay, San Jose and Turda. Specifically, thank the following from Barangay Quezon: Annabelle Dela Cruz – Barangay Council, Geraldine Igbal, and Romulo Pabero – Boatman/community guide. Barangay Borac – Janette Tabale, Adonis Fernandez, Rosalie Vijar, Romely Diwan and Arnold Paculdas. Barangay Turda – Archee Razote and Marlo Razote – Boatman/community guide. Barangay New Busuanga – Adrian Mahinay and Grace Libarra. Barangay Concepcion – Purisima Tolentino and Dorcas Bareng. The Tourism Staff in Busuanga and Coron, the mayor of Busuanga, Elizabeth Cervantes and the mayor of Coron, Mario T. Reyes. We thank Minako Abe Ito and Martha Arciniega for assistance with the figures. This paper is dedicated to the memory of Francisco “Jun” Esplana, field assistant and advocate for blue carbon ecosystems of Busuanga.
Supplementary Material
The Supplementary Material for this article can be found online at: https://www.frontiersin.org/articles/10.3389/fmars.2021.671753/full#supplementary-material
References
Abrenica, M. A., Ilagan, G. A., Liuag, H. L., Napeñas, A., Tabion, R. A., and Tamina, R. C. (2013). Municipality of Coron ECAN Resource Management Plan 2017-2022. Available online at: https://pcsd.gov.ph/wp-content/uploads/2020/12/06.-Coron-ECAN-Resource-Management-Plan.pdf
Allison, E. H., Perry, A. L., Badjeck, M. C., Neil Adger, W., Brown, K., Conway, D., et al. (2009). Vulnerability of national economies to the impacts of climate change on fisheries. Fish Fish. 10, 173–196. doi: 10.1111/j.1467-2979.2008.00310.x Available online at: https://pcsd.gov.ph/wp-content/uploads/2020/12/06.-Coron-ECAN-Resource-Management-Plan.pdf
Arias-Ortiz, A., Serrano, O., Masqué, P., Lavery, P. S., Mueller, U., Kendrick, G. A., et al. (2018). A marine heatwave drives massive losses from the world’s largest seagrass carbon stocks. Nat. Clim. Change 8, 338–344. doi: 10.1038/s41558-018-0096-y
Baker, J. L. (ed.) (2012). Climate Change, Disaster Risk, and the Urban Poor, Cities Building Resilience for a Changing World. Washington, DC: The World Bank, 297.
Baloloy, A. B., Blanco, A. C., Raymund Rhommel, R. R. C., and Nadaoka, K. (2020). Development and application of a new mangrove vegetation index (MVI) for rapid and accurate mangrove mapping. ISPRS J. Photogramm. Remote Sens. 166, 95–117. doi: 10.1016/j.isprsjprs.2020.06.001
Barbier, E. B., Hacker, S. D., Kennedy, C., Koch, E. W., Stier, A. C., and Silliman, B. R. (2011). The value of estuarine and coastal ecosystem services. Ecol. Monogr. 81, 169–193. doi: 10.1890/10-1510.1
Bautista, M. A., Malolos, G. A., Magyaya, A., Palevino, M. L., and Suarez, M. (2017). Municipality of Busuanga ECAN Resource Management Plan 2017-2022. Partnership With Municipal Government of Busuanga, Municipal ECAN Board, Palawan Council for Sustainable Development. Available online at: https://pcsd.gov.ph/2020/12/11/07-busuanga-ecan-resource-management-plan/ (accessed December 24, 2020).
Beitl, C. M. (2015). Mobility in the mangroves: catch rates, daily decisions, and dynamics of artisanal fishing in a coastal commons. Appl. Geogr. 59, 98–106. doi: 10.1016/j.apgeog.2014.12.008
Béné, C., Arthur, R., Norbury, H., Allison, E. H., Beveridge, M., Bush, S., et al. (2016). Contribution of fisheries and aquaculture to food security and poverty reduction: assessing the current evidence. World Dev. 79, 177–196. doi: 10.1016/j.worlddev.2015.11.007
Berkes, F., Robin, M., McConney, P., Pollnac, R., and Pomeroy, R. (2001). Managing Small-Scale Fisheries-Alternative Directions and Methods. Ottawa: International Development Research Centre.Google Scholar.
Birkmann, J., Garschagen, M., Mucke, P., Schauder, A., Seibert, T., Welle, T., et al. (2014). World Risk Report 2014. Berlin: Institute for Environment and Human Security (UNU-EHS).
Bjork, M., Short, F., Mcleod, E., and Beer, S. (2008). Managing Seagrasses for Resilience to Climate Change. Gland: IUCN.
Blanco, A. C., Tamondong, A., Tagle, E., Fortes, M., and Nadaoka, K. (2014). “Change in seagrass fractional cover in Bolinao and Anda, Philippines derived from Landsat 2riori,” in 35th Asian Conference on Remote Sensing 2014, ACRS 2014: Sensing for Reintegration of Societies, Nay Pyi Taw.
Buckle, P., Marsh, G., and Smale, S. (2001). Assessment of Personal and Community Resilience and Vulnerability. Report: EMA Project 15/2000. Available online at: http://www.Radixonline.org/resources/assessment-of-personal-and-community-resilience.pdf. (accessed January 6, 2021).
Carter, H. N., Schmidt, S. W., and Hirons, A. C. (2015). An international assessment of mangrove management: incorporation in integrated coastal zone management. Diversity 7, 74–104. doi: 10.3390/d7020074
Cinner, J. E., McClanahan, T. R., Daw, T. M., Graham, N. A. J., Maina, J., Wilson, S. K., et al. (2009). Linking social and ecological systems to sustain coral reef fisheries. Curr. Biol. 19, 206–212. doi: 10.1016/j.cub.2008.11.055
Crooks, S., Orr, M., Emmer, I., von Unger, M., Brown, B., and Murdiyarso, D. (2014). Guiding Principles for Delivering Coastal Wetland Carbon Projects. Nairobi: UNEP and CIFOR, 57.
Cullen-Unsworth, L. C., Nordlund, L. M., Paddock, J., Baker, S., McKenzie, L. J., and Unsworth, R. K. F. (2014). Seagrass meadows globally as a coupled social-ecological system: implications for human wellbeing. Mar. Pollut. Bull. 83, 387–397. doi: 10.1016/j.marpolbul.2013.06.001
Cutter, S. L., Barnes, L., Berry, M., Burton, C., Evans, E., Tate, E., et al. (2008). A place-based model for understanding community resilience to natural disasters. Glob. Environ. Chang. 18, 598–606. doi: 10.1016/j.gloenvcha.2008.07.013
de la Torre-Castro, M., Di Carlo, G., and Jiddawi, N. S. (2014). Seagrass importance for a small-scale fishery in the tropics: the need for seascape management. Mar. Pollut. Bull. 83, 398–407. doi: 10.1016/j.marpolbul.2014.03.034
De La Torre-Castro, M., and Rönnbäck, P. (2004). Links between humans and seagrasses – An example from tropical East Africa. Ocean Coast. Manag. 47, 361–387. doi: 10.1016/j.ocecoaman.2004.07.005
Donato, D. C., Kauffman, J. B., Murdiyarso, D., Kurnianto, S., Stidham, M., and Kanninen, M. (2011). Mangroves among the most carbon-rich forests in the tropics. Nat. Geosci. 4, 293–297. doi: 10.1038/ngeo1123
Ekstrom, J. A., Suatoni, L., Cooley, S. R., Pendleton, L. H., Waldbusser, G. G., Cinner, J. E., et al. (2015). Vulnerability and adaptation of US shellfisheries to ocean acidification. Nat. Clim. Chang. 5, 207–214. doi: 10.1038/nclimate2508
Ellison, J. C. (2015). Vulnerability assessment of mangroves to climate change and sea-level rise impacts. Wetl. Ecol. Manag. 23, 115–137. doi: 10.1007/s11273-014-9397-8
Fabinyi, M. (2010). The intensification of fishing and the rise of tourism: competing coastal livelihoods in the Calamianes Islands. Philippines. Hum. Ecol. 38, 415–427. doi: 10.1007/s10745-010-9329-z
FAO (2007). The World’s Mangroves 1980-2005. Rome: Food and Agriculture Organization, 77. FAO Forestry Paper 153.
FAO (2016). The State of World Fisheries and Aquaculture 2016. Contributing to Food Security and Nutrition for All. Rome: FAO, 200.
FAO, and WFP (2009). The State of Food Insecurity in the World. Economic Crises – Impacts and Lessons Learned. Rome: FAO.
Fortes, M. D., Ooi, J. L. S., Tan, Y. M., Prathep, A., Bujang, J. S., and Yaakub, S. M. (2018). Seagrass in Southeast Asia: a review of status and knowledge gaps, and a road map for conservation. Bot. Mar. 61, 269–288. doi: 10.1515/bot-2018-0008
Fourqurean, J. W., Duarte, C. M., Kennedy, H., Marbà, N., Holmer, M., Mateo, M. A., et al. (2012). Seagrass ecosystems as a globally significant carbon stock. Nat. Geosci. 5, 505–509. doi: 10.1038/ngeo1477
Goldberg, L., Lagomasino, D., Thomas, N., and Fatoyinbo, T. (2020). Global declines in human-driven mangrove loss. Glob. Chang. Biol. 26, 5844–5855. doi: 10.1111/gcb.15275
Grech, A., Chartrand-Miller, K., Erftemeijer, P., Fonseca, M., McKenzie, L., Rasheed, M., et al. (2012). A comparison of threats, vulnerabilities and management approaches in global seagrass bioregions. Environ. Res. Lett. 7:024006. doi: 10.1088/1748-9326/7/2/024006
Green, E., and Short, F. (eds) (2003). World Atlas of Seagrasses. Berkeley, CA: University of California Press.
Green, S. J., White, A. T., Flores, J. O., Carreon, M. F. III, and Sia, A. E. (2003). “Philippine fisheries in crisis: A framework for management,” in Coastal Resource Management Project of the Department of Environment and Natural Resources, Cebu City, 77.
Howard, J., Sutton-Grier, A., Herr, D., Kleypas, J., Landis, E., Mcleod, E., et al. (2014). Clarifying the role of coastal and marine systems in climate mitigation. Front. Ecol. Environ. 15:42–50. doi: 10.1002/fee.1451
Huxham, M., Whitlock, D., Githaiga, M., and Dencer-Brown, A. (2018). Carbon in the coastal seascape: how interactions between mangrove forests, seagrass meadows and tidal marshes influence carbon storage. Curr. For. Rep. 4, 101–110. doi: 10.1007/s40725-018-0077-4
Indo-Pacific Seagrass Network (IPSN). (2021). Indo-Pacific Seagrass Network. Avaliable online at: https://indopacificseagrass.network/ (accessed February 19, 2021).
IPCC (2012). “Managing the risks of extreme events and disasters to advance climate change adaptation,” in A Special Report of Working Groups I and II of the Intergovernmental Panel on Climate Change, eds C. B. Field, V. Barros, T. F. Stocker, D. Qin, D. J. Dokken, K. L. Ebi, et al. (Cambridge: Cambridge University Press), 582.
Jacinto, M. R., Songcuan, A. J. G., Von Yip, G., and Santos, M. D. (2015). Development and application of the fisheries vulnerability assessment tool (Fish Vool) to tuna and sardine sectors in the Philippines. Fish. Res. 161, 174–181. doi: 10.1016/j.fishres.2014.07.007
Jentoft, S. (2014). Walking the talk: implementing the international voluntary guidelines for securing sustainable small-scale fisheries. Marit. Stud. 13, 1–15. doi: 10.1186/s40152-014-0016-3
Licuanan, W. Y., Samson, M. S., Mamauag, S. S., David, L. T., Borja-del Rosario, R., Quibilan, M. C. C., et al. (2015). I-C-SEA Change: a participatory tool for rapid assessment of vulnerability of tropical coastal communities to climate change impacts. Ambio 44, 718–736. doi: 10.1007/s13280-015-0652-x
Long, J., Napton, D., Giri, C., and Graesser, J. (2014). A mapping and monitoring assessment of the Philippines’ Mangrove forests from 1990 to 2010. J. Coast. Res. 30, 260–271. doi: 10.2112/JCOASTRES-D-13-00057.1
Mamauag, S. S., Aliño, P. M., Gonzales, R. O. M., and Deocadez, M. R. (2009). Patterns of demersal fish distribution derived from line fishing experiment in Calauag Bay, Philippines. Philipp. Agric. Sci. 92, 370–387.
Mamauag, S. S., Alino, P. M., Martinez, R. J. S., Muallil, R. N., Doctor, M. V. A., Dizon, E. C., et al. (2013). A framework for vulnerability assessment of coastal fisheries ecosystems to climate change — Tool for. Fish. Res. 147, 381–393. doi: 10.1016/j.fishres.2013.07.007
McClanahan, T. R., Castilla, J. C., White, A. T., and Defeo, O. (2009). Healing small-scale fisheries by facilitating complex socio-ecological systems. Rev. Fish Biol. Fish. 19, 33–47. doi: 10.1007/s11160-008-9088-8
McKenzie, L. J., and Campbell, S. J. (2002). “Seagrass-Watch,” in Manual for Community (citizen) Monitoring of Seagrass Habitat, eds L. J. McKenzie and S. J. Campbell (Queensland: Department of Primary Industries Queensland), 43. Western Pacific Edition (QFS, NFC, Cairns).
Mcleod, E., Chmura, G. L., Bouillon, S., Salm, R., Björk, M., Duarte, C. M., et al. (2011). A blueprint for blue carbon: toward an improved understanding of the role of vegetated coastal habitats in sequestering CO2. Front. Ecol. Environ. 9:552–560. doi: 10.1890/110004
McLeod, E., and Salm, R. V. (2006). Managing Mangroves for Resilience to Climate Change. Gland: IUCN, 64.
Millennium Ecosystem Assessment (2005). Ecosystems and Human Well-being: Synthesis. Washington, DC: Island Press.
Mironenko, O., Lucas, P. L., Tarasova, N., and Zlinszky, J. (2015). Sustainable development goals: why do we need them? Soc. Evol. Hist. 14, 176–190.
Muallil, R. N., Geronimo, R. C., Cleland, D., Cabral, R. B., Doctor, M. V., Cruz-Trinidad, A., et al. (2011). Willingness to exit the artisanal fishery as a response to scenarios of declining catch or increasing monetary incentives. Fish. Res. 111, 74–81. doi: 10.1016/j.fishres.2011.06.013
Nordlund, L. M., Unsworth, R. K. F., Gullström, M., and Cullen-Unsworth, L. C. (2018). Global significance of seagrass fishery activity. Fish Fish. 19, 399–412. doi: 10.1111/faf.12259
Orencio, P. M., and Fujii, M. (2013). An index to determine vulnerability of communities in a coastal zone: a case study of baler. Aurora, Philippines. Ambio 42, 61–71. doi: 10.1007/s13280-012-0331-0
Pauly, D. (1997). “Small-scale fisheries in the tropics: marginality, rioritizingon, and some implications for fisheries management,” in Global Trends: Fisheries Management: American Fisheries Society Symposium 20, eds E. K. Pikitch, D. D. Huppert, and M. P. Sissenwine (Bethesda, MA).
PCSD (2006). In-Depth Coastal/Marine Resources Survey Report for Busuanga Municipality. Puerto Princesa City: Palawan Council for Sustainable Development.
Pendleton, L., Donato, D. C., Murray, B. C., Crooks, S., Jenkins, W. A., Sifleet, S., et al. (2012). Estimating Global “Blue Carbon” emissions from conversion and degradation of vegetated coastal ecosystems. PLoS One 7:e0043542. doi: 10.1371/journal.pone.0043542
Pollnac, R. B., and Crawford, B. R. (2000). Discovering Factors that Influence the Success of Community-Based Marine Protected Areas in the Visayas, Philippines. Narragansett, RI: University of Rhode Island. Coastal Management Report # 2229. PCAMRD Book Series No. 33.
Quevedo, J. M. D., Uchiyama, Y., and Kohsaka, R. (2021). Linking blue carbon ecosystems with sustainable tourism: dichotomy of urban–rural local perspectives from the Philippines. Reg. Stud. Mar. Sci. 45:101820. doi: 10.1016/j.rsma.2021.101820
Quiros, T., Croll, D. A., Tershy, B. R., Fortes, M. D., and Raimondi, P. (2017). Land use is a better predictor of tropical seagrass condition than marine protection. Biol. Conserv. 209, 454–463.
Quiros, T. E. A. L., Beck, M. W., Araw, A., Croll, D. A., and Tershy, B. (2018). Small-scale seagrass fisheries can reduce social vulnerability?: A comparative case study. Ocean Coast. Manag. 157, 56–67. doi: 10.1016/j.ocecoaman.2018.02.003
Shah, K., Gupta, V., and Boyd, C. (2000). Tourism, the poor and other stakeholders: Experience in Asia. Overseas Development Institute. Fair Trade in Tourism Project. London, UK. 57. Available online at: https://odi.org/en/publications/tourism-the-poor-and-other-stakeholders-experience-in-asia/ (accessed December 24, 2020).
Siegel, K. J., Cabral, R. B., McHenry, J., Ojea, E., Owashi, B., and Lester, S. E. (2019). Sovereign states in the Caribbean have lower social-ecological vulnerability to coral bleaching than overseas territories. Proc. R. Soc. B Biol. Sci. 286:20182365. doi: 10.1098/rspb.2018.2365
Song, A. M., Dressler, W. H., Satizábal, P., and Fabinyi, M. (2021). From conversion to conservation to carbon: the changing policy discourse on mangrove governance and use in the Philippines. J. Rural Stud. 82, 184–195. doi: 10.1016/j.jrurstud.2021.01.008
Spalding, M., Kainuma, M., and Collins, L. (2010). World Atlas of Mangroves. London: Earthscan, 319.
Stankovic, M., Ambo-Rappe, R., Carly, F., Dangan-Galon, F., Fortes, M. D., Hossain, M. S., et al. (2021). Quantification of blue carbon in seagrass ecosystems of Southeast Asia and their potential for climate change mitigation. Sci. Total Environ. 783:146858. doi: 10.1016/j.scitotenv.2021.146858
Sudo, K., Quiros, T. E. A. L., Prathep, A., Luong, C. V., Lin, H.-J., Bujang, J. S., et al. (2021). Recent distribution, temporal change and conservation status of tropical seagrass beds in southeast Asia. Front. Mar. Sci. 8:637722. doi: 10.3389/fmars.2021.637722
Tamondong, A., Nakamura, T., Quiros, T. E. A., and Nadaoka, K. (2021). Time series analysis for monitoring seagrass habitat and environment in busuanga, Philippines using google earth engine. Int. Arch. Photogramm. Remote Sens. Spatial Inf. Sci. XLIII-B3-2021, 109–116. doi: 10.5194/isprs-archives-XLIII-B3-2021-109-2021
Tan, Y. M., Saunders, J. E., and Yaakub, S. M. (2018). A proposed decision support tool for rioritizing conservation planning of Southeast Asian seagrass meadows: combined approaches based on ecosystem services and vulnerability analyses. Bot. Mar. 61, 305–320. doi: 10.1515/bot-2017-0117
Thorhaug, A., Gallagher, J. B., Kiswara, W., Prathep, A., Huang, X., Yap, T. K., et al. (2020). Coastal and estuarine blue carbon stocks in the greater Southeast Asia region: seagrasses and mangroves per nation and sum of total. Mar. Pollut. Bull. 160:111168. doi: 10.1016/j.marpolbul.2020.111168
UNEP (2014). The Importance of Mangroves to People: A Call to Action, eds J. van Bochove, E. Sullivan, and T. Nakamura (Cambridge: United Nations Environment Programme World Conservation Monitoring Centre), pp 128.
UNEP-WCMC, WorldFish Centre, WRI, and TNC (2018). Global Distribution of Warm-Water Coral Reefs, Compiled From Multiple Sources Including the Millennium Coral Reef Mapping Project. Version 4.0. Includes contributions from ImaRS-USF and IRD (2005), ImaRS-USF (2005) and Spalding et al. (2001). Cambridge (UK): UN Environment World Conservation Monitoring Centre. Avaliable online at: http://data.unep-wcmc.org/datasets/1 (accessed February 18, 2021).
United Nations Environment Programme (UNEP) (2020). Out of the Blue: The Value of Seagrasses to the Environment and to People. Nairobi: UNEP.
Unsworth, R. K. F., Nordlund, L. M., and Cullen-Unsworth, L. C. (2018). Seagrass meadows support global fisheries production. Conserv. Lett. 12:e12566. doi: 10.1111/conl.12566
Valiela, I., Bowen, J. L., and York, J. K. (2001). Mangrove forests: one of the World’s threatened major tropical environments. Bioscience 51, 807–815.
Veettil, B. K., Ward, R. D., Lima, M. D. A. C., Stankovic, M., Hoai, P. N., and Quang, N. X. (2020). Opportunities for seagrass research derived from remote sensing: a review of current methods. Ecol. Indic. 117:106560. doi: 10.1016/j.ecolind.2020.106560
Waycott, M., Collier, C., Mcmahon, K., Ralph, P., McKenzie, L., Udy, J., et al. (2007). Vulnerability of Seagrasses in the Great Barrier Reef to Climate Change. Joondalup WA: ECU Publications.
Waycott, M., Duarte, C. M., Carruthers, T. J. B., Orth, R. J., Dennison, W. C., Olyarnik, S., et al. (2009). Accelerating loss of seagrasses across the globe threatens coastal ecosystems. Proc. Natl. Acad. Sci. U.S.A. 106, 12377–12381. doi: 10.1073/pnas.0905620106
Keywords: blue carbon, ecosystem services, vulnerability, seagrass, mangroves, small scale fisheries
Citation: Quiros TEAL, Sudo K, Ramilo RV, Garay HG, Soniega MPG, Baloloy A, Blanco A, Tamondong A, Nadaoka K and Nakaoka M (2021) Blue Carbon Ecosystem Services Through a Vulnerability Lens: Opportunities to Reduce Social Vulnerability in Fishing Communities. Front. Mar. Sci. 8:671753. doi: 10.3389/fmars.2021.671753
Received: 24 February 2021; Accepted: 21 June 2021;
Published: 03 August 2021.
Edited by:
Holly J. Niner, University of Plymouth, United KingdomReviewed by:
Benjamin L. Jones, Project Seagrass, United KingdomInés Mazarrasa, Environmental Hydraulics Institute IH Cantabria, Spain
Copyright © 2021 Quiros, Sudo, Ramilo, Garay, Soniega, Baloloy, Blanco, Tamondong, Nadaoka and Nakaoka. This is an open-access article distributed under the terms of the Creative Commons Attribution License (CC BY). The use, distribution or reproduction in other forums is permitted, provided the original author(s) and the copyright owner(s) are credited and that the original publication in this journal is cited, in accordance with accepted academic practice. No use, distribution or reproduction is permitted which does not comply with these terms.
*Correspondence: T. E. Angela L. Quiros, QW5nZWxhTFF1aXJvc0Bmc2MuaG9rdWRhaS5hYy5qcA==