 Christine M. Gabriele
 Dimitri W. Ponirakis
 Holger Klinck
- 1Glacier Bay National Park and Preserve, Gustavus, AK, United States
- 2Center for Conservation Bioacoustics, Cornell Lab of Ornithology, Ithaca, NY, United States
- 3Department of Fisheries, Wildlife, and Conservation Science, Marine Mammal Institute, Oregon State University, Newport, OR, United States
The global COVID-19 pandemic caused a sharp decline in vessel traffic in many areas around the world, including vessel-based tourism throughout Alaska, USA in 2020. Marine vessel traffic has long been known to affect the underwater acoustic environment with direct and indirect effects on marine ecological processes. Glacier Bay National Park in southeastern Alaska has monitored underwater sound since 2000. We used continuous, calibrated hydrophone recordings to examine 2020 ambient sound levels compared with previous years: 2018, the most recent year with data available, and 2016 for historical perspective. Park tourism occurs mainly in May–September. Overall, the number of vessel entries in Glacier Bay was 44–49% lower in 2020 (2020: n = 1,831; 2018: n = 3,599; 2016: n = 3,212) affecting all vessel classes, including the complete absence of cruise ships and only three tour vessel trips. In all years, we found clear seasonal and diurnal patterns in vessel generated noise, focused from 06:00 to 20:00 local time (LT) in the summer months. Broadband (17.8–8,910 Hz) sound levels in the 2020 Visitor Season were 2.7 dB lower than 2018 and 2.5 dB lower than 2016. Focusing on morning (06:00–09:00 LT) and afternoon (15:00–18:00 LT) time-blocks when tour vessels and cruise ships enter and exit Glacier Bay, median broadband sound levels were 3.3–5.1 dB lower in 2020 than prior years. At the 95th percentile levels, morning and afternoon peak times in 2020 were 6.3–9.0 dB quieter than previous years. A 3 dB decline in median sound level in the 125 Hz one-third octave band in 2020 reflects a change in medium and large vessel noise energy and/or harbor seal vocalizations. Our results suggest that all types of vessels had a role in the quieter underwater sound environment in 2020, with the combined acoustic footprint of tour vessels and cruise ships most evident in the decrease in the 95th percentile loudest sounds. This and other descriptions of the pandemic-induced quiet, and the gradual return to increased activity, can help inform efforts to improve existing methods to mitigate vessel noise impacts and maintain the ecological integrity of marine protected areas.
Introduction
In 2020, the global COVID-19 pandemic presented a unique opportunity to understand the effects of vessel noise on the underwater acoustic environment in many places around the world. Marine vessel traffic is essential to modern commerce and passenger vessel tourism but produces underwater noise that overlaps in frequency, space and time with marine mammal sounds (Richardson et al., 1995) that are integral to vital life functions such as feeding, navigation, communication, breeding, and rearing young (Brumm and Slabbekoorn, 2005; Tyack, 2008; Barber et al., 2011). Increasing ocean noise and its effects on marine mammal communication have been documented in various studies (Payne and Webb, 1971; Malme et al., 1981; Andrew et al., 2002, McKenna et al., 2012; Miksis-Olds et al., 2013; Houghton et al., 2015). In the North Pacific, ambient sound levels increased by over 3 dB per decade from 1950 to 2007 (Andrew et al., 2002; McDonald et al., 2006; Chapman and Price, 2011) primarily due to increased commercial shipping but also attributable to other human activities. Noise trends are stable or decreasing in some part of the world, such as the Equatorial Pacific and South Atlantic and the North Pacific (Andrew et al., 2011; Miksis-Olds and Nichols, 2016). The shipping industry is affected by global crises (Notteboom et al., 2021) and noise levels have been documented to respond to decreased shipping activity (McKenna et al., 2012).
In Alaskan waters, marine tourism was strongly affected by the COVID-19 pandemic. No-sail orders from the U.S. Centers for Disease Control and Prevention (CDC) canceled all cruise ship visits to Alaska to prevent spreading the virus onboard ships and in ports-of-call (Federal Register, 2020; Ito et al., 2020). The Canadian government announced a series of port closures to cruise ships that began in March 2020 (Transport Canada, 2020) that prevented cruise ship visits to Alaska during the 2020 tourism season because under the United States Jones Act (Section 27 of Pub. L. 66-261), foreign-flag vessels must visit a foreign port between stops at U.S. ports. Although U.S.-flag tour vessels carrying fewer than 250 passengers were exempt from the CDC no-sail order, these tour vessel trips also canceled Alaska sailings in 2020 (KTOO News August 2020). Here, we characterize the underwater acoustic environment in Glacier Bay National Park (GBNP) during 2020’s absence of cruise ships and almost all tour vessels to increase our understanding of the acoustic contribution of these vessel classes to the underwater soundscape.
Since 2000, the National Park Service (NPS) has worked with the U.S. Navy to monitor underwater sound in Glacier Bay National Park to inform management of vessel-based visitation. Previous work has resulted in detailed descriptions of the underwater soundscape in the area (Kipple and Gabriele, 2004a; McKenna et al., 2017) and modeling to predict how management actions such as vessel speed limits and scheduling may affect the underwater acoustic environment and communication ability of iconic marine mammals in the park (Frankel and Gabriele, 2017; Gabriele et al., 2018). For example, reduced ship speed is associated with a decrease in individual vessel noise output (Kipple, 2002; Kipple and Gabriele, 2004a) and daily sound exposure levels (Frankel and Gabriele, 2017). Studies in this vast (2,400 km2) marine protected area have also advanced scientific knowledge of humpback whale (Megaptera novaeangliae) and harbor seal (Phoca vitulina richardsii) communication in Glacier Bay (Wild and Gabriele, 2014; Matthews et al., 2017a,b, 2020; Fournet et al., 2018a,b; Gabriele et al., 2018). Prior work allows us both a basis of comparison to assess the changes that occurred in 2020, and an understanding of the vocal behavior of these two species to provide biological context on the effects of changes to the underwater sound environment.
Materials and Methods
Study Area
Glacier Bay National Park (GBNP) is a tidewater glacier fjord system with over 2,400 km2 of marine waters (Figure 1). The Park experiences tourism-related vessel traffic mainly in May through September. The NPS has jurisdiction over the marine waters of the Park and controls private and commercial vessel traffic during the spring, summer, and fall using a quota system (Code of Federal Regulations 13.65). All types of commercial and private vessels entering Glacier Bay are subject to daily and seasonal limits during the Visitor Season (Code of Federal Regulations Title 36, Part 13, Subpart N). During the May–September Visitor Season, NPS data indicate the date/time that each commercial, private, fishing, or government vessel enters and exits GBNP. Park regulations currently allow up to two cruise ships, three tour vessels, and thirty-one smaller charter and private vessels to enter Glacier Bay daily during the June through August summer season. Glacier Bay is acoustically isolated from most distant shipping noise because it is bounded by land on all sides except its mouth. Freight-carrying vessels crossing the Gulf of Alaska pass the mouth of Glacier Bay but do not enter because it is not a thoroughfare.
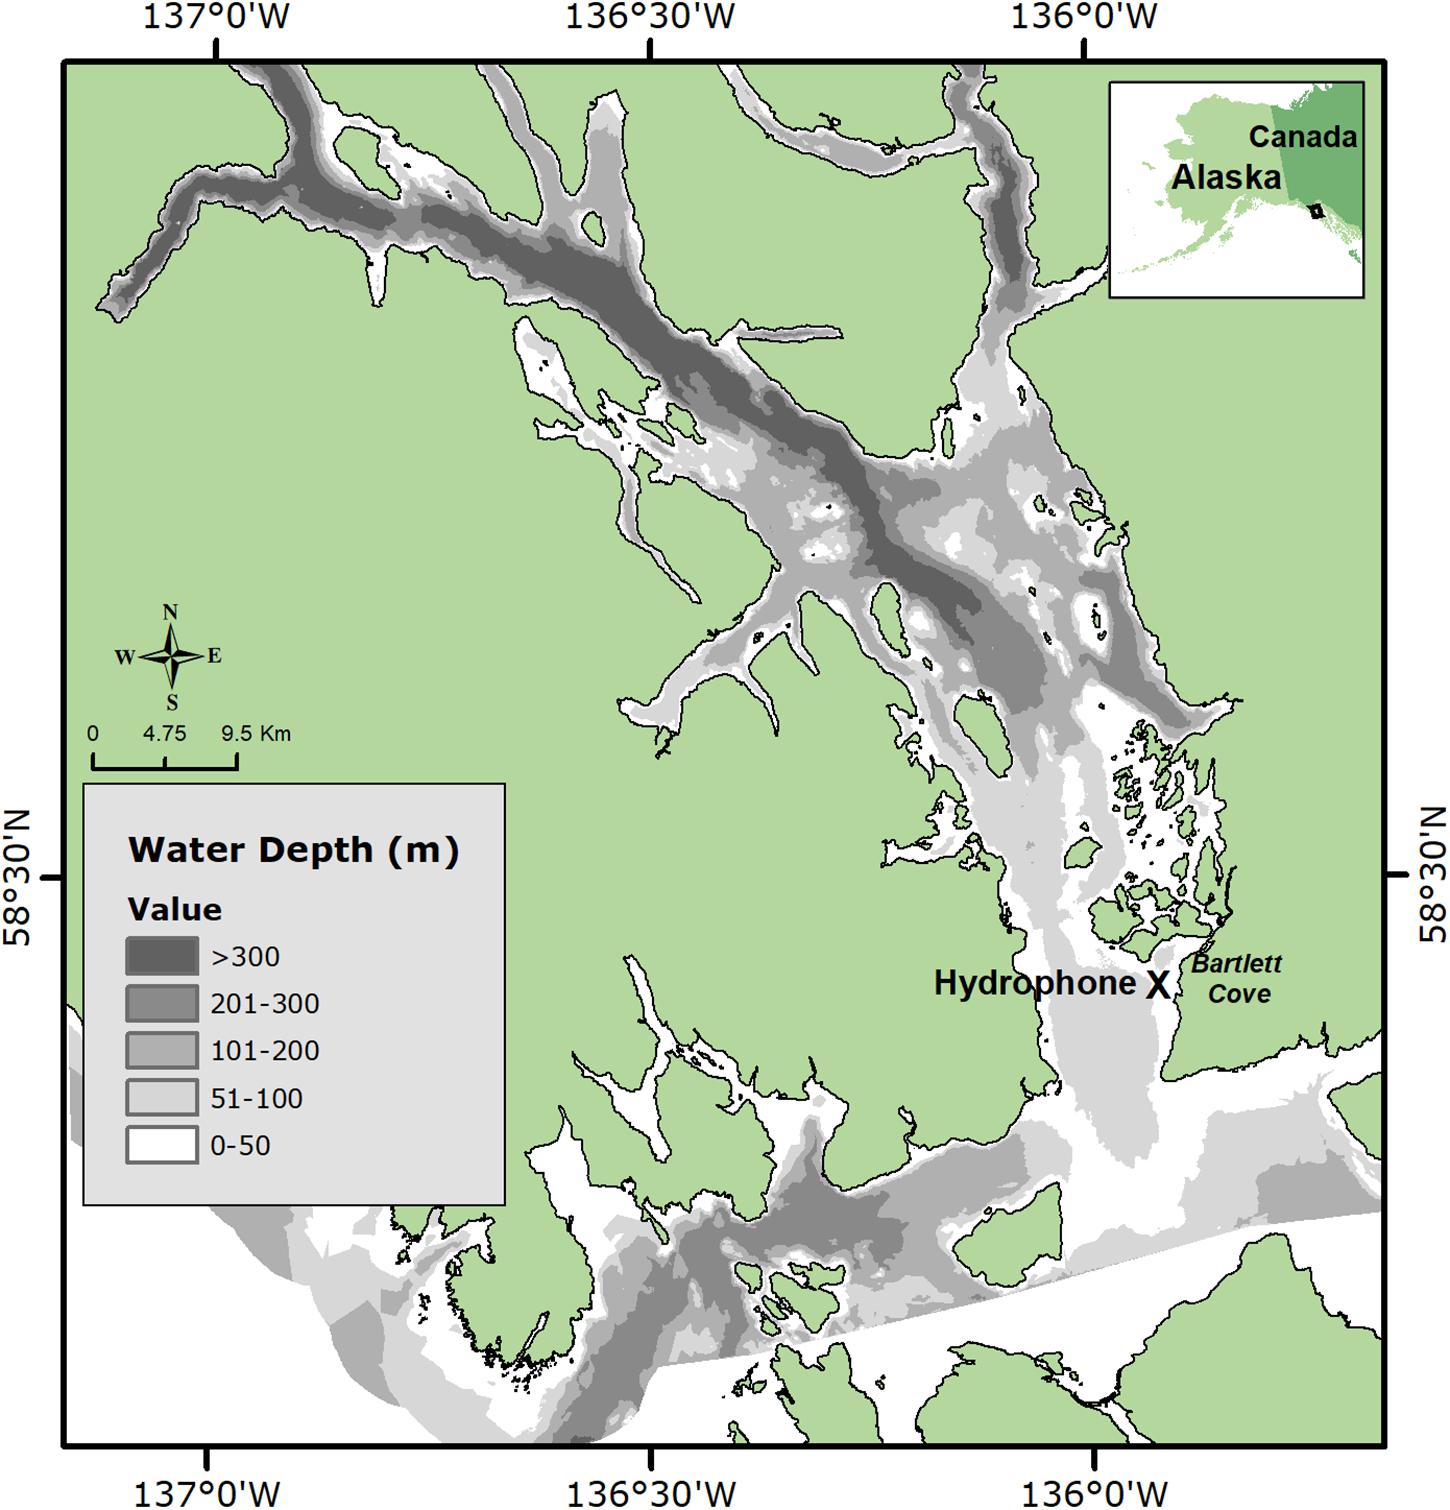
Figure 1. Study area map showing hydrophone location and the bathymetry of Glacier Bay. The geographic location of Glacier Bay is indicated with a black box in the inset Alaska map.
Acoustic Data Collection
A cabled calibrated hydrophone system to monitor the underwater acoustic environment has been in place in lower Glacier Bay (58.43501 N, 135.92297 W; Figure 1) since May 2000. The seafloor is a remnant of a glacial moraine and is fairly flat at a depth of 40–60 m. In this study, we used continuous acoustic recordings from 2016, 2018, to 2020. The hydrophone system was not operational in 2019. The system consisted of a calibrated ITC type 8215A broadband omnidirectional hydrophone with a nominal sensitivity −174 dB re 1 V/μPa (Gavial ITC Inc., Santa Barbara, CA, United States) mounted on an anchoring tripod 1 m above the seafloor (30.2 m depth). A submerged 5-mile cable connects the hydrophone to a control unit at park headquarters, where continuous recordings were made 24 h a day, archived as 5 min sound files (National Instruments 4451 Digital Signal Analyzer, 22.05 kHz sampling rate, 24-bit resolution, 50 dB gain, ± 10 V ADC clipping level). We established the calibration of the Glacier Bay system with a broadband source by comparison to a calibrated reference hydrophone at the Fox Island Acoustic Laboratory. Those measurements were performed as an end-to-end calibration through the full length of cable, in-water, as a function of frequency. We verified calibration of the lab measurement system at each major cable replacement or computer system update and also inspected and periodically removed biofouling from the hydrophone sensor. The recording system had a flat frequency response from 20 to 20 kHz (±2 dB). Received levels in this study are reported as broadband, and one-third octave band sound pressure levels (Leq, 10 min) in dB re 1 μPa as measured at the hydrophone.
Ambient Noise Data Processing
Noise levels from the hydrophone data were calculated for consecutive 10 min periods for the entire 2016, 2018, and 2020 data sets. Sound level metrics were computed using Raven-X (Dugan et al., 2011) in a two-stage process. First, the 5 min AIF audio files were processed to calculate spectrum levels. To achieve frequency resolution of 1 Hz and a temporal resolution of 1 s for the spectral data, we calculated spectrum levels with the following parameters: 22,050 FFT, Hann window, and 0% overlap. In the second stage, the Raven-X analyzer then generated broadband (17.8–8,910 Hz) and 1/3-Octave band metrics that were averaged into 10 min sound level values. Ten-minute sound levels for each frequency band were statistically analyzed to quantify the percentile sound level distributions at hourly and monthly resolutions.
Environmental Data
Wind has long been recognized as a primary source of underwater noise (Knudsen et al., 1948; Wenz, 1962). Wind disturbs the ocean surface and results in the wave, turbulence, droplet and bubble activity that comprise wind noise. To account for the role of wind in Glacier Bay’s underwater sound environment, we summarized wind speed data from the NOAA National Data Buoy Center station BLTA2 in Bartlett Cove for 2020 and 2018, while the 2016, data were downloaded from Dark Sky API due to lack of available data from BLTA2 (Supplementary Figures 4, 5).
Rain is another prevalent source of ocean ambient noise in the 1–50 kHz frequency range (Amitai and Nystuen, 2008). Prior work in our study area indicated that the acoustic signature of rain characteristically peaks at 16 kHz (Kipple and Gabriele, 2003). However, the contribution of rain to noise levels at lower frequencies below 1 kHz is less significant in the study area and typically masked by other sources (e.g., vessel noise). To assess the contribution of artifact from tidal current over the hydrophone sensor, we summarized tidal current data for all three years, that were downloaded from NOAA Tides and Currents site station 9452534 Bartlett Cove, Alaska (Supplementary Figure 6).
Vessel Traffic Data
Manmade underwater noise in Glacier Bay is primarily associated with motorized vessel activities. Vessel noise is typically due to engine, propulsion system, and propeller-related noise (Ross, 2005). Small craft with high-speed engines and propellers generally produce higher frequency noise while large vessels tend to generate low frequency noise because of their size and their large, slow speed engines and propellers (Barlett and Wilson, 2002; Kipple and Gabriele, 2004a,b; McKenna et al., 2012). All vessels can produce broadband propeller cavitation noise, which occurs at higher frequencies (Erbe, 2002; Kipple, 2002; Kipple and Gabriele, 2004a,b; Erbe et al., 2016; Veirs et al., 2016).
We summarized each vessel entry according to regulatory categories used by the NPS to manage vessel traffic. Currently, GBNP regulations allow up to 2 cruise ships, 3 tour vessels and 6 smaller charter and 25 private vessels per day in June-August (Code of Federal Regulations 13.65). The large cruise ships visiting Glacier Bay in 2016 and 2018 were 237–290 m (60,000–114,000 gross ton) vessels carrying 1,000–3,000 passengers, powered by diesel electric or gas turbines with various propeller or azipod propulsion configurations. These ships enter and exit Glacier Bay on a pre-determined schedule (Supplementary Figures 7, 8). The radiated noise signatures of several cruise ships has been characterized (Kipple, 2002, NPS unpublished data). Tour vessels during the study were 46–73 m long, carried up to 149 passengers, and operate on a variety of schedules. A daily tour vessel, the 55 m catamaran Baranof Wind departed Bartlett Cove daily at 07:30 and returned around 15:30 daily; its source level has been estimated in previous work (Frankel and Gabriele, 2017; Gabriele et al., 2018). Charter vessels during the study years ranged from 7 to 29 m and generally carried fewer than 12 passengers for day-trips or overnight excursions. The private vessel category encompasses a wide variety of craft, ranging from 6 m outboard engine-powered skiffs, to 12–20 m cabin cruisers and 82 m mega-yachts. NPS administrative vessel traffic includes a variety of 5–6 m outboard powered skiffs, several 7–8 m inboard-powered patrol and research vessels, occasional visits from NOAA or U.S. Coast Guard vessels (> 61 m), as well as the 10 m pilot boat Serac that embarks Park Ranger naturalists on each entering cruise ship and disembarks the rangers before the ship exits Glacier Bay in late afternoon or early evening. We defined as Operating Hours of 06:00–20:00 LT and Off Hours of 20:00–06:00 LT, based on known patterns of vessel use of Glacier Bay (Kipple and Gabriele, 2004a).
Results
Environmental Variation
We examined the distribution of wind speeds in the study area in 2016, 2018, and 2020 (Supplementary Figure 3). The predominant summer wind pattern of increasing afternoon westerly or south-westerly winds is also evident. Median noise levels increased with increasing wind speed (Supplementary Figure 4). We plotted wind speed in May–September 2016, 2018, and 2020 (Supplementary Figure 5) demonstrates that all three years are similar up to the 70th percentile, when 2016 becomes distinct with lower sound levels up through the 99th percentile. While wind and rain noise both contributed to the underwater sound environment, there is little or no indication that variation in natural sounds was the primary driver of inter-year differences in noise levels.
Vessel Traffic
Vessel traffic varied among the years studied here (Figure 2) with the overall number of recorded vessel entries highest in 2018 (n = 3,599), followed by 2016 (n = 3,288) in contrast to only 1,831 entries in 2020, a 44–49% decline. Tour vessels and cruise ships represented 14–15% of May–September vessel entries in 2016 and 2018 but less than 1% in 2020. In May–September, NPS vessel use declined by 384–494 entries, and fishing/sightseeing charters declined by 184–190 entries. Private vessels were the most numerous class in all years but decreased in 2020 (n = 1,372) compared to other years by 414–528 entries. Small vessels in the charter, private and NPS classes represented a much larger proportion of total vessel traffic in 2020. In 2020, as a COVID-19 safety precaution, private vessels entering Glacier Bay were required to complete an online boater orientation and proceed into Glacier Bay rather than reporting to Bartlett Cove in person prior to starting their visit.
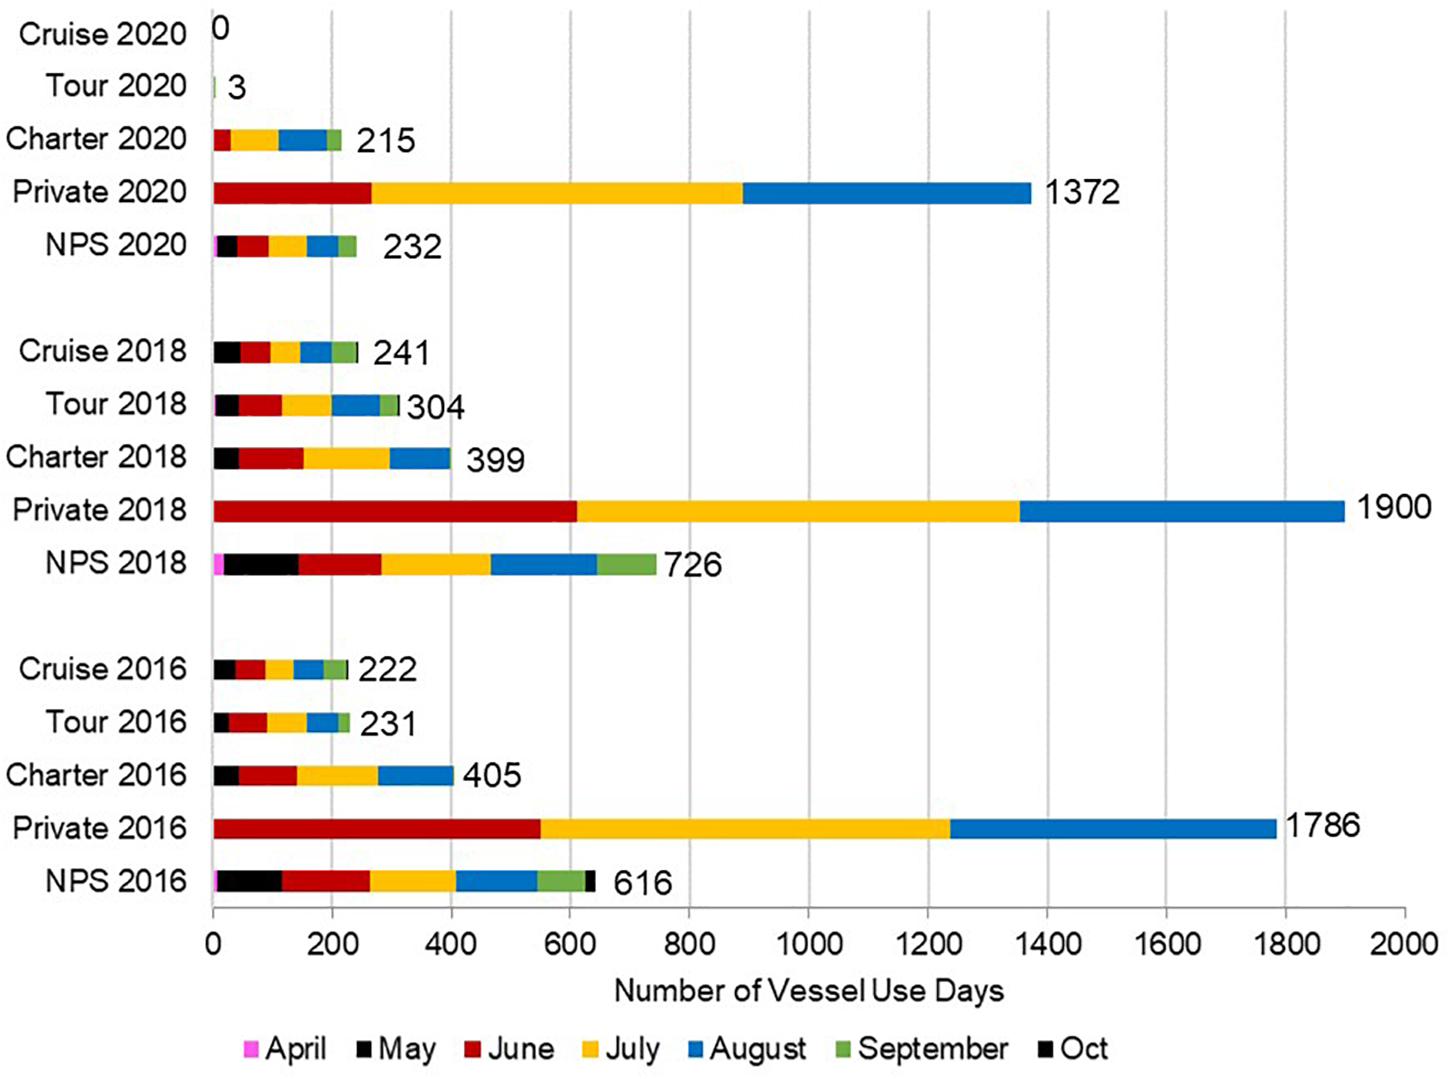
Figure 2. Vessel traffic records for Glacier Bay 2016, 2018, and 2020, showing the numbers of the various categories of vessels in each year. Data values at the end of each bar show the total number of vessels in May–September only.
Annual and Seasonal Variability in Ambient Noise
Full-year diel plots of broadband (17.8–8,910 Hz) levels illustrate the primary drivers of Glacier Bay’s underwater soundscape (Figure 3). These plots revealed variation within years due to vessel traffic patterns and biological and environmental sound sources. We observed two pronounced noise peaks: one in the morning as cruise ships and the daily catamaran tour vessel enter the bay and one during their afternoon/evening departure (Supplementary Figures 7, 8). While vessel noise was still evident in 2020, the lack of tightly scheduled cruise ships and tour vessels resulted in the absence of a visible morning and evening entry and exit peak, particularly in the 63 and 125 Hz one-third octave bands that characterize large vessel noise (Figure 4 and Supplementary Figure 1; Dekeling et al., 2014). Lower sound levels in 2020 are likely in part attributable to private vessels entering Glacier Bay without reporting to Bartlett Cove for an in-person boater orientation. Many private vessels in 2020 traveled directly into the bay at a greater distance from the hydrophone rather than traveling in and out of Bartlett Cove at close proximity to the hydrophone at the start of their visit. Harbor seal roars are a dominant noise source during their mating season in May–July (see Matthews et al., 2017a) especially evident in the 125 Hz one-third octave bands (range: 79–200 Hz, Figure 4 and Supplementary Figures 1, 2). Humpback and killer whale vocalizations occur frequently in Glacier Bay (McKenna et al., 2017), but do not follow a specific temporal pattern that would make them visible at the annual scale. Harbor porpoise also commonly occur but vocalize at frequencies (Mohl and Andersen, 1973) too high for our hydrophone system to detect. Wind-generated noise occurs throughout the year, with storms evident in fall and winter (see also Supplementary Figure 3). Also shown as “noise” in Figure 3 is the artifact of tidal flow over the hydrophone sensor, which appears in the lower frequencies (<200 Hz; Supplementary Figure 1) as regularly spaced lines slanted upward as the hour of peak tidal flow advances by one hour each day (see also Supplementary Figure 6).
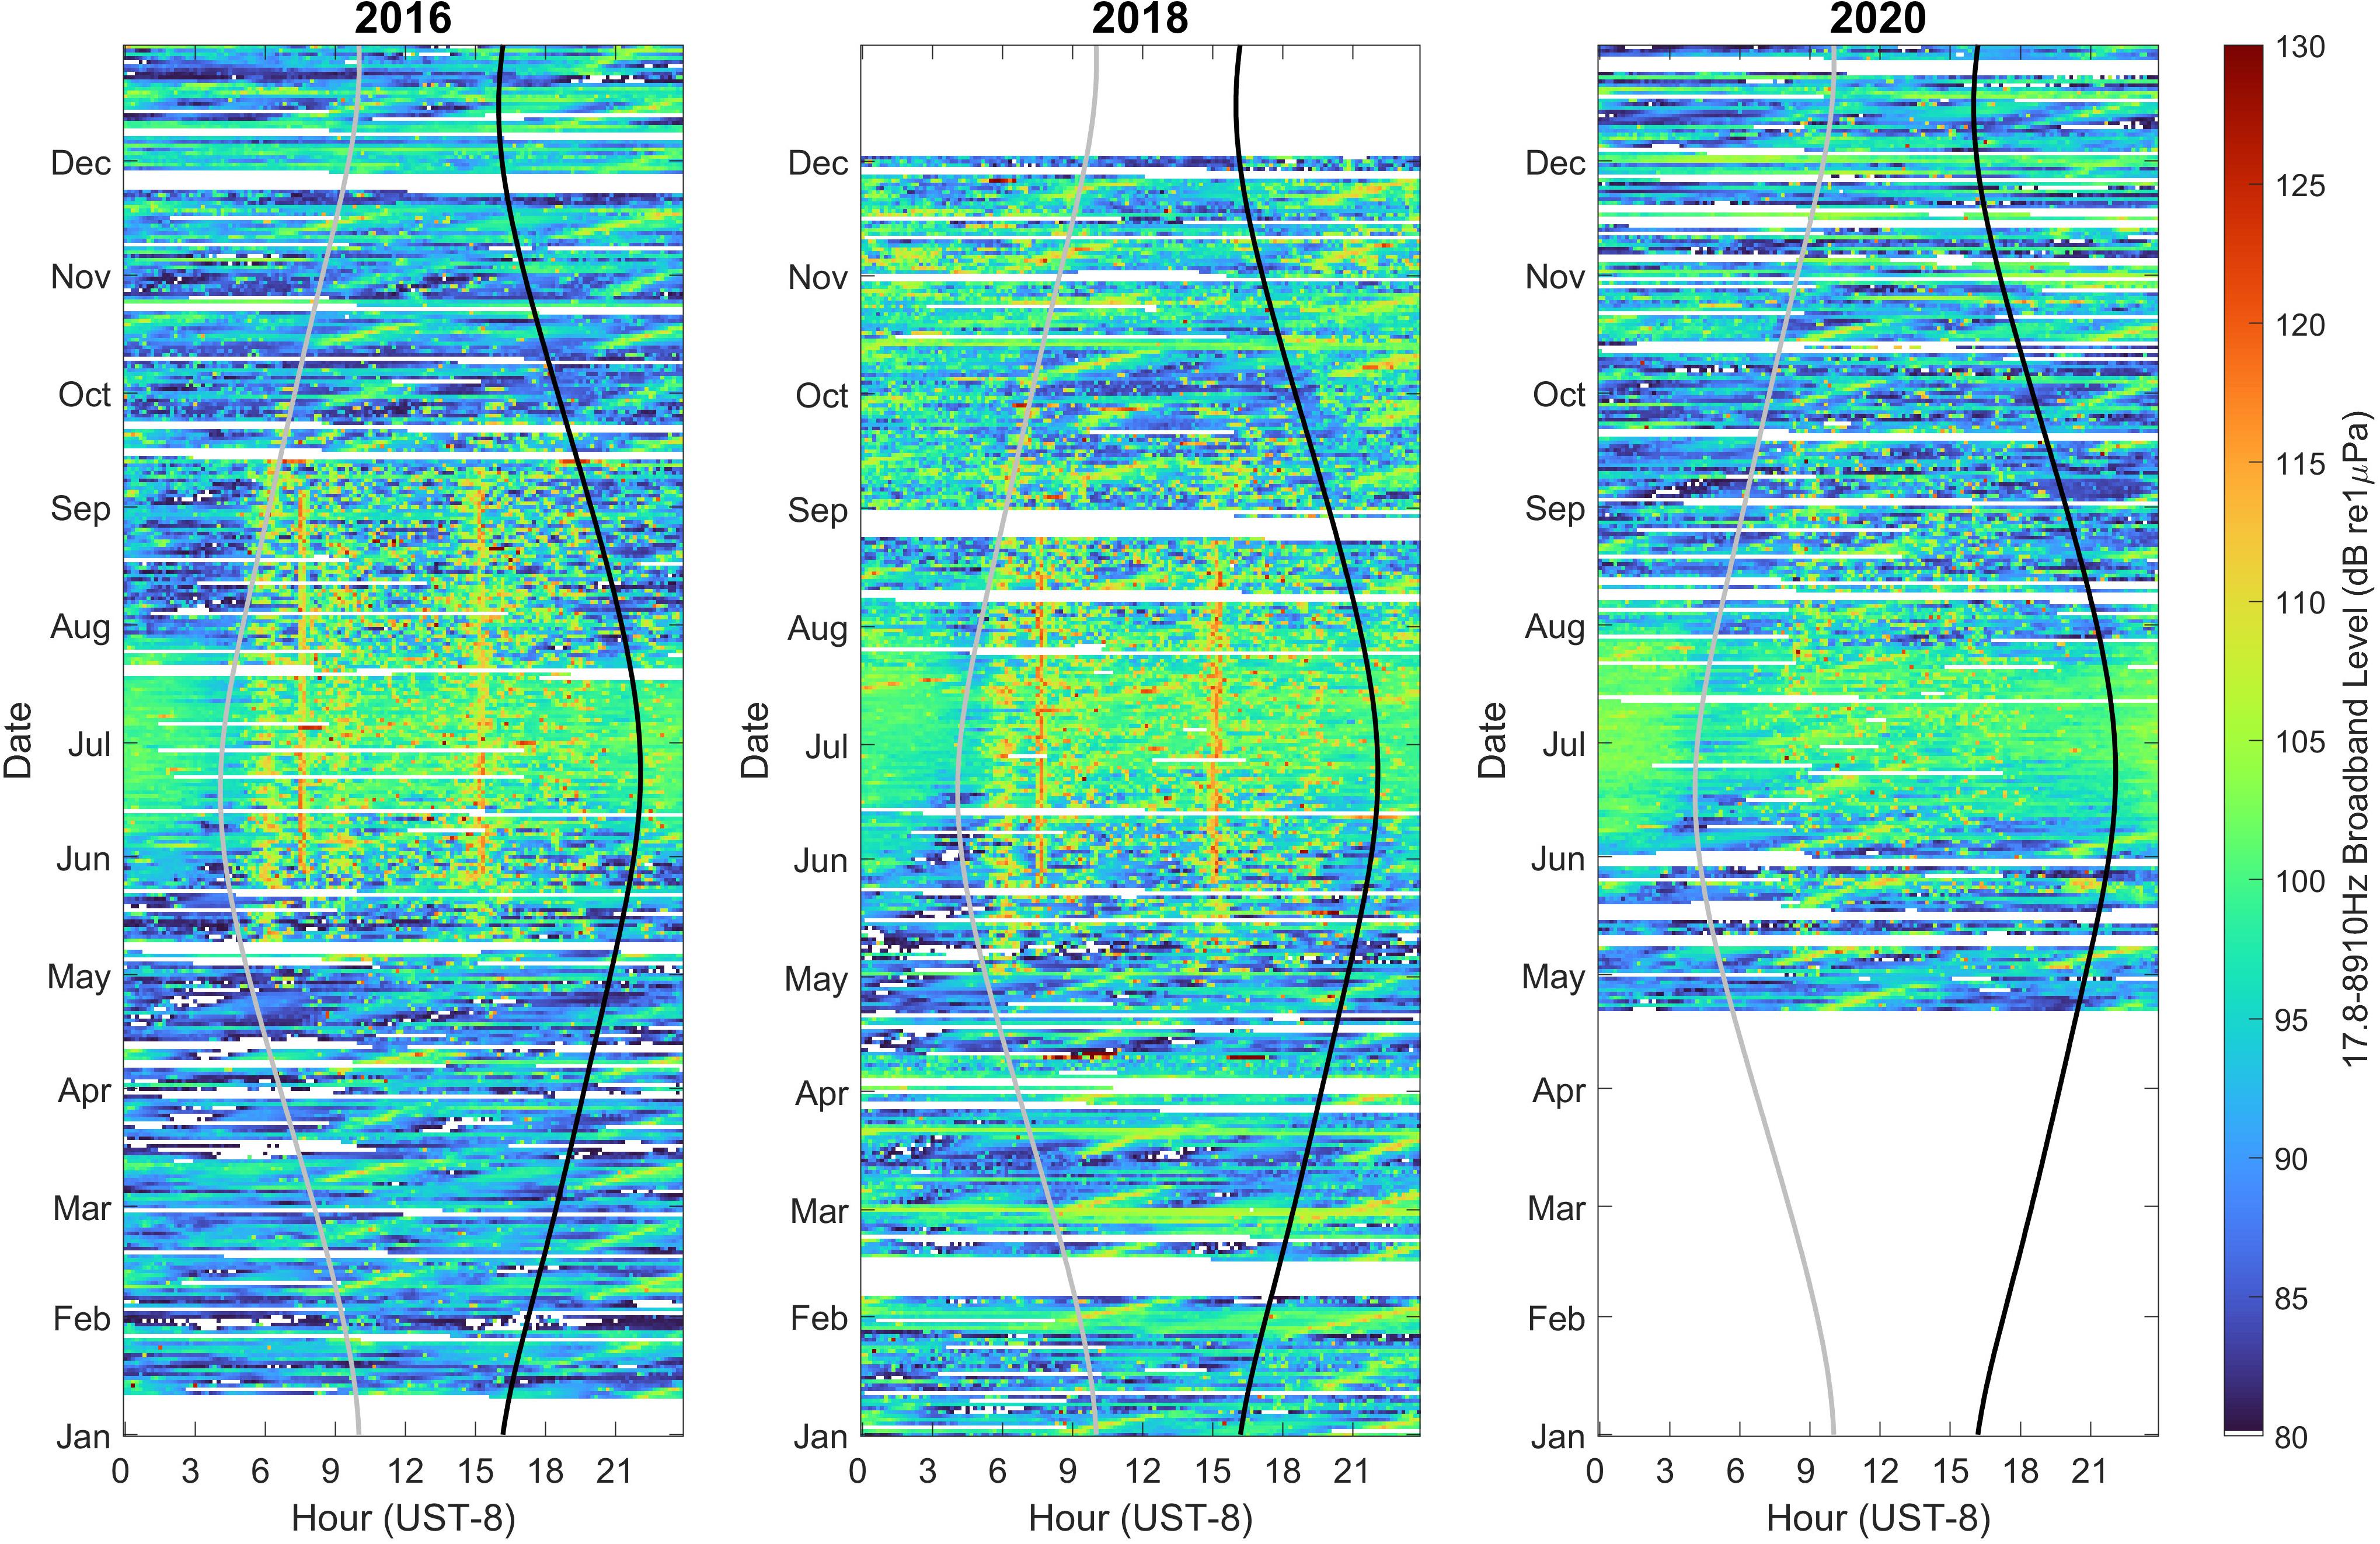
Figure 3. Full Year diel broadband (17.8–8,910 Hz) levels at 10 min resolution for 2016, 2018, and 2020. Band level in dB re 1 μPa is indicated by the color scale at right. White sections indicate missing data. Variation within and between years is due to vessel traffic patterns, harbor seal vocalizations, weather, and the artifact of tidal flow over the hydrophone sensor (regularly spaced, upward-slanted lines). The light gray line indicates sunrise time and the black line indicates sunset time.
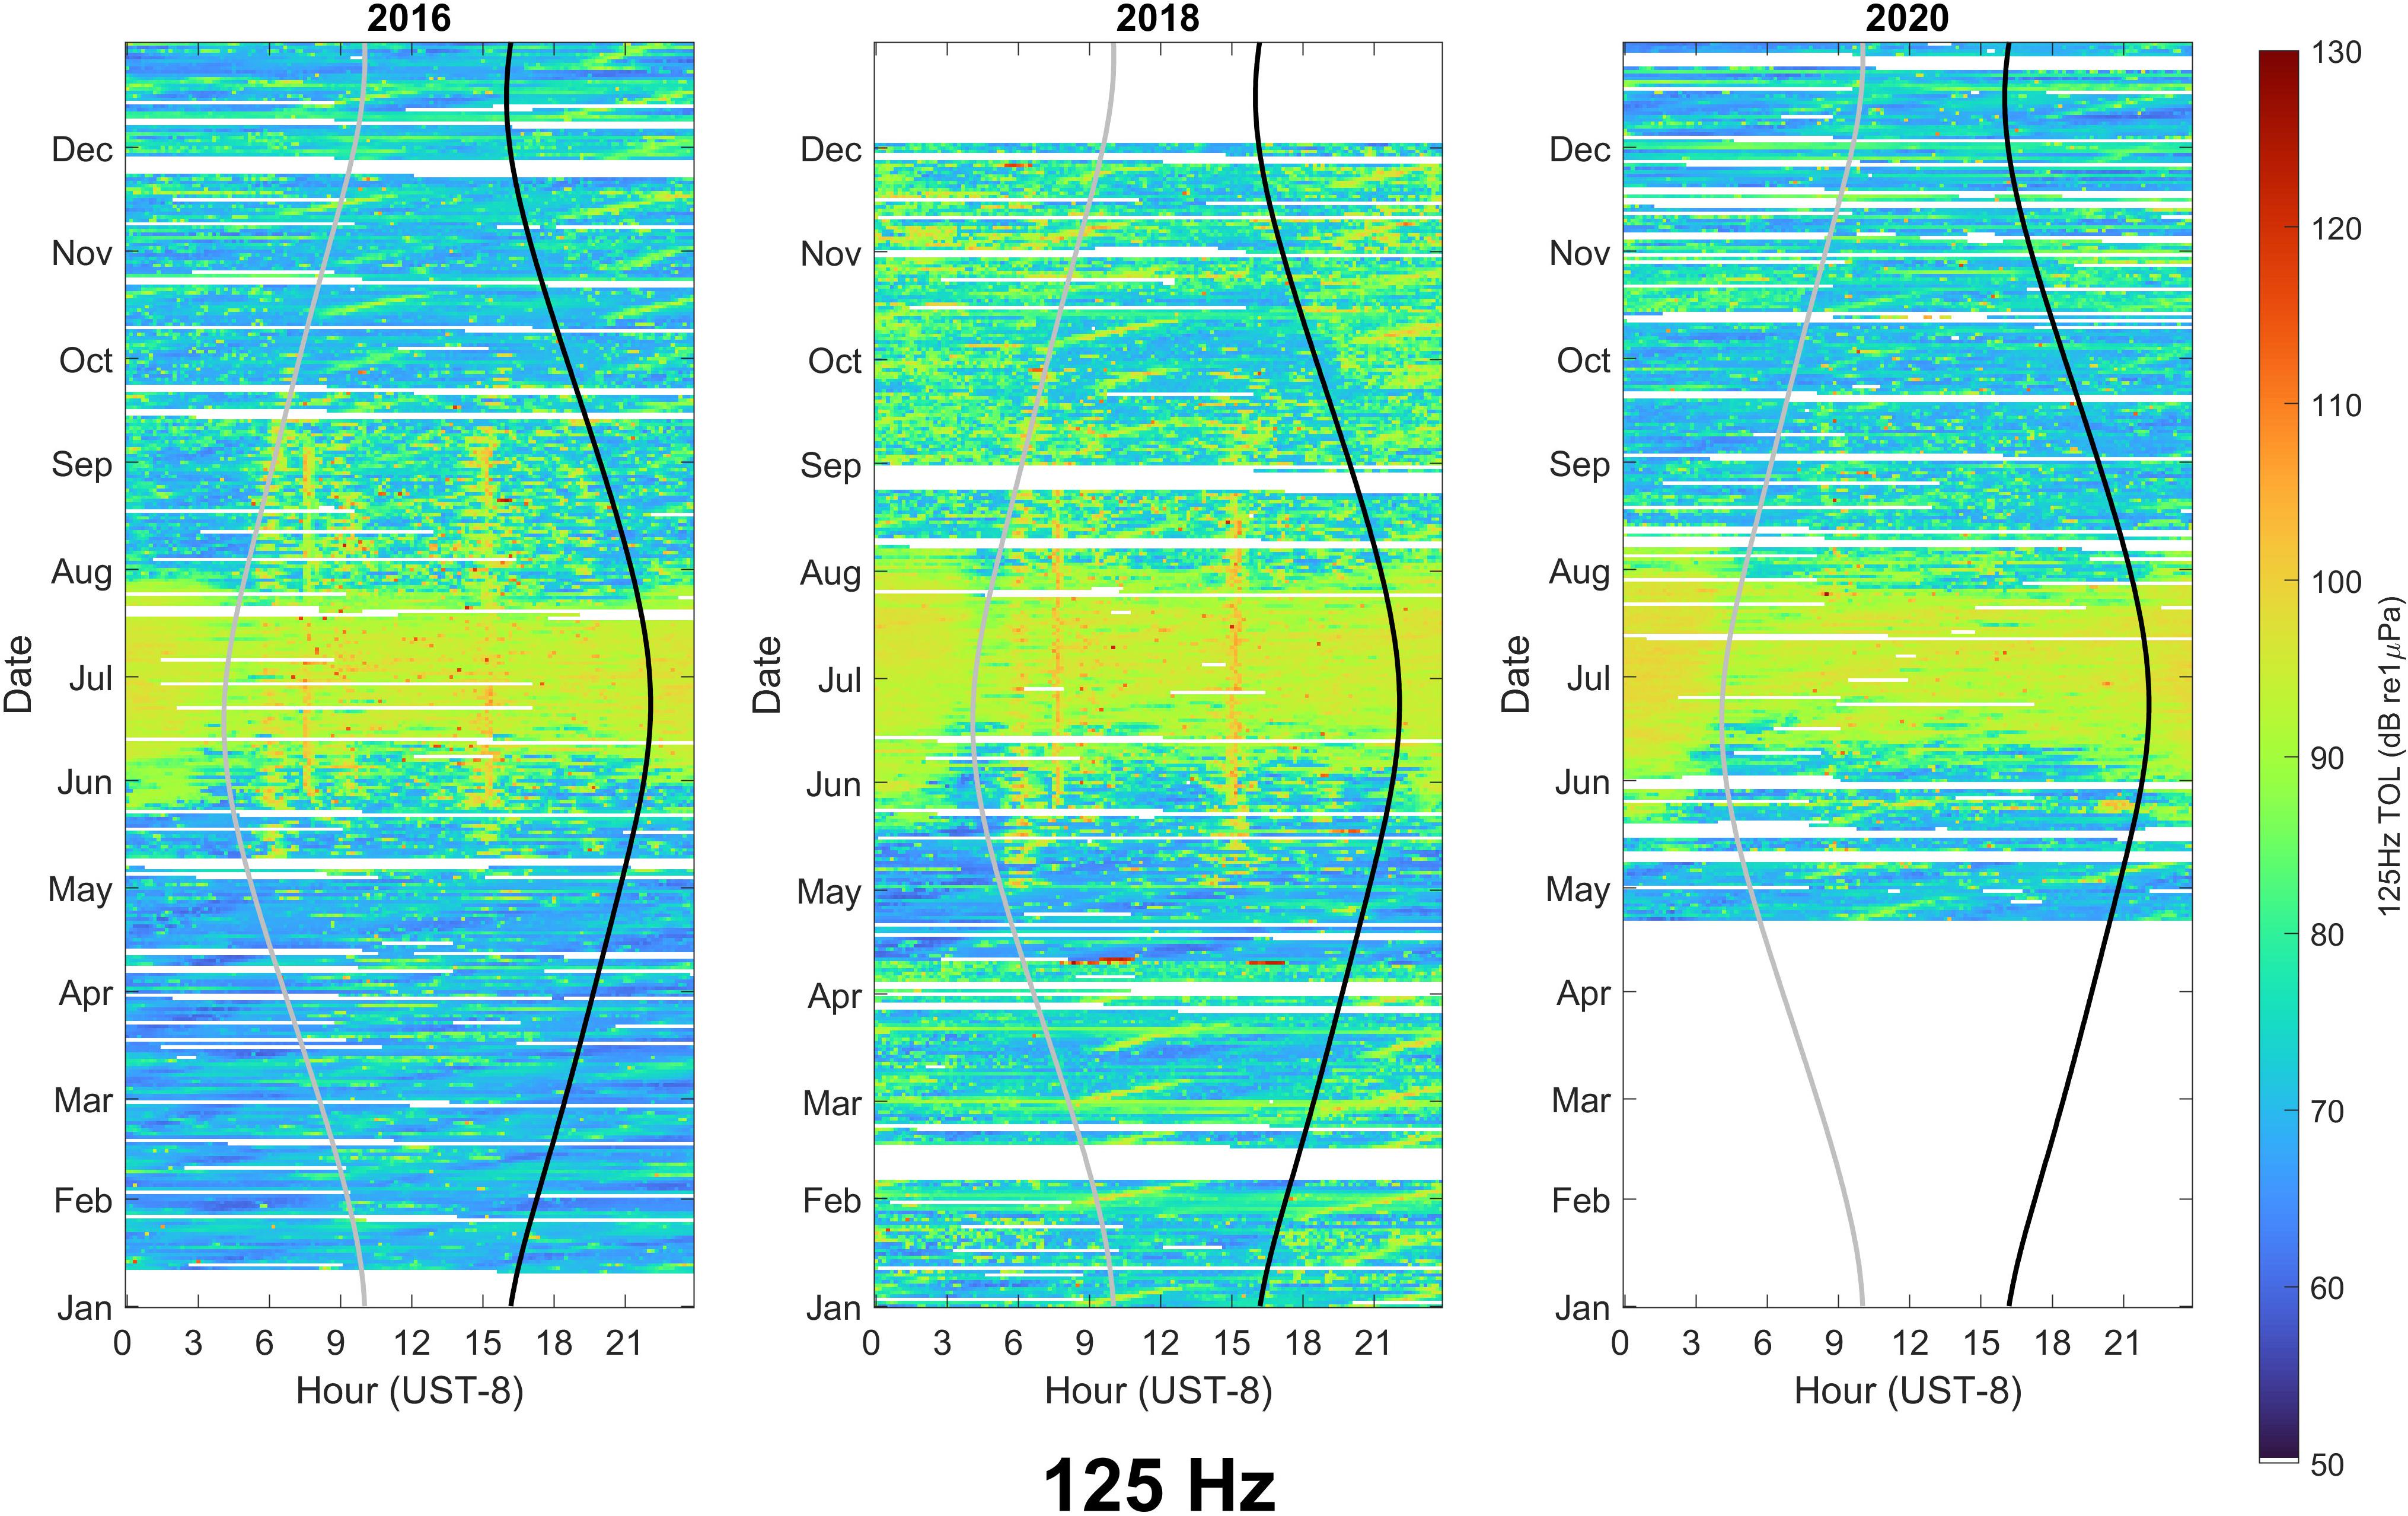
Figure 4. Full year diel levels for the 125 Hz one-third octave at 10 min resolution for 2016, 2018, and 2020. Band level in dB re 1 μPa is indicated by the color scale at right. White sections indicate missing data. Variation within and between years is due to vessel traffic patterns, harbor seal vocalizations, weather, and the artifact of tidal flow over the hydrophone sensor (regularly spaced, upward-slanted lines). The light gray line indicates sunrise time and the black line indicates sunset time.
To further quantify the frequencies most affected by the seasonal variability in these acoustic sources, we contrasted the median one-third octave levels (TOL) in 2016, 2018, and 2020 during the Visitor Season and Off Season (Figure 5). Median sound levels in all one-third octave bands were substantially lower in 2020 than in previous years. During the Visitor Season in 2020, the median level in all but one one-third octave band remained below 80 dB, whereas in 2016 and 2018 the noise levels in many bands exceeded 80 dB. Statistically, this results in median broadband levels in Visitor Season Operating Hours 2020 that are 2.5–2.7 dB lower than 2016 and 2018, respectively (Supplementary Table 1). At the 95th percentile level, 2020 median broadband levels in Visitor Season Operating Hours were 4.0–4.1 dB quieter than prior years. The harbor seal acoustic signal in the 125 Hz band remained visible in all years, but the median level in 2020 was 3 dB lower than in 2016 or 2018 (Figure 5). 2020 was markedly quieter during the daytime in the Visitor Season as a whole (Figure 6), particularly in the 125 Hz band although differences between years were not as apparent in the Off Season or at Off Hours (Figures 5, 6).
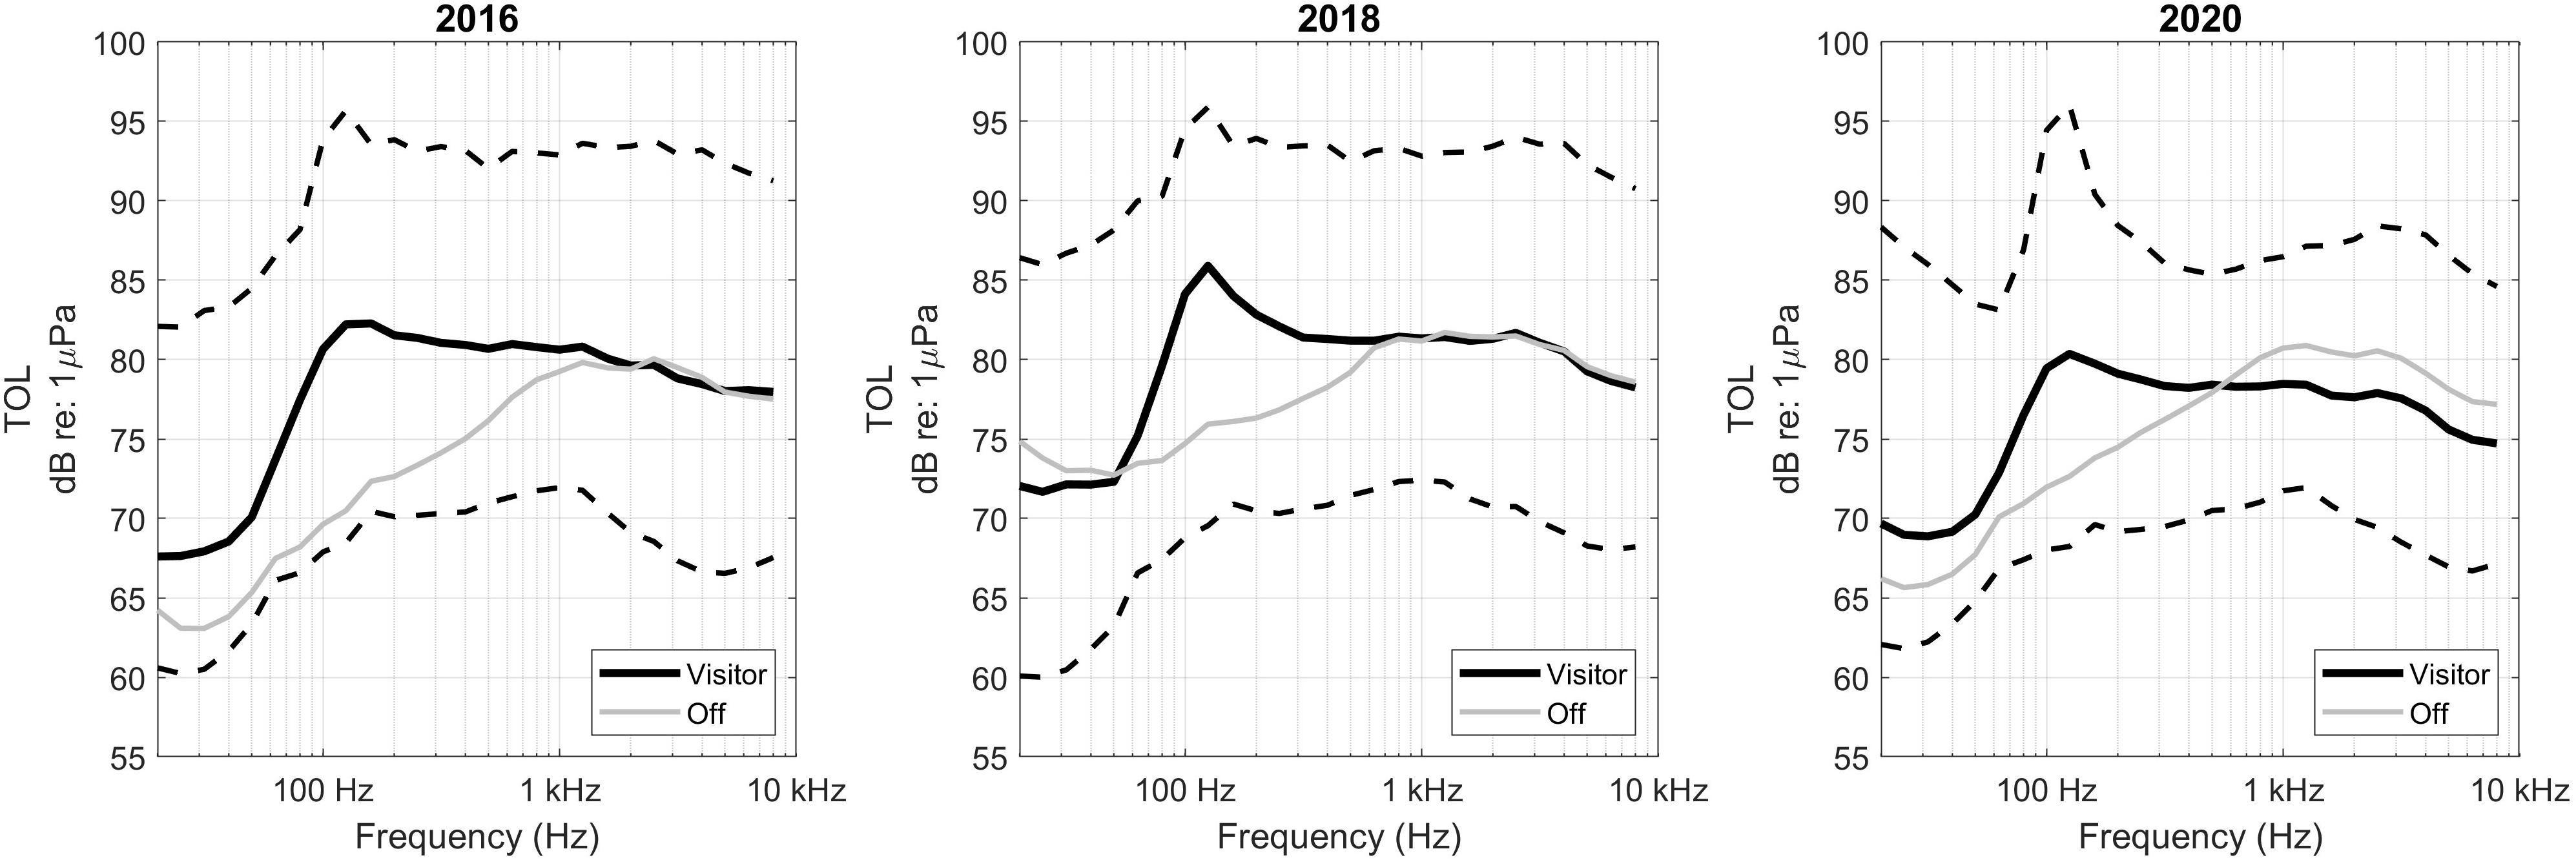
Figure 5. Median sound pressure levels for one-third octave bands (TOL) in the Visitor Season (May–September, black line) and Off Season (October–April, gray line) in lower Glacier Bay. 10th percentile and 90th percentile levels are shown as dotted lines. Peak at 125 Hz in Visitor Season curve corresponds with harbor seal vocalizations in May–July each year.
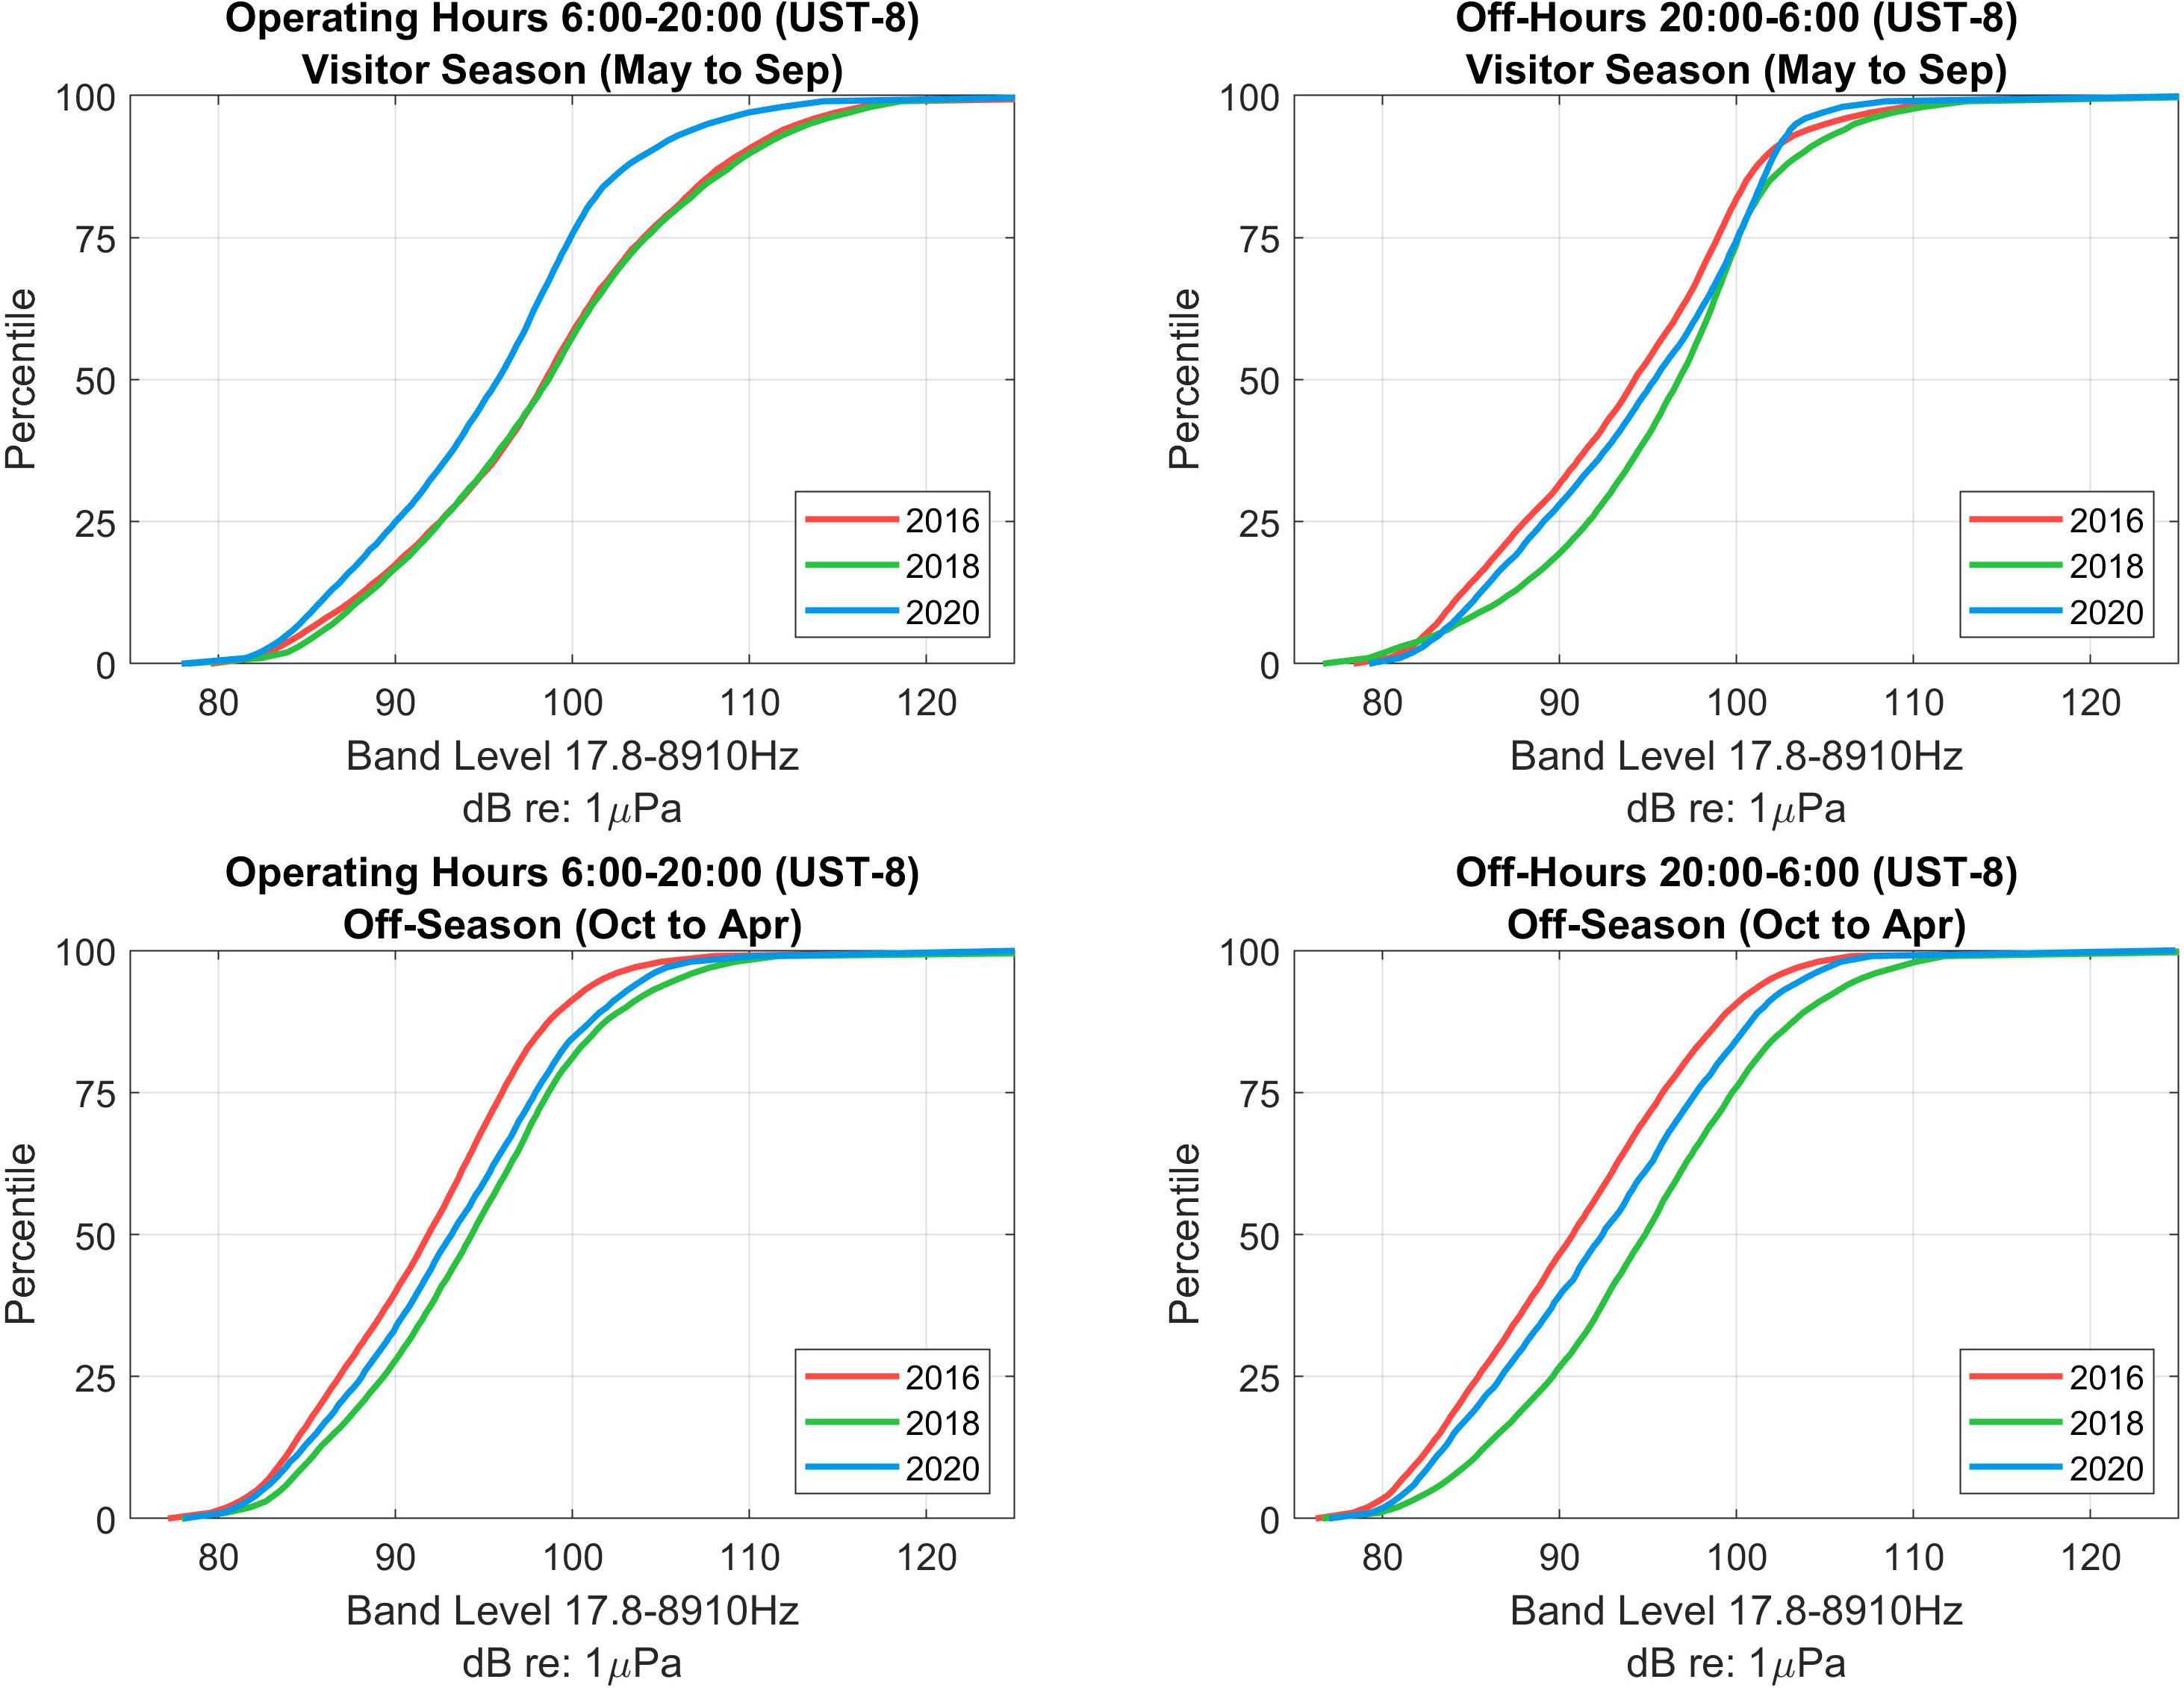
Figure 6. Cumulative Distribution of 10 min resolution Broadband noise levels (17.8–8,910 Hz) for Glacier Bay’s Visitor Season and Off Season during 6 a.m.–8 p.m. LT operating hours and 8 p.m.–6 a.m. LT Off Hours.
Monthly Variability in Ambient Noise
Within the Visitor Season, June, July, and August are the months with peak vessel-generated noise (Figure 7), with broadband noise levels (17.8–8,910 Hz) peaking in July each year during what we defined as Operating Hours of (06:00–20:00 LT; after Kipple and Gabriele, 2004a) which is not surprising in that vessel numbers peak in July as well (Figure 2). In the Off-Hours (20:00–06:00 LT), the years are somewhat similar, including 2020, suggesting that the soundscape did not systematically vary among the years of the study.
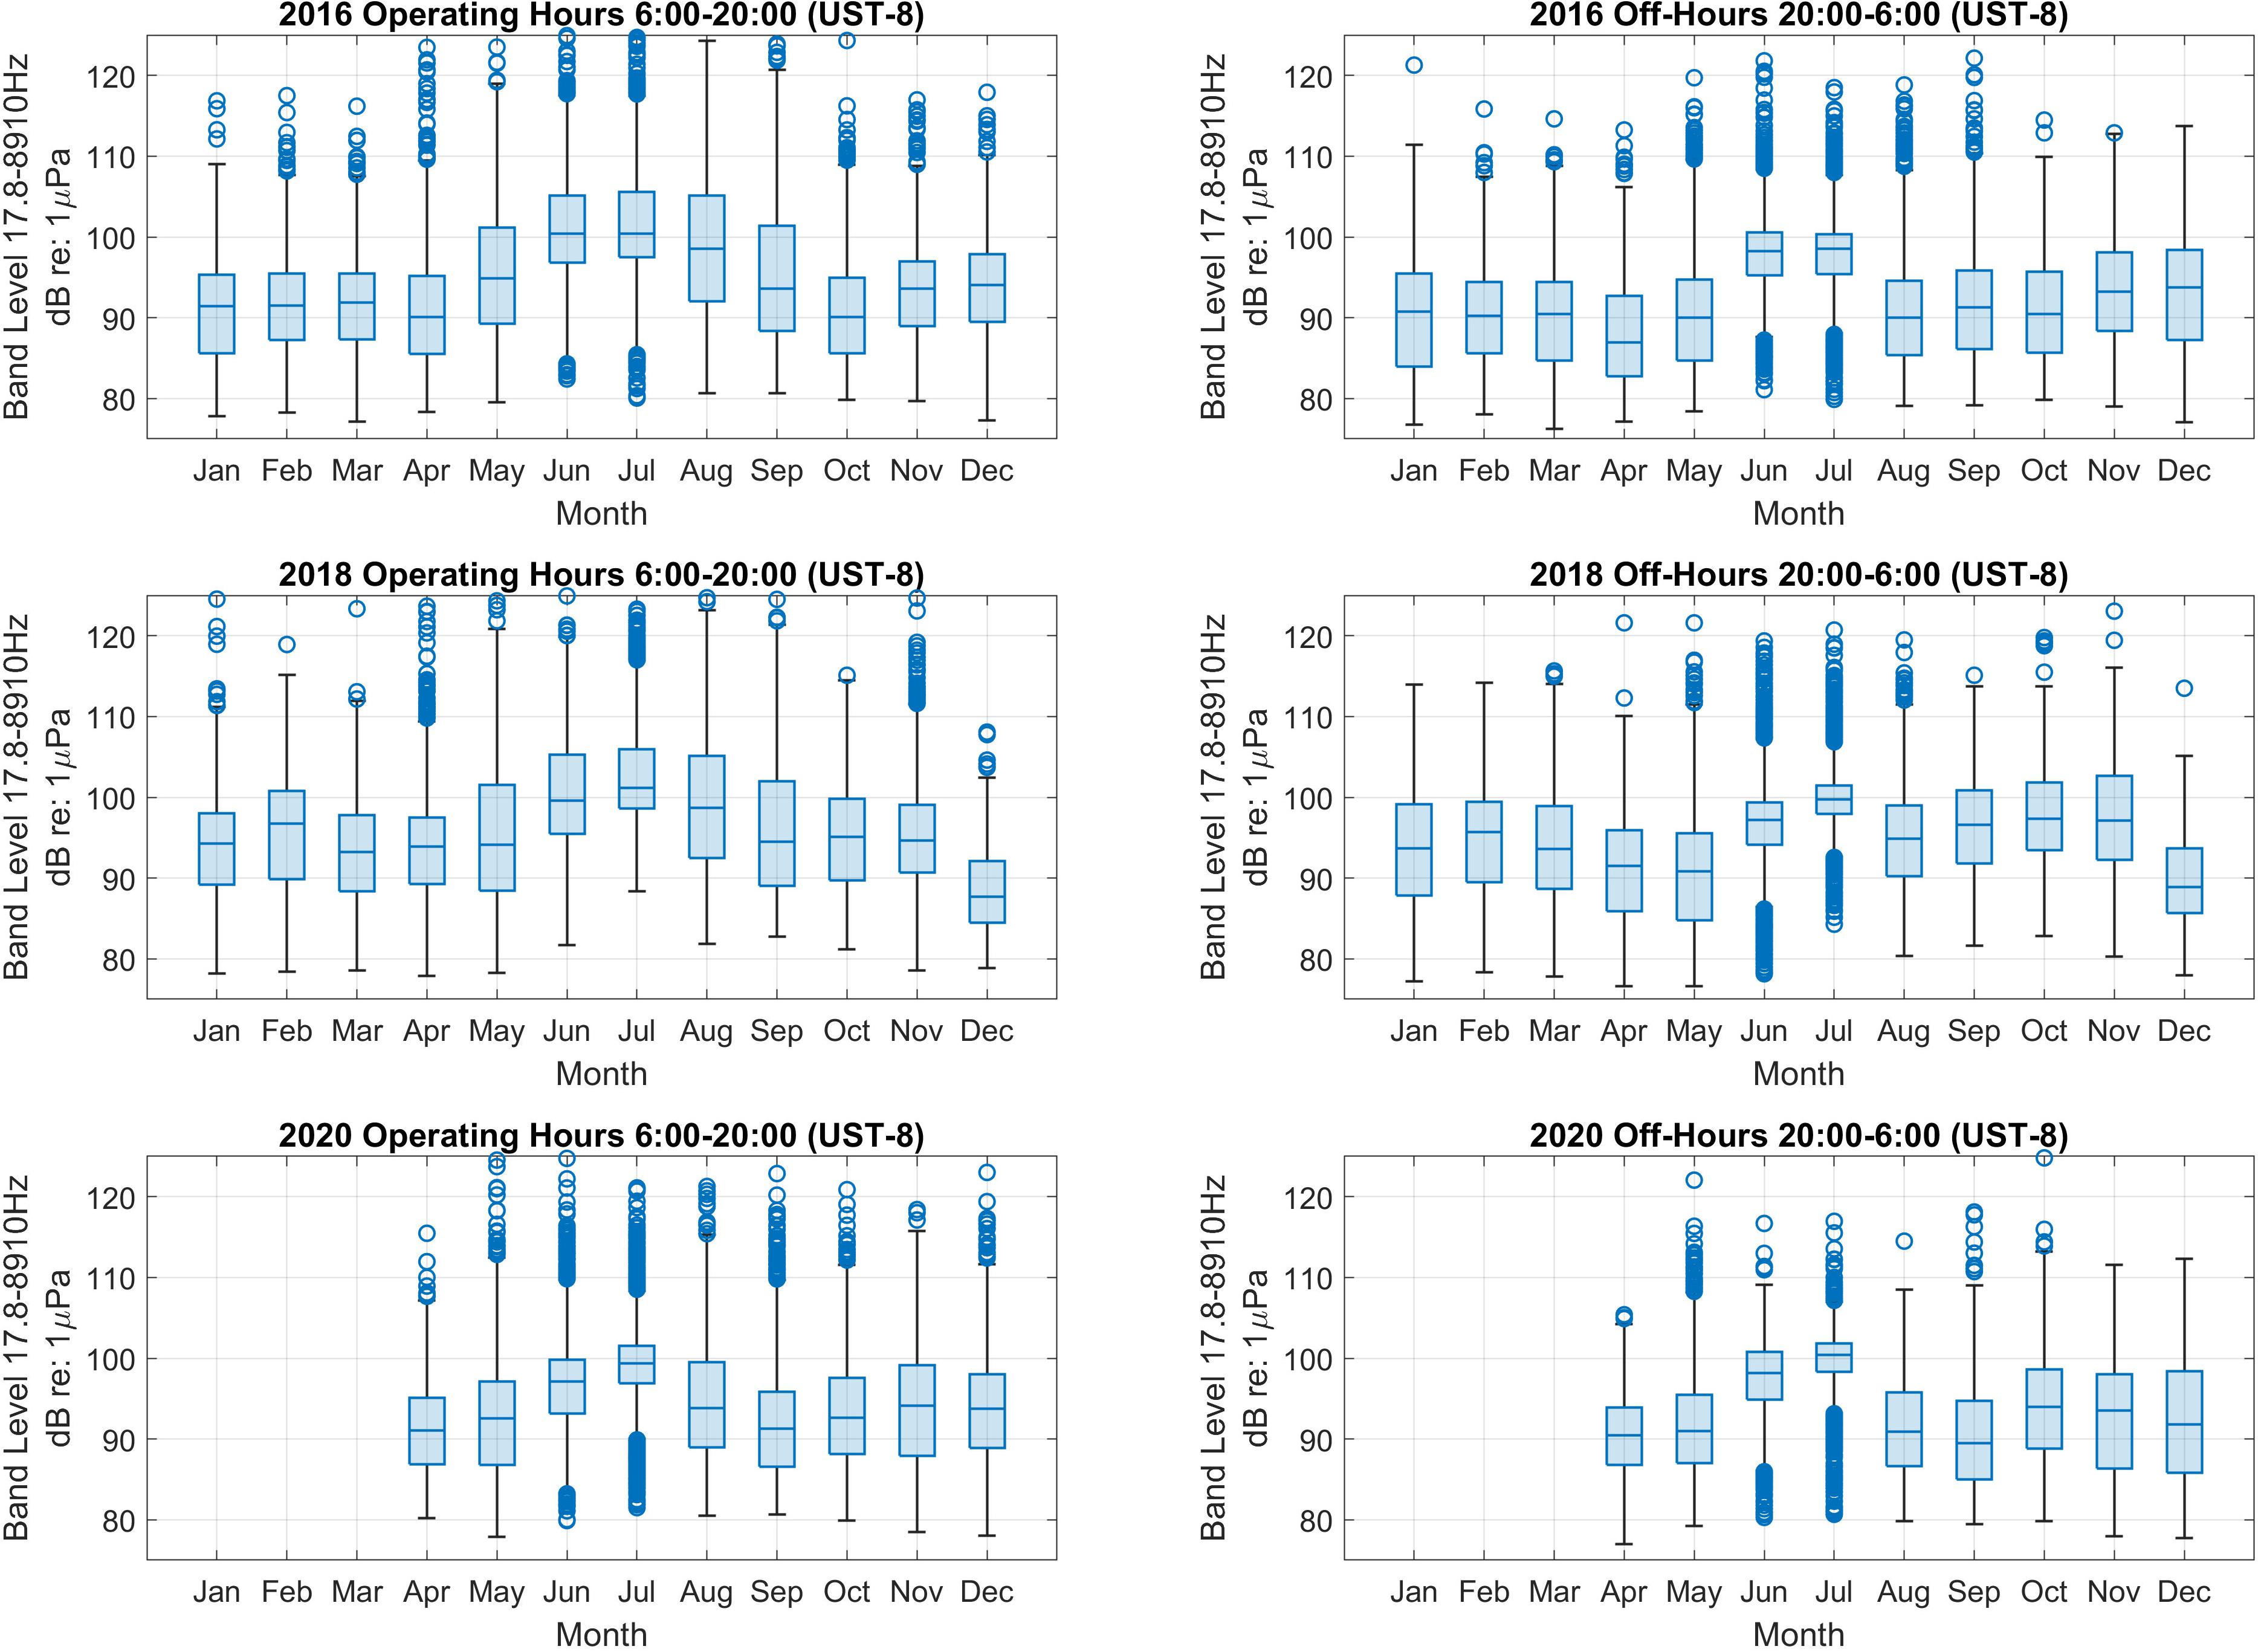
Figure 7. Box-plot showing monthly distributions of 10 min resolution broadband (17.8–8,910 Hz) noise levels for 2016, 2018, and 2020. On each box, the central mark indicates the median, and the bottom and top edges of the box indicate the 25th and 75th percentiles, respectively. The whiskers extend to the most extreme data points not considered outliers, and the outliers are plotted individually using the “o” symbol.
Hourly Variability in Ambient Noise
We calculated Leq10 min broadband (17.8–8,910 Hz) noise levels for 2016, 2018, and 2020 and summarized them by hour of day (Figure 8). In the 2020 Visitor Season, median hourly sound levels appeared to be less variable than in 2016 and 2018, which showed peaks in the early morning and late afternoon, and the lowest sound levels at 03:00 and 04:00 LT (Figure 8). In the Off Season, there was less hourly variation than the Visitor Season (Figure 8). These visible peaks in sound energy (Figures 3, 4, 8) led us to quantify and contrast the difference in noise levels between years during time blocks comprising the peak hours of vessel entry and exit of Glacier Bay. We calculated noise levels at 10 min resolution within 3 h time-blocks (00:00–03:00 LT, 06:00–09:00 LT, 09:00–12:00 LT etc.) each day during the Visitor Season (Figure 9). Overall, in the morning (06:00–09:00 LT) and afternoon (15:00–18:00 LT) time blocks, median broadband sound levels were 3.3–5.1 dB lower in 2020 than prior years. At the 95th percentile level, the loudest sounds at the hydrophone in 2020 were 107.3 dB whereas they were 113.6 and 115.0 dB in 2016 and 2018. In contrast, late at night when vessel traffic is uncommon (00:00–03:00), all three years had median broadband levels between 94.1 and 97.4 dB, and 2020 was similar at 96.7 dB. All the median values for 2020 regardless of time block fell within the night-time range of noise values, whereas all the daytime median values for years 2016 and 2018 exceeded the night-time range of median values. During the morning time-block (06:00–09:00) when cruise ships, the daily catamaran tour and other vessel enter Glacier Bay, 2016 and 2018 median broadband levels were around 100 dB, in contrast to 2020 with its median level of 95 dB (Table 1). At the 95th percentile level, the difference was even more pronounced, with morning and afternoon peak times in 2020 were 6.3–9.0 dB quieter than previous years. The loudest sounds at the hydrophone in 2020 were 107.2 dB whereas they were 114.4–116.2 dB in 2016 and 2018, respectively. Similarly, in the afternoon/evening time-block (15:00–18:00) when vessels exit Glacier Bay, median broadband levels in 2020 were 95.8 dB, compared to 99.1 and 99.5 dB in 2016 and 2018 (Table 1).
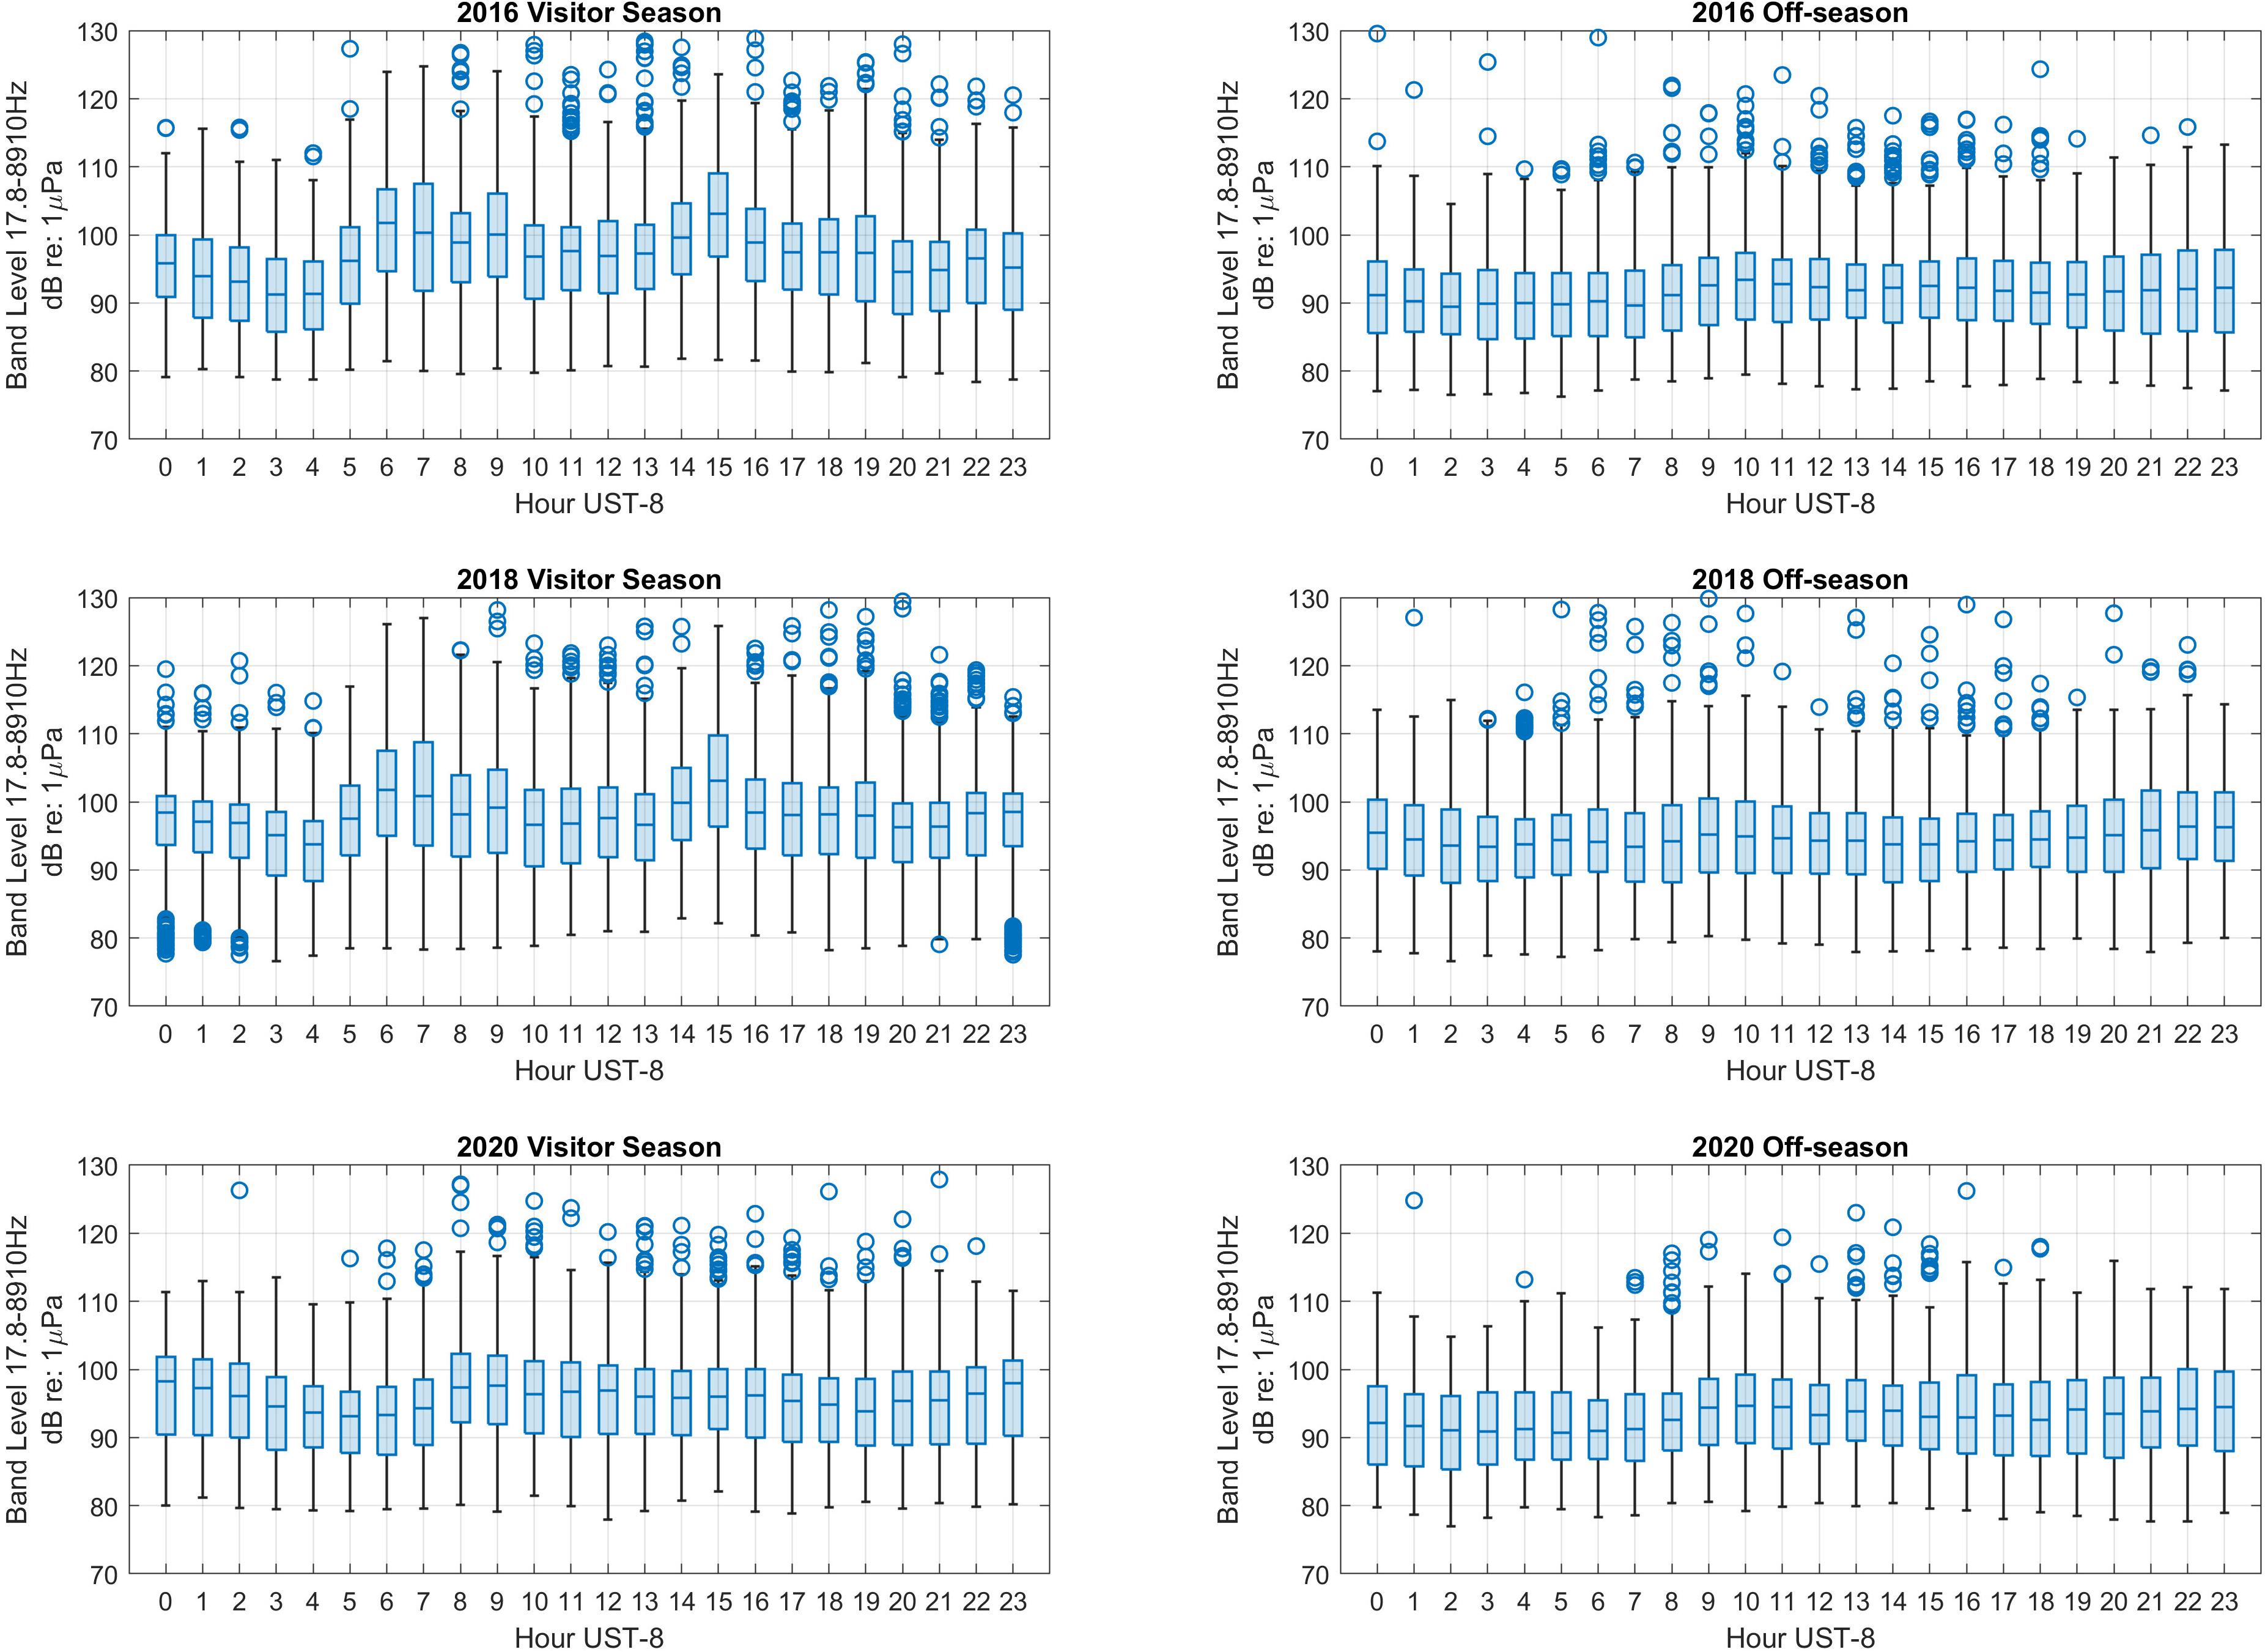
Figure 8. Box-plot showing hourly 10 min resolution broadband (17.8–8,910 Hz) noise levels for 2016, 2018, and 2020. On each box, the central mark indicates the median, and the bottom and top edges of the box indicate the 25th and 75th percentiles, respectively. The whiskers extend to the most extreme data points not considered outliers, and the outliers are plotted individually using the “o” symbol.
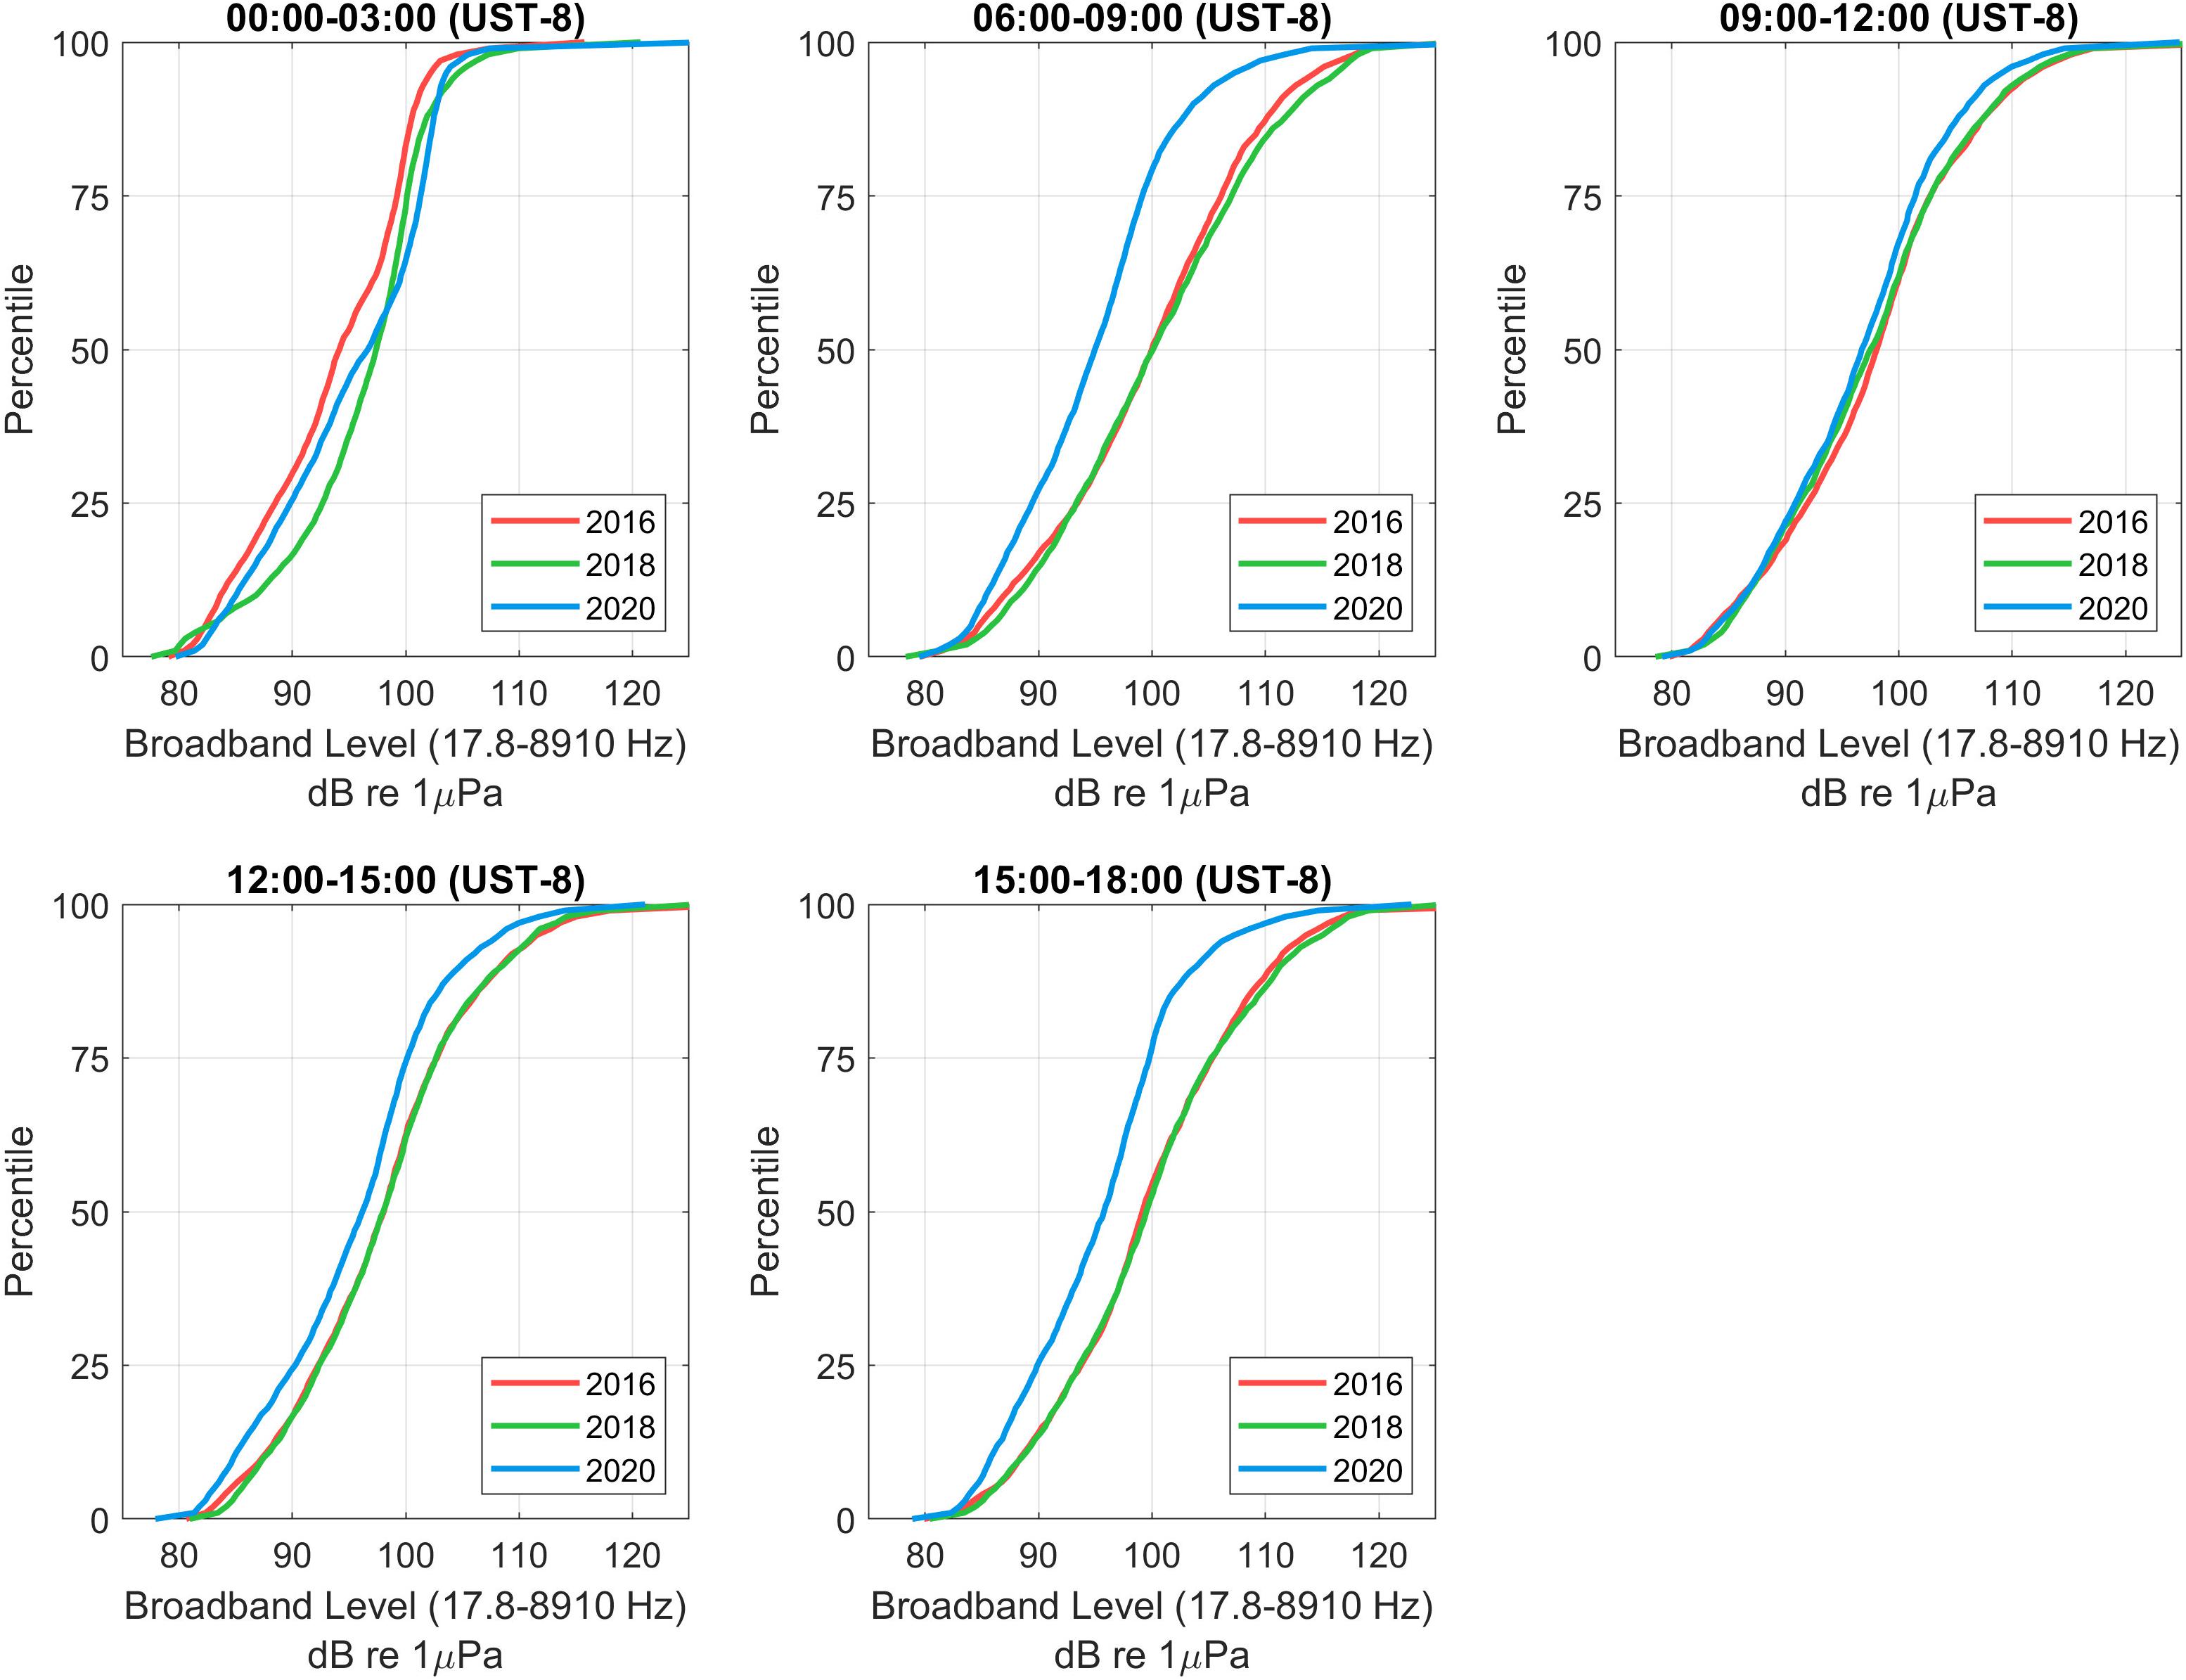
Figure 9. Cumulative distribution of broadband noise levels (17.8–8,910 Hz) in lower Glacier Bay in 2016, 2018, and 2020 for time blocks during daylight hours when vessel traffic is most common and late at night when vessel traffic is uncommon. 2020 is quietest in all time blocks except the midnight to 03:00 LT time block, when all years are equivalent.
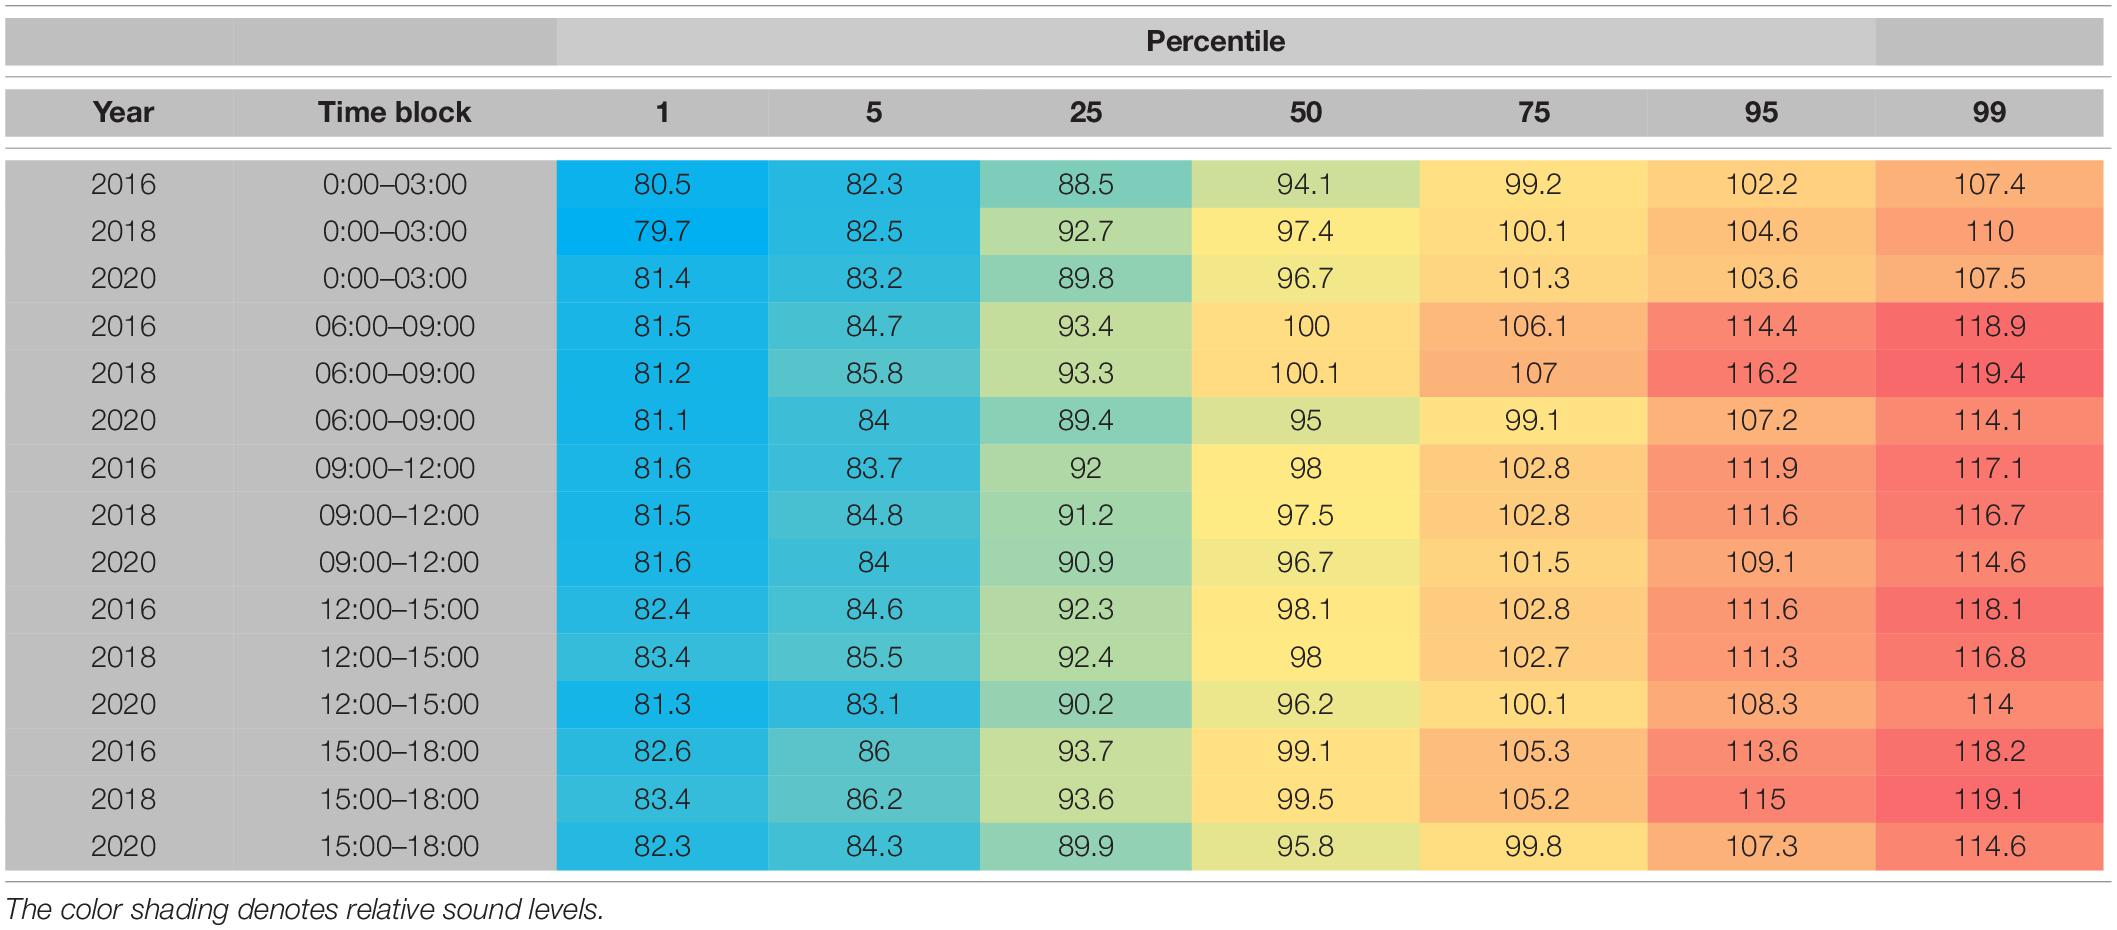
Table 1. Distribution of broadband sound levels (17.8–8,910 Hz dB re 1 μPa) at 10 min resolution in specified time-blocks (LT) in Glacier Bay during the May–September visitor season.
Discussion
Attributing underwater noise to specific vessel types is vital to efforts to reduce noise and preserve natural soundscapes. After estimating the acoustic contributions of cruise ships and tour vessels to Glacier Bay’s underwater sound environment (Frankel and Gabriele, 2017), the COVID-19 pandemic created an unintentional experiment which allowed us to directly measure underwater sound levels in the complete absence of cruise ships and assess their relative contribution directly for the first time, albeit complicated by simultaneous reductions in other vessel classes. The overall number of vessel entries in 2020 showed a 44–49% decline compared to 2016 and 2018, respectively. Traffic in 2020 was comprised mainly of private vessels, sport-fishing and sightseeing, and NPS vessels, although these vessel classes too were greatly reduced compared to 2016 and 2018 levels (Figure 2). By all measures, Glacier Bay’s underwater acoustic environment in 2020 was markedly quieter than 2016 and 2018 during the daytime Operating Hours during the May–September Visitor Season. Prior to 2020, there was a pronounced noise peak in the morning as the daily catamaran tour (NPS, unpublished data) and cruise ships (Supplementary Figures 7, 8) enter the bay and at their afternoon/evening departure. All classes of vessels had a role in the quieter underwater sound environment in 2020 but the acoustic contribution of tour vessels and cruise ships to the underwater soundscape is substantial, especially in terms of the loudest sounds (Table 1 and Supplementary Figure 1). The gradual return of tourism to Glacier Bay in the coming years will provide additional opportunity to explore the contributions of different vessel classes.
Scientific reports of changes in underwater sound levels during the COVID-19 pandemic are just starting to emerge. While it is not unexpected that the underwater acoustic environment would be characterized by lower sound levels when there are fewer vessels, the acoustic effects depend upon the circumstances. Near Vancouver, Canada, the pandemic-induced reduction in commercial shipping traffic resulted in 1.5–2.7 dB reductions in underwater noise in the 100 Hz band at three out of four hydrophone stations in the first 3 months of 2020, whereas the fourth hydrophone showed no difference in sound levels (Thomson and Barclay, 2020). Not all human activities or sectors of the maritime industry were equally affected during the pandemic (Ito et al., 2020; Millefiori et al., 2020; Yazir et al., 2020; Notteboom et al., 2021). In the Mediterranean, for example, decreases in shipping occurred more in coastal areas and lasted longer in sectors other than cargo and tanker shipping (March et al., 2020). Due to the pandemic’s sharp and lasting effects on Alaska tourism, the change in Glacier Bay’s acoustic environment may be one of the most distinct, because the area lacks other types of traffic that would occur in absence of tourism.
Human behavior appears to drive a clear diurnal pattern of vessel noise in Glacier Bay (Figure 3). Human use of Glacier Bay concentrates in the daytime, and in the summer months when the days are long and the weather is often favorable. Most cruise ships as well as the day-tour catamaran enter Glacier Bay early enough to take advantage of prime daylight hours to view the spectacular scenery of the park and exit the bay by late afternoon or early evening (Supplementary Figures 7, 8, NPS unpublished data). Although vessel noise was still evident in 2020, it began later in the morning and did not display a distinct peak, with vessels apparently entering and exiting the bay at various times of day (Figures 3, 8). The contrast in underwater sound levels between 2020 and prior years was much less distinct during Off Hours and Off Season. Previous noise characterization work using over 10,000 audio samples in 2000–2008 demonstrates that vessel noise was less common in the hours between 9:00 p.m and 5:00 a.m LT (Kipple and Gabriele, 2003; McKenna et al., 2017), suggesting that natural sounds such as wind, rain, and harbor seal vocalizations (in May–July) are the more prominent components of the underwater sound environment in late evening through early morning hours.
To understand the received levels in different frequency bands (Figure 5), it is important to note that the hydrophone is located in outer Bartlett Cove, in a location where all small craft and medium-sized tour vessels pass near or even directly over the hydrophone sensor. Thus, in 2020 when visitor traffic was composed predominantly of small vessels, most Glacier Bay vessel traffic was composed of the types of vessels that tend to pass close to the hydrophone. The individual noise events that comprise small vessel passages are a good representation of their influence on the soundscape wherever they travel in Glacier Bay. Cruise ships, in contrast, pass at a much greater distance from the hydrophone (for example vessel tracks see Gende et al., 2011; Frankel and Gabriele, 2017) and reduce their speed to embark and disembark NPS interpretive rangers outside Bartlett Cove. As such, measurements from the Bartlett Cove hydrophone are a minimal estimate of the contributions of cruise ships to Glacier Bay’s underwater soundscape, as they are farther from the hydrophone and are often likely to be louder when traveling at their full transiting speed (Kipple, 2002).
During the daytime in the Visitor Season as a whole, 2020 was markedly quieter, particularly in the 63.1–200 Hz bands (Figure 5 and Supplementary Table 1). For the Off Season, 2020 was not quietest, but note that the lack of data in January–mid-April likely missed the period of least vessel traffic (both because it was early in the COVID-19 pandemic and the Off Season). Focusing on the morning and afternoon time blocks when vessel traffic peaks occur (Figure 3 and Supplementary Figures 7, 8, McKenna et al., 2017), we found that 2020 median broadband levels were 3.5–5.0 dB quieter than in typical recent years, and that the 95th percentile levels were 7–8 dB quieter (Table 1 and Figure 9).
In the Off Season, the distribution of the acoustic energy among one-third octave bands (Figure 5) is similar in all years, particularly 2016 and 2020, with 2018 displaying the highest sound levels. Spring and fall wind events (Supplementary Figure 3) likely contribute to the increased median noise levels, which increase with increasing wind speed (Supplementary Figure 4). It is difficult to interpret the role of vessel noise in Glacier Bay’s Off Season in the absence of vessel traffic records for these time periods. During Visitor Season, there is pronounced difference between 2020 and prior years (Figure 5), notably between 100–200 Hz, that appears to be attributable to both vessel noise and biological sounds. In previous work, the distinct peak in the 125 Hz one-third octave band was attributed to harbor seal vocalizations (McKenna et al., 2017), but substantial sound energy for cruise ships also falls in the 63 and 125 Hz one-third octave bands (Kipple, 2002) which have been identified as important to quantifying and mitigating ship noise (Dekeling et al., 2014). The median 125 Hz peak is similar between 2016 and 2018 but 3 dB quieter in 2020. However, at the 95th percentile level (Figure 5) the 125 Hz peak is more pronounced, perhaps because noise from large vessels is absent.
Harbor seals have been documented to vocalize slightly louder in the presence of vessel noise in the context of typical Glacier Bay vessel traffic in 2015 (Matthews et al., 2020) but the anomalous quiet in 2020 may have created an acoustic environment where quieter (Derryberry et al., 2020) or less frequent vocalizations would suffice. Given the variability in the source levels of individual harbor seal roars (139–159 dBRMS re 1 μPa @ 1 m, 40–500 Hz, Matthews et al., 2017b), it could be that different males were defending territory near the hydrophone in each year. It is also possible that roaring males were farther away in 2020; reduced vessel traffic may have made available preferred habitat farther away from the hydrophone. Glacier Bay’s major harbor seal haul-outs are not near the hydrophone location, and the NPS standardized aerial haul-out surveys in 2020 were canceled due to COVID-19 safety concerns, but NPS opportunistic marine mammal sightings during humpback whale surveys documented the highest number of harbor seals since 1997 (NPS, unpublished data). While the current single-hydrophone system cannot determine differences in source levels, future work to discern the contribution of harbor seal roars to the observed acoustic differences could look for systematic differences in diurnal patterns, duration of calls, call rate, and received levels between years. White-crowned sparrows (Zonotrichia leucophrys) were documented to sing more quietly and their vocalizations traveled farther in newly quieted neighborhoods during COVID-19 (Derryberry et al., 2020). The pandemic-driven quiet period provides an important opportunity to observe changes in behavior in the context of restored acoustic habitats.
Previous work suggested that aggregate vessel noise on a typical day during Glacier Bay’s Visitor Season substantially masks humpback whale and harbor seal vocalizations and reduces their available communication space (Gabriele et al., 2018). That work also estimated that closely spaced cruise ship entries increased the estimated daily amount of communication space available to vocalizing whales and seals (Gabriele et al., 2018). Humpback whales have been found to increase the loudness of their calls in the presence of natural and manmade noise (the Lombard Effect), but were also less likely to vocalize when vessel noise was present (Fournet et al., 2018a) suggesting that they may wait for a quiet time to communicate. Although morning and afternoon concentrations of vessel noise markedly compromised the acoustic environment, we speculate that synchronized traffic with short, louder periods of time, to create quiet periods between vessel noise events, may be beneficial to marine mammal acoustic ecology, as opposed to prolonged time periods of noise without quiet periods (Heise et al., 2017; Merchant, 2019). Work in progress to examine humpback whale calling patterns in 2020 vs. previous years may further elucidate this question.
Our work and future studies will help inform efforts to maintain the integrity of marine protected areas while providing opportunities to visit and enjoy iconic places like Glacier Bay. Globally, there is growing recognition of human impacts on the underwater soundscape, efforts toward mitigation (e.g., European Commission, 2008; International Maritime Organization, 2014) and a slow but steady increase in knowledge of the direct and indirect effects that underwater noise has on a vast number of marine organisms and ecological processes (Duarte et al., 2021). To decrease vessel noise, vessel speed limits are particularly effective (Frankel and Gabriele, 2017; McKenna et al., 2017) and several other methods have been recommended, including reducing vessel traffic, routing vessel traffic away from sensitive marine resources, designing quieter vessels, and providing incentives for quieter vessels (International Maritime Organization, 2014; Heise et al., 2017; Merchant, 2019). Future work could examine the underwater noise budgets of Glacier Bay and other marine tourism destinations as a function of vessel size and the number of visitors carried. Continuing to characterize the acoustic environment and updating that knowledge as the fleet characteristics and/or vessel management strategies change should be considered a management and conservation priority.
While scientific knowledge of the mechanisms of biological effects often lags behind, it remains clear that global biological diversity is at risk from noise and myriad other sensory pollutants (Dominoni et al., 2020). Noise pollution in otherwise undeveloped environments degrades habitat for marine species whose vital life functions rely upon the underwater sound environment. Marine mammals and other taxa have methods of compensating for noise (Parks et al., 2009; Tennessen and Parks, 2016; Fournet et al., 2018a; Matthews et al., 2020) but the effectiveness of compensatory behavior and the ultimate effects of noise on reproductive success are unknown. In marine protected areas and elsewhere, underwater noise is just one of many stressors that affect marine wildlife (Hatch et al., 2012; Williams et al., 2015; Blair et al., 2016; Haver et al., 2019), for example, the recent catastrophic effects of changing climate and unpredictable conditions on Alaska’s marine ecosystems (Oliver et al., 2018; von Biela et al., 2019; Piatt et al., 2020; Arimitsu et al., 2021; Suryan et al., 2021). As maritime activities gradually resume in Glacier Bay and other areas, and marine protected area managers must rise to the challenge to use what has been learned in the pandemic-induced quiet to improve methods to mitigate vessel noise and foster healthy marine ecosystems in these vulnerable and important public resources.
Data Availability Statement
The data analyzed in this study is subject to the following licenses/restrictions: By February 2022, the datasets analyzed for this study will be available in the National Oceanic and Atmospheric Administration’s National Center for Environmental Information (NCEI) (https://www.ncei.noaa.gov). Requests to access these datasets should be directed to CG, Q2hyaXNfR2FicmllbGVAbnBzLmdvdg==.
Author Contributions
CG, DP, and HK conceived and designed the data analytical approach. CG collected and curated the acoustic and vessel traffic data. DP wrote the data analysis routines and created graphics. CG wrote the manuscript with contributions to drafting, critical review, and editorial input from DP and HK. All authors contributed to the article and approved the submitted version.
Funding
The data collection, system maintenance, and manuscript preparation was funded by the U.S. National Park Service commercial user fees. Data processing and analysis were funded by the Center for Conservation Bioacoustics, Cornell Lab of Ornithology, Cornell University.
Conflict of Interest
The authors declare that the research was conducted in the absence of any commercial or financial relationships that could be construed as a potential conflict of interest.
Acknowledgments
This hydrophone system design and maintenance that underlies Glacier Bay’s unique long time-series of underwater ambient noise data would not have been possible without the skill, dedication and good humor of Blair Kipple, Russ Dukek, Larry Arndt, Kyle Gustafson, and others at the U.S. Naval Surface Warfare Center’s Carderock Detachment. Many GBNP staff and volunteers helped with the underwater sound monitoring program over the years. Thanks to Jessica Chen at NAVFAC Pacific for helping jumpstart the 2020 data collection effort.
Supplementary Material
The Supplementary Material for this article can be found online at: https://www.frontiersin.org/articles/10.3389/fmars.2021.674787/full#supplementary-material
References
Amitai, E., and Nystuen, J. A. (2008). “Underwater acoustic measurements of rainfall,” in Precipitation: Advances in Measurement, Estimation and Prediction, ed. S. Michaelides (Berlin: Springer), 343–363. doi: 10.1007/978-3-540-77655-0_13
Andrew, R. K., Howe, B. M., and Mercer, J. A. (2011). Long-time trends in ship traffic noise for four sites off the North American West Coast. J. Acoust. Soc. Am. 129, 642–651. doi: 10.1121/1.3518770
Andrew, R. K., Howe, B. M., Mercer, J. A., and Dzieciuch, M. A. (2002). Ocean ambient sound: comparing the 1960s with the 1990s for a receiver off the California coast. Acoust. Res. Lett. Online 3, 65–70. doi: 10.1121/1.1461915
Arimitsu, M., Piatt, J., Hatch, S., Suryan, R. M., Batten, S., Bishop, M. A., et al. (2021). Heatwave-induced synchrony within forage fish portfolio disrupts energy flow to top pelagic predators. Glob. Chang. Biol. 27, 1859–1878. doi: 10.1111/gcb.15556
Barber, J. R., Burdett, C. L., Reed, S. E., Warner, K. A., Formichella, C., Crooks, K. R., et al. (2011). Anthropogenic noise exposure in protected natural areas: estimating the scale of ecological consequences. Landsc. Ecol. 26, 1281–1295. doi: 10.1007/s10980-011-9646-7
Barlett, M. L., and Wilson, G. R. (2002). Characteristics of small boat signatures. J. Acoust. Soc. Am. 112:2221. doi: 10.1121/1.4778778
Blair, H. B., Merchant, N. D., Friedlaender, A. S., Wiley, D. N., and Parks, S. E. (2016). Evidence for ship noise impacts on humpback whale foraging behaviour. Biol. Lett. 12:20160005. doi: 10.1098/rsbl.2016.0005
Brumm, H., and Slabbekoorn, H. (2005). Acoustic communication in noise. Adv. Study Behav. 35, 151–209.
Chapman, N. R., and Price, A. (2011). Low frequency deep ocean ambient noise trend in the Northeast Pacific Ocean. J. Acoust. Soc. Am. 129, EL161–EL165.
Dekeling, R. P. A., Tasker, M. L., Van der Graaf, A. J., Ainslie, M. A., Andersson, M. H., André, M., et al. (2014). Monitoring Guidance for Underwater Noise in European Seas, Part I: Executive Summary. A Guidance Document within the Common Implementation Strategy for the Marine Strategy Framework Directive by MSFD Technical Subgroup on Underwater Noise. Luxembourg: Publications Office of the European Union.
Derryberry, E. P., Phillips, J. N., Derryberry, G. E., Blum, M. J., and Luther, D. (2020). Singing in a silent spring: birds respond to a half-century soundscape reversion during the COVID-19 shutdown. Science 370, 575–579. doi: 10.1126/science.abd5777
Dominoni, D. M., Halfwerk, W., Baird, E., Buxton, R. T., Fernández-Juricic, E., Fristrup, K. M., et al. (2020). Why conservation biology can benefit from sensory ecology. Nat. Ecol. Evol. 4, 502–511. doi: 10.1038/s41559-020-1135-4
Duarte, C. M., Chapuis, L., Collin, S. P., Costa, D. P., Devassy, R. P., Eguiluz, V. M., et al. (2021). The soundscape of the Anthropocene ocean. Science 371:eaba4658. doi: 10.1126/science.aba4658
Dugan, P. J., Ponirakis, D. W., Zollweg, J. A., Pitzrick, M. S., Morano, J. L., Warde, A. M., et al. (2011). “SEDNA – bioacoustic analysis toolbox: matlab platform to support high performance computing, noise analysis, event detection and event modeling,” in Proceedings of the IEEE OCEANS 2011, (Kona, HI).
Erbe, C. (2002). Underwater noise of whale-watching boats and potential effects on killer whales (Orcinus orca), based on an acoustic impact model. Mar. Mamm. Sci. 18, 394–418. doi: 10.1111/j.1748-7692.2002.tb01045.x
Erbe, C., Liong, S., Koessler, M. W., Duncan, A. J., and Gourlay, T. (2016). Underwater sound of rigid-hulled inflatable boats. J. Acoust. Soc. Am. 139, EL223–EL227.
European Commission (2008). Directive 2017/845 of the European Parliament and of the Council as of 17 June 2008 Establishing a Framework for Community Action in the Field of Marine Environmental Policy (Marine Strategy Framework Directive) OJ L 164.25.6.2008. Brussels: European Commission, 19.
Federal Register (2020). No Sail Order and Suspension of Further Embarkation; Notice of Modification and Extension and Other Measures Related to Operations. Available online at: (https://www.federalregister.gov/documents/2020/04/15/2020-07930/no-sail-order-and-suspension-of-further-embarkation-notice-of-modification-and-extension-and-other) (accessed June 3, 2021).
Fournet, M. E., Matthews, L. P., Gabriele, C. M., Haver, S., Mellinger, D. K., and Klinck, H. (2018a). Humpback whales Megaptera novaeangliae alter calling behavior in response to natural sounds and vessel noise. Mar. Ecol. Prog. Ser. 607, 251–268. doi: 10.3354/meps12784
Fournet, M. E., Matthews, L. P., Gabriele, C. M., Mellinger, D. K., and Klinck, H. (2018b). Source levels of foraging humpback whale calls. J. Acoust. Soc. Am. 143, EL105–EL111.
Frankel, A. S., and Gabriele, C. M. (2017). Predicting the acoustic exposure of humpback whales from cruise and tour vessel noise in Glacier Bay, Alaska, under different management strategies. Endanger. Species Res. 34, 397–415. doi: 10.3354/esr00857
Gabriele, C. M., Ponirakis, D. W., Clark, C. W., Womble, J. N., and Vanselow, P. (2018). Underwater acoustic ecology metrics in an Alaska marine protected area reveal marine mammal communication masking and management alternatives. Front. Mar. Sci. 5:270. doi: 10.3389/fmars.2018.00270
Gende, S. M., Hendrix, A. N., Harris, K. R., Eichenlaub, B., Nielsen, J., and Pyare, S. (2011). A Bayesian approach for understanding the role of ship speed in whale–ship encounters. Ecol. Appl. 21, 2232–2240. doi: 10.1890/10-1965.1
Hatch, L. T., Clark, C. W., Van Parijs, S. M., Frankel, A. S., and Ponirakis, D. W. (2012). Quantifying loss of acoustic communication space for right whales in and around a U.S. national marine sanctuary. Conserv. Biol. 26, 983–994. doi: 10.1111/j.1523-1739.2012.01908.x
Haver, S. M., Fournet, M. E., Dziak, R. P., Gabriele, C., Gedamke, J., Hatch, L. T., et al. (2019). Comparing the underwater soundscapes of four US National Parks and Marine Sanctuaries. Front. Mar. Sci. 6:500. doi: 10.3389/fmars.2019.00500
Heise, K., Barrett-Lennard, L., Chapman, R., Dakin, T., Erbe, C., Hannay, D. E., et al. (2017). Proposed metrics for the management of underwater noise for southern resident killer whales. Tech. Rep. 31. doi: 10.25317/CORI20172
Houghton, J., Holt, M. M., Giles, D. A., Hanson, M. B., Emmons, C. K., Hogan, J. T., et al. (2015). The relationship between vessel traffic and noise levels received by killer whales (Orcinus orca). PloS one 10:e0140119. doi: 10.1371/journal.pone.0140119
International Maritime Organization (2014). Guidelines for the Reduction of Underwater Noise from Commercial Shipping to Address Adverse Impacts on Marine Life. MEPC.1/Circ.833. London: International Maritime Organization.
Ito, H., Hanaoka, S., and Kawasaki, T. (2020). The cruise industry and the COVID-19 outbreak. Transp. Res. Interdiscip. Perspect. 5:100136. doi: 10.1016/j.trip.2020.100136
Kipple, B. M. (2002). Southeast Alaska Cruise ship Underwater Acoustic Noise. Naval Surface Warfare Center report NSWCCD-71-TR-2002/574. Bremerton, WA: Naval Surface Warfare Center, 84.
Kipple, B., and Gabriele, C. (2003). Glacier Bay Watercraft Noise: Underwater Acoustic Noise Levels of Watercraft Operated by Glacier Bay National Park and Preserve as measured in 2000 and 2002. Bremerton, WA: Naval Surface Warfare Center – Carderock Division, 54.
Kipple, B. M., and Gabriele, C. M. (2004a). Glacier Bay Underwater Noise – August 2000-August 2002. report NSWCCD-71-TR-2004/521. Bremerton, WA: Naval Surface Warfare Center, 70.
Kipple, B. M., and Gabriele, C. M. (2004b). Glacier Bay Watercraft Noise - Noise Characterization for Tour, Charter, Private and Government Vessels. Bremerton, WA: Naval Surface Warfare Center.
Knudsen, V. O., Alford, R. S., and Emling, J. W. (1948). Digital communications. J. Mar. Res. 7:410.
Malme, C. I., Miles, P. R., and McElroy, P. T. (1981). Acoustic environment of humpback whales in Glacier Bay and Frederick Sound, Alaska. J. Acoust. Soc. Am. 70:S85.
March, D., Metcalfe, K., Tintoré, J., and Godley, B. (2020). Tracking the global reduction of marine traffic during the COVID-19 pandemic. Nat. Commun. 12, 1–12.
Matthews, L. P., Fournet, M. E., Gabriele, C., Klinck, H., and Parks, S. E. (2020). Acoustically advertising male harbour seals in southeast Alaska do not make biologically relevant acoustic adjustments in the presence of vessel noise. Biol. Lett. 16:20190795. doi: 10.1098/rsbl.2019.0795
Matthews, L. P., Gabriele, C. M., and Parks, S. E. (2017a). The role of season, tide, and diel period in the presence of harbor seal (Phoca vitulina) breeding vocalizations in glacier bay national park and preserve, Alaska. Aquat. Mamm. 43, 537–546.
Matthews, L. P., Parks, S. E., Fournet, M. E., Gabriele, C. M., Womble, J. N., and Klinck, H. (2017b). Source levels and call parameters of harbor seal breeding vocalizations near a terrestrial haulout site in Glacier Bay National Park and Preserve. J. Acoust. Soc. Am. 141, EL274–EL280.
McDonald, M. A., Hildebrand, J. A., and Wiggins, S. M. (2006). Increases in deep ocean ambient noise in the Northwest Pacific west of San Nicolas Island, California. J. Acoust. Soc. Am. 120, 711–717.
McKenna, M. F., Gabriele, C. M., and Kipple, B. (2017). Effects of marine vessel management on the underwater acoustic environment of Glacier Bay National Park, AK. Ocean Coast. Manag. 139, 102–112.
McKenna, M. F., Ross, D., Wiggins, S. M., and Hildebrand, J. A. (2012). Underwater radiated noise from modern commercial ships. J. Acoust. Soc. Am. 131:92e103.
Merchant, N. D. (2019). Underwater noise abatement: economic factors and policy options. Environ. Sci. Policy 92, 116–123.
Miksis-Olds, J. L., and Nichols, S. M. (2016). Is low frequency ocean sound increasing globally? J. Acoust. Soc. Am. 139, 501–511.
Miksis-Olds, J. L., Bradley, D. L., and Maggie Niu, X. (2013). Decadal trends in Indian Ocean ambient sound. J. Acoust. Soc. Am. 134, 3464–3475.
Millefiori, L. M., Braca, P., Zissis, D., Spiliopoulos, G., Marano, S., Willett, P. K., et al. (2020). Covid-19 Impact on Global Maritime Mobility. arXiv [Preprint]. Available online at: https://arxiv.org/abs/2009.06960 (accessed June 3, 2021).
Mohl, B., and Andersen, S. (1973). Echolocation: high frequency component in the click of the harbor porpoise (Phocoena phocoena). J. Acoust. Soc. Am. 54, 1368–1372.
Notteboom, T., Pallis, T., and Rodrigue, J. P. (2021). Disruptions and resilience in global container shipping and ports: the COVID-19 pandemic versus the 2008–2009 financial crisis. Marit. Econ. Logist. 23, 179–210. doi: 10.1057/s41278-020-00180-5
Oliver, E. C., Donat, M. G., Burrows, M. T., Moore, P. J., Smale, D. A., Alexander, L. V., et al. (2018). Longer and more frequent marine heatwaves over the past century. Nat. Commun. 9:1324.
Parks, S. E., Urazghildiiev, I., and Clark, C. W. (2009). Variability in ambient noise levels and call parameters of North Atlantic right whales in three habitat areas. J. Acoust. Soc. Am. 125, 1230–1239.
Payne, R. S., and Webb, D. (1971). Orientation by means of long range acoustic signaling in baleen whales. Ann. N.Y. Acad. Sci. 188, 110–141.
Piatt, J. F., Parrish, J. K., Renner, H. M., Schoen, S. K., Jones, T. T., Arimitsu, M. L., et al. (2020). Extreme mortality and reproductive failure of common murres resulting from the northeast Pacific marine heatwave of 2014-2016. PLoS One 15:e0226087. doi: 10.1371/journal.pone.0226087
Richardson, W. J., Greene, C. R., Malme, C. I., and Thomson, D. H. (1995). Marine Mammals and Noise. San Diego, CA: Academic Press.
Suryan, R. M., Arimitsu, M. L., Coletti, H. A., Hopcroft, R. R., Lindeberg, M. R., Barbeaux, S. J., et al. (2021). Ecosystem response persists after a prolonged marine heatwave. Sci. Rep. 11:115.
Tennessen, J. B., and Parks, S. E. (2016). Acoustic propagation modeling indicates vocal compensation in noise improves communication range for North Atlantic right whales. Endanger. Species Res. 30, 225–237.
Thomson, D. J., and Barclay, D. R. (2020). Real-time observations of the impact of COVID-19 on underwater noise. J. Acoust. Soc. Am. 147, 3390–3396.
Transport Canada (2020). Minister Garneau Announces Extended Measures for Cruise Ships and Pleasure Craft in Canada. Ottawa, ON: Transport Canada.
Tyack, P. L. (2008). Implications for marine mammals of large-scale changes in the marine acoustic environment. J. Mamm. 89, 549–558. doi: 10.1644/07-MAMM-S-307R.1
Veirs, S., Veirs, V., and Wood, J. D. (2016). Ship noise extends to frequencies used for echolocation by endangered killer whales. PeerJ 4:e1657.
von Biela, V. R., Arimitsu, M. L., Piatt, J. F., Heflin, B., Schoen, S. K., Trowbridge, J. L., et al. (2019). Extreme reduction in nutritional value of a key forage fish during the Pacific marine heatwave of 2014–2016. Mar. Ecol. Prog. Ser. 613, 171–182.
Wenz, G. M. (1962). Acoustic ambient noise in the ocean: spectra and sources. J. Acoust. Soc. Am. 34, 1936–1956.
Wild, L. A., and Gabriele, C. M. (2014). Putative contact calls made by humpback whales (Megaptera novaeangliae) in southeastern Alaska. Can. Acoust. 42, 23–31.
Williams, R., Erbe, C., Ashe, E., and Clark, C. W. (2015). Quiet (er) marine protected areas. Mar. Pollut. Bull. 100, 154–161.
Keywords: Alaska, Glacier Bay National Park, marine protected area, soundscape, marine mammal, harbor seal (Phoca vitulina), underwater sound
Citation: Gabriele CM, Ponirakis DW and Klinck H (2021) Underwater Sound Levels in Glacier Bay During Reduced Vessel Traffic Due to the COVID-19 Pandemic. Front. Mar. Sci. 8:674787. doi: 10.3389/fmars.2021.674787
Received: 02 March 2021; Accepted: 25 May 2021;
Published: 25 June 2021.
Edited by:
Renata Sousa-Lima, Federal University of Rio Grande do Norte, BrazilReviewed by:
Nathan D. Merchant, Centre for Environment, Fisheries and Aquaculture Science (CEFAS), United KingdomDouglas Wartzok, Florida International University, United States
Copyright © 2021 Gabriele, Ponirakis and Klinck. This is an open-access article distributed under the terms of the Creative Commons Attribution License (CC BY). The use, distribution or reproduction in other forums is permitted, provided the original author(s) and the copyright owner(s) are credited and that the original publication in this journal is cited, in accordance with accepted academic practice. No use, distribution or reproduction is permitted which does not comply with these terms.
*Correspondence: Christine M. Gabriele, Y2hyaXNfZ2FicmllbGVAbnBzLmdvdg==