 Raphaëlle Descôteaux1*
 Elizaveta Ershova1,2,3
 Owen S. Wangensteen1
 Kim Præbel1
 Paul E. Renaud4,5
 Finlo Cottier1,6
 Bodil A. Bluhm1
- 1UiT, The Arctic University of Norway, Tromsø, Norway
- 2Norwegian Institute of Marine Research, Bergen, Norway
- 3Shirshov Institute of Oceanology, Russian Academy of Sciences, Moscow, Russia
- 4Akvaplan-niva, Fram Centre for Climate and the Environment, Tromsø, Norway
- 5The University Centre in Svalbard, Svalbard, Norway
- 6Scottish Association for Marine Science, Oban, United Kingdom
In many species of marine benthic invertebrates, a planktonic larval phase plays a critical role in dispersal. Very little is known about the larval biology of most species, however, in part because species identification has historically been hindered by the microscopic size and morphological similarity among related taxa. This study aimed to determine the taxonomic composition and seasonal distribution of meroplankton in the Barents Sea, across the Polar Front. We collected meroplankton during five time points seasonally and used high-throughput DNA barcoding of individual larvae to obtain species-level information on larval seasonality. We found that meroplankton was highly diverse (72 taxa from eight phyla) and present in the Barents Sea year-round with a peak in abundance in August and November, defying the conventional wisdom that peak abundance would coincide with the spring phytoplankton bloom. Ophiuroids, bivalves, and polychaetes dominated larval abundance while gastropods and polychaetes accounted for the bulk of the taxon diversity. Community structure varied seasonally and total abundance was generally higher south of the Polar Front while taxon richness was overall greater to the north. Of the species identified, most were known inhabitants of the Barents Sea. However, the nemertean Cephalothrix iwatai and the brittle star Ophiocten gracilis were abundant in the meroplankton despite never having been previously recorded in the northern Barents Sea. The new knowledge on seasonal patterns of individual meroplanktonic species has implications for understanding environment-biotic interactions in a changing Arctic and provides a framework for early detection of potential newcomers to the system.
Introduction
In the Arctic, and around the world’s oceans, benthic invertebrates play important roles in carbon cycling and remineralization of nutrients (Renaud et al., 2007a), as prey for fish (Eriksen et al., 2020), birds (Merkel et al., 2007), and mammals (Dehn et al., 2007), as well as supporting important fisheries (e.g., the Northern shrimp Pandalus borealis, Garcia, 2007), and subsistence harvesting (Rapinski et al., 2018). The Barents Sea, located in the Atlantic gateway to the Arctic, is home to over 3,000 benthic invertebrate taxa, making it one of the most diverse regions of the Arctic (Piepenburg et al., 2011; Renaud et al., 2015).
Most studies on the benthic invertebrates of the Barents Sea have focused on the adult stage (Carroll et al., 2008; Cochrane et al., 2009; Jørgensen et al., 2015; Zakharov et al., 2020). For a large proportion of benthic invertebrates, however, the larval phase constitutes the main vector for dispersal, having important implications for population connectivity (Cowen and Sponaugle, 2009), species conservation and management of marine protected areas (Krueck et al., 2017), dispersal of invasive species and understanding of the impacts of environmental change on benthic communities (Levin, 2006; Renaud et al., 2015). Compared to adults, planktonic stages are relatively short-lived, with a presence in the water column from hours to months (Shanks, 2009), though this becomes longer in colder temperatures, sometimes more than doubling in duration with a drop of a few degrees (O’Connor et al., 2007). Therefore, repeated sampling over the course of a year is required to capture as much of the diversity as possible. Such seasonal sampling of Arctic meroplankton has mostly been done in fjordic environments to date (Kuklinski et al., 2013; Stübner et al., 2016; Brandner et al., 2017; Michelsen et al., 2017). There, most meroplanktonic groups peak in abundance in the spring/early summer, around the time of the phytoplankton bloom, presumably to maximize food availability for the larvae. The few studies that focus on Arctic offshore locations only sampled during a short time window, together covering only the period from May to September (Clough et al., 1997; Schlüter and Rachor, 2001; Fetzer and Arntz, 2008). A peak in larval abundance coinciding with a peak in local primary production, as occurs in Arctic and Antarctic fjords and coasts (Bowden et al., 2009; Arendt et al., 2013; Michelsen et al., 2017; Presta et al., 2019) as well as in lower latitude regions (Highfield et al., 2010), is often assumed but has not yet been corroborated with seasonally resolved sampling on Arctic shelves.
The spring phytoplankton bloom is broadly found to occur in May in the southern Barents Sea, when sufficient light and stratification of the water column favor bloom development. In ice-covered waters of the northern Barents Sea, however, the phenology of the phytoplankton bloom is more variable, occurring anytime from May to July depending on timing of sea ice retreat (Dalpadado et al., 2020; Dong et al., 2020). In these seasonally ice-covered waters, an ice algal bloom as well as an under-ice phytoplankton bloom can contribute primary production to the system prior to ice melt, extending the duration of the productive period (Syvertsen, 1991; Leu et al., 2015; Ardyna et al., 2020). Even with these additional sources of production in ice-covered waters, however, total primary production in the northern Barents Sea is substantially lower than in the southern Barents Sea (Slagstad et al., 2011; Hunt et al., 2013).
The Barents Sea is an Arctic inflow shelf which receives large inputs of Atlantic Water (Carmack and Wassmann, 2006; Jakobsen et al., 2011). As this Atlantic Water flows north and eastward, it eventually meets colder and fresher Arctic Water flowing south (Oziel et al., 2016; Figure 1). The boundary area between these two major water masses is termed the Polar Front (Oziel et al., 2016). The front is relatively narrow and its location constrained largely by topography, remaining relatively constant through time. East of approximately 32° E the Polar Front splits into a southern and a northern front, the locations of which are typically more variable than the front west of 32°E (Oziel et al., 2016), though Barton et al. (2018) noted that the location of the northern front is also well constrained by topography. As Atlantic Water cools and mixes with other water masses in the Barents Sea, it becomes denser and sinks, forming Barents Sea Water (Oziel et al., 2016) which can then penetrate under Arctic Water north of the Polar Front (Lind et al., 2012). Atlantic Water entering the Barents Sea from the south can supply high abundances of biota, including zooplankton, onto the Arctic shelf (Wassmann et al., 2015; Hunt et al., 2016), potentially including planktonic life stages of more southern benthic species. Arctic inflow shelves such as the Barents Sea are thus likely to increasingly receive boreal species extending their range into the Arctic as the climate continues to warm (Renaud et al., 2015). At this time, we do not know which species have the capacity to reach the Arctic during their larval stage.
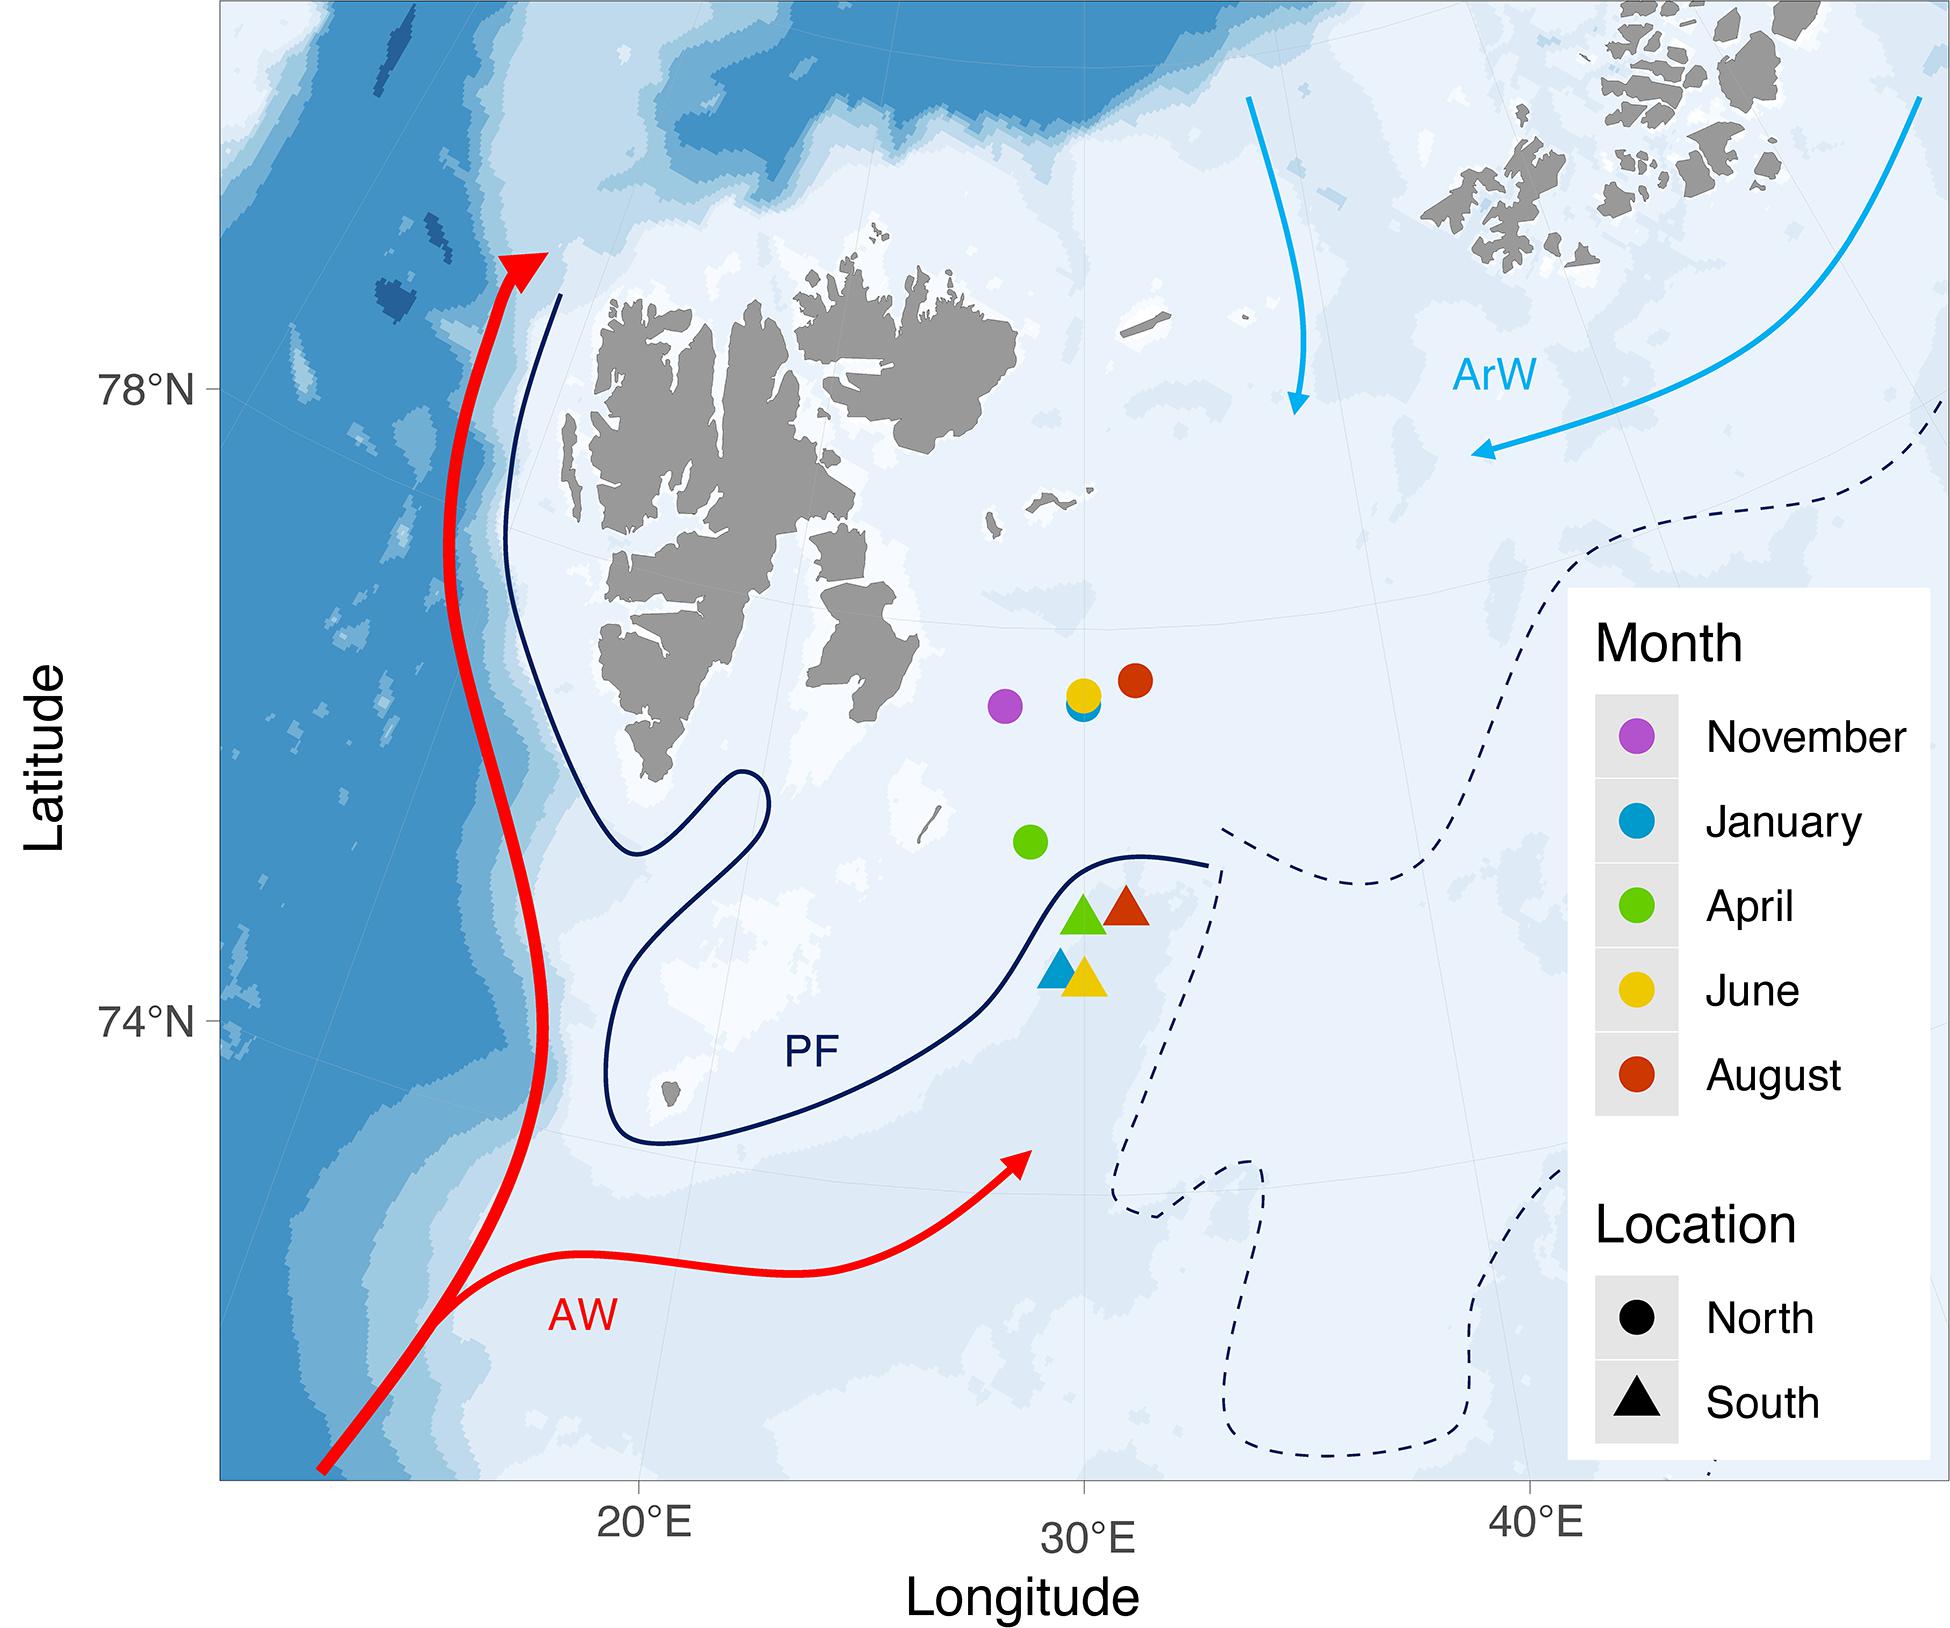
Figure 1. Study area with sampling locations. Map was produced using package ggOceanMaps in R (Vihtakari, 2020). Arrows show Atlantic (AW, red) and Arctic (ArW, blue) water currents while the whole dark line represents the approximate location of the oceanographic Polar Front (PF) where it is stable, west of 32°E, and dashed lines represent the more variable southern and northern fronts to the east (based on Loeng, 1991; Oziel et al., 2016).
Benthic invertebrate early life stages can be very difficult, and sometimes even impossible, to identify to species or genus using morphological characteristics alone. Consequently, most zooplankton studies either group taxa into an all-encompassing “meroplankton” category or identify them to broad taxonomic resolution such as phylum or class levels (e.g., Hirche et al., 2011; Gluchowska et al., 2016). Even in studies that focus specifically on meroplankton, species-level identification is scarce due to the common lack of distinguishing features across closely-related taxa (e.g., Bowden et al., 2009; Highfield et al., 2010). The use of DNA barcoding to identify meroplankton, while promising, initially achieved relatively low success rates (Heimeier et al., 2010). However, recent advances in methods specifically designed to barcode meroplankton have enabled the identification of hundreds of individuals, and dozens of taxa, with high success rate (Ershova et al., 2019).
Such species-level identification opens up possibilities to obtain detailed community composition and its variability in time and space. In addition, species-level identification can contribute important information on larval biological traits such as timing of larval release as well as larval duration for a large number of species simultaneously. Historically, much of the information on larval duration of individual species relied on laboratory rearing of larvae (Shanks, 2009). As such, the information was limited to a subset of species, each experiment studying a single or a few species at once, and could have potentially been biased by laboratory conditions (Shanks, 2009). Finally, species-level identification also has the potential to detect non-native species as they drift into the Arctic through water currents, perhaps serving as an early warning system for harmful alien species, or species of potential ecosystem impact.
The objective of this study was to determine the taxonomic composition and seasonality of the meroplankton community in the Barents Sea, north and south of the Polar Front. By using a high-throughput DNA barcoding method to identify early life stages, we aimed to achieve high taxonomic resolution yielding species-specific information on seasonality, larval duration, and association with water masses, as well as identifying greater taxon richness than previously realized, including identification of potential newcomers. We hypothesized that seasonality differs across taxa but that most species peak in abundance around the spring phytoplankton bloom and remain in the water column for up to a few months. We also predicted that the meroplankton community differs in composition between north and south of the Polar Front, in association with different water masses, and that the larval assemblage represents a mix of larvae from local Barents Sea species as well as some more southern species advected into the Barents Sea. Implications of these findings in the context of invasibility of the Arctic inflow shelves are discussed.
Materials and Methods
Field Sampling
Meroplankton samples were collected at stations north and south of the Polar Front during a series of seasonal cruises in November 2017 and in January, April, June and August 2018 (Table 1 and Figure 1). Due to cruise logistics, no samples were collected south of the Polar Front in November 2017. In addition, extensive sea ice blocked northward travel in April, so sampling north of the Polar Front occurred at slightly lower latitude in April compared to the other time points. At each station and sampling month, a CTD cast (Seabird SBE 911 or SBE 911+) preceded zooplankton sampling to determine the depth distribution of water masses based on the vertical profiles of temperature, salinity and density (Table 1). Temperature, salinity, and fluorescence measurements (as a proxy for chlorophyll a concentration) data were obtained from the CTD casts for further analysis. Zooplankton samples were collected from each water layer individually using a 64-μm closing WP2 (0.255 m2 mouth opening, Hydro-Bios) or Multinet (0.25 m2 mouth opening, Hydro-Bios) towed vertically at 0.5 m/s, retrieving two to four samples per station and covering the entire water column from ∼10 m above the seafloor to the surface. In April, when phytoplankton was highly abundant, 180 μm mesh was used instead of 64 μm to prevent clogging. The 180 μm mesh was also used to sample the surface layer in June at the northern location after the upper portion of the 64 μm mesh ripped open during sampling of lower layers, leaving only the outer 300 μm mesh toward the net opening (see Table 1 for further details). Zooplankton samples were concentrated on a 64 μm sieve and immediately transferred into 96% ethanol for preservation. The ethanol was changed after ∼24 h to maintain optimal conditions for DNA preservation.
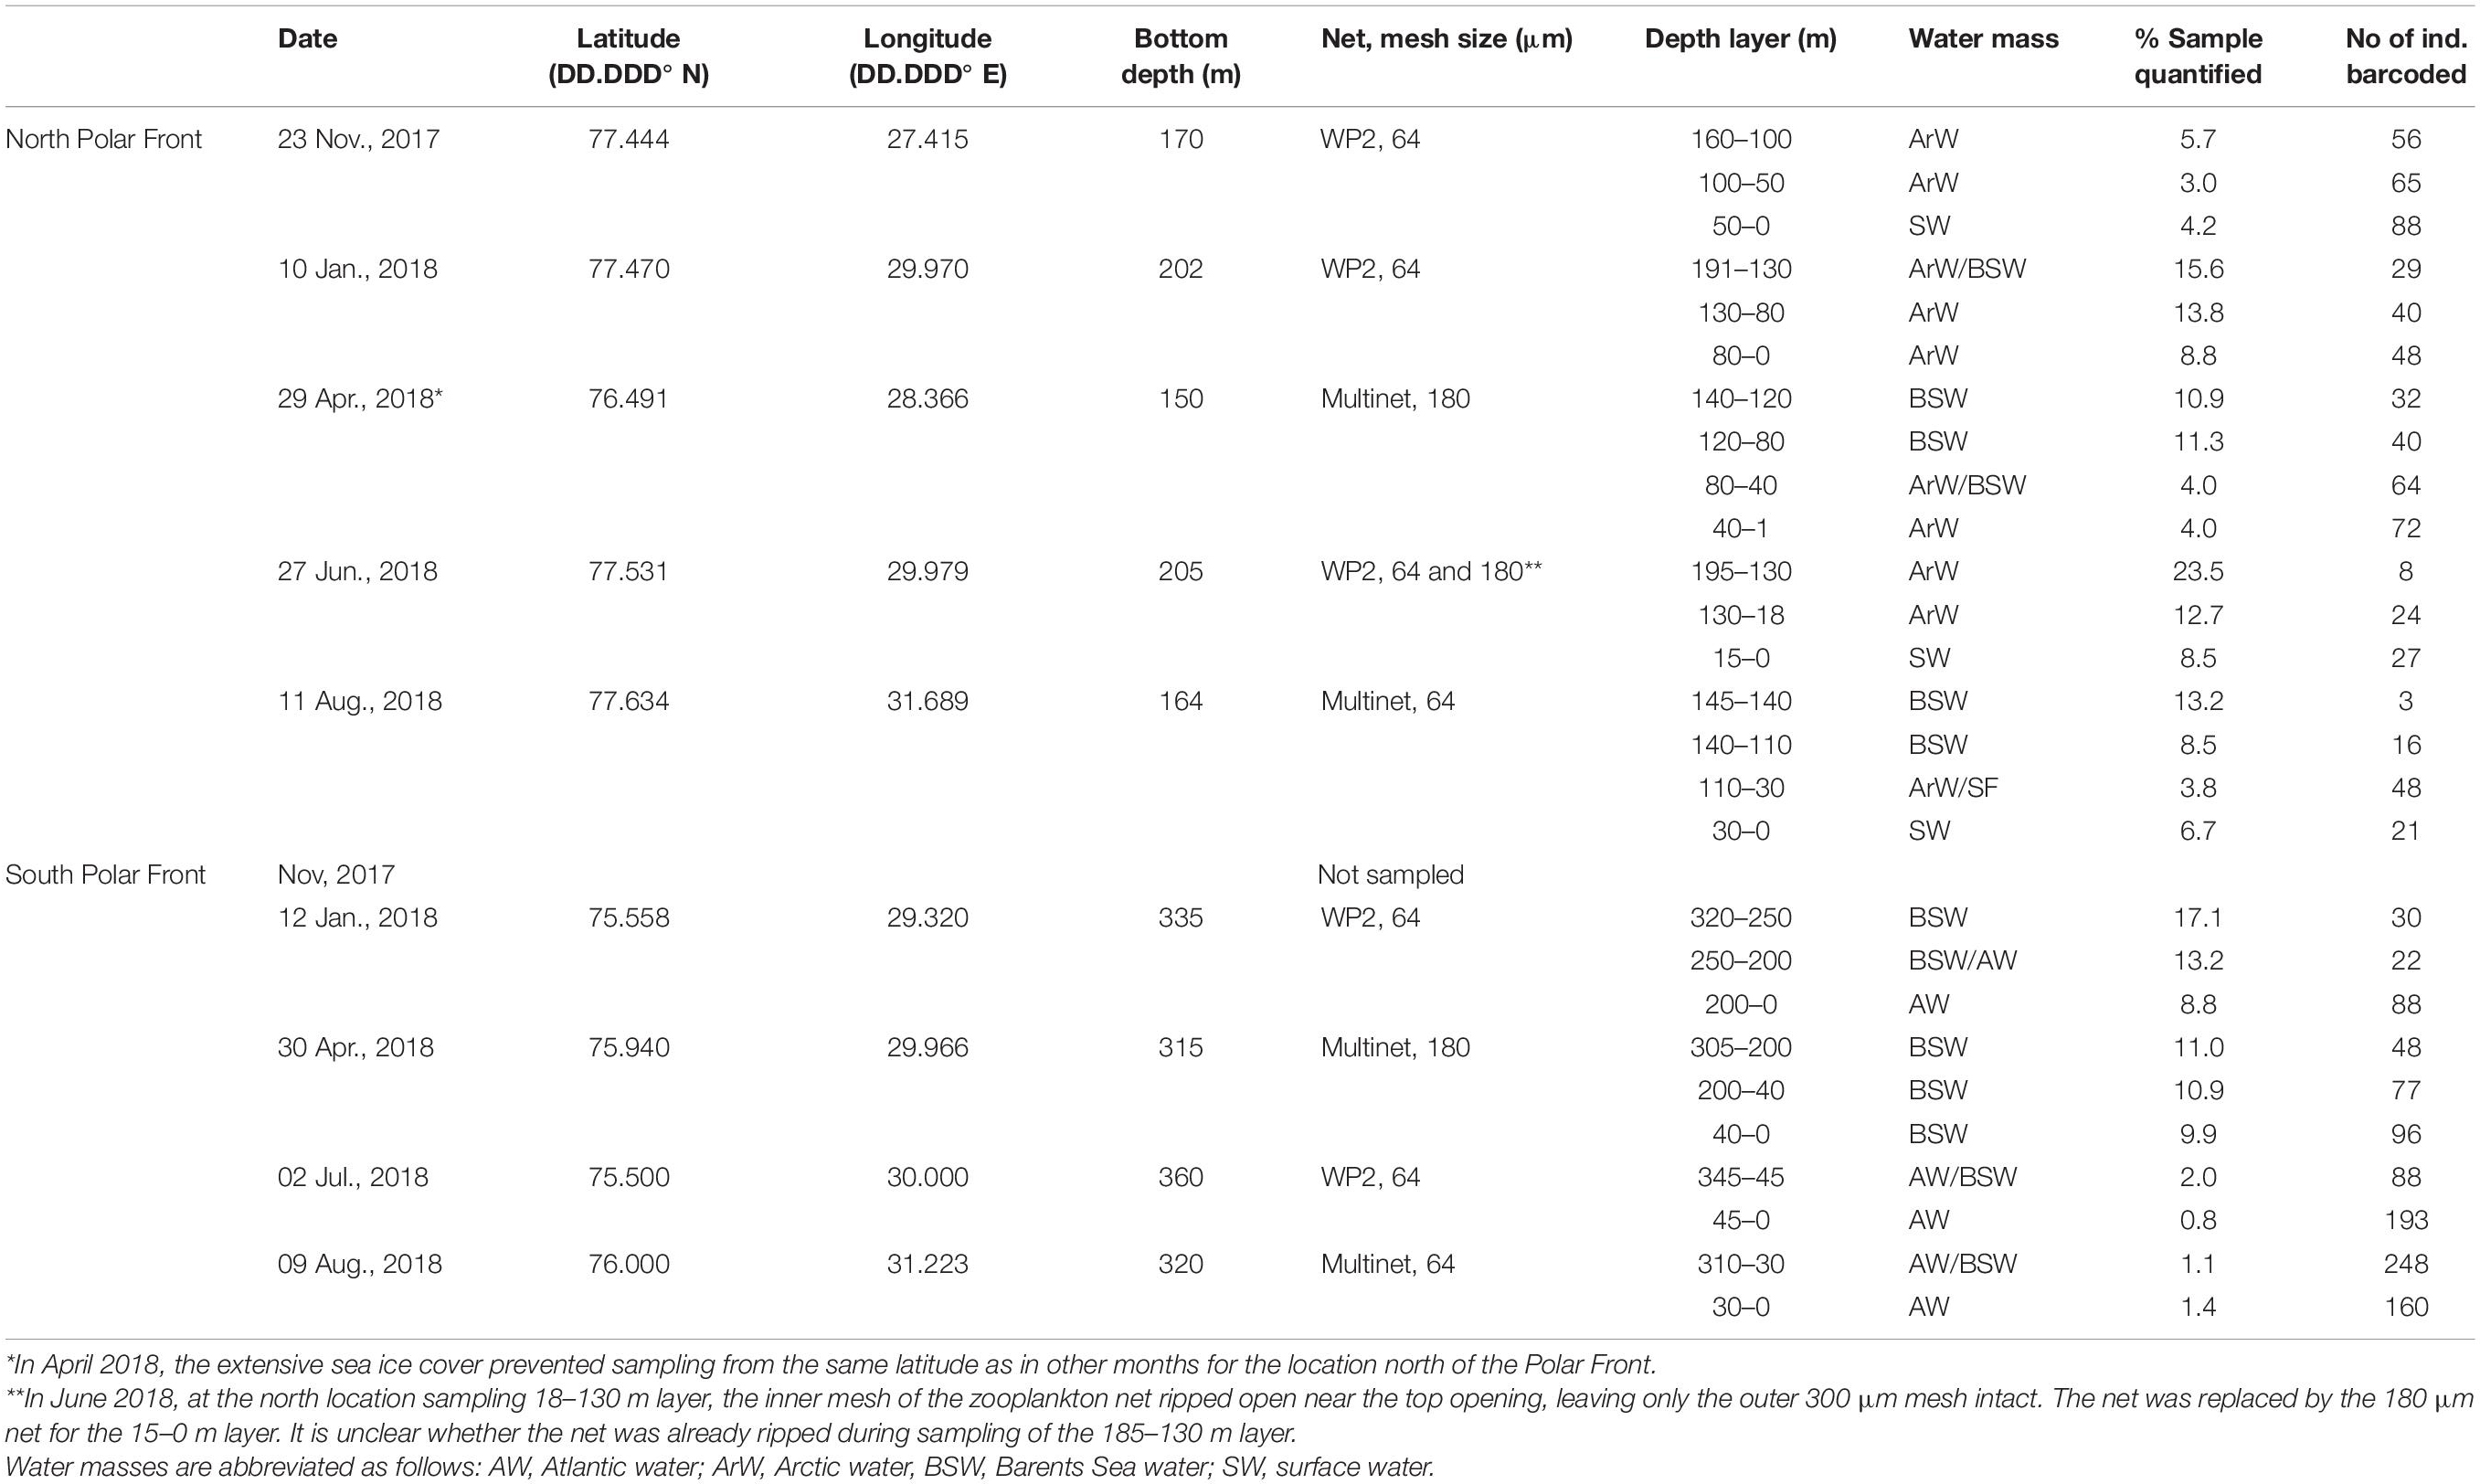
Table 1. Sampling stations and gears for collection of meroplankton north and south of the Barents Sea Polar Front from November 2017 to August 2018.
Sorting and Quantification
In the laboratory, a quantitative subsample from each zooplankton sample was sorted under a Leica M205C dissecting microscope at 20–100 × magnification to quantify and isolate individual meroplankton specimens for barcoding. Subsamples of 0.8–23.5% of total sample volume (Table 1), depending on meroplankton density, were collected using a 5-mL pipette with the tip cut off to prevent clogging from large zooplankton. All meroplanktonic individuals in the subsample were visually classified into morphotypes largely corresponding to broad taxonomic levels (e.g., Bivalvia, Nudibranchia, Ophiuroidea, etc.) and counted. For each morphotype, the number of individuals counted in the subsample was multiplied by the subsampling factor to estimate the numbers in the whole sample. Abundance values (individuals/m3) of each morphotype in each sample were then calculated by dividing the number of larvae by the volume of seawater filtered for each sample. For each sample, up to ∼30 individuals from each morphotype were photographed (for reference and for measurements of body size) using a Leica MC170 HD microscope camera, then soaked in MilliQ water prior to DNA extraction.
High-Throughput DNA Barcoding
Each photographed individual was then transferred individually into 20 μL Alkaline Lysis Reagent (25 mM NaOH, 0.2 mM EDTA) using sterilized tools, and heated at 95°C for 30 min to extract the DNA. Bivalve and gastropod larvae were crushed with the flat blade of a micro-scalpel prior to extraction. The DNA extracts were then pH-neutralized by adding 20 μL Neutralization Buffer (40 mM Tris–HCl) and kept at 4°C until amplification. This extraction method (HotShot extraction, Truett et al., 2000; Meissner et al., 2013) is ideal for very small organisms like meroplankton because it minimizes DNA loss by eliminating all cleaning and transfer steps.
We used a high-throughput multiplexing approach (after Ershova et al., 2019) to DNA-barcode a large number of larvae (Shokralla et al., 2015). By using a double-tagging strategy, we were able to sequence ∼1,000 individuals simultaneously. First, a ∼313 base pair fragment of the mitochondrial cytochrome C oxidase I (COI) gene was amplified by PCR using individually-tagged Leray-XT primers, a highly degenerate primer set (Geller et al., 2013; Wangensteen et al., 2018). The availability of reference sequences as well as its ability to assign taxonomy to species level (Hebert et al., 2003; Andújar et al., 2018) make this marker ideal for meroplankton identification. Each PCR reaction consisted of 10 μL polymerase (AccuStart II PCR ToughMix or AmpliTaq Gold), 0.16 μL bovine serum albumin 20 μg/μL, 5.84 μL nuclease-free water, 1 μL individually-tagged forward primer (5 μM, mlCOIintF-XT 5′-GGWACWRGWTGRACWITITAYCCYCC-3′), 1 μL individually-tagged reverse primer (5 μM, jgHCO2198 5′-TAIACYTCIGGRTGICCRAARAAYCA-3′) as well as 2 μL undiluted DNA template for a total reaction volume of 20 μL. The PCR protocol consisted of a denaturation step for 10 min at 95°C followed by 35 cycles of 94°C for 1 min, 45°C for 1 min and 72°C for 1 min, and a final extension of 5 min at 72°C (Wangensteen et al., 2018). The same tag was used on the forward and reverse primers to enable detection of chimeras. A total of 96 different primer tags were available, so sets of 96 individually-tagged PCR amplicons were pooled into libraries. Libraries were cleaned (fragments below 70 base pairs removed) and concentrated using MinElute columns and final DNA concentration measured using a Qubit fluorometer with broad-range dsDNA BR Assay Kit (Qubit). Each library was then prepared for sequencing using the NEXTflex PCR-free DNA sequencing kit (BIOO Scientific), according to manufacturer instructions, omitting the second bead cleaning round in Step B to improve yield. This library preparation protocol includes ligation of Illumina adapters as well as a 6-base library tag (BIOO Scientific). Each pool of 96 samples received a different library tag so that DNA from each larva was recognizable through its unique combination of the primer tag and the library tag. Prior to sequencing, each library was quantified by qPCR using the NEBNext Library Quant Kit (New England Biolabs). Libraries were sequenced on an Illumina MiSeq platform with v2 or v3 2 × 250 bp kits and spiked with 1% PhiX used as an internal control to calculate error rates.
Bioinformatics
All sequences obtained from the MiSeq runs were processed in the OBITools software suite (Boyer et al., 2016) as in Ershova et al. (2019). The forward and reverse reads were aligned and annotated for reads with alignment quality scores > 40 using the function illuminapairedend. Contigs were assigned to the corresponding larvae (demultiplexed) using ngsfilter, which also removed primer sequences. Only sequences with 300–320 base pairs and no ambiguous bases were retained for clustering in Swarm v2 (Mahé et al., 2015) with local clustering threshold d = 13. Singletons were discarded. Initial taxonomic assignation was performed with Ecotag (Boyer et al., 2016) against a local reference database (Wangensteen et al., 2018) and then checked manually in the Barcode of Life database (BOLD1) and NCBI database BLAST2 for definitive assignment. Due to the nature of high-throughput sequencing, most larval samples contained reads from several taxa (possibly food items, contamination, etc.). The sequence with the most abundant reads within each sample was assumed to correspond to the larva itself. All samples with either less than 10 reads total or with fewer than 1,000 reads and, at the same time, less than 75% of reads assigned to the most abundant sequence were considered unreliable and were not included in further analysis. We then compared the taxonomic assignments from DNA barcoding to the initial morphological identification. Individuals, for which the two did not match at even a coarse taxonomic level, as well as non-meroplanktonic taxa, were omitted from subsequent analysis. The remaining sequences were considered successful. A sequence match of >98% to the reference database was considered an “exact” match (Leray et al., 2016). For the larvae with <98% sequence match, the taxon name of the closest match was retained, but the % match was listed alongside for clarity. Accepted taxonomic names and classification were obtained from the World Register of Marine Species (WoRMS3).
Larval Body Size Measurements
For species that were detected in the samples at multiple time points, body size was measured to help differentiate between species with continuous reproduction (average body size relatively constant throughout the year) from species with more discrete reproductive timing but long larval duration (average body size increases through time). For the purpose of this analysis, temperature effects were not considered. Body size measurements were made using the photographs of each individual obtained prior to DNA extraction. Measurements were conducted in ImageJ software (Abramoff et al., 2004) with the Straight Line tool (Segmented Line when needed), using the scale bar on each photograph to calibrate the measurements. In echinoderm pluteus larvae, the length of the postero-dorsal arm was used while in bivalve veliger larvae, the anterior-posterior length was measured (Shanks, 2001).
Data Analysis
Temperature and salinity data from the station CTD casts were manually de-spiked and binned by 1 m (or 1 db). Salinity data were calibrated to Autosal salinities when available (June-July and August 2018). Each sample from a given water layer was assigned to a water mass based on its mean salinity (S) and temperature (T) values: Atlantic Water (AW: S > 34.8, T > 3°C), Arctic Water (ArW: S < 34.7, T < 0°C) and Barents Sea Water (BSW: S > 34.8, T ≤ 2°C, Oziel et al., 2016). Where mean temperature and salinity values fell between the defined cores of two water masses, the water was considered to be a mixing product of the two. When the surface layer did not fit in the standard water mass definitions but was much fresher than underlying layers, it was called Surface Water (SW).
Density values for each species detected by DNA barcoding were obtained by multiplying the number of each morphotype in each sample by the percentage of the barcoded larvae corresponding to each sequence-based identification. For example, if a sample contained 50 ophioplutei/m3 and from that sample 10% of all barcoded ophioplutei matched with Ophiura sarsii, then we estimated the density of O. sarsii in that sample to be 5 individuals/m3. We then multiplied the density in each sample by the depth range of that same sample and added all depth layers within one location to obtain a depth-integrated abundance value expressed in individuals/m2. Larvae that were not successfully identified through DNA barcoding were not included in subsequent analysis so listed abundances represent a conservative estimate of total abundances. Meroplankton diversity and community analyses were conducted with package vegan in RStudio, v. 1.4.1106 (Oksanen et al., 2019) and visualized using package ggplot2 (Wickham, 2016). A species accumulation curve (function specaccum) was used to determine whether our sampling covered the full diversity of the region. A heatmap of species abundances was created to visualize seasonal patterns. Meroplanktonic taxa in the heatmap were clustered according to the seasonal and geographical distribution using the UPGMA (unweighted pair group method with arithmetic mean) clustering method. To test the difference in meroplankton communities across months and locations, we did separate analyses of “size” (total abundance) and “shape” (community composition, Greenacre, 2017). The difference in total abundance across locations and months was tested using Kruskal–Wallis tests performed separately for location and month. The unequal variance across locations and months prevented the use of an ANOVA. The difference in taxon richness across location and month, however, was tested using a two-way ANOVA without an interaction term. Spatial and seasonal patterns in community structure were explored using Canonical Correspondence Analysis (CCA) of the fourth-root transformed taxa abundances. Explanatory variables included water mass type (Atlantic, Arctic, Barents Sea and Surface Waters; Table 1), location (north vs. south of the Polar Front), sampling month (November, January, April, June, and August), as well as average water column temperature, salinity, and fluorescence (as a proxy for chlorophyll a concentrations). The best subset of constraining variables was selected by stepwise selection using the ordistep function. The significance of the overall model and individual terms was calculated using permutation tests (anova.cca function) at a significance level of p < 0.05. The correlations of the individual species abundances to the resulting ordination were obtained using the function envfit, and only species that were found to be significantly driving the ordination (p < 0.05) are shown on the biplots.
Results
Oceanography
Water mass characteristics contrasted sharply between the north and south of the Polar Front during all seasons (Figure 2 and Table 1). North of the Polar Front, deep waters consisted of the relatively cold and saline Barents Sea Water throughout the year while shallower layers consisted mostly of Arctic Water. The characteristics of the surface layer fluctuated seasonally. A colder and fresher water layer overlaid the Arctic Water in November, but was not present in January. Surface temperatures began to increase again in June and reached upward of 4°C by August. While sampling north of the Polar Front in April occurred further south than in the other months (Figure 1), the water mass characteristics showed a clear similarity to the more northern sampling location of other months, remaining well within characteristics of Arctic Water at the surface (Figure 2). The deep waters south of the Polar Front also consisted mostly of Barents Sea Water, except in January where they were typically 1–2°C warmer. Upper layers in the south consisted entirely of Atlantic Water, except in April when the whole water column was well mixed with characteristics of the Barents Sea Water mass. Together, these observations suggest that our two sampling locations were positioned on either side of the oceanographic Polar Front, but shared water mass characteristics in deeper layers.
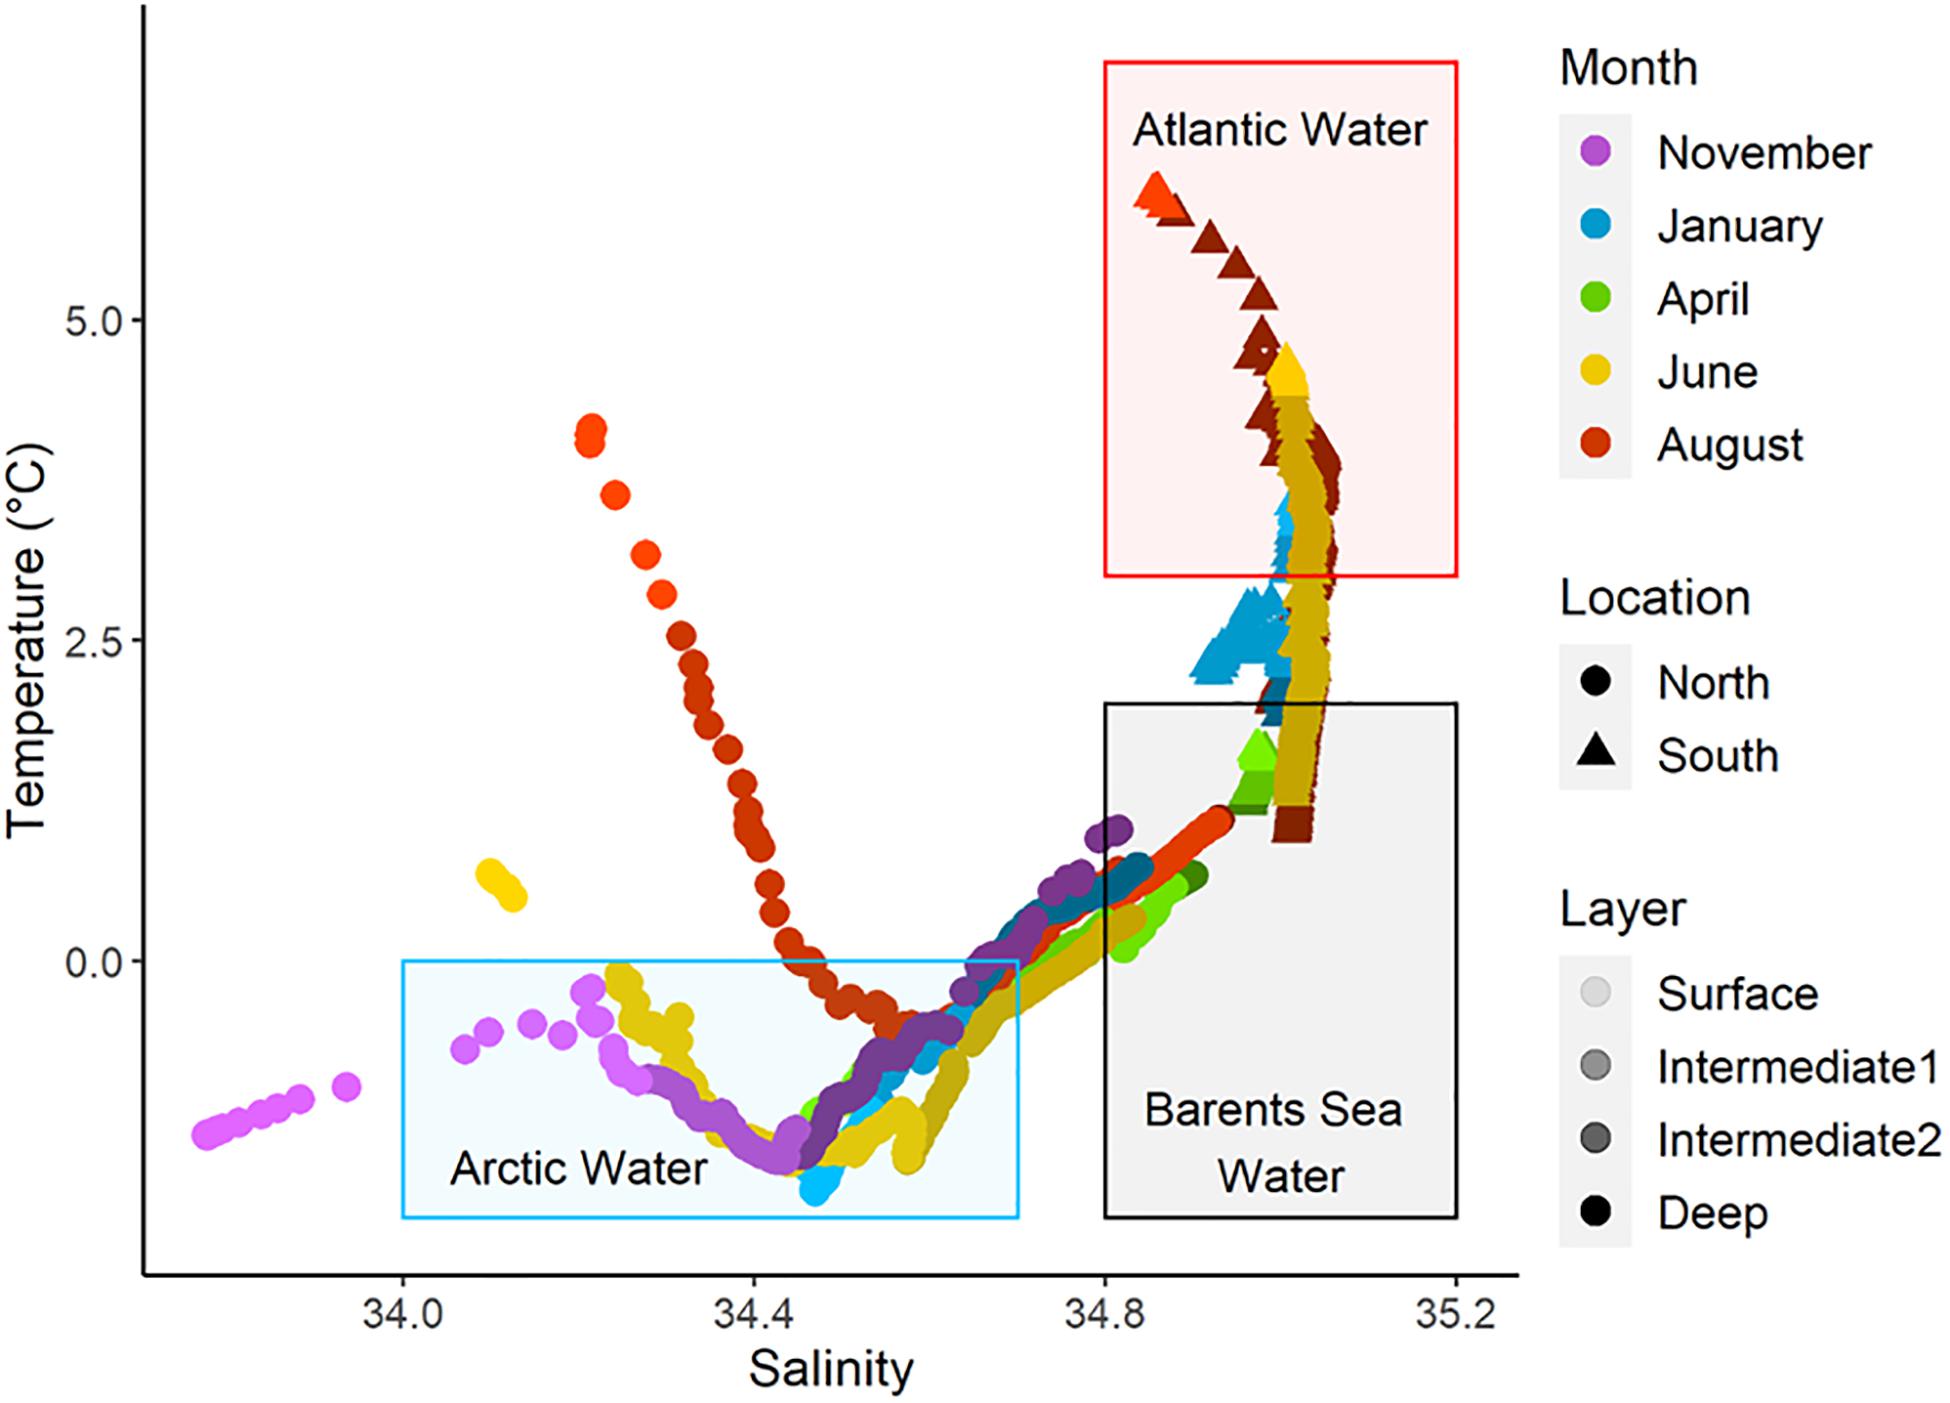
Figure 2. Temperature and salinity diagram of water masses in the Barents Sea where meroplankton was collected. The colored rectangles represent the major water masses encountered during this study: Atlantic Water (red), Arctic Water (blue) and Barents Sea Water (gray). For the data points, each color palette represents a sampling month. The tone variations within each color palette represent the different water layers with darker tones representing deep layers and lighter tones surface layers.
Success Rate of DNA Barcoding
We had good quality amplification of the DNA extracts, even without the cleaning steps found in most extraction methods, perhaps due to the small size of the samples. A total of 1,672 individuals was barcoded, with 1,192 (71%) resulting in successful DNA-based identification (Supplementary Data Sheet 1). The success rate of DNA barcoding was very high for the majority of taxa: Echinodermata (94%), Bivalvia (93%), Bryozoa (95%), and Nemertea (93%). Annelida had 87% success and the unsuccessful 13% were caused by insufficient reads (6%), a sequence with no match in the DNA databases (3%) or by a DNA-based identification which did not match the visual identification (4%). Gastropoda had the lowest success rate (59%), most often due to the insufficient number of DNA reads in the sequencing process (35%). Approximately 86% of MOTUs (molecular operational taxonomic units) had an “exact” match (>98%) in BOLD or GenBank (Supplementary Table 1). Of those “exact” matches, 87% of unique sequences were identified to species, 8% to genus, 3% to family, and 2% to order level.
Meroplankton – Overall Diversity
Swarm 2.0 clustered the barcoded individuals into 86 different meroplankton MOTUs, assigned to 72 taxa, belonging to eight phyla (Supplementary Table 1). Taxon richness ranged from 5 to 27 taxa per sampling event (integrated over the whole water column). The species accumulation curve (Figure 3) did not reach an asymptote, indicating that we did not capture the full diversity of the system. Mollusca, Echinodermata, and Annelida dominated the meroplankton community in terms of taxon richness, but we also found some Nemertea, Bryozoa, Sipuncula, Cnidaria, and Arthropoda (Supplementary Table 1 and Figure 4).
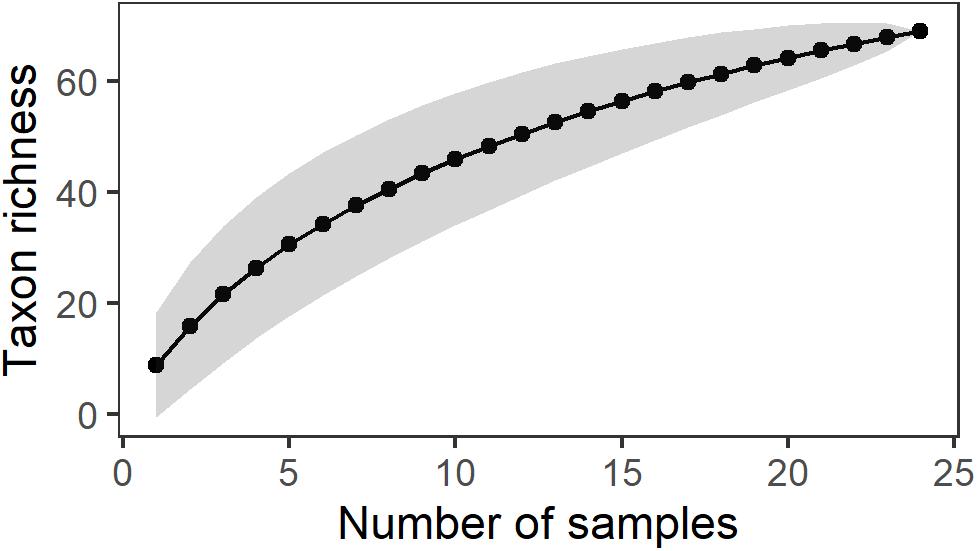
Figure 3. Species accumulation curve of meroplankton taxa in the Barents Sea north and south of the Polar Front covering a seasonal cycle.
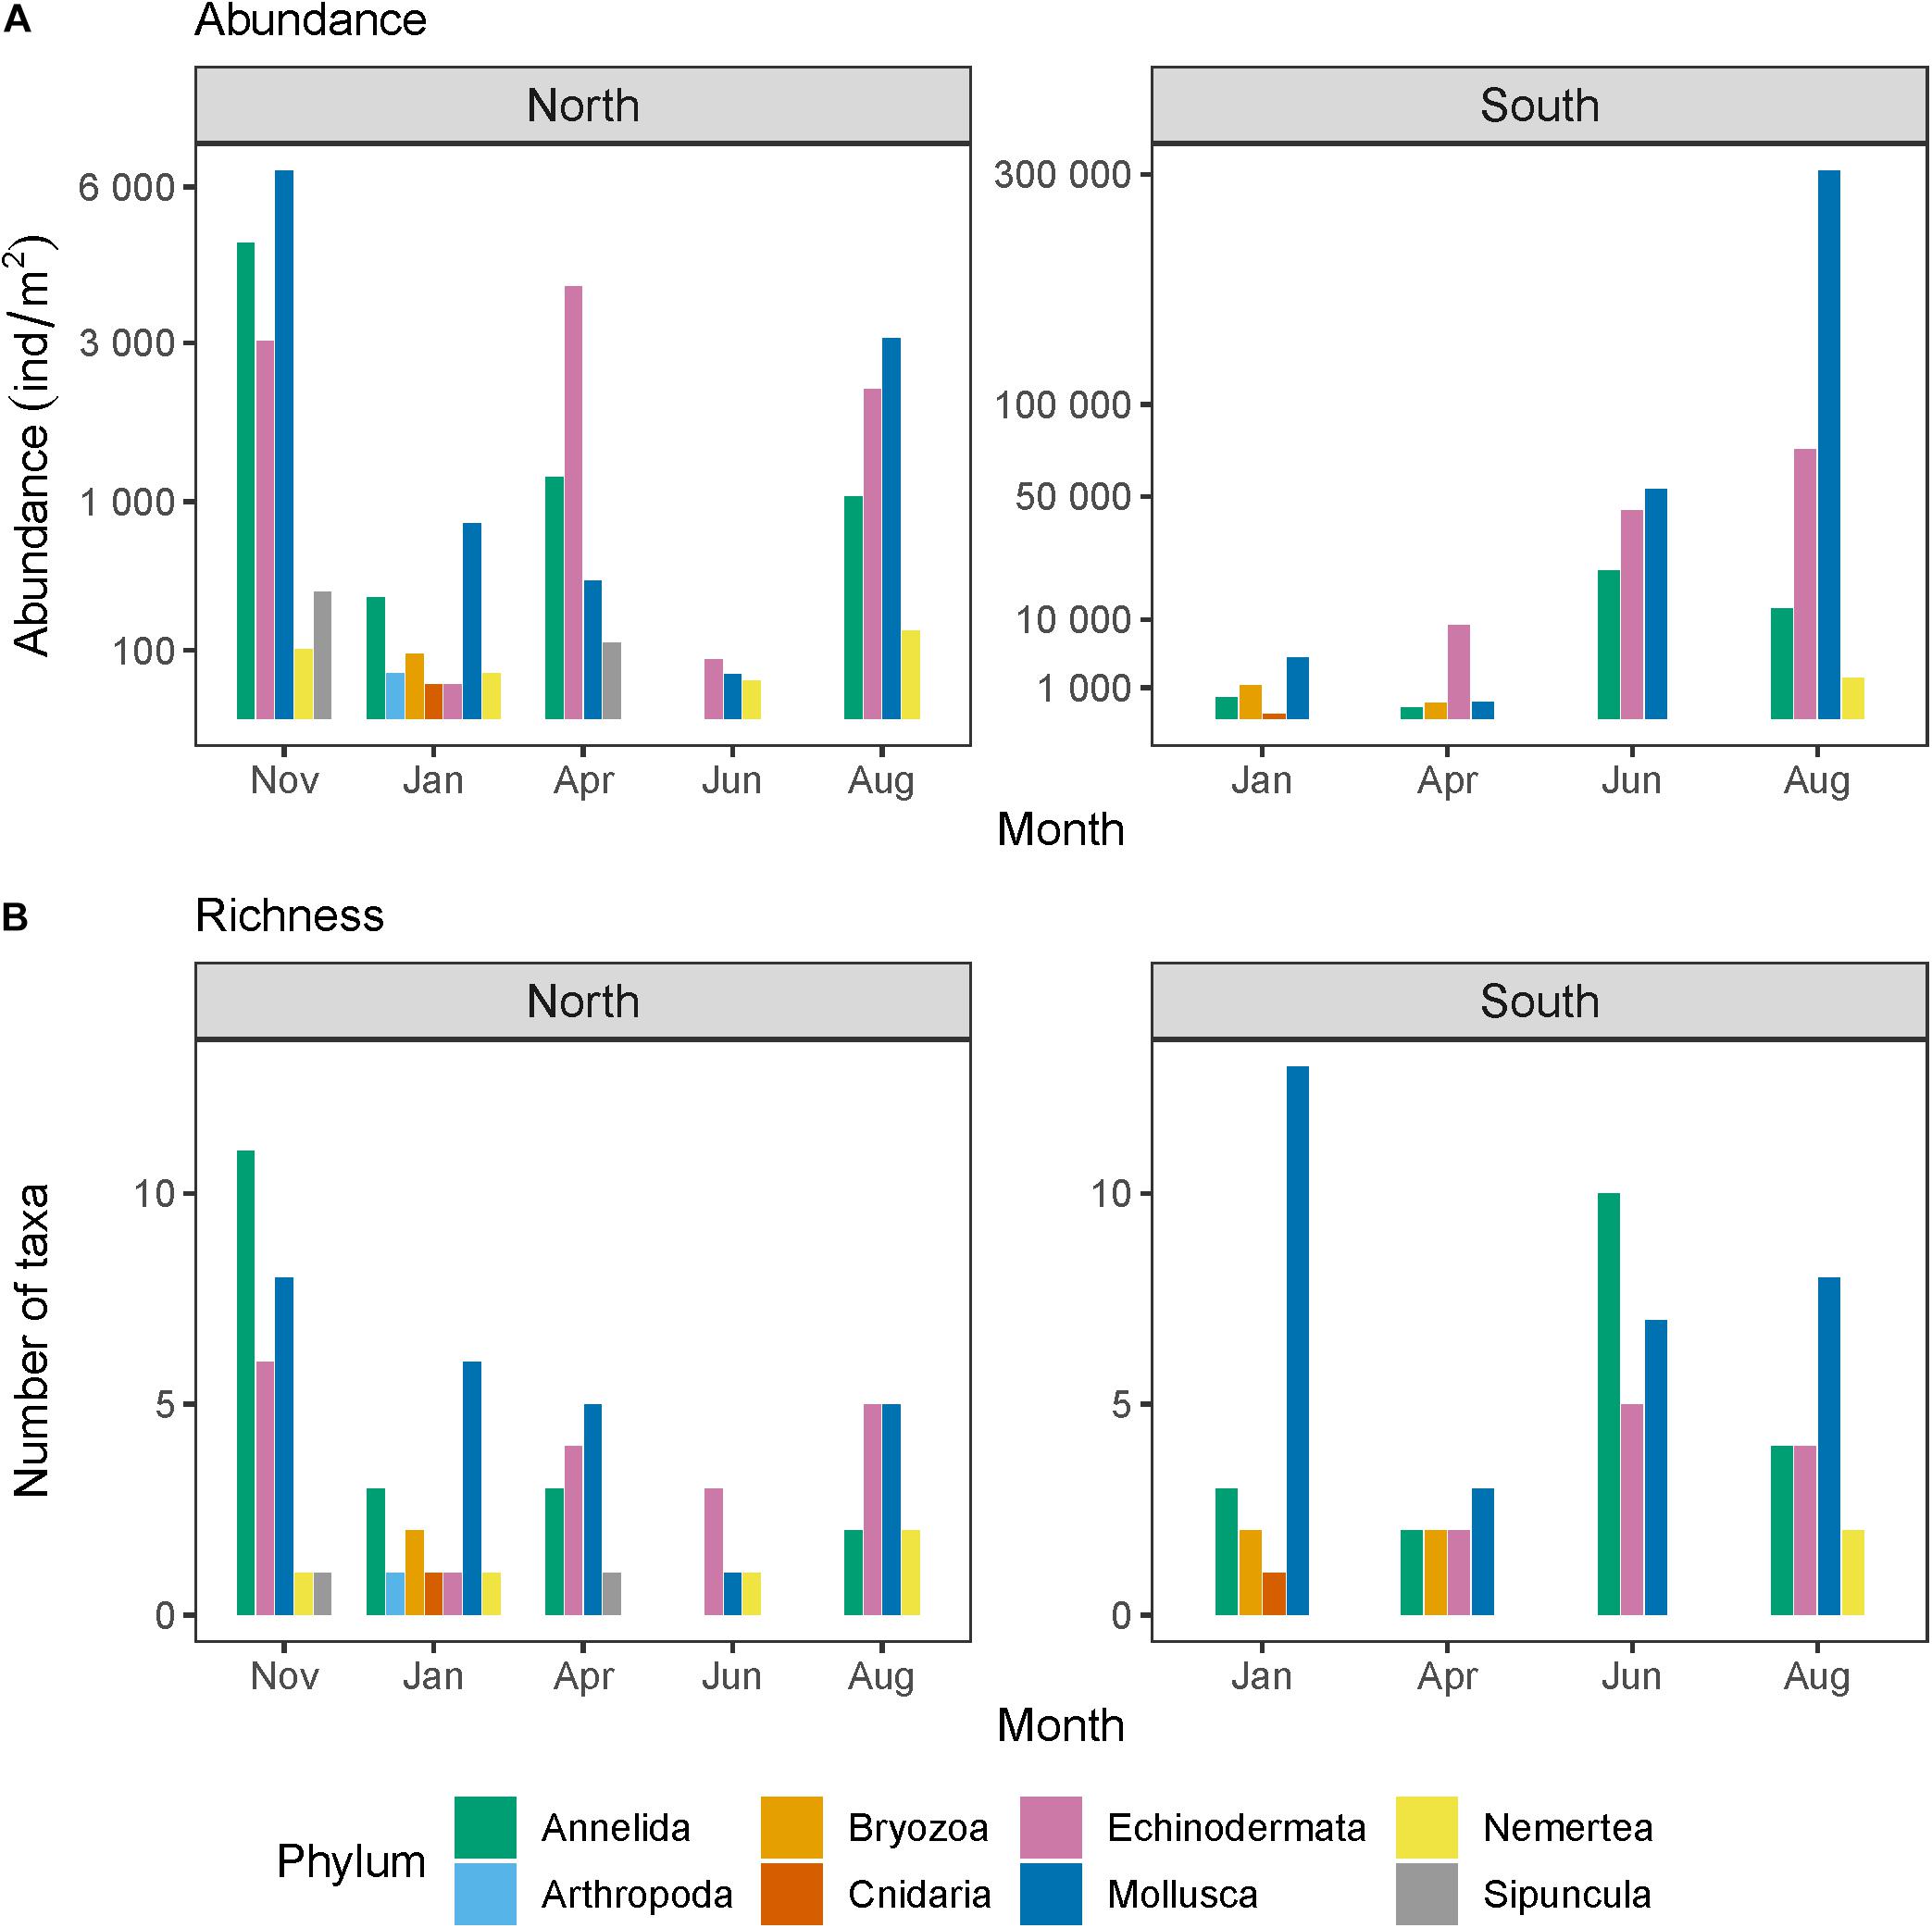
Figure 4. Meroplankton (A) abundance integrated across the water column as well as (B) taxon richness north and south of the Polar Front across seasons. Note that the y-axes in panel (A) differ between the locations north and south of the Polar Front and that they are square-root transformed to facilitate visualization of lower values. Also note that the April sampling “north” of the Polar Front occurred closer to the Polar Front than the other time points and that no data are available for November south of the Polar Front.
Meroplankton Seasonality – Abundance
Meroplankton abundance fluctuated seasonally but patterns varied across taxa. Meroplankton was present in the water column year-round but, contrary to our initial hypothesis, total abundance did not peak around the spring bloom (Figure 4). In fact, for the location north of the Polar Front, abundance was at its lowest in June, with values around 150 individuals/m2. Abundance increased in August and peaked in November when it was estimated at 14,671 individuals/m2. Abundance was low in January (1,369 individuals/m2) and reached a secondary peak in April reaching about half of November values (5,736 individuals/m2). At the location south of the Polar Front, overall abundance was at its lowest in January (3,149 individuals/m2) and gradually increased through the year, reaching its highest value in August (391,137 individuals/m2, no samples were taken in November). Total meroplankton abundance also differed on either side of the Polar Front with overall much greater abundance to the south (3,149–391,137 individuals/m2) compared to the north (150–14,671 individuals/m2), though this difference was not statistically significant (p = 0.206), perhaps due to the low power of the test.
These overall seasonal patterns were in large part driven by molluscs (mostly bivalves) which dominated abundance in most months, except for April when echinoderms made up most of the larval abundance, both north and south of the Polar Front (Figure 4A). Echinoderms and annelids were also abundant and followed a similar seasonal pattern to bivalves, except that annelids peaked in June at the location south of the Polar Front and echinoderms peaked in April at the location north of the Polar Front. Gastropod larvae peaked in the winter months, in November to the north and in January to the south of the Polar Front (Figure 5). Nemerteans were present all months except April north of the Polar Front but only in August to the south. Sipunculids were only found north of the Polar Front, in November and April. Bryozoans, cnidarians, and arthropods were mostly present in January but only in low numbers.
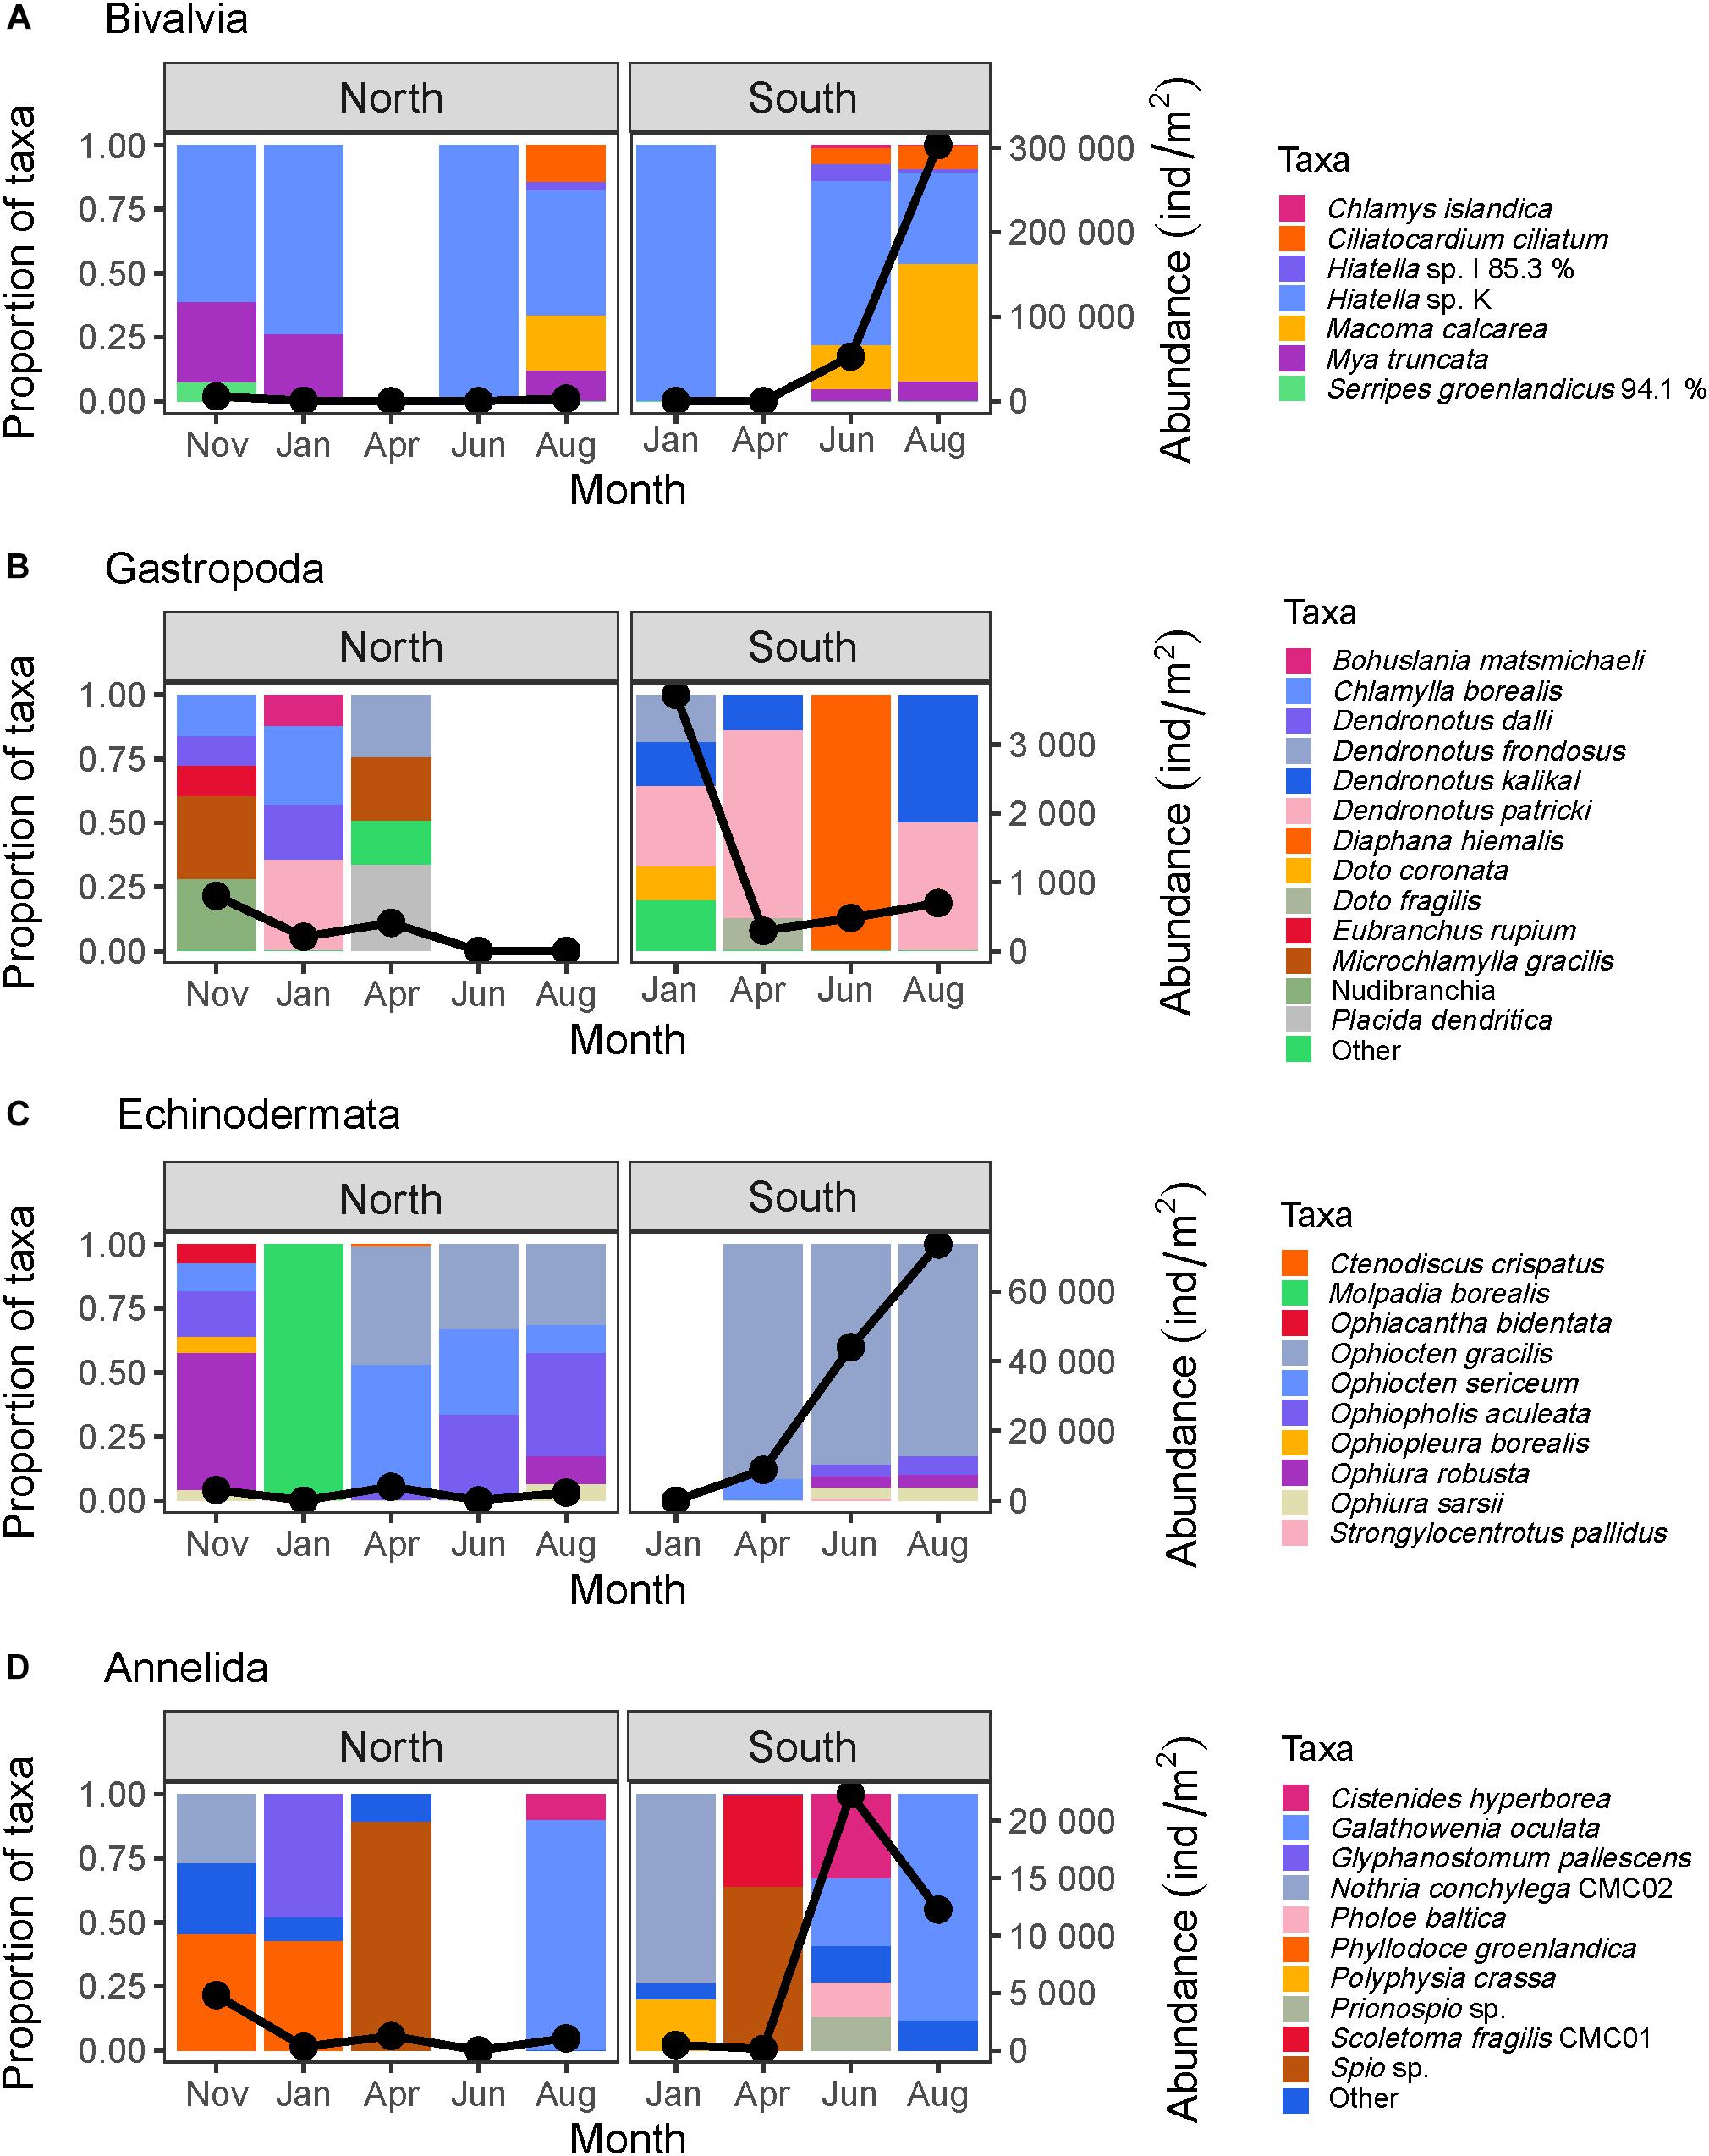
Figure 5. Composition of the four most abundant meroplanktonic higher taxa: (A) Bivalvia, (B) Gastropoda, (C) Echinodermata, and (D) Annelida expressed as proportional abundance (colored bars, left y-axis) as well as total abundance (black line, right y-axis) for the locations north and south of the Polar Front. For Gastropoda and Annelida, taxa that did not make up at least 10% of the group’s abundance for at least one sampling point were combined in a “Other” category for ease of reading. Some taxa are named with letters or numbers instead of a species name (e.g., Hiatella sp. K and N. conchylega CMC02). These represent currently un-named but genetically-distinct lineages.
Meroplankton Seasonality – Taxon Richness
Taxon richness was significantly greater to the north (p = 0.002). Out of the 72 taxa identified, 27 taxa were shared between the two locations whereas 20 were only found to the south and 25 only found to the north of the Polar Front (Figure 6 and Supplementary Table 1). Taxon richness also changed significantly through time (p = 0.013). North of the Polar Front, species richness was highest in November (27 taxa), thereafter decreasing gradually until reaching its minimum in June of the following year (five taxa, Figure 4B). The pattern appeared more erratic to the south, with overall high taxon richness throughout the year (>18 taxa each month) except in April when richness was lower (9 taxa).
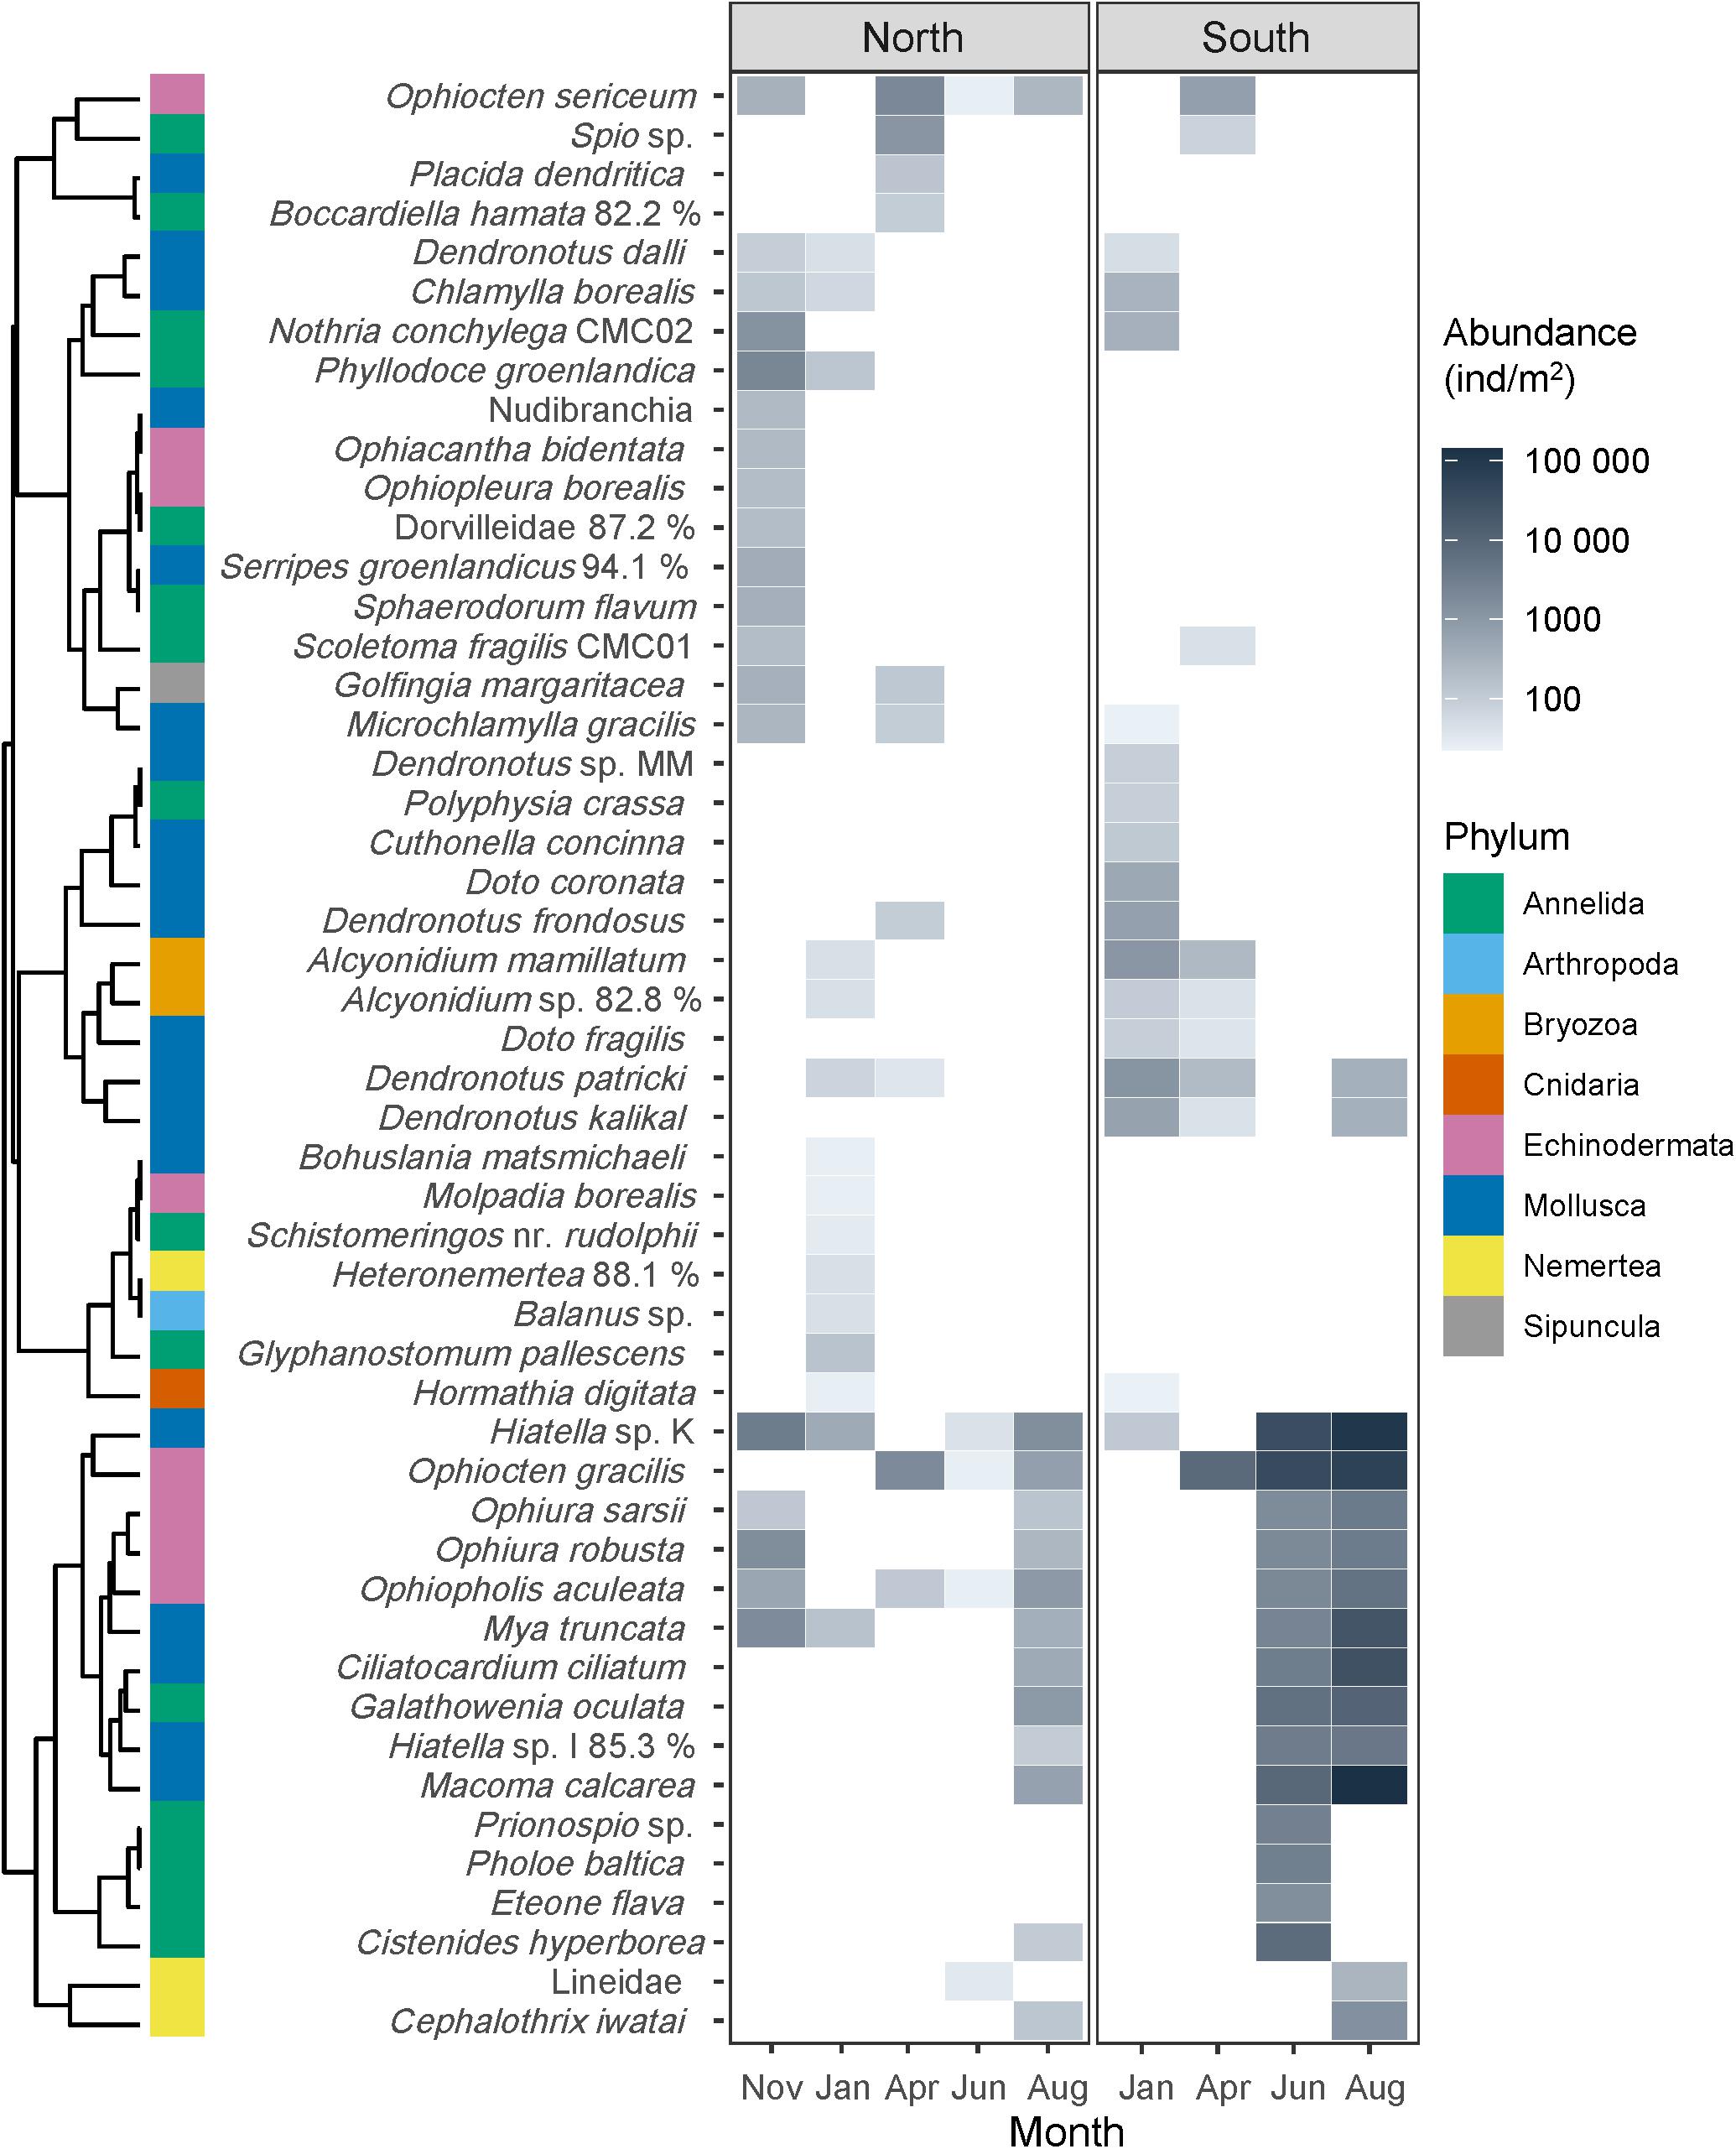
Figure 6. Heatmap of meroplankton species abundance integrated over the entire water column (individuals/m2) north and south of the Polar Front. For readability, only taxa that contributed at least 1% of total abundance of at least one sampling event are included (for all taxa, see Supplementary Table 1). Taxa are clustered according to their seasonal and geographical distribution with colors indicating phylum. Note that no samples were taken south of the Polar Front in November 2017.
Taxon richness was dominated by annelids with 28 taxa represented, all of which polychaete worms (Supplementary Table 1). During most months, only 2–4 polychaete taxa were found at each location, but a large rise in diversity occurred in November in the north and in June in the south when 11 and 10 taxa were identified, respectively. As with abundance, molluscs made up a large proportion of species richness at both locations at most sampling events. While bivalves made up the bulk of the mollusc abundance, however, gastropods were much more diverse with 18 different taxa identified (compared to seven bivalve taxa, Supplementary Table 1), almost all of which were nudibranchs. The bivalve Hiatella sp. K made up a large proportion of Mollusca abundance in all months, except in April when it was not observed (Figure 5A). Only one sea urchin larva (Strongylocentrotus pallidus), one sea star (Ctenodiscus crispatus), and one sea cucumber (Molpadia borealis) were found so that brittle star larvae made up the bulk of echinoderm abundance and diversity (11 species total, Figure 5C). The brittle star Ophiocten gracilis was extremely abundant and made up >80% of echinoderm abundance during all months when ophiuroids were found south of the Polar Front. It was also present to the north, but its relative contribution to the echinoderm abundance was lower there.
Larval Duration
Most taxa were present at a single time point, but a few species were found during most of the year (Figures 5, 6). The bivalve Hiatella sp. K showed no distinct trend in size through time, suggesting continuous reproduction (Figure 7). The size-frequency histogram for the brittle star O. gracilis, on the other hand, showed a gradual increase in size through time from April to August, suggestive of a long-lived planktonic phase originating from a discrete spawning event. The bivalve Mya truncata, and the ophiuroids Ophiopholis aculeata and Ophiocten sericeum were also present in the water column throughout most of the year (Figures 5, 6), but we had insufficient numbers to generate informative size histograms.
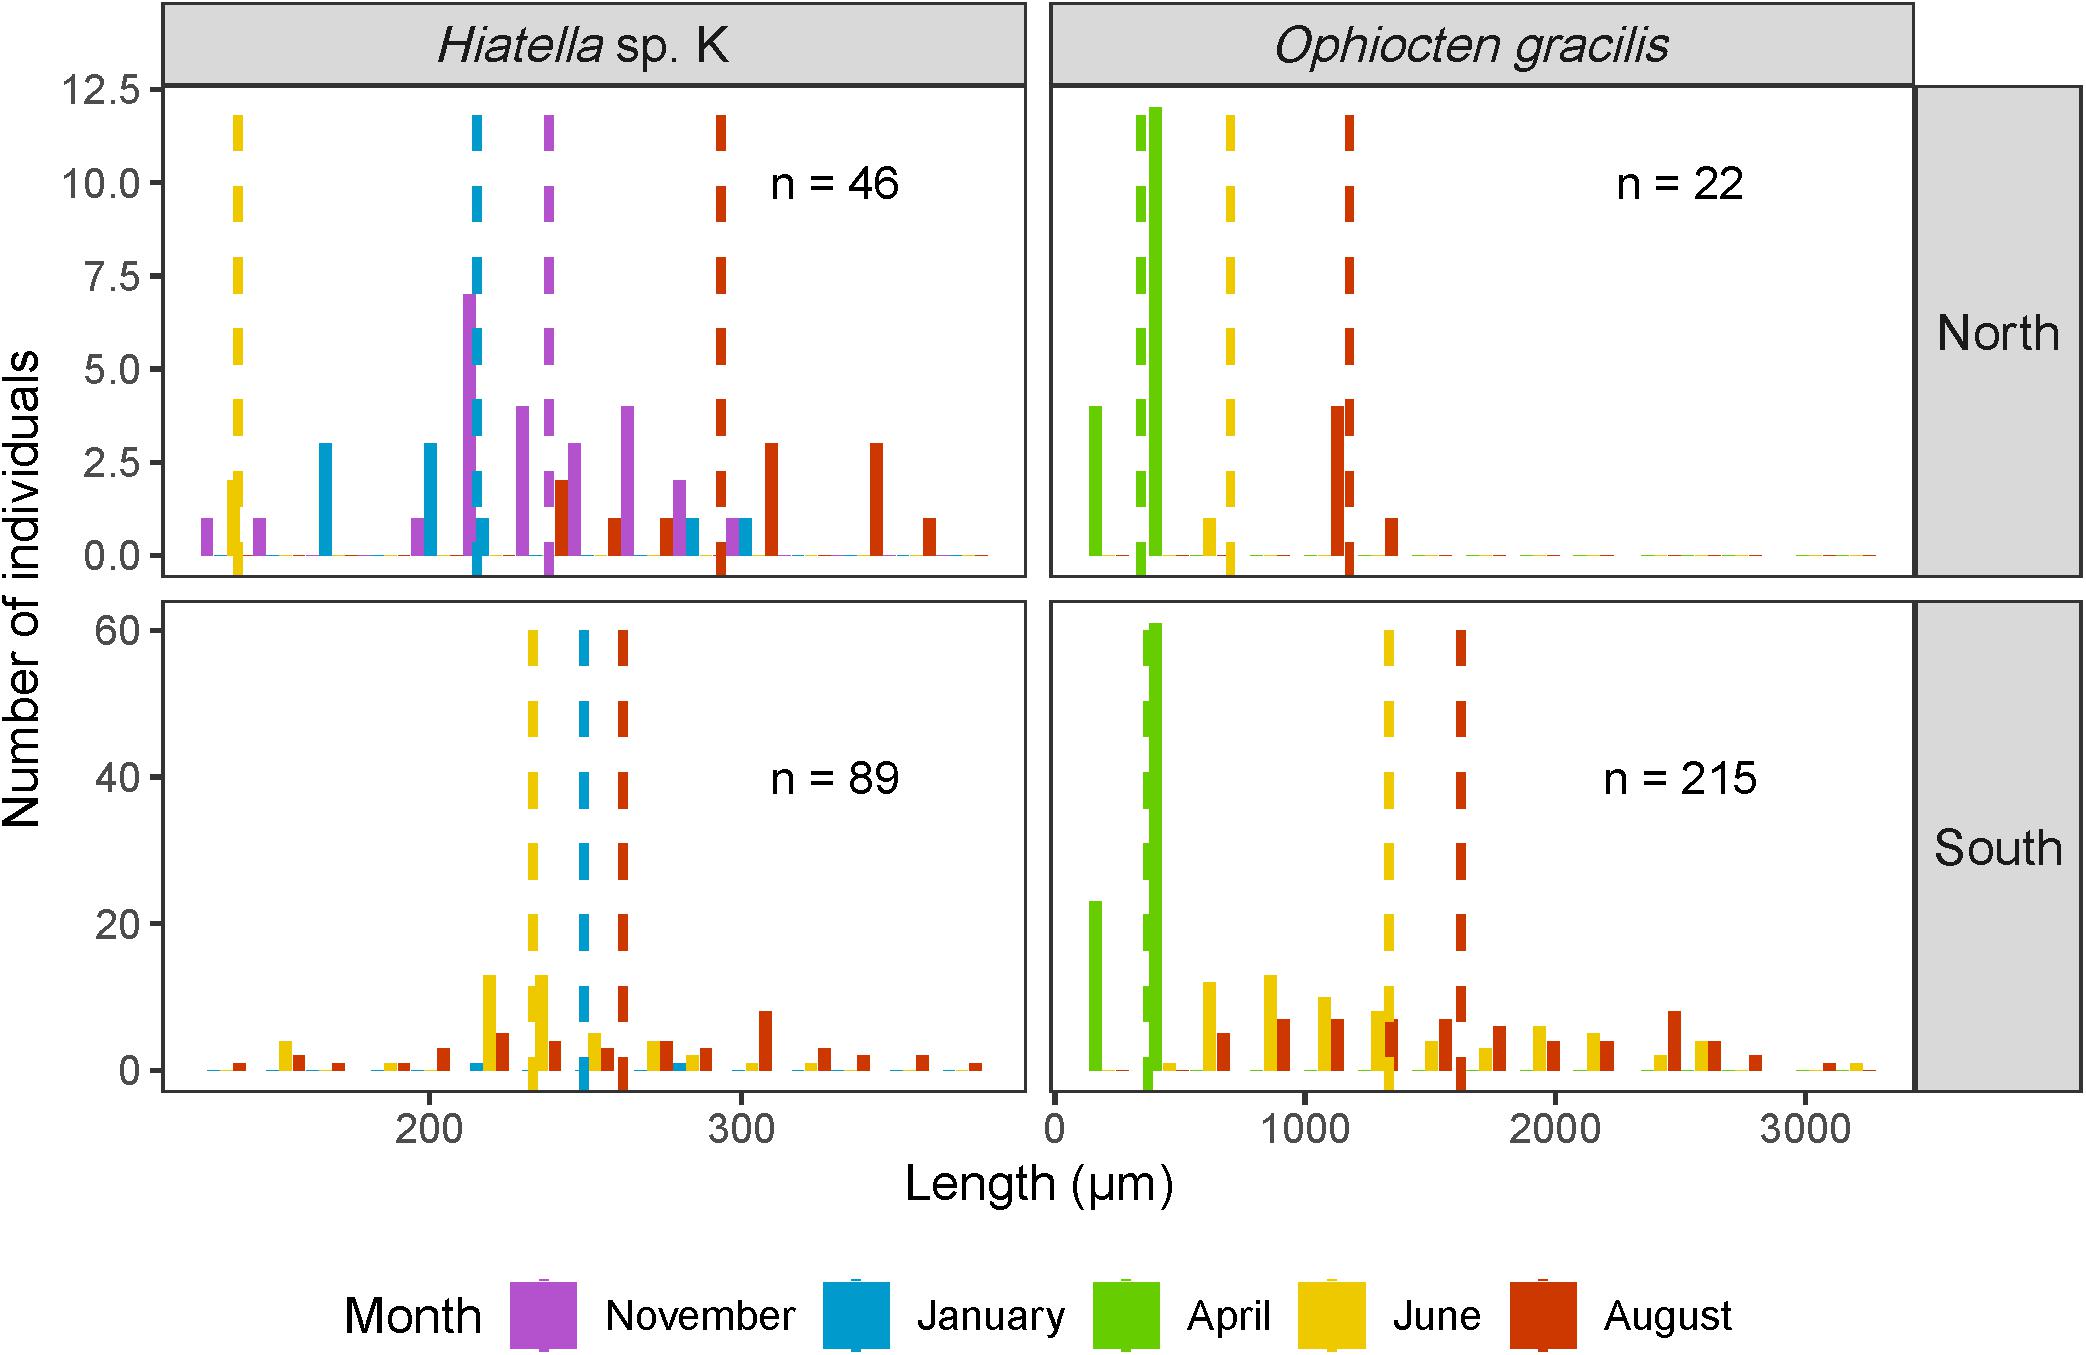
Figure 7. Length-frequency distributions of larvae of Hiatella sp. K and Ophiocten gracilis, two meroplankton taxa with prolonged presence in the water column (at least three sampling events), north and south of the Polar Front. The colored dashed lines represent the mean length for each month and n represents the number of individuals contributing to each histogram.
Meroplankton Community Patterns
The final CCA model was significant (p < 0.01) and included only sampling month as a constraining factor, suggesting that seasonal differences overpowered any variation between locations or water masses (Supplementary Table 2). No strong differences between North/South locations were observed on the ordination, though visually, there seemed to be a North/South difference within months in January and June (Figure 8). The CCA explained 34.2% of total inertia in the data, with the first two axes accounting for 22%. The samples collected in November, January, and April each formed their own distinct groups on the ordination, while the communities in June and August were very similar in species composition (Figure 8). In November, the community was characterized by the polychaetes Sphaerodorum flavum, Nothria conchylega, and Phyllodoce groenlandica as well as Nudibranchia indet, the ophiuroid Ophiacantha bidentata and the bivalve Serripes groenlandicus 94.1%. The community in January was almost entirely characterized by nudibranchs. Nudibranchs were still important in April in addition to the seastar C. crispatus and the polychaetes Spio sp. and Lumbrineris sp. During June/August the bivalves Macoma calcarea, Ciliatocardium ciliatum, Mya truncata, and Hiatella sp. K as well as the ophiuroids Ophiura robusta, Ophiopholis aculeata, and O. gracilis and the polychaete Galathowenia oculata characterized the meroplankton community.
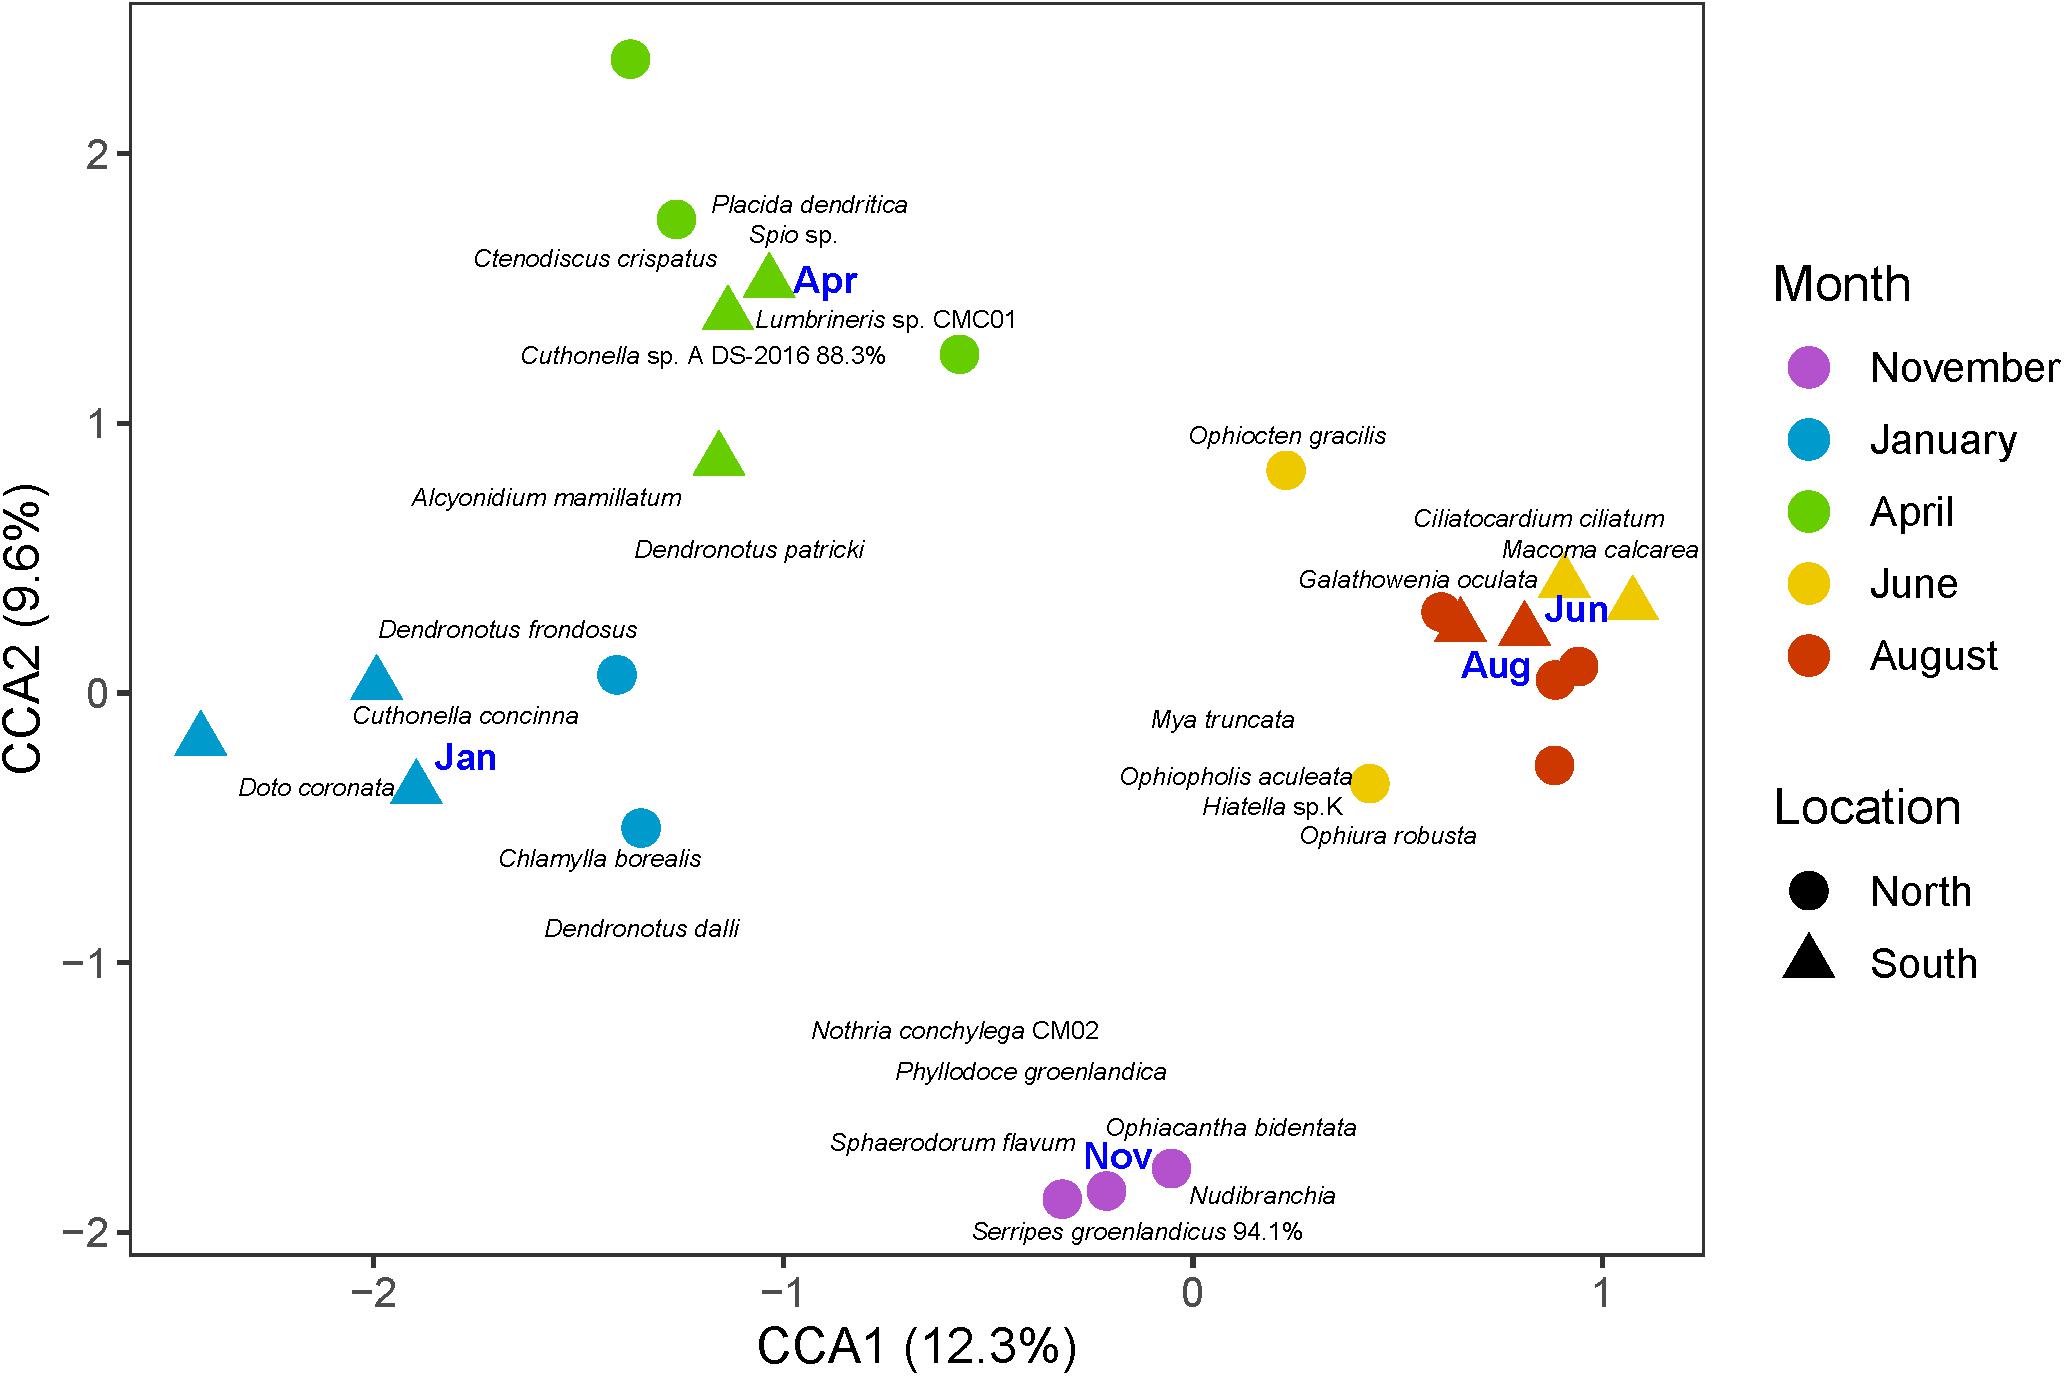
Figure 8. Similarity of meroplankton communities across months (colors), north and south of the Polar Front (symbols) shown in a canonical correspondence analysis (CCA) plot based on fourth-root transformed meroplankton abundance data. Each point represents a single sample per month, location and depth layer. The blue month labels are centroids for the corresponding months. The first axis explains 12.3% of the variance while the second explains 9.6%.
Discussion
Success of DNA Barcoding
We implemented a simple, relatively cheap and highly effective method (Ershova et al., 2019) to efficiently sequence hundreds of DNA-barcodes of meroplankton individuals from eight phyla. The HotShot extraction method (Truett et al., 2000) has proven to be extremely effective in extracting DNA from meroplankton, yielding higher success rates (71% overall but >93% for Echinodermata, Bivalvia, Nemertea, and Bryozoa) than earlier studies using different extraction methods [35% in Heimeier et al. (2010); 49% in Brandner et al. (2017); 68% in Walczynska et al. (2019)]. The benefits of the HotShot extraction method include that no membrane binding of DNA and no transfer of extract are needed, and it can be scaled to high-throughput (Meissner et al., 2013). Our lower success rate for DNA barcoding of gastropods compared to the other taxa may be due to incomplete crushing of the shell or the fact that most gastropod larvae were very small (∼100 μm) and may have provided insufficient material for DNA extraction. In addition, the majority of these were suspected to be young Limacina helicina (a pelagic gastropod, not meroplankton) based on the morphological resemblance to successfully-barcoded individuals of the same species, and these can be especially difficult to DNA-barcode (Elizaveta Ershova, IMR, personal communication). Therefore, the success rate of DNA barcoding of strictly-meroplanktonic gastropods was probably much higher than reported here.
In addition to effective DNA extraction, amplification, and sequencing, successful identification of larvae through DNA barcoding requires a curated barcode database such as BOLD against which to compare the larval sequences (Hebert et al., 2003). Important efforts in recent years (e.g., Layton et al., 2014, 2016) have added many additional species to the databases, but marine invertebrates in general remain under-represented (Weigand et al., 2019). In our study, 14% of all sequences did not find an “exact” match (>98% sequence match) in BOLD or GenBank. Of the sequences that did get a match >98%, about a tenth was not identified to species level in the barcode database itself. Therefore, the addition of more boreal-Arctic and Arctic species to the DNA barcode databases as well as taxonomic expertise for proper identification of these organisms would further improve our ability to identify meroplankton. Our very high success rate of meroplankton identification clearly demonstrates, however, that DNA barcoding of the COI gene marker is already a highly effective way of identifying meroplankton and will continue to improve as barcode databases become more complete.
Meroplankton Biodiversity
DNA barcoding enabled identification of meroplankton at a much higher taxonomic resolution than was achieved through morphological identification. We therefore captured a greater taxon richness than reported in most other seasonal high-latitude studies using morphological identification (Schlüter and Rachor, 2001; Fetzer and Arntz, 2008; Kuklinski et al., 2013; Silberberger et al., 2016; Michelsen et al., 2017). Bowden et al. (2009) found an even higher diversity of meroplankton taxa in the Antarctic, but they sampled more frequently throughout the year and had more stations compared to the present study, possibly capturing a larger proportion of the overall meroplankton community.
In our study, molluscs, echinoderms, and annelids dominated the meroplankton community in terms of taxon richness. While annelids and echinoderms are often amongst the most diverse groups in high-latitude meroplankton assemblages (Schlüter and Rachor, 2001; Michelsen et al., 2017), to our knowledge our study is the first to identify such a diverse larval nudibranch fauna. Echinoderms, molluscs, and annelids also dominated the meroplankton community in abundance, similarly to other studies in high-latitude regions (Schlüter and Rachor, 2001; Sewell and Jury, 2011). These phyla are also abundant and taxon-rich on the seafloor in the Barents Sea (Carroll et al., 2008; Cochrane et al., 2009; Jørgensen et al., 2015). Other taxa that are abundant on the seafloor in our study region (Zakharov et al., 2020), however, were notably rare or absent in our samples. First, species without a pelagic early life stage or those which remain in the benthic boundary layer just above the seafloor would not have been captured by our sampling method. A majority of polar prosobranchs, for instance, rely on direct development (Clarke, 1992) explaining why so few non-nudibranch gastropods were caught here, despite being present on the seafloor (Jørgensen et al., 2015). Additionally, our seasonal sampling may have missed species with a short-lived planktonic stage of less than a few weeks (Shanks, 2009) such as the tunicate Styela rustica (Khalaman et al., 2008). Large and mobile taxa such as crab larvae may have been able to avoid the slow-moving fine-mesh nets used in this study (Porter et al., 2008) or been too rare to be captured in a single net tow. Finally, our offshore location may explain the relative paucity of coastally dominant cirripeds [but see Basedow et al. (2010)].
While the majority of taxa found in this study are known inhabitants of the Barents Sea (Sirenko et al., 2001), a few species have, to our knowledge, never been recorded there. Notably, the nudibranch Bohuslania matsmichaeli (99.68% DNA match) is currently only known from one fjord in southern Norway (Korshunova et al., 2018). The presence of its larva in the Barents Sea suggests either that its propagules can disperse over very large distances or that the geographical range of the adults extends further north than currently known, although a third possibility of transport by ship ballast water cannot be excluded. Note, however, that our observation of this species here is only based on one barcoded larva. The brittle star O. gracilis (100% DNA match), the larvae of which were found in this study in very large numbers, has also not been recorded in the northern Barents Sea, but is commonly found on the shelf and continental slope along the coast of Norway [Sirenko et al., 2001; Global Biodiversity Information Facility (GBIF), 2019b]. While its primary distribution is along bathyal depths (Gage and Tyler, 1981), several adults have been collected from shallower locations [Global Biodiversity Information Facility (GBIF), 2019b] so the species’ ability to settle and survive on the Barents Sea shelf in the future seems unlikely but possible. It is also possible that adults of O. gracilis are currently found on the northern Barents Sea shelf but have been confused for the closely-related O. sericeum. Finally, we barcoded several individuals of the nemertean Cephalothrix iwatai (99% DNA match), a deep-sea species previously only recorded in the Sea of Japan [Chernyshev, 2013; Global Biodiversity Information Facility (GBIF), 2019a]. It is, however, highly unlikely that the larvae have drifted into the Barents Sea from the Sea of Japan. Therefore, one can presume that C. iwatai is more widely distributed than previously thought or that our specimens belong to a closely-related species which has not yet been barcoded. So far, conditions on the Barents Sea shelf have likely prevented some of these and other more southern species from settling onto the seafloor and growing to a reproductive stage, at least not in sufficient numbers to grow a detectable population. However, climate change and Atlantification of the Barents Sea (Polyakov et al., 2017, 2020) may increase the flow of Atlantic Water onto the Barents Sea shelf (Oziel et al., 2020), potentially transporting more propagules north as well as making conditions more favorable for some non-native species to settle and grow there as has been suggested for other species (e.g., Berge et al., 2005; Geoffroy et al., 2018; Renaud et al., 2019).
Seasonality
Larval abundance and composition varied sharply throughout the year. Contrary to our initial hypothesis, larval abundance peaked in August (south) and November (north) rather than in the spring when food would have presumably been most abundant for the larvae. There was, however, a secondary peak in larval abundance in April north of the Polar Front. In 2018 in our study area, the phytoplankton bloom peaked in early May, first north of the Polar Front, then, about 1 week later, to the south (Marie Porter, SAMS, personal communication). Thus, our April sampling captured the beginning and our June sampling captured the end of the bloom. A mooring study at 81°N on the northern coast of Svalbard similarly found the bloom to begin in early May (Henley et al., 2020). At first glance, this asynchrony of the bulk of the meroplanktonic community with the peak in primary production appears to contrast with studies in Svalbard fjords where overall meroplankton abundance peaks in spring/summer around the phytoplankton bloom (Kuklinski et al., 2013; Stübner et al., 2016), as well as in fjords in mainland Norway (Michelsen et al., 2017), in Greenland (Arendt et al., 2013), in the Antarctic and sub-Antarctic (Bowden et al., 2009; Presta et al., 2019), and off of the coast of the United Kingdom (Highfield et al., 2010). However, seasonality differs across taxa and a peak in abundance around the phytoplankton bloom is often driven by a few highly abundant taxa such as cirriped larvae (Węsławski et al., 1988; Highfield et al., 2010), which were not captured in large numbers in our study. Indeed, larvae of molluscs, echinoderms, polychaetes, and other taxa are often found later in the year than cirripeds (Węsławski et al., 1988; Highfield et al., 2010), although generally not as late as the August/November peak found here. Consistent with our findings of a late summer/fall peak (August/November) in abundance, a sediment trap study in the Chukchi Sea showed a peak in meroplankton export to the seafloor in September/October (Lalande et al., 2020). Additionally, a seasonal study of meroplankton on the continental shelf off of mainland Norway showed a peak in total abundance in July to September (Silberberger et al., 2016), consistent with our peak in August and November.
A combination of factors may explain the mismatch between the meroplankton peak and the phytoplankton bloom. First, for some of the species we collected, the pelagic larva can rely on a maternally-derived yolk sac for nutrition so it does not need to eat while in the plankton (e.g., lecithotrophic larvae of Capitella capitata, Méndez et al., 2000). For these larvae, availability of food in the plankton is irrelevant so there would be no need to time larval release with the phytoplankton bloom, at least not for the sake of the larval stage survival itself. Most taxa that we collected, however, are planktotrophic and would presumably require food to survive while in the plankton (Arctic Traits Database4, Degen and Faulwetter, 2019). These feeding larvae may rely on different food sources (Boidron-Métairon, 1995) than the dominant diatom taxa such as Thalassiosira spp. and Chaetoceros spp. present during the spring bloom in the study region (Hegseth, 1998; Wassmann et al., 1999). A wide range of other planktonic organisms including dinoflagellates, cercozoans, and fungi feed copepods outside of bloom periods in the Arctic (Cleary et al., 2017) and may feed meroplankton as well. Bivalve larvae, for instance, can feed on ciliates or dinoflagellates (Lindeque et al., 2015), which are present year-round in an Arctic fjord (Marquardt et al., 2016). Metabolic rate decreases with decreasing temperature in polar invertebrates (e.g., Heilmayer and Brey, 2003) so meroplankton in cold high-latitude waters may require less food to survive. Given that larval occurrence of most species in our study did not coincide with the spring bloom, it may be the adults instead which take advantage of the abundant food available during the bloom to fuel reproduction (e.g., Witte, 1996; Renaud et al., 2007b). For these income breeders, there would be a time lag between peak food availability and peak larval abundance (Kuklinski et al., 2013), just as we have observed in this study. In addition, some of the larvae may have been released around the spring bloom in a different location and taken several months to reach our study area. Finally, larvae released in the fall may benefit from the darker conditions to escape visual predators, though this theory remains to be tested.
Some potential biases in our sampling need evaluating. While the exact location of sampling differed slightly across months, especially for the location north of the Polar Front, we consider artifacts of this in the data minimal since the temperature and salinity profiles indicated clear differences between the north and the south of the Polar Front across all seasons. While the November sampling occurred closest to land which may partially explain the higher abundances at that time (Bluhm et al., 2018), August sampling, which also had very high meroplankton abundances, occurred furthest away from land. It is therefore likely that the August/November meroplankton peak remains valid. A secondary peak in abundance also occurred in April to the north of the Polar Front. This peak, largely driven by the ophiuroids O. gracilis and O. sericeum as well as the polychaete Spio sp., may represent a real surge in abundance just prior to the phytoplankton bloom (in May, Dalpadado et al., 2020; Dong et al., 2020). However, it could also be an artifact of the closer proximity to the Polar Front compared to other months, given that plankton often accumulate in patches around fronts (Trudnowska et al., 2016) and adult benthic invertebrates on the seafloor also occur in higher densities near the Polar Front (Carroll et al., 2008). However, O. gracilis does not occur on the northern Barents Sea shelf at all, so higher adult densities are unlikely to explain the April peak north of the Polar Front. Given that the zooplankton net mesh size was larger in April (180 μm) and, at the northern location, in June (180 and 64/300 μm, see Table 1 note for details), smaller larvae (e.g., earliest stages of Hiatella arctica measure around 120 μm, Flyachinskaya and Lesin, 2006; Brandner et al., 2017) could have been under-sampled and abundances under-estimated compared to other months. Nonetheless, it is unlikely that an abundant species would have been missed entirely as some individuals would have presumably been caught in the net through aggregations of other plankton such as phytoplankton clusters. Finally, zooplankton distribution can be spatially patchy, with plankton concentrations sometimes varying by more than one order of magnitude over a distance of a few kilometers (e.g., Trudnowska et al., 2016) and meroplankton is no exception (Kersten et al., 2019). Taking multiple replicates of each net sample would help obtain a more robust estimate of species abundance and composition at a particular location. In this study, as is often the case during oceanographic surveys on shared research vessels, sampling time was limited, allowing for collection of only one replicate per sample. We recommend that future studies put a strong emphasis on replication of net samples.
The meroplankton community varied greatly throughout the year with most species present at one or two consecutive sampling events, suggesting a larval period of at most a few months for most species (assuming at least some local retention). However, some taxa (the ophiuroids O. gracilis, O. sericeum, and O. aculeata, the bivalves Hiatella sp. K and M. truncata, and the nudibranchs Dendronotus patricki and Dendronotus kalikal) were present through most of the year. Our data suggest that the extended presence in the water column can be explained in some taxa by a long-lived pelagic phase [e.g., O. gracilis, also observed in Gage and Tyler (1981)]. On the continental slope off of the United Kingdom, O. gracilis spawns in late winter and early spring and settlement of the post-larvae to the seafloor occurs in summer (Tyler and Gage, 1982). Similarly, we observed a pulse of small larvae in April and on average larger larvae as well as several post-larvae in August, suggestive of a similarly long larval phase in the Barents Sea compared to the coast of the United Kingdom, even though we would have expected a longer larval phase in our region as colder waters tend to extend larval period (O’Connor et al., 2007). Contrary to O. gracilis, the average size of Hiatella sp. K showed no obvious pattern over time, suggesting continuous reproduction (or at least multiple reproductive events) throughout the year, which is consistent with prior observations (Garcia et al., 2003; Brandner et al., 2017). In addition, several species identified in our study, such as the polychaetes Bylgides groenlandicus and N. conchylega as well as several nudibranchs, were identified in the meroplankton but, to our knowledge, a pelagic life stage has never been explicitly recorded in these species (Supplementary Image 1). Data from this study therefore contributes valuable, although coarse, species-level information on reproductive strategy, timing, and duration.
Role of the Polar Front
While seasonality drove the bulk of the differences in community composition among samples, there were some differences between the sampling locations north and south of the Polar Front as well. Specifically, about two thirds of the taxa were found only on one side of the front or the other and the taxon richness was significantly greater to the north, partially supporting our hypothesis of different meroplankton communities across the front. Note, however, that the difference in community structure was not statistically significant as per the multivariate analysis. The distinctiveness of zooplankton communities across fronts has been demonstrated in various systems worldwide (Perry et al., 1993; Coyle and Pinchuk, 2005; Powell et al., 2015), including in the Barents Sea where the Polar Front has been interpreted to act as a barrier to larval dispersal (e.g., Schlüter and Rachor, 2001). The benthic macrofaunal communities differ substantially across the Barents Sea Polar Front (Carroll et al., 2008), potentially due to different larval supplies or, vice versa, supplying larvae of different species on either side of the front. Indeed, in our study, early life stages of polychaetes (a predominantly macrofaunal group) differed greatly in species composition across the Polar Front. Of the 28 polychaete taxa identified in the meroplankton, only seven were shared between north and south, but with all phyla combined, about a third of the taxa were shared. This observation is congruent with the benthic megafaunal communities (including most echinoderms and some molluscs) on the seafloor below, which differ somewhat between the two locations but are overall more similar to each other compared to other regions of the Barents Sea (Jørgensen et al., 2015; Zakharov et al., 2020). Importantly, while our two locations were positioned on either side of the Polar Front, with surface waters differing greatly in temperature and salinity, deeper layers were similar between the two locations. The Barents Sea water mass, which spanned the deeper layers of both the north and south locations, potentially acted as a corridor for transport of larvae between our two locations. Other oceanographic features (particularly eddies, Porter et al., 2020) may also facilitate exchange of water, and therefore of meroplankton, across the oceanographic Polar Front. Eddies have been shown to transport larvae in other regions of the world (e.g., Madagascar, Ockhuis, 2016). The branch of Atlantic Water that wraps around the western coast of Svalbard and enters the Barents Sea from the north (Lind et al., 2012) is of relatively low volume and has limited penetration southward into the Barents Sea, so is unlikely to constitute a significant supply of meroplankton to our sampling site north of the Polar Front. Therefore, our study suggests that the Polar Front may not act as an impervious barrier to larval dispersal, yet maintains some level of community differentiation.
Despite some differences in faunal characteristics across the Polar Front, there was little impact of water mass on the meroplankton community composition. The same taxa were often found at all depths, in water layers of different properties, within a given station. While another meroplankton study in the Barents Sea showed strong associations of meroplankton communities with water masses (Schlüter and Rachor, 2001), another study in the Ross Sea found no significant differences across water masses once other factors, such as depth and region, were accounted for Gallego et al. (2014). A possible explanation could be that some taxa may actively migrate within the water column as a means of regulating their range of dispersal (Largier, 2003). Alternatively, we may have captured either the upward trajectory of newly-released larvae or the downward journey of settling propagules. It therefore appears that early life stages of some of these taxa may be able to withstand relatively large variations in temperature and salinity, at least for short periods of time (Costlow and Bookout, 1969).
Conclusion
Our new knowledge gained from the combination of high taxonomic and seasonal resolution opposes the previous notion of tight coupling of the spring bloom to larval abundance, and instead shows taxon-specific seasonal patterns with most species occurring in late summer and fall. This study also highlights the value of high-throughput DNA barcoding as a means of identifying meroplankton to high taxonomic resolution. In addition to providing species-specific information on reproductive timing, etc., this method enabled the identification of species that are non-native to the study area. Boreal species which already have a means of reaching the Arctic inflow shelves during their larval phase may be among the first to expand their range into the Arctic as the climate continues to warm. Regular monitoring of the meroplanktonic community on the inflow shelves using high-throughput DNA barcoding may play a key role in early detection of these newcomers.
Data Availability Statement
The raw sequencing datasets presented in this study are publicly available in the Sequence Read Archive (SRA) repository of NCBI Bioproject name: PRJNA725248; https://www.ncbi.nlm.nih.gov/bioproject/PRJNA725248. The rest of the data, as well as photos of meroplankton individuals and the bioinformatics and data analysis R codes can be found at Dryad Digital Repository https://doi.org/10.5061/dryad.n8pk0p2vf.
Author Contributions
RD, EE, PR, and BB conceived the study. RD, EE, OW, and KP designed the molecular protocol. FC and RD collected and interpreted the physical data. RD and EE collected the zooplankton samples. RD, EE, and OW performed the laboratory work. OW ran the bioinformatics and RD performed data analysis. RD wrote the manuscript with contributions from EE, OW, KP, PR, FC, and BB. All authors have read and approved the manuscript.
Funding
This research has been jointly funded by UiT the Arctic University of Norway and the Tromsø Research Foundation under the project “Arctic Seasonal Ice Zone Ecology,” project number 01vm/h1 as well as by the Fram Centre Flagship “Climate Change in Fjord and Coast” grant number 272019 and the Fonds de Recherche Nature et Technologies du Québec (file number 270604). The ArcticPRIZE project (NE/P006302/1 – United Kingdom Natural Environment Research Council) and the Nansen Legacy project (Norwegian Research Council project 276730) contributed ship time for sampling. The UiT library covered the costs of open access publication. The work of EE was done within the framework of the state assignment of IO RAS (theme no. 0128-2021-0007).
Conflict of Interest
The authors declare that the research was conducted in the absence of any commercial or financial relationships that could be construed as a potential conflict of interest.
Acknowledgments
We would like to thank the chief scientists, crew, and fellow scientists onboard the RV Helmer Hanssen, RV Kronprins Haakon, and RRS James Clark Ross for their support during our sampling efforts. We would also like to thank ArcticPRIZE project and the Nansen Legacy project for contributing CTD data and discussion fora. We are grateful to Helena Michelsen (UiT), Kristine Cerbule (UiT), and Julie Bitz-Thorsen (UiT) for their assistance during laboratory work. We would also further like to thank Emily Venables (SAMS) for processing the CTD data of the January, April, and June cruises, to Randi Ingvaldsen (IMR) for general discussions on oceanography of the Barents Sea and to Michael Greenacre (University Pompeu Fabra) for advice on statistical analyses.
Supplementary Material
The Supplementary Material for this article can be found online at: https://www.frontiersin.org/articles/10.3389/fmars.2021.677732/full#supplementary-material
Footnotes
- ^ http://boldsystems.org
- ^ https://blast.ncbi.nlm.nih.gov/Blast.cgi
- ^ www.marinespecies.org/
- ^ https://www.univie.ac.at/arctictraits/
References
Abramoff, M. D., Magalhaes, P. J., and Ram, S. (2004). Image processing with ImageJ. Biophotonics Int. 11, 36–42.
Andújar, C., Arribas, P., Yu, D. W., Vogler, A. P., and Emerson, B. C. (2018). Why the COI barcode should be the community DNA metabarcode for the metazoa. Mol. Ecol. 27, 3968–3975. doi: 10.1111/mec.14844
Ardyna, M., Mills, M., Oziel, L., Grondin, P.-L., Lacour, L., Verin, G., et al. (2020). Environmental drivers of under-ice phytoplankton bloom dynamics in the Arctic Ocean. Elem. Sci. Anth. 8:30. doi: 10.1525/elementa.430
Arendt, K. E., Juul-Pedersen, T., Mortensen, J., Blicher, M. E., and Rysgaard, S. (2013). A 5-year study of seasonal patterns in mesozooplankton community structure in a sub-Arctic fjord reveals dominance of Microsetella norvegica (Crustacea, Copepoda). J. Plankton Res. 35, 105–120. doi: 10.1093/plankt/fbs087
Barton, B. I., Lenn, Y.-D., and Lique, C. (2018). Observed Atlantification of the Barents Sea causes the Polar Front to limit the expansion of winter sea ice. J. Phys. Oceanogr. 48, 1849–1866. doi: 10.1175/JPO-D-18-0003.1
Basedow, S. L., Tande, K. S., and Zhou, A. M. (2010). Biovolume spectrum theories applied: spatial patterns of trophic levels within a mesozooplankton community at the Polar Front. J. Plankton Res. 32, 1105–1119. doi: 10.1093/plankt/fbp110
Berge, J., Johnsen, G., Nilsen, F., Gulliksen, B., and Slagstad, D. (2005). Ocean temperature oscillations enable reappearance of blue mussels Mytilus edulis in Svalbard after a 1000 year absence. Mar. Ecol. Prog. Ser. 303, 167–175. doi: 10.3354/meps303167
Bluhm, B. A., Hop, H., Vihtakari, M., Gradinger, R., Iken, K., Melnikov, I. A., et al. (2018). Sea ice meiofauna distribution on local to pan-Arctic scales. Ecol. Evol. 8, 2350–2364. doi: 10.1002/ece3.3797
Boidron-Métairon, I. F. (1995). “Larval nutrition,” in Ecology of Marine Invertebrate Larvae, ed. L. McEdward (Boca Raton, FL: CRC Press Inc), 223–248.
Bowden, D. A., Clarke, A., and Peck, L. S. (2009). Seasonal variation in the diversity and abundance of pelagic larvae of Antarctic marine invertebrates. Mar. Biol. 156, 2033–2047. doi: 10.1007/s00227-009-1235-9
Boyer, F., Mercier, C., Bonin, A., Le Bras, Y., Taberlet, P., and Coissac, E. (2016). Obitools: a unix-inspired software package for DNA metabarcoding. Mol. Ecol. Resour. 16, 176–182. doi: 10.1111/1755-0998.12428
Brandner, M. M., Stübner, E., Reed, A. J., Gabrielsen, T. M., and Thatje, S. (2017). Seasonality of bivalve larvae within a high Arctic fjord. Polar Biol. 40, 263–276. doi: 10.1007/s00300-016-1950-x
Carmack, E., and Wassmann, P. (2006). Food webs and physical–biological coupling on pan-Arctic shelves: unifying concepts and comprehensive perspectives. Prog. Oceanogr. 71, 446–477. doi: 10.1016/j.pocean.2006.10.004
Carroll, M. L., Denisenko, S. G., Renaud, P. E., and Ambrose, W. G. Jr. (2008). Benthic infauna of the seasonally ice-covered western Barents Sea: patterns and relationships to environmental forcing. Deep. Res. Part II Top. Stud. Oceanogr. 55, 2340–2351. doi: 10.1016/j.dsr2.2008.05.022
Chernyshev, A. V. (2013). Two new species of deep-sea nemerteans from the SoJaBio expedition in the Sea of Japan. Deep. Res. Part II Top. Stud. Oceanogr. 8, 148–155. doi: 10.1016/j.dsr2.2012.07.041
Clarke, A. (1992). Reproduction in the cold: Thorson revisited. Invertebr. Reprod. Dev. 22, 175–184. doi: 10.1080/07924259.1992.9672270
Cleary, A. C., Søreide, J. E., Freese, D., Niehoff, B., and Gabrielsen, T. M. (2017). Feeding by Calanus glacialis in a high arctic fjord: potential seasonal importance of alternative prey. ICES J. Mar. Sci. 74, 1937–1946. doi: 10.1093/icesjms/fsx106
Clough, L. M., Ambrose, W. G. Jr., Ashjian, C. J., Piepenburg, D., Renaud, P. E., and Smith, S. L. (1997). Meroplankton abundance in the Northeast Water Polynya: insights from oceanographic parameters and benthic abundance patterns. J. Mar. Syst. 10, 343–357. doi: 10.1016/s0924-7963(96)00082-6
Cochrane, S. K. J., Denisenko, S. G., Renaud, P. E., Emblow, C. S., Ambrose, W. G. Jr., and Ellingsen, H. I., et al. (2009). Benthic macrofauna and productivity regimes in the Barents Sea — ecological implications in a changing Arctic. J. Sea Res. 61, 222–233. doi: 10.1016/j.seares.2009.01.003
Costlow, J. D., and Bookout, C. G. (1969). Temperature and meroplankton. Chesap. Sci. 10, 253–255. doi: 10.2307/1350462
Cowen, R. K., and Sponaugle, S. (2009). Larval dispersal and marine population connectivity. Annu. Rev. Mar. Sci. 1, 443–466. doi: 10.1146/annurev.marine.010908.163757
Coyle, K. O., and Pinchuk, A. I. (2005). Seasonal cross-shelf distribution of major zooplankton taxa on the northern Gulf of Alaska shelf relative to water mass properties, species depth preferences and vertical migration behavior. Deep. Res. Part II Top. Stud. Oceanogr. 52, 217–245. doi: 10.1016/j.dsr2.2004.09.025
Dalpadado, P., Arrigo, K. R., van Dijken, G. L., Skjoldal, H. R., Bagøien, E., Dolgov, A. V., et al. (2020). Climate effects on temporal and spatial dynamics of phytoplankton and zooplankton in the Barents Sea. Prog. Oceanogr. 185:102320. doi: 10.1016/j.pocean.2020.102320
Degen, R., and Faulwetter, S. (2019). The Arctic Traits Database-a repository of Arctic benthic invertebrate traits. Earth Syst. Sci. Data 11, 301–322. doi: 10.5194/essd-11-301-2019
Dehn, L. A., Sheffield, G. G., Follmann, E. H., Duffy, L. K., Thomas, D. L., and O’Hara, T. M. (2007). Feeding ecology of phocid seals and some walrus in the Alaskan and Canadian Arctic as determined by stomach contents and stable isotope analysis. Polar Biol. 30, 167–181. doi: 10.1007/s00300-006-0171-0
Dong, K., Kvile, Ø, Stenseth, N., and Stige, L. (2020). Associations among temperature, sea ice and phytoplankton bloom dynamics in the Barents Sea. Mar. Ecol. Prog. Ser. 635, 25–36. doi: 10.3354/meps13218
Eriksen, E., Benzik, A. N., Dolgov, A. V., Skjoldal, H. R., Vihtakari, M., Johannesen, E., et al. (2020). Diet and trophic structure of fishes in the Barents Sea: the Norwegian-Russian program “Year of stomachs” 2015 – Establishing a baseline. Prog. Oceanogr. 183:102262. doi: 10.1016/j.pocean.2019.102262
Ershova, E. A., Descoteaux, R., Wangensteen, O. S., Iken, K., Hopcroft, R. R., Smoot, C., et al. (2019). Diversity and distribution of meroplanktonic larvae in the Pacific Arctic and connectivity with adult benthic invertebrate communities. Front. Mar. Sci. 6:490. doi: 10.3389/fmars.2019.00490
Fetzer, I., and Arntz, W. E. (2008). Reproductive strategies of benthic invertebrates in the Kara Sea (Russian Arctic): adaptation of reproduction modes to cold water. Mar. Ecol. Prog. Ser. 356, 189–202. doi: 10.3354/meps07271
Flyachinskaya, L. P., and Lesin, P. A. (2006). Using 3D reconstruction method in the investigations of Bivalvia larval development (by the example of Hiatella arctica L.). Proc. Zool. Inst. Russ. Acad. Sci. 310, 45–50.
Gage, J. D., and Tyler, P. A. (1981). Non-viable seasonal settlement of larvae of the upper bathyal brittle star Ophiocten gracilis in the Rockall Trough abyssal. Mar. Biol. 64, 153–161. doi: 10.1007/bf00397104
Gallego, R., Lavery, S., and Sewell, M. A. (2014). The meroplankton community of the oceanic Ross Sea during late summer. Antarct. Sci. 26, 345–360. doi: 10.1017/S0954102013000795
Garcia, E. G. (2007). The northern shrimp (Pandalus borealis) offshore fishery in the Northeast Atlantic. Adv. Mar. Biol. 52, 147–266. doi: 10.1016/S0065-2881(06)52002-4
Garcia, E. G., Thorarinsdottir, G. G., and Ragnarsson, S. A. (2003). Settlement of bivalve spat on artificial collectors in Eyjafjordur, North Iceland. Hydrobiologia 503, 131–141. doi: 10.1023/B:HYDR.0000008495.24479.4f
Geller, J., Meyer, C., Parker, M., and Hawk, H. (2013). Redesign of PCR primers for mitochondrial cytochrome c oxidase subunit I for marine invertebrates and application in all-taxa biotic surveys. Mol. Ecol. Resour. 13, 851–861. doi: 10.1111/1755-0998.12138
Geoffroy, M., Berge, J., Majaneva, S., Johnsen, G., Langbehn, T. J., Cottier, F., et al. (2018). Increased occurrence of the jellyfish Periphylla periphylla in the European high arctic. Polar Biol. 41, 2615–2619. doi: 10.1007/s00300-018-2368-4
Global Biodiversity Information Facility (GBIF) (2019a). Cephalothrix iwatai (Chernyshev, 2013). GBIF Backbone Taxonomy. Checklist dataset. Copenhagen: GBIF.
Global Biodiversity Information Facility (GBIF) (2019b). Ophiocten gracilis (Sars G.O., 1871). GBIF Backbone Taxonomy. Checklist dataset. Copenhagen: GBIF.
Gluchowska, M., Kwasniewski, S., Prominska, A., Olszewska, A., Goszczko, I., Falk-Petersen, S., et al. (2016). Zooplankton in Svalbard fjords on the Atlantic-Arctic boundary. Polar Biol. 39, 1785–1802. doi: 10.1007/s00300-016-1991-1
Greenacre, M. (2017). “Size” and “shape” in the measurement of multivariate proximity. Methods Ecol. Evol. 8, 1415–1424. doi: 10.1111/2041-210X.12776
Hebert, P. D. N., Ratnasingham, S., and Dewaard, J. R. (2003). Barcoding animal life: cytochrome c oxidase subunit 1 divergences among closely related species. Proc. R. Soc. B 270, S96–S99. doi: 10.1098/rsbl.2003.0025
Hegseth, E. N. (1998). Primary production of the northern Barents Sea. Polar Res. 17, 113–123. doi: 10.1111/j.1751-8369.1998.tb00266.x
Heilmayer, O., and Brey, T. (2003). Saving by freezing? Metabolic rates of Adamussium colbecki in a latitudinal context. Mar. Biol. 143, 477–484. doi: 10.1007/s00227-003-1079-7
Heimeier, D., Lavery, S., and Sewell, M. A. (2010). Using DNA barcoding and phylogenetics to identify Antarctic invertebrate larvae: lessons from a large scale study. Mar. Genomics 3, 165–177. doi: 10.1016/j.margen.2010.09.004
Henley, S. F., Porter, M., Hobbs, L., Braun, J., Guillaume-Castel, R., Venables, E. J., et al. (2020). Nitrate supply and uptake in the Atlantic Arctic sea ice zone: seasonal cycle, mechanisms and drivers. Philos. Trans. R. Soc. A Math. Phys. Eng. Sci. 378:20190361. doi: 10.1098/rsta.2019.0361
Highfield, J. M., Eloire, D., Conway, D. V. P., Lindeque, P. K., Attrill, M. J., and Somerfield, P. J. (2010). Seasonal dynamics of meroplankton assemblages at station L4. J. Plankton Res. 32, 681–691. doi: 10.1093/plankt/fbp139
Hirche, H.-J., and Kosobokova, K. N. (2011). Winter studies on zooplankton in Arctic seas: the Storfjord (Svalbard) and adjacent ice-covered Barents Sea. Mar. Biol. 158, 2359–2376. doi: 10.1007/s00227-011-1740-5
Hunt, G. L. Jr., Blanchard, A. L., Boveng, P., Dalpadado, P., Eisner, L., Hopcroft, R. R., et al. (2013). The Barents and Chukchi seas: comparison of two Arctic shelf ecosystems. J. Mar. Syst. 109, 43–68. doi: 10.1016/j.jmarsys.2012.08.003
Hunt, G. L. Jr., Drinkwater, K. F., Arrigo, K., Berge, J., Daly, K. L., Danielson, S., et al. (2016). Advection in polar and sub-polar environments: impacts on high latitude marine ecosystems. Prog. Oceanogr. 149, 40–81. doi: 10.1016/j.pocean.2016.10.004
Jakobsen, T., and Ozhigin, V. K. (2011). The Barents Sea: Ecosystem, Resources, Management : Half a Century of Russian-Norwegian Cooperation. Trondheim: Tapir Academic Press.
Jørgensen, L. L., Ljubin, P. A., Skjodal, H. R., Ingvaldsen, R. B., Anisimova, N. A., and Manushin, I. E. (2015). Distribution of benthic megafauna in the Barents Sea: baseline for an ecosystem approach to management. ICES J. Mar. Sci. 72, 595–613. doi: 10.1093/icesjms/fst048
Kersten, O., Vetter, E. W., Jungbluth, M. J., Smith, C. R., and Goetze, E. (2019). Larval assemblages over the abyssal plain in the Pacific are highly diverse and spatially patchy. PeerJ. 7:e7691. doi: 10.7717/peerj.7691
Khalaman, V. V., Belyaeva, D. V., and Flyachinskaya, L. P. (2008). Effect of excretory-secretory products of some fouling organisms on settling and metamorphosis of the larvae of Styela rustica (Ascidiae). Russ. J. Mar. Biol. 34, 170–173. doi: 10.1134/S106307400803005X
Korshunova, T., Lundin, K., Malmberg, K., Picton, B., and Martynov, A. (2018). First true brackish-water nudibranch mollusc provides new insights for phylogeny and biogeography and reveals paedomorphosis-driven evolution. PLoS One 13:e0192177. doi: 10.1371/journal.pone.0192177
Krueck, N. C., Ahmadia, G. N., Green, A., Jones, G. P., Possingham, H. P., Riginos, C., et al. (2017). Incorporating larval dispersal into MPA design for both conservation and fisheries. Ecol. Appl. 27, 925–941. doi: 10.1002/eap.1495
Kuklinski, P., Berge, J., McFadden, L., Dmoch, K., Zajaczkowski, M., Nygård, H., et al. (2013). Seasonality of occurrence and recruitment of Arctic marine benthic invertebrate larvae in relation to environmental variables. Polar Biol. 36, 549–560. doi: 10.1007/s00300-012-1283-3
Lalande, C., Grebmeier, J. M., Hopcroft, R. R., and Danielson, S. L. (2020). Annual cycle of export fluxes of biogenic matter near Hanna Shoal in the northeast Chukchi Sea. Deep. Res. Part II Top. Stud. Oceanogr. 177:104730. doi: 10.1016/j.dsr2.2020.104730
Largier, J. L. (2003). Considerations in estimating larval dispersal distances from oceanographic data. Ecol. Appl. 13, 71–89. doi: 10.1890/1051-0761(2003)013[0071:cieldd]2.0.co;2
Layton, K. K. S., Corstorphine, E. A., and Hebert, P. D. N. (2016). Exploring Canadian echinoderm diversity through DNA barcodes. PLoS One 11:e0166118. doi: 10.1371/journal.pone.0166118
Layton, K. K. S., Martel, A. L., and Hebert, P. D. N. (2014). Patterns of DNA barcode variation in Canadian marine molluscs. PLoS One 9:e95003. doi: 10.1371/journal
Leray, M., and Knowlton, N. (2016). Censusing marine eukaryotic diversity in the twenty-first century. Philos. Trans. R. Soc. B Biol. Sci. 371:20150331. doi: 10.1098/rstb.2015.0331
Leu, E., Mundy, C. J., Assmy, P., Campbell, K., Gabrielsen, T. M., Gosselin, M., et al. (2015). Arctic spring awakening - steering principles behind the phenology of vernal ice algal blooms. Prog. Oceanogr. 139, 151–170. doi: 10.1016/j.pocean.2015.07.012
Levin, L. A. (2006). Recent progress in understanding larval dispersal: new directions and digressions. Integr. Comp. Biol. 46, 282–297. doi: 10.1093/icb/icj024
Lind, S., and Ingvaldsen, R. B. (2012). Variability and impacts of Atlantic Water entering the Barents Sea from the north. Deep. Res. Part I Oceanogr. Res. Pap. 62, 70–88. doi: 10.1016/j.dsr.2011.12.007
Lindeque, P. K., Dimond, A., Harmer, R. A., Parry, H. E., Pemberton, K. L., and Fileman, E. S. (2015). Feeding selectivity of bivalve larvae on natural plankton assemblages in the Western English Channel. Mar. Biol. 162, 291–308. doi: 10.1007/s00227-014-2580-x
Loeng, H. (1991). Features of the physical oceanographic conditions of the Barents Sea. Polar Res. 10, 5–18. doi: 10.3402/polar.v10i1.6723
Mahé, F., Rognes, T., Quince, C., de Vargas, C., and Dunthorn, M. (2015). Swarmv2: highly-scalable and high-resolution amplicon clustering. PeerJ 3:e1420. doi: 10.7717/peerj.1420
Marquardt, M., Vader, A., Stübner, E. I., Reigstad, M., and Gabrielsen, T. M. (2016). Strong seasonality of marine microbial eukaryotes in a high-Arctic fjord (Isfjorden, in West Spitsbergen, Norway). Appl. Environ. Microbiol. 82, 1868–1880. doi: 10.1128/AEM.03208-15
Meissner, H., Fevolden, S.-E., Amundsen, P. A., and Præbel, K. (2013). Evaluation of three methods for high throughput extraction of DNA from challenging fish tissues. Conserv. Genet. Resour. 5, 733–735. doi: 10.1007/s12686-013-9893-9
Méndez, N., Linke-Gamenick, I., and Forbes, V. E. (2000). Variability in reproductive mode and larval development within the Capitella capitata species complex. Invertebr. Reprod. Dev. 38, 131–142. doi: 10.1080/07924259.2000.9652448
Merkel, F. R., Jamieson, S. E., Falk, K., and Mosbech, A. (2007). The diet of common eiders wintering in Nuuk, Southwest Greenland. Polar Biol. 30, 227–234. doi: 10.1007/s00300-006-0176-8
Michelsen, H. K., Svensen, C., Reigstad, M., Nilssen, E. M., and Pedersen, T. (2017). Seasonal dynamics of meroplankton in a high-latitude fjord. J. Mar. Syst. 168, 17–30. doi: 10.1016/j.jmarsys.2016.12.001
O’Connor, M. I., Bruno, J. F., Gaines, S. D., Halpern, B. S., Lester, S. E., Kinlan, B. P., et al. (2007). Temperature control of larval dispersal and the implications for marine ecology, evolution, and conservation. Proc. Natl. Acad. Sci. U.S.A. 104, 1266–1271. doi: 10.1073/pnas.0603422104
Ockhuis, S. A. N. (2016). The “Suitcase Hypothesis”- Can Eddies Provide a Pathway for Gene Flow Between Madagascar and KwaZulu-Natal?. Master’s thesis. Cape Town: Cape Peninsula University of Technology.
Oksanen, J., Blanchet, G., Friendly, M., Kindt, R., Legendre, P., McGlinn, D., et al. (2019). Vegan: Community Ecology Package. R Package Version 2.5-6.
Oziel, L., Baudena, A., Ardyna, M., Massicotte, P., Randelhoff, A., Sallée, J.-B., et al. (2020). Faster Atlantic currents drive poleward expansion of temperate phytoplankton in the Arctic Ocean. Nat. Commun. 11:1705. doi: 10.1038/s41467-020-15485-5
Oziel, L., Sirven, J., and Gascard, J.-C. (2016). The Barents Sea frontal zones and water masses variability (1980-2011). Ocean Sci. 12, 169–184. doi: 10.5194/os-12-169-2016
Perry, R. I., Harding, G. C., Loder, J. W., Tremblay, M. J., Sinclair, M. M., and Drinkwater, K. F. (1993). Zooplankton distributions at the Georges Bank frontal system: retention or dispersion? Cont. Shelf Res. 13, 357–383. doi: 10.1016/0278-4343(93)90056-4
Piepenburg, D., Archambault, P., Ambrose, W. G. Jr., Blanchard, A. L., Bluhm, B. A., Carroll, M. L., et al. (2011). Towards a pan-Arctic inventory of the species diversity of the macro- and megabenthic fauna of the Arctic shelf seas. Mar. Biodivers. 41, 51–70. doi: 10.1007/s12526-010-0059-7
Polyakov, I. V., Alkire, M. B., Bluhm, B. A., Brown, K. A., Carmack, E. C., Chierici, M., et al. (2020). Borealization of the Arctic Ocean in response to anomalous advection from sub-Arctic seas. Front. Mar. Sci. 7:491. doi: 10.3389/fmars.2020.00491
Polyakov, I. V., Pnyushkov, A. V., Alkire, M. B., Ashik, I. M., Baumann, T. M., Carmack, E. C., et al. (2017). Greater role for Atlantic inflows on sea-ice loss in the Eurasian Basin of the Arctic Ocean. Science 356, 285–291. doi: 10.1126/science.aai8204
Porter, M., Henley, S. F., Orkney, A., Bouman, H. A., Hwang, B., Dumont, E., et al. (2020). A polar surface eddy obscured by thermal stratification. Geophys. Res. Lett. 47:e2019GL086281. doi: 10.1029/2019gl086281
Porter, S. S., Eckert, G. L., Byron, C. J., and Fisher, J. L. (2008). Comparison of light traps and plankton tows for sampling brachyuran crab larvae in an Alaskan fjord. J. Crustac. Biol. 28, 175–179. doi: 10.1651/06-2818R.1
Powell, J. R., and Ohman, M. D. (2015). Changes in zooplankton habitat, behavior, and acoustic scattering characteristics across glider-resolved fronts in the Southern California Current System. Prog. Oceanogr. 134, 77–92. doi: 10.1016/j.pocean.2014.12.011
Presta, M. L., Capitanio, F. L., and Hoffmeyer, M. S. (2019). Spatio-temporal dynamics of mesozooplankton in the subantarctic Beagle Channel: the case of Ushuaia Bay (Argentina). Reg. Stud. Mar. Sci. 28:100546. doi: 10.1016/j.rsma.2019.100546
Rapinski, M., Cuerrier, A., Harris, C., Elders of Ivujivik, Elders of Kangiqsujuaq, and Lemire, M. (2018). Inuit perception of marine organisms: from folk classification to food harvest. J. Ethnobiol. 38, 333–355. doi: 10.2993/0278-0771-38.3.333
Renaud, P. E., Morata, N., Ambrose, W. G. Jr., Bowie, J. J., and Chiuchiolo, A. (2007a). Carbon cycling by seafloor communities on the eastern Beaufort Sea shelf. J. Exp. Mar. Biol. Ecol. 349, 248–260. doi: 10.1016/j.jembe.2007.05.021
Renaud, P. E., Riedel, A., Michel, C., Morata, N., Gosselin, M., Juul-Pedersen, T., et al. (2007b). Seasonal variation in benthic community oxygen demand: a response to an ice algal bloom in the Beaufort Sea, Canadian Arctic? J. Mar. Syst. 67, 1–12. doi: 10.1016/j.jmarsys.2006.07.006
Renaud, P. E., Sejr, M. K., Bluhm, B. A., Sirenko, B., and Ellingsen, I. H. (2015). The future of Arctic benthos: expansion, invasion, and biodiversity. Prog. Oceanogr. 139, 244–257. doi: 10.1016/j.pocean.2015.07.007
Renaud, P. E., Wallhead, P., Kotta, J., Włodarska-Kowalczuk, M., Bellerby, R. G. J., Rätsep, M., et al. (2019). Arctic sensitivity? Suitable habitat for benthic taxa is surprisingly robust to climate change. Front. Mar. Sci. 6:538. doi: 10.3389/fmars.2019.00538
Schlüter, M., and Rachor, E. (2001). Meroplankton distribution in the central Barents Sea in relation to local oceanographic patterns. Polar Biol. 24, 582–592. doi: 10.1007/s003000100255
Sewell, M. A., and Jury, J. A. (2011). Seasonal patterns in diversity and abundance of the high Antarctic meroplankton: plankton sampling using a Ross Sea desalination plant. Limnol. Oceanogr. 56, 1667–1681. doi: 10.4319/lo.2011.56.5.1667
Shanks, A. L. (2001). An Identification Guide to the Larval Marine Invertebrates of the Pacific Northwest. Corvallis: Oregon State University Press.
Shanks, A. L. (2009). Pelagic larval duration and dispersal distance revisited. Biol. Bull. 216, 373–385. doi: 10.1086/BBLv216n3p373
Shokralla, S., Porter, T. M., Gibson, J. F., Dobosz, R., Janzen, D. H., Hallwachs, W., et al. (2015). Massively parallel multiplex DNA sequencing for specimen identification using an Illumina MiSeq platform. Sci. Rep. 5:9687. doi: 10.1038/srep09687
Silberberger, M. J., Renaud, P. E., Espinasse, B., and Reiss, H. (2016). Spatial and temporal structure of the meroplankton community in a sub-Arctic shelf system. Mar. Ecol. Prog. Ser. 555, 79–93. doi: 10.3354/meps11818
Sirenko, B. I., Buzhinskaja, G. N., Andriashev, A. P., Balushkin, A. V., Neyelov, A. V., Markhaseva, E. L., et al. (2001). List of Species of Free-Living Invertebrates of Eurasian Arctic Seas and Adjacent Deep Waters. In: Exploration of the Fauna of the Seas. St. Petersburg: Russian Academy of Sciences Zoological Institute.
Slagstad, D., Ellingsen, I. H., and Wassmann, P. (2011). Evaluating primary and secondary production in an Arctic Ocean void of summer sea ice: an experimental simulation approach. Prog. Oceanogr. 90, 117–131. doi: 10.1016/j.pocean.2011.02.009
Stübner, E. I., Søreide, J. E., Reigstad, M., Marquardt, M., and Blachowiak-Samolyk, K. (2016). Year-round meroplankton dynamics in high-Arctic Svalbard. J. Plankton Res. 38, 522–536. doi: 10.1093/plankt/fbv124
Syvertsen, E. E. (1991). Ice algae in the Barents Sea: types of assemblages, origin, fate and role in the ice-edge phytoplankton bloom. Polar Res. 10, 277–288. doi: 10.1111/j.1751-8369.1991.tb00653.x
Trudnowska, E., Gluchowska, M., Beszczynska-Möller, A., Blachowiak-Samolyk, K., and Kwasniewski, S. (2016). Plankton patchiness in the Polar Front region of the west Spitsbergen Shelf. Mar. Ecol. Prog. Ser. 560, 1–18. doi: 10.3354/meps11925
Truett, G. E., Heeger, P., Mynatt, R. L., Truett, A. A., Walker, J. A., and Warman, M. L. (2000). Preparation of PCR-quality mouse genomic DNA with hot sodium hydroxide and Tris (HotSHOT). Biotechniques 29, 52–54. doi: 10.2144/00291bm09
Tyler, P. A., and Gage, J. D. (1982). Ophiopluteus ramosus, the larval form of Ophiocten gracilis (Echinodermata: Ophiuroidea). J. Mar. Biol. Assoc. UK 62, 485–486. doi: 10.1017/S002531540005743X
Vihtakari, M. (2020). ggOceanMaps: Plot Data on Oceanographic Maps using “ggplot2.”. Available online at: https://mikkovihtakari.github.io/ggOceanMaps. (accessed March 1, 2021).
Walczynska, K. S., Søreide, J. E., Weydmann-Zwolicka, A., Ronowicz, M., and Gabrielsen, T. M. (2019). DNA barcoding of Cirripedia larvae reveals new knowledge on their biology in Arctic coastal ecosystems. Hydrobiologia 837, 149–159. doi: 10.1007/s10750-019-3967-y
Wangensteen, O. S., Palacín, C., Guardiola, M., and Turon Corresp, X. (2018). Metabarcoding littoral hard-bottom communities: unexpected diversity and database gaps revealed by two molecular markers. PeerJ 6:e4705. doi: 10.7287/peerj.preprints.3429v1
Wassmann, P., Kosobokova, K. N., Slagstad, D., Drinkwater, K. F., Hopcroft, R. R., Moore, S. E., et al. (2015). The contiguous domains of Arctic Ocean advection: trails of life and death. Prog. Oceanogr. 139, 42–65. doi: 10.1016/j.pocean.2015.06.011
Wassmann, P., Ratkova, T., Andreassen, I., Vernet, M., Pedersen, G., and Rey, F. (1999). Spring bloom development in the marginal ice zone and the central Barents Sea. Mar. Ecol. 20, 321–346. doi: 10.1046/j.1439-0485.1999.2034081.x
Weigand, H., Beermann, A. J., Čiampor, F., Costa, F. O., Csabai, Z., Duarte, S., et al. (2019). DNA barcode reference libraries for the monitoring of aquatic biota in Europe: gap-analysis and recommendations for future work. Sci. Total Environ. 678, 499–524. doi: 10.1016/j.scitotenv.2019.04.247
Węsławski, J. M., Zajaczkowski, M., Kwaśniewski, S., Jezierski, J., and Moskal, W. (1988). Seasonality in an Arctic fjord ecosystem: Hornsund, Spitsbergen. Polar Res. 6, 185–189. doi: 10.3402/polar.v6i2.6861
Witte, U. (1996). Seasonal reproduction in deep-sea sponges-triggered by vertical particle flux? Mar. Biol. 124, 571–581. doi: 10.1007/BF00351038
Keywords: meroplankton, larvae, seasonality, DNA barcoding, Barents Sea, life history traits
Citation: Descôteaux R, Ershova E, Wangensteen OS, Præbel K, Renaud PE, Cottier F and Bluhm BA (2021) Meroplankton Diversity, Seasonality and Life-History Traits Across the Barents Sea Polar Front Revealed by High-Throughput DNA Barcoding. Front. Mar. Sci. 8:677732. doi: 10.3389/fmars.2021.677732
Received: 08 March 2021; Accepted: 03 May 2021;
Published: 28 May 2021.
Edited by:
Xavier Pochon, The University of Auckland, New ZealandReviewed by:
Haakon Hop, Norwegian Polar Institute, NorwayQuentin Mauvisseau, University of Oslo, Norway
Jose Maria Landeira, Instituto de Oceanografía y Cambio Global (IOCAG), Spain
Copyright © 2021 Descôteaux, Ershova, Wangensteen, Præbel, Renaud, Cottier and Bluhm. This is an open-access article distributed under the terms of the Creative Commons Attribution License (CC BY). The use, distribution or reproduction in other forums is permitted, provided the original author(s) and the copyright owner(s) are credited and that the original publication in this journal is cited, in accordance with accepted academic practice. No use, distribution or reproduction is permitted which does not comply with these terms.
*Correspondence: Raphaëlle Descôteaux, cmFwaGFlbGxlLmRlc2NvdGVhdXhAdWl0Lm5v