 Dini Adyasari
 Daniel Montiel
 Behzad Mortazavi
 Natasha Dimova
- 1Department of Geological Sciences, University of Alabama, Tuscaloosa, AL, United States
- 2Alabama Water Institute, University of Alabama, Tuscaloosa, AL, United States
- 3Geosyntec Consultants, Clearwater, FL, United States
- 4Department of Biological Sciences, University of Alabama, Tuscaloosa, AL, United States
- 5Center for Complex Hydrosystems Research, University of Alabama, Tuscaloosa, AL, United States
Quantifying and characterizing groundwater flow and discharge from barrier islands to coastal waters is crucial for assessing freshwater resources and contaminant transport to the ocean. In this study, we examined the groundwater hydrological response, discharge, and associated nutrient fluxes in Dauphin Island, a barrier island located in the northeastern Gulf of Mexico. We employed radon (222Rn) and radium (Ra) isotopes as tracers to evaluate the temporal and spatial variability of fresh and recirculated submarine groundwater discharge (SGD) in the nearshore waters. The results from a 40-day continuous 222Rn time series conducted during a rainy season suggest that the coastal area surrounding Dauphin Island was river-dominated in the days after storm events. Groundwater response was detected about 1 week after the precipitation and peak river discharge. During the period when SGD was a factor in the nutrient budget of the coastal area, the total SGD rates were as high as 1.36 m day–1, or almost three times higher than detected fluxes during the river-dominated period. We found from a three-endmember Ra mixing model that most of the SGD from the barrier island was composed of fresh groundwater. SGD was driven by marine and terrestrial forces, and focused on the southeastern part of the island. We observed spatial variability of nutrients in the subterranean estuary across this part of the island. Reduced nitrogen (i.e., NH4+ and dissolved organic nitrogen) fluxes dominated the eastern shore with average rates of 4.88 and 5.20 mmol m–2 day–1, respectively. In contrast, NO3– was prevalent along the south-central shore, which has significant tourism developments. The contrasting nutrient dynamics resulted in N- and P-limited coastal water in the different parts of the island. This study emphasizes the importance of understanding groundwater flow and dynamics in barrier islands, particularly those urbanized, prone to storm events, or located near large estuaries.
Introduction
Barrier islands are some of the most dynamic coastal zone environments due to their exposed position at the land–sea interface (Leatherman and Beller-Simms, 1997). They are highly vulnerable to storm events and contaminations, yet particularly desirable areas for tourism development (Wang and Roberts Briggs, 2015). The coastal geomorphology of barrier islands is shaped by waves, tides, currents, and its geology primarily consisting of highly permeable sand deposits. These sandy aquifers typically have a limited potential to capture surface freshwater; thus, rainfall infiltrates quickly to recharge the aquifer system and forms a freshwater lens. The size of freshwater lenses depends on the island’s geology, elevation, vegetation composition and density, groundwater recharge and discharge, and climatic events (Schneider and Kruse, 2006). Changes in precipitation patterns and sea-level rise due to climate change may reduce the extent of freshwater lenses in barrier islands by decreasing freshwater recharge and increasing their salinity (Leatherman and Beller-Simms, 1997). In addition, barrier islands throughout the United States are experiencing a population increase, raising serious concerns on the sustainability of freshwater resources. Human activities have increased the water demand, reduced recharge of aquifer systems due to groundwater abstraction, and decreased groundwater quality due to land-use changes (Board et al., 2018).
Previous studies on barrier islands focus on the impact of seawater intrusion on their coastal aquifers (Masterson et al., 2014; Manda et al., 2015), coastal groundwater characteristics and flow (Corbett et al., 2000; Röper et al., 2012; Hofmann et al., 2020), biogeochemical processes in the groundwater–surface water interface (Bratton et al., 2009; Schutte et al., 2016; Seibert et al., 2019), and submarine groundwater discharge (SGD) at the coastal area (Bokuniewicz and Pavlik, 1990; Rapaglia et al., 2010; Evans and Wilson, 2017). In these studies, SGD is defined as any and all water flow on continental margins from the seabed to the coastal ocean, regardless of fluid composition or driving force (Burnett et al., 2003). SGD comprises meteoric or fresh groundwater and seawater that has infiltrated coastal aquifers (Moore, 2010). SGD is driven by terrestrial hydraulic gradients, seasonal changes in the aquifer level on land, wave setup, and tidal pumping (Santos et al., 2012); some of these factors also apply to the coastal dynamics of barrier islands.
Naturally occurring radioisotopes, such as radium (Ra) and radon (Rn) isotopes, are often employed as tracers to evaluate SGD in a wide range of coastal environments. The advantage of using Ra-Rn radioisotopes is that their concentration is elevated in groundwater compared to surface water, creating a large surplus in surface waters in discharge areas (Moore, 1996; Burnett and Dulaiova, 2003). For instance, Ra isotopes are used to evaluate brackish or recirculated SGD (RSGD) input to coastal waters because Ra isotopes are largely particle bound in freshwater but desorb from particles in contact with saline water (Moore, 2003). Meanwhile, 222Rn is associated with total groundwater discharge (fresh groundwater and recirculated seawater) (Burnett and Dulaiova, 2003). In addition, SGD is found to transport significant loads of solutes into coastal oceans, including nutrients (Slomp and Van Cappellen, 2004), trace metals (Rodellas et al., 2014), and organic matter (Kim and Kim, 2017).
Previous studies investigating groundwater hydrodynamics in barrier islands are primarily focused on Spiekeroog Island of Germany (summary in Beck and Brumsack, 2012) or the east coast of the United States (e.g., Bratton et al., 2009; Schutte et al., 2016; Corbett et al., 2000). The Gulf of Mexico is especially vulnerable to climate change impacts, particularly related to its coastal water quality (Justiæ et al., 1996; Laurent et al., 2018). Increasing risks of climate change caused by sea-level rise, storm intensification, and precipitation variability may adversely affect hydrologic and biogeochemical cycling in barrier islands of this region (Anderson and Emanuel, 2010). To obtain insights into the groundwater–surface water dynamics on a barrier island in the northern Gulf of Mexico, we studied the groundwater hydrological response (or SGD) and associated nutrient fluxes in Dauphin Island, part of the Alabama–Louisiana barrier island chain. Understanding the mechanisms and dynamics of groundwater flow and SGD within this Island can help establish responsible urban development and water resources management plans in other barrier islands worldwide.
The objectives of this study are to (1) examine the hydrological response of groundwater in small barrier islands to storm events, (2) assess and characterize groundwater discharge in the coastal area, and (3) analyze water quality with implications of nutrient transport from land to the ocean/Gulf of Mexico via SGD in this type of geological setting.
Materials and Methods
Study Site
Dauphin Island is a 26-km-long barrier island located about 6.5 km off the coast of Mobile County, Alabama, in the northeastern Gulf of Mexico (Figure 1A). The Island is characterized by a warm, humid subtropical climate influenced by the Gulf of Mexico. Long term National Oceanic and Atmospheric Administration (NOAA) precipitation records from a monitoring station deployed at Dauphin Island1 show an average annual rainfall of 1,320 and 1,266 mm for 2014 and 2016, respectively (Supplementary Figure 1; NOAA, 2021). The Island has diverse ecosystems, including sandy beaches, dunes, maritime forests, freshwater ponds, and intertidal wetlands, which have been shaped throughout history due to longshore drifts and hurricanes (Enwright et al., 2017). Dauphin Island has a resident population of about 1,238 (United States Census Bureau, 2018) and consists mainly of a residential community with small commercial development. However, the population during the peak tourist summer season grows by a factor of five or six (Black, 2019).
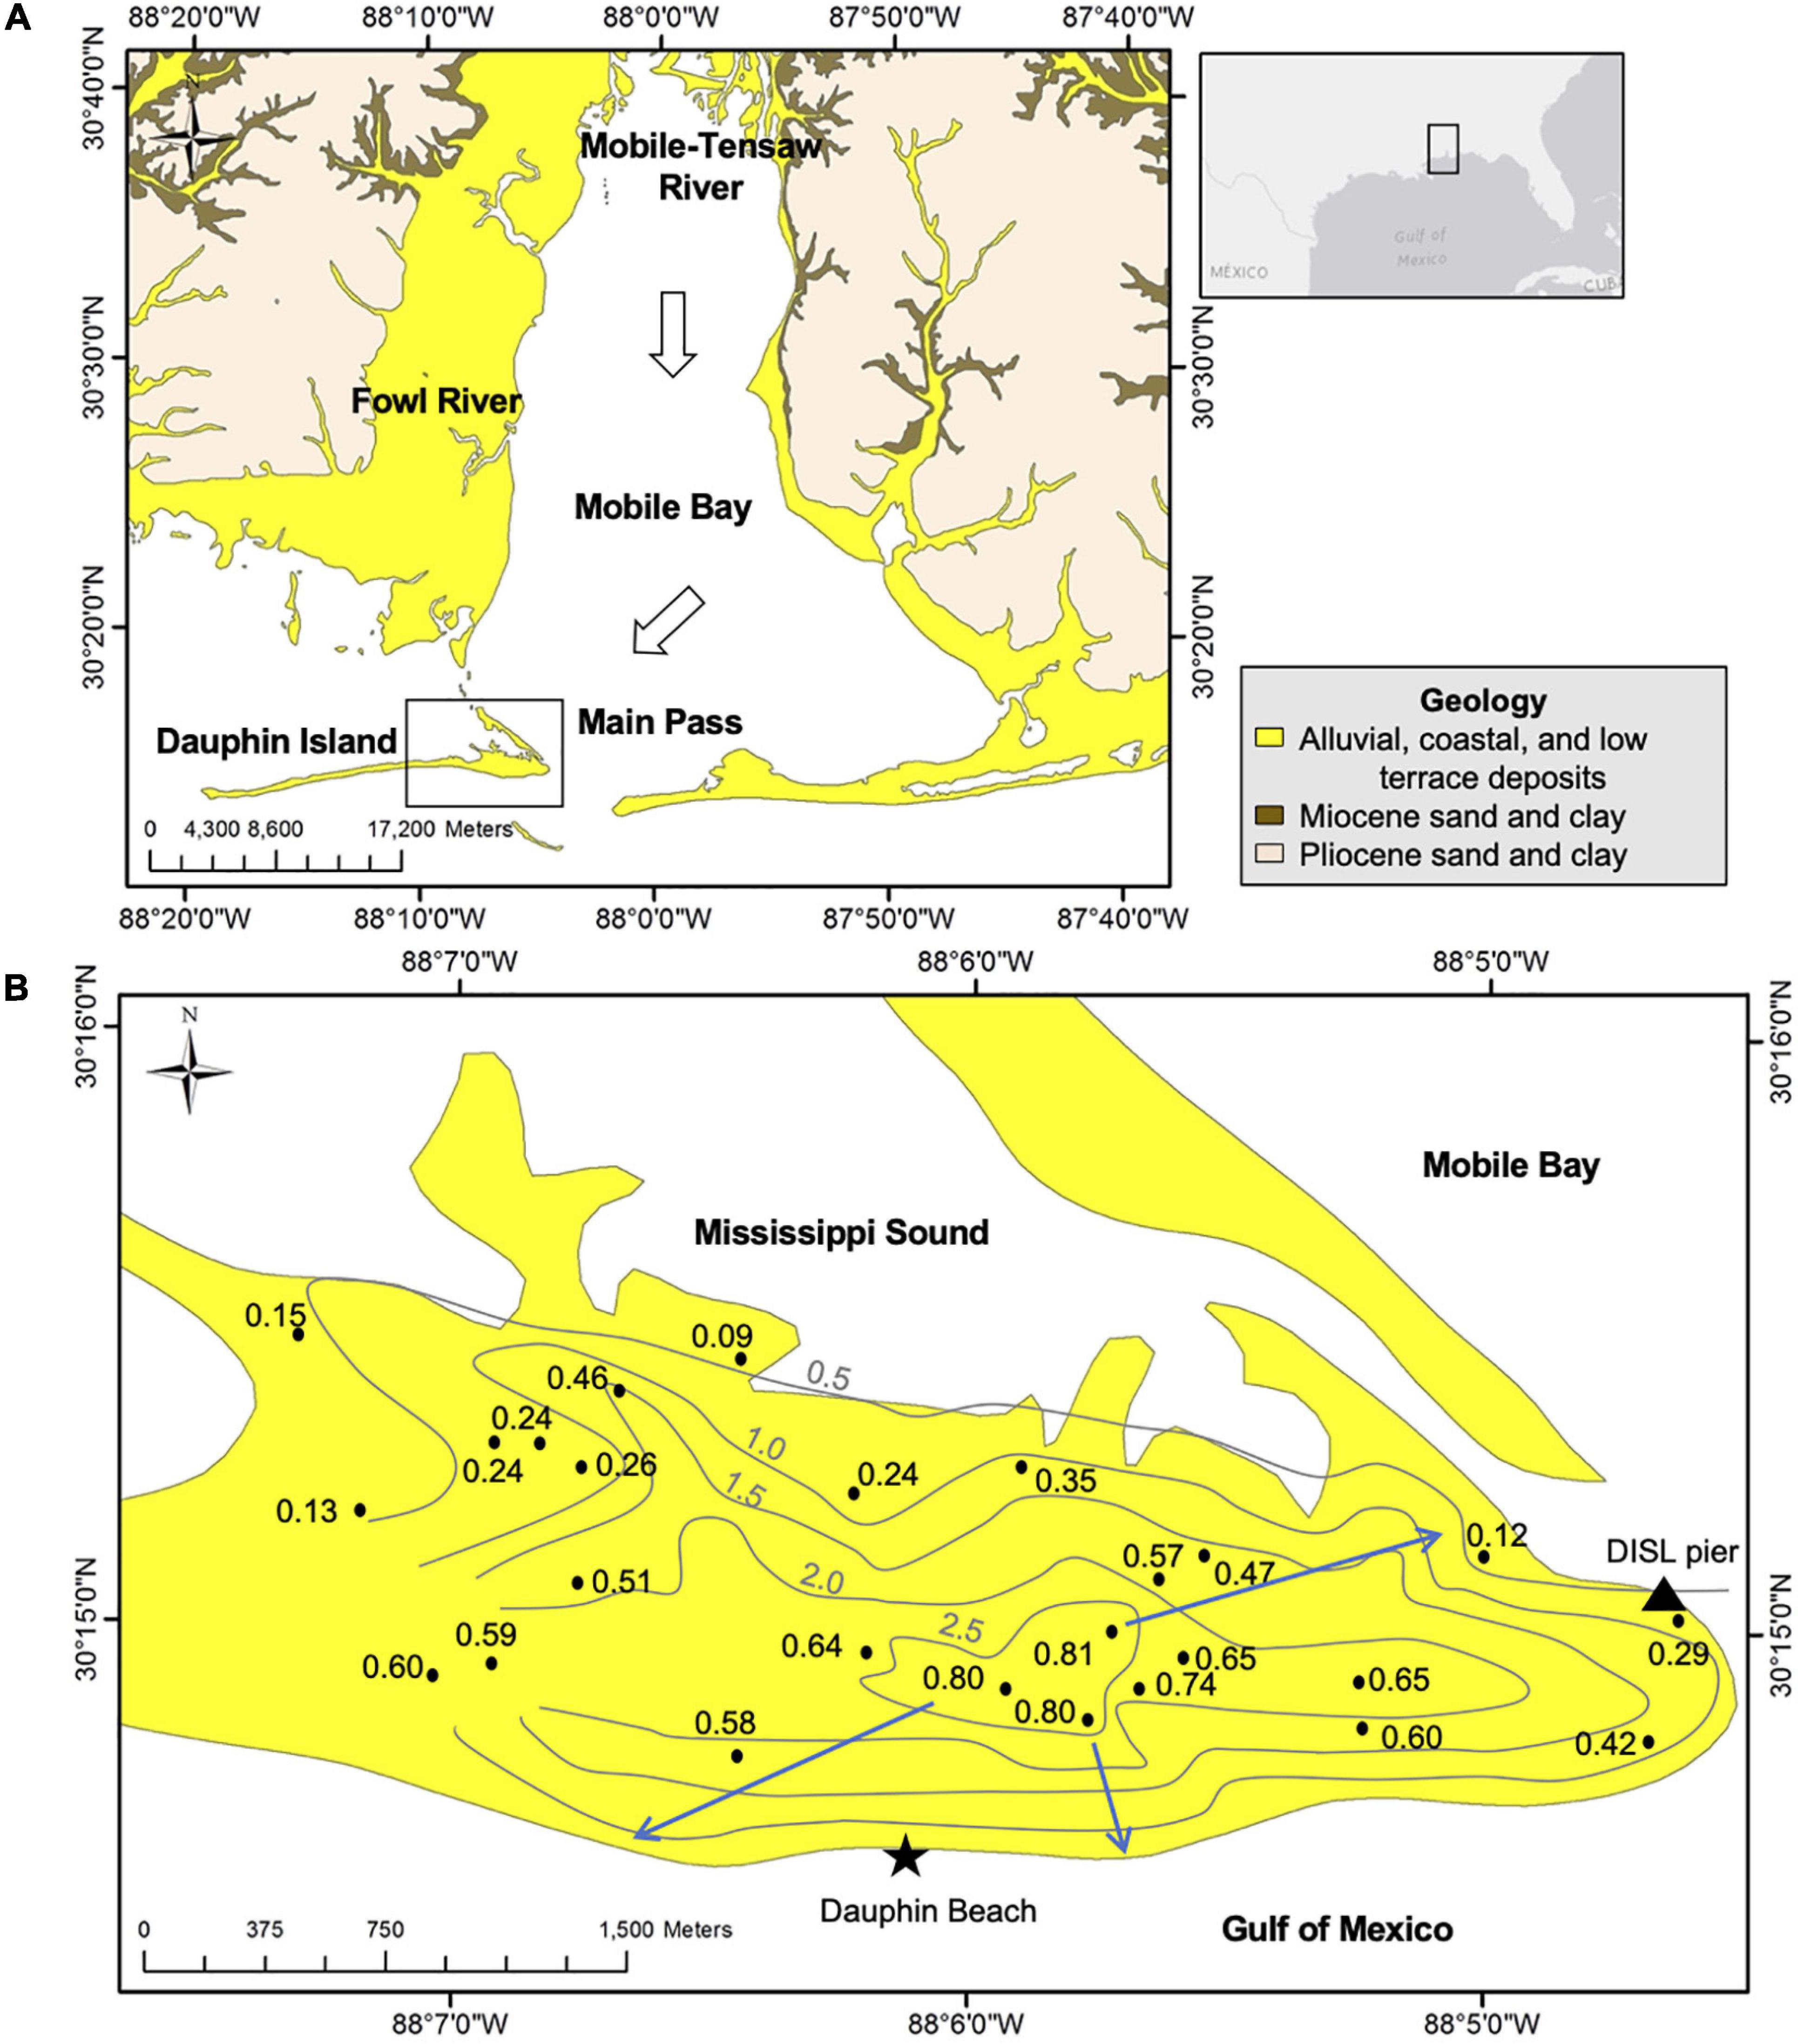
Figure 1. Dauphin Island is a barrier island located in the northeastern Gulf of Mexico. The arrow in Mobile Bay represents the direction of Mobile-Tensaw River discharge (A). 222Rn and nutrient temporal measurements were conducted from Dauphin Island Sea Laboratory (DISL) station pier in 2014 (triangle point, B). Groundwater sample was also collected from Dauphin Beach in 2016, next to a golf field (star point, B). Groundwater water table altitude and contour line (in meters) is modified from Kidd (1988). The geological map is from the Geological Survey of Alabama (2020). Groundwater flow is depicted by blue line in (B).
The population of Dauphin Island receives its freshwater source from two aquifer formations of Holocene to Pleistocene age: (1) the water-table aquifer and (2) the shallow sandy aquifer (Chang Sun et al., 2016). The uppermost water-bearing unit is the water-table aquifer and consists of a thin veneer of Holocene sand and the underlying Pleistocene Gulfport Formation (Luttrell et al., 1991). The surficial Holocene sand is fine- to medium-grained quartz and quartzite and is from 0.3- to 1.5-m thick over most of eastern Dauphin Island (Kidd, 1988). The same report by Kidd (1988) states that the sand grades into the sand, silt, and clay unit in the Mississippi Sound, north of Dauphin Island. Meanwhile, the Gulfport Formation is 9-m thick and consists of well- to moderately sorted, medium- to very fine-grained quartz sand. The water-table aquifer has a hydraulic conductivity of 13 to 17 m day–1 and is underlain by a 6-m-thick confining clay layer, which separates the water-table aquifer from the shallow sand aquifer. In this paper, we assume that SGD originates from the water-table aquifer, as this aquifer layer responds immediately to groundwater recharge and discharge based on previous modeling studies (Chang Sun et al., 2016; Bedekar et al., 2019). Even with the availability of freshwater sources, Chang Sun et al. (2016) predicted that the water-table aquifer in Dauphin Island might not sustain any significant future population growth, especially under adverse climate change conditions.
Sampling Strategy and Analyses
Temporal Groundwater Discharge Variability
Measurements of the temporal variations of radon (222Rn, i.e., total groundwater discharge) were conducted as time series between May 19 and June 28, 2014, which coincided with the local summer storm season. Coastal water was sampled at the DISL station’s pier, located on the Island’s eastern side (30°15.075′N and 88°04.670′W, Figure 1B). 222Rn in coastal water was measured continuously in 30-min intervals for 40 days using a Durridge RAD7 with the Radon-in-Water RAD Aqua accessories (Durridge, 2015). Coastal water samples were pumped from about 30 cm below the surface water level at a rate of 2.5 L min–1. Water level, salinity, dissolved oxygen (DO), and wind speed were obtained from the DISL monitoring station2. Precipitation data during this period were collected from the NOAA monitoring station in Dauphin Island (NOAA, 2021). To compare groundwater and river hydrological responses, we used the river discharge record of the Fowl River in Mobile County3. This gauge [United States Geological Survey (USGS) gauge number 02471078] is the closest stream gauge to Dauphin Island and is located in an area with precipitation patterns similar to the Island.
In addition, groundwater and coastal water grab samples were collected in a 2-h interval for 24 h on May 27 and 28, 2014, respectively. The samples were analyzed for nutrients [nitrate (NO3–), nitrite (NO2–), ammonium (NH4+), phosphate (PO43–), and dissolved organic nitrogen (DON)]. Groundwater samples for nutrient and Ra analyses were collected from a piezometer installed at the tide line near the DISL pier at a depth of ∼1.5 m. Coastal water samples for the 24-h sampling period were collected next to the RAD7 intake, i.e., 30 cm below the surface water level. 222Rn data for further analyses were only collected from coastal water and not from groundwater because the high levels of H2S in groundwater deteriorated the 222Rn measurements by skewing the RAD7 readings (Lane-Smith, 2014).
Spatial Groundwater Discharge Variability
To identify preferential groundwater pathways along the southern (ocean) side of Dauphin Island, boat surveys screening continuously for 222Rn anomalies in coastal waters were conducted on June 26, 2014 and June 13, 2016. The first coastal spatial survey began from the easternmost part toward the westernmost tip of the Island at a speed of < 5 km h–1 to allow for 222Rn equilibration (Dimova et al., 2009). 222Rn in coastal surface water was measured in 10 minutes intervals at approximately 250 m from the high tide line at a water depth up to 2.3 m. During the survey, coastal water grab samples were also collected for nutrients (NO3–, NO2–, NH4+, PO43–, and DON) at five locations along the route. Because measurements from the 2014 survey revealed higher 222Rn concentrations on the eastern end of the Island, the focus of the second boat survey conducted in the summer of 2016 was on that part of Dauphin Island. During the 2016 spatial survey, one groundwater grab sample was collected in Dauphin Beach from a piezometer from a depth of about 0.5–1 m. This sample was later analyzed for NO3–, NO2–, NH4+, PO43–, and DON concentration.
222Rn-Based SGD Assessments
Total SGD fluxes based on 222Rn data were calculated using a modification of single-box Rn mass balance model described in Burnett and Dulaiova (2003) to account for potential 222Rn flux from river inputs. Based on this model, SGD is determined by changes in the 222Rn inventories after it was normalized by changes in water depth over tidal cycles (Ftide), atmospheric loss (Fatm), and mixing with offshore waters (Fmix). To adapt this model to Dauphin Island’s coastal settings, 222Rn inventories in coastal water are subtracted with incoming 222Rn inventories entering the study site via the Main Pass (Supplementary Figure 2). 222Rn-based SGD fluxes (dpm m–2 day–1) are normalized into meters-per-day units by dividing by the 222Rn concentration in the groundwater endmember (dpm m–3). Data for 222Rn groundwater endmember concentrations were taken from Ellis (2013). It is an average of 32 measurements of radon concentrations in groundwater wells in the vicinity of the Baldwin County area, which is located 26 km from Dauphin Island and has similar geological settings (Figure 1A).
Ra-Based SGD Assessments
To measure Ra concentrations in water, 120 L of coastal water samples was collected and passed through MnO2-coated acrylic fiber. 226Ra concentrations were measured using the method described in Geibert et al. (2013). 223Ra and 224Ra activities were measured using a delayed coincidence counter (RaDeCC) (Moore and Arnold, 1996). The fibers were analyzed twice: immediately after collection and approximately 4 weeks after collection to assess 228Th and correct for supported 224Ra. We used Ra concentrations in six samples for Ra-based SGD assessments: one sample from our field work and five samples from Montiel et al. (2019a).
In this study, we initially calculated RSGD fluxes using both the short-lived Ra isotopes (223Ra and 224Ra), using an approach described by Paytan et al. (2006), and the long-lived 226Ra following an approach described by Hwang et al. (2010). We found that the difference between the two approaches was significant, i.e., between 40 and 60%. Based on recent studies by Tamborski et al. (2020), the short-lived isotopes tend to overestimate RSGD due to their significant regeneration from sediments in the overlaying water column, while the evaluations based on long-lived isotope are sensitive to water exchange across large scale boundaries, which was difficult to determine for our study site.
Therefore, a qualitative assessment using a three-endmember mixing model was used to examine the contribution of recirculated seawater to total SGD and delineate the contribution of each endmember. The mixing model was based on the activities of the longer-lived Ra isotopes (i.e., 223Ra and 226Ra) on three different endmembers: (1) the mixture of Mobile-Tensaw River and Mobile Bay waters that goes to the Main Pass, (2) the recirculated SGD in the Dauphin Island’s water-table aquifer resulting from tidal pumping, and (3) the offshore water (i.e., Gulf of Mexico water) (e.g., Montiel et al., 2019a). We employed the following three equations (Eqs. 1, 2, and 3) to solve for the three unknown variables of the mix between river and Mobile Bay mix fraction (fMB), recirculated SGD fraction (fRSGD), and offshore water fraction (fOW):
where RaDI, RaRSGD, RaOW, and RaMB are Ra concentrations (dpm m–3). RaMB is the average surface water Ra concentration in the Main Pass obtained from Montiel et al. (2019a). RaRSGD is the average groundwater Ra concentration from our field sampling and Montiel et al. (2019a). RaOW is Ra concentration with the highest salinity from the 24-h time series taken during the high tide. RaDI is the Ra concentration during the 24-h measurement at DISL pier. λ223 and λ226 are the decay constants of 223Ra (0.06 day–1) and 226Ra (1.18 × 10⁻⁶ day–1), and τ is the apparent age/residence time of Dauphin Island coastal water (days). The residence time (or apparent Ra age) was estimated by the difference in 224Ra/223Ra activity ratio (AR) between surface and groundwater (Moore, 2000).
Nutrient Analyses
Coastal and groundwater samples were filtered in the field through sterile 0.45-μm cellulose acetate filters and stored in acid-cleaned 50-ml polypropylene vials for further nutrient analyses. Samples were kept on ice for a maximum of 6 h until they were frozen pending analyses. The analyses for NO3–, NO2–, NH4+, PO43–, and DON were performed at the DISL Analytical facility using a Skalar San++ segmented flow autoanalyzer with automatic in-line sample digestion (Skalar Analytical B.V). Dissolved inorganic nitrogen (DIN) was assessed as a total of NO3–, NO2–, and NH4+. All SGD-derived nutrient fluxes to coastal areas of Dauphin Island were measured by multiplying the average nutrient concentration in coastal groundwater by the average calculated SGD rates.
Statistical Analyses
Variance among endmembers (groundwater and surface water) was evaluated using unpaired two-samples Wilcoxon test after all parameters did not meet null hypotheses of Shapiro test (normality) and F-test (homogeneity). Statistical significance was determined using a 95% CI (p < 0.05). Statistical analyses and figure visualizations were conducted using R version 4.0.3 (R Core Team, 2020).
Results
Groundwater Discharge to Nearshore Areas of Dauphin Island
The concentrations of groundwater and coastal water 222Rn, 223Ra, 224Ra, and 226Ra are presented in Table 1. 222Rn in groundwater (average 73,000 dpm m–3) was 50 times higher than in surface water (average 1,475 dpm m–3). The average 226Ra concentrations in groundwater and surface waters were 550 and 70 dpm m–3, respectively, with uncertainties below 0.1%. The results for short-lived Ra isotopes showed average Ra in the shallow groundwater of 30 dpm m–3 and 482 for 223Ra and 224Ra, respectively, with an uncertainty of 0.1%. These average concentrations were up to 1.7 and 2.7 times higher for 223Ra and 224Ra, respectively, than in coastal surface water samples. The apparent Ra age or residence time of Dauphin Island coastal water was 2.8 days at the DISL pier. Statistical analyses confirmed that Ra and Rn activities between different sample groups (groundwater and surface water) were significantly different (p < 0.05).
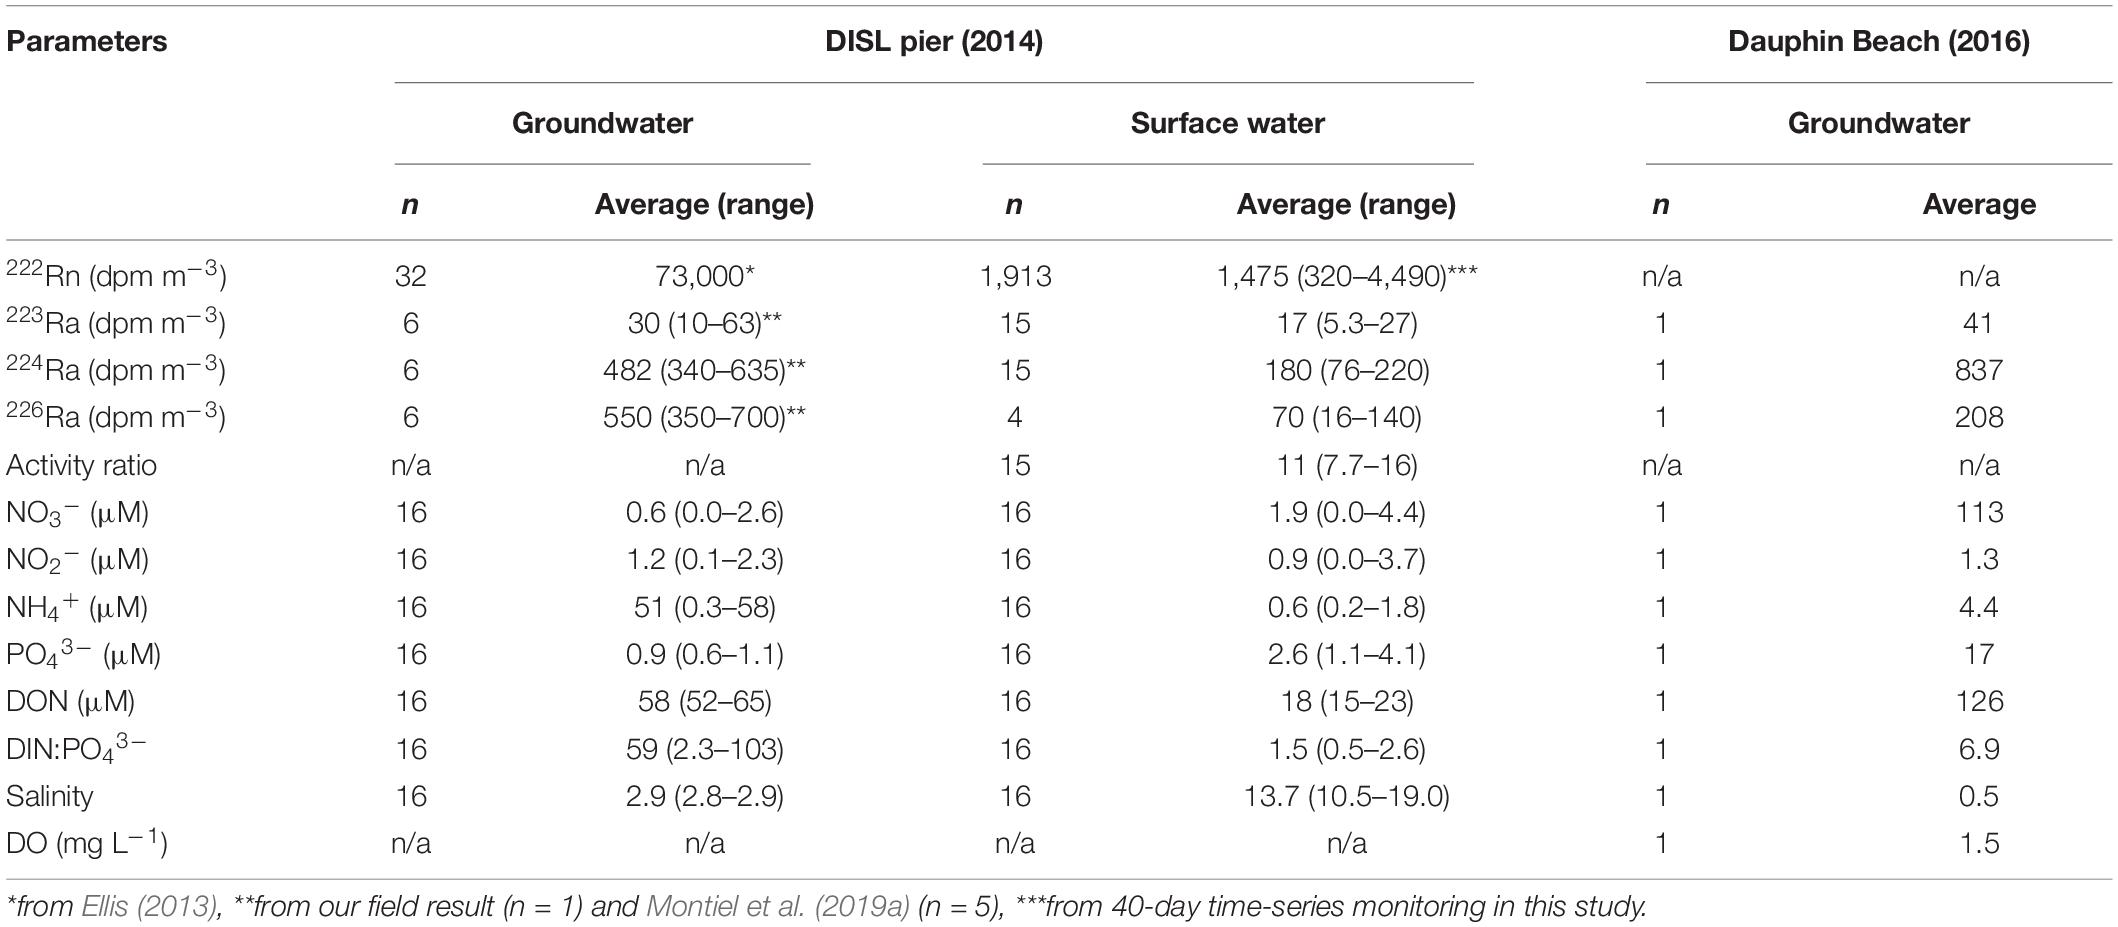
Table 1. Composition of groundwater and surface water during a 24-h time series on DISL pier (2014) and grab sample on Dauphin Beach (2016).
During the 40-day time series, the calculated SGD rates derived from the 222Rn mass-balance approach were in the range of 0 and 1.36 m day–1 with an average of 0.09 m day–1 (Table 2). If we were to use the minimum (40,000 dpm m–3) and maximum (80,000 dpm m–3) surficial groundwater endmember concentration as measured by Ellis (2013), the SGD fluxes would be in the range between 0.08 and 0.16 m day–1, or approximately two times variation difference. To estimate the total SGD export from the Island to the Gulf of Mexico, we multiply this result by the length of the southern part of Dauphin Island (excluding the tail part, 13 km). This calculation results in a total SGD estimation to the Gulf of Mexico of 1,132 m2 day–1 on average.
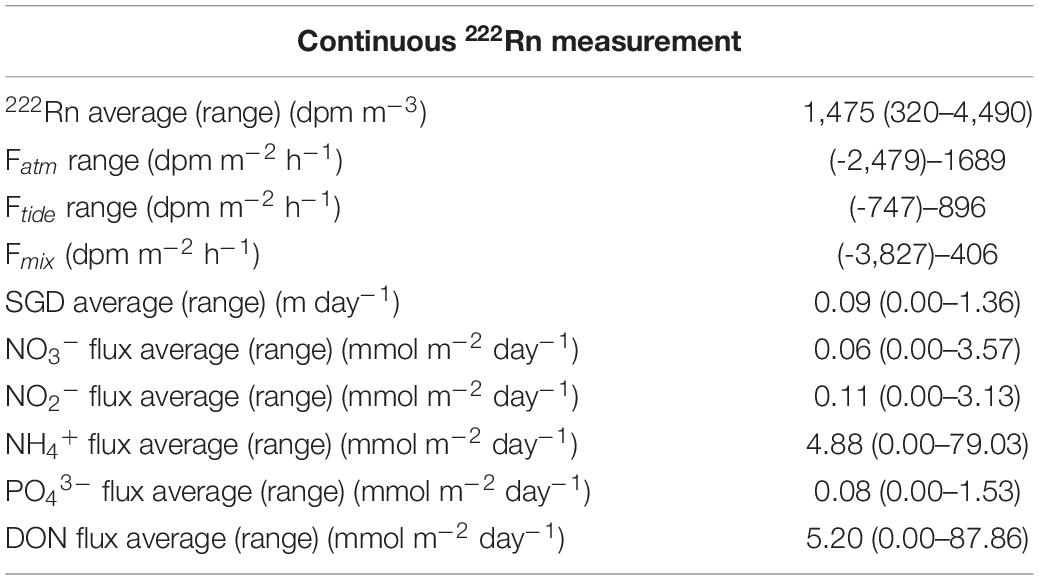
Table 2. 222Rn-based SGD and nutrient flux estimations.
The three-endmember Ra mixing model result confirmed that Dauphin Island’s brackish coastal waters were dominated by Mobile Bay fraction during the low tide of our sampling session, while offshore water from the Gulf of Mexico was prevalent during the high tide (Table 3). Recirculated SGD only contributed from negligible to small fraction during low tide (1%). In fact, we calculated a negative RSGD fraction during high tide. This finding also indicates that SGD discharging to nearshore water of Dauphin Island was primarily fresh groundwater.
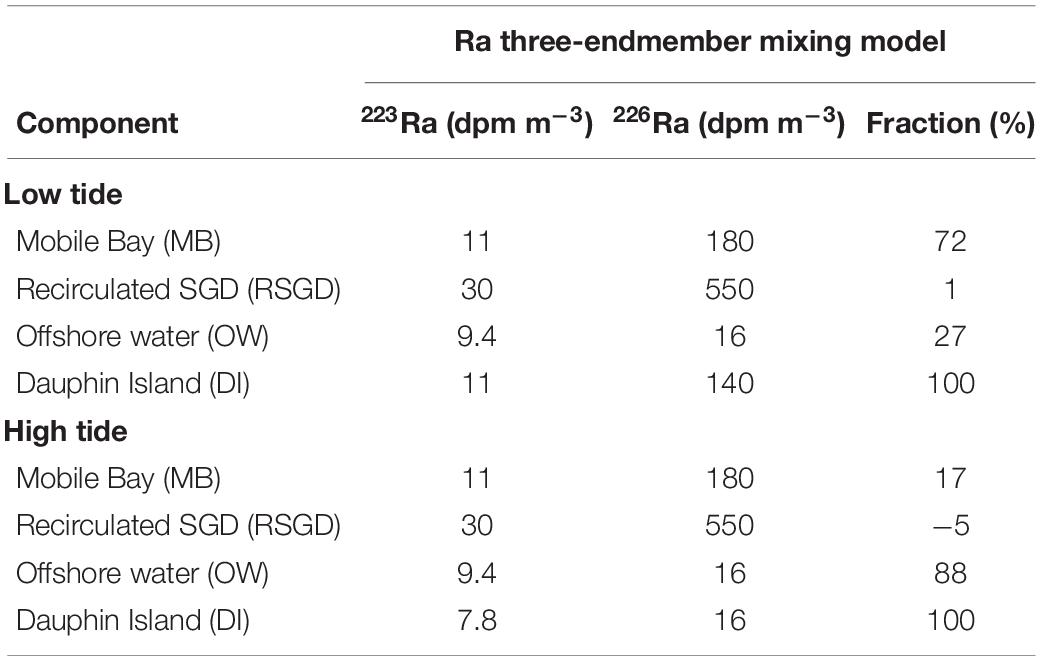
Table 3. Contributions of each endmember to Dauphin Island coastal water based on three-endmember Ra mixing model.
Spatial distributions of 222Rn during the coastal surveys revealed large differences along the Island’s coastline, where the southeastern part had higher tracer inventories compared with the other parts of the Island, suggesting higher SGD rates (Figure 2). For instance, 222Rn was 3.5 times higher in nearshore waters in this part of the Island than the southwestern part during the 2014 survey. Furthermore, the spatial surveys in both 2014 and 2016 revealed a similar range of 222Rn in these coastal waters, i.e., between 0 and 420 dpm m–3. This finding strongly suggests preferential groundwater pathways into the southeastern Dauphin Island independent of time.
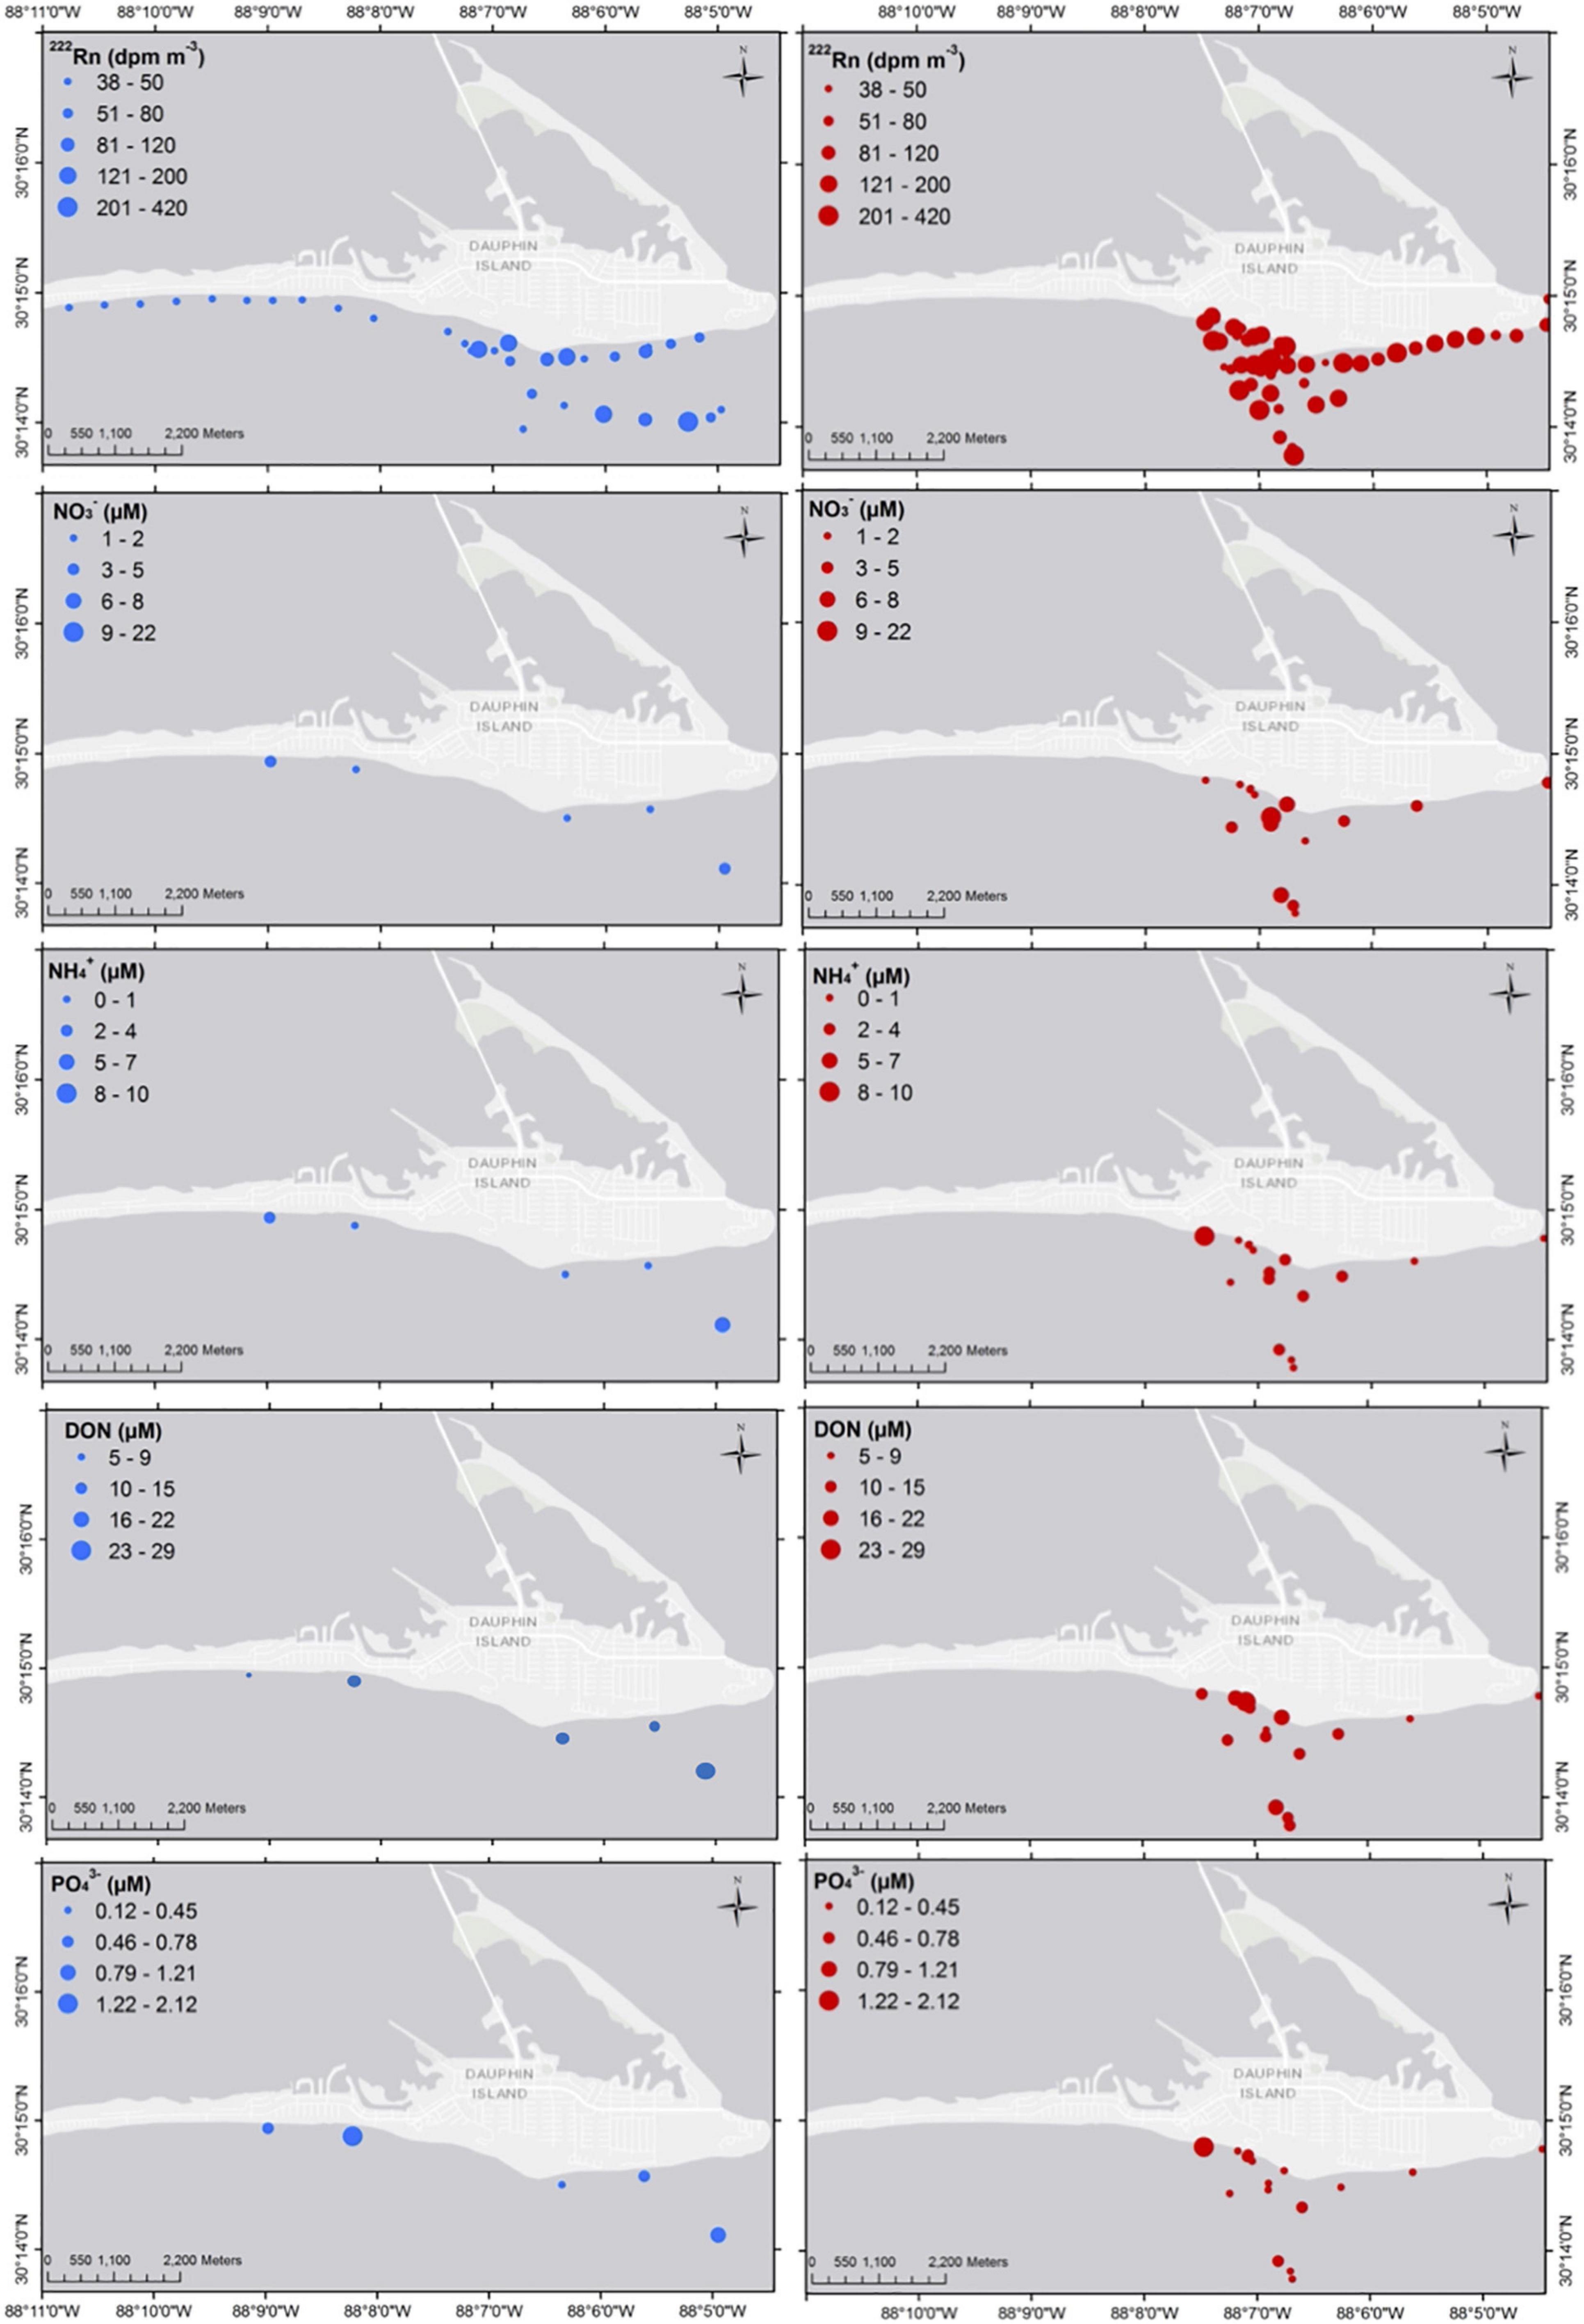
Figure 2. Spatial distribution of 222Rn and nutrients in coastal waters along the ocean side of Dauphin Island in 2014 (left) and 2016 (right).
Hydrological Response to Storm Events
The hydrometeorological parameters depicting the coastal hydrodynamic conditions in the study area between May 19 and June 28, 2014 are illustrated in Figure 3, while the measurement results in 30 minutes intervals are presented in Supplementary Table. The frequency of each parameter is shown in Supplementary Figure 3, while Supplementary Figure 4 displays scatter plots of each of the independent variables (e.g., wind speed, salinity, DO, and water level) on the x-axes and the dependent variable (i.e., 222Rn concentrations) on the y-axes in different stages of the monitoring period. According to the NOAA monitoring station records, the Island received more than 242 mm of rain over the course of the study. The USGS records indicate that the Fowl River discharge to Mobile Bay during this study varied between 0.7 and 13 m3 s–1. We identified two storm events during this period, one on May 29 and another on June 11, 2014. High wind speeds, as high as 15 m s–1, were associated with heavy precipitation up to 56 mm per day throughout these events. To evaluate the effect of these summer storms on the river and groundwater hydrodynamics of the area, we analyzed the hydrometeorological conditions prior, during, and after the storms. The described parameters, i.e., precipitation, wind speed, water level, salinity, DO, river discharge, and 222Rn/SGD, were compared with base flow conditions.
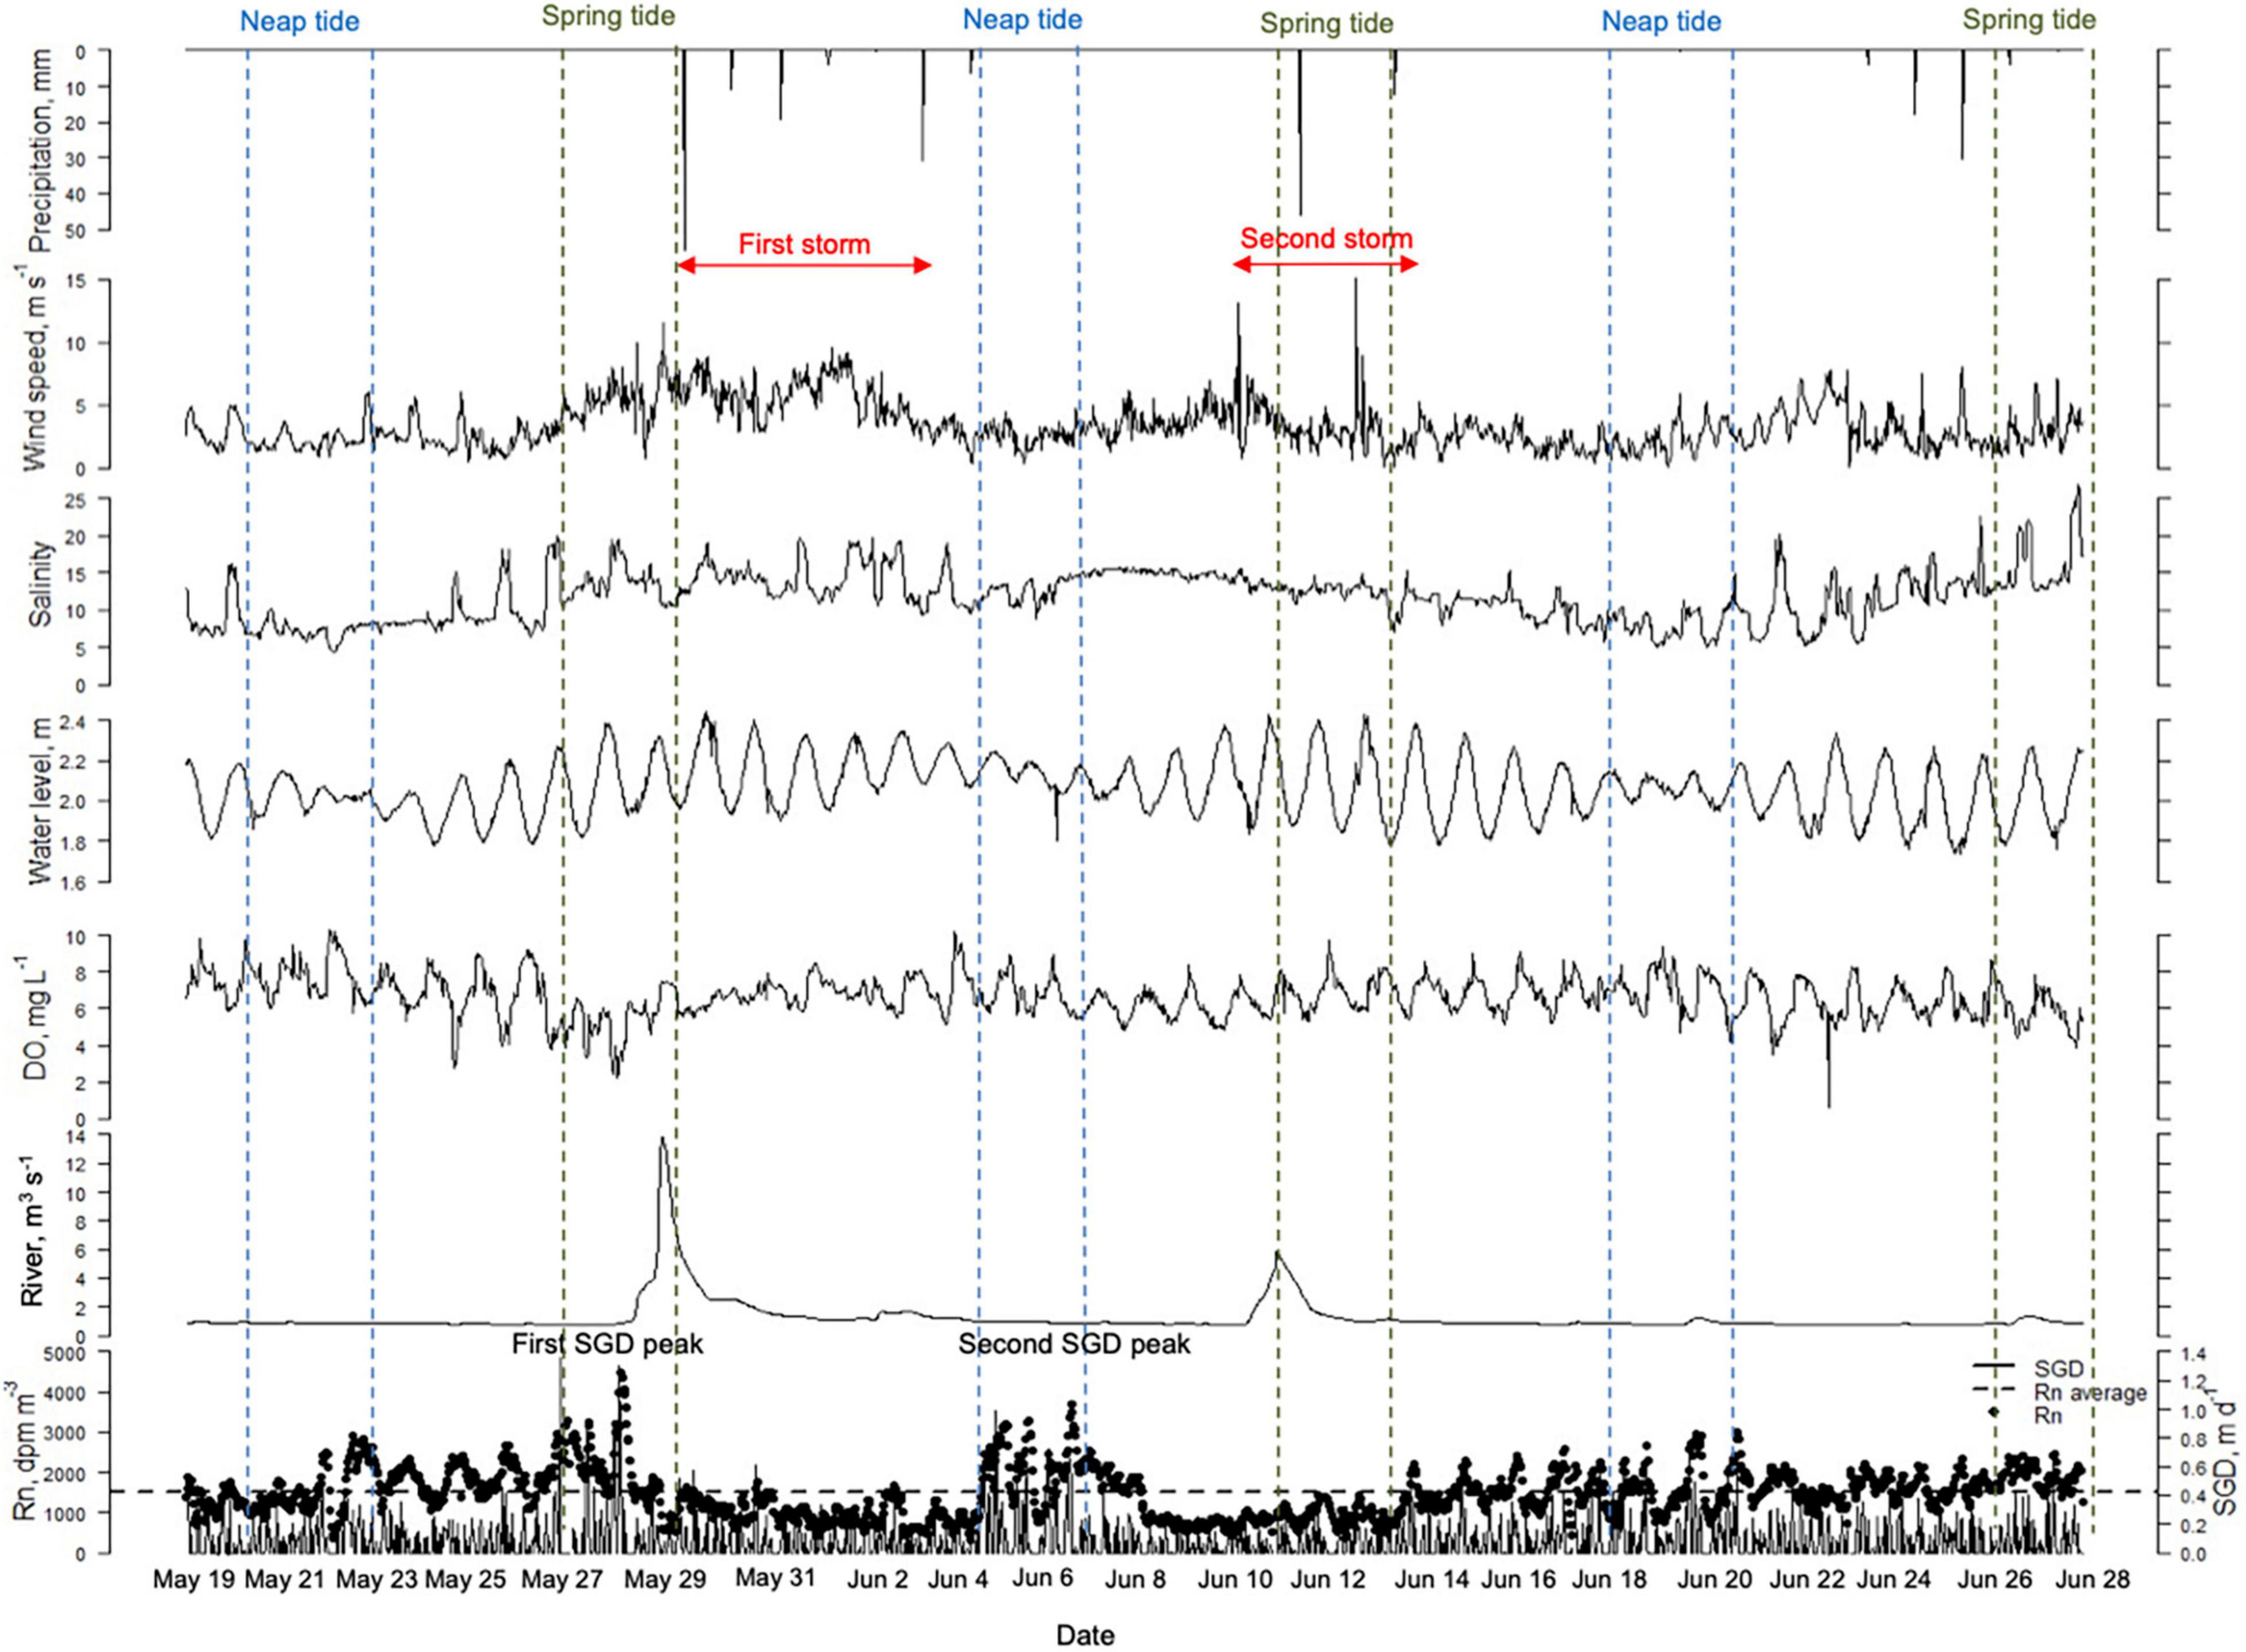
Figure 3. Hydrometeorological dynamics in Dauphin Island coastal site during the rainy season (May 19–June 28, 2014).
(1) Before the first storm (May 19–May 26, 2014). During the 10 days period before the first storm, the wind speed averaged 2.4 m s–1. Salinity varied between 4 and 18 with an average of 8.4. The coastal surface water was well oxygenated during most of the monitoring period with a DO concentration between 2.8 and 10.3 mg L–1. The water level oscillated between 1.7 and 2.2 m. The fluctuation of water level showed a clear diurnal tidal cycle with no significant tidal discursion. The 222Rn daily fluctuations were around 1,614 ± 509 dpm m–3. SGD fluctuated between 0 and 0.5 m day–1 with an average of 0.08 m day–1.
(2) First SGD peak (May 27–28, 2014). The first positive 222Rn anomaly occurred on May 27, which coincided with the spring tide and low DO concentration (i.e., 2.2 mg L–1). The latest rain event before the first SGD peak was on May 15 (Figure 4), which suggests 12 days of groundwater residence time in the Island’s water-table aquifer, assuming that the groundwater table responded to the previous rain event on May 15. During this high SGD period, we detected groundwater discharge as high as 1.36 m day–1 or almost three times higher than the average level during normal conditions. The period only lasted for 2 days before 222Rn activities decreased abruptly to a below-average level.
(3) First storm (May 29–June 4, 2014). The first storm event during our monitoring period lasted approximately 7 days with a total of 127 mm of precipitation and a maximum wind speed of 12 m s–1 (Figure 3). The DO and salinity patterns during this event were distorted, most likely because of extensive mixing during the storm. The river discharge peaked immediately on the first day of the storm (May 29), and minor pulses in river discharge occurred on the following days in response to the smaller precipitation events after the initial rainfall, which was the heaviest (Figures 3, 4). River discharge returned to base flow on June 4, on the last day of this precipitation event. During the 7-day storm event, we observed a sharp decrease of the 222Rn concentration in coastal waters with values that rarely exceeded the average regardless of the tide stage. During this period, SGD was in the range of 0–0.6 m day–1, similar to the pre-storm discharge.
(4) Second SGD peak and post-discharge/first storm aftermath (June 5–June 8, 2014). 222Rn activities in coastal water began to recover as soon as the first storm passed. During the same time, SGD rates increased responding to the large recharge event. The second SGD peak occurred approximately 7 days after the first storm day (May 29). The second peak occurred during neap tide with SGD rates up to 1 m day–1, which was smaller than the first peak but still twice higher than normal. Our observations showed that it took 3 days for the SGD to go back to base flow conditions (Figure 4). Salinity changes after the first storm were smoother and spanned over a narrow range, most likely reflecting the continuous fresh groundwater seepage (Figure 3 and Supplementary Figure 4). Furthermore, 222Rn activities and SGD rates decreased significantly, even lower than the base flow, on June 9, indicating that all storm-driven groundwater had been discharged from the water-table aquifer. Because this is the only SGD period where we observed an apparent increase and decrease of SGD, we attempted to quantify the water-table aquifer storage in Dauphin Island. Considering the cumulative SGD of 23.6 m day–1 during the 3-day span and the Dauphin Island watershed of 1.5 × 10⁷ m2 (Mobile Bay National Estuary Program, 2021), we calculated water-table aquifer storage of approximately 1.06 × 10⁹ m3.
(5) Second storm (June 10–13, 2014). The second storm brought lower total precipitation than the first storm, i.e., 58 mm; however, the wind speed in the areas was much higher, up to 15 m s–1. The river discharge record indicated that the river had responded immediately on the same day it started raining. During the storm period, 222Rn in coastal waters was anomalously low (average 860 ± 225 dpm m–3), equivalent to SGD rates of 0–0.3 m day–1 or 1.7 times lower compared with the base flow conditions.
(6) Post-discharge/second storm aftermath (June 14–28, 2014). After the storm, the fluctuation of the environmental parameters returned to the base flow conditions. The average 222Rn activities and SGD increased and were similar to the pre-storm, i.e., 1,618 ± 420 dpm m–3 and 0.09 m day–1, respectively. The highest post-storm SGD rate occurred 8 days after the start of the second storm (Figure 4). However, this SGD peak was not as high as the two other peaks (i.e., 0.8 m day–1), presumably due to the effects of the neap tide and/or smaller precipitation preceding this tip. The observed elevated 222Rn condition during the after-storm periods were associated with low wind speed and low to medium DO (Supplementary Figure 4). Another rain event occurred again between June 23 and 27; however, there was no significant response from Flow River and SGD (Figure 4). SGD was expected to increase in a 1-week offset, while the lack of Fowl River’s hydrological response indicates a local rain event in Dauphin Island that did not reach Mobile County, where the river is located.
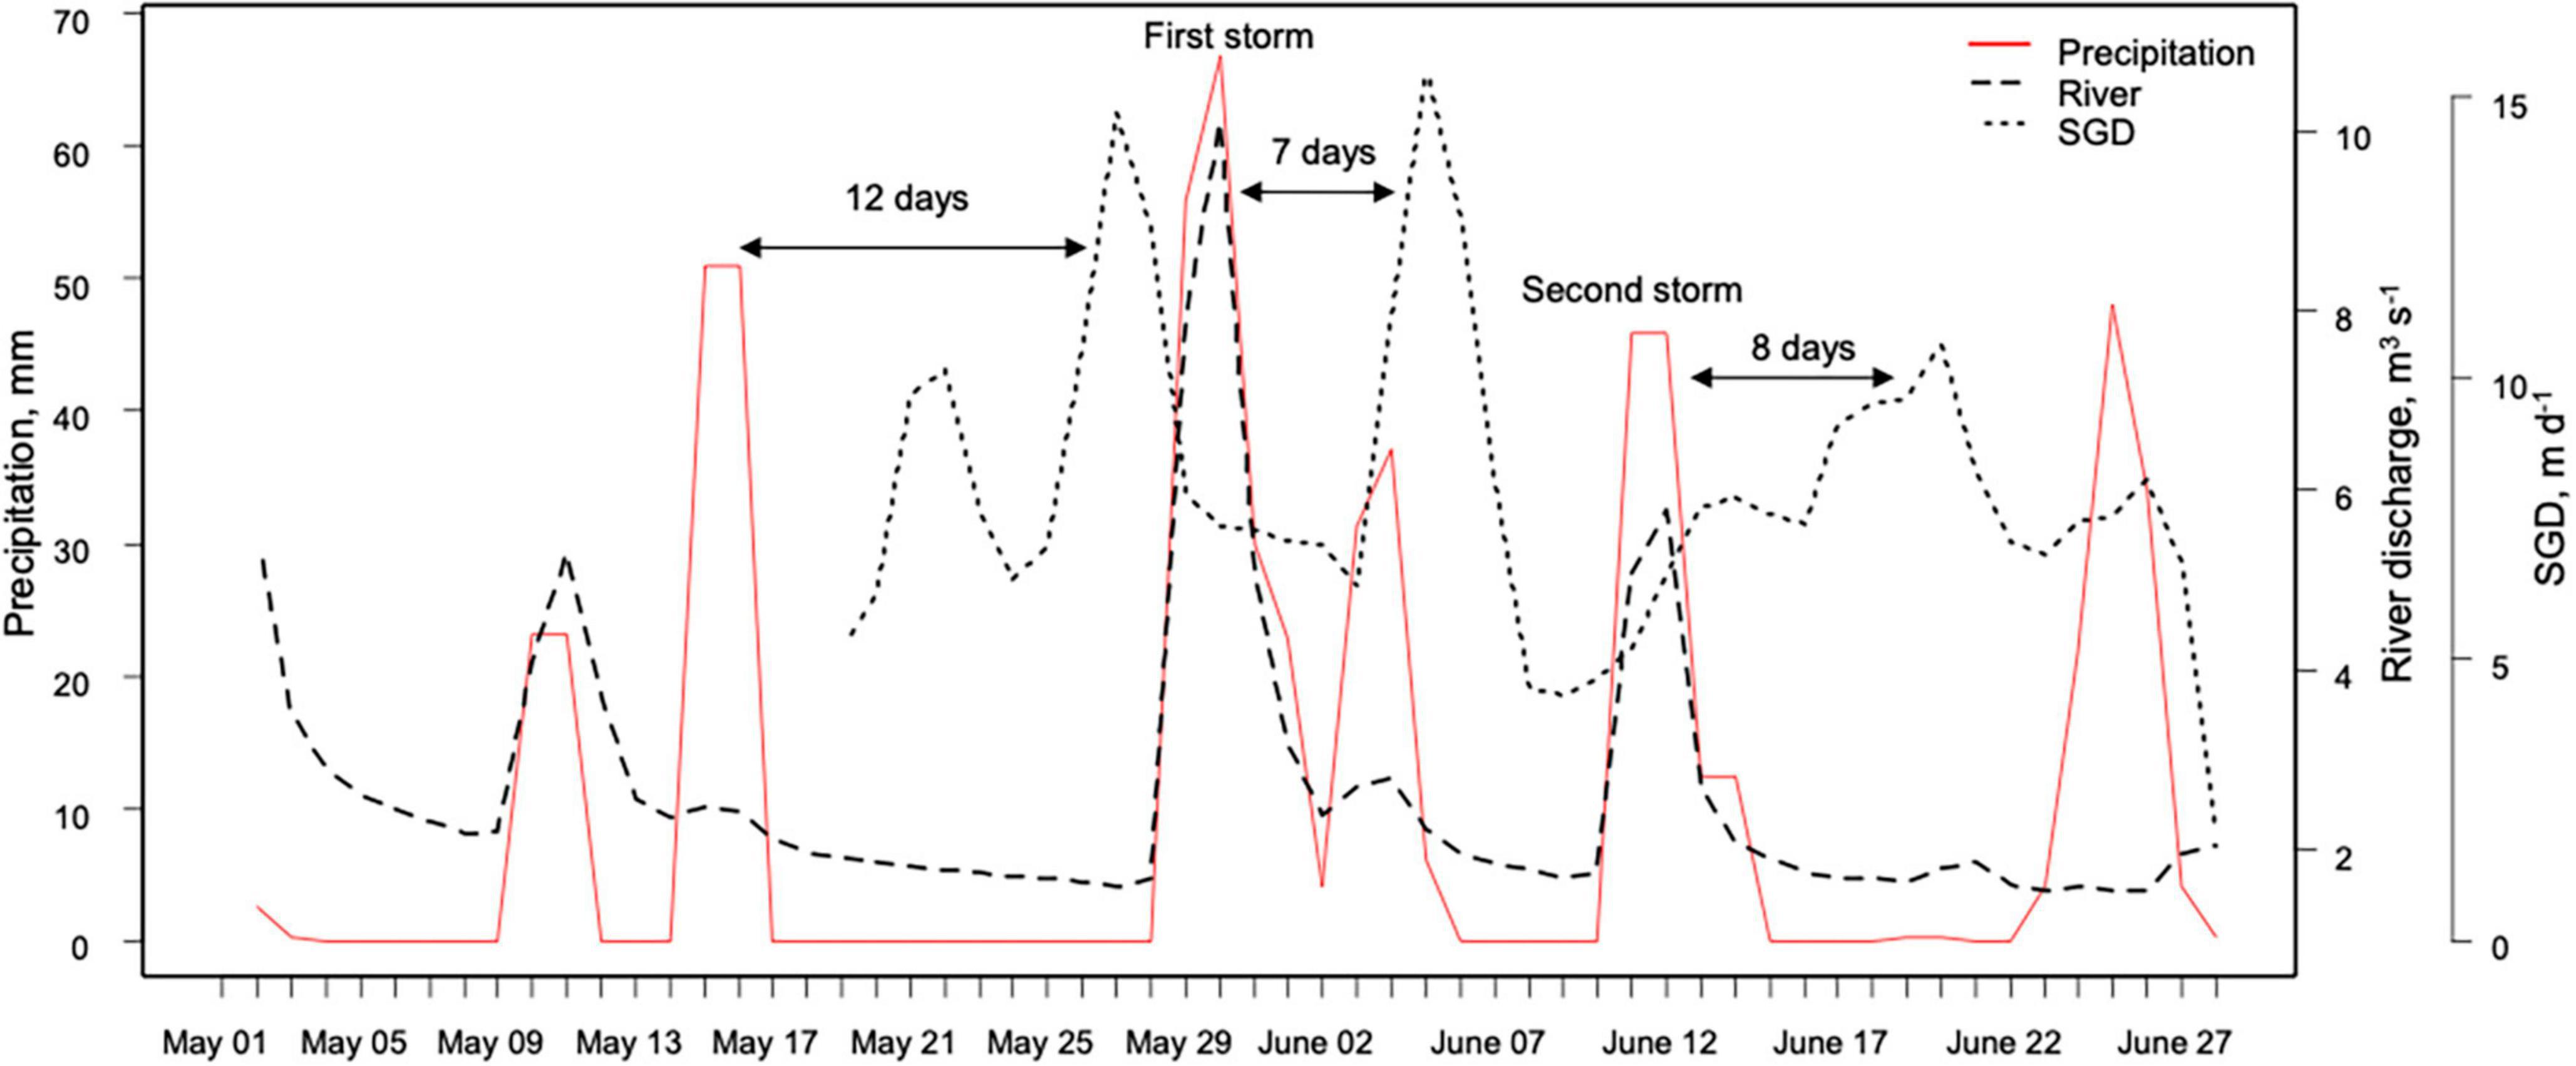
Figure 4. Cumulative precipitation, river discharge, and SGD during and 2 weeks prior to the sampling period.
Overall, we observed that the maximum SGD was lower during neap tide than during the spring tide (1 and 1.36 m day–1, respectively). The highest after-storm SGD was 1 m day–1 in comparison with SGD during dry periods before precipitation (0.5 m day–1). When the 222Rn inventory was low during the storm event, SGD was up to 0.6 m day–1, while high 222Rn inventory during the non-storm event resulted in SGD up to 1.36 m day–1.
Nutrient Concentration and Fluxes
The results of the 24-h grab sampling time series in DISL pier in 2014 are shown in Table 1, while the results of the nutrient spatial survey in 2014 and 2016 are displayed in Figure 2. We did not observe any significant correlation between salinity and nutrient in both years (Supplementary Figures 5, 6). During the 24-h measurement from the DISL pier, groundwater salinity was stable (2.8–2.9), while surface water salinity ranged between 10.5 and 19. NO3– concentrations varied across all samples, ranging from 0 to 4.4 μM in surface water samples and 0–2.6 μM in groundwater samples. NO2– concentration lower than NO3– (0–3.7 μM in surface water samples, and 0–2.3 μM in groundwater samples). PO43– concentration was higher in surface (1–4 μM) than groundwater (0–1.1 μM). Low NH4+ concentration (0–1.8 μM) in surface water contrasted with high NH4+ concentration in groundwater (0–58 μM). DON concentration followed a similar trend with NH4+, with a higher concentration in groundwater (52–65 μM) than surface water samples (15–23 μM). These results indicate a statistical difference between groundwater and surface water samples (p < 0.05). The average DIN:PO43– of groundwater and coastal water was 59 and 1.5, respectively, indicating a P-limited groundwater source in contrast to the N-limited coastal waters on the eastern shore of Dauphin Island. Figure 5 shows no significant correlation between nutrient concentration during the 24-h measurement in both groundwater and coastal water and the tidal cycle. However, we found that groundwater NH4+ concentration was stable throughout the time series, except for one outlier. A correlation between NH4+ and PO43– with DIN:PO43– ratio in groundwater and coastal water indicates that these two solutes were the governing nutrient limiting factors in the DISL pier coastal area. We also found that 222Rn had a notable inverse correlation with PO43–, which suggests that PO43– was most likely not derived from groundwater or land.
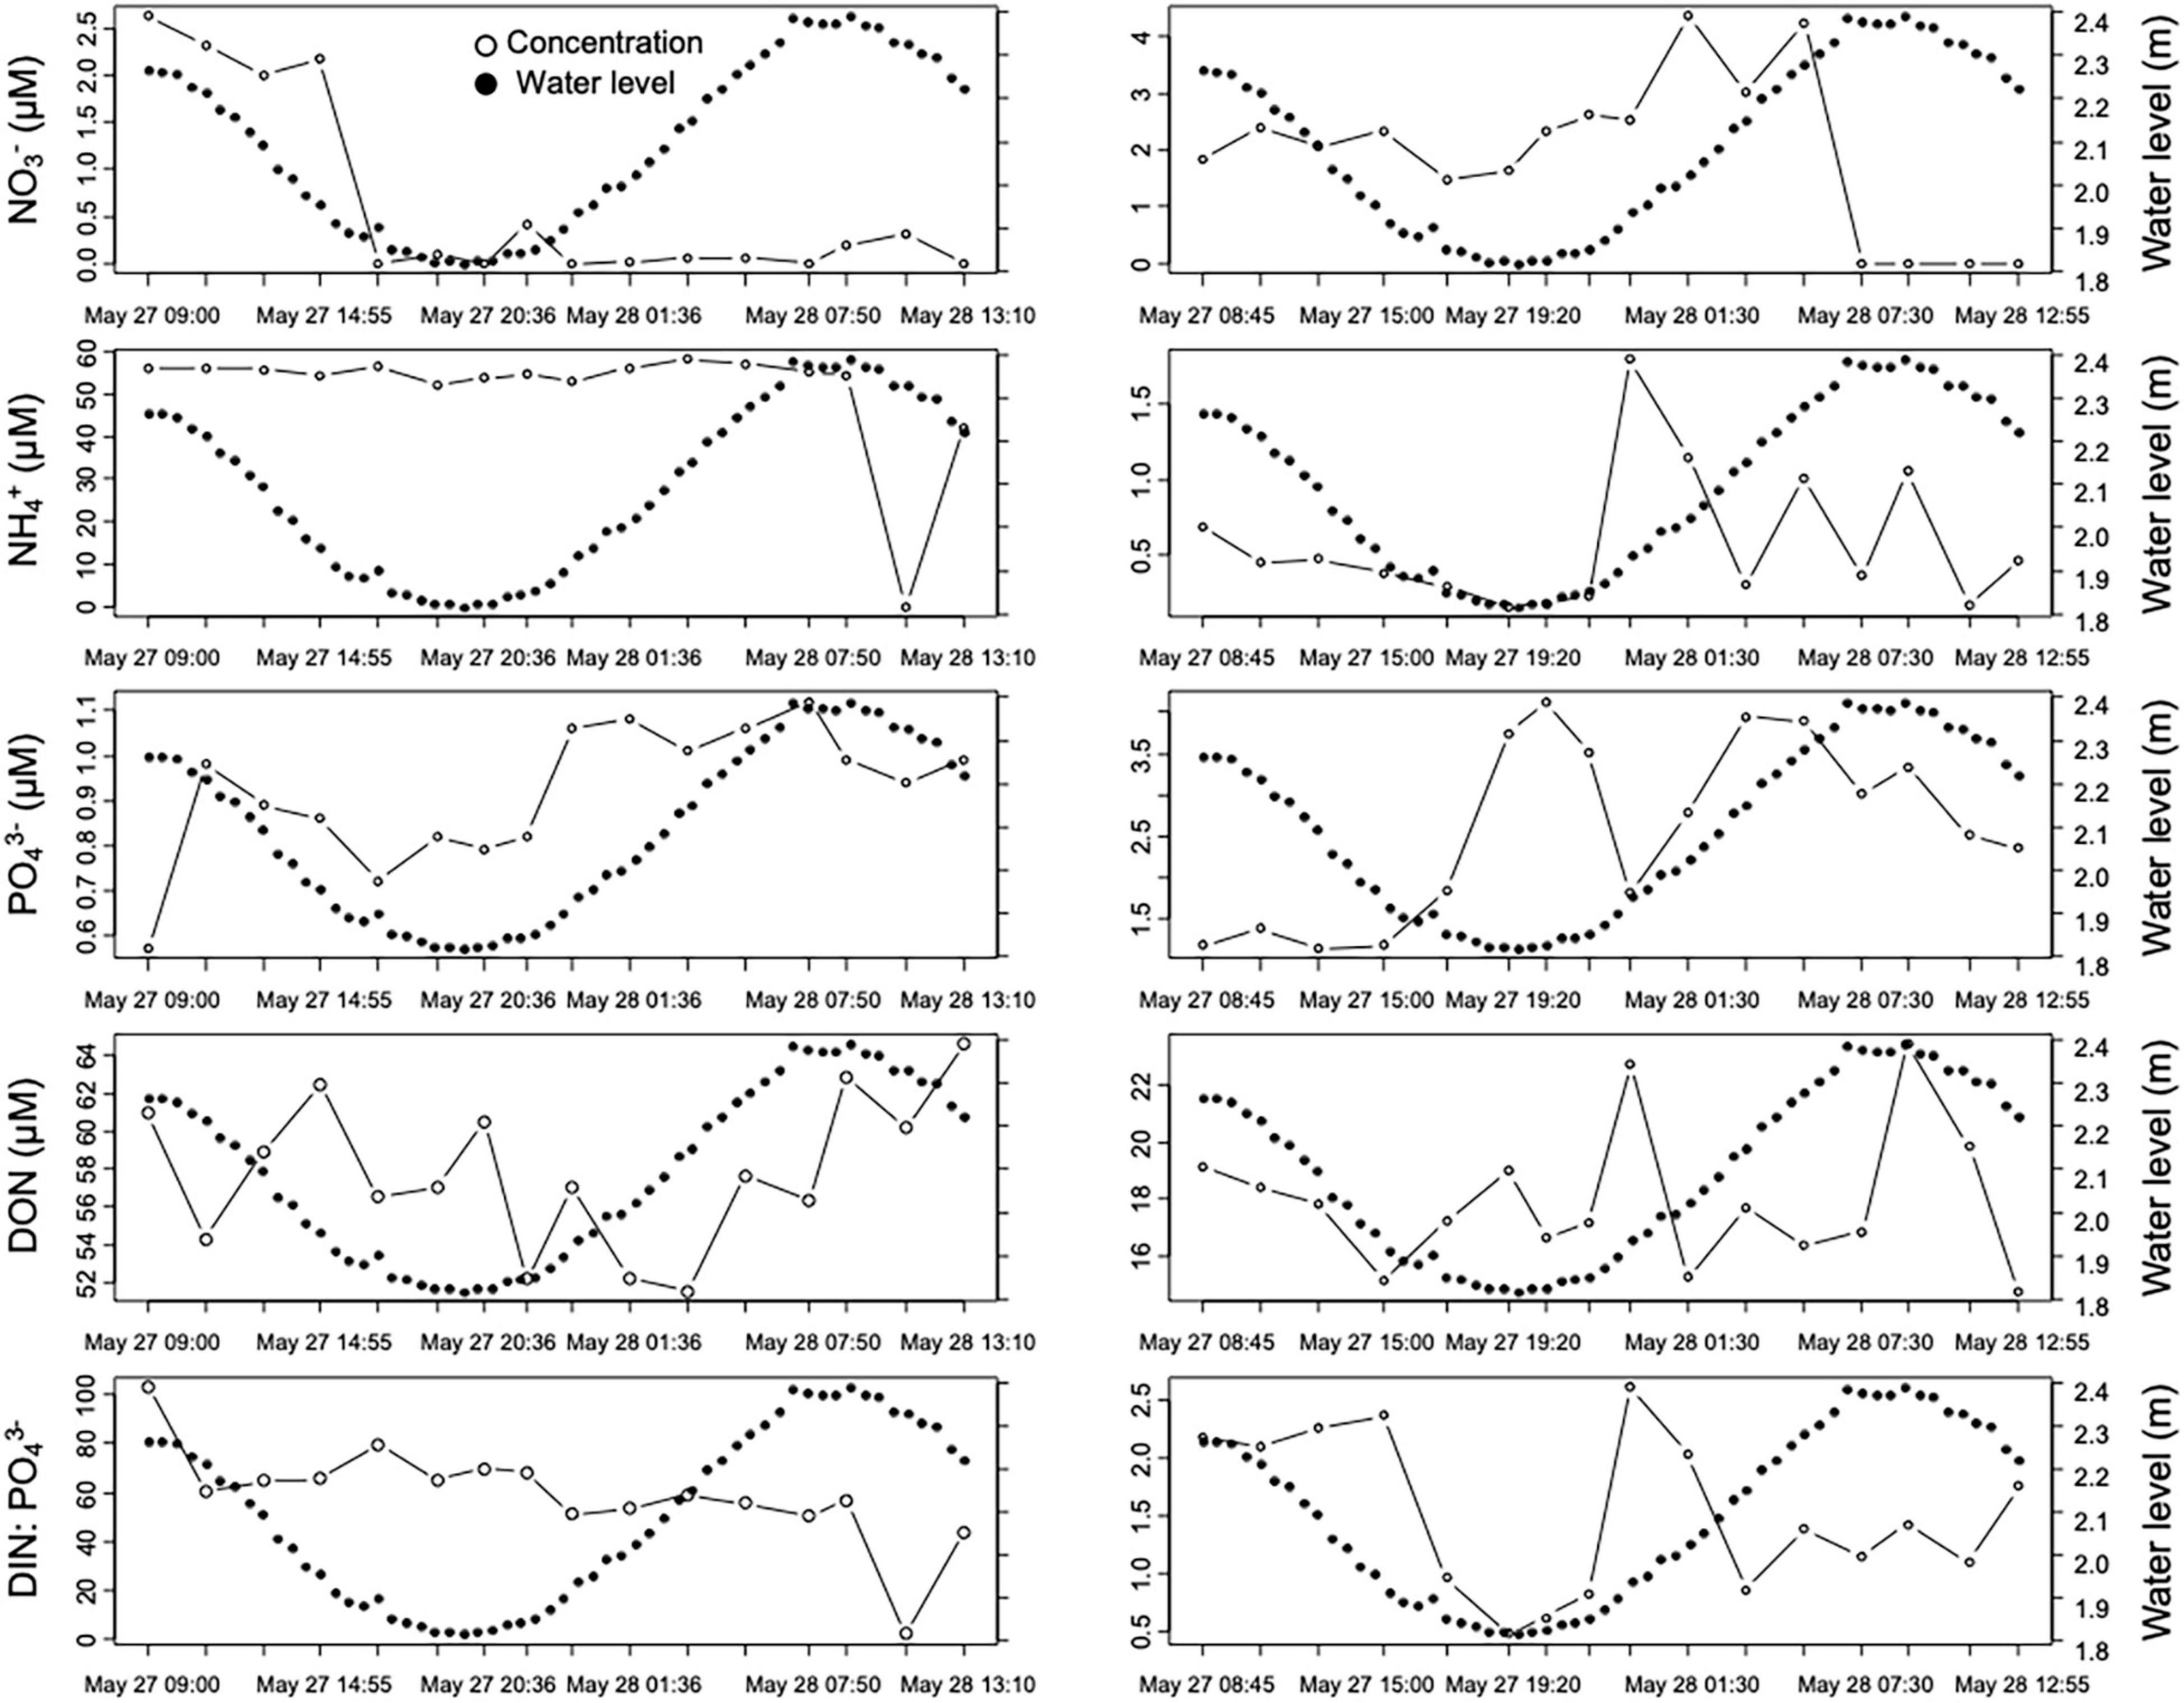
Figure 5. Time series measurement of nutrient in the groundwater (left) and coastal water (right) plotted against tidal cycle in DISL pier.
To calculate total SGD-derived nutrient fluxes, the average concentration of nutrients in coastal groundwater of DISL pier was multiplied by the 222Rn-derived SGD rates. This resulted in average fluxes of 0.06, 0.11, 4.88, 0.08, and 5.20 mmol m–2 day–1 per meter shoreline for NO3–, NO2–, NH4+, PO43–, and DON, respectively (Table 2). To quantify total SGD-derived nutrient export to the Gulf of Mexico, the above nutrient average concentrations were multiplied by the total shoreline length of Dauphin Island facing this Gulf of Mexico, i.e., 13 km. The calculation resulted in average fluxes of 0.75 mol m–1 day–1 for NO3–, 1.40 mol m–1 day–1 for NO2–, 63.49 mol m–1 day–1 for NH4+, 1.07 mol m–1 day–1 for PO43–, and 67.66 mol m–1 day–1 for DON.
Based on the coastal spatial surveys from 2014 and 2016, we found an increase in NO3– and NH4+ in the span of 2 years, while DON and PO43– remained similar (Figure 2). The change affected the DIN:PO43– ratio of coastal Dauphin Island as well, from an average of 4 in 2014 (N-limited) to 40 (P-limited) in 2016. Interestingly, we found a significantly high NO3– concentration (113 μM) in the pore water sampled in Dauphin Beach during the 2016 survey, even though groundwater DO was considered anoxic (average 1.5 mg L–1, Table 1). This concentration was 188 times higher than the average groundwater NO3– detected at the DISL pier in 2014 (0.6 μM). The different trend between groundwater concentration in DISL pier and Dauphin Beach was also displayed by PO43– (18 times higher) and DON (two times higher). Inversely, NH4+ concentration in Dauphin Beach was 11 times lower than in DISL pier.
Discussion
Groundwater Dynamics and Hydrological Response to Storm Events
During the continuous 40-day monitoring of this study, we observed two periods of negative 222Rn anomalies (below average concentrations in surface water), which coincided with the two storm events occurring during our monitoring period (Figure 3 and Supplementary Figure 4). These low inventories in the water column resulted from 222Rn degassing under high wind speed and heavy rainfall, and thus were not associated with the SGD fluctuations (Burnett et al., 2006). Indeed, the calculated atmospheric evasion during these periods (Fatm) was constantly high (average 50 dpm m–2 h–1). Other studies have observed this process as well, and it is especially pronounced in shallow water systems (up to 2–2.5 m depths) (e.g., Dimova et al., 2013).
The positive anomalies of 222Rn in the water column, associated with an excess of SGD-delivered 222Rn, were observed two times during this study (Figure 3). The first SGD peak occurred during spring tide, which is expected based on higher tidal amplitude; compared with neap tides, spring tide provides a higher terrestrial hydraulic gradient, and thus groundwater discharge (Kim and Hwang, 2002). The second SGD peak, which was the direct response of the first storm event recorded during our study, was observed approximately 7 days after the first day of precipitation during the storm event (Figure 4). This SGD peak was significant even though it took place during the neap tide. This finding suggests that precipitation, i.e., terrestrial driver, in specific cases had a higher impact on the magnitude of the local SGD compared with tidal pumping. Hence, we conclude that SGD in Dauphin Island was driven primarily by marine forces on a daily basis; however, when precipitation or storm events occurred, terrestrial forces were more prevalent than marine forces.
The groundwater hydrological response from the first storm occurred 7 days after the first day of precipitation (May 29), and this groundwater transit time was twice shorter compared with the first observed groundwater residence time, i.e., 12 days as calculated from the rainfall on May 15 until the first SGD peak (Figure 4). The contrasting rainfall pattern may explain the different groundwater transit times through the Island’s water-table aquifer: the rainfall on May 15 was a one-time event, while the first storm event was characterized by heavy and steady rainfall for 7 days. Groundwater recharge rates and runoff are reportedly increased when rainfall intensities are about 75 mm h–1 (Wang et al., 2015), which was the rainfall range recorded during the first storm event. This may explain the shorter groundwater residence time after a storm event, in comparison with groundwater residence time after a one-time rain event. Furthermore, this finding suggests that the short-term groundwater regime in Dauphin Island changes depending on the duration and intensity of a precipitation event. A long-term simulation shows that higher storm frequency in the future is expected to significantly influence hydrological cycling in the Gulf of Mexico’s barrier island ecosystems (Anderson and Emanuel, 2010). Therefore, greater attention should also be paid to groundwater dynamics during and after storm events, particularly due to the role of SGD as the conduit for terrestrial- and in-situ-generated contaminants and materials to the coastal water. For example, a sudden increase of SGD-derived nutrient influx to coastal water after hurricane events reportedly caused red tides at the Florida coast (Hu et al., 2006).
In addition, the relatively short groundwater response to these storms is consistent with the hydrogeology of the Island (Figure 6). Dauphin Island has a shallow groundwater table and relatively high hydraulic conductivity (13–18 m day–1, Kidd, 1988) due to the highly permeable, well-sorted quartz sand of the Pleistocene to Holocene formations of the water-table aquifer. When compared with the surface discharge, groundwater response was about a week slower. The gauge station at Fowl River indicates no offset between the peak of the river discharge and the monitored rain events (USGS 02471078). While we did not find any gauge recording discharge in the downstream Mobile-Tensaw River Delta entering Mobile Bay, we assume that the condition mirrors the Fowl River discharge. The different response time between river and aquifer system indicates that the Dauphin Island coastal waters are river-dominated shortly after a high precipitation event. However, when the river discharge goes back to base flow, SGD can be a factor as the SGD-derived material fluxes were three times higher than during the river-dominated period (Figure 3). The alternating groundwater-river controls and the prevalence of fresh groundwater have considerable implications specifically for crustaceans. Mobile Bay tends to be highly stratified most of the year, but specifically after large storm events during the summer. This condition also applies to the areas of the Main Pass, which is the closest to the study site (Noble et al., 1996). As SGD from DISL pier was characterized by anoxic, NH4+-rich fresh groundwater, the development of strong pictoclines would prevent mixing of surface and bottom waters, thus isolating and exposing bottom biota to anoxic conditions. We suggest that SGD plays a role in exacerbating the hypoxic conditions during the stratification event.
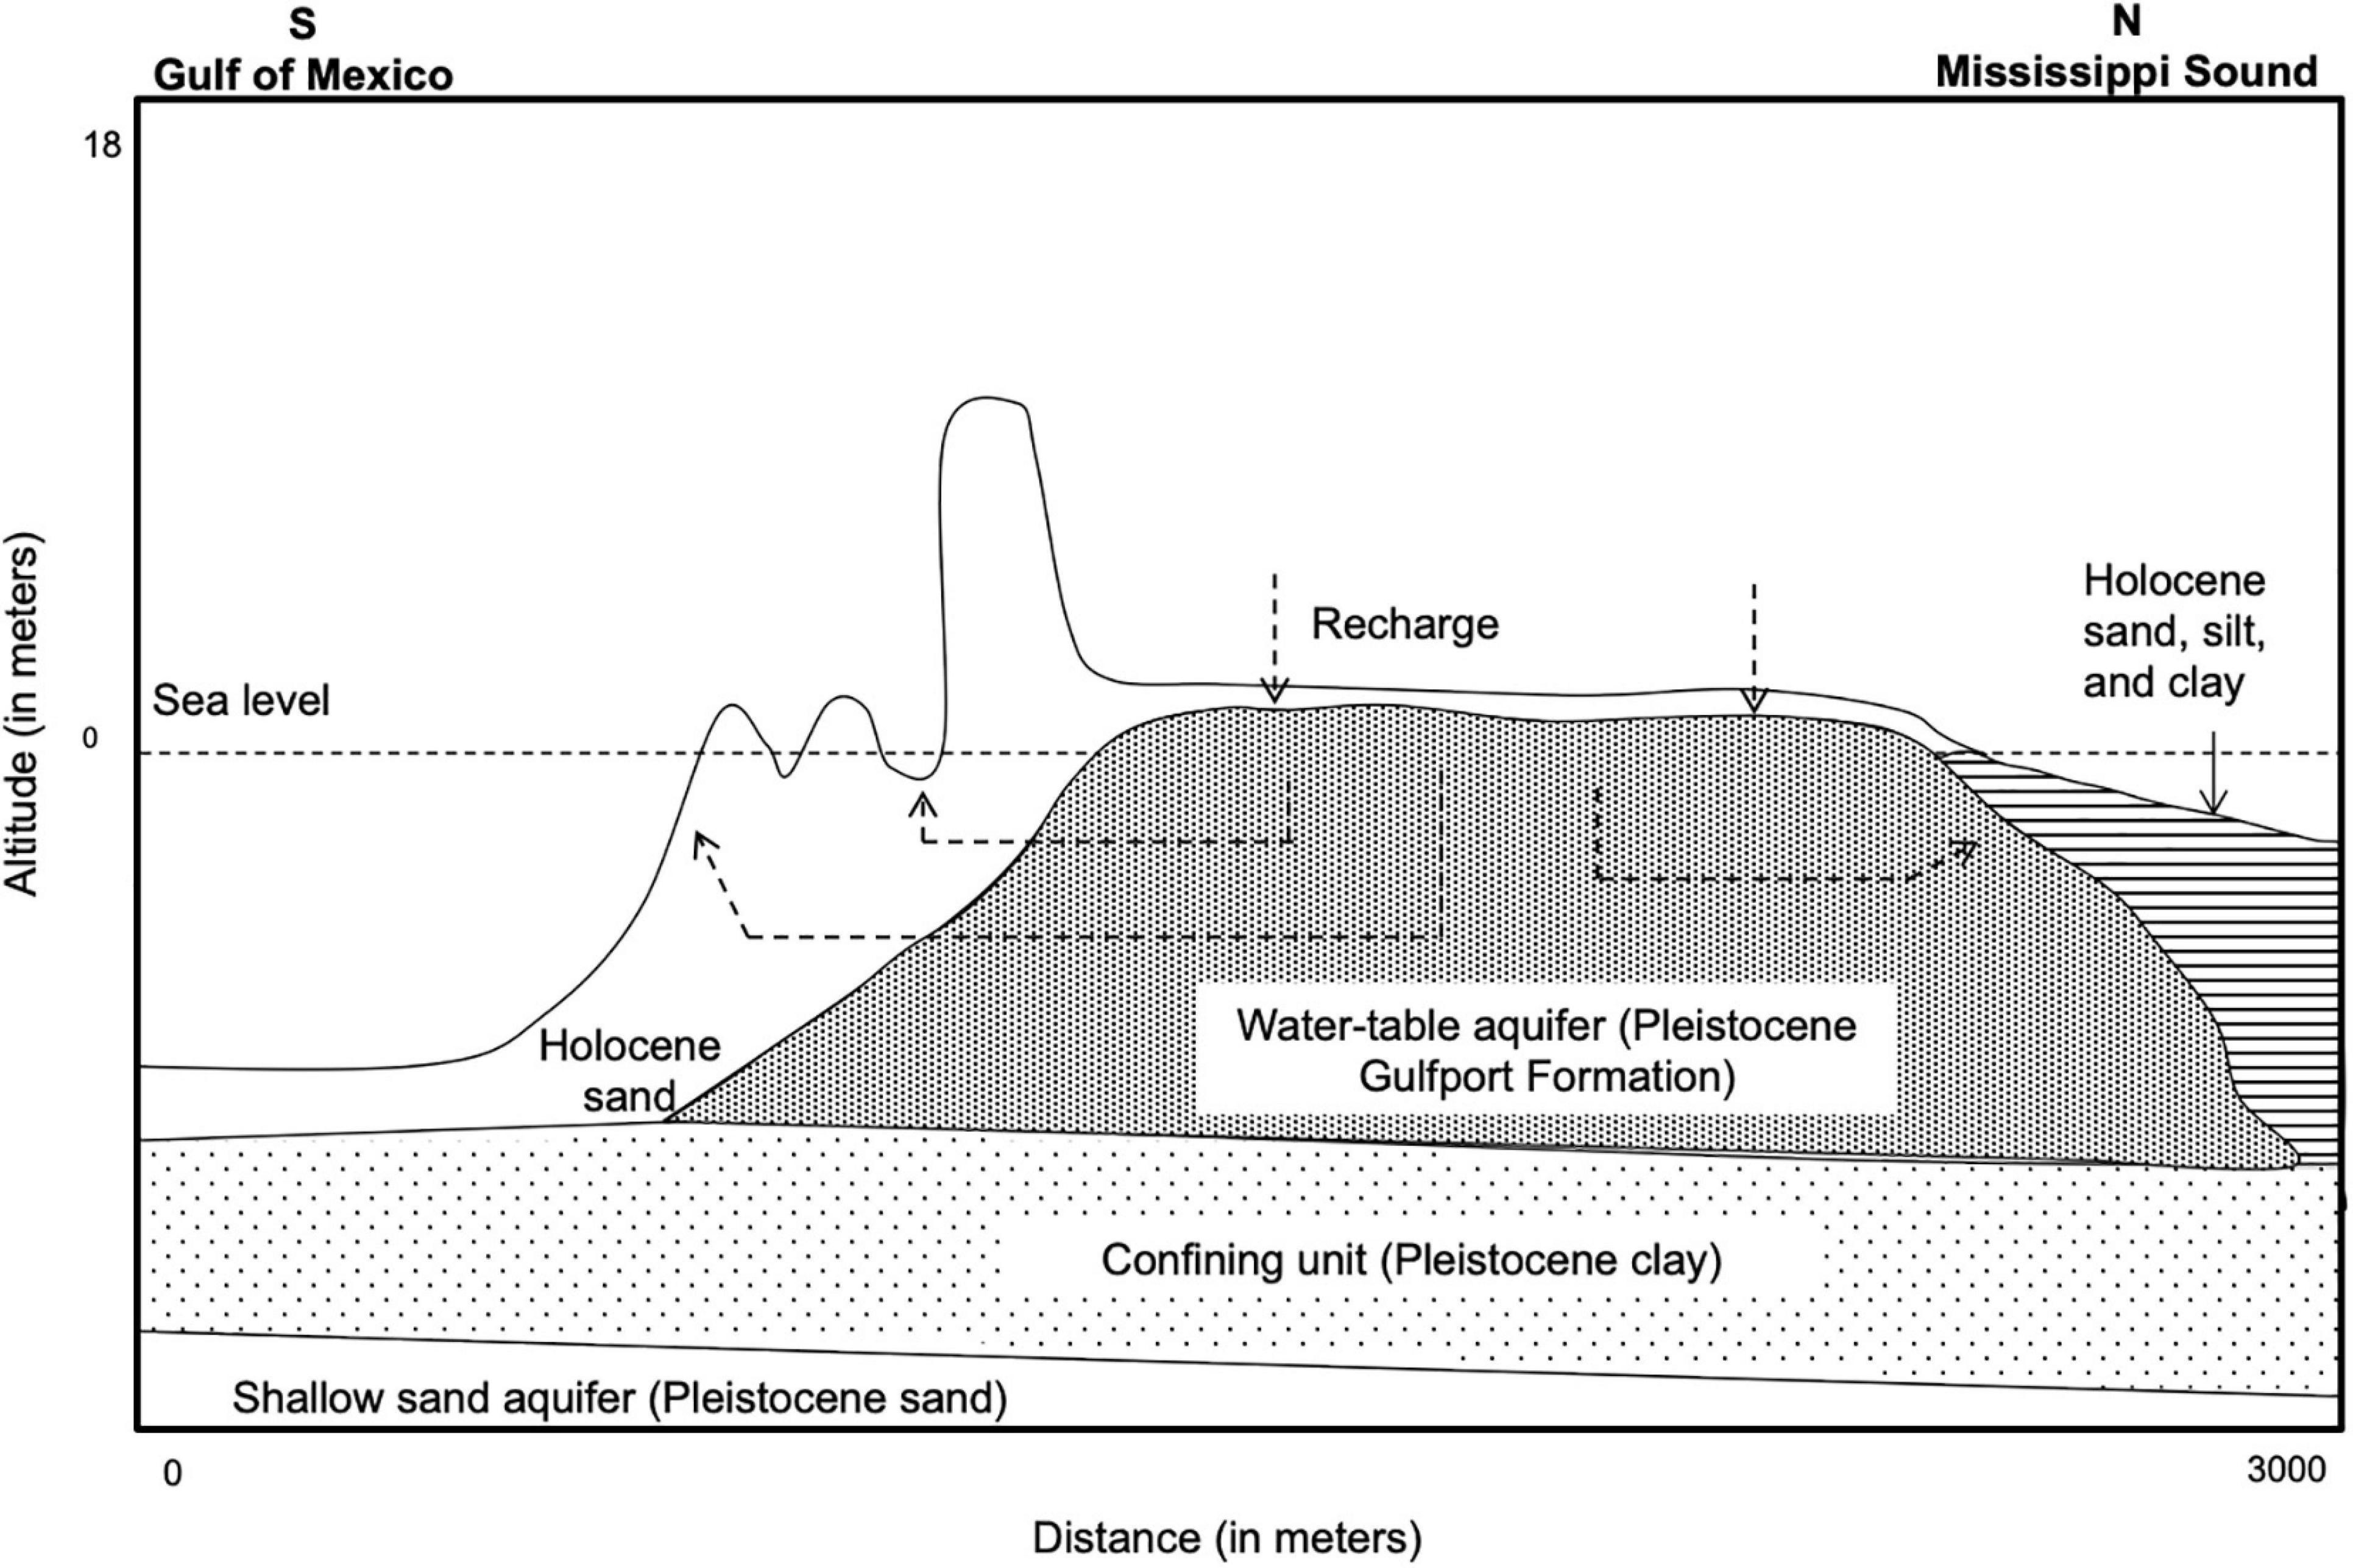
Figure 6. Conceptual sketch of groundwater flow across Dauphin island from the center of the Island to the Gulf of Mexico in the south and Mississippi Sound in the north. The generalized south-north hydrogeological section of Dauphin Island is modified from Otvos (1985).
Preferential Groundwater Pathways of SGD
222Rn coastal surveys result revealed that a significant part of the groundwater discharge was concentrated on relatively few focused areas in the southeastern part of the Island. These areas also received significant flux of up to 5.2 mmol m–2 day–1 per meter shoreline for DON and were identified as “hot spots” of potential contamination. While we did not conduct a 222Rn spatial survey in the northern part of the Island, based on the hydraulic gradients (Figure 1) and clay-dominated geological settings (Figure 6) of the Island’s northern part, these areas should not receive a significant discharge from the Island (Kidd, 1988). With this being said, future studies should include northern Dauphin Island as a location for spatial groundwater survey to determine SGD contribution in all parts of the Island. Similarly, the western part, or the “tail part” of Dauphin Island, has a low hydraulic gradient and minimum discharge.
In a hydrologically and meteorologically dynamic coastal environment influenced by river discharge such as Dauphin Island, determining the ideal groundwater tracer could be challenging. However, we concur with other studies conducted in river-dominated coastal areas that 222Rn was an ideal groundwater tracer where salinity fluctuations affect Ra inventories significantly (Dulaiova et al., 2006; Montiel et al., 2019a). During this study, the 222Rn concentration was 50 times higher in groundwater compared with surface waters, which was higher than its Ra counterpart (i.e., 1.7 and 2.7 times for 223Ra and 224Ra, respectively). On the other hand, 222Rn is more susceptible to degassing during high wind speed and heavy rainfall that usually occur during storm events, as also shown during our sampling period. In an area prone to tropical storms like the Gulf of Mexico, the low 222Rn inventory during the storm may underestimate the actual SGD fluxes. The storm influence to coastal 222Rn concentration is also observed in the nearby Florida Panhandle, where sediment resuspension during storms alters SGD tracer concentration and complicates the interpretation of the results (Santos et al., 2009). Other factors affecting 222Rn activities during stormy condition are beach setup and wave energy. For example, an SGD study during stormy condition in Japan resulted in two or three times increased 222Rn concentration compared with calm periods (Nikpeyman et al., 2019), which contradicts the result of this study. The different result can be attributable to the different coastal environment: Dauphin Island and the surrounding Gulf of Mexico are categorized as low-energy depositional coastal environments. Consequently, the broad continental shelf and its associated shallow water column and small tidal oscillations generate lower energy waves; hence, preventing deeper seawater infiltration into the coastal aquifer, and resulting in lower percentage recirculated SGD and lower 222Rn inventory during the storm events. Therefore, even though 222Rn is the more ideal tracer based on these findings, its interpretation and utilization during storm events should be proceeded with cautions.
We found that the Ra mass balance had limited application for the specifics of this site. The result of Ra mass balance indicates small Ra contribution to surface waters, and the majority of Ra signal is due to river-enriched Mobile Bay waters that enter the DISL pier study site through the Main Pass and Gulf of Mexico offshore water. Even further, we found a deficiency of Ra in the groundwater system during the high tide (Table 3). We suggest that this could be attributed to seawater infiltration in the Island’s water-table aquifer, which entrains river-born Ra into it. During such conditions, oxygenated waters most likely result in co-precipitation of Ra onto STE sediments resulting in negative fRSGD in the mixing model (Garcia-Orellana et al., 2021). While the three-endmember mixing model is a simplification of the system, the result of negligible RSGD is plausible due to the geology of southeastern Dauphin Island, which supports the occurrence of fresh SGD instead of RSGD. However, more detailed Ra studies should be conducted to conclusively quantify the contribution of RSGD in Dauphin Island, particularly in constraining the SGD boundary in an open water system.
The Difference of N Dynamics Between DISL Pier and Dauphin Beach
During this study, we found significantly different nutrient flux characteristics at the two sampling locations along the ocean side of Dauphin Island, i.e., the DISL pier, which was sampled in 2014, and Dauphin Beach, sampled in 2016.
DISL Pier
We found at the DISL monitoring station that NH4+ and DON dominated the nitrogen (N) form in the coastal groundwater with concentrations up to 50 μM, or approximately 40 and 50% of total dissolved N, respectively, while both coastal groundwater and surface water had low NO3– and NO2– concentration (Table 1). Furthermore, NH4+ was stable throughout the 24-h time-series measurement tidal cycle, suggesting that a reduced form of N was characteristic of the STE at this location (Figure 5). This condition is also mirrored alongside Mobile Bay’s eastern shoreline, where organic-rich surface coastal sediment promoting a high concentration of NH4+ and DON was reported as well as other coastal aquifers worldwide (Montiel et al., 2019b; Santos et al., 2021). NH4+ and DON in the STE can be either physicochemically generated from the mineralization of coastal organic deposits or, in the case of NH4+, a product of microbially mediated dissimilatory nitrate reduction to ammonium (DNRA) process, which was also observed in the eastern Mobile Bay (Bernard et al., 2015; Adyasari et al., 2020). The lack of significant correlation of any groundwater parameters to Ra (a proxy of recirculated seawater) and Rn (a proxy of total groundwater) indicated that these parameters are autochthonous in the STE, i.e., they are not originated either from the hinterland or the ocean.
As a result of these N-species distributions, we calculated that NH4+ and DON fluxes were the highest contributor of nutrient input via SGD to the DISL pier study site, followed by NO2–, PO43–, and NO3– (Table 2). It must be noted that the 24-h nutrient sampling in DISL pier was conducted during low river discharge; thus, it was during the period of SGD-influenced environment where nutrient was delivered to the coastal water primarily via groundwater. However, NH4+ concentration in the coastal water was almost negligible, indicating that high STE-derived NH4+ was oxidized to NO3–, rapidly taken by phytoplankton or mixed with NH4+-poor offshore or Mobile Bay water. Likewise, DON concentration in surface water was only half of its concentration in the coastal groundwater during our 24-h measurement. The rapid loss of SGD-derived NH4+ and DON in the coastal water is consistent with the rate of phytoplankton nutrient demand in this region. For example, Mortazavi et al. (2012) reported N phytoplankton demand of approximately 0.15–2.2 mmol m–2 day–1 in Weeks Bay, Alabama, a nearby estuary. NH4+ is the preferred N-source for cyanobacteria (Domingues et al., 2011), which were abundant in the southern part of Mobile Bay (Adyasari et al., 2020). NH4+ is also the more readily used N-species by phytoplankton in comparison with NO3– or DON; therefore, the similarity between N demand with SGD-associated NH4+ flux in this study suggests that NH4+ was rapidly consumed by phytoplankton and hence its low concentration in coastal water.
SGD-derived P flux was also in the same range with phytoplankton demand of P (i.e., 0.009–0.14 mmol m–2 day–1 (Mortazavi et al., 2012). However, unlike NH4+, nearshore water PO43– concentration in this study was up to three times higher than other coastal water studies in Dauphin Island (Plutchak et al., 2010) or Mobile Bay (Beebe and Lowery, 2018; Montiel et al., 2019b). As groundwater and Mobile Bay water column themselves had very low PO43– concentration, and any PO43– delivered by SGD is presumably consumed by phytoplankton, the high coastal PO43– concentration suggests that PO43– is produced within Dauphin Island’s coastal water itself. This notion is also supported by the negative correlation between PO43– and 222Rn. Possible sources of coastal PO43– could be remineralization of organic matter, atmospheric deposition, or a product of bottom water upwelling. PO43– produced in the sediment or bottom water can be upwelled to surface water due to the occurrence of north–south wind direction in the days before the sampling (DISL, 2014), resulting in high surface water PO43– concentration. The dilution of groundwater-derived NH4+ and net production of PO43– in coastal water promoted N-limitation in the DISL pier area (DIN: PO43– of 1.5).
Dauphin Beach
In Dauphin Beach, the nutrient data in 2016 suggest different nutrient patterns and processes than in DISL pier. We found an elevated NO3– concentration, up to 113 μM or more than two orders of magnitude higher than DISL pier (Table 1). This finding could be associated with a golf course opening in July 2015 (Mack, 2016), a year before the 2016 sampling event. The golf course is located 250 m from the sampling point, and fertilizers applied to the course may contribute to the high groundwater NO3– concentration. The prevalence of NO3– in this area was surprising considering the anoxic condition observed of the aquifer (Table 1). While NO3– concentration in anoxic aquifers has also been observed elsewhere (e.g., Utom et al., 2020), more samples in Dauphin Beach have to be acquired to accurately determine the biogeochemical processes occurring in this area. To the best of our knowledge, no other data or studies related to subsurface nutrient concentration exist in Dauphin Island. Therefore, we suggest that our results can be used as a preliminary study indicating the impact of anthropogenic activities on the groundwater quality in Dauphin Island, considering that high levels of tourism development often correlates with elevated groundwater nutrient levels worldwide (ArandaCirerol et al., 2006; Silva and Mattos, 2020). We also acknowledge the need for further studies examining the δ15N/δ18O in NO3–, such as the study conducted in Mobile Bay by Montiel et al. (2019b), which will significantly help in identifying the source of NO3– in this part of Dauphin Island’s coastal aquifer. Adjacent to the beach, coastal water NO3– concentration along the Dauphin Island coastal shoreline in 2016 was 5 μM, indicating dilution of SGD-derived NO3– with offshore water from the Gulf of Mexico.
In addition, groundwater NH4+ concentration shows notable variability between DISL pier and Dauphin Beach. Even though DON concentration was still highly prevalent in Dauphin Beach and composed 50% of total dissolved N in this area, NH4+ concentration was remarkably lower. On average, the Dauphin Beach groundwater had 11 times lower NH4+ than in the DISL pier. This finding suggests that the STE hydrogeological conditions were not uniform along the ocean side of Dauphin Island. In contrast with the STE at the DISL pier, coastal groundwater in Dauphin Beach was characterized by a NO3–- and DON-prevalent environment.
The difference in groundwater nutrient composition also affected the DIN:PO43– ratio in Dauphin Beach’s coastal water. Based on 2016 spatial survey, the average DIN:PO43– ratio in this area was 40, indicating P-limitation, and it was primarily driven by elevated NO3– concentration (Supplementary Table). This result contrasts with the result from DISL pier in 2014, where we observed N-limitation. Note that both locations in 2014 and 2016 were assumed to be in SGD-influenced environments during the time of sampling periods. The DISL pier sampling occurred during the first SGD peak, while Dauphin Beach is located in a sheltered bay where there were no river inputs and the influence of the river plume from Mobile Bay was less pronounced (Figure 1B). Therefore, SGD may play an essential part as a pathway for land-based nutrients in these two locations. The nutrient results from 2014 and 2016 show that spatial and temporal nutrient variability in the coastal groundwater also affected coastal water quality in each respective area due to SGD.
The DIN:PO43– ratio itself is an indicator for assessing nutrient limitations to phytoplankton growth. A deviation of DIN:PO43– ratio from the Redfield ratio 16:1, which occurred in both study sites in Dauphin Island, may result in the change of phytoplankton assemblage and have further implications for food webs and ecosystem function (Dodds, 2002). Indeed, high spatial variability shown during the 222Rn coastal survey indicates the possibility of concentrated nutrient or pollutant transport zones in certain areas of the Island. A depletion in either coastal DIN or PO43– concentration due to SGD reportedly may result in eutrophication and even red tides (Lee and Kim, 2007; Lee et al., 2010).
Barrier islands in the Gulf of Mexico are sensitive to climate change threats, such as increasing seawater intrusion or changing precipitation patterns. A study conducted after Hurricane Ivan in 2005 concludes that this event negatively affected gross primary productivity, net productivity, and chlorophyll a of tidal creek sediments in Dauphin Island (Cebrian et al., 2008). We have demonstrated in this study that storm events and precipitation patterns can change SGD characteristics, which subsequently may alter its associated solute fluxes. Therefore, a change of nutrient fluxes and patterns may be expected in the future, affecting the coastal water quality of Dauphin Island and the health of its coastal ecosystem.
Conclusion
In this study, a combination of direct measurements of groundwater discharge and nutrient concentration and hydrometeorological data was employed to examine the groundwater hydrological response, discharge, and associated nutrient fluxes in Dauphin Island, United States. This study indicates that regardless of its relatively small size, Dauphin Island has dynamic coastal settings in terms of hydrology and biogeochemistry. We found that the local rivers had an immediate hydrological response time than groundwater during the storm event, pointing to a river-dominated environment. However, our results also suggest that during dry conditions, SGD can be a factor in the coastal area with discharge rates up to 1.36 m day–1. SGD fluctuation was influenced by precipitation and tidal amplitude. We found that NH4+- and DON-dominated SGD occurred in the eastern part of the Island while the SGD in the southern Dauphin Island had a high NO3– concentration. Our spatial survey suggests constant groundwater discharge and higher coastal nutrient concentration in the span of 2 years. We presume the increase was attributable to tourism development in the area. The temporal nutrient dynamics lead to different N- and P-limitations in the local areas, affecting food webs and ecosystem function. However, we acknowledge the need for further studies to delineate the sources of N to the groundwater system.
Overall, our study points to the challenges in accurately estimating the groundwater discharge dynamics in barrier islands prone to storm surges or located near large estuaries. This study emphasizes the importance of understanding groundwater flow path and hydrological response to precipitation for maintaining good coastal water quality, particularly in small islands with elevated hydraulic conductivity, low solute dispersivity levels, and high susceptibility to storm events. We conclude that despite most of the barrier islands are small in size, they exhibit high spatial and temporal groundwater variability associated with solute fluxes. Considering these islands are sensitive to increasing anthropogenic development and seawater intrusion from climate change events, attention must be paid to the implementation of nutrient attenuation or recharge management to maintain their groundwater quality and quantity for future freshwater resources.
Data Availability Statement
The original contributions presented in the study are included in the article/Supplementary Material, further inquiries can be directed to the corresponding author/s.
Author Contributions
ND and BM designed the study and conducted the field work in 2014. DM participated in the 2016 survey field expedition and contributed to the laboratory sample analyses. DA compiled the data, did the data analyses, and wrote the first draft. All authors contributed to writing and editing the manuscript.
Funding
DA was funded by the Walter Benjamin Fellowship from German Research Foundation (DFG). The field work was sponsored by the College of Arts and Sciences at the University of Alabama and the Dauphin Island Sea Laboratory as a Faculty Research Fellowship awarded to ND. DM was supported by a summer fellowship by the ExxonMobil Summer Fund and the Geological Sciences Advisory Board (GSAB) at the Department of Geological Sciences at the University of Alabama.
Conflict of Interest
DM and Geosyntec Consultants declare that no employment, consultancy, patent, product development, or marketed products will be implemented in relation with this publication.
The remaining authors declare that the research was conducted in the absence of any commercial or financial relationships that could be construed as a potential conflict of interest.
Publisher’s Note
All claims expressed in this article are solely those of the authors and do not necessarily represent those of their affiliated organizations, or those of the publisher, the editors and the reviewers. Any product that may be evaluated in this article, or claim that may be made by its manufacturer, is not guaranteed or endorsed by the publisher.
Acknowledgments
Heather Black assisted ND in the field work in 2014 and was supported by the 2014 ExxonMobil Summer Graduate Fellowship. The authors gratefully acknowledge use of the resources of the Alabama Water Institute at The University of Alabama.
Supplementary Material
The Supplementary Material for this article can be found online at: https://www.frontiersin.org/articles/10.3389/fmars.2021.679010/full#supplementary-material
Footnotes
- ^ https://www.ncdc.noaa.gov/cdo-web/datasets/GHCND/stations/GHCND:USC00012172/detail
- ^ https://arcos.disl.org/
- ^ https://waterdata.usgs.gov/monitoring-location/02471078/#parameterCode=00065
References
Adyasari, D., Hassenrück, C., Montiel, D., and Dimova, N. (2020). Microbial community composition across a coastal hydrological system affected by submarine groundwater discharge (SGD). PLoS One 15:e0235235. doi: 10.1371/journal.pone.0235235
Anderson, W. P. Jr., and Emanuel, R. E. (2010). Effect of interannual climate oscillations on rates of submarine groundwater discharge. Water Resour. Res. 46:W05503. doi: 10.1029/2009WR008212
ArandaCirerol, N., Herrera-Silveira, J. A., and Comín, F. A. (2006). Nutrient water quality in a tropical coastal zone with groundwater discharge, northwest Yucatan, Mexico. Estuarine Coastal and Shelf. Science 68, 445–454. doi: 10.1016/j.ecss.2006.02.015
Beck, M., and Brumsack, H.-J. (2012). Biogeochemical cycles in sediment and water column of the Wadden Sea: the example Spiekeroog Island in a regional context. Ocean Coastal Manage. 68, 102–113. doi: 10.1016/j.ocecoaman.2012.05.026
Bedekar, V. S., Memari, S. S., and Clement, T. P. (2019). Investigation of transient freshwater storage in island aquifers. J. Contam. Hydrol. 221, 98–107. doi: 10.1016/j.jconhyd.2019.02.004
Beebe, D. A., and Lowery, B. A. (2018). Seawater recirculation drives groundwater nutrient loading from a developed estuary shoreline with on-site wastewater treatment systems: mobile Bay, USA. Environ. Earth Sci. 77:372.
Bernard, R. J., Mortazavi, B., and Kleinhuizen, A. A. (2015). Dissimilatory nitrate reduction to ammonium (DNRA) seasonally dominates NO3reduction pathways in an anthropogenically impacted sub-tropical coastal lagoon. Biogeochemistry 125, 47–64. doi: 10.1007/s10533-015-0111-6
Black, H. (2019). Cloudy Future for Dauphin Island, a Canary in the Coal Mine of Climate Change, WBHM. Birmingham: Public Radio WBHM 90.3 FM.
Board, O. S., and National Academies of Sciences, and Medicine, E. (2018). Understanding the long-term evolution of the coupled natural-human coastal system: the future of the US Gulf Coast. Washington, DC: National Academies Press.
Bokuniewicz, H., and Pavlik, B. (1990). Groundwater seepage along a barrier island. Biogeochemistry 10, 257–276. doi: 10.1007/bf00003147
Bratton, J. F., Böhlke, J. K., Krantz, D. E., and Tobias, C. R. (2009). Flow and geochemistry of groundwater beneath a back-barrier lagoon: the subterranean estuary at chincoteague Bay, Maryland, USA. Mari. Chem. 113, 78–92. doi: 10.1016/j.marchem.2009.01.004
Burnett, W. C., and Dulaiova, H. (2003). Estimating the dynamics of groundwater input into the coastal zone via continuous radon-222 measurements. J. Environ. Radioact. 69, 21–35. doi: 10.1016/s0265-931x(03)00084-5
Burnett, W. C., Bokuniewicz, H., Huettel, M., Moore, W. S., and Taniguchi, M. (2003). Groundwater and pore water inputs to the coastal zone. Biogeochemistry 66, 3–33. doi: 10.1023/b:biog.0000006066.21240.53
Burnett, W., Aggarwal, P., Aureli, A., Bokuniewicz, H., Cable, J. E., Charette, M. A., et al. (2006). Quantifying submarine groundwater discharge in the coastal zone via multiple methods. Sci. Total Environ. 367, 498–543.
Cebrian, J., Foster, D., Plutchak, R., Sheehan, K. L., Miller-Meehan, M. C., Anton, A., et al. (2008). The impact of Hurricane Ivan on the primary productivity and metabolism of marsh tidal creeks in the NorthCentral Gulf of Mexico. Aquatic Ecol. 42, 391–404. doi: 10.1007/s10452-007-9096-0
Chang Sun, W., Nemec, K., Kalin, L., and Clement, T. P. (2016). Impacts of climate change and urbanization on groundwater resources in a barrier Island. J. Environ. Eng. 142:D4016001.
Corbett, D. R., Dillon, K., and Burnett, W. (2000). Tracing groundwater flow on a barrier island in the north-east Gulf of Mexico. Estuarine, Coastal Shelf. Sci. 51, 227–242. doi: 10.1006/ecss.2000.0606
Dimova, N. T., Burnett, W. C., Chanton, J. P., and Corbett, J. E. (2013). Application of radon-222 to investigate groundwater discharge into small shallow lakes. J. Hydrol. 486, 112–122. doi: 10.1016/j.jhydrol.2013.01.043
Dimova, N., Burnett, W. C., and Lane-Smith, D. (2009). Improved automated analysis of radon (222Rn) and thoron (220Rn) in natural waters. Environ. Sci. Technol. 43, 8599–8603. doi: 10.1021/es902045c
DISL (2014). Dauphin Island Hydrological and Meteorological Data Dauphin Island Sea Laboratory. Island, AL: Dauphin.
Domingues, R. B., Barbosa, A. B., Sommer, U., and Galvão, H. M. (2011). Ammonium, nitrate and phytoplankton interactions in a freshwater tidal estuarine zone: potential effects of cultural eutrophication. Aquatic Sci. 73, 331–343. doi: 10.1007/s00027-011-0180-0
Dulaiova, H., Burnett, W., Wattayakorn, G., and Sojisuporn, P. (2006). Are groundwater inputs into river-dominated areas important? The chao phraya rivergulf of thailand. Limnol. Oceanogr. 51, 2232–2247. doi: 10.4319/lo.2006.51.5.2232
Ellis, J. H. (2013). Evaluation of Submarine Groundwater Discharge and Groundwater Quality Using a Novel Coupled Approach: Isotopic Tracer Techniques and Numerical Modeling. Tuscaloosa: University of Alabama Libraries.
Enwright, N. M., Borchert, S. M., Day, R. H., Feher, L. C., Osland, M. J., and Wang, L. et al. (2017). Barrier island habitat map and vegetation surveyDauphin Island. Alabama 2015, 2331–1258.
Evans, T. B., and Wilson, A. M. (2017). Submarine groundwater discharge and solute transport under a transgressive barrier island. J. Hydrol. 547, 97–110. doi: 10.1016/j.jhydrol.2017.01.028
Garcia-Orellana, J., Rodellas, V., Tamborski, J., Diego-Feliu, M., and van Beek, P. (2021). Radium isotopes as submarine groundwater discharge (SGD) tracers: review and recommendations. Earth Sci. Rev. 2021:103681. doi: 10.1016/j.earscirev.2021.103681
Geibert, W., Rodellas, V., Annett, A., Van Beek, P., Garcia-Orellana, J., Hsieh, Y. T., et al. (2013). 226Ra determination via the rate of 222Rn ingrowth with the radium delayed coincidence counter (RaDeCC). Limnol. Oceanogr. Methods 11, 594–603. doi: 10.4319/lom.2013.11.594
Hofmann, H., Newborn, D., Cartwright, I., Cendón, D. I., and Raiber, M. (2020). Groundwater mean residence times of a subtropical barrier sand island. Hydrol. Earth Syst. Sci. 24, 1293–1318. doi: 10.5194/hess-24-1293-2020
Hu, C., Muller-Karger, F. E., and Swarzenski, P. W. (2006). Hurricanes, submarine groundwater discharge, and Florida’s red tides. Geophys. Res. Lett. 33:L11601. doi: 10.1029/2005GL025449
Hwang, D.-W., Kim, G., Lee, W.-C., and Oh, H.-T. (2010). The role of submarine groundwater discharge (SGD) in nutrient budgets of Gamak Bay, a shellfish farming bay, in Korea. J. Sea Res. 64, 224–230. doi: 10.1016/j.seares.2010.02.006
Justiæ, D., Rabalais, N. N., and Turner, R. E. (1996). Effects of climate change on hypoxia in coastal waters: a doubled CO2 scenario for the northern Gulf of Mexico. Limnol. Oceanogr. 41, 992–1003. doi: 10.4319/lo.1996.41.5.0992
Kidd, R. E. (1988). Hydrogeology and Water-Supply Potential of the Water-Table Aquifer on Dauphin Island. Alabama: Geological Survey.
Kim, G., and Hwang, D. W. (2002). Tidal pumping of groundwater into the coastal ocean revealed from submarine 222Rn and CH4 monitoring. Geophys. Res. Lett. 29, 23-1-23-4.
Kim, J., and Kim, G. (2017). Inputs of humic fluorescent dissolved organic matter via submarine groundwater discharge to coastal waters off a volcanic island (Jeju, Korea). Sci. Rep. 7, 1–9.
Laurent, A., Fennel, K., Ko, D. S., and Lehrter, J. (2018). Climate change projected to exacerbate impacts of coastal eutrophication in the northern Gulf of Mexico. J. Geophys. Res. Oceans 123, 3408–3426. doi: 10.1002/2017jc013583
Leatherman, S. P., and Beller-Simms, N. (1997). Sea-level rise and small island states: an overview. J. Coastal Res. 24, 1–16. doi: 10.9734/ajee/2018/41019
Lee, Y.-W., and Kim, G. (2007). Linking groundwater-borne nutrients and dinoflagellate red-tide outbreaks in the southern sea of Korea using a Ra tracer. Estuarine Coastal Shelf Sci. 71, 309–317. doi: 10.1016/j.ecss.2006.08.004
Lee, Y.-W., Kim, G., Lim, W.-A., and Hwang, D.-W. (2010). A relationship between submarine groundwater borne nutrients traced by Ra isotopes and the intensity of dinoflagellate red-tides occurring in the southern sea of Korea. Limnol. Oceanogr. 55, 1–10. doi: 10.4319/lo.2010.55.1.0001
Luttrell, G. L., Hubert, M. L., and Murdock, C. R. (1991). Lexicon of New Formal Geologic Names of the United States 1981-1985. Washington: US Geological Survey.
Mack, A. L. (2016). New Owners Re-Open Once Popular Isle Dauphine Golf Course on Dauphin Island, Al.Com. Birmingham: AL.com. Available online at: https://www.al.com/sports/2016/10/new_owners_re-open_once_popula.html
Manda, A. K., Sisco, M. S., Mallinson, D. J., and Griffin, M. T. (2015). Relative role and extent of marine and groundwater inundation on a dune-dominated barrier island under sea-level rise scenarios. Hydrol. Proc. 29, 1894–1904. doi: 10.1002/hyp.10303
Masterson, J. P., Fienen, M. N., Thieler, E. R., Gesch, D. B., Gutierrez, B. T., and Plant, N. G. (2014). Effects of sea-level rise on barrier island groundwater system dynamics–ecohydrological implications. Ecohydrology 7, 1064–1071. doi: 10.1002/eco.1442
Mobile Bay National Estuary Program (2021). Dauphin Island Watershed, Mobile Bay National Estuary Program, Mobile, AL. Available online at: https://www.mobilebaynep.com/watersheds/dauphin-island-watershed/the-landscape
Montiel, D., Lamore, A. F., Stewart, J., Lambert, W. J., Honeck, J., Lu, Y., et al. (2019b). Natural groundwater nutrient fluxes exceed anthropogenic inputs in an ecologically impacted estuary: lessons learned from Mobile Bay. Alabama. Biogeochemistry 145, 1–33. doi: 10.1007/s10533-019-00587-0
Montiel, D., Lamore, A., Stewart, J., and Dimova, N. (2019a). Is submarine groundwater discharge (SGD) important for the historical fish kills and harmful algal bloom events of Mobile Bay? Estuaries Coasts 42, 470–493. doi: 10.1007/s12237-018-0485-5
Moore, W. S. (1996). Large groundwater inputs to coastal waters revealed by 226Ra enrichments. Nature 380, 612–614. doi: 10.1038/380612a0
Moore, W. S. (2000). Ages of continental shelf waters determined from 223Ra and 224Ra. J. Geophys. Res. Oceans 105, 22117–22122. doi: 10.1029/1999jc000289
Moore, W. S. (2003). Sources and fluxes of submarine groundwater discharge delineated by radium isotopes. Biogeochemistry 66, 75–93. doi: 10.1023/b:biog.0000006065.77764.a0
Moore, W. S. (2010). The effect of submarine groundwater discharge on the ocean. Ann. Rev. Mari. Sci. 2, 59–88.
Moore, W. S., and Arnold, R. (1996). Measurement of 223Ra and 224Ra in coastal waters using a delayed coincidence counter. J. Geophys. Res. Oceans 101, 1321–1329. doi: 10.1029/95jc03139
Mortazavi, B., Riggs, A. A., Caffrey, J. M., Genet, H., and Phipps, S. W. (2012). The contribution of benthic nutrient regeneration to primary production in a shallow eutrophic estuary, Weeks Bay, Alabama. Estuaries Coasts 35, 862–877. doi: 10.1007/s12237-012-9478-y
Nikpeyman, Y., Hosono, T., Ono, M., Yang, H., Ichiyanagi, K., Shimada, J., et al. (2019). Sea surficial waves as a driving force that enhances the fresh shallow coastal groundwater flux into the oceans. Environ. Earth Sci. 78, 1–9.
NOAA (2021). Daily Summaries Station Details Dauphin Island No 2, AL US, 2014. Dauphin Island: Oceanic and Atmospheric Administration (NOAA). Available online at: https://www.ncdc.noaa.gov/cdo-web/datasets/GHCND/stations/GHCND:USC00012172/detail
Noble, M. A., Schroeder, W. W., Wiseman, W. J. Jr., Ryan, H. F., and Gelfenbaum, G. (1996). Subtidal circulation patterns in a shallow, highly stratified estuary: Mobile Bay, Alabama. J.Geophys. Res. Oceans 101, 25689–25703. doi: 10.1029/96jc02506
Paytan, A., Shellenbarger, G. G., Street, J. H., Gonneea, M. E., Davis, K., Young, M. B., et al. (2006). Submarine groundwater discharge: an important source of new inorganic nitrogen to coral reef ecosystems. Limnol. Oceanogr. 51, 343–348. doi: 10.4319/lo.2006.51.1.0343
Plutchak, R., Major, K., Cebrian, J., Foster, C. D., Miller, M. E. C., Anton, A., et al. (2010). Impacts of oyster reef restoration on primary productivity and nutrient dynamics in tidal creeks of the north central gulf of mexico. Estuaries Coasts 33, 1355–1364. doi: 10.1007/s12237-010-9327-9
R Core Team (2020). R: A Language and Environment for Statistical Computing. Vienna: R Foundation for Statistical Computing.
Rapaglia, J., Sipio, E. D., Bokuniewicz, H., Zuppi, G. M., Zaggia, L., Galgaro, A., et al. (2010). Groundwater connections under a barrier beach: a case study in the Venice Lagoon. Continental Shelf Res. 30, 119–126. doi: 10.1016/j.csr.2009.10.001
Rodellas, V., Garcia-Orellana, J., Tovar-Sanchez, A., Basterretxea, G., Lopez-Garcia, J. M., Sánchez-Quiles, D., et al. (2014). Submarine groundwater discharge as a source of nutrients and trace metals in a Mediterranean bay (Palma Beach, Balearic Islands). Marine Chem. 160, 56–66. doi: 10.1016/j.marchem.2014.01.007
Röper, T., Kröger, K. F., Meyer, H., Sültenfuss, J., Greskowiak, J., and Massmann, G. (2012). Groundwater ages, recharge conditions and hydrochemical evolution of a barrier island freshwater lens (Spiekeroog, Northern Germany). J. Hydrol. 454, 173–186. doi: 10.1016/j.jhydrol.2012.06.011
Santos, I. R., Dimova, N., Peterson, R. N., Mwashote, B., Chanton, J., and Burnett, W. C. (2009). Extended time series measurements of submarine groundwater discharge tracers (222Rn and CH4) at a coastal site in Florida. Marine Chem. 113, 137–147. doi: 10.1016/j.marchem.2009.01.009
Santos, I. R., Chen, X., Lecher, A. L., Sawyer, A. H., Moosdorf, N., Rodellas, V., et al. (2021). Submarine groundwater discharge impacts on coastal nutrient biogeochemistry. Nat. Rev. Earth Environ. 2, 307–323. doi: 10.1038/s43017-021-00152-0
Santos, I. R., Eyre, B. D., and Huettel, M. (2012). The driving forces of porewater and groundwater flow in permeable coastal sediments: a review. Estuarine Coastal Shelf Sci. 98, 1–15. doi: 10.1016/j.ecss.2011.10.024
Schneider, J. C., and Kruse, S. E. (2006). Assessing selected natural and anthropogenic impacts on freshwater lens morphology on small barrier Islands: dog Island and St. George Island, Florida, USA. Hydrogeol. J. 14, 131–145. doi: 10.1007/s10040-005-0442-9
Schutte, C. A., Wilson, A. M., Evans, T., Moore, W. S., and Joye, S. B. (2016). Methanotrophy controls groundwater methane export from a barrier island. Geochim. Et Cosmochimica Acta 179, 242–256. doi: 10.1016/j.gca.2016.01.022
Seibert, S. L., Greskowiak, J., Prommer, H., Böttcher, M. E., and Massmann, G. (2019). Modeling of biogeochemical processes in a barrier island freshwater lens (Spiekeroog, Germany). J. Hydrol. 575, 1133–1144. doi: 10.1016/j.jhydrol.2019.05.094
Silva, K. B., and Mattos, J. B. (2020). A spatial approach for the management of groundwater quality in tourist destinations. Tourism Manage. 79:104079. doi: 10.1016/j.tourman.2020.104079
Slomp, C. P., and Van Cappellen, P. (2004). Nutrient inputs to the coastal ocean through submarine groundwater discharge: controls and potential impact. J. Hydrol. 295, 64–86. doi: 10.1016/j.jhydrol.2004.02.018
Tamborski, J., Cochran, J. K., Bokuniewicz, H., Heilbrun, C., Garcia-Orellana, J., Rodellas, V., et al. (2020). Radium mass balance sensitivity analysis for submarine groundwater discharge estimation in semi-enclosed basins: the case study of Long Island Sound. Front. Environ. Sci. 8:108. doi: 10.3389/fenvs.2020.00108
United States Census Bureau, (2018). Available online at: https://datausa.io/profile/geo/dauphin-island-al
Utom, A. U., Werban, U., Leven, C., Müller, C., Knöller, K., Vogt, C., et al. (2020). Groundwater nitrification and denitrification are not always strictly aerobic and anaerobic processes, respectively: an assessment of dual-nitrate isotopic and chemical evidence in a stratified alluvial aquifer. Biogeochemistry 147, 211–223. doi: 10.1007/s10533-020-00637-y
Wang, H., Gao, J. E., Zhang, M. J., Li, X. H., Zhang, S. L., and Jia, L. Z. (2015). Effects of rainfall intensity on groundwater recharge based on simulated rainfall experiments and a groundwater flow model. Catena 127, 80–91. doi: 10.1016/j.catena.2014.12.014
Wang, P., and Roberts Briggs, T. M. (2015). “Chapter 10 - storm-induced morphology changes along barrier islands and poststorm recovery,” in Coastal and Marine Hazards, Risks, and Disasters, eds J. F. Shroder, J. T. Ellis, and D. J. Sherman (Boston: Elsevier), 271–306. doi: 10.1016/b978-0-12-396483-0.00010-8
Keywords: barrier island, submarine groundwater discharge, nutrient, storm, hydrological response, radon, radium, northern Gulf of Mexico
Citation: Adyasari D, Montiel D, Mortazavi B and Dimova N (2021) Storm-Driven Fresh Submarine Groundwater Discharge and Nutrient Fluxes From a Barrier Island. Front. Mar. Sci. 8:679010. doi: 10.3389/fmars.2021.679010
Received: 10 March 2021; Accepted: 14 June 2021;
Published: 27 July 2021.
Edited by:
Juan Jose Munoz-Perez, University of Cádiz, SpainReviewed by:
Jianan Liu, East China Normal University, ChinaYaser Nikpeyman, Shahid Beheshti University, Iran
Copyright © 2021 Adyasari, Montiel, Mortazavi and Dimova. This is an open-access article distributed under the terms of the Creative Commons Attribution License (CC BY). The use, distribution or reproduction in other forums is permitted, provided the original author(s) and the copyright owner(s) are credited and that the original publication in this journal is cited, in accordance with accepted academic practice. No use, distribution or reproduction is permitted which does not comply with these terms.
*Correspondence: Dini Adyasari, ZGFkeWFzYXJpQHVhLmVkdQ==