 Steve Whalan
 Marji Puotinen
 Mary Wakeford
 Iain Parnum
 Karen Miller
- 1Australian Institute of Marine Science, Indian Ocean Marine Research Centre, Crawley, WA, Australia
- 2School of Environment, Science and Engineering, Southern Cross University, Lismore, NSW, Australia
- 3Centre for Marine Science and Technology, Curtin University, Bentley, WA, Australia
The silver-lipped pearl oyster, Pinctada maxima, is the primary species used for the culture of pearls in the Indo-Pacific region. The Western Australian fishery relies on wild-caught animals, and as such, knowledge of the status and distribution of P. maxima underpins sustainable management of the fishery. Eighty Mile Beach, in tropical Western Australia, is the key harvest area for P. maxima, with oysters collected by divers to depths of ∼35 m, although there are anecdotal accounts of oysters beyond diving depths. Image-based, and acoustic methods were used to elucidate distribution patterns of P. maxima off Eighty Mile Beach, including data from 862 km2 of multibeam survey and 119 towed video transects spanning an area from the 20 to 100 m contour lines. We quantified habitat characters including depth, substrate, and benthic community composition associated with pearl oyster distribution. Multibeam sonar data was also coupled with towed video data to produce predictive statistical models of P. maxima habitat. We found P. maxima to depths of 76 m, although more than 90% of individuals occurred shallower than 40 m and less than 2% were found deeper than 50 m. Oysters occupied flat, sandy habitats with neighbouring benthic communities of filter feeders (>98% of observations). These results show P. maxima predominantly occurs in depths <40 m, with no evidence that extensive populations extend into deep water in the region.
Introduction
Distribution patterns of organisms are regulated through a range of ecological processes, including dispersal and recruitment (Marshall et al., 2010). Dispersal for sessile marine invertebrates hinges on the nature of a species larval phase. For example, sessile adults may produce broadcast spawned gametes that disperse while they fertilise and develop within the water column, or alternatively release developed larvae that have the potential to settle quickly (Thorson, 1950). The final phase of the larval cycle – larval settlement and recruitment behaviours – are particularly important to interpretations of the spatial distribution of populations (Jenkins, 2005; Marshall et al., 2010).
The Silver Lipped Oyster, Pinctada maxima, exhibits a complex life cycle; adults broadcast spawn gametes which develop to larvae within the plankton. Larvae have a pre-competency period of 3–4 weeks before they attach to hard substrate with byssal threads (Rose and Baker, 1994). Physical habitat (micro scale surface topography) plays a role in successful larval settlement for P. maxima, as the oyster produces byssal threads that attach the body/shell to benthic substrate, highlighting the importance of hard substrate for larval settlement (Taylor et al., 1998). Substrate related cues of microorganism biofilms and neurotransmitter compounds are also implicated in the settlement of P. maxima larvae (Taylor et al., 1998; Zhao et al., 2003). The specificity and role of environmental-signalling settlement cues to marine invertebrate larvae, including P. maxima, indicates the importance of phenotype-environment matches for larval recruitment and the concomitant downstream effect on distribution patterns in sessile invertebrates (Marshall et al., 2010).
Despite this need for attachment to hard substrate, P. maxima has been reported to occur on a variety of substrata, including unconsolidated sediment (Wada and Temkin, 2008). However, soft sediment habitats in which P. maxima have been observed, may comprise a veneer of sediment over consolidated seabed structure that was presumably exposed at the time of settlement (Department of Fisheries., 2016). The requirement of hard substrate for P. maxima recruitment is also evidenced with attachment to conspecific P. maxima shells, fragments of broken shells, or rubble (Joll, 1996; Hart and Joll, 2006). As a result, recruitment to these smaller unconsolidated fragments, including adult oyster shells, may also contribute to scattered distribution patterns in soft sediment habitats.
Pinctada maxima occurs throughout the Indo West Pacific, including the region offshore from Eighty Mile Beach, Western Australia and contributes to an important fishery (Hart and Friedman, 2004). The fishery there is regulated, but resource management and conservation of wild stocks would benefit from additional knowledge of patterns of distribution and abundance. P. maxima has been reported in depths between 5 and 40 m in the Eighty Mile Beach region, which is coincident with the depth range of the fishery (Gervis and Sims, 1992; Hart and Friedman, 2004; Department of Fisheries., 2016). Notably, P. maxima has been reported to depths of 120 m in parts of its range (reviewed in Wada and Temkin, 2008), and there has been suggestion that deep (>40 m) populations may occur in Western Australia. Within the region of Eighty Mile Beach, the presence of P. maxima in depths beyond safe diving limits of ∼35 m represents a knowledge gap (Joll, 1996), which potentially impedes optimal utilisation and conservation of the resource.
The objectives of this study were two-fold. First was to investigate patterns in the distribution and abundance of P. maxima, based on towed video imagery undertaken across a range of depth and benthic habitats, focussing on areas beyond diving depths. Second was to use statistical modelling to identify which combination of habitat-related factors (e.g., depth, substrate and neighbouring epibenthos) derived from multibeam sonar, backscatter data and towed video imagery, best explain the observed distribution of P. maxima offshore from Eighty Mile Beach.
Materials and Methods
Study Location
Eighty Mile Beach is located on the north western coastline of Western Australia (Figure 1). The waters adjacent to Eighty Mile Beach form part of the Western Australian P. maxima fishery and within this region P. maxima is hand-harvested by divers from depths up to 35 m. Three separate voyages were undertaken on the Australian Institute of Marine Science’s Research Vessel, Solander (Trip 1: 23rd April -6th May 2018; Trip 2: 13th – 20th March 2019; and Trip 3: 11th- 19th May 2019) to survey an area of approximately two million hectares spanning the 20–100 m contours and located directly offshore from areas where the commercial oyster fishery operates. During these field trips, 119 towed video transects to depths of 134 m were undertaken, 35 benthic sleds were deployed, 85 sediment grab samples collected, and approximately 5,000 km (862 km2) of multibeam bathymetry collected (Figure 1).
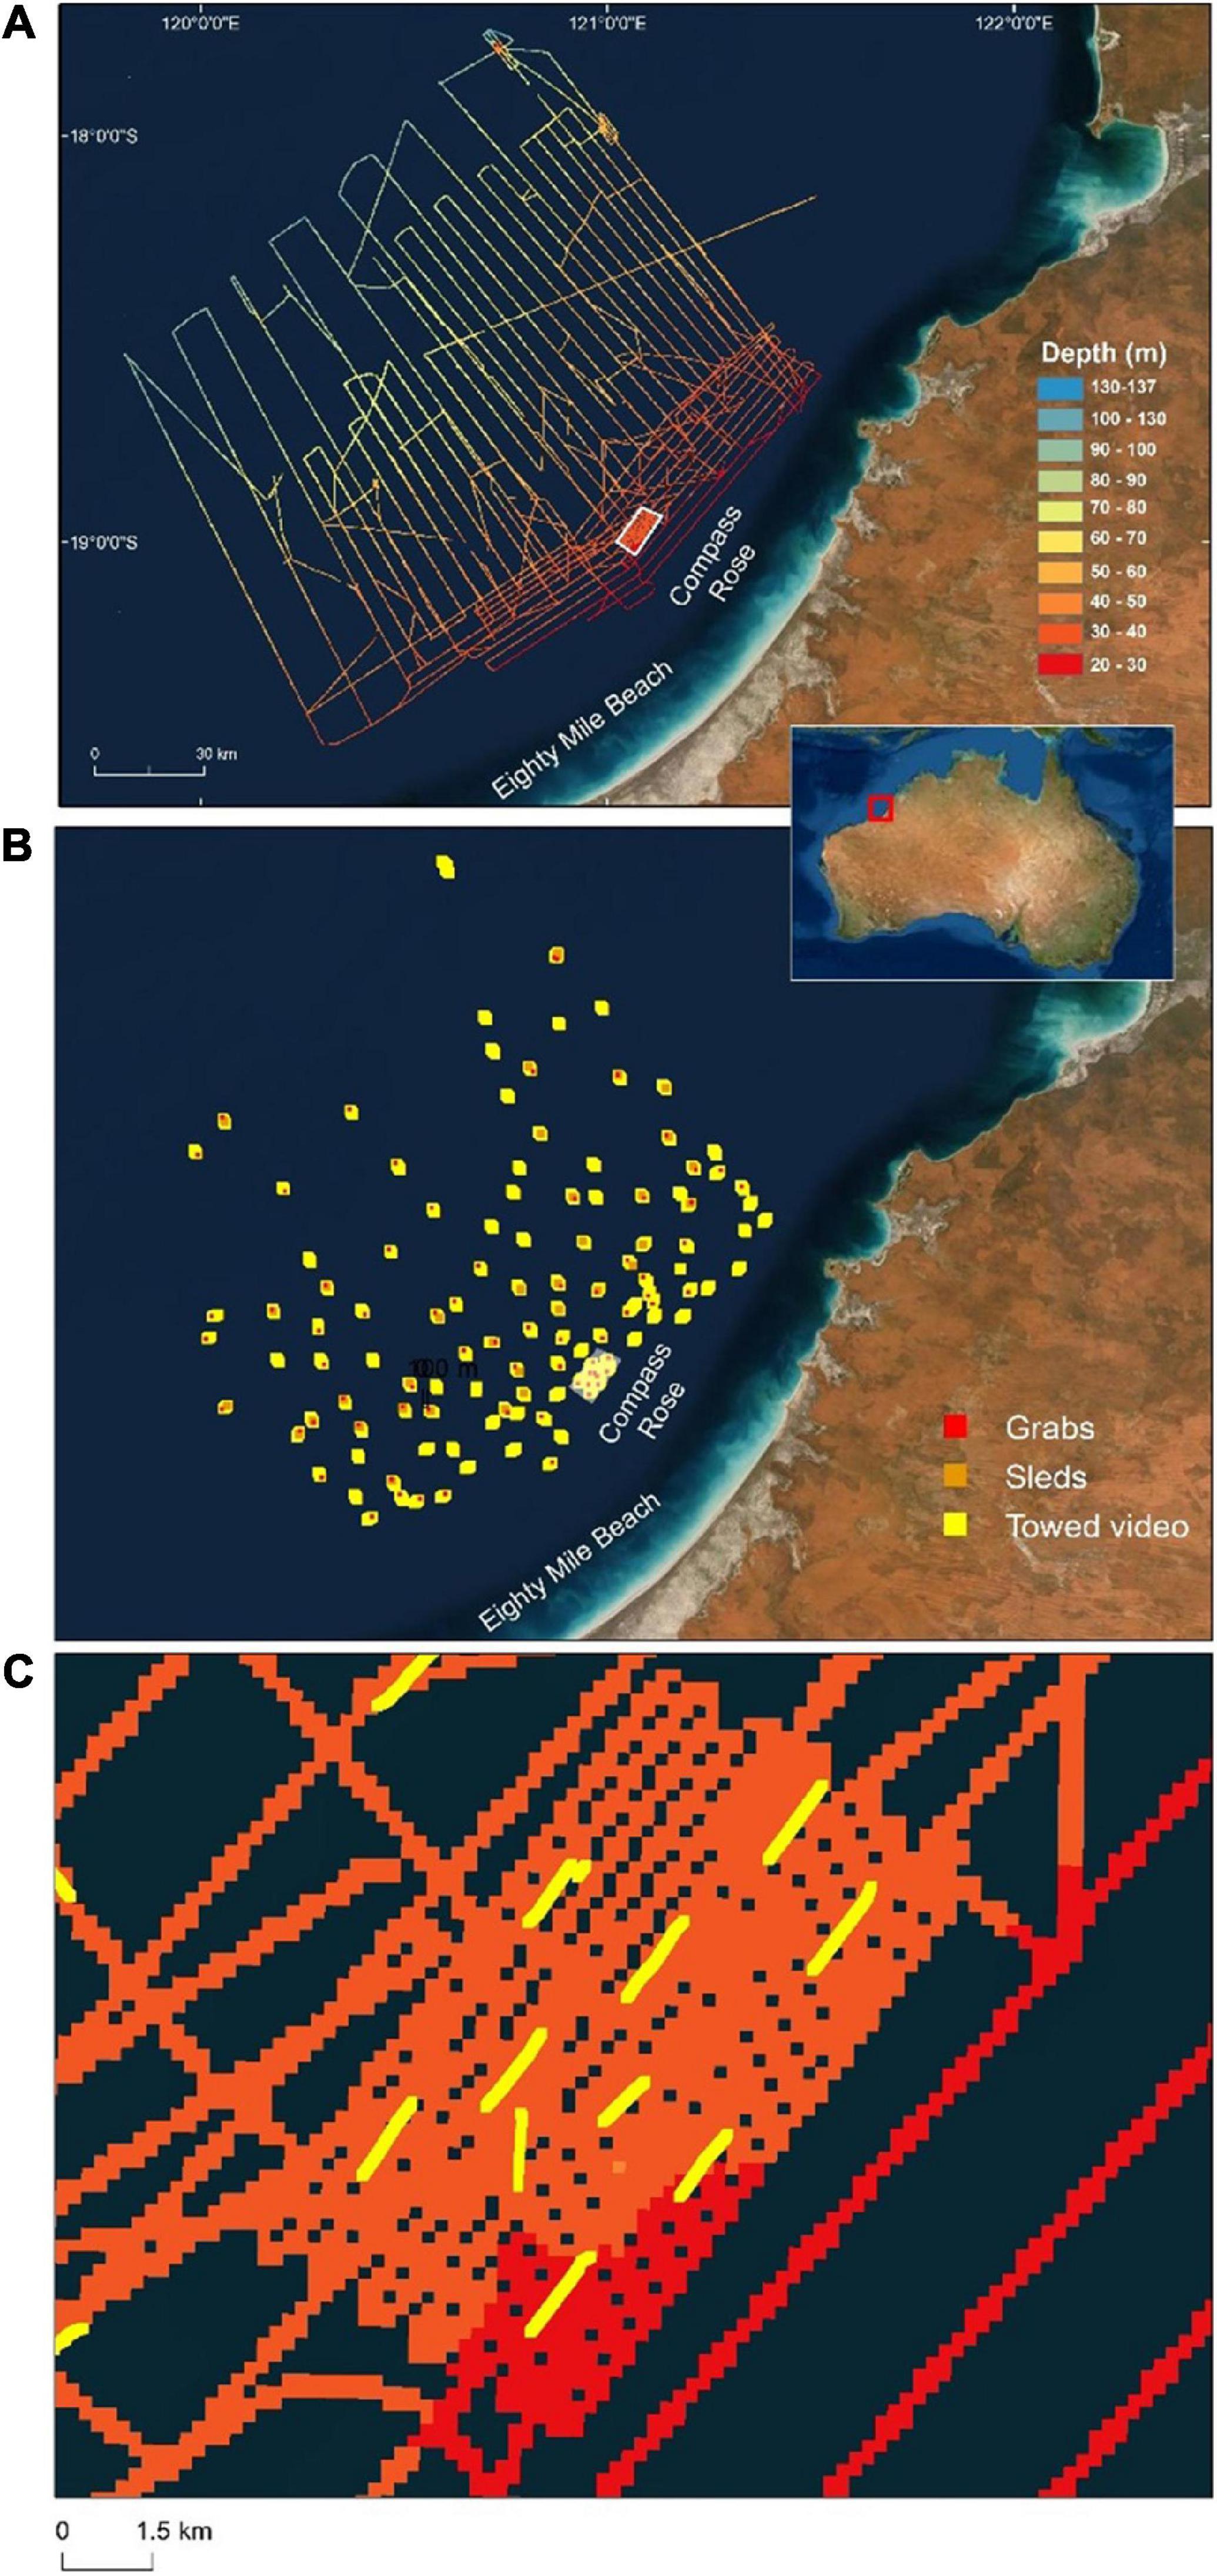
Figure 1. Study area offshore from Eighty Mile Beach showing (A) ships track shaded by depth (from multibeam sonar), (B) locations of all sampling by towed video (n = 119), benthic sled (n = 35) and sediment grab (n = 85), and (C) close-up view of the Compass Rose area with depth (colour shading) and towed video tracks (yellow lines). Basemaps sourced from ESRI, DigitalGlobe, GeoEye, Earthstar Geographics, CNES/Airbus DS, USDA, USGS, AeroGRID, IGN and the GIS User Community.
Multibeam Surveys of the Seabed
Physical characteristics of the seabed offshore from Eighty Mile Beach were examined using a Multibeam Echo Sounder (multibeam). Multibeam bathymetry and backscatter data was collected using an R2Sonic 2026 or 2024 multibeam echo-sounder, an Applanix POS MV to establish position and attitude data, an AML sound velocity sensor at the multibeam head and an AML Minos X sound velocity profiler. Multibeam and ancillary data were collected in QPS QINSy. The survey area was too large to map continuous coverage of the seafloor to depths of ∼100 m with the amount of ship time available. As a result, multibeam lines were not overlapping, rather they were spread across the survey area enabling exploration across an extensive area and wide depth range offshore from the shallow oyster fishing grounds. Multibeam lines were more closely spaced in one location where oysters are common and regularly harvested in ∼35 m depth (Compass Rose, Figure 1). This was to provide detailed data in a known pearl oyster habitat, and to provide context for the new areas explored.
Multibeam data were processed with QIMERA (version 2), using a horizontal datum of MGA51 and vertical datum of Australian Height Datum (AusGeoid 09). On the first two trips, multibeam backscatter data was collected with the R2Sonic 2026 at 100, 200, and 400 kHz. On the third trip, multibeam backscatter data was collected with the R2Sonic 2024 at 200 and 400 kHz (100 kHz was not available on that system). Backscatter was processed in MATLAB following the protocols details in by Schimel et al. (2018) and implemented as in Parnum and Gavrilov (2011a, b). The backscatter data were corrected for system parameters, and surface scattering coefficient was calculated using the mean of the beam time series data ± 5 dB from detection sample. The angular dependence of the processed backscatter was normalised by calculating the z-score for each angular degree. This angular normalisation procedure involved binning data into one degree bins from −60° (port) to + 60° (starboard), and subtracting the mean and then dividing by the standard deviation for each degree bin, meaning the data are in units of standard deviation (SD). Only normalised backscatter between 30° and 60° (port and starboard) were used in the final grids, as data outside of this region were not found to be useful and/or normalised adequately. Figure 2 shows 100 kHz backscatter data gridded to 10 m: before (a) and after (b) the angular normalisation procedure from an area where video tows detected P. maxima. Figure 2C shows the mean across track backscatter data before and after angular normalisation procedure, for an area where P. maxima were detected (Box A) and a nearby area from the same transect where they were not detected (Box B). Although depth data was used from all three surveys, backscatter data was only used from the first two surveys where the same system was used. This was mainly as 100 kHz backscatter was found to be the most useful indicator of P. maxima, and this frequency was not available on the third survey. Attempts to incorporate the backscatter collected at 200 and 400 kHz from the third survey with that of the first two surveys were not successful.
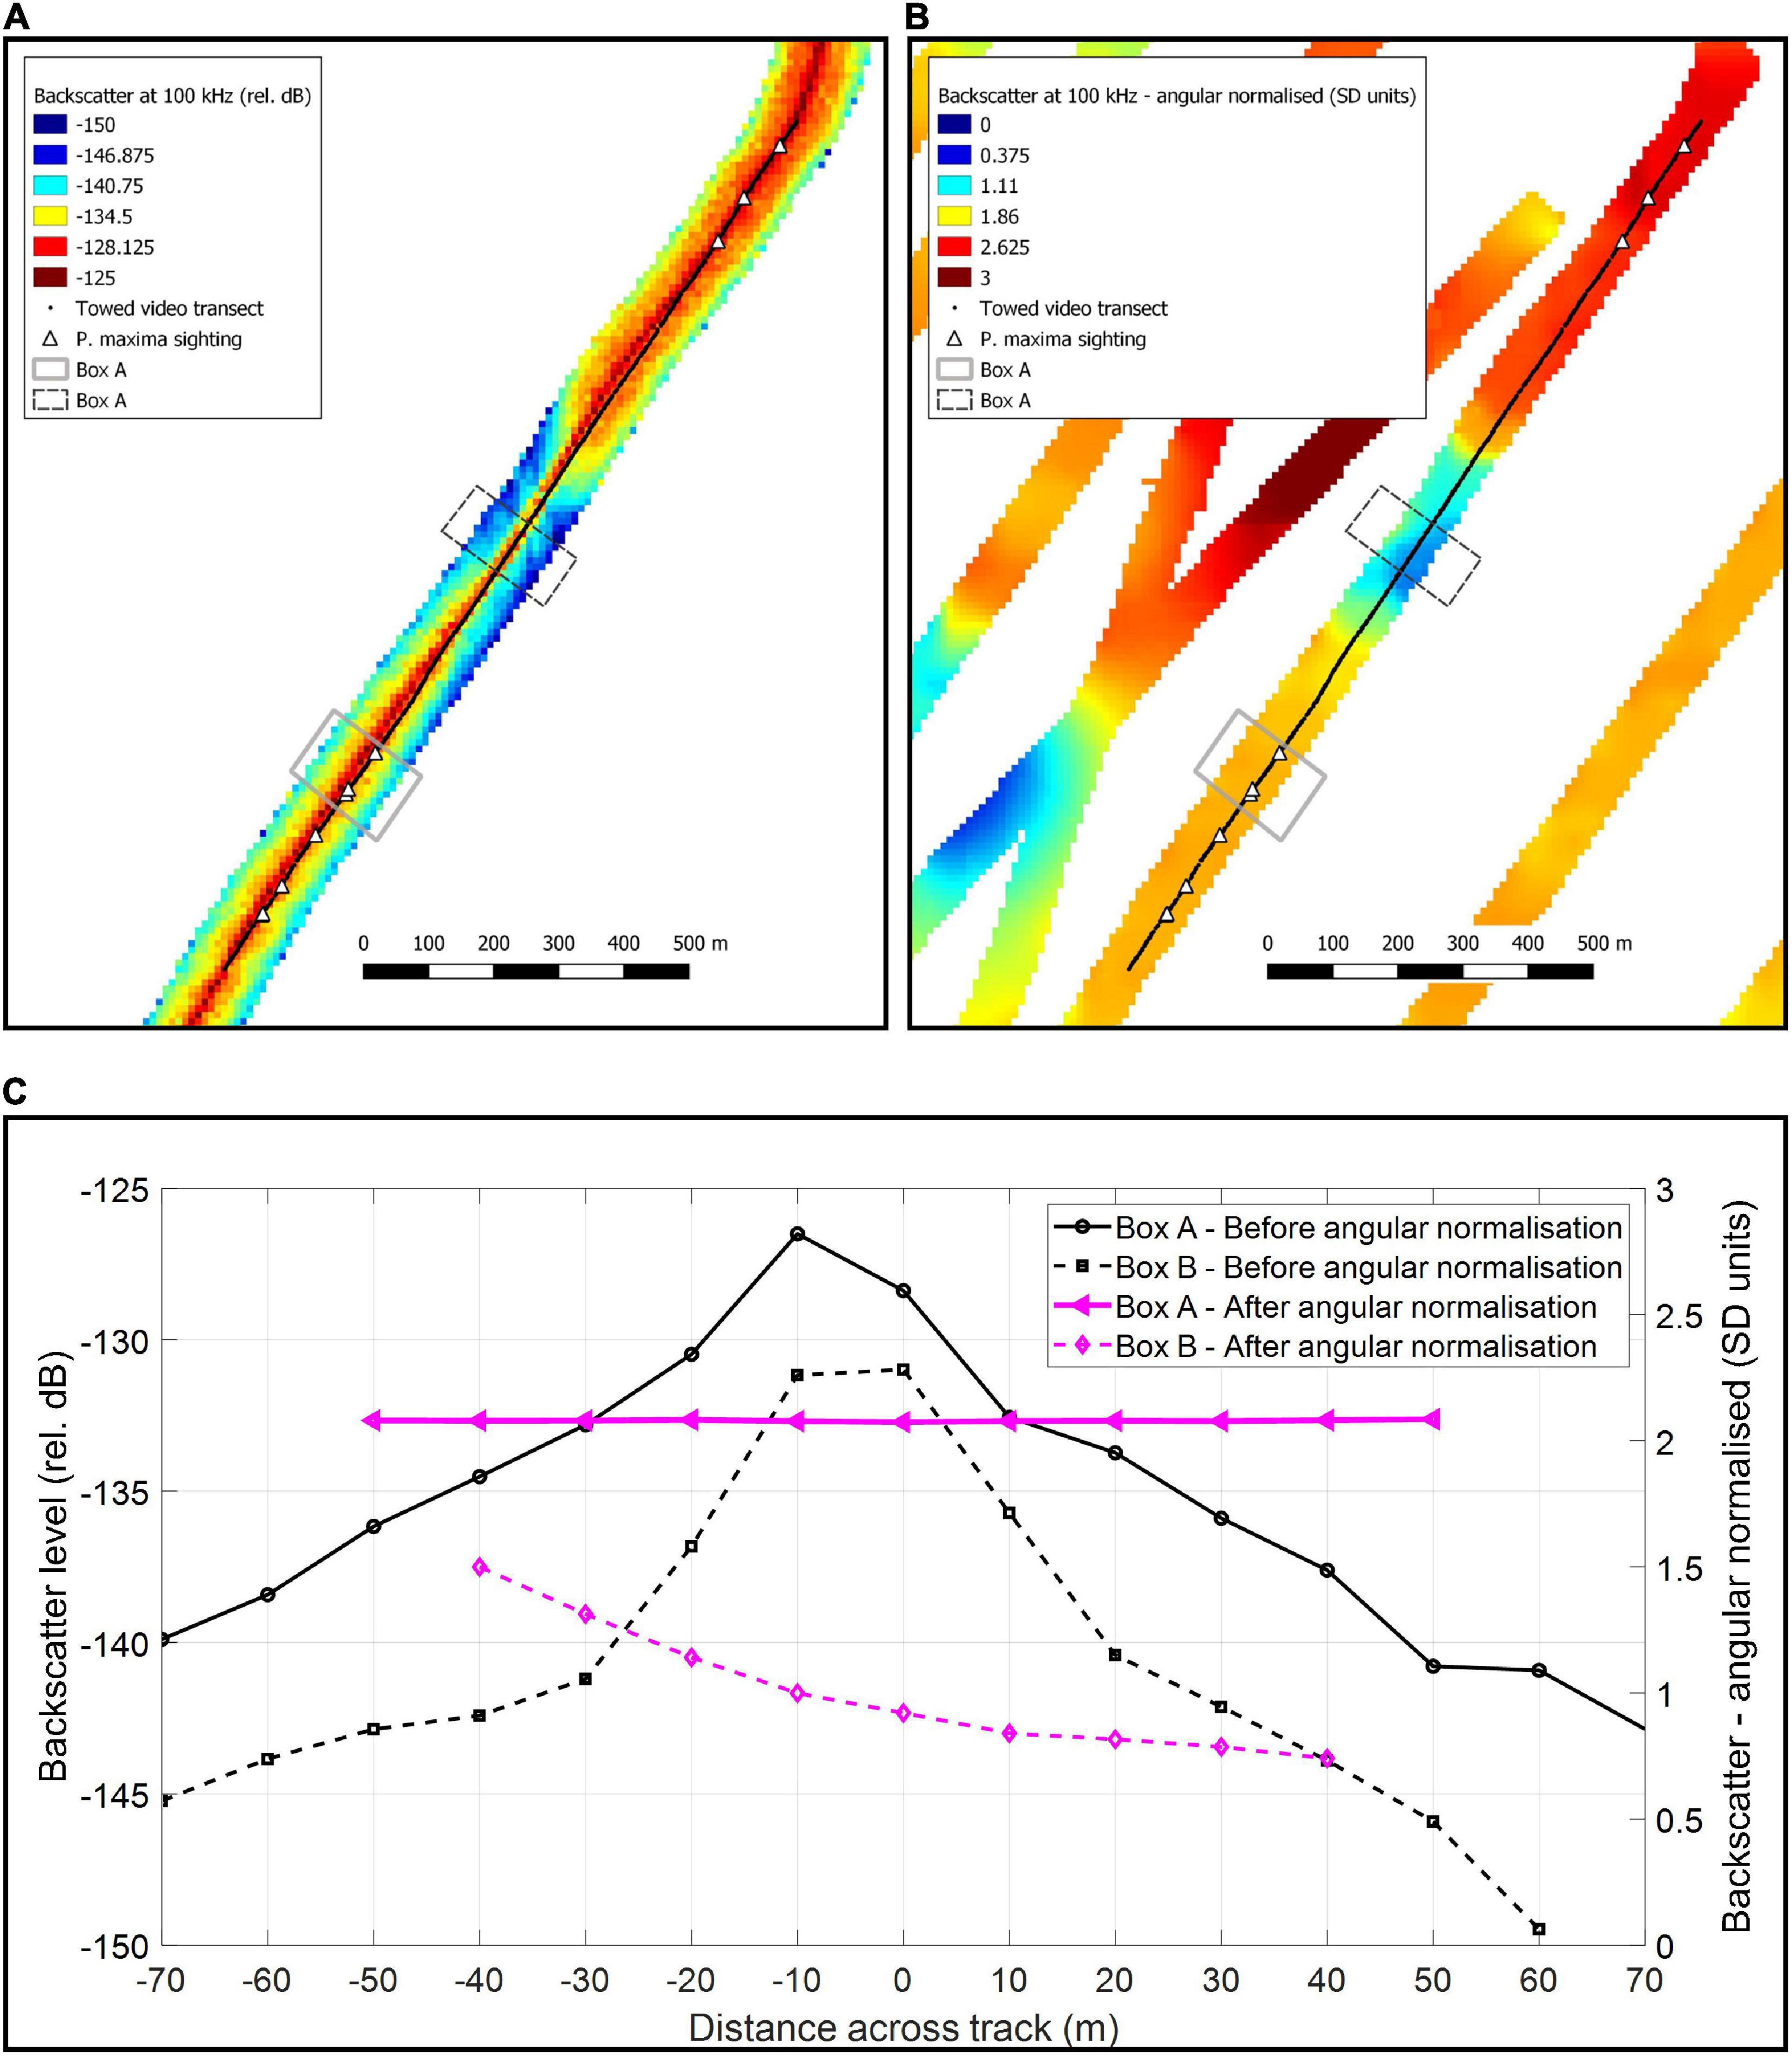
Figure 2. Multibeam backscatter at 100 kHz gridded to 10 m and a towed video transect showing detections of Pinctada maxima, where: (A) is before and (B) after the angular normalisation has been applied to the backscatter data, and (C) the mean across-track backscatter from Boxes (A,B).
Data from the multibeam surveys were used to create high resolution maps of seabed bathymetry and relative backscatter strength as a gross measure of seabed type within the multibeam swathes. Observations from towed video and sediment analysis from grab samples (see below) was used to supplement the multibeam data by providing a “ground-truthing” of backscatter data with observed seabed types; thereby allowing mapping of inferred seabed characteristics.
Sediment Sampling
Sediment samples were taken (n = 85) using a Smith-McIntyre grab. Samples were collected from a sub-set of the towed video transect sites to cover a representative spread of depths (range 31–102 m; Figure 1) and seabed morphologies/hardness (as inferred from multibeam data). Samples were submitted to the Geoscience Australia sedimentology laboratory for measurement of gravel, sand and mud content by wet sieve separation and of particle size distributions of the clay to sand fraction by laser diffraction using a Malvern Mastersizer 2000 particle size analyser. Sample pre-treatment included digestion of organic material by hydrogen peroxide and disaggregation using calgon (sodium hexametaphosphate). Summary statistics from laser analysis include mean, median, standard deviation, skewness and kurtosis indices. Separate sample splits were used for measurement of carbonate content using the carbonate digestion method (Müller and Gastner, 1971).
Towed Video Surveys of Oysters and Associated Benthos
Towed video was used to determine the presence and relative abundance of P. maxima on the sea floor, and to quantify associated benthic community composition. A total of 119 towed video transects was conducted across the study site and incorporating a depth range of 11–132 m. Towed video transects (Figure 1) were chosen to represent a range of depths and distance from shore, as well as to sample across the full range of inferred seabed hardness and morphologies present in the region (as determine from multibeam and backscatter data).
Towed video was deployed from the RV Solander. Transects were ∼1.5 km in length and towed at ∼1.5 knots with the tow body maintained at a height of ∼50 cm above the seabed via a controlled speed winch on deck (Carroll et al., 2018). Imagery was collected in the form of a forward-facing video (which has a wide view of the sea floor) and a downward facing digital stills camera (Lumix DMC-LX100 which takes high-resolution images with a field of view between ∼ 0.1 and 0.25 m2). All imagery was georeferenced with post-processed latitude and longitude from Ultra-short Baseline (USBL) acoustic positioning. Depth was determined from post-processed multibeam data.
Position and orientation data for the USBL Transceiver were acquired by an Applanix PosMV OceanMaster with satellite aiding via Fugro Marinestar G4+, which provides high accuracy real-time position (of better than 15 cm vertical and 10 cm horizontal in real-time) and orientation at 200 Hz. This position and orientation information was used in real-time by the USBL system for time-stamping and pitch and roll compensation, in the acquisition software for real-time generation of beacon position (1119T omni directional ± 90° mini beacon) as well as being logged for post-processing the beacon locations after the completion of the survey.
Forward facing video was observed in real-time to record the presence/absence of P. maxima on the seabed, along with broad substrate composition and/or relative cover of epibenthic communities (Supplementary Table 1). These observations were recorded every 2 s along the transect, with an average of 710 observations recorded per transect. High resolution digital still images were taken every 5 s, equating to approximately every 3.5 – 4 m. along the transect. Still images were analysed using a five-point intercept method to identify the benthos underlying each point (substate and biota) following Jonker et al. (2008). The benthic group Microbenthos comprised points of uncertain abiotic/biotic identity (fine detrital material or small clumps on soft sediment; short branching to mat-like coverings on sand/gravel/rubble). Initially, still images were run through an automated classification software (Benthobox – Heyward et al., 2017) to efficiently separate out images comprised of entirely bare substrate (i.e., sand and/or soft sediment; which was ∼20% of all images), with all points on remaining images classified manually by a benthic ecologist. The Collaborative and Annotation Tools for Analysis of Marine Imagery (CATAMI) classification scheme guided benthic categories (Althaus et al., 2015). Manual classifications were checked by a second benthic ecologist by reviewing the point-scores per category and updating the database where errors were identified.
A total of 44,754 digital still images from towed video were analysed using a five-point intercept method, providing 218,726 data points. Pearl oysters were not scored in downward facing still images using this method. Instead, oyster numbers per transect were based on observations from the forward-facing video. Multivariate analyses were then used to examine relationships between P. maxima abundance along the transect and benthic community composition using PRIMER 7 (Clarke and Gorley, 2008). Percent cover data of benthic groups (derived from the still image analysis) were square root transformed and Bray-Curtis similarity matrices constructed, prior to Principal Coordinates Analysis (PCoA). Hierarchical cluster analysis on Bray-Curtis similarity matrices (using group average clustering) was combined with a shade plot to provide a visual representation by transect of oyster abundance and benthic composition.
Pearl oysters can often be partially buried in sediment and difficult to see with visual approaches. Therefore, to contribute to the validation of the presence/absence of P. maxima in depths >40 m, we used a benthic sled to sample epibiota on a sub-set of towed video transects, selected to target a range of depths and substrate types across the study area. Each sled sampling event (n = 35, Figure 1) covered ∼200 m of seabed, with catches sorted immediately on the back deck to check for oysters.
Statistical Modelling of Pearl Oyster Habitats
Two statistical models, using the Random Forest (RF) ensemble machine-learning algorithm (Breiman, 2001), were built to investigate the association between physical and biological habitat characteristics and the observed distribution of P. maxima. Random Forest is a commonly used algorithm for spatial modelling (Elith et al., 2006; Elith and Leathwick, 2009) that uses tree-type classifiers and bootstrap aggregation based on subsets of the input data (Breiman, 2001). Linear and complex non-linear models can both be fitted efficiently using RF and without being prone to overfitting and errors due to predictor collinearity and, to a lesser extent, autocorrelation (De’ath and Fabricius, 2000; Davidson et al., 2012) because RF includes the results of multiple trees from bootstrap samples of the training data and reduces bias through random predictor selection (Cutler et al., 2007). The models have high accuracy compared to other comparable methods and provide ecologically interpretable outcomes (Breiman, 2001; Prasad et al., 2006). Models were implemented in Python1.
Forward facing video data from towed video transects, including the presence/absence of P. maxima and classifications of broad substrate composition and epibenthic communities, were used for the statistical modelling. A small number of towed video data points were removed from the analysis because they fell outside the multibeam swath footprint and thus fine-scale depth-related predictors could not be generated for them. The final data set for modelling comprised 80,771 video observations, including 333 records of P. maxima. Because so few oyster observations existed, we did not remove further data in case of autocorrelation.
Oysters were rare across the entire study area, although examination of the towed video data showed oysters were more often associated with sparse filter feeder communities than any other biota type (Table 1). We therefore used a two-step modelling process to first model the presence/absence of sparse filter feeder communities (Figure 3A), then used the outputs from the model of sparse filter feeders (Step 6 in Figure 3A) as a predictor variable in a second model to predict the presence or absence of oysters (step 2 in Figure 3B).
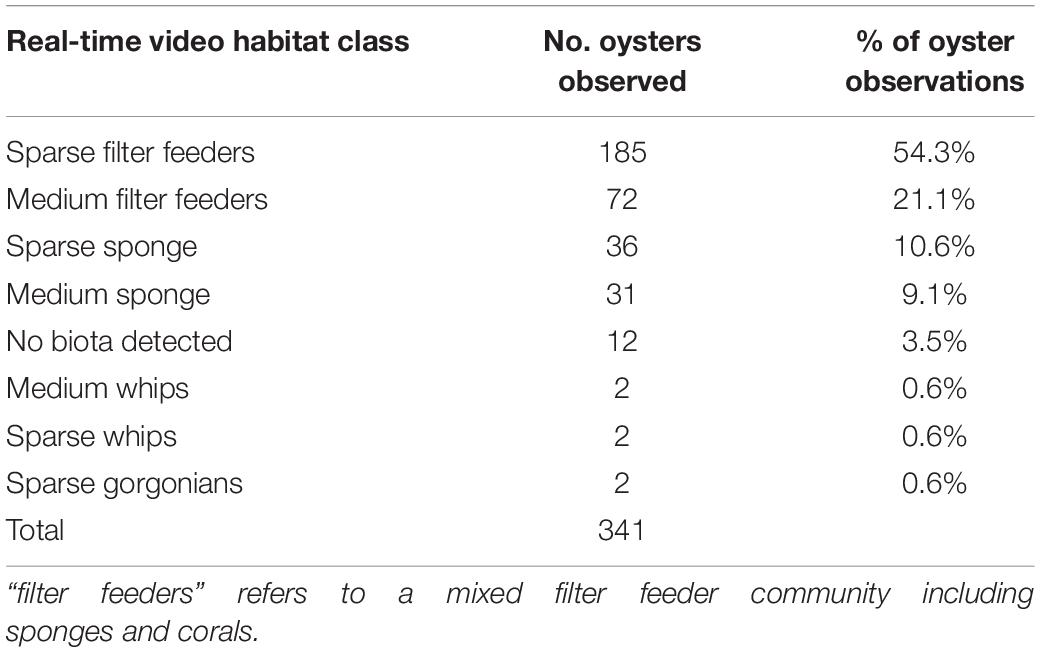
Table 1. Percent of habitat classes observed in the same locations as oysters on real-time towed video transects (including observations that were discarded due to missing bathymetry data).
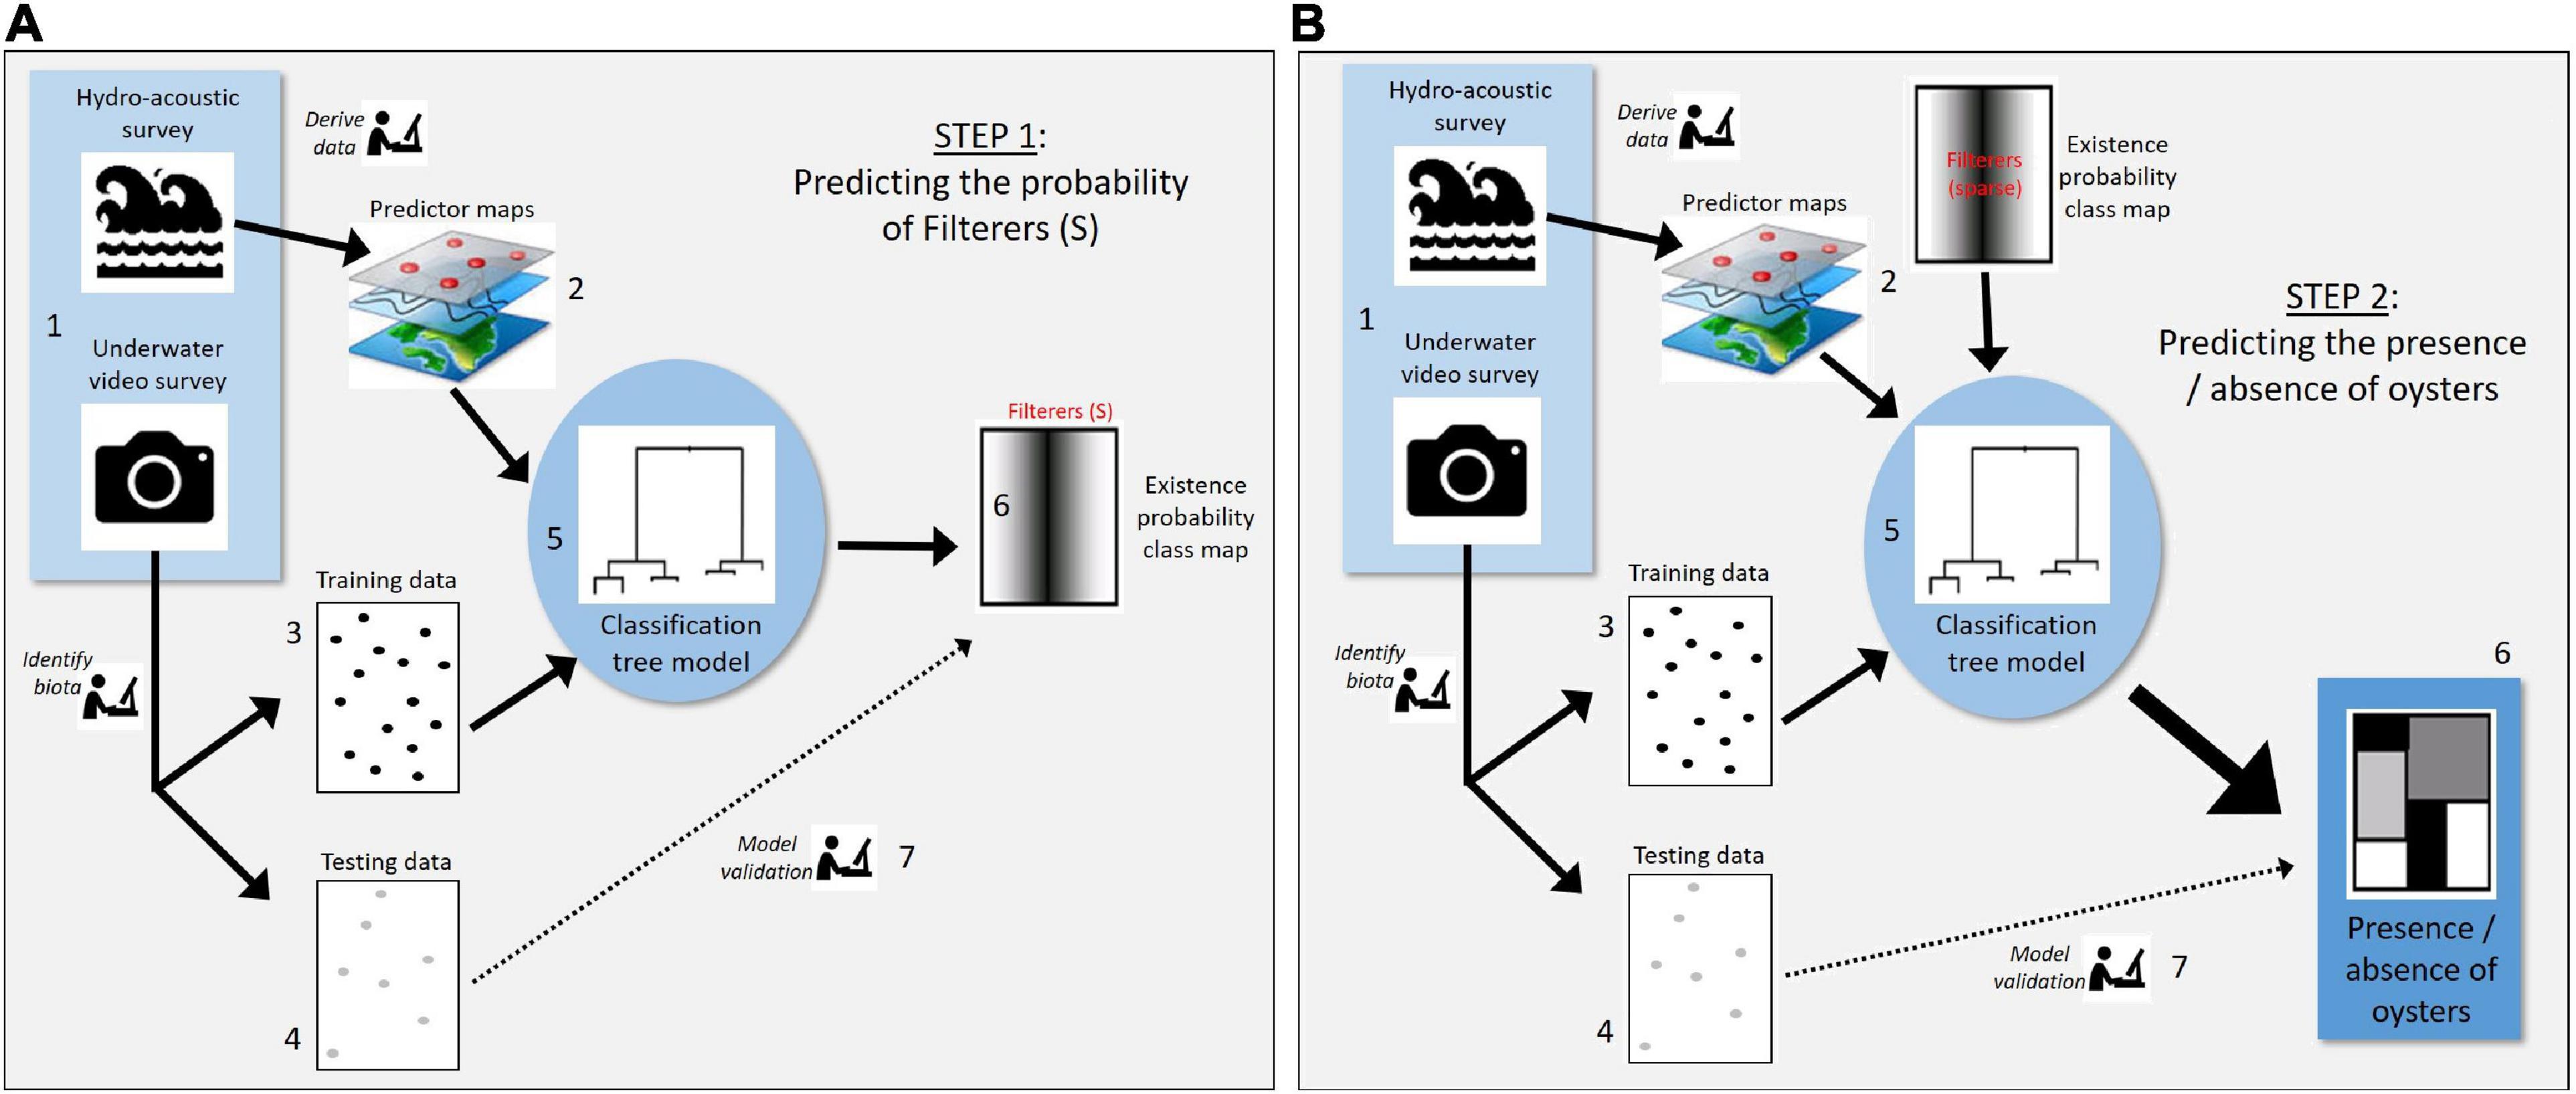
Figure 3. Analysis steps undertaken to: (A) predict the probability of habitat class “sparse filter feeders” which, in our data set, most frequently coincided with the presence of oysters, and (B) predict the presence versus absence of oysters incorporating predictions of sparse filter feeders from the first model. Thus, step 6 from model (A) produces the “Existence probability class map” which feeds into step 2 of model (B) as shown in the figure.
For the first of these models, we predicted the probability of existence of sparse filter feeders within the swath covered by the multibeam data using an RF model (Figure 3A). The presence versus absence of sparse filter feeders, as recorded by real-time towed video, was the dependent variable for the first model. A suite of 27 independent predictor variables were derived from bathymetry at three spatial scales (10 m, 100 m, 250 m; Supplementary Table 2) to examine whether filter feeder response to the bathymetric context varied by scale. The average, standard deviation and range for the variable “depth” were calculated for four spatial windows (5, 10, 25, and 50 pixels wide) for the 250 m data. This was not possible for the 10 and 100 m bathymetry data, as it was collected “under the line” only – trying to calculate these for such a limited spatial extent would mean part of many of the spatial windows would lack data.
To enable testing of the predictive skill of the resultant model (Barry and Elith, 2006; Elith and Leathwick, 2009), the towed video records of observed sparse filter feeders were split into two, with 70% used to form the “training” dataset upon which the RT model was based and the remaining 30% of the data (hold out data) used as a “testing” dataset. This allowed testing the relative importance of each predictor variable and estimating of the overall classification accuracy of the model.
The probability of existence of filter feeders from the first model was then used as a predictor variable in a second RF model to predict the presence or absence of P. maxima (Figure 3B). A set of 96 independent predictor variables were used in this model (Supplementary Table 3). These included: backscatter measured from multibeam sonar at three frequencies (100, 200, and 400 kHz) and three spatial scales (10, 30, 200 m pixel), water quality, sea surface temperature, chlorophyll A concentrations, and the probability of occurrence of sparse filter feeders. An additional variable of the presence versus absence of sparse filter feeders was created to account for the fact that predictions of existence were rarely equal to 1 even when the habitat class of interest was observed. As with the first model, classification accuracy of this model was assessed using hold-out data.
Results
Distribution and Relative Abundance of P. maxima Offshore of Eighty Mile Beach
Three hundred and forty-one P. maxima were observed by towed video across the study area. In addition, we collected three P. maxima by benthic sled from depths >40 m. P. maxima was not recorded on the majority of towed video transects (73 of 119). In transects where P. maxima was present, counts ranged between 1 and 37 individuals, and oysters were concentrated in shallow areas, particularly in the central part of the study area (Figure 4). The incidence of P. maxima in towed video transects ranged from <0.1 to 6.41% of all observations.
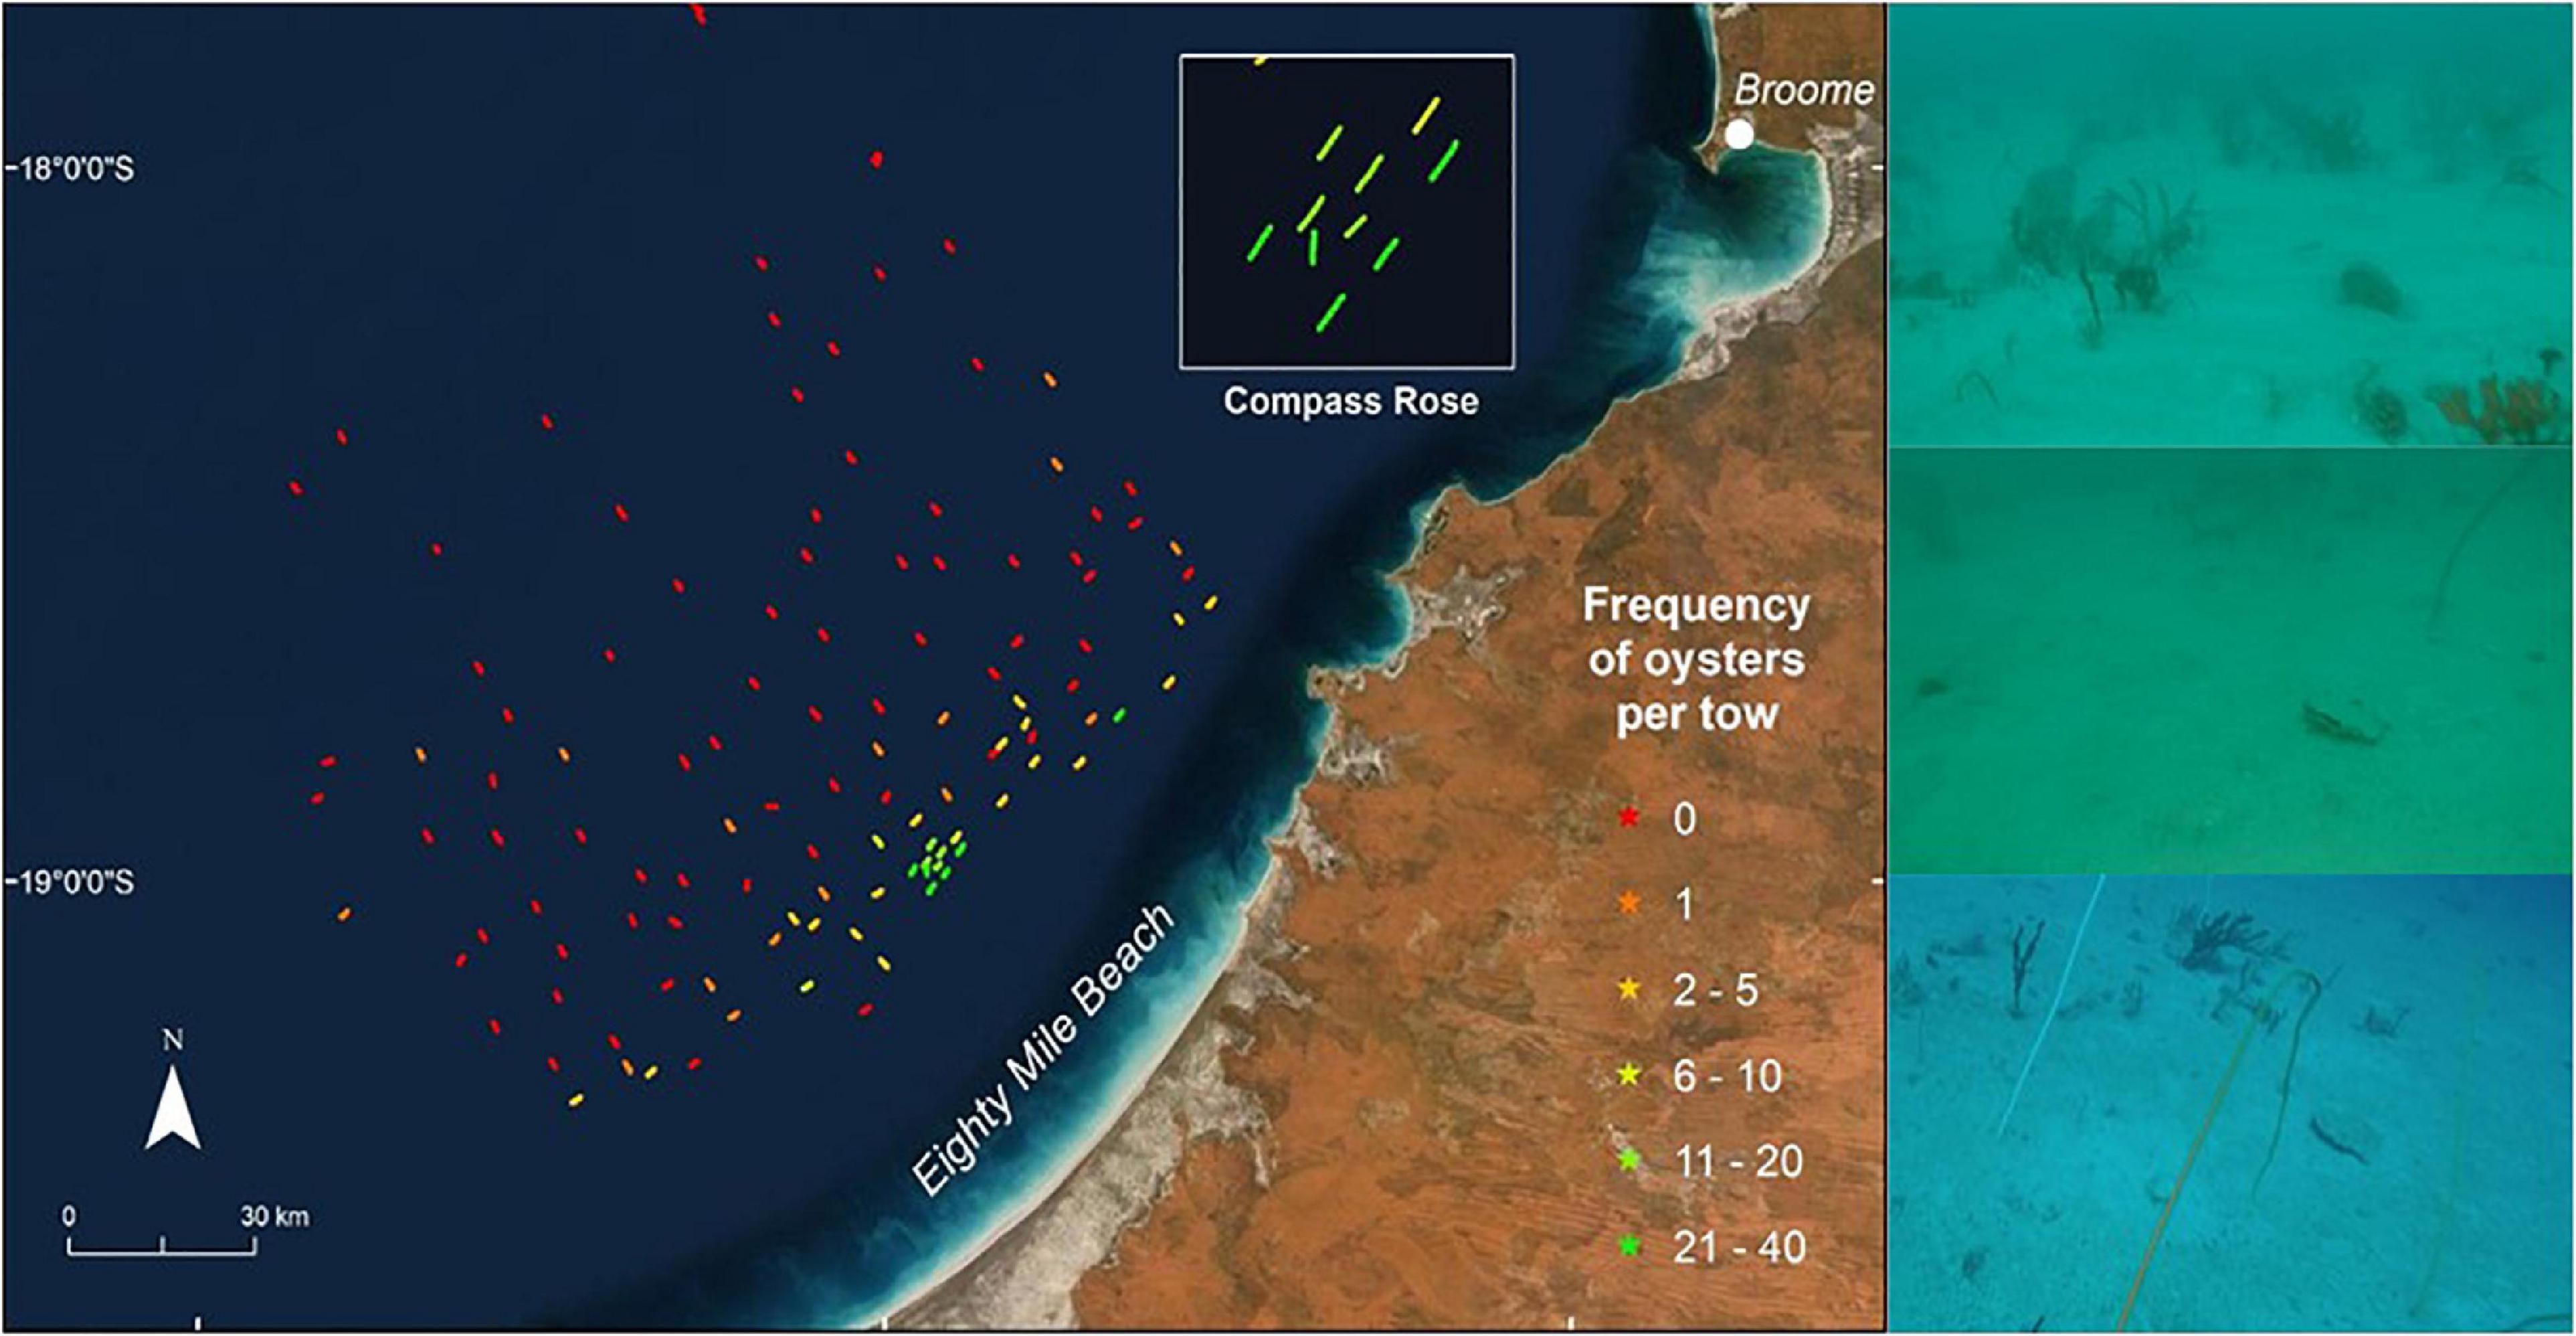
Figure 4. Distribution and relative abundance of pearl oysters, P. maxima, observed during towed video transects across the study area offshore from Eighty Mile Beach. Towed video transects where no oysters were observed are in red, with other transects coloured according to the frequency of oysters observed. The maximum number of oysters seen on a single transect was 37. Photographs show examples of pearl oysters observed on the sea floor using the AIMS towed video platform. Basemaps sourced from ESRI, DigitalGlobe, GeoEye, Earthstar Geographics, CNES/Airbus DS, USDA, USGS, AeroGRID, IGN and the GIS User Community.
Pinctada maxima was observed at depths ranging from 28 to 76 m. However, 91.8% of P. maxima observations occurred in depths shallower than 40 m and only 1.8% of P. maxima were observed in depths >50 m, despite sampling effort being greatest in the 40–70 m depth range (Figure 5A).
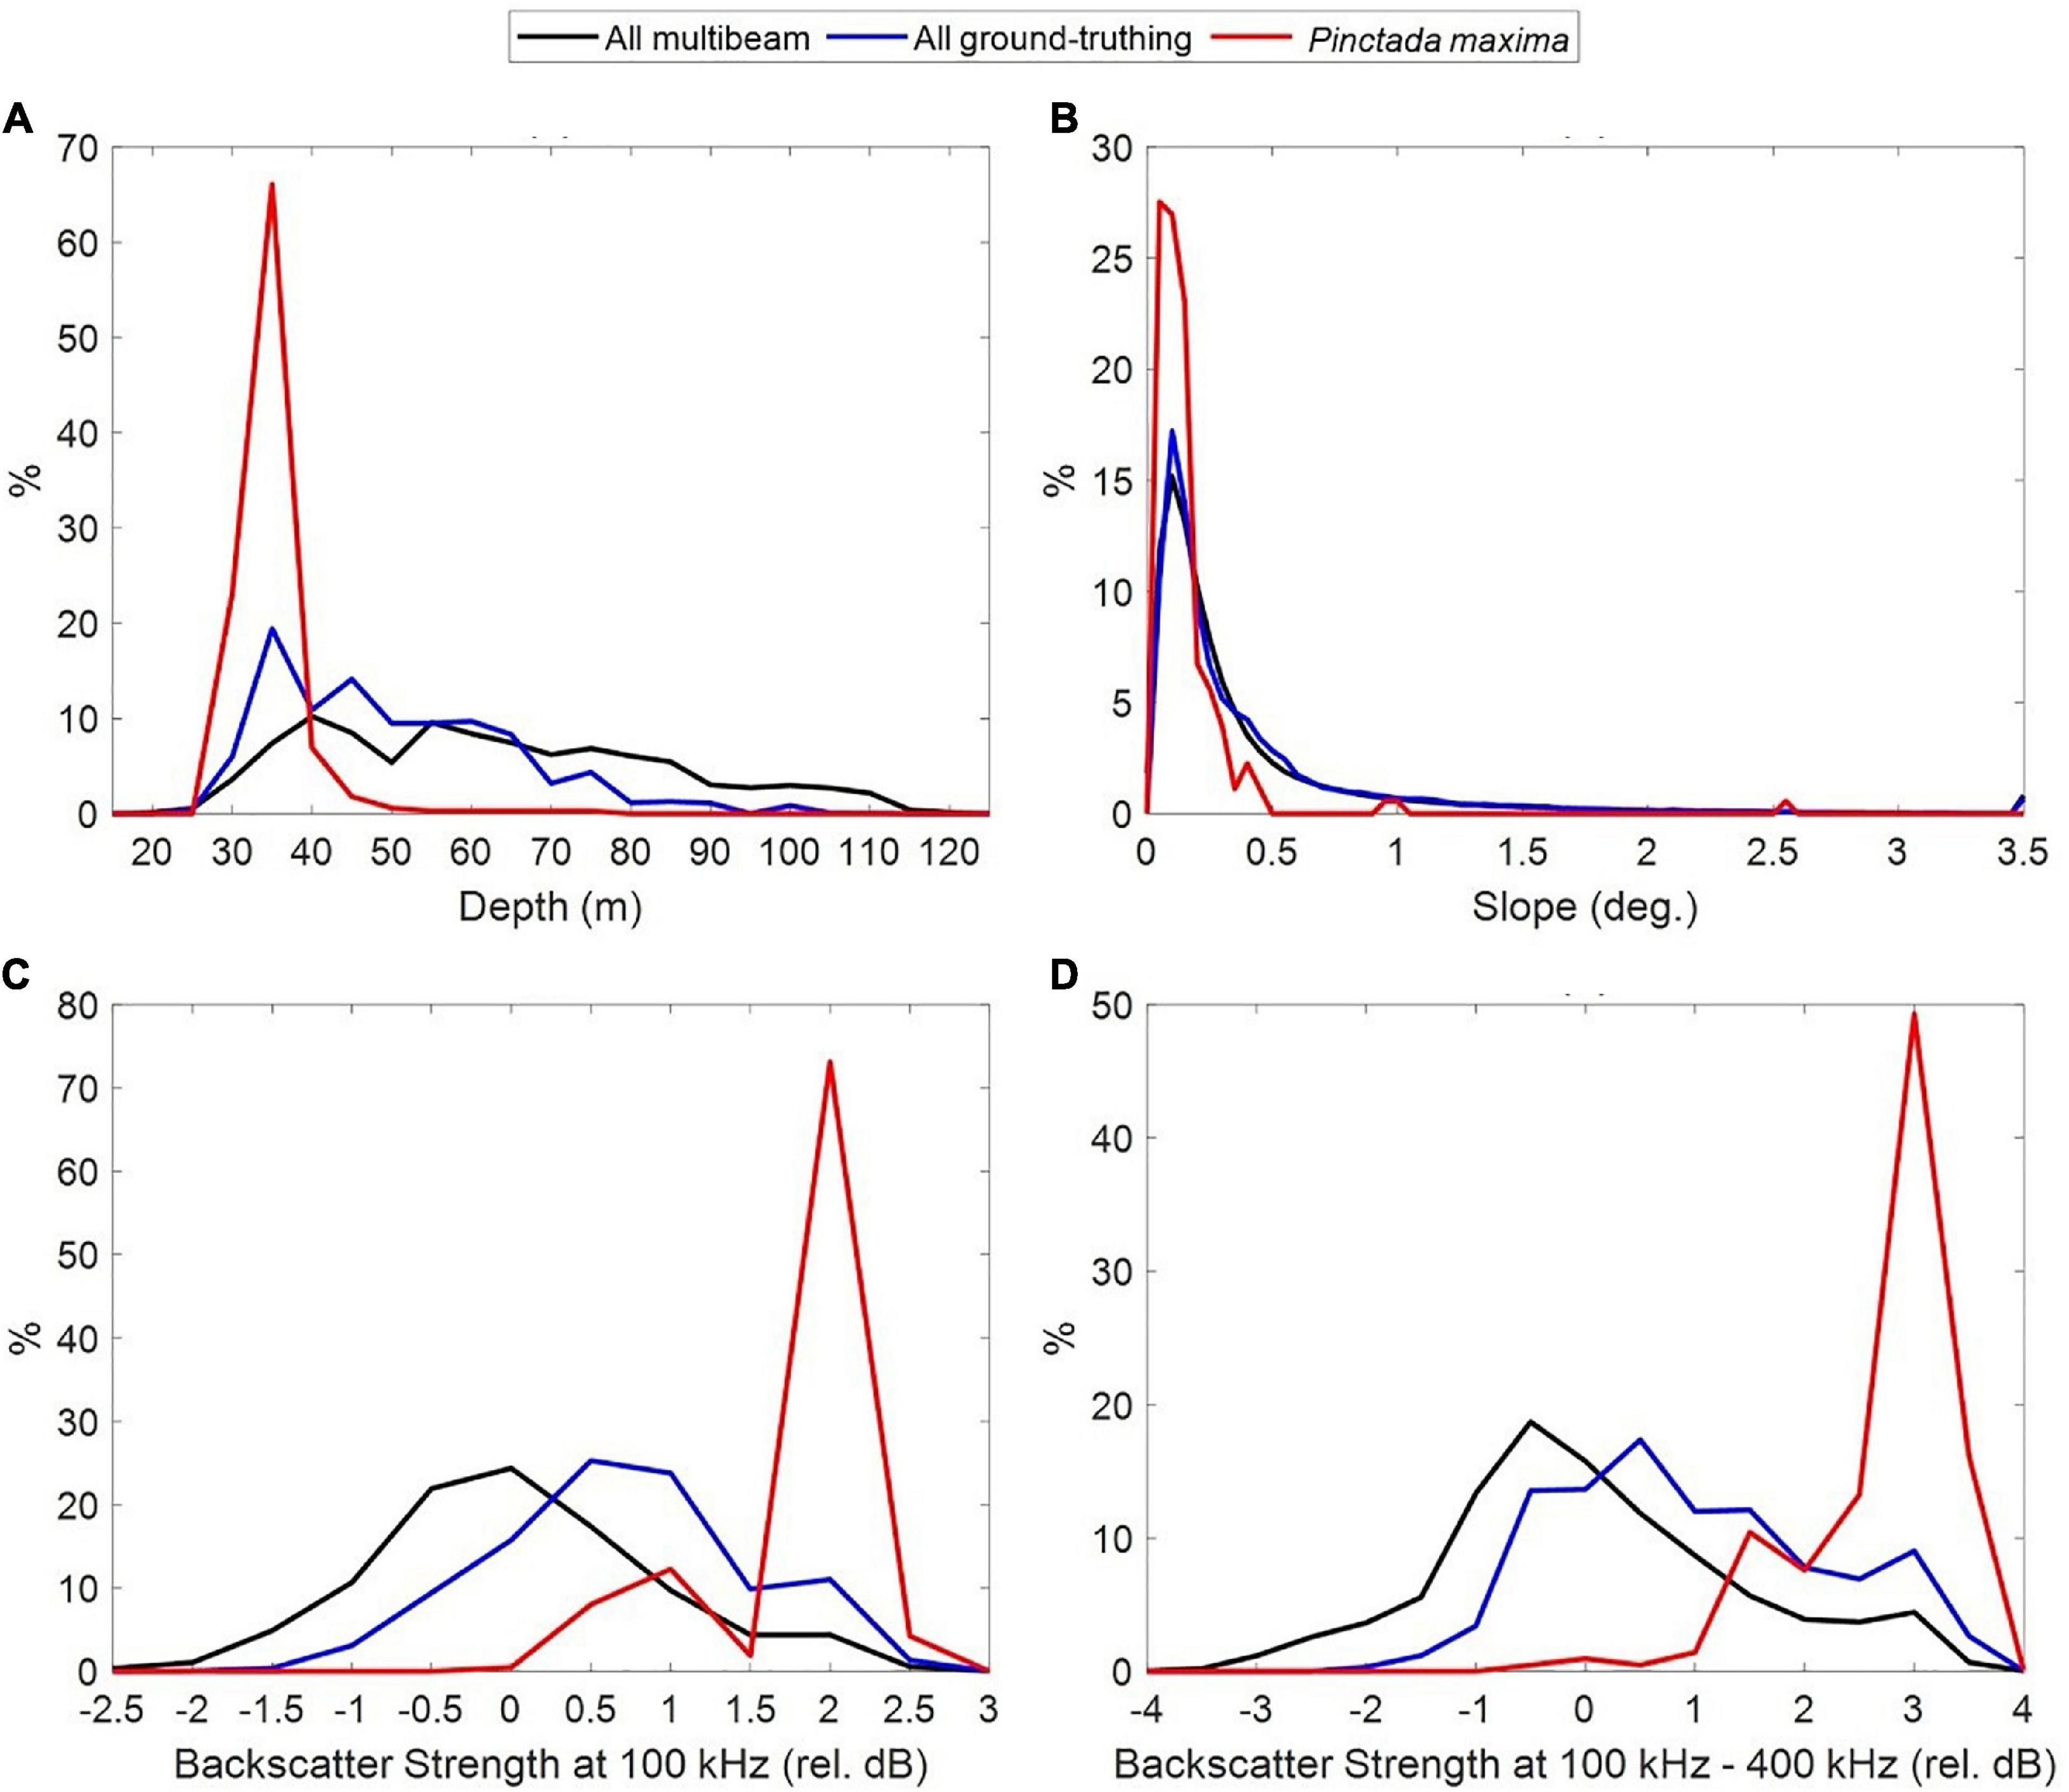
Figure 5. Frequency of oyster observations (in red) relative to multibeam sampling effort and ground-truthing (towed video + sled sampling) across depth (A), seabed slope (B) and multibeam backscatter levels at 100 kHz (relative dB normalised by STD) (C) and the difference in backscatter levels collected at 100 and 400 kHz (relative dB normalised by STD) (D).
We found a strong association between oyster abundance and seabed slope (Figure 5B), with oysters more associated with flat areas, although much of the survey area was actually flat. In addition, the frequency of observations of P. maxima peaked at relatively high levels of backscatter when collected at 100 kHz (Figure 5C) but did not correlate well with backscatter collected at 200 nor 400 kHz (not shown). The difference in seafloor backscatter collected at 100 and 400 kHz shows more potential to discriminate between the presence/absence of P. maxima, than 100 kHz alone (Figure 5D). These seafloor types were mainly found in water shallower than 38 m.
Sediments across the survey area were dominated by sand (>87% of samples comprised >70% sand; Figure 6), although there was some variation across the survey area. Oysters were observed on transects with a high proportion of sand, although were not always present on sandy transects (Figure 6), indicating habitat preferences of oysters are more complex than just sediment type.
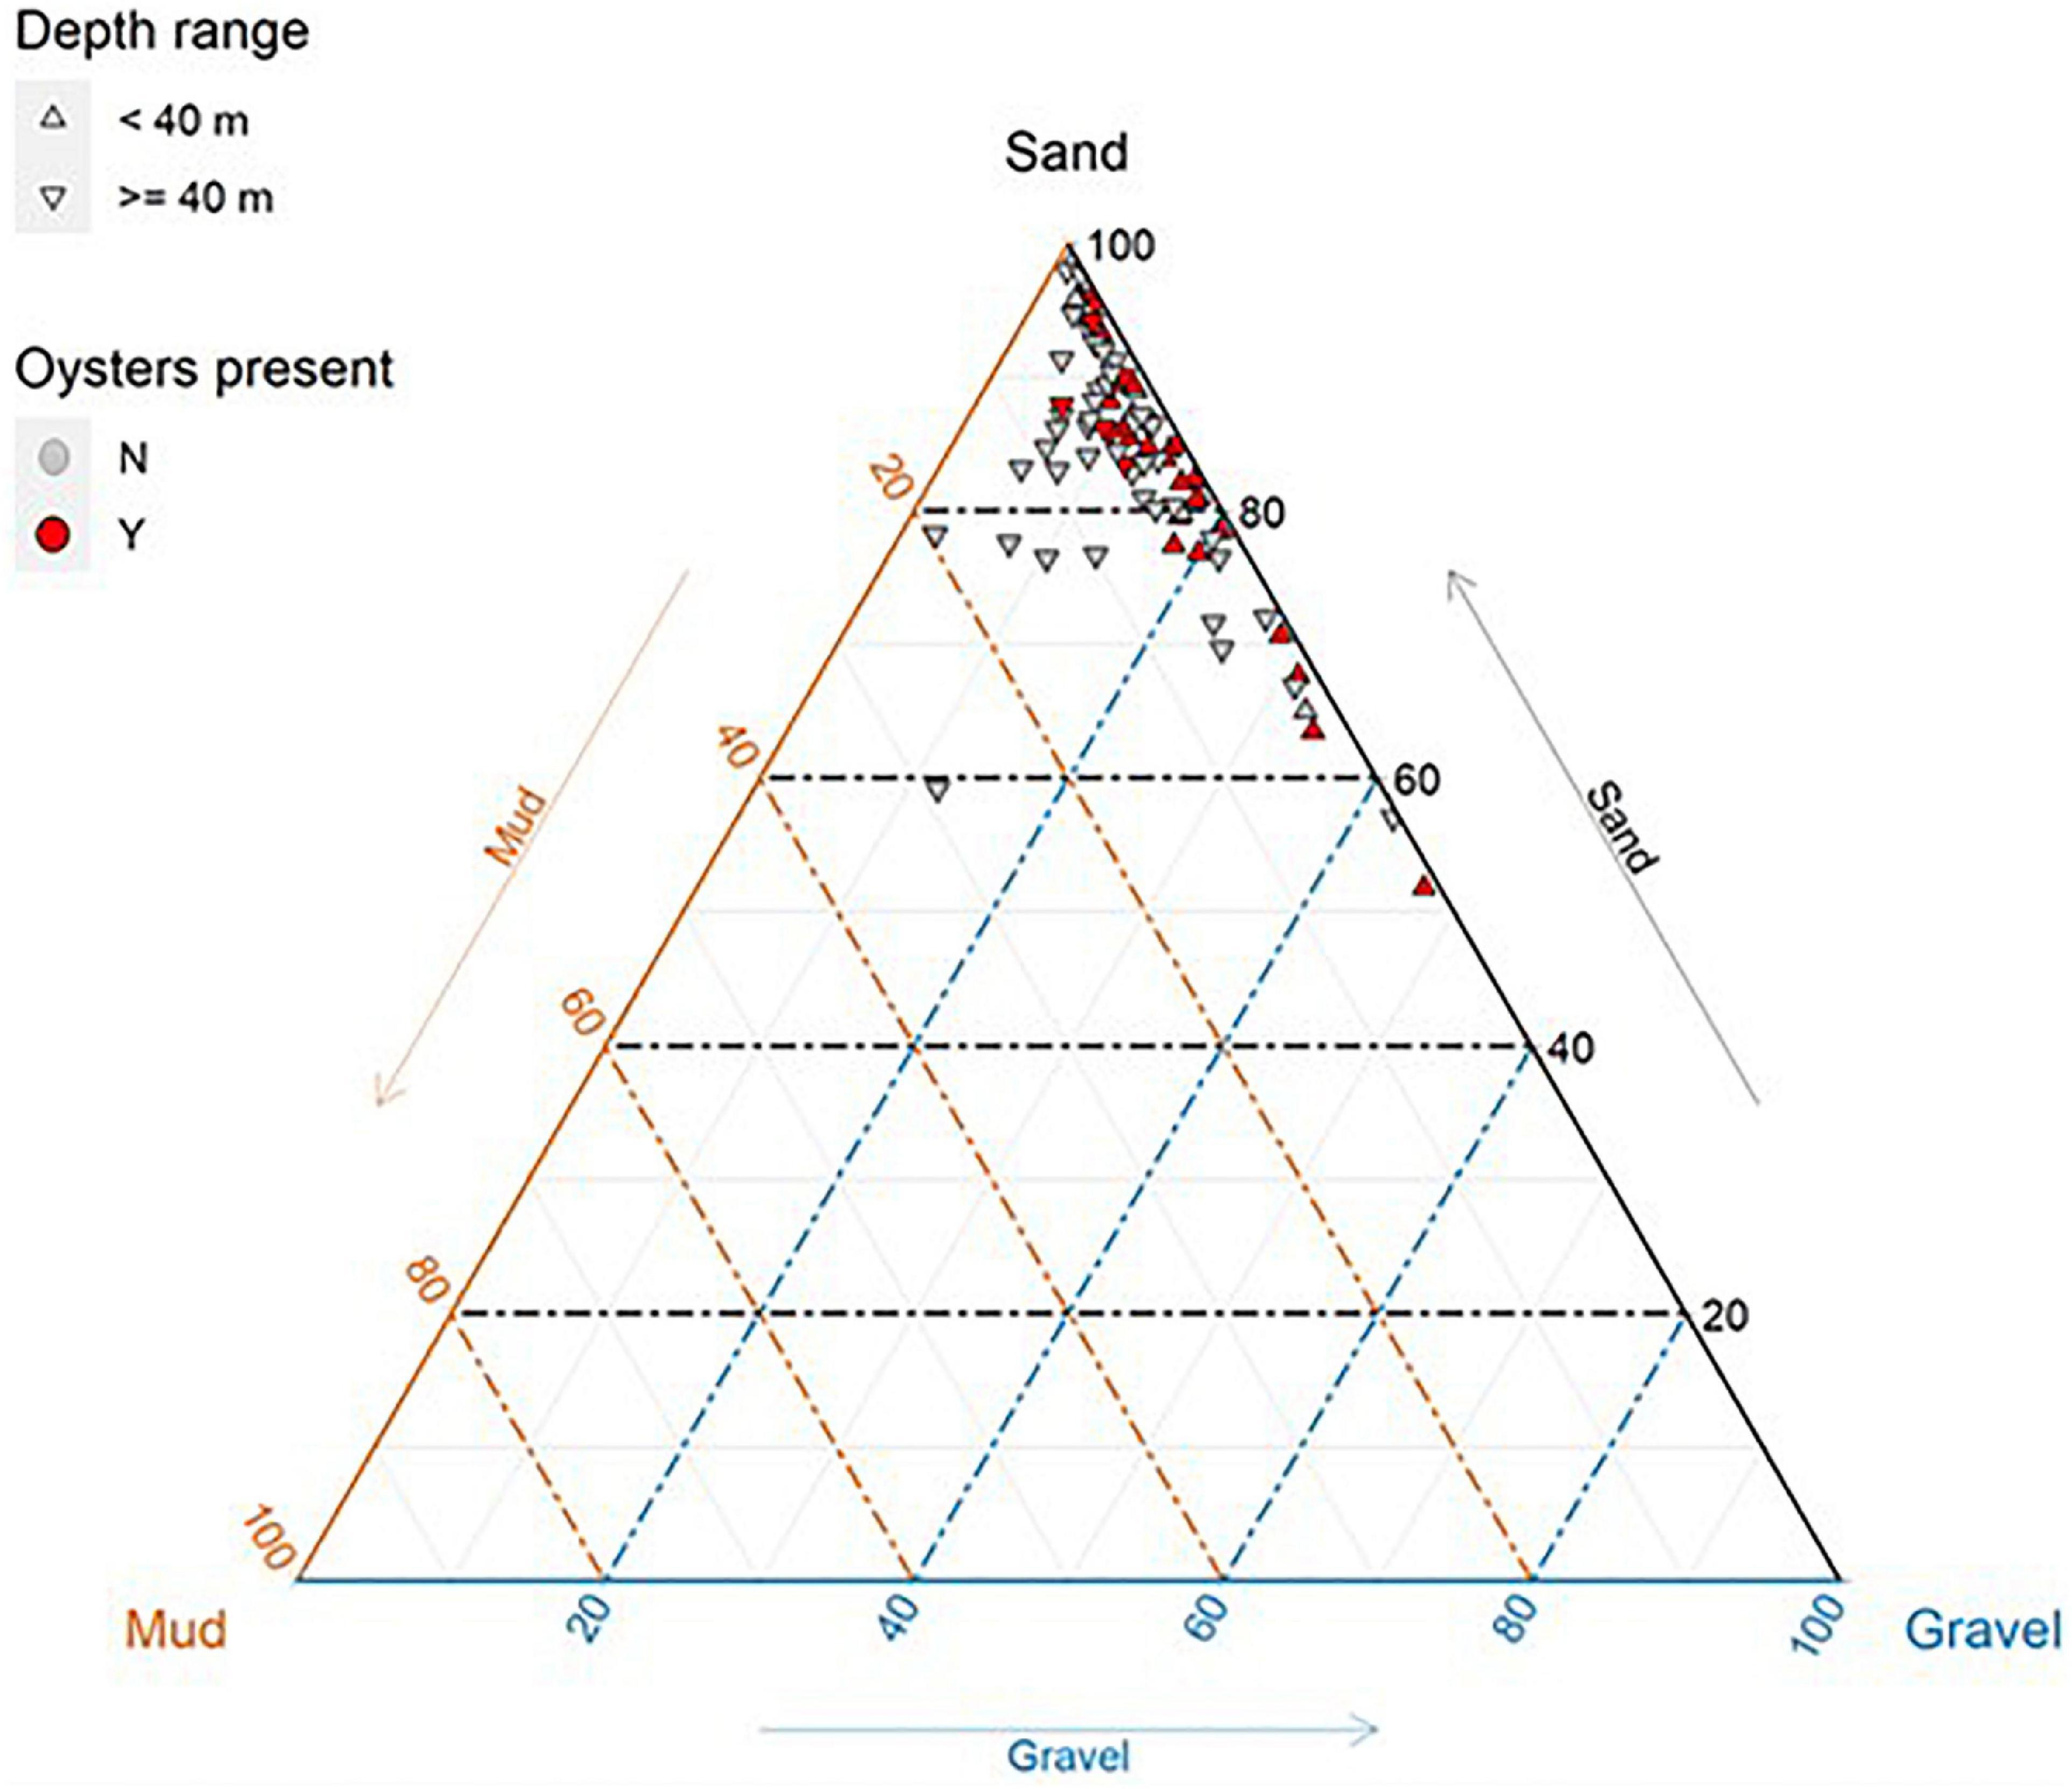
Figure 6. Sediment composition (%) of benthic grabs (n = 85) taken within the survey area offshore from Eighty Mile Beach. Sediment grabs located along transects where oysters were present are coloured red.
Benthic Communities in Pearl Oyster Habitats
Across the study area, cover of benthic organisms typically ranged from 1 to 6% (Supplementary Figure 2). Observations from the forward-facing video showed that 98% of P. maxima were observed in sandy habitats where there were filter feeding communities (Figure 7 and Table 1), a result also consistent with the principal coordinates analysis (PCoA) of associations with benthic habitat categories (taxa and substrate) and oyster densities. PCoA analysis explained ∼88% of the data variability across the first two dimensions (Figure 8). The resulting ordination showed patterns consistent with other results in that there were no oysters present on many of the transects throughout the study area. Where oysters were observed, a notable pattern was that oysters were found in the presence of other oysters. This is clearly seen in the upper right-hand side of the plot (Figure 8) where obvious groupings of oysters in densities >1 occurred. To a lesser extent this pattern of oysters (in densities >1) is also depicted in the upper right and lower left-hand side of the plot. Both unconsolidated and sand substrate were both apparent when oysters occur in densities >1, a finding also depicted in the cluster analysis (S1); bryozoans also have an association with oysters.
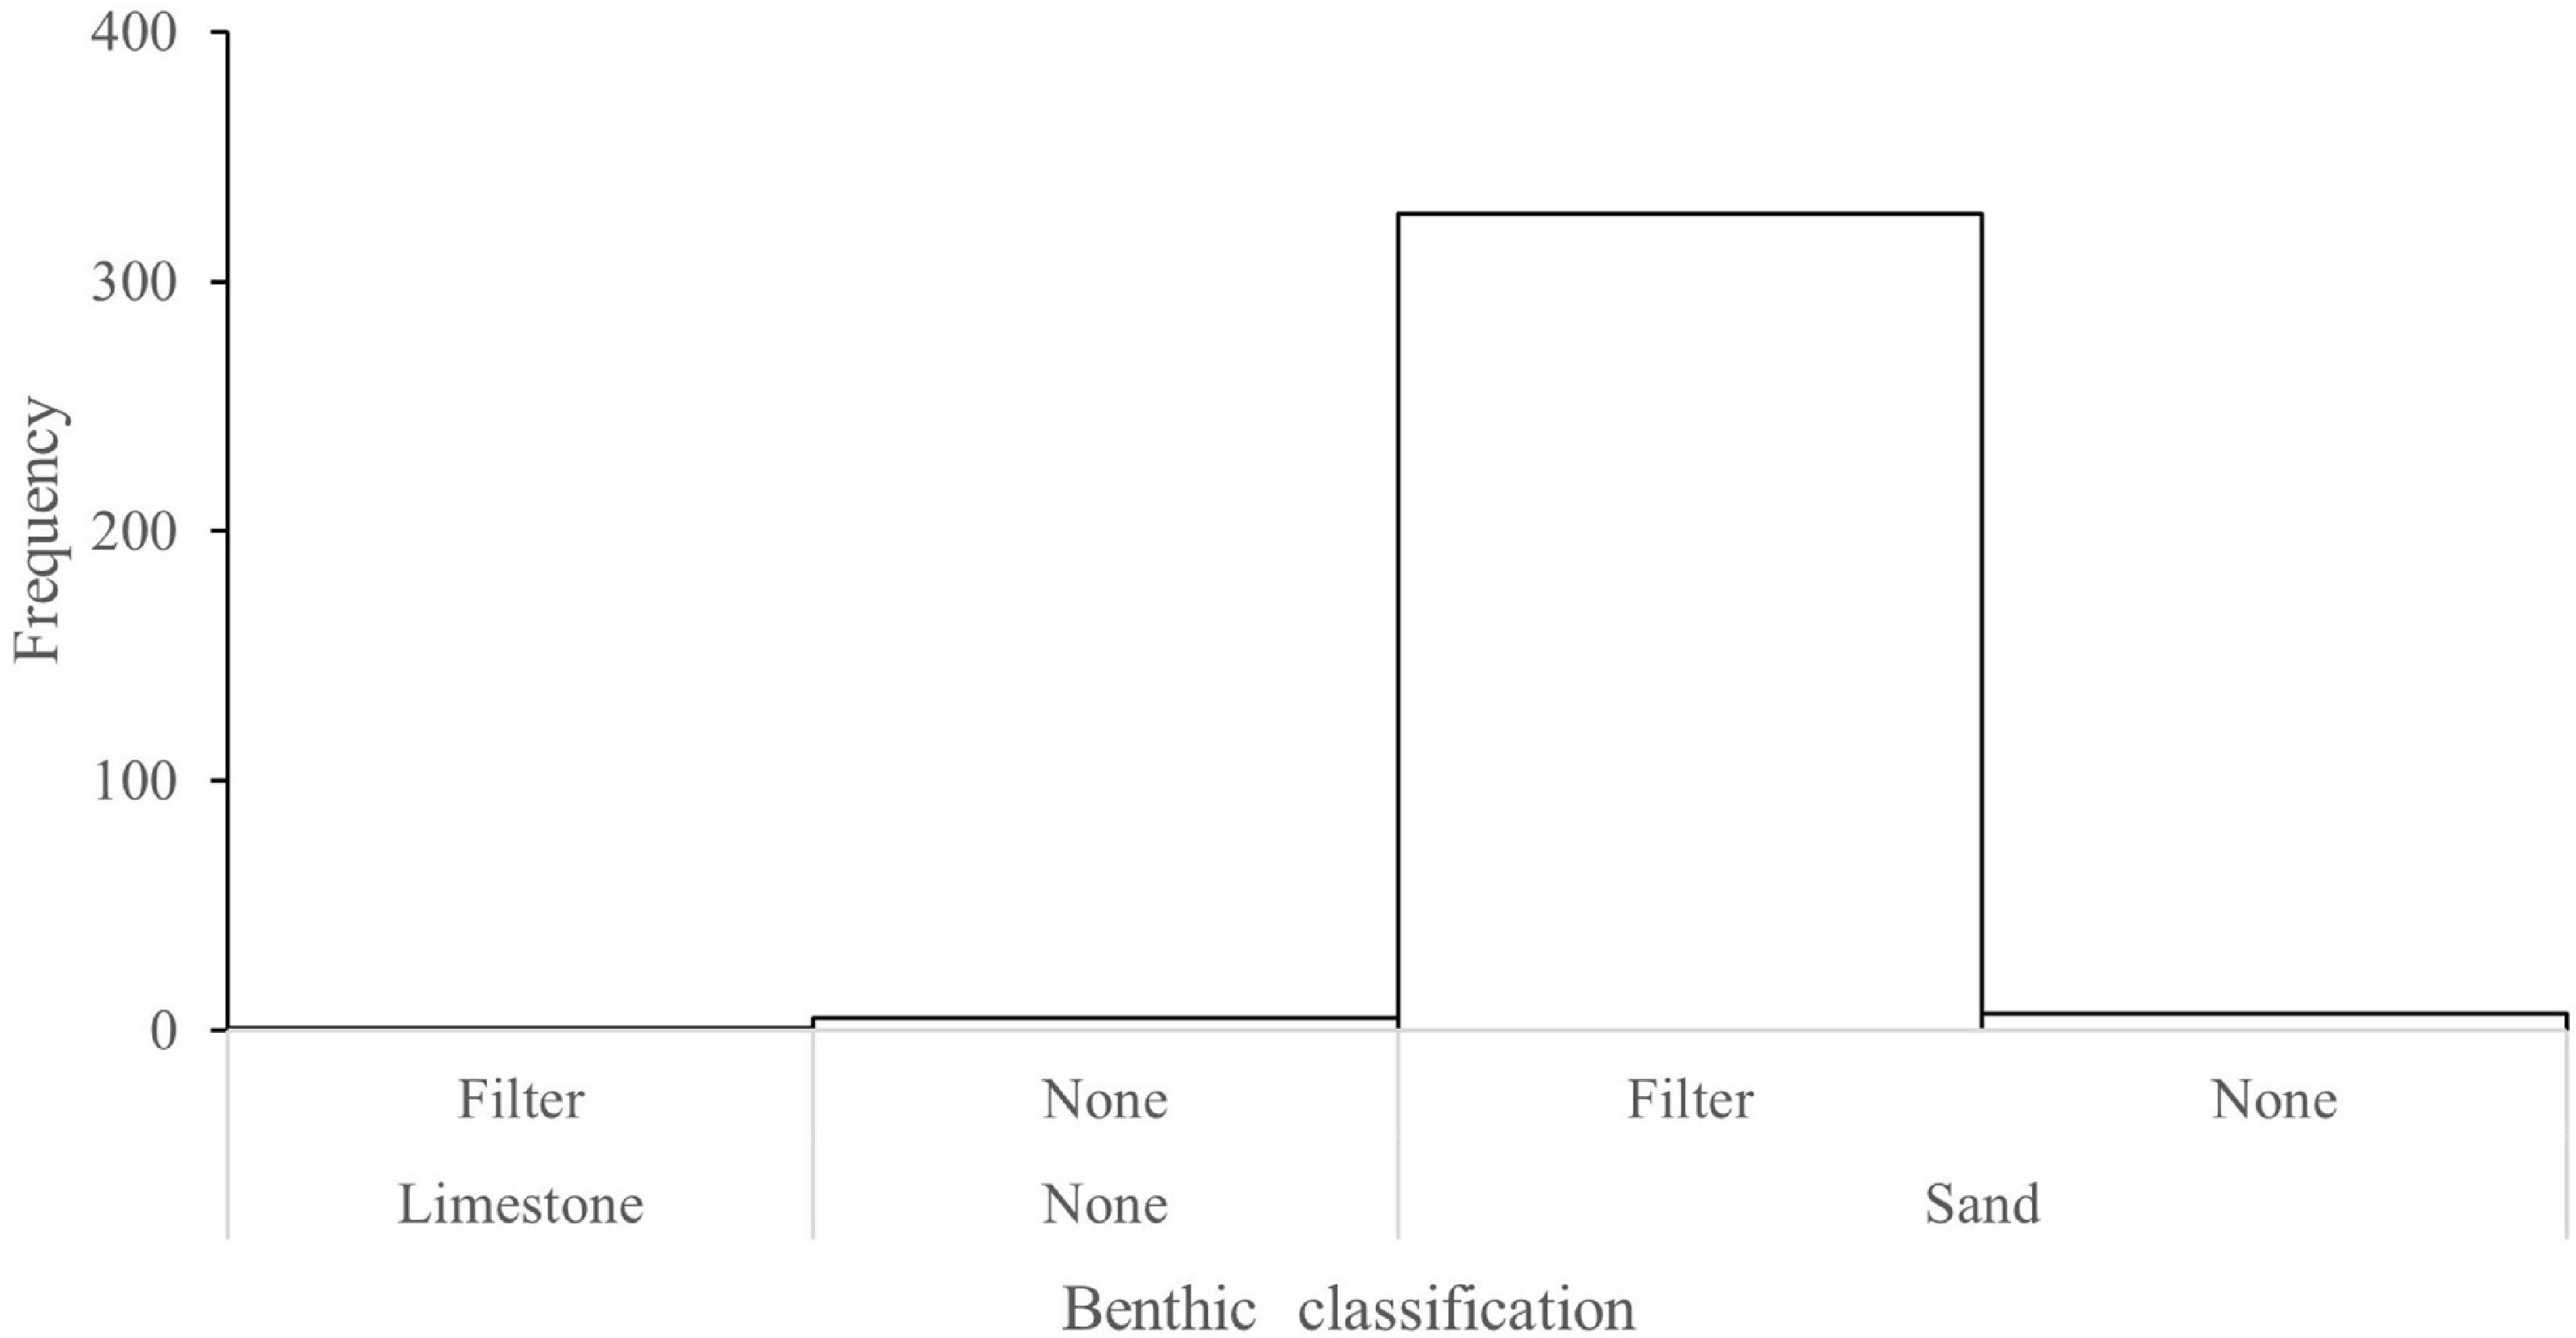
Figure 7. Frequency histogram of taxa and substrate associated with Pinctada maxima towed video observations offshore from Eighty Mile Beach. On the Benthic classification (X) axis, the first row of benthic classifications represent epi-benthic organisms where “Filter” is a classification given to any benthic filter feeders including: sponges, gorgonians, and sea whips and “None” representing no organisms observed. The second row represents the substrate composition where “None” represents substrate that could not be determined.
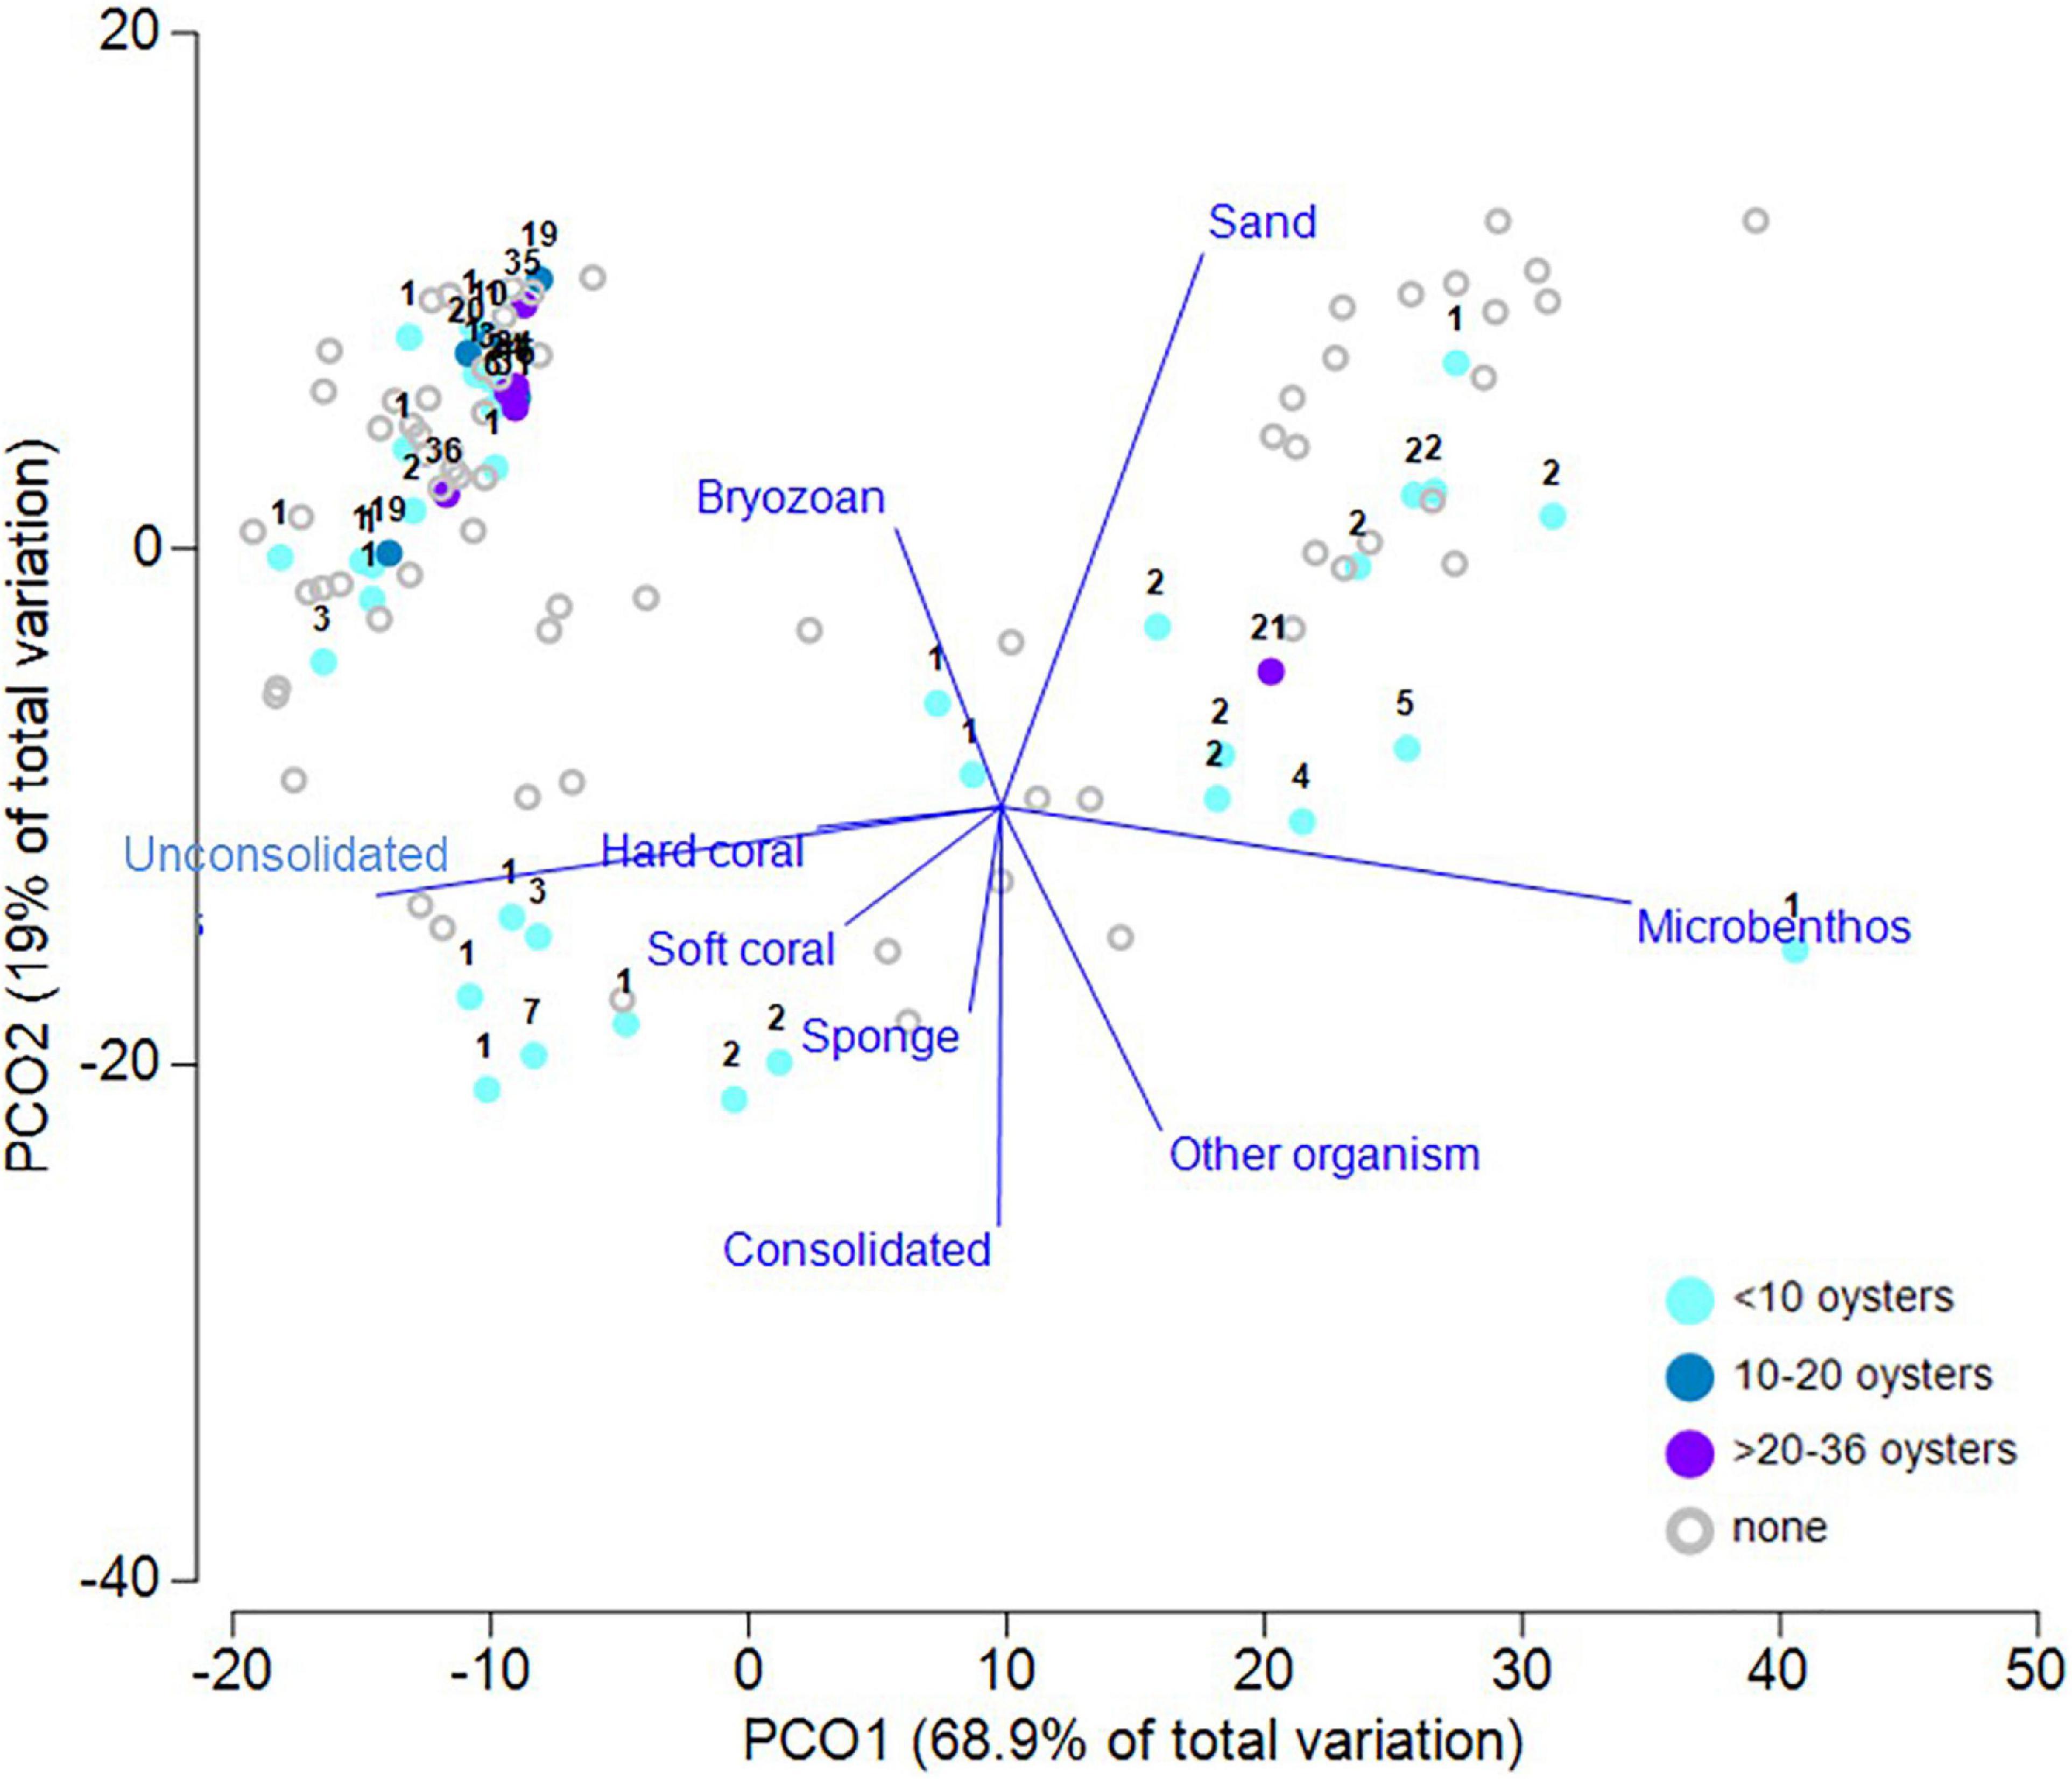
Figure 8. Ordination plot following Principal Coordinates Analysis of P. maxima density and designated benthic groups observed in surveyed transects. Oyster density observed along each transect were binned into four arbitrary levels of density, as identified in the legend, and with additional information on actual numbers notated for each data point. Vectors are based on the raw Pearson correlations of variables with length >0.2.
Predicting the Distribution of Pearl Oyster Habitat
The classification accuracy of modelling to predict the probability of existence of sparse filter feeders was assessed as moderate (kappa = 0.6, – Landis and Koch, 1977). The relative importance of the predictor variables was low (Supplementary Figure 3), with the eight most important derived from the 10 m resolution bathymetry “under the line” data. The most important variable was the average depth (10 m) for a 5-pixel neighbourhood. The least important variables were those at the coarsest resolution (250 m). The classification accuracy of the second model (kappa = 0.20) was at the low end of fair, identifying the very limited power of the model in explaining P. maxima occurrence. This poor performance included instances of the model missing oysters that were observed and predicting oysters that were not seen (Supplementary Figure 5). In contrast to the first model, the presence/absence model of P. maxima was dominated by a single variable – the probability that habitat type “sparse filter feeders” exist, with lesser contributions from various backscatter measures, the actual observed locations of “sparse filter feeders” and, to a much lesser degree, sea surface temperature variables (Supplementary Figure 4). While exploratory analysis (Figure 5) showed that oysters are more likely to occur in shallow areas that are flat, where low frequency backscatter is high (suggesting buried hard substrate), and there are sparse filter feeders, plenty of such locations existed with no oysters present (Figure 8) hence the low power of the model to predict oyster habitat based on the variables we measured here.
Discussion
Despite extensive searching in waters between 40 and 100 m offshore of Eighty Mile Beach, we found no evidence of deep pearl oyster beds in the region. More than 92% of the oysters observed with towed video were shallower than 40 m, consistent with other studies quantifying depth distribution in P. maxima, both in the Eighty Mile Beach region and across the geographic range of P. maxima (Gervis and Sims, 1992; Wada and Temkin, 2008; Department of Fisheries., 2016), although earlier data are sourced from diver visual census generally undertaken in depths <40 m, and so are less comprehensive.
Pinctada maxima has been reported to occur in depths of up to 120 m, although detail on abundances of P. maxima at these lower depth ranges is unknown (reviewed in Wada and Temkin, 2008). In the present study, individuals of P. maxima were observed to 76 m depth, but these were generally singletons and represented a tiny fraction of observations (i.e., <2% observed in depths >50 m), indicating waters deeper than 40 m are not a preferred habitat, at least in the Eighty Mile Beach region.
While we identified aspects of what appears to be the preferred habitat type for P. maxima (i.e., sandy, flat areas with high 100 kHz backscatter and sparse filter feeding communities), we found no statistically significant associations between the presence or abundance of P. maxima either with benthic habitat type or epibenthic community composition, resulting in low power to predict potential pearl oyster habitat. Further, our results showed that even where these combinations of factors co-occur, oysters may, or may not, be present. Reports by pearl fisherman describe P. maxima habitat as “potato bottom” (associations with sponges and ascidians) or “garden habitat” (associations with communities of filter feeders) (Department of Fisheries., 2016) whereas our data suggests stronger associations with bryozoans and macroalgae. It may be that stronger species-specific associations between pearl oysters and other filter feeding epibenthos exist, but these were not evident based on the broad taxonomic classifications possible from towed video imagery. Analysis of benthic communities at a finer spatial and taxonomic resolution may provide additional insights. Alternatively, the finding that oysters show a broad association with other oysters highlights the potential of larval settlement to conspecifics. Conspecific larval settlement, and downstream gregarious adult distributions are evident in other sessile benthic invertebrates (Hadfield and Paul, 2001) including other species of oysters (Reeves et al., 2020). While experimental work is required to support this premise in P. maxima, conspecific larval settlement would provide the most parsimonious explanation of the gregarious and also patchy distributions of P. maxima observed in this study. Moreover, the finding of individual oysters also seen in this study highlights the complexity of larval behaviours in sessile invertebrates; larvae can respond to environmental cues that signal optimal habitat, but the absence of settlement cues doesn’t necessarily preclude settlement (Kotsiri et al., 2018).
Pinctada maxima is a sessile invertebrate. Adult distribution patterns therefore rely on larval dispersal and settlement behaviours. P. maxima is a broadcast spawner, with larvae developing in the plankton and exhibiting a larval pre-competency period of several weeks (Rose and Baker, 1994). Population genetic subdivision among P. maxima populations in WA, QLD, and the Northern Territory (Lind et al., 2007) and between Australia and Indonesia (Benzie and Smith-Keune, 2006) suggests larval dispersal and recruitment across regional spatial scales (hundreds to thousands of kms) is limited. At more local scales, there is evidence that larval dispersal, as inferred by genetic data, can occur over tens to hundreds of kilometres in this species (Johnson and Joll, 1993). P. maxima populations in the region of Eighty Mile Beach are considered a single stock, although there is evidence of some spatial and temporal variation in recruitment (Thomas and Miller, unpublished data). Modelling of P. maxima larval dispersal off Eighty Mile Beach also suggests strong tidal movements in this region aid passive movement of larvae across the fishing grounds (Condie et al., 2009). Taken together both modelled and population genetic data corroborate patterns of depth distribution observed in the present study and provide plausibility to the overriding scenario that distributions of P. maxima, within the region of Eighty Mile Beach are depth limited, predominantly occurring shallower than 40 m. The three oysters collected by sled in >40 m depth during this study have been genotyped and compared with those collected shallower than 40 m (Thomas and Miller, unpublished data) and there is no evidence that the deep water oysters are genetically distinct from those in shallow water. Although sample sizes are too small to draw firm conclusions, these preliminary genetic results suggest larval transport occurs between shallow and deep water and reinforces the notion that oysters recruit most successfully in shallow water.
That P. maxima occurs predominantly on sand was a curious result. Larval settlement of pearl oysters, including P. maxima, relies on larvae using byssal threads to attach to the substrate. The obligatory process of settlement, and attachment via byssal threads, results in many pearl oyster species having a permanent form of attachment to hard substrate (Gervis and Sims, 1992). However, permanent attachment of P. maxima following settlement remains unresolved due to conflicting reports of this species retaining permanent attachment (Hart et al., 2016) versus a capacity to detach byssus attachment and the oyster then relying on the weight of the adult shell to limit being passively moved (Gervis and Sims, 1992; Taylor et al., 1998). It is unknown whether this free-living habit of P. maxima results in small scale dispersal from the origin of larval recruitment, as some pearl oysters can use their foot to move during their early development (Wada and Temkin, 2008). Nevertheless, P. maxima has been reported to occur in a variety of sediment or substrata (reviewed in Wada and Temkin, 2008) although it is unclear if these habitats comprise a veneer of sediment over hard foundations of reef. The finding that P. maxima were found on sandy habitats but were predominantly associated with neighbouring communities of other sessile (filter feeding) invertebrates, suggests that hard, consolidated substrates exist below a veneer of sandy sediments; consolidated substrates also being important for successful recruitment of sessile filter feeders. Certainly, our multibeam backscatter data indicates oysters are typically found in areas where there may be underlying harder surfaces, and it may be that the epibenthos have recruited to exposed harder substrates that have subsequently been buried – probably unsurprising in the dynamic marine environments of NW Australia, where tidal range is up to 10 m with associated strong currents. Alternatively, unconsolidated substrate, in the form of broken rubble or shell may play a role in settlement of P. maxima. Further work is required to provide information on the level of consolidated and unconsolidated substrate in this region, and the role it plays in P. maxima distributions.
Support for an interpretation that P. maxima occurs on consolidated (hard) substrate can also be linked to the multibeam (backscatter) results. P. maxima predominantly occurred in areas with high backscatter collected at 100 kHz. In general, the lower the acoustic frequency, the more penetration through the seafloor (Jackson and Richardson, 2007), suggesting 100 kHz backscatter was potentially influenced by hard substrates under any thin veneer of sand. However, the penetration of 100 kHz into sand will still be limited to centimetres (Jackson and Richardson, 2007). Backscatter was not a strong predictor in the random forest models, however, because plenty of observations of high backscatter at 100 kHz also did not contain oysters.
Conclusion
In addition to confirming that P. maxima most commonly occurs in waters shallower than 40 m in the Eighty Mile Beach Region of Western Australia, we have also shown that remotely deployed towed video is a useful method for assessing sessile invertebrate distributions at depths beyond safe diving limits, or where there is a preference to avoid destructive sampling associated with benthic sleds (Shortis et al., 2000; Jones et al., 2009). Towed video survey has great potential in estimating oyster distributions. Similar approaches have been validated for oysters as well as scallops, although often video methods can underestimate abundances (Thorgren et al., 2017; Ewing et al., 2018; Miller et al., 2019). Certainly for a species such as P. maxima that has relatively low densities (e.g., Eighty Mile Beach – 1 oyster 450 m–1 and 1 oyster 101 m–2 depending on benthic habitat Joll (1996), Torres Strait – between 3 and 30 oysters Ha–1 (Pitcher et al., 1992) and Solomon Islands −0.1–1.23 oysters 400 m–2 (Hawes et al., 2011) we showed that the forward-facing camera with a wide field of view is critical for detecting oysters as very few were observed in the digital stills. The need to “fly” the towed video close to the sea floor in the turbid, high-current environments of NW Australia typically limits the field of view of the high definition stills camera, although as technology develops our capacity to capture high quality imagery of the sea floor will continue to improve and will be important to ensure towed video tools can be used accurately and routinely. Further, more detailed taxonomic identification of species associated with P. maxima may also provide a clearer understanding of habitat preferences of pearl oysters and in turn improve our ability to predict the distribution of oyster habitats.
The spatial extent of our study was constrained by available ship time. This necessitated a trade-off between obtaining full coverage multibeam data over a small area, or maximising the depth range and area explored. Consequently it was not possible to construct a continuous map of depth across the entire survey area. Never the less, these results are of use in designing follow up surveys which, if coupled with additional multibeam data, would increase our capacity to understand (1): spatial predictions (over a greater area) of the probability of benthic community types and (2): the influence of multibeam backscatter over variable seafloor types, and the relative usefulness of the different frequencies collected at mapping different substrates and species.
Data Availability Statement
The datasets presented in this study are available online at https://apps.aims.gov.au/metadata/view/0e5ca52f-5525-44da-b0ca-df758850963e.
Author Contributions
KM, MP, and IP designed the study. SW, MP, MW, and IP undertook data analysis. All authors contributed to interpretation of results and manuscript writing.
Funding
This study was funded by the Australian Institute of Marine Science and Santos Ltd. This research forms part of the North West Shoals to Shore Research Program which is supported by Santos as part of the company’s commitment to better understand Western Australia’s marine environment. Santos Ltd was not involved in the study design, collection, analysis, interpretation of data, the writing of this article or the decision to submit it for publication.
Conflict of Interest
The authors declare that the research was conducted in the absence of any commercial or financial relationships that could be construed as a potential conflict of interest.
Publisher’s Note
All claims expressed in this article are solely those of the authors and do not necessarily represent those of their affiliated organizations, or those of the publisher, the editors and the reviewers. Any product that may be evaluated in this article, or claim that may be made by its manufacturer, is not guaranteed or endorsed by the publisher.
Acknowledgments
We thank the crew of the RV Solander, as well as Neill Roberts, Chris Teasdale, Luke Thomas, Josh Mason, Scott Gardner, Nicole Ryan, Laurence Dugal, Jenelle Ritchie, and Louise Scott for assistance with field work. Thanks also to Mark Case and Jamie Colquhoun for imagery analysis, Alaa Mufti and Xinh Le Sy for help with multibeam acquisition, Ben Radford and Ronen Galaiduk for advice on statistical modelling, and A. Heyward for an initial review of the manuscript. AIMS acknowledges Yawuru, Karajarri, and Nyangumarta People as Traditional Owners of the 80 Mile Beach coast and surrounding region where this work on Pearl Oyster was undertaken. We recognise these People’s ongoing spiritual connection to country and pay our respects to their Aboriginal Elders past, present and emerging.
Supplementary Material
The Supplementary Material for this article can be found online at: https://www.frontiersin.org/articles/10.3389/fmars.2021.679749/full#supplementary-material
Footnotes
References
Althaus, F., Hill, N., Ferrari, R., Edwards, L., Przeslawski, R., Schönberg, C. H. L., et al. (2015). A standardised vocabulary for identifying benthic biota and substrata from underwater imagery: the CATAMI classification scheme. PLoS One 10:e0141039.
Barry, S., and Elith, J. (2006). Error and uncertainty in habitat models. J. Appl. Ecol. 43, 413–423. doi: 10.1111/j.1365-2664.2006.01136.x
Benzie, J. A. H., and Smith-Keune, C. (2006). Microsatellite variation in Australian and Indonesian pearl oyster Pinctada maxima populations. Mar. Ecol. Prog. Ser. 314, 197–211. doi: 10.3354/meps314197
Carroll, A., Althaus, F., Beaman, R., Friedman, A., Ierodiaconou, D., Ingleton, T., et al. (2018). “Marine sampling field manual for towed underwater camera systems,” in Field Manuals for Marine Sampling to Monitor Australian Waters, eds R. Przeslawski and S. Foster [National Environmental Science Programme (NESP)], 131–152.
Condie, S. A., Mansbridge, J. V., Hart, A. M., and Andrewartha, J. R. (2009). Transport and recruitment of silver-lip pearl oyster larvae on Australia’s North West Shelf. J. Shellfish Res. 25, 179–185. doi: 10.2983/0730-8000(2006)25[179:tarosp]2.0.co;2
Cutler, D. R., Edwards, T. C. Jr., Beard, K. H., Cutler, A., Hess, K. T., Gibson, J., et al. (2007). Random forests for classification in ecology. Ecology 88, 2783–2792.
Davidson, A. D., Boyer, A. G., Kim, H., Pompa-Mansilla, S., Hamilton, M. J., Costa, D. P., et al. (2012). Drivers and hotspots of extinction risk in marine mammals. Proc. Natl. Acad. Sci. U. S. A. 109, 3395–3400. doi: 10.1073/pnas.1121469109
De’ath, G., and Fabricius, K. E. (2000). Classification and regression trees: a powerful yet simple technique for ecological data analysis. Ecology 81, 3178–3192. doi: 10.1890/0012-9658(2000)081[3178:cartap]2.0.co;2
Department of Fisheries. (2016). Integrated Fisheries Management Resource Report Pearl Oyster (Pinctada maxima) Resource. Perth: Department of Fisheries, 0819–4327.
Elith, J., and Leathwick, J. R. (2009). Species distribution models: ecological explanation and prediction across space and time. Annu. Rev. Ecol. Evol. Sys. 40, 677–697. doi: 10.1146/annurev.ecolsys.110308.120159
Elith, J., Graham, C. H., Anderson, R. P., Dudík, M., Ferrier, S., Guisan, A., et al. (2006). Novel methods improve prediction of species’ distributions from occurrence data. Ecography 29, 129–151.
Ewing, G., Keane, J. P., and Semmens, J. M. (2018). Industry-independent video survey of commercial scallop (Pecten fumatus) densities in Great Oyster Bay - May 2017 survey. Hobart: Institute for Marine and Antarctic Studies.
Gervis, M. H., and Sims, N. (1992). The biology and culture of pearl oysters (Bivalvia: Pteriidae). Manila: International Center for Living Aquatic Resources Management.
Hadfield, M. G., and Paul, V. J. (2001). “Natural chemical cues for settlement and metamorphosis of marine invertebrate larvae,” in Marine Chemical Ecology, eds J. B. McClintock and W. Baker (Boca Raton: CRC Press), 431–461. doi: 10.1201/9781420036602.ch13
Hart, A. M., and Friedman, K. J. (2004). Mother-of-pearl shell (Pinctada maxima): Stock evaluation for management and future harvesting in Western Australia. Western Australia: Department of Fisheries.
Hart, A. M., and Joll, L. (2006). Growth, mortality, recruitment, and sex ratio in wild stocks of the silver-lipped pearl oyster Pinctada maxima (Jameson) (Mollusca: Pteriidae) in Western Australia. J. Shellfish Res. 25, 201–210. doi: 10.2983/0730-8000(2006)25[201:gmrasi]2.0.co;2
Hart, A., Travaille, K. L., Jones, R., Brand-Gardner, S., Webster, F., Irving, A., et al. (2016). Western Australian silver-lipped pearl oyster (Pinctada maxima) industry. Perth: Department of Fisheries.
Hawes, I., Lasiak, T., Lincoln-Smith, M., and Oengpepa, C. (2011). The status of Sliverlip Pearl Oyster Pinctada maxima (Jameson) (Mollusca. Pteridae) in the Solomon Islands after a 15 year export ban. J. Shellfish Res. 30, 255–260. doi: 10.2983/035.030.0209
Heyward, A., Case, M., Cappo, M., Colquhoun, J., Curry, L., Fisher, R., et al. (2017). The Barracouta, Goeree and Vulcan, Shoals Survey 2016. Townsville: Australian Institute of Marine Science.
Jackson, D., and Richardson, M. (2007). High-frequency seafloor acoustics. New York, NY: Springer Science and Business Media.
Jenkins, S. R. (2005). Larval habitat selection, not larval supply, determines settlement patterns and adult distribution in two chthamalid barnacles. J. Anim. Ecol. 74, 893–904. doi: 10.1111/j.1365-2656.2005.00985.x
Johnson, M. S., and Joll, L. M. (1993). Genetic subdivision of the pearl oyster Pinctada maxima in Northern Australia. Aust. J. Mar. Freshw. Res. 44, 519–526. doi: 10.1071/mf9930519
Joll, L. (1996). Stock evaluation and recruitment measurements in the WA Pearl Oyster Fishery. Perth: Fisheries Research and Development Corporation.
Jones, D. O. B., Bett, B. J., Wynn, R. B., and Masson, D. G. (2009). The use of towed camera platforms in deep-water science. Int. J. Soc. Underw. Technol. 28, 41–50. doi: 10.3723/ut.28.041
Jonker, M., Johns, K., and Osborne, K. (2008). Surveys of Benthic Reef Communities Using Underwater Digital Photographs and Counts of Juvenile Corals. Long-Term Monitoring of the Great Barrier Reef. Standard Operating Procedure 10/2008. Townsville, OLD: Australian Institute of Marine Science.
Kotsiri, M., Protopapa, M., Mouratidis, S., Zachariadis, M., Vassilakos, D., Kleidas, I., et al. (2018). Should I stay or should I go? The settlement-inducing protein complex guides barnacle settlement decisions. J. Exp. Biol. 221:jeb185348.
Landis, J. R., and Koch, G. G. (1977). The measurement of observer agreement for categorical data. Biometrics 33, 159–174. doi: 10.2307/2529310
Lind, C. E., Evans, B. S., Taylor, J. J. U., and Jerry, D. R. (2007). Population genetics of a marine bivalve, Pinctada maxima, throughout the Indo-Australian Archipelago shows differentiation and decreased diversity at range limits. Mol. Ecol. 16, 5193–5203. doi: 10.1111/j.1365-294x.2007.03598.x
Marshall, D. J., Monro, K., Bode, M., Keough, M. J., and Swearer, S. (2010). Phenotype–environment mismatches reduce connectivity in the sea. Ecol. Lett. 13, 128–140. doi: 10.1111/j.1461-0248.2009.01408.x
Miller, T. J., Hart, D. R., Hopkins, K., Vine, N. H., Taylor, R., York, A. D., et al. (2019). Estimation of the capture efficiency and abundance of Atlantic sea scallops (Placopecten magellanicus) from paired photographic–dredge tows using hierarchical models. Can. J. Fish. Aquat. Sci. 76, 847–855. doi: 10.1139/cjfas-2018-0024
Müller, G., and Gastner, M. (1971). The “Karbonat-Bombe”, a simple device for the determination of the carbonate content in sediments, soils, and other materials. Neues Jahrbuch für Mineralogie Monatshefte 10, 446–469.
Parnum, I. M., and Gavrilov, A. N. (2011a). High-frequency multibeam echo-sounder measurements of seafloor backscatter in shallow water: Part 1–Data acquisition and processing. Underw. Technol. 30, 3–12. doi: 10.3723/ut.30.003
Parnum, I. M., and Gavrilov, A. N. (2011b). High-frequency multibeam echo-sounder measurements of seafloor backscatter in shallow water: Part 2–Mosaic production, analysis and classification. Underw. Technol. 30, 13–26. doi: 10.3723/ut.30.013
Pitcher, C. R., Skewes, T. D., Dennis, D. M., and Prescott, J. H. (1992). Distribution of seagrasses, substratum and epibenthic macrobiota in Torres Strait, with notes on pearl oyster abundance. Aust. J. Mar. Freshw. Res. 43, 409–420. doi: 10.1071/mf9920409
Prasad, A. M., Iverson, L. R., and Liaw, A. (2006). Newer classification and regression tree techniques: bagging and random forests for ecological prediction. Ecosystems 9, 181–199. doi: 10.1007/s10021-005-0054-1
Reeves, S. E., Renzi, J. J., Fobert, E. K., Silliman, B. R., Hancock, B., and Gillies, C. L. (2020). Facilitating better outcomes: how positive species interactions can improve oyster reef restoration. Front. Mar. Sci. 7:656. doi: 10.3389/fmars.2020.00656
Rose, R. A., and Baker, S. B. (1994). Larval and spat culture of the Western Australian silver- or goldlip pearl oyster, Pinctada maxima Jameson (Mollusca: Pteriidae). Aquaculture 126, 35–50. doi: 10.1016/0044-8486(94)90246-1
Schimel, A. C. G., Beaudoin, J., Parnum, I. M., Le Bas, T., Schmidt, V., Keith, G., et al. (2018). Multibeam sonar backscatter data processing. Mar. Geophys. Res. 39, 121–137. doi: 10.1007/s11001-018-9341-z
Shortis, M. R., Miller, S., Harvey, E. S., and Robson, S. (2000). An analysis of the calibration stability and measurement accuracy of an underwater stereo-video system used for shellfish surveys. Geomatics Research Australasia 73, 1–24.
Taylor, J. J., Southgate, P. C., and Rose, R. A. (1998). Assessment of artificial substrates for collection of hatchery-reared silver-lip pearl oyster (Pinctada maxima, Jameson) spat. Aquaculture 162, 219–230. doi: 10.1016/s0044-8486(98)00213-0
Thorson, G. (1950). Reproductive and larval ecology of marine bottom invertebrates. Biol. Rev. 25, 1–45. doi: 10.1111/j.1469-185x.1950.tb00585.x
Wada, K. T., and Temkin, I. (2008). “Taxonomy and Phylogeny,” in The Pearl Oyster, eds P. A. Southgate and J. Lucas (Oxford: Elsevier Science), 37–62.
Keywords: silver-lipped pearl oyster, spatial, fishery, habitat, depth-distribution
Citation: Whalan S, Puotinen M, Wakeford M, Parnum I and Miller K (2021) Distribution of the Pearl Oyster Pinctada maxima off Eighty Mile Beach, Western Australia. Front. Mar. Sci. 8:679749. doi: 10.3389/fmars.2021.679749
Received: 05 April 2021; Accepted: 31 July 2021;
Published: 09 September 2021.
Edited by:
Daniel Ierodiaconou, Deakin University, AustraliaReviewed by:
Hiroto Higa, Yokohama National University, JapanJaume Piera, Consejo Superior de Investigaciones Científicas (CSIC), Spain
Copyright © 2021 Whalan, Puotinen, Wakeford, Parnum and Miller. This is an open-access article distributed under the terms of the Creative Commons Attribution License (CC BY). The use, distribution or reproduction in other forums is permitted, provided the original author(s) and the copyright owner(s) are credited and that the original publication in this journal is cited, in accordance with accepted academic practice. No use, distribution or reproduction is permitted which does not comply with these terms.
*Correspondence: Karen Miller, ay5taWxsZXJAYWltcy5nb3YuYXU=