 Marion Poupard
 Helena Symonds3
 Hervé Glotin
- 1Université de Toulon, Aix Marseille Univ., CNRS, LIS, DYNI, Marseille, France
- 2BIOSONG, SAS, Paris, France
- 3Pacific Orca Society/OrcaLab, Alert Bay, BC, Canada
- 4Université de Toulon, INPS, SMIoT, La Garde, France
Acoustic emissions are vital for orca (Orcinus orca) socializing, hunting, and maintaing spatial awareness. Studying the acoustic emissions of orcas on an individual basis often results in interference with their natural behaviors through mounting tags or following by boat. In order to analyze their inter- and intra-group communication, we propose a study allowing us to associate vocalizations with their emitter (matriline and when possible individual). Such a non-interfering device for allocating calls to individual orcas could substantially boost our understanding of their complex acoustic world. Our experimental protocol was based on a compact array of four hydrophones fixed near the shore, operable up to 1 km away from the path of orcas. It was used during summer 2019 at the research station OrcaLab, northern Vancouver Island, Canada. A total of 722 calls were extracted, jointly with visual identification and azimuth of surfacing orcas, allowing validation of the acoustic diarization and azimuth estimations of the orca calls. We then calculated the Call Rate (CR) for each matriline or when possible individual in order to describe their acoustic activity. Preliminary results show that CR could be modulated according to the distance of the signaler from a group, the presence of another group, or anthropic pressure.
1. Introduction
Orca (Orcinus orca) is a marine mammal that inhabits oceans across the globe. Local populations have specific prey preferences and cultural traits that define their particular ecotype. The Northern Resident orca population (the focus of this study) inhabits the coastal waters of British Columbia and south-east Alaska in the northeast Pacific Ocean. This population feeds primarily on Chinook and Chum Salmon whose annual migrations along coastal waters are taken advantage of by these orcas and determines a lot of their movement through coastal locations.
The Northern Resident orca community consists of 300+ individuals organized into 40+ family groups or matrilines. A matriline typically consists of a mother and her offspring. As orcas are generally long living, a matriline may consist of several generations. Vocalizations used for communication are inherited through the mother and are designated as the dialect of a group. These dialects define the acoustic tradition of each group and allow for group identification.
Pods are groups of related orcas that frequently live and travel together. They also share the same acoustic dialect. The smallest unit of socialization within the pods is the matriline, which links individuals through maternal descent (Ford, 2009). The matrilines are very united, i.e., there is no dispersal from these matrilines and that individuals typically travel with their mothers for life. The resulting need to stay in touch and the fact that their prey does not (unlike in mammal-eaters) restrict their frequency of vocalizing make them an acoustically very active ecotype.
In fact, for orcas, the ability to emit sound, hear, and vocalize is vital to performing activities such as communication, reproduction, and hunting (Council et al., 2003; Burham et al., 2016). They can produce a wide variety of sounds including clicks, whistles, and pulsed calls (Ford, 1991). Pulsed calls or vocalizations are primordial for communication, and a pod can share between 7 and 17 different calls classed by types (Ford, 1989). Vocal activity also depends on the activity of the group (Filatova et al., 2013). Numerous acoustic studies have already proven that pulsed vocalization plays an important role in the social life of the group (Bain, 1986; Filatova et al., 2010, 2013).
In order to grasp the richness of orcas' intra-group communication, it is necessary to analyze the acoustic production of each individual or matriline during natural activities in the wild. Most studies so far describe pod level call behavior (Foote et al., 2004; Miller et al., 2004). It has proved challenging to demonstrate vocalizations produced by an observed matriline or individual. Members of a matriline often travel in rather close proximity, requiring methods that can tell apart signalers that are relatively close in space. Therefore, it seems useful to put in place methods and protocols that associate vocalizations with an individual or matriline.
Many studies have described the vocal exchanges of animals as the response of a receiver after the emission of a particular signal (Krebs et al., 1981; Janik, 2000). Some studies have already identified the signaler in a group of orcas (Miller et al., 2004), finding that the types and timing of calls are influenced by the calling behaviors of other members of the group.
Miller and Tyack (1998) used an array with 15 hydrophones towed from a boat. The results are compelling because their method enables identification of which individual produces a call unless a call comes from an individual within a closely spaced group. Unfortunately, the deployment of a towed array is costly and is, therefore, not convenient for a long-term natural experiment on free ranging whales and orcas are easily disturbed by boats (Holt et al., 2009, 2021). Recent advances in technology have enabled the use of D-tags (containing hydrophones, accelerometers, magnetometers, or GPS loggers) to study orca behaviors (Johnson et al., 2009; Tennessen et al., 2019). But currently, these studies have not made it possible to acoustically separate the individuals inside of a matriline of orcas. Furthermore, cetacean tags can also be negatives on individuals (Andrews et al., 2019). Regarding source separation from fixed antennas, the study of Gassmann et al. (2013) was able to locate orcas quite precisely, but they used a very large antenna of 14 hydrophones spaced several 10s of meters apart.
In this study, using our localization method allowed us to accurately assign an azimuth (the direction of the source from the observer) to a surface entity.
Once the individuals or matrilines were identified, we used a quantitative variable to describe the vocal behavior of the orcas : the Call Rate (CR), equal to the number of vocalizations each 10s for each individual or matriline. The CR is commonly used in underwater (Quick and Janik, 2008; Luís et al., 2014) and terrestrial (Leonard et al., 2003; Reers and Jacot, 2011) bioacoustics to quantitatively describe the emission of sound signals.
The objective of our study was to proceed with a protocol that allowed us to acoustically identify individual or matriline vocalizations under certain conditions. We used an audio-visual protocol based on the visual identification of orcas from the shore, and a four-hydrophone array submerged nearby offshore to separate each of the calls being emitted several 100 m away.
2. Materials and Methods
The study site was chosen offshore of the field research station OrcaLab (Pacific Orca Society), located on Hanson Island in Blackney Pass, British Columbia (50.574072-126.706390). Blackney Pass is part of the designated Critical Habitat for the Northern Resident Community of orcas. Northern Resident orcas use Blackney Pass throughout the year but most frequently from July through October. Blackney Pass links Blackfish Sound with Johnstone Strait and is one of two main routes used by the orcas to transit to and from Johnstone Strait, a key destination and location for orca feeding and social activity, and Johnstone Strait features the Robson Bight (Michael Bigg) Ecological Reserve that was established to protect the sensitive rubbing beaches within. Rubbing on the small smooth stones of selected beaches is a unique behavior favored by the Northern Residents. Resident orcas spend approximately 50–65% of their time foraging; resting, traveling, and socializing make up the remainder.
During the study period, OrcaLab provided logistical support, in terms of accommodations, expertise, supplying power requirements, and personnel assistance. OrcaLab has researched Northern Resident orcas for the past five decades and has extensive knowledge of their habits, acoustic traditions, and physical identification. OrcaLab has maintained a network of several remote hydrophones for four decades. This broad array network allows for the acoustic detection of matriline groups and their general movements within 50 sq km of the designated Critical Habitat.
To increase knowledge surrounding orca communication, our team designed a small aperture four-hydrophone array at a high sampling rate (4*192 kHz 16 bits). One goal was to record highly defined acoustic data from orcas passing in front of OrcaLab and connect these data to visual observations made from land at OrcaLab. The goal was to estimate the Time Delays of Arrival (TDoA) of the calls, thus their azimuth by a simple linear solver, and to assess a multi-modal label for each call : the type of call, azimuth, and identity of the emitting orca.
2.1. Acoustic Data Acquisition
The four-hydrophone array was a tetrahedral portable antenna of 12 kg (Figure 1) that used four SQ26-01 hydrophones with a high-frequency sensibility between 10 Hz and 50 kHz. The flat frequency response of the hydrophones is available in Supplementary Figure 1. The maximum aperture of this array was 77 cm.
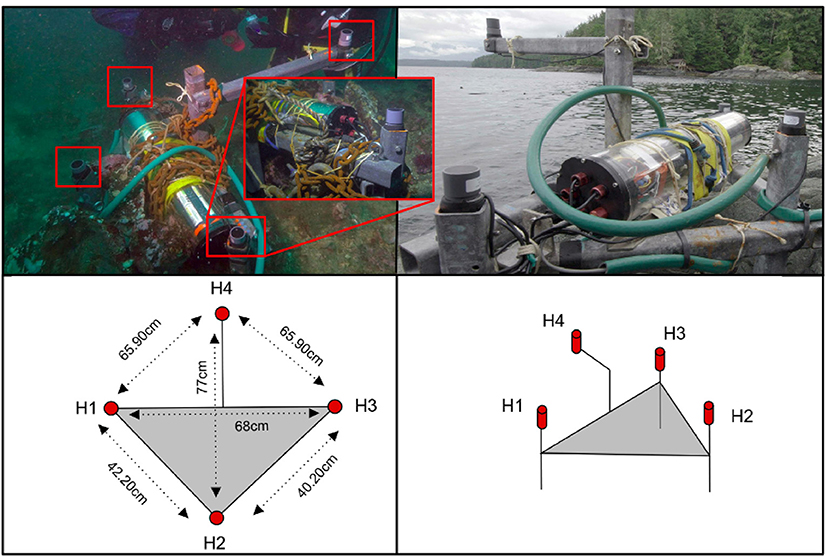
Figure 1. (Top) The four-hydrophone antenna, with the 12 V (green) cable connected into Orcalab. (Bottom) Diagram of the antenna and its inter-hydrophone distances.
It included a low-power high-resolution autonomous sound card (Supplementary Figure 2), called JASON (Barchasz et al., 2020), and the recording capability of up to five uncompressed channels at a sampling rate of up to 2 MHz, 16 bits. It can be accompanied by a low power acoustic trigger (Fourniol et al., 2018), but this was not necessary at OrcaLab because JASON was switched ON/OFF manually from OrcaLab when orcas were seen.
In this study, we recorded at a 192 kHz sampling rate on four channels.
We over-sampled the recording up to 192 kHz even if the bandwidth of the hydrophones was about 60 kHz, in order to increase the precision of the estimated 85 angles of arrival and to increase the efficiency of separating the calls individual by individual. The antenna was placed at a depth of 23 m. The GPS position of the array is 50.57 of latitude and –126.70 of longitude. The axis of the antenna H2 H4 was pointed north. The map of viewing and listening ranges is available in Supplementary Figure 3. Due to its weight and an additional 10 kg of ballast, there was no concern regarding its stability, even during strong currents (> 1 m/s).
The device was powered from the shore through 75 m of 12 V cable connected to OrcaLab. The ability to power the device from land allowed us to limit our recording to when orcas passed in front of OrcaLab. Later, we could correlate the acoustic data with visual observations from OrcaLab. The antenna was taken out of the water when the 512 GB microSD storage was full [corresponding to 90 h of recordings: 5010/ (4 * 2 * 192,000)/3,600)]. The recording sessions took place from the 20th of July to the 1st of August, the 4th of August to the 22nd of August, and the 23rd of August to the 15th of September 2019. In total, we recorded 42 vocal passages that included multiple orcas and three of them were further analyzed for this study.
Several recording samples are available from the 11th, 30th, and 31st of August, 2019, four channels, and 192 kHz SR (data availability statement).
2.2. Visual Data Acquisition
When orcas were spotted in Blackney Pass located in front of OrcaLab, the antenna was powered on by a simple on/off button from OrcaLab. It was turned off when the orcas were no longer visible (Figure 2). During each passing of the orcas, five observers at OrcaLab worked together to identify the groups and individuals present using the photo-identification catalogue of the NRKW (Northern Resident Killer Whales) population (Towers, 2015). Individuals can be discriminated based on natural markings such as notches on the dorsal fin, scars, or shape of the gray patch behind the dorsal fin. This task was always carried out by the same people:
• Person 1 (H.S.) : Real-time identification of groups and individuals (when possible) with a dedicated '“Big Eyes” binocular (Product, 2014),
• Person 2 (P.S.) : Using spotting scope to help H.S. for identifications (Bushnell Spacemaster 78–1,800 with, zoom 15 × 45),
• Person 3 (M.P.) : Recording of Person 1 (H.S) real-time comments and azimuths of each individual or matriline associated with the visual reference points in Blackney Pass. Each site was assigned a precise azimuth with a compass (e.g., “Green House” = 15 degrees). At every surfacing, the azimuth was recorded. The recordings were made using a mobile phone.
• Person 4 (A.Doohan) : Orcas azimuth check and photographing individuals.
• Person 5 (E.Vierling) : Photographing individuals.
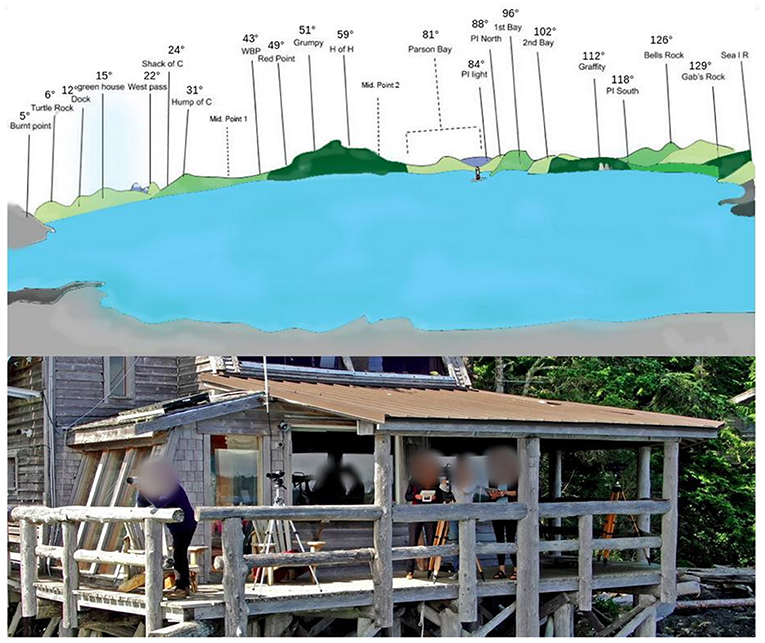
Figure 2. (Top) Representation of the view of Blackney Pass from Orcalab. Each site was assigned a precise azimuth using a compass (e.g., “Pi Light” = 84 degrees.). (Bottom) Picture of the visual protocol.
H.S and P.S experts of NRK identifications have been working on this population for several decades. A.Doohan, and E.Vierling were trained during the summer to participate in this protocol, notably for taking notes and taking photographs. M.P coordinated the protocol with H.S and P.S and learned the different visual reference points in Blackney Pass. All the devices used (“Big Eyes” binocular, camera, and telephones) were synchronized to the second before use.
If several groups were present at different azimuths, we used a second “Big Eyes” to make the identifications. Once the passage was finished, the whole team confirmed the presence of the individuals using the photographs and the photo-identification catalog (Towers, 2015). The map of viewing and listening ranges is available in Supplementary Figure 3 The listening range was estimated in consultation with the Orcalab experts H.S and P.S by means of the hydrophone array on site 24 h a day (Poupard et al., 2019a).
2.3. Annotation of the Recordings
Manual annotations of the vocalizations were conducted with Audacity to provide waveform and spectrogram visualization. Thanks to the experience of H.S, and the catalog of underwater calls produced by killer whales (Ford, 1987), three recordings were precisely annotated in which calls were identified and correlated. H.S. is one of the most experienced researchers on orca vocalization of this population, with extended and continuous analyses over more than 25 years. These three recordings were chosen because particular events took place, such as the arrival of a boat, or the meeting of several individuals. An example of 13 s of annotations (Supplementary Figure 4) and the list of the calls annotated in the experiments (Supplementary Figure 5) are available in Supplementary Material.
2.4. Azimuth Estimation of the Orca Calls Using the Hydrophone Array
As described in the previous section, each vocalization was detected and annotated. From the four channels, we computed the three independent Time Delay of Arrival (TDoA) by inter-correlations : τ21,τ31, τ41. The high sampling rate (192 kHz) allowed us to measure precise TDoAs. We estimated the azimuth of the sources with a linear solver (Bénard-Caudal et al., 2010). The advantage of this solver is that nothing prior is assumed on the travel of the orcas.
Current methodology shows how to implement the position and azimuth estimators in compact arrays and to evaluate their performance before the array is deployed (Urazghildiiev and Hannay, 2018), but it cannot be used to estimate motion parameters of sources that move at variable speeds and azimuth (TDoA) as do the orcas in our study. Thus, we ran, without any priors on the target motion, an azimuth only method based on TDoAs and a linear solver (Bénard-Caudal et al., 2010). Another advantage is that it integrates the three TDoAs from the four hydrophones to robustly solve only two unknowns (azimuth and elevation of the source). In this study, we did not use estimation of the elevation, as it was in a shallow water area and the orcas were near the surface. A tracking of a few individual orcas, without visual checking, has been realized in another study using many (14) hydrophones on a plurality (3) of compact arrays (Gassmann et al., 2013).
Then, we joined the azimuth estimates of each call to every identified orca using the visual positions noted by OrcaLab observers. We associated individuals or groups of orcas with a vocalization track by using a photo-identification catalog (Towers, 2015). If the visual position corresponded to the acoustic position, (within 5 degrees) then the call was attributed to an individual or to a matriline. When orcas were very close to each other (less than 7 m), it was difficult to associate a call with an individual, but in some cases we were able to associate vocalizations with a specific individual.
2.5. Calculation of the Call Rate and Statistical Tests
Once the individual or matriline was identified, we used a quantitative variable : the CR by counting the number of vocalizations every 10 s for individual or matriline. Thus, we divided the tracks into different periods (80 s, or 5*80 = 400 s), and we estimated the mean and variance of the CR over the non-overlapping 10-s intervals in each period. All the parameters chosen to carry out the CR are summarized in Table 1. Then, we performed statistical tests between periods and individual or matriline. The variance in CRs was not normally distributed as assessed by Shapiro-Wilk test (p < 0.05). Since our data did not follow a normal distribution, we performed a Kruskal-Wallis test (Breslow, 1970) followed by a post hoc test of Dunn-Bonferroni (Dunn, 1964). In order to denote the statistical difference between periods, we added letters on Figures 6, 10, 13. For periods with the same letter, the difference was not statistically significant. All the data processing is are summarized in Figure 3.
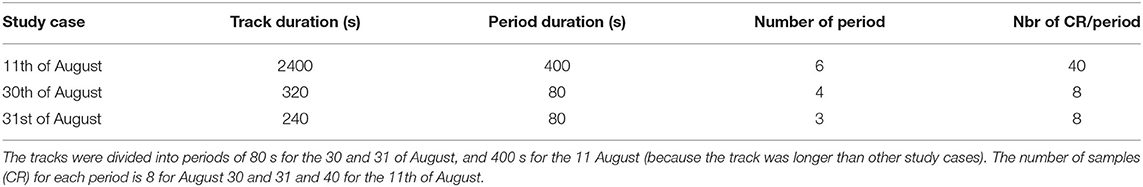
Table 1. Table of the three case studies summarizing the parameters chosen to carry out the statistical tests.
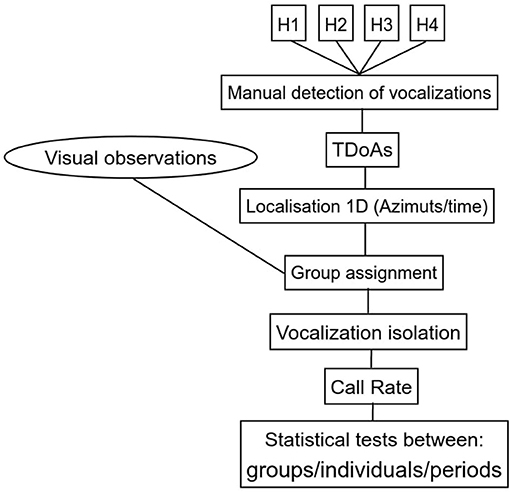
Figure 3. Synopsis of the protocol.
3. Results
The sessions of summer 2019 totaled 71 passages of orcas including 42 with vocalizations. Among the 57 passages during daytime, 29 passages included vocalizations (Table 2).
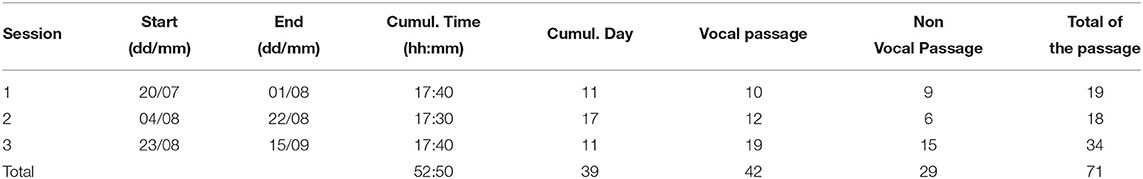
Table 2. Summary of the records of all of the sessions and the number of passages for each session.
We were able to isolate calls for three individuals (three males), because the males were somewhat removed from the group (minimum 50 m). A total of 85 vocalizations were produced by these three males (Table 3).
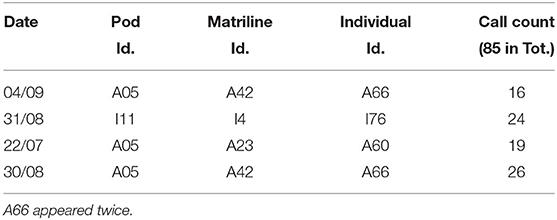
Table 3. Summary of the three individuals for which we isolated calls.
We focused on three particular events : 11th, 30th, and 31st of August. See Supplementary Figure 5 for the list of the heard and annotated vocalizations. The color of each call corresponds to the color in the scatter plots in Figures 5, 8, 9, 12.
3.1. First Observation (11th of August)
The first case study was on the 11th of August, when the A25, A50, A54, and I04 matrilines (mat.) came through Blackney Pass at 4:46 p.m. (16 individuals).
During this passage, the orcas were traveling at a moderate swim velocity of less than 13 kph. Then, at 5:08:20 p.m. a cruise ship (Figure 4) passed in front OrcaLab (traveling in the same direction as the orcas). Once the boat was present, the orcas dispersed and several surfed in its wake. This made individual identification more difficult.
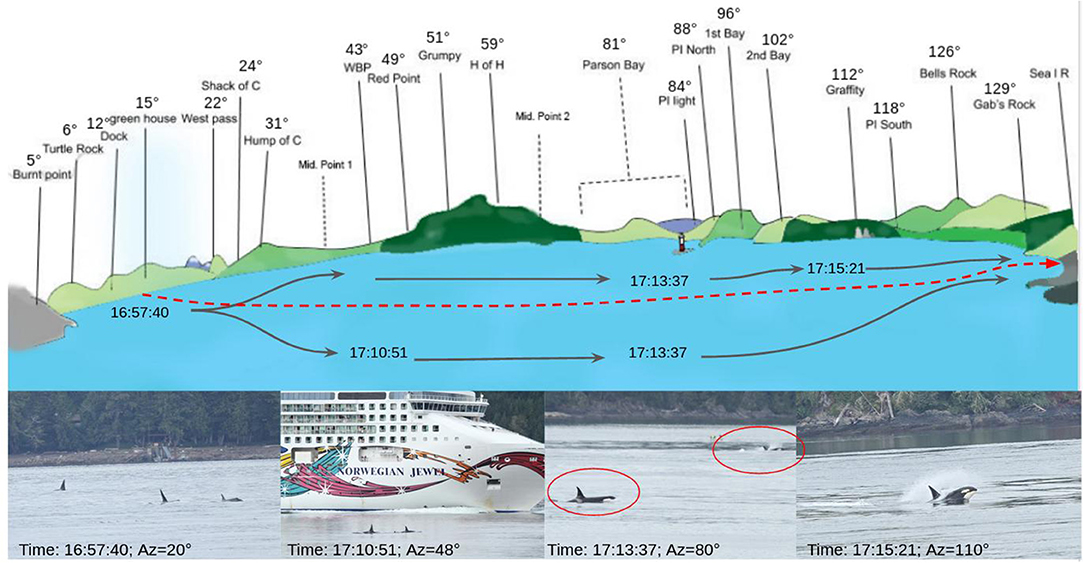
Figure 4. Graph of the passage of the 11th of August. Top: representation of the view of Blackney Pass from Orcalab with the visual position of the group. The red line is the boat trajectory. Bottom: pictures taken from Orcalab deck.
Figure 4 presents the azimuths of a group during the 11th of August event and includes associated pictures. We noticed that at the start of the trajectory, the orcas were gathered in a single group (picture on the left). Then, smaller groups formed and some orcas were on the right and left of the boat (picture 2 and 3). During the end of the track, some individuals “surfed” behind the ship (last picture, Figure 4).
Figure 5A illustrates the passage of this group. Each point represents a call placed in azimuth; the curves are the visual track of the individuals. Each visual observation matched the computed azimuth of each call (green dots). We thus validated the acoustic azimuth estimations.
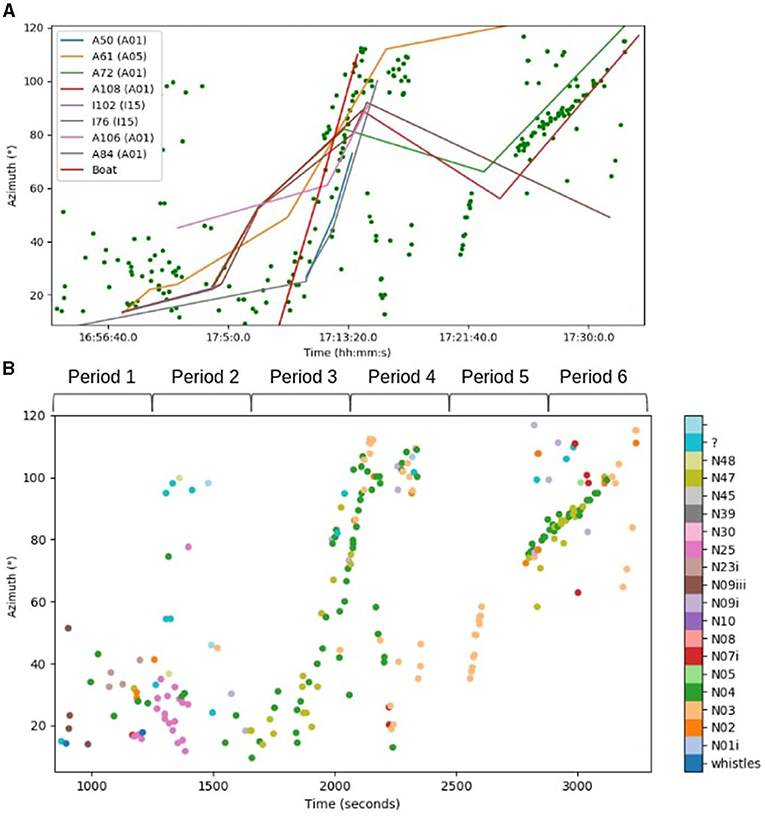
Figure 5. (A) Graph of the passage of the 11th of August. Each green point represents a vocalization placed in azimuth. The different curves are the positions of each individual visually detected. The red line is the visual trajectory of the boat. (B) Graph of the passage of the 11th of August. Each point represents a vocalization placed in azimuth. Each color represents a type of call. The most common types are N04, N03, and N48.
During the first part (until 5:15 p.m.) of the track, it was possible to recognize eight individuals from A05, A01, and I15 pods (Figure 5A). After the passage of the boat, the orcas split up so we lost the identification of four whales. From 5:16 p.m. to 5:30 p.m. we had the identifications of A61 (mat.A25), A72 (mat. A50), A108 (mat. A50), and I76 (mat. I04). Visual observations were supplemented by acoustic analyses. From 4:56 p.m. to 5:10 p.m. the orcas were together in Blackney Pass traveling at a slow speed. When the cruise ship arrived, the whales started to accelerate and followed the boat until azimuth 100°.
We were able to see this fast track visually and acoustically from 5:06 p.m. to 5:15 p.m. During the last part of the track, from 5:23 p.m. to 5:33 p.m., we observed that some orcas continued their trajectory while four individuals (from three different matrilines) turned around : A61 (mat.A25), A72 (mat.A50), A108 (mat.A50), and I76 (mat.I04). The male A61 (orange) is high in azimuth. Individuals A72, A108, and I76 had been traveling together for 10 min.
We were able to extract the types of vocalizations (Figure 5B). We divided this track into six parts to run statistical tests. The first and second parts were before the arrival of the cruise ship when the orcas traveled slowly and emitted call types N25, N04, N02, and N09iii. The third part happened when the boat came through Blackney Pass and the orcas followed it (surfing) and produced only N04 and N47 calls (1,700–2,000 s). At the end of the boat passage (period 4), they produced a lot of N04 and N03 calls, and some of them turned around. During periods 5 and 6, from 2,700 to 3,200 s, the track from 90° to 120° is composed of N04 and N47 calls. This is when the individuals, A72, A108, and I76 were traveling very close to each other. According to these observations, we could suppose that the boat not only had an influence on the velocity of the orcas, but also on the number of calls used.
To determine this, we counted the number of calls in order to check whether the boat had an influence on the CR. Figure 6 shows the result associated with the statistical tests. The CR means did not follow a normal distribution (Shapiro test, p = 0.0003), so the measures of the differences between the medians were calculated (Kruskal-Wallis test, p = 4.10e-05). After this, the Dunn-Bonferonni test was carried out and the significant differences are shown in Figure 6.
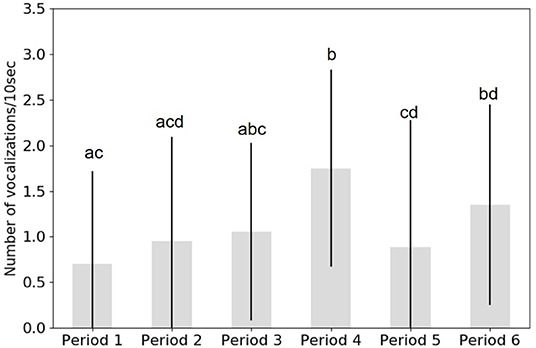
Figure 6. Graph of the mean of the call rate for each period of the 11st of August for each period (1–6) and the SD. The letters (a,b,c,d) show statistically significant differences between periods. Letters in common between periods mean that they are not significantly different. The arrival of the boat is during period 3.
During the first two periods (before the arrival of the boat), the density of calls was low. When the boat came through Blackney Pass (period 3), the density of calls started to increase until the boat was gone.
In fact, during period 4 (corresponding to the end of the passage of the boat) the CR was higher and significantly different from the first 2 periods.
When the orcas turned around, there were not as many calls (period 5). Then, the density increased again when A108, I72, and I76 traveled together (period 6).
3.2. Second Observation (30th of August)
The second case study was on the 30th of August in which the A42 and A25 matrilines of the A05 pod and the A54 matriline of the A01 pod came through Blackney Pass together (17 individuals). Figure 7 represents the passage of the 30th of August in front of OrcaLab with examples of four pictures taken from OrcaLab. The visual observations confirmed that the group was very compact and traversed quickly through the 4 km of Blackney Pass (the time needed to traverse BP is approximately 20 min).
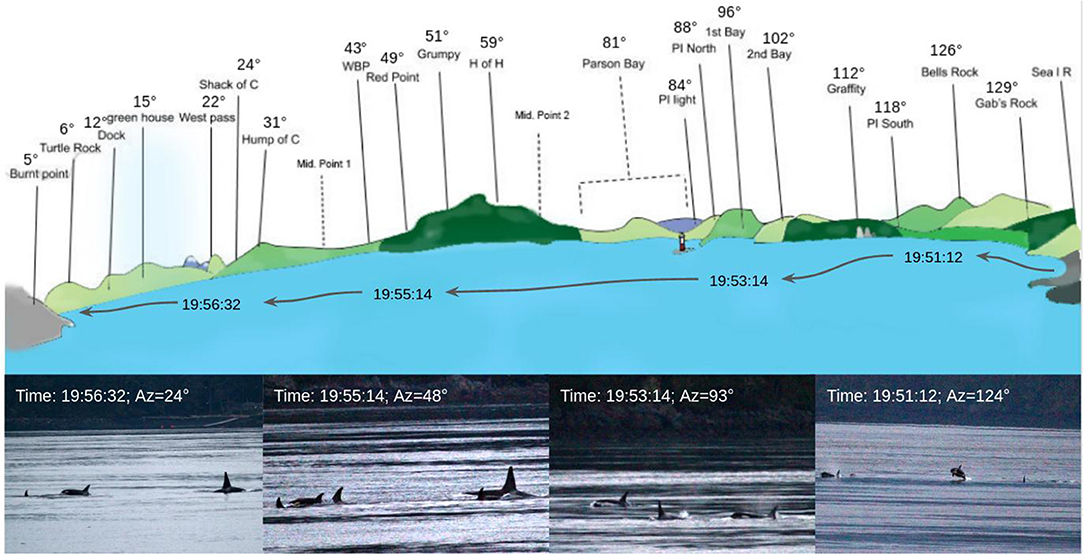
Figure 7. Graph of the passage of the 30th of August. Top: representation of the view of Blackney Pass from Orcalab with the visual position of the group. Bottom: pictures taken from Orcalab deck.
Figure 8A illustrates the passage of this group. Each point represents a call placed in azimuth; the blue curve is the visual track of the group. Each visual observation (blue curve) matched the computed azimuth of each call. We thus validated the acoustic azimuth estimations. For each call, we extracted the type of call and plotted it according to the azimuth of the orcas (Figure 8B). The track was quite compact, and the group (A42s, A54s, and A25s) traveled north very quickly. During this track, there were a lot of different calls (nine different types), which eventually subsided into the shared N03 call type. The A01s and A05s traveled together, and we attributed the calls to a pod following Ford (1987). Figure 9 shows the trajectory of A01s, A05s and their emitted calls. We divided the track into four parts and measured the CR in these periods for the A01s and A05s. The CR means did not follow a normal distribution (Shapiro test, p = 0.0026), so the differences between the medians were calculated (Kruskal-Wallis test, p = 1.10e-05).
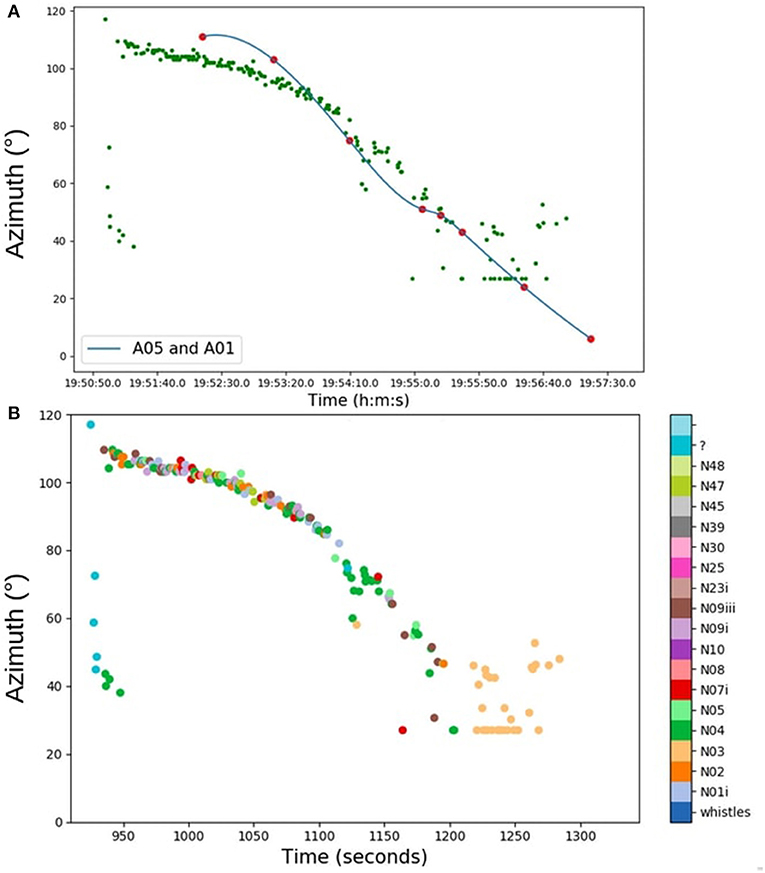
Figure 8. (A) Graph of the passage of the 30th of August. Each green point represents a vocalization placed in azimuth. The blue curve is the interpolation of the A05 and A01 visual azimuth estimations. (B) Graph of the passage of the 30th of August. Each point represents a vocalization placed in azimuth. Each color represents a type of call.
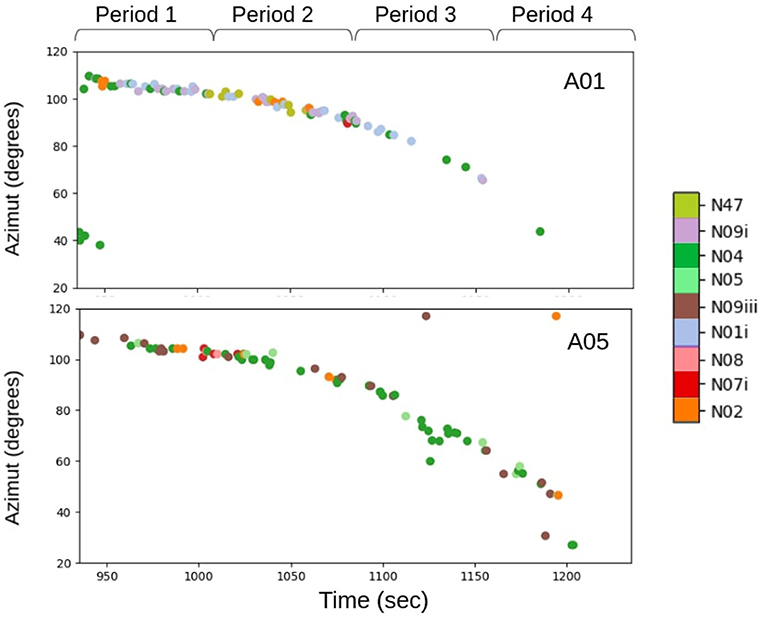
Figure 9. Graph of the passages of the 30th of August. Each point represents a vocalization placed in azimuth. Each color represents a type of call. Top: trajectory of the A01s, Bottom: trajectory of the A05s.
After this, post hoc testing was used to evaluate differences between each distribution pair (Dunn-Bonferroni tests) (Figure 10).
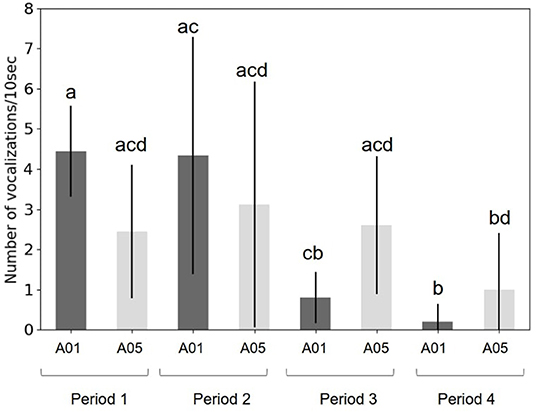
Figure 10. Graph of the call rate of the 30th of August for each period and for the A01s (dark gray) and the A05s (light gray).
This graph shows significant differences between time periods and pods. During periods 1 and 2, the CR was higher for the A01 pod; then, this was reversed for periods 3 and 4. During the last period (4), the CR for A01 pod was different from periods 1 and 2.
When the density of calls of A01s increased, the CR of the A05s decreased (Figure 10), but the CR for the two pods (A05 and A01), during the same period, was not statistically different.
This case study showed us that when individuals were too close together, it was difficult to identify matrilines or individuals by azimuth. But we were able to study the CR thanks to the acoustic identification of the different pods present.
3.3. Third Observation (31st of August)
We focused here on the 31st of August, when a large group made up of I16s, I65s, I04s, and I27s came through Blackney Pass (16 individuals). The majority of the four matrilines traveled together; the male I76 (mat.I04), traveled by himself behind the large composite group, eventually joining them at the end of the track.
Figure 11 shows the visual trajectory photographed from OrcaLab and the representation of the trajectory in Blackney Pass. The orange curve represents the large group and the white curve the male I76. Visual observations allowed us to validate our azimuthal positions from the acoustic antenna.
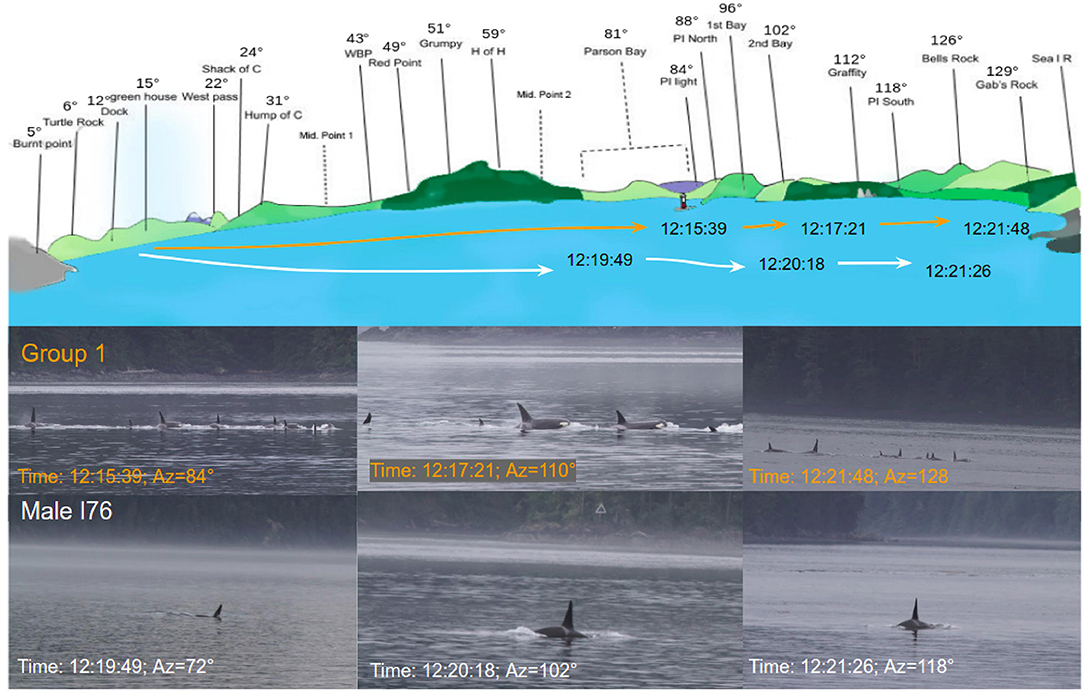
Figure 11. Graph of the passage of the 31st of August. Top: representation of the view of Blackney Pass from Orcalab with the visual position of the group (orange) and the male I76 (white). Bottom: pictures taken from Orcalab.
In Figure 12A, each point represents a vocalization placed by the estimated acoustic azimuth. The blue and orange curves are the interpolated visual azimuths of the male I76 and the large group, respectively. We see that it was possible to assign vocalizations either to the individual male or to the larger group because each acoustic position corresponded to a visual position. This result allowed us to isolate 24 calls from the male I76.
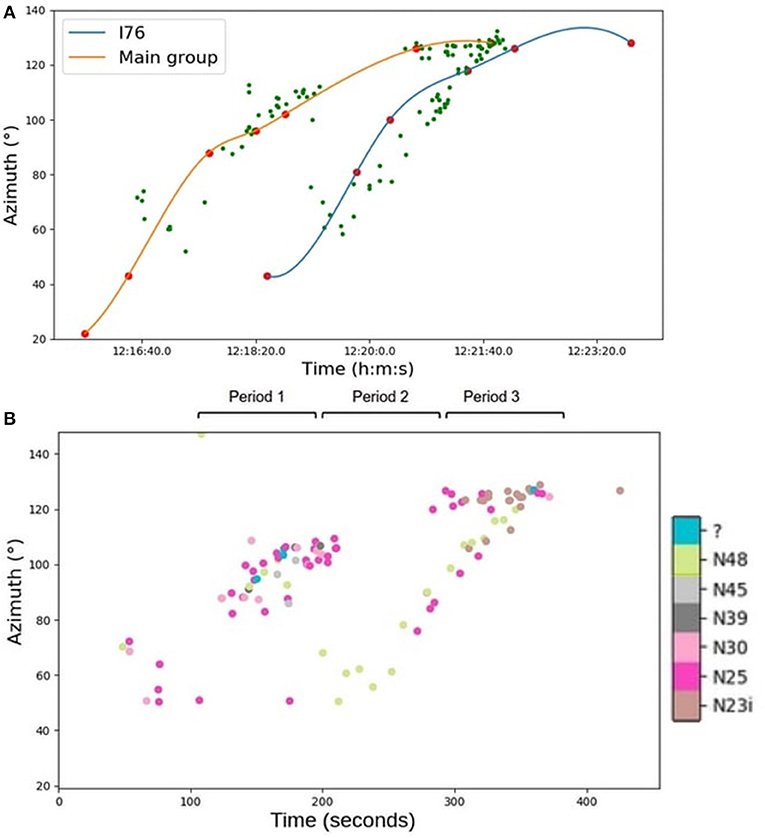
Figure 12. (A) Graph of the passage of the 31st of August. Each green point represents a vocalization placed in azimuth. The blue curve is the interpolated position of the male I76 visually detected, the orange curve is the large group. (B) Graph of the passage of the 31st of August. Each point represents a vocalization placed in azimuth. Each color represents a type of call. The most common types are N25, N48, and N23i. The track was split into three 80-s periods.
From the manual annotations, we made correlations between the azimuth and the type of calls for the large group and I76.
For these recordings, seven different calls were produced (Figure 12B). Each point represents a call with its type in color. We see that the right track (I76) is composed of N48 (green), N25 (pink), and N23i (brown). Thus, we could assume that when the male was alone, he made a combination of two calls, N48 and N25, and when he was close enough to his group, he produced N23i calls to which his group answered with the same type. The large group produced all types of calls, including type N23i (brown) at the end of the track. We can see that the N23i type call is produced just before and after I76 merged with the larger group.
We measured the CR for the group and the male I76, in order to see whether there were different periods of call exchanges. To do this, the number of vocalizations was counted every 10 s and its average was calculated for each period.
The means did not follow a normal distribution (Shapiro test, p = 0.0043), so the measure of the differences between the medians was calculated (Kruskal-Wallis test, p = 0.0022). Medians were statistically different. Post hoc testing was used to evaluate differences between each distribution pair (Dunn-Bonferroni tests).
The result is shown in Figure 13. In the first period, the large group was acoustically active compared to the male I76 (post hoc Bonferroni test, p < 0.00006). During the second and third periods, there was no statistically different CR between the group and I76.
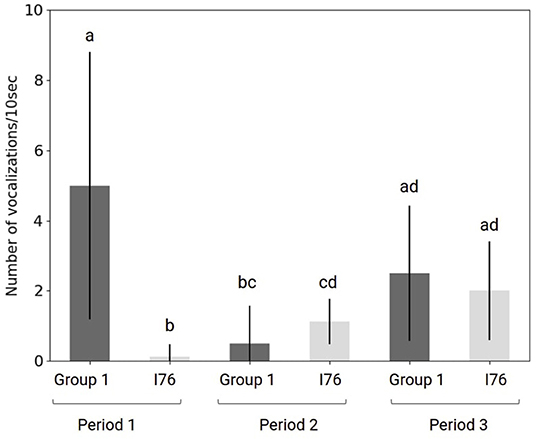
Figure 13. Graph of the call rate of the 31st of August for each period and for the group (dark gray) and the male I76 (light gray).
We observed that when the male started calling (period 2), the group did not call (compared to period 1). During the third period (meeting), the CR of the group and I76 both increased.
4. Discussion
In order to coordinate their activities, maintain group cohesion, or recognize members in the group, orcas need to communicate (Grebner et al., 2008). To describe the orca intra-group communication, we calculated the CR for each individual or group. The CR could be different according to behavioral categories and particular events. This preliminary result is in agreement with Grebner (2009), which showed that orcas can initiate contact using discrete pulsed calls during particular events.
Our results show that one can track individual calls of orcas in free range in order to study their CR variation according to various parameters like the presence of a boat or the relative position of an individual vs. a group of whales. To accomplish this, we analyzed three different natural scenes or observations. Previous shore-based fixed hydrophone systems enabled the detection and tracking of orcas from the same population (Grebner, 2009; Bergler et al., 2019; Poupard et al., 2019a; Best et al., 2020) but did not succeed in associating individuals with calls or determine precise individual pattern variations of communication between groups. Tracking of a few individual orcas in another population, without visual checking, has been realized in a complex pilot study using 14 hydrophones deployed in three compact arrays (Gassmann et al., 2013). Our protocol is based on a single compact array with only four hydrophones (maximum aperture of 0.6 m) combined with visual observations for identification validation. It is light (20 kg) and dense, which allows for easy transportation and installation compared to previous multichannel orca recordings (Freitag and Tyack, 1993; Mellinger et al., 2007; Grebner, 2009; Gassmann et al., 2013; Bergler et al., 2019). In addition, this study showed several advantages that fixed hydrophones have over acoustic D-tags and towed arrays. With our protocol, we had the ability to record over long periods of time and avoid altering the natural behaviors of the orcas through artificial noise and boat presence. The material, using a low power custom high velocity sound card, in addition to being easy to use, is also relatively inexpensive totalling less than $2,000 USD. Its large storage (512GB) and power supply capacity connected to the shore also allowed us to leave the antenna submerged for several weeks, thus maximizing the observations with light logistics. This study is based on known methods for bioacoustics and source localization, such as manual detections of the calls, the calculations of the TDoAs, the linear solver, and the calculation of the CR. This study presents the use of a compact array (0.6 m) (Urazghildiiev and Hannay, 2018) for an azimuth estimation of orcas, without any priors on the target (Bénard-Caudal et al., 2010). Our method relies on a high sampling rate to measure three TDoAs, then estimating the azimuth through a simple linear solver. We ran the estimations from real recordings combined with visual observations of the sources to demonstrate the robustness of the method. The resulting diarization of the orcas yields new accurate observations of the modulation of individual CR even in the context of boat noise.
In shallow water areas, as in our study, the range estimation is limited (Urazghildiiev and Hannay, 2018). Thus, we aimed to estimate azimuth of the positions of orcas. The main difficulty with implementing azimuth-only techniques with stationary arrays is that the position estimates are unobservable from the azimuth measurements if the statistics on the speed of the source are unknown and if the heading of the target is not constant (Urazghildiiev and Hannay, 2018). Because we do not have motion parameters of orcas that move at variable speed and azimuth, we ran, without any priors on the target motion, an heading-only method, based on TDoAs and a linear solver (Bénard-Caudal et al., 2010). Another advantage is that it integrates the three TDoAs from the four hydrophones to robustly solve only the two unknowns: azimuth and elevation of the source. In this study, we do not use estimation of the elevation as in shallow water areas orcas are nearer to the surface. The elevation will be used in further studies to better diarize orcas.
In order to test/validate our material and method, we analyzed three different natural scenes presenting specific situations such as the presence of boats, and the relative position of an individual vs. a group of whales. These three case studies serve as examples of how our protocol can be applied and used. The results of the three case studies presented, are therefore, only trends and must subsequently be validated at larger scales even if statistical tests have been set up. Once the calls had been allocated to a group or individual, we chose to work on the evolution of the CR along each orca track. The first case study analyzed the CR of a group of orcas in the presence of a cruise ship. The CR increased significantly at the end of the passage of the ship and when the ship moved away, whereas the CR was stable before the arrival of the ship.
Anthropogenic noise has an influence on orca emissions. Holt et al. (2009) have proven that orcas increase their call amplitude in response to vessel noise. Our study complements this observation, showing that orcas could change both their trajectory and CR when a large vessel was present. However, the presence of a vessel at the same time as the orcas only happened once in our study. We, therefore, cannot yet verify that the change in CR was due to the presence of a vessel, suggesting that this result is a trend and will need to be later validated on a larger scale.
Recently, Holt et al. (2021) showed that the hunting behavior of this population was affected by the close presence of boats, and that females and males respond differently to nearby vessels. These results align with our study, which showed distinct behavioral responses such as surfing, distancing, and increased CR when the orca, were in the same vicinity as a cruise ship.
In the second observation (30th of August), orcas passed in front of OrcaLab and composed of A05 pod (mat. A42 and A25) and the A01 pod (mat. A54). The tracks of these groups were interesting : Two pods traveled together and exchanged a lot of calls for several minutes and at the end of the trajectory a lot of N03 calls were emitted (Figure 8). In Ford (1989), it was realized that N03 calls are produced after periods of social activity or high-arousal contexts like active foraging. Moreover, the lower source level of the N03 call makes this call more suitable during close range vocal exchanges (Miller, 2006). Our preliminary results suggest that pods emit calls in turn, alternating low and high CR when traveling together, and the track is split into different time periods (Figure 9) or when there are particular combinations of calls. Our observations suggest that individuals from different pods (A05 and A01) communicate while traveling together. We propose two hypotheses: First, when more than one pod travels closely and one pod begins communicating, individuals from the other pod might try to be silent in order to facilitate the communication between individuals of the first pod.
Second, and following Krebs et al. (1981), we could assume the existence of a veritable interaction between these two pods. For example, when the first pod vocalizes, then a 2nd pod may respond to them (and vice-versa). According to the second hypothesis, the type of call provides particular information to the original signaler: The combination of particular calls from A05 depends on the emission of particular A01 calls (Figure 9). By increasing the number of recordings and analyses, we will eventually be able to highlight the interactions between the matrilines on a large temporal scale.
In the third observation, on the 31st of August, a big group made up of the I16, I65, I04, and I27 matrilines came through Blackney Pass. Behind them was a lone male orca, I76 (mat. I04). This scene is noteworthy because the male traveled far behind his group and made specific types of calls. When he was far from his group, he made a combination of N25 and N48 calls, but once he approached his group, he vocalized with the N23i call type and his group answered with the same type of call. We conclude that modulations of call types could improve the ability of orcas to give information on their relative positions and help to localize each other.
Furthermore, there may be a greater need for redundancy in communication signals in large groups as is typical of common dolphins, requiring faster signal production to facilitate inter-individual or group cohesion. Our results can complement the study of Grebner (2009) who highlighted the production of calls before the meeting of two groups. Orcas could use particular types of calls in order to improve good propagation in the water and facilitate the reception of the signal.
When somewhat isolated, the male I76 made a particular type of call and modulated his CR (Figure 12). As he got closer to his group, he increase his CR (period 3) and emitted other call types in the direction of his group presumably in order to facilitate communication (Miller, 2002). Additionally, the group decreased its CR. Such changes in the CR may occur when individuals are separated from group. A similar pattern is shown for other species : Bottlenose dolphins (Cook et al., 2004), Spider monkeys (Ramos-Fernández, 2005), and Chimpanzees (Mitani and Nishida, 1993).
All of these preliminary results demonstrate the interest of the presented protocol. It can be implemented over the long term, for different species, in order to get strong statistical conclusions on bioacoustical behavior. Different scientific perspectives may be considered. The first would be to increase the number of recordings in order to confirm the different trends of this study such as the influence of vessels on CR. We will, therefore, be able to statistically show that certain parameters can influence the intra-group communication of the NRKW community. By increasing the recordings, we can also create an individual call directory. The latter will allow us to potentially look for individual signatures within the different vocalizations.
For this study, the antenna was connected to Orcalab via a power cable. We then sent the data (.wav) directly back to the research station in order to carry out the TDoAs calculations in real time. In this study, we only used CR to describe communication, but it will be possible to use other parameters such as the vocalization parameters (maximum, minimum frequency, calls duration, and time of first peak) (Ford, 1989; Poupard et al., 2019b). Further work will be conducted to characterize the robustness of the method adding boat noises on the recordings (the estimate of false negatives and the bias of the estimates of the azimuth). The range estimation is difficult for distant sources in shallow water areas (Urazghildiiev and Hannay, 2018). It could be facilitated by a larger aperture, up to 10 m, which remains a compact array, but could allow the calculation of the speed of individuals and a 3D analysis of their activity. Moreover, analysis on the frequency content of these vocalizations will make it possible to study strategies of orcas to maintain their inter-group communication under strong anthropic pressure. This would help characterize nuisance thresholds beyond the usual physiological threshold criteria.
The results and trends of this study show the relevance of a fixed very small aperture four hydrophones of the antenna for the study of intra-group communication in orcas.
Data Availability Statement
The datasets presented in this study can be found in online repositories. The names of the repository/repositories and accession number(s) can be found below: The original recordings samples are available from the 11th 30th, 31st of August, 4 channels, 192 kHz SR 16 bits (under copyright of the authors) at the address: http://sabiod.univ-tln.fr/pub/orca_SR/. An animation of the last observation (31st of August) is available at the address: http://sabiod.lis-lab.fr/pub/OL_Frontiers2021/.
Ethics Statement
Ethical review and approval was not required for the animal study because this study was carried out on wild Orcas. We did not use boat or d-tags. We just put an acoustic antenna in front of the Orcalab research station.
Author Contributions
HG and MP defined the protocol, have built and prepared the antenna, computed the detection and the azimuth of the vocalizations. HS, PS, and MP participated in the visual data acquisition. HS annotated the recordings (Audacity). MP, HG, and HS wrote the manuscript and produced the results. All the authors conceived the experiment, participated with the installation the antenna, and authors discussed the results and reviewed the manuscript.
Funding
This research is partly funded by: FUI 22 Abyssound, ANR-18-CE40-0014 SMILES, ADSIL ANR-20-CHIA-0014-01 DGA AID national Chair in AI for bioacoustics (H.G.), MARITTIMO Intereg European FEDER GIAS project, MI CNRS MASTODONS sabiod.org, and Pole INPS Univ Toulon. M. Poupard's Phd was cofunded by Biosong SAS and the University of Toulon. We thank the Annenberg Foundation grant 18-581 and the Gencon Foundation.
Conflict of Interest
The authors declare that the research was conducted in the absence of any commercial or financial relationships that could be construed as a potential conflict of interest.
Publisher's Note
All claims expressed in this article are solely those of the authors and do not necessarily represent those of their affiliated organizations, or those of the publisher, the editors and the reviewers. Any product that may be evaluated in this article, or claim that may be made by its manufacturer, is not guaranteed or endorsed by the publisher.
Acknowledgments
We thank OrcaLab and its volunteers for welcoming MP and HG during the summer of 2019 to set up this research. We thank M. Hockin-Bennett for her indispensable help on the dives. We thank E. Vierling and A. Doohan for their essential support. We thank SMIoT Scientific Instrumentation (V. Gies and V. Barchasz), and INPS of UTLN for the development of the JASON DAQ project.
Supplementary Material
The Supplementary Material for this article can be found online at: https://www.frontiersin.org/articles/10.3389/fmars.2021.681036/full#supplementary-material
Supplementary Figure 1. The frequency response of the hydrophone SQ26.
Supplementary Figure 2. The JASON CARD.
Supplementary Figure 3. The range map of the antenna.
Supplementary Figure 4. An example of annotation.
Supplementary Figure 5. The list of all calls.
References
Andrews, R. D., Baird, R. W., Calambokidis, J., Goertz, C. E., Gulland, F. M., Heide-Jorgensen, M. P., et al. (2019). Best practice guidelines for cetacean tagging. J. Cetacean Res. Manage. 20, 27–66. doi: 10.47536/jcrm.v20i1.237
Bain, D. (1986). Acoustic behavior of Orcinus: sequences, periodicity, behavioral correlates and an automated technique for call classification. Behav. Biol. Killer Whales 1, 335–371.
Barchasz, V., Gies, V., Marzetti, S., and Glotin, H. (2020). “A novel low-power high speed accurate and precise DAQ with embedded artificial intelligence for long term biodiversity survey,” in Proceedings of the Acustica Symposium (Lyon).
Bénard-Caudal, F., Giraudet, P., and Glotin, H. (2010). Whale 3D monitoring using astrophysic nemo onde two meters wide platform with state optimal filtering by rao-blackwell monte carlo data association. Appl. Acoust. 71, 994–999. doi: 10.1016/j.apacoust.2010.05.018
Bergler, C., Schröter, H., Cheng, R. X., Barth, V., Weber, M., Nöth, E., et al. (2019). Orca-spot: an automatic killer whale sound detection toolkit using deep learning. Sci. Rep. 9, 1–17. doi: 10.1038/s41598-019-47335-w
Best, P., Ferrari, M., Poupard, M., Paris, S., Marxer, R., Symonds, H., et al. (2020). “Deep learning and domain transfer for orca vocalization detection,” in Proceeding of the2020 International Joint Conference on Neural Networks (IJCNN) (Glasgow: IEEE).
Breslow, N. (1970). A generalized kruskal-wallis test for comparing k samples subject to unequal patterns of censorship. Biometrika 57, 579–594. doi: 10.1093/biomet/57.3.579
Burham, R., Palm, R., Duffus, D., Mouy, X., and Riera, A. (2016). The combined use of visual and acoustic data collection techniques for winter killer whale (Orcinus orca) observations. Glob. Ecol. Conserv. 8, 24–30. doi: 10.1016/j.gecco.2016.08.001
Cook, M. L., Sayigh, L. S., Blum, J. E., and Wells, R. S. (2004). Signature-whistle production in undisturbed free-ranging Bottlenose dolphins (Tursiops truncatus). Proc. R. Soc. 271, 1043–1049. doi: 10.1098/rspb.2003.2610
Council, N. R. (2003). “Ocean noise and marine mammals,” in National Research Council (US) Committee on Potential Impacts of Ambient Noise in the Ocean on Marine Mammals (Washington, DC: National Academies Press).
Dunn, O. J. (1964). Multiple comparisons using rank sums. Technometrics 6, 241–252. doi: 10.1080/00401706.1964.10490181
Filatova, O., Burdin, A., and Hoyt, E. (2010). Horizontal transmission of vocal traditions in killer whale (Orcinus orca) dialects. Biol. Bull. 37, 965–971. doi: 10.1134/S1062359010090104
Filatova, O., Guzeev, M., Fedutin, I., Burdin, A., and Hoyt, E. (2013). Dependence of killer whale (Orcinus orca) acoustic signals on the type of activity and social context. Biol. Bull. 40, 790–796. doi: 10.1134/S1062359013090045
Foote, A. D., Osborne, R. W., and Hoelzel, A. R. (2004). Whale-call response to masking boat noise. Nature 428, 910–910. doi: 10.1038/428910a
Ford, J. K. (1987). A Catalogue of Underwater Calls Produced by Killer Whales (Orcinus orca) in British Columbia. Department of Fisheries and Oceans, Fisheries Research Branch, Canada.
Ford, J. K. (1989). Acoustic behaviour of resident killer whales (Orcinus orca) off vancouver island, british columbia. Can. J. Zool. 67, 727–745. doi: 10.1139/z89-105
Ford, J. K. (1991). Vocal traditions among resident killer whales (Orcinus orca) in coastal waters of British Columbia. Can J Zool. 69, 1454–1483. doi: 10.1139/z91-206
Ford, J. K. (2009). “Killer whale: (Orcinus orca),” in Encyclopedia of Marine Mammals, (Elsevier), 650–657. Available online at: https://www.sciencedirect.com/science/article/pii/B9780123735539001504
Fourniol, M., Gies, V., Barchasz, V., Kussener, E., Barthelemy, H., Vauche, R., et al. (2018). “Low-power wake-up system based on frequency analysis for environmental internet of things,” in 2018 14th IEEE/ASME International Conference on Mechatronic and Embedded Systems and Applications (MESA) (Oulu: IEEE), 1–6.
Freitag, L. E., and Tyack, P. L. (1993). Passive acoustic localization of the atlantic bottlenose dolphin using whistles and echolocation clicks. J. Acoust. Soc. Am. 93, 2197–2205. doi: 10.1121/1.406681
Gassmann, M., Elizabeth Henderson, E., Wiggins, S. M., Roch, M. A., and Hildebrand, J. A. (2013). Offshore killer whale tracking using multiple hydrophone arrays. J. Acoust. Soc. Am. 134, 3513–3521. doi: 10.1121/1.4824162
Grebner, D. M. (2009). Individual Killer Whale Vocal Variation During Intra-Group Behavioral dynamics (Ph.D. thesis). Pennsylvania State Univ.
Grebner, D. M., Bradley, D. L., Capone, D. E., Parks, S. E., Miksis-Olds, J. L., and Ford, J. K. (2008). Localization of killer whale mother, juvenile, and calf vocalizations. J. Acoust. Soc. Am. 124, 2507–2507. doi: 10.1121/1.4782887
Holt, M. M., Noren, D. P., Veirs, V., Emmons, C. K., and Veirs, S. (2009). Speaking up: killer whales (Orcinus orca) increase their call amplitude in response to vessel noise. J. Acoust. Soc. Am. 125, EL27–EL32. doi: 10.1121/1.3040028
Holt, M. M., Tennessen, J. B., Ward, E. J., Hanson, M. B., Emmons, C. K., Giles, D. A., et al. (2021). Effects of vessel distance and sex on the behavior of endangered killer whales. Front. Mar. Sci. 7:1211. doi: 10.3389/fmars.2020.582182
Janik, V. M. (2000). Whistle matching in wild bottlenose dolphins (Tursiops t.). Science 289, 1355–1357. doi: 10.1126/science.289.5483.1355
Johnson, M., de Soto, N. A., and Madsen, P. T. (2009). Studying the behaviour and sensory ecology of marine mammals using acoustic recording tags: a review. Mar. Ecol. Prog. Ser. 395, 55–73. doi: 10.3354/meps08255
Krebs, J. R., Ashcroft, R., and Van Orsdol, K. (1981). Song matching in the great tit Parus major L. Anim. Behav. 29, 918–923. doi: 10.1016/S0003-3472(81)80029-2
Leonard, M. L., Horn, A. G., and Parks, E. (2003). The role of posturing and calling in the begging display of nestling birds. Behav. Ecol. Sociobiol. 54, 188–193. doi: 10.1007/s00265-003-0626-z
Luís, A. R., Couchinho, M. N., and dos Santos, M. E. (2014). Changes in the acoustic behavior of resident Bottlenose dolphins near operating vessels. Mar. Mamm. Sci. 30, 1417–1426. doi: 10.1111/mms.12125
Mellinger, D. K., Stafford, K. M., Moore, S. E., Dziak, R. P., and Matsumoto, H. (2007). An overview of fixed passive acoustic observation methods for cetaceans. Oceanography 20, 36–45. doi: 10.5670/oceanog.2007.03
Miller, P. J. (2002). Mixed-directionality of killer whale stereotyped calls: A direction of movement cue? Behav. Ecol. Sociobiol. 52, 262–270. doi: 10.1007/s00265-002-0508-9
Miller, P. J. (2006). Diversity in sound pressure levels and estimated active space of resident killer whale vocalizations. J. Comp. Physiol. A 192, 449. doi: 10.1007/s00359-005-0085-2
Miller, P. J., Shapiro, A., Tyack, P., and Solow, A. (2004). Call-type matching in vocal exchanges of free-ranging resident killer whales, (Orcinus orca). Anim. Behav. 67, 1099–1107. doi: 10.1016/j.anbehav.2003.06.017
Miller, P. J., and Tyack, P. L. (1998). A small towed beamforming array to identify vocalizing resident killer whales (Orcinus orca) concurrent with focal behavioral observations. Deep Sea Res. II Top. Stud. Oceanogr. 45, 1389–1405. doi: 10.1016/S0967-0645(98)00028-9
Mitani, J. C., and Nishida, T. (1993). Contexts and social correlates of long-distance calling by male chimpanzees. Anim. Behav. 45, 735–746. doi: 10.1006/anbe.1993.1088
Poupard, M., Best, P., Schlüter, J., Prévot, J.-M., Symonds, H., Spong, P., et al. (2019a). “Deep learning for ethoacoustics of orcas on three years pentaphonic continuous recording at OrcaLab revealing tide, moon and diel effects,” in IEEE OCEANS (Marseille: IEEE), 1–7.
Poupard, M., de Montgolfier, B., and Glotin, H. (2019b). “Ethoacoustic by bayesian non parametric and stochastic neighbor embedding to forecast anthropic pressure on dolphins,” in IEEE OCEANS (Marseille: IEEE), 1–5.
Product, R.-C. B. E. (2014). Big Eyes Binoculars-Product Repair. Available online at: http://www.bigeyes.ca/f_03_specifications_binoculars.htm.
Quick, N. J., and Janik, V. M. (2008). Whistle rates of wild Bottlenose dolphins (Tursiops truncatus): Influences of group size and behavior. J. Comp. Psychol. 122, 305. doi: 10.1037/0735-7036.122.3.305
Ramos-Fernández, G. (2005). Vocal communication in a fission-fusion society: do spider monkeys stay in touch with close associates? Int. J. Primatol. 26, 1077–1092. doi: 10.1007/s10764-005-6459-z
Reers, H., and Jacot, A. (2011). The effect of hunger on the acoustic individuality in begging calls of a colonially breeding weaver bird. BMC Ecol. 11:3. doi: 10.1186/1472-6785-11-3
Tennessen, J. B., Holt, M. M., Hanson, M. B., Emmons, C. K., Giles, D. A., and Hogan, J. T. (2019). Kinematic signatures of prey capture from archival tags reveal sex differences in killer whale foraging activity. J. Exp. Biol. 222:jeb191874. doi: 10.1242/jeb.191874
Towers, J. R. (2015). Photo-identification Catalogue and Status of the Northern Resident Killer Whale Population in 2014. Canada: Fisheries and Oceans.
Keywords: orca, call-rate, diarization, intra-group, communication, compact hydrophone array, call assignment
Citation: Poupard M, Symonds H, Spong P and Glotin H (2021) Intra-Group Orca Call Rate Modulation Estimation Using Compact Four Hydrophones Array. Front. Mar. Sci. 8:681036. doi: 10.3389/fmars.2021.681036
Received: 15 March 2021; Accepted: 03 September 2021;
Published: 12 October 2021.
Edited by:
Miles James Parsons, Australian Institute of Marine Science (AIMS), AustraliaReviewed by:
Ildar Urazghildiiev, JASCO Applied Sciences (Canada) Ltd., CanadaBrigitte Schlögl, Leipzig University, Germany
Copyright © 2021 Poupard, Symonds, Spong and Glotin. This is an open-access article distributed under the terms of the Creative Commons Attribution License (CC BY). The use, distribution or reproduction in other forums is permitted, provided the original author(s) and the copyright owner(s) are credited and that the original publication in this journal is cited, in accordance with accepted academic practice. No use, distribution or reproduction is permitted which does not comply with these terms.
*Correspondence: Marion Poupard, cG91cGFyZG1hcmlvbkBnbWFpbC5jb20=