 Jun Liu
 Haibin Zhang
- Institute of Deep-Sea Science and Engineering, Chinese Academy of Sciences, Sanya, China
Environmental DNA (eDNA) metabarcoding is an emerging tool to estimate diversity by combining DNA from the environmental samples and the high-throughput sequencing. Despite its wide use in estimating eukaryotic diversity, many factors may bias the results. Maker choice and reference databases are among the key issues in metabarcoding analyses. In the present study, we compared the performance of a novel 28S rRNA gene marker designed in this study and two commonly used 18S rRNA gene markers (V1-2 and V9) in estimating the eukaryotic diversity in the deep-sea sediments. The metabarcoding analyses based on the sediment surveys of the Okinawa Trough found that more eukaryotic taxa were discovered by 18S V9 than 28S and 18S V1-2, and that 18S V9 also performed better in metazoan recovery than the other two markers. Although a broad range of taxa were detected by the three metabarcoding markers, only a small proportion of taxa were shared between them even at the phylum level. The non-metric multidimensional scaling (NMDS) analysis also supported that communities detected by the three markers were distinct from each other. In addition, different communities were resolved by different reference databases (NCBI nt vs. SILVA) for the two 18S markers. Combining the three markers, annelids were found to be the most abundant (44.9%) and diverse [179 operational taxonomic units (OTUs)] metazoan group in the sediments of the Okinawa Trough. Therefore, multiple independent markers are recommended to be used in metabarcoding analyses during marine diversity surveys, especially for the poorly understood deep-sea sediments.
Introduction
About 8.7 million eukaryotic species are predicted to inhabit Earth with ∼2.2 million in the ocean, however, most of them are not described (Mora et al., 2011). Although there is so many species unknown, diversity continues to decline due to pressures from anthropogenic activities and climate change (Butchart et al., 2010; Dawson et al., 2011). Therefore, fast, efficient, and reliable methods are required for estimating ecosystem biodiversity. The environmental DNA (eDNA) coupled with high-throughput sequencing is an emerging tool to assess eukaryotic biodiversity (Bik et al., 2012a). The eDNA derived from the environmental samples (e.g., sediments, soil, water, etc.) is an efficient, non-invasive, and easy-to-standardize sampling approach (Thomsen and Willerslev, 2015). The eDNA metabarcoding method has been widely used in biodiversity surveys, however, there are still pitfalls and limitations for this emerging method (Ruppert et al., 2019).
One of the most important issues to be considered in metabarcoding studies is the maker selection, because different gene markers have contrasting coverage, resolution, and bias between taxa (Ruppert et al., 2019). The nuclear small subunit ribosomal RNA (18S rRNA) gene, has been popularly used in eDNA metabarcoding surveys largely due to the versatility of PCR primers for screening the entire eukaryotic domain (Leray and Knowlton, 2016), and several different hypervariable regions have been used in different studies (Fonseca et al., 2010; Bik et al., 2012b; Guardiola et al., 2015; Chain et al., 2016; Zhang et al., 2018; Djurhuus et al., 2020). In particularly, the V1-2 and V9 hypervariable regions of the 18S rRNA gene are mostly used to illuminate diversity of microbial eukaryotes (Fonseca et al., 2010; Bik et al., 2012b; Djurhuus et al., 2020). Despite being widely used in the eukaryotic diversity assessment, the 18S rRNA gene has its disadvantages. For example, some studies have found that the 18S rRNA gene appeared to underestimate the meiofaunal diversity when comparing to the mitochondrial COI (Tang et al., 2012). Makers such as the mitochondrial 16S rRNA gene or COI have often been used to recover specific metazoan groups (Djurhuus et al., 2020; West et al., 2020). The 28S rRNA gene has also been used to assess community diversity for metazoans (Machida and Knowlton, 2012), zooplankton (Hirai et al., 2020), or algae (Bittner et al., 2013).
The incomplete reference database is another important issue when conducting eDNA metabarcoding studies, because taxonomic assignment of the sequences relies heavily on the quality and completeness of the reference database. The public sequence repositories such as the GenBank database of the National Center for Biotechnology Information (NCBI) or a smaller database of reference sequences with trusted taxonomy such as SILVA (Pruesse et al., 2007) are often used to assign taxonomy (Bik et al., 2012a). However, inconsistencies in taxonomic classifications between different reference databases may lead to different taxonomic assignment. Recently, Balvociute and Huson (2017) compared four public databases, namely SILVA, RDP, Greengenes, and NCBI, and found that the NCBI taxonomy was larger and more diverse, and should be used as a common framework when comparing analyses performed on different taxonomic classifications. However, few studies have evaluated the effects of different reference databases.
Covering nearly two thirds of the Earth’s surface, the deep-sea environment is the largest ecosystem on the planet (Rex, 1981). Most of the deep sea is heterotrophic in the absence of the photosynthesis, which mainly depends on food from the euphotic zone (Ramirez-Llodra et al., 2010). For this reason, deep-sea benthic communities are usually considered to be food limited, due to the low input of detritus from the euphotic zone, which may influence the benthic abundance and diversity (Smith et al., 2008). However, the deep seafloor ecosystems have been poorly studied because of the remoteness and vastness of the deep sea. In recent years, eDNA metabarcoding has been employed to investigate the deep-sea benthic community diversity and patterns (e.g., Guardiola et al., 2015; Fonseca et al., 2017), improving our understanding of the deep-sea eukaryotic ecosystems.
In the present study, the deep-sea benthic eukaryotic communities in the Okinawa Trough, northwest Pacific were characterized by using eDNA metabarcoding with different metabarcoding markers and reference databases. The main aim of this study was to evaluate and compare the taxonomic coverage and species resolution power of different eDNA metabarcoding markers in deep-sea community surveys. A novel 28S metabarcoding primer set targeting metazoans was designed in this study. The performance of this 28S marker and two commonly used 18S rRNA gene markers (V1-2 and V9) were evaluated. The effect of the reference databases (NCBI and SILVA) on the results of eDNA metabarcoding analyses were also discussed.
Materials and Methods
The 28S Maker Design and in silico PCR Analysis
In present study, a novel primer set for 28S rRNA gene targeting metazoans was designed. A total of 4166 metazoan 28S rDNA sequences were downloaded from the SILVA database1. A pipeline of programs, Primer Prospector, was used to screen conserved sites against the alignment of reference sequences and generate de novo universal primers (Walters et al., 2011). The primers were then sorted according to sensitivity, specificity, or degeneracy, and scored by taxonomic coverage, and mismatch counts. Finally, a primer pair which generates amplicon lengths of ∼400 bp with the lowest mismatch rate and highest coverage (both hit >75% of the 4166 sequences) was selected (1096F and 1535R) (Table 1). The length of the amplified fragment is suitable for the Illumina MiSeq platform.
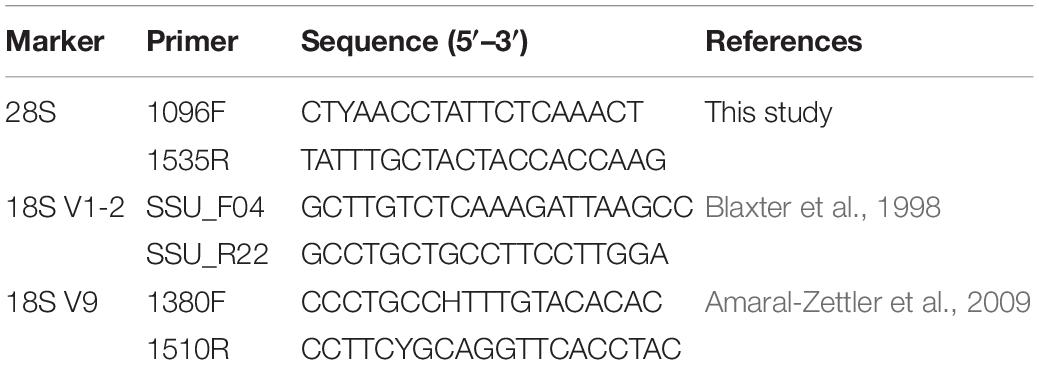
Table 1. List of primers used in this study.
To compare the performance of different primer sets, the novel 28S primers and two previously published primer sets targeting the V1-2 (Blaxter et al., 1998) and V9 (Amaral-Zettler et al., 2009) hypervariable regions of the 18S rRNA gene were evaluated by in silico PCRs. All the primers are provided in Table 1. The primer set SSU_F04 and SSU_R22 targeting the ∼400 bp V1-2 region of the 18S rRNA gene (Blaxter et al., 1998) has been widely used in meiofaunal community surveys (e.g., Fonseca et al., 2010). The universal eukaryotic primers 1380F and 1510R were used to amplify a short fragment (∼130 bp) of the 18S V9 region (Amaral-Zettler et al., 2009), which can address general questions of eukaryotic biodiversity over extensive taxonomic and ecological scales (De Vargas et al., 2015). The TestPrime 1.02 was applied to check the performance of the three primer pairs, by using the non-redundant SILVA SSU Reference database (release SSURef 138.1 NR) for the 18S regions and the LSU database (release LSURef 138.1 NR) for the 28S region, and allowing 1 mismatch and 5-bases of 0-mismatch zone at 3′ end (Klindworth et al., 2013).
Sampling and DNA Extraction
Six sediment samples were collected from the Okinawa Trough with a box corer (50 × 50 cm) during a scientific cruise of R/V Xiangyanghong 20 in 2016 (Supplementary Figure 1). The top ∼5 cm of the sediment was subsampled by a push core of 7-cm diameter from the box corer, and stored at −20°C. Then the six samples were stored at −80°C in the laboratory until DNA extraction. The depths of the six sites ranged from ∼550 to 1400 m.
Prior to DNA extraction, the samples were thawed at 4°C overnight. The total DNA of each sample was extracted from ∼10 g sediment with the PowerMax Soil DNA Isolation Kit (MO BIO Laboratories, Inc., United States) following the manufacturer’s instructions.
PCR and Sequencing
The three markers (28S, 18S V1-2, and 18S V9) were used to amplify eukaryotic communities by PCR reactions. Each PCR was conducted in a volume of 20 μL. The PCR reaction consisted of ∼10 ng template DNA, 2 U TransStart Fastpfu DNA Polymerase (TransGen Biotech, China), 1× FastPfu Buffer, 0.25 mM dNTPs, 0.2 mg/ml bovine serum albumin (BSA), and 0.4 μM of each primer. Thermal cycling conditions included an initial denaturation step at 95°C for 3 min, followed by 37 cycles of 95°C for 30 s, 55°C for 30 s, and 72°C for 45 s, and a final extension at 72°C for 10 min. Three replicate PCRs were amplified from the same DNA template and pooled together to reduce the effect of stochastic PCR amplification. The high-throughput sequencing for the 18S V1-2 and 28S markers was performed on the Illumina MiSeq platform (300 bp paired-end) by Majorbio Co., Ltd. (Shanghai, China). Due to the technological problems, the sequencing for the short 18S V9 marker was conducted on the Illumina HiSeq 2500 platform (PE250) by Novogene Co., Ltd. (Beijing, China). Demultiplexed raw reads have been deposited in the NCBI Sequence Read Archive database (BioProject PRJNA658834 with BioSample accession numbers SAMN16072347–SAMN16072351 and SAMN17126436).
Bioinformatics and Statistical Analysis
Raw sequence reads were demultiplexed and quality filtered with Trimmomatic v0.32 (Bolger et al., 2014), and merged by FLASH v1.2.11 (Magoč and Salzberg, 2011). Operational taxonomic units (OTUs) were clustered with 97% similarity cutoff by using UPARSE v7.1 (Edgar, 2013), and chimeric sequences were identified and removed with UCHIME (Edgar, 2010). Taxonomic assignment for each sequence was conducted by using BLAST searches and the NCBI nt reference database with e-value of 1e−5. Besides, the SILVA v138 reference database (only for Eukaryota) was also used to assign the sequences of the two 18S gene markers (18S V1-2 and 18S V9).
For comparison between different markers and reference databases, two data sets were analyzed. One included the 28S, 18S V1-2, and 18S V9 against the NCBI nt reference database (Data Set 1), and the other included 18S V1-2 and 18S V9 against the SILVA reference database (Data Set 2). Rarefaction curves were estimated with Mothur (Schloss et al., 2009) to evaluate the sequencing effort. To minimize bias due to sequencing effort, each data set was subsampled down to the size of the smallest sample.
Dissimilarities between eukaryotic diversity obtained from different metabarcoding markers were visualized by using the non-metric multidimensional scaling (NMDS) analysis. The analysis was performed at the OTU level, with the abundance-based Bray–Curtis index and presence/absence-based Jaccard index, respectively. All the statistical analyses were performed on the online platform of Majorbio Cloud Platform3.
Results
In silico Analysis
The results of the in silico analysis performed against the non-redundant SILVA SSU/LSU databases are shown in Table 2. No Archaea and some Bacteria sequences were amplified by the three primer sets. For Eukaryota, the primer set SSU_F04/SSU_R22 for the 18S V1-2 region had the most number of hits (16,308), followed by the 28S primer set 1096F/1535R, whereas only 495 hits were detected for the 1380F/1510R targeting the short 18S V9 region. The 28S primer set had higher amplification efficiency in recovering Eukaryota (74.5%) than the 18S V1-2 primers (53.0%), whereas the 18S V9 primers poorly recovered Eukaryota (1.8%). Similarly, amplification efficiency found for the three primer pairs in recovering Metazoa was 89.6% for the 28S, 61.1% for the 18S V1-2, and 1.2% for the 18S V9.
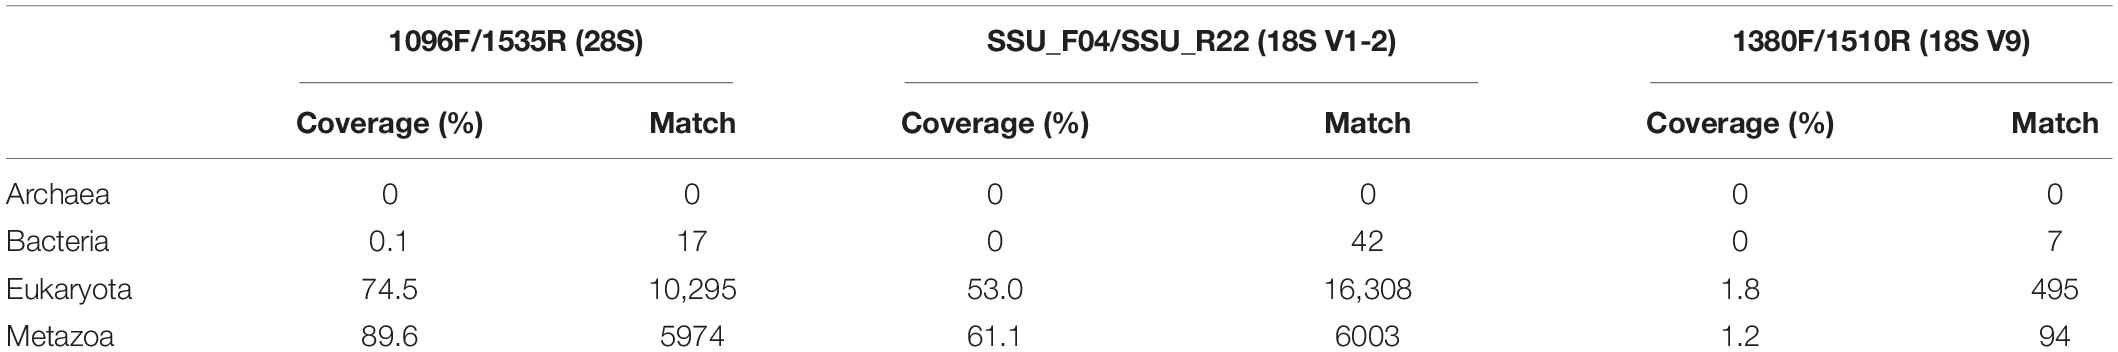
Table 2. In silico analysis showing the coverage (%) and the number of hit (match) of the three primer sets.
Sequence Data
A total of 1,355,328 raw paired-end reads were generated, with 357,214 for 28S, 439,212 for 18S V1-2, and 558,902 for 18S V9 (Supplementary Table 1). Rarefaction curves of the three markers showed that the sequencing depths were sufficient to recover the eukaryotic diversity for 28S and 18S V1-2, but insufficient for 18S V9 despite a deeper sequencing effort (Figure 1).
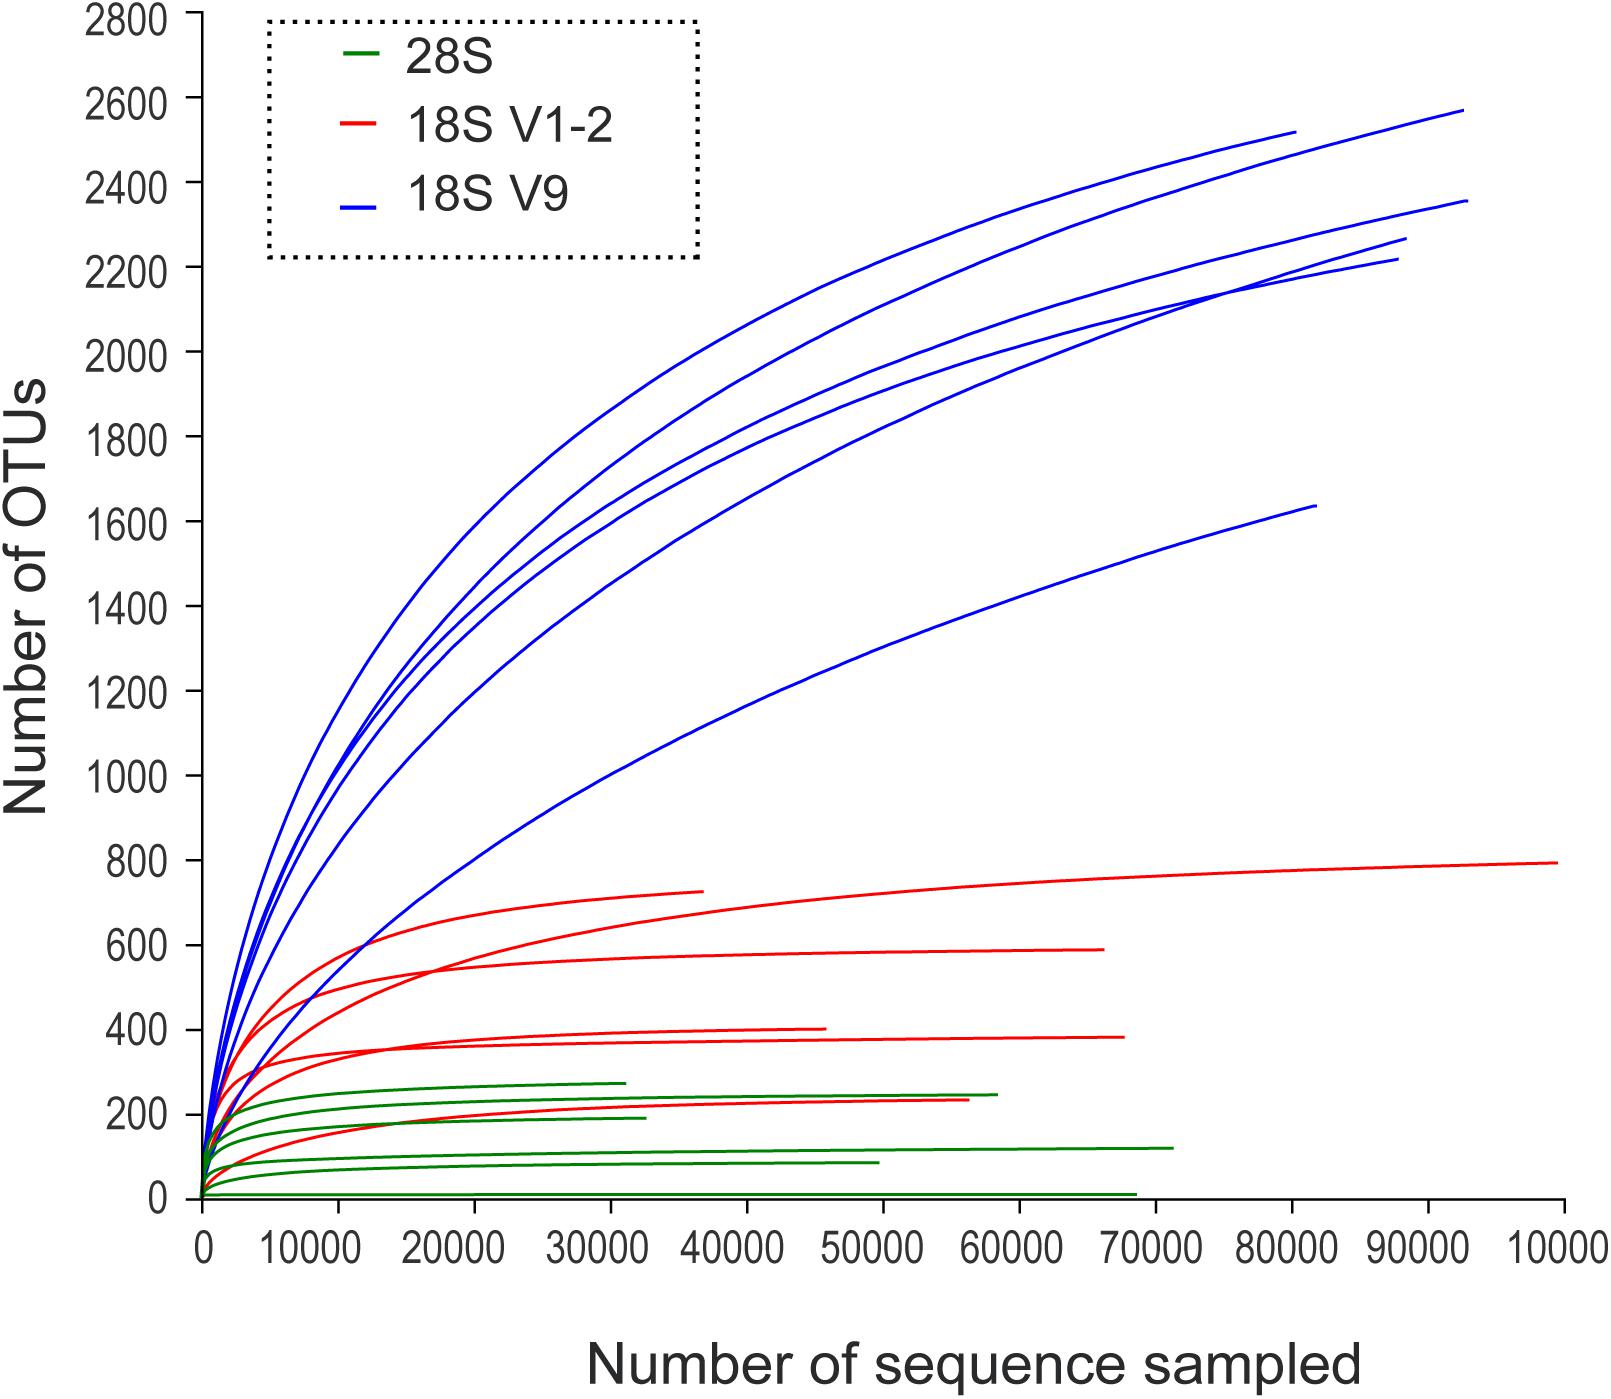
Figure 1. Rarefaction curves of OTU numbers for the 28S, 18S V1-2, and 18S V9 metabarcoding markers.
For Data Set 1, 185,994 sequences were obtained for each of the three metabarcoding marker (30,999 for each sample) after filtering and subsampling (Supplementary Table 2). No Archaea and Bacteria sequences were detected by 28S and 18S V1-2, while 39 sequences for Archaea and 128 for Bacteria were found in 18S V9. Because our study focused on the eukaryotic communities, sequences not assigned to Eukaryota were removed. Finally, 183,426 sequences were retained for each maker with 30,541 for each sample within Data Set 1. For Data Set 2, each sample was filtered and subsampled to 30,541 sequences for 18S V1-2 and 18S V9 in order to compare the taxonomic coverage between different reference databases (NCBI nt vs. SILVA).
Taxonomic Assignment
For Data Set 1, 531 OTUs were identified for 28S, 1352 for 18S V1-2, and 3788 for 18S V9 (Table 3). These OTUs were assigned to 27, 30, and 39 phyla for the three metabarcoding markers, respectively (Table 3). The number of families, genera, and species identified by 18S V1-2 was slightly higher than 28S, but were lower than 18S V9 (Table 3). In total, 44 phyla were identified by the 3 markers, with 21 sharing among different markers (Figure 2). At the family level, 53 were shared among them (total 758), and only 12 of 1428 species were shared among them (Figure 2). Furthermore, the NMDS analysis also supported that different metabarcoding markers generated distinct profiles of benthic eukaryotic diversity from the same sediment samples, with the abundance or presence/absence data (Figure 3).
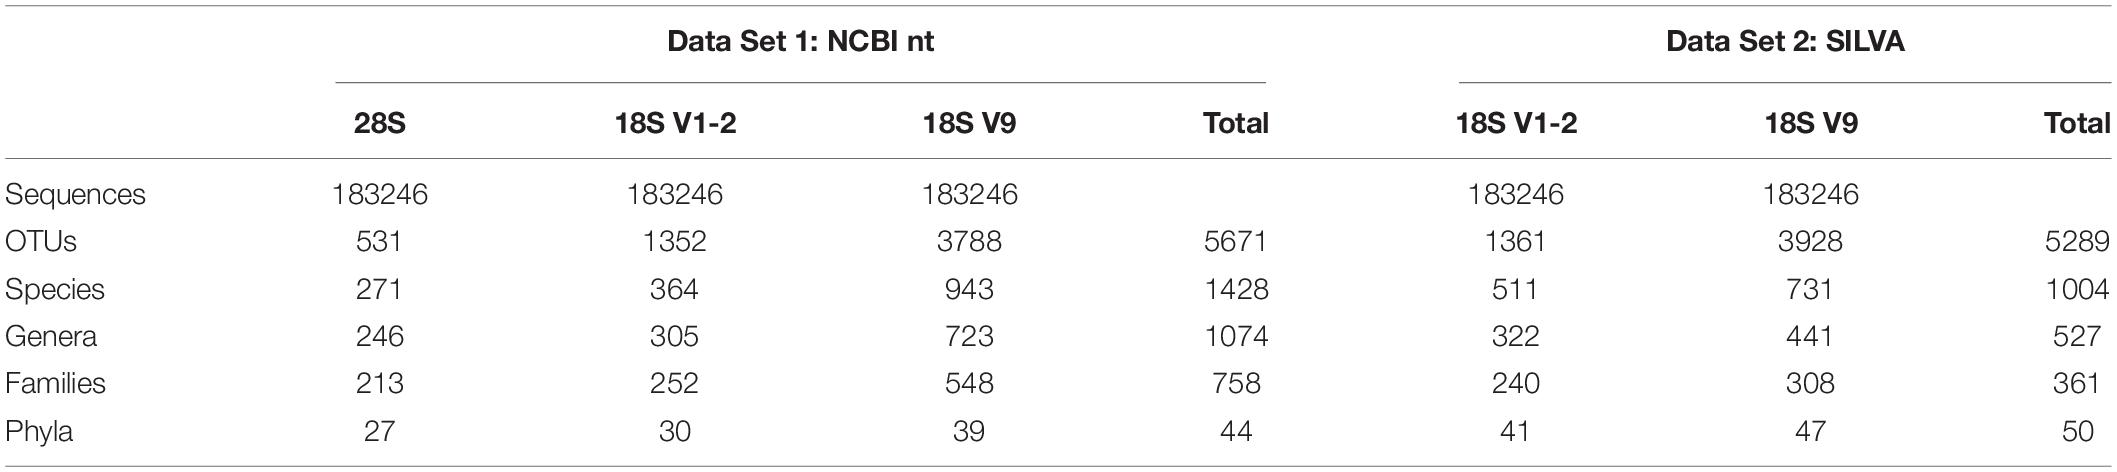
Table 3. Summary of taxonomic assignment identified with different metabarcoding markers and different reference databases.
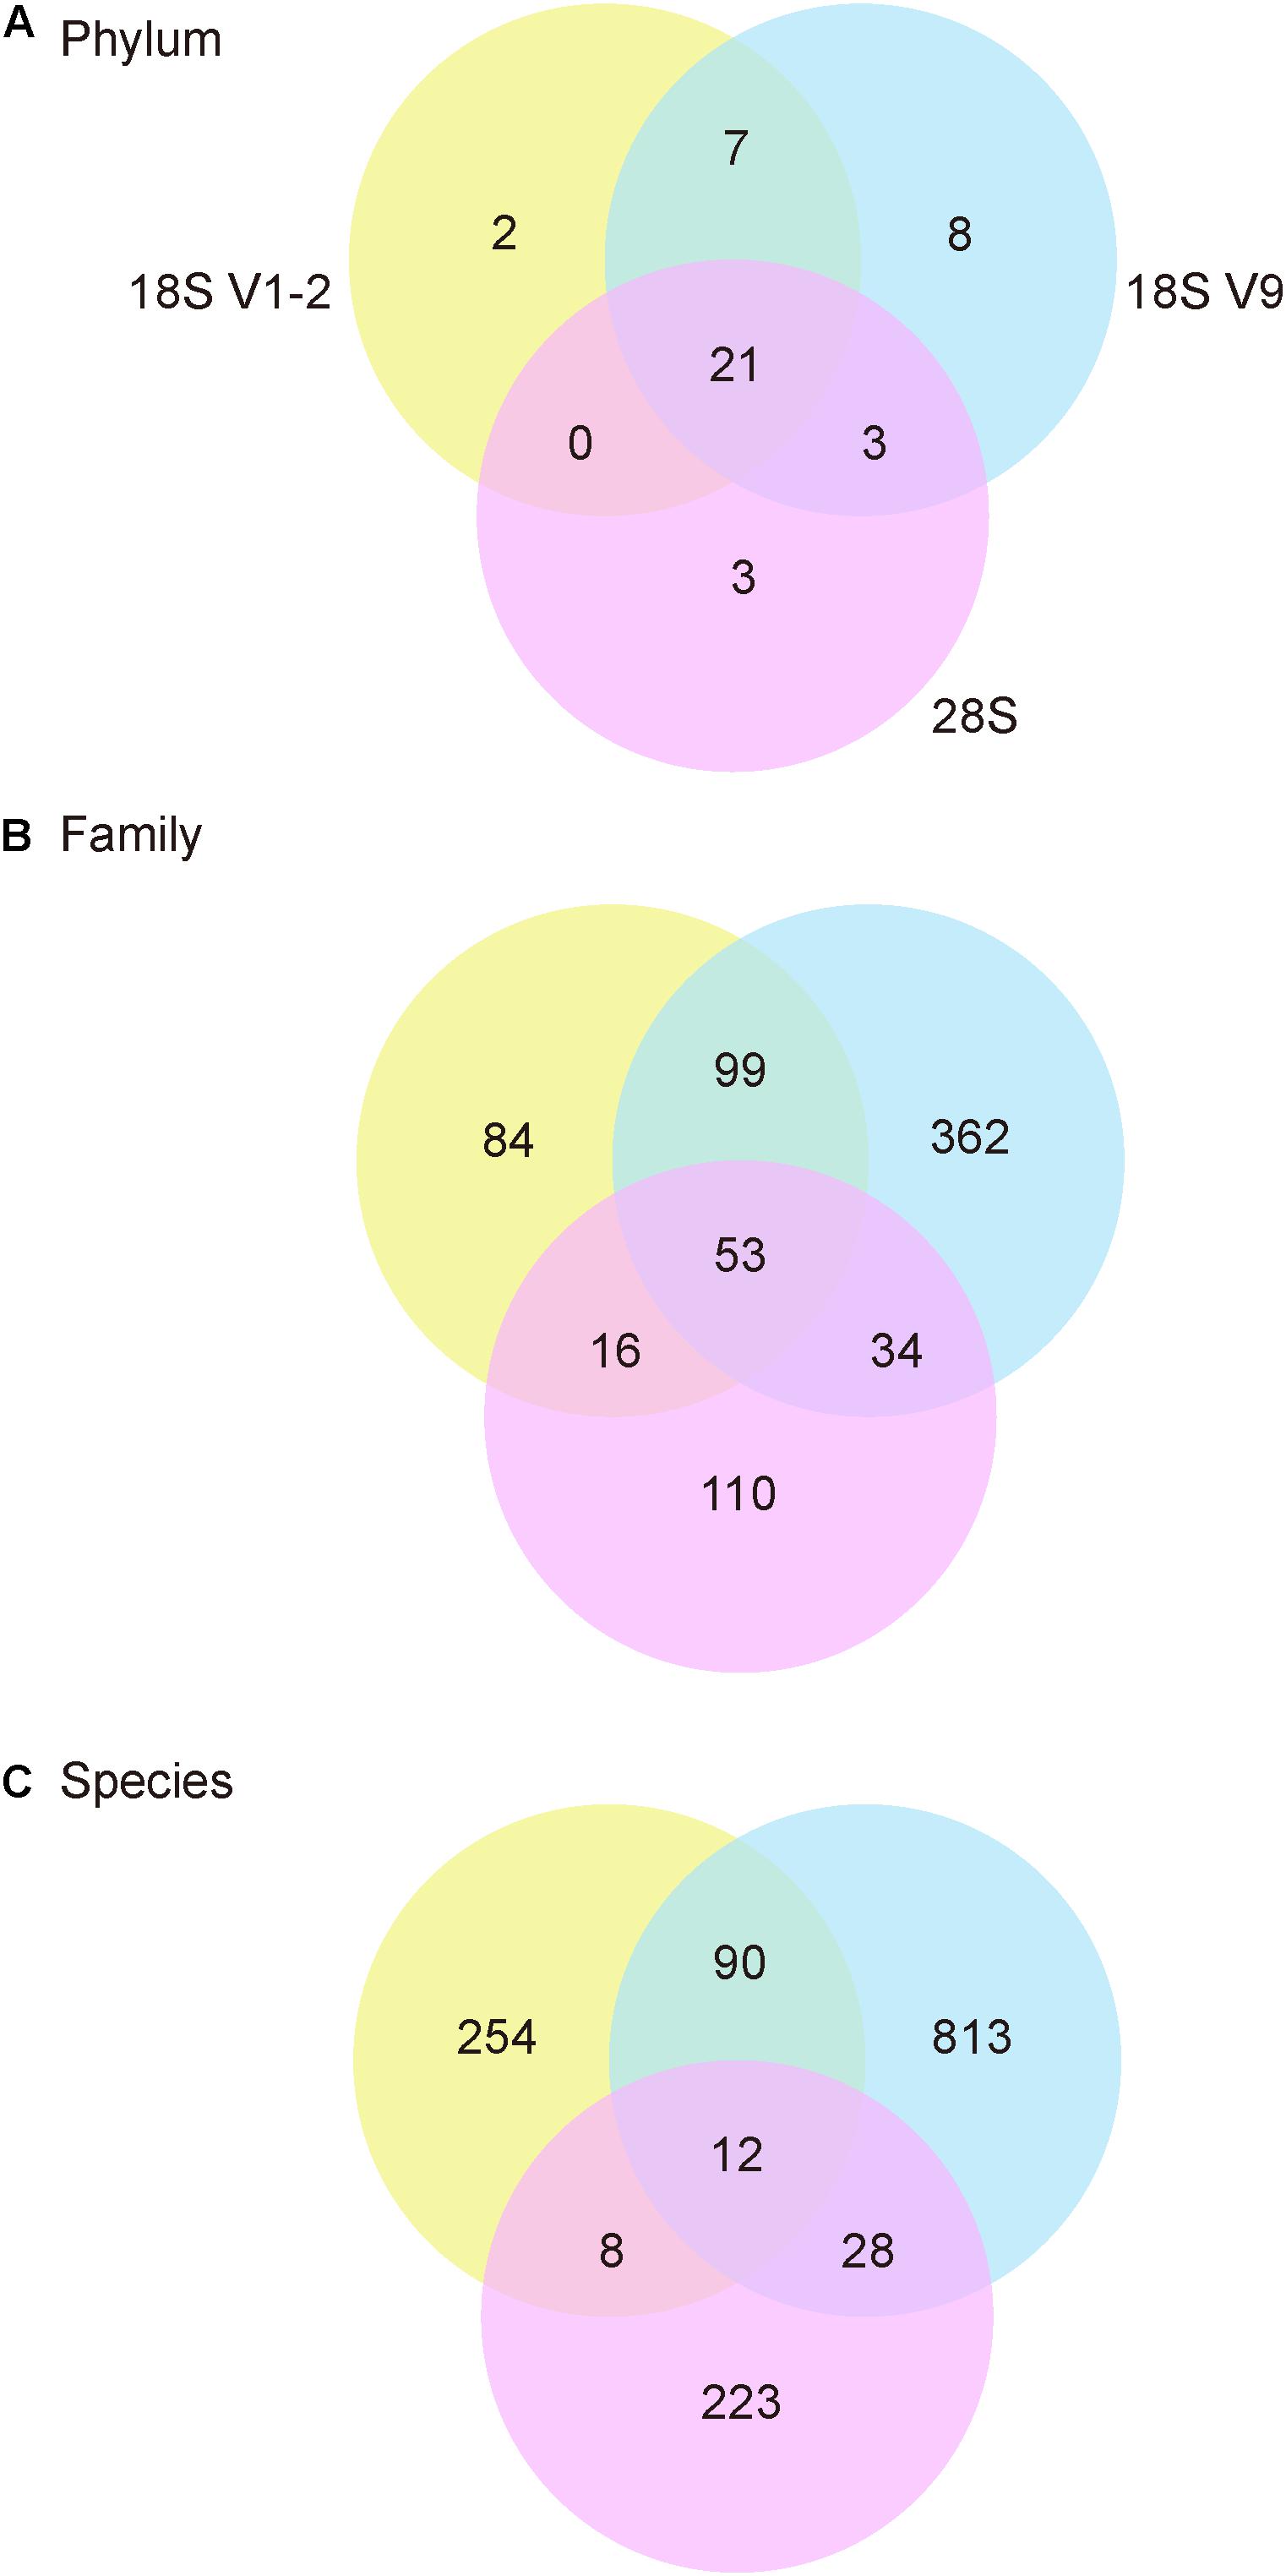
Figure 2. Venn diagrams showing number of phyla (A), families (B), and species (C) for 28S, 18S V1-2, and 18S V9 against the NCBI nt database.
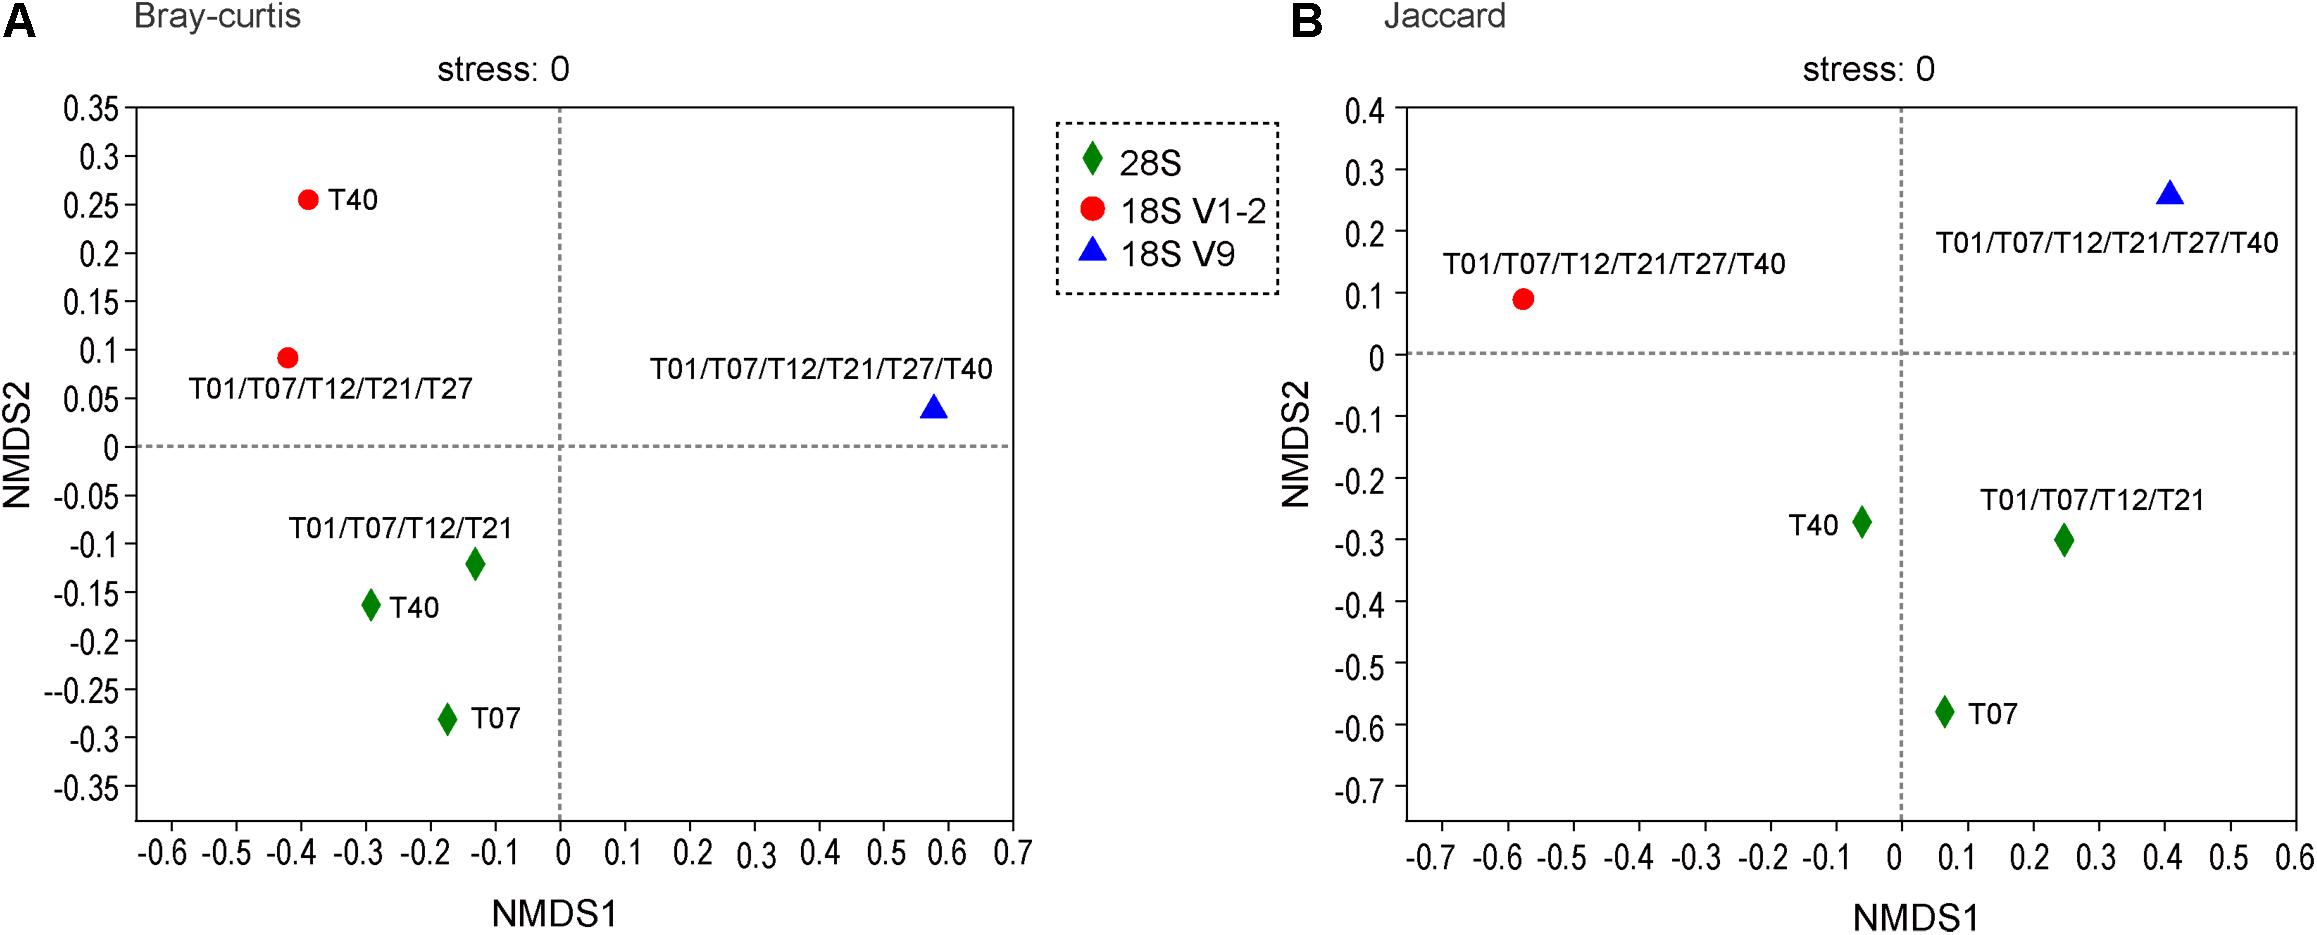
Figure 3. Non-metric multidimensional scaling (NMDS) analysis of benthic community structure (OTU level) detected with 28S, 18S V1-2, and 18S V9 based on abundance (Bray–Curtis) data (A), and presence/absence (Jaccard) data (B). Sample names (T01, T07, T12, T21, T27, and T40) are labeled.
For each metabarcoding marker within Data Set 1, the abundance of metazoans was 29.06% for 28S, 26.89% for 18S V1-2, and 10.02% for the 18S V9 (Supplementary Table 3). Number of taxonomic ranks (phylum, family, species, and OTU) for 18S V9 was higher than 18S V1-2 and 28S, and the number of these taxa for 18S V1-2 was comparable or slightly higher than 28S.
For Data Set 2, 41 phylum were determined for 1361 OTUs by 18S V1-2, and 47 phylum for 3928 OTUs by 18S V9 (Table 3). Similarly, much more families, genus, and species were determined by 18S V9 than 18S V1-2 (Table 3). In total, 50 phyla were identified by the 2 markers, with 38 shared between them (Supplementary Figure 2). A total of 187 families, and 238 species were shared between the 2 markers (Supplementary Figure 2).
For 18S V1-2 and 18S V9, taxonomic ranks (i.e., phylum, family, and species) were compared between the two data sets based on different reference databases (Supplementary Figure 3). The number of phyla identified by the NCBI nt database was slightly fewer than the SILVA database for both markers. Comparable number of families were recognized by using the two databases for the 18S V1-2 gene marker, while the number of families recovered by NCBI for 18S V9 was about twice that by SILVA. More species were determined by SILVA for 18S V1-2, but more were identified by NCBI for 18S V9 (Supplementary Figure 3). In addition, a small proportion of families or species were shared between the two databases, and even no more than 27% phyla were shared between different databases for both 18S V1-2 and 18S V9 (Supplementary Figure 3).
Metazoan Communities in the Okinawa Trough
Combining the three markers based on NCBI nt database (Data Set 1), 22.0% of all the sequences were Metazoa, while 26.9% sequences were not assigned to any taxonomic ranks. Similarly, 21.2% of sequences in Data Set 2 (18S V1-2 and V9 against the SILVA database) were Metazoa, but only 3% of sequences were not assigned to any taxonomic ranks. Because metazoan families were not well recovered in Data Set 2, here we only presented the results from Data Set 1 (Figure 4). The most abundant (44.9%) phylum found in the sediments of the Okinawa Trough was Annelida, followed by Cnidaria (25.4%) and Nemertea (13.0%). Phyla such as Mollusca, Nematoda, Chordata, Arthropoda, Hemichordata, and Entoprocta also showed abundance ≥1%. Annelida, Cnidaria, and Arthropoda were the most diverse groups with 179, 120, and 76 OTUs, respectively. At the family level, 65 families were determined for Cnidaria, 52 families for Arthropoda, and 49 families for Annelida. In addition, 40 families were found for Mollusca, and 24 families for Nematoda. It was noted that only eight families were found for the relatively abundant phylum Nemertea.
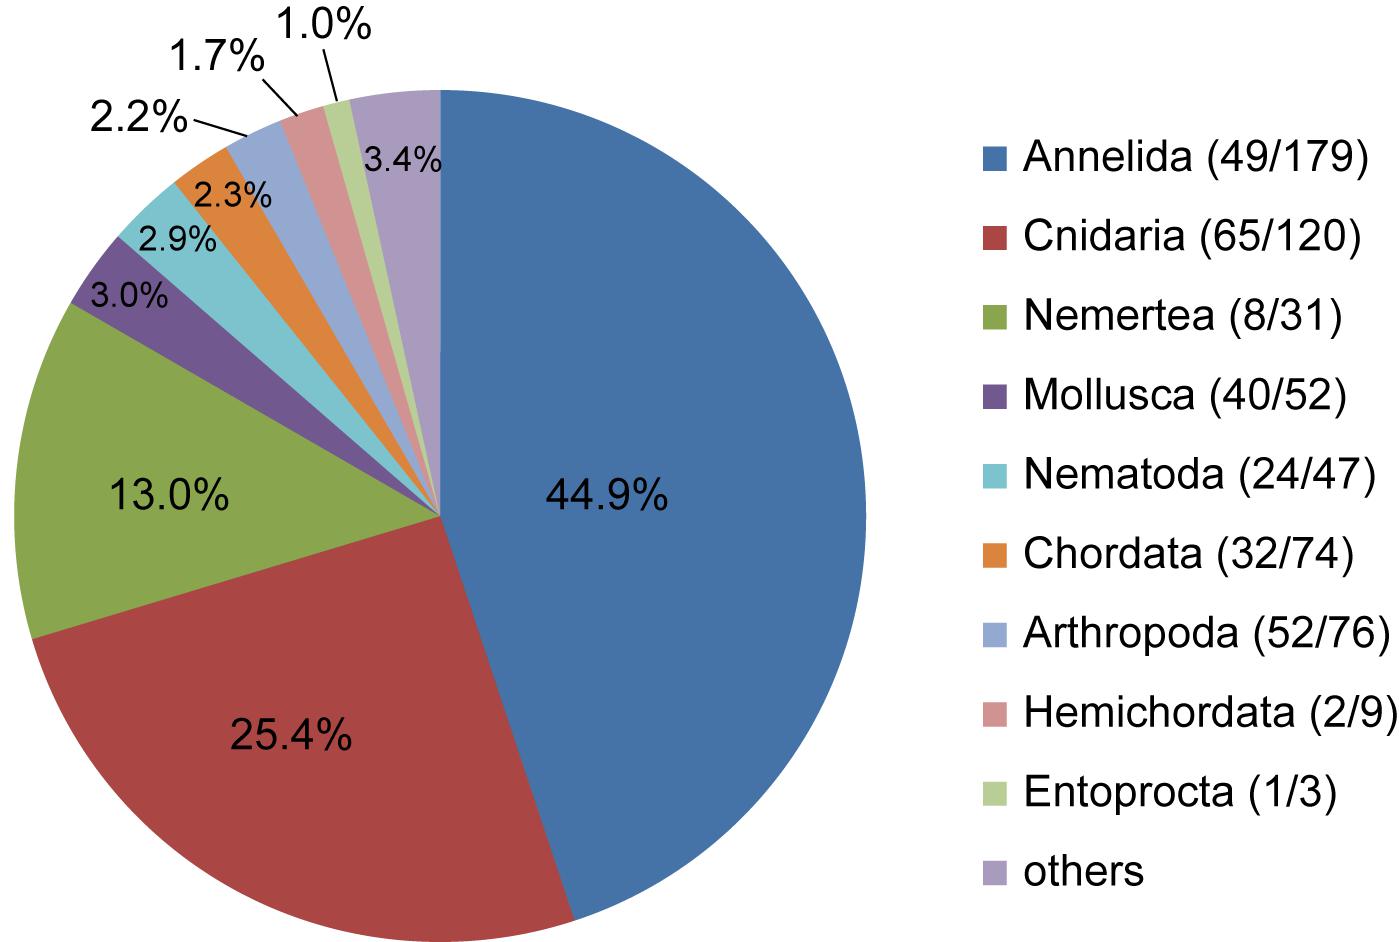
Figure 4. Proportions of metazoan phyla detected by all the sequences of Data Set 1 (including 28S, 18S V1-2, and 18S V9). Numbers in brackets represent the number of metazoan families/OTUs found in each phylum.
Metazoan groups were also detected by each of the three markers (Data Set 1). The 28S and 18S V1-2 markers revealed similar metazoan communities and abundance (Supplementary Figure 4). Annelida (∼50%), Cnidaria (20%), and Nemertea (∼13%) were the most abundant phyla among all the metazoan groups, and Annelida was also the most diverse group in terms of the family and OTU levels. However, the 18S V9 showed that Cnidaria was the most abundant (49%), and had the greatest number of families (n = 53). The second most abundant phylum was Annelida (14.4%), which was also one of the most diverse groups with 36 families and 81 OTUs.
Discussion
Different Markers in Estimating the Deep-Sea Benthic Diversity
Given the importance of marker choice in eDNA matabarcoding studies, it is critical to evaluate the performance of different markers used in the diversity surveys based on the eDNA, because different markers could perform differently in assessing eukaryotic diversity (e.g., Tanabe et al., 2016; Zhang et al., 2020). Although many metabarcoding studies used one or more gene markers to estimate eukaryotic diversity, few have investigated the performance of different markers in assessing diversity of the poorly understood deep-sea ecosystem. In the present study, we provided a novel 28S rRNA gene marker targeting the metazoans, and presented the evaluation of this and two commonly used 18S rRNA gene markers (18S V1-2 and 18S V9) in assessing the benthic diversity of the deep-sea benthic communities by metabarcoding analyses.
A broad taxonomic coverage and high taxonomic resolving power are crucial when choosing markers in metabarcoding studies. In this study, the in silico analysis showed that primer sets 1096F/1535R for the 28S gene marker had the highest amplification efficiency in recovering Eukaryota and Metazoa, followed by the SSU_F04/SSU_R22 for the 18S V1-2 marker (Table 2). The metabarcoding analyses showed that a wide range of eukaryotes (Table 3) and metazoans (Supplementary Table 3) were detected by the three markers, suggesting their utility in eukaryotic and metazoan diversity assessment. The 18S V9 displayed the best performance since it recovered the greatest number of taxa in both Data Sets 1 and 2. Furthermore, 18S V9 had the highest sequence variability while 28S had the lowest variability, although amplicons of 18S V9 (∼130 bp) were shorter than the other two markers (∼400 bp). This may partially explain the observation that although the sequencing depth of 18S V9 was deeper than 28S and 18S V1-2, 18S V9 appeared not to be sufficient to recover the benthic diversity (Figure 1). Overall, 18S V9 outperformed the 18S V1-2 and 28S gene markers in metabarcoding analyses, suggesting that this marker is probably more suitable for metabarcoding the deep-sea eukaryotic or metazoan communities. However, it should be noted that although markers with shorter amplicons are more preferred for degraded eDNA due to higher amplification success rates (Meusnier et al., 2008), targeting larger DNA fragments will favor the amplification of DNA from living or recent dead individuals in the environment (Sinniger et al., 2016).
The primer set 1380F/1510R for 18S V9 had the lowest amplification efficiency among the three primer sets in the in silico analysis (Table 2), however, more eukaryotic and metazoan taxa were detected by 18S V9 than 28S and 18S V1-2 in the metabarcoding analyses (Table 3). The contrast performance of the in silico analysis and the metabarcoding analyses for the markers may be caused by many reasons such as different taxonomic compositions between the reference database and the actual biological community (Zhang et al., 2020). In this study, more matched sequences (4785 for Eukaryota; 2849 for Metazoa) were generated and sequence coverage increased to 9.3% for Eukaryota and 14.8% for Metazoa when five mismatches were allowed in the in silico analysis (data not shown). Thus, the low efficiency of 18S V9 in the in silico analysis is most likely due to the poor representation of eukaryotic/metazoan sequences for this gene region in the current SILVA SSU reference database. Our results agreed with findings from previous studies that the in silico analysis can provide an initial assessment of the primers, but the metabarcoding analyses in an actual metabarcoding study are more crucial to understand the primer performance (Zhang et al., 2020).
Although a broad range of taxa were detected, it was observed that only a small proportion of taxa were shared among the three markers (Figure 2). Even at the phylum level, no more than 50% phyla were detected by all the three markers. Furthermore, the NMDS analysis also supported that communities detected by the three markers were distinct from each other (Figure 3). The results are consistent with findings in previous metabarcoding studies that evolutionary independent markers could detect different taxonomic groups (Tanabe et al., 2016; Zhang et al., 2018, 2020). Thus, a combination of multiple markers is recommended to increase taxonomic coverage in the metabarcoding surveys.
Choice of the Reference Database
In the present study, both the NCBI nt and SILVA databases were used for the taxonomic assignment for 18S V1-2 and 18S V9. Different communities were resolved by different databases (Supplementary Figure 3). Even at the phylum level, no more than 27% phyla were shared between the two databases for the two markers. Perhaps it was not clear which database is the best choice for assessing benthic diversity, because a greater number of species was recovered in the SILVA database with 18S V1-2, while in NCBI with 18S V9 (Supplementary Figure 3). As reported by a recent study, the NCBI taxonomy appeared to be more comprehensive than SILVA (Balvociute and Huson, 2017). These results indicate that both databases may be far less complete for the deep-sea eukaryotic communities, and that the taxonomic classifications of both databases are probably not well compatible. Currently, most metabarcoding studies used one of the databases (Fonseca et al., 2010; Chain et al., 2016; Djurhuus et al., 2020), and it seems that few studies have compared the effects of different databases on metabarcoding analyses. In addition, it was noticed that taxonomic classifications were incomplete in both databases. For example, some OTUs assigned to a family, genus, and species were not assigned to a order, class, or phylum. Moreover, about 45% OTUs against the NCBI nt database, and about 24% OTUs against the SILVA database were not assigned to any taxonomic ranks, suggesting that a substantial amount of diversity are unknown in terms of the 18S rRNA sequences within both databases. Considering the importance of the reference database, the update of taxonomic classifications of each database is necessary to improve the taxonomic resolution in metabarcoding analyses.
Application of eDNA Barcoding to Assess Metazoan Diversity in the Deep-Sea Sediments
As the largest ecosystem on the planet, the deep-sea environment harbors high diversity but is poorly understood (Ramirez-Llodra et al., 2010; Woolley et al., 2016). In this study, the metabarcoding analyses of the 28S and 18S V1-2 markers both showed that the annelids were the most abundant and diverse metazoan group while cnidarians were the most abundant and diverse as revealed by 18S V9 (Supplementary Figure 4). Based on the combination of the three metabarcoding markers, annelids were found to be the most abundant (44.9%) and diverse (179 OTUs) metazoan group in the sediment of the Okinawa Trough, followed by cnidarians (Figure 4). Interestingly, some less abundant phyla were also found to be highly diverse, e.g., Arthropoda (abundance 2.2%) with 52 families and 76 OTUs. The findings here were inconsistent with many previous studies based on traditional methods which found that nematodes were the dominant metazoans in the marine sediments (Soltwedel, 2000; Neira et al., 2001; Danovaro et al., 2002; Sajan et al., 2010; Leduc et al., 2016). Recent studies using the metabarcoding method revealed that other taxonomic groups such as Annelida or Arthropoda were dominant with high abundance and diversity in some deep-sea regions (Bik et al., 2012b; Guardiola et al., 2015). However, other metabarcoding studies have also found nematodes as the most diverse metazoans in the deep-sea sediment (Guardiola et al., 2016; Sinniger et al., 2016). The inconsistency among these studies suggest that traditional taxonomic methods are to some extent limited when assessing the deep-sea diversity, especially for the microbial eukaryotes, and that different eDNA metabarcoding markers may resolve different eukaryotic communities in different deep-sea regions. Nonetheless, the metabarcoding method is a powerful tool to estimate the deep-sea biodiversity, and moreover, multiple markers are recommended during the metabarcoding analyses to obtain a full picture of the deep-sea diversity.
Data Availability Statement
The datasets presented in this study can be found in online repositories. The names of the repository/repositories and accession number(s) can be found below: NCBI (accession: SAMN16072347–SAMN16072351 and SAMN17126436).
Author Contributions
JL and HZ conceived the study. JL performed the lab work, analyzed the data, and wrote the manuscript. HZ designed the 28S rRNA gene marker and reviewed the manuscript. Both authors read and approved the final manuscript.
Funding
The study was supported by National Key R&D Program of China (2017YFC0306604 and 2016YFC0304905), the major scientific and technological projects of Hainan Province (ZDKJ2019011), and the Strategic Priority Research Program of the Chinese Academy of Sciences (CAS) (XDA22040502).
Conflict of Interest
The authors declare that the research was conducted in the absence of any commercial or financial relationships that could be construed as a potential conflict of interest.
Publisher’s Note
All claims expressed in this article are solely those of the authors and do not necessarily represent those of their affiliated organizations, or those of the publisher, the editors and the reviewers. Any product that may be evaluated in this article, or claim that may be made by its manufacturer, is not guaranteed or endorsed by the publisher.
Acknowledgments
We acknowledge the captains, crew, and scientific staffs on the R/V Xiangyanghong 20. We also thank Helu Liu of Institute of Deep-Sea Science and Engineering, CAS for helping sample collections.
Supplementary Material
The Supplementary Material for this article can be found online at: https://www.frontiersin.org/articles/10.3389/fmars.2021.684955/full#supplementary-material
Footnotes
References
Amaral-Zettler, L. A., McCliment, E. A., Ducklow, H. W., and Huse, S. M. (2009). A method for studying protistan diversity using massively parallel sequencing of V9 hypervariable regions of small-subunit ribosomal RNA genes. PLoS One 4:e6372. doi: 10.1371/journal.pone.0006372
Balvociute, M., and Huson, D. H. (2017). SILVA, RDP, Greengenes, NCBI and OTT-how do these taxonomies compare? BMC Genomics 18:114. doi: 10.1186/s12864-017-3501-4
Bik, H. M., Porazinska, D. L., Creer, S., Caporaso, J. G., Knight, R., and Thomas, W. K. (2012a). Sequencing our way towards understanding global eukaryotic biodiversity. Trends Ecol. Evol. 27, 233–243. doi: 10.1016/j.tree.2011.11.010
Bik, H. M., Sung, W., De Ley, P., Baldwin, J. G., Sharma, J., Rocha-Olivares, A., et al. (2012b). Metagenetic community analysis of microbial eukaryotes illuminates biogeographic patterns in deep-sea and shallow water sediments. Mol. Ecol. 21, 1048–1059. doi: 10.1111/j.1365-294x.2011.05297.x
Bittner, L., Gobet, A., Audic, S., Romac, S., Egge, E. S., Santini, S., et al. (2013). Diversity patterns of uncultured Haptophytes unravelled by pyrosequencing in Naples Bay. Mol. Ecol. 22, 87–101. doi: 10.1111/mec.12108
Blaxter, M. L., De Ley, P., Garey, J. R., Liu, L. X., Scheldeman, P., Vierstraete, A., et al. (1998). A molecular evolutionary framework for the phylum Nematoda. Nature 392:71. doi: 10.1038/32160
Bolger, A. M., Lohse, M., and Usadel, B. (2014). Trimmomatic: a flexible trimmer for Illumina sequence data. Bioinformatics 30, 2114–2120. doi: 10.1093/bioinformatics/btu170
Butchart, S. H., Walpole, M., Collen, B., van Strien, A., Scharlemann, J. P. W., and Almond, R. E. A. (2010). Global biodiversity: indicators of recent declines. Science 328, 1164–1168.
Chain, F. J., Brown, E. A., MacIsaac, H. J., and Cristescu, M. E. (2016). Metabarcoding reveals strong spatial structure and temporal turnover of zooplankton communities among marine and freshwater ports. Divers. Distrib. 22, 493–504. doi: 10.1111/ddi.12427
Danovaro, R., Gambi, C., and Della Croce, N. (2002). Meiofauna hotspot in the Atacama Trench, eastern South Pacific Ocean. Deep Sea Res.1 Oceanogr. Res. Pap. 49, 843–857. doi: 10.1016/s0967-0637(01)00084-x
Dawson, T. P., Jackson, S. T., House, J. I., Prentice, I. C., and Mace, G. M. (2011). Beyond predictions: biodiversity conservation in a changing climate. Science 332, 53–58. doi: 10.1126/science.1200303
De Vargas, C., Audic, S., Henry, N., Decelle, J., Mahé, F., Logares, R., et al. (2015). Eukaryotic plankton diversity in the sunlit ocean. Science 348:1261605.
Djurhuus, A., Closek, C. J., Kelly, R. P., Pitz, K. J., Michisaki, R. P., Starks, H. A., et al. (2020). Environmental DNA reveals seasonal shifts and potential interactions in a marine community. Nat. Commun. 11:254.
Edgar, R. C. (2010). Search and clustering orders of magnitude faster than BLAST. Bioinformatics 26, 2460–2461. doi: 10.1093/bioinformatics/btq461
Edgar, R. C. (2013). UPARSE: highly accurate OTU sequences from microbial amplicon reads. Nat. Methods 10, 996–998. doi: 10.1038/nmeth.2604
Fonseca, V. G., Carvalho, G. R., Sung, W., Johnson, H. F., Power, D. M., Neill, S. P., et al. (2010). Second-generation environmental sequencing unmasks marine metazoan biodiversity. Nat. Commun. 1:98.
Fonseca, V., Sinniger, F., Gaspar, J., Quince, C., Creer, S., Power, D. M., et al. (2017). Revealing higher than expected meiofaunal diversity in Antarctic sediments: a metabarcoding approach. Sci. Rep. 7:6094.
Guardiola, M., Uriz, M. J., Taberlet, P., Coissac, E., Wangensteen, O. S., and Turon, X. (2015). Deep-sea, deep-sequencing: metabarcoding extracellular DNA from sediments of marine canyons. PLoS One 10:e0139633. doi: 10.1371/journal.pone.0139633
Guardiola, M., Wangensteen, O. S., Taberlet, P., Taberlet, P., Coissac, E., and Uriz, M. J. (2016). Spatio-temporal monitoring of deep-sea communities using metabarcoding of sediment DNA and RNA. PeerJ 4:e2807. doi: 10.7717/peerj.2807
Hirai, J., Tachibana, A., and Tsuda, A. (2020). Large-scale metabarcoding analysis of epipelagic and mesopelagic copepods in the Pacific. PLoS One 15:e0233189. doi: 10.1371/journal.pone.0233189
Klindworth, A., Pruesse, E., Schweer, T., Peplies, J., Quast, C., Horn, M., et al. (2013). Evaluation of general 16S ribosomal RNA gene PCR primers for classical and next-generation sequencing-based diversity studies. Nucleic Acids Res. 41:e1. doi: 10.1093/nar/gks808
Leduc, D., Rowden, A. A., Glud, R. N., Wenzhoefer, F., Kitazato, H., and Clark, M. (2016). Comparison between infaunal communities of the deep floor and edge of the Tonga Trench: possible effects of differences in organic matter supply. Deep Sea Res. 1 Oceanogr. Res. Pap. 116, 264–275. doi: 10.1016/j.dsr.2015.11.003
Leray, M., and Knowlton, N. (2016). Censusing marine eukaryotic diversity in the twenty-first century. Philos. Trans. R. Soc. Lond. B Biol. Sci. 371:20150331. doi: 10.1098/rstb.2015.0331
Machida, R. J., and Knowlton, N. (2012). PCR primers for metazoan nuclear 18S and 28S ribosomal DNA sequences. PLoS One 7:e46180. doi: 10.1371/journal.pone.0046180
Magoč, T., and Salzberg, S. L. (2011). FLASH: fast length adjustment of short reads to improve genome assemblies. Bioinformatics 27, 2957–2963. doi: 10.1093/bioinformatics/btr507
Meusnier, I., Singer, G. A. C., Landry, J.-F., Hickey, D. A., Hebert, P. D. N., and Hajibabaei, M. (2008). A universal DNA mini-barcode for biodiversity analysis. BMC Genomics 9:214. doi: 10.1186/1471-2164-9-214
Mora, C., Tittensor, D. P., Adl, S., Simpson, A. G., and Worm, B. (2011). How many species are there on Earth and in the ocean? PLoS Biol. 9:e1001127. doi: 10.1371/journal.pbio.1001127
Neira, C., Sellanes, J., Levin, L. A., and Arntz, W. E. (2001). Meiofaunal distributions on the Peru margin: relationship to oxygen and organic matter availability. Deep Sea Res. 1 Oceanogr. Res. Pap. 48, 2453–2472. doi: 10.1016/s0967-0637(01)00018-8
Pruesse, E., Quast, C., Knittel, K., Fuchs, B. M., Ludwig, W., Peplies, J., et al. (2007). SILVA: a comprehensive online resource for quality checked and aligned ribosomal RNA sequence data compatible with ARB. Nucleic Acids Res. 35, 7188–7196. doi: 10.1093/nar/gkm864
Ramirez-Llodra, E., Brandt, A., Danovaro, R., De Mol, B., Escobar, E., German, C. R., et al. (2010). Deep, diverse and definitely different: unique attributes of the world’s largest ecosystem. Biogeosciences 7, 2851–2899. doi: 10.5194/bg-7-2851-2010
Rex, M. A. (1981). Community structure in the deep-sea benthos. Annu. Rev. Ecol. Syst. 12, 331–353. doi: 10.1146/annurev.es.12.110181.001555
Ruppert, K. M., Kline, R. J., and Rahman, M. S. (2019). Past, present, and future perspectives of environmental DNA (eDNA) metabarcoding: a systematic review in methods, monitoring, and applications of global eDNA. Glob. Ecol. Conserv. 17:e00547. doi: 10.1016/j.gecco.2019.e00547
Sajan, S., Joydas, T. V., and Damodaran, R. (2010). Meiofauna of the western continental shelf of India, Arabian Sea. Estuar. Coast. Shelf Sci. 86, 665–674. doi: 10.1016/j.ecss.2009.11.034
Schloss, P. D., Westcott, S. L., Ryabin, T., Hall, J. R., Hartmann, M., and Hollister, E. B. (2009). Introducing mothur: open-source, platform-independent, community-supported software for describing and comparing microbial communities. Appl. Environ. Microbiol. 75, 7537–7541. doi: 10.1128/aem.01541-09
Sinniger, F., Pawlowski, J., Harii, S., Gooday, A. J., Yamamoto, H., Chevaldonné, P., et al. (2016). Worldwide analysis of sedimentary DNA reveals major gaps in taxonomic knowledge of deep-sea benthos. Front. Mar. Sci. 3:92. doi: 10.3389/fmars.2016.00092
Smith, C. R., De Leo, F. C., Bernardino, A. F., Sweetman, A. K., and Arbizu, P. M. (2008). Abyssal food limitation, ecosystem structure and climate change. Trends Ecol. Evol. 23, 518–528. doi: 10.1016/j.tree.2008.05.002
Soltwedel, T. (2000). Metazoan meiobenthos along continental margins: a review. Prog. Oceanogr. 46, 59–84. doi: 10.1016/s0079-6611(00)00030-6
Tanabe, A. S., Nagai, S., Hida, K., Yasuike, M., Fujiwara, A., Nakamura, Y., et al. (2016). Comparative study of the validity of three regions of the 18S-rRNA gene for massively parallel sequencing-based monitoring of the planktonic eukaryote community. Mol. Ecol. Resour. 16, 402–414. doi: 10.1111/1755-0998.12459
Tang, C. Q., Leasi, F., Obertegger, U., Kieneke, A., Barraclough, T. G., Fontaneto, D., et al. (2012). The widely used small subunit 18S rDNA molecule greatly underestimates true diversity in biodiversity surveys of the meiofauna. Proc. Natl. Acad. Sci. U.S.A. 109, 16208–16212. doi: 10.1073/pnas.1209160109
Thomsen, P. F., and Willerslev, E. (2015). Environmental DNA–An emerging tool in conservation for monitoring past and present biodiversity. Biol. Conserv. 183, 4–18. doi: 10.1016/j.biocon.2014.11.019
Walters, W. A., Caporaso, J. G., Lauber, C. L., Berg-Lyons, D., Fierer, N., and Knight, R. (2011). PrimerProspector: de novo design and taxonomic analysis of barcoded polymerase chain reaction primers. Bioinformatics 27, 1159–1161. doi: 10.1093/bioinformatics/btr087
West, K. M., Stat, M., Harvey, E. S., Skepper, C. L., DiBattista, J. D., Richards, Z. T., et al. (2020). eDNA metabarcoding survey reveals fine-scale coral reef community variation across a remote, tropical island ecosystem. Mol. Ecol. 29, 1069–1086. doi: 10.1111/mec.15382
Woolley, S. N., Tittensor, D. P., Dunstan, P. K., Guillera-Arroita, G., Lahoz-Monfort, J. J., Wintle, B. A., et al. (2016). Deep-sea diversity patterns are shaped by energy availability. Nature 533:393. doi: 10.1038/nature17937
Zhang, G. K., Chain, F. J., Abbott, C. L., and Cristescu, M. E. (2018). Metabarcoding using multiplexed markers increases species detection in complex zooplankton communities. Evol. Appl. 11, 1901–1914. doi: 10.1111/eva.12694
Keywords: benthic community, 18S, 28S, environmental DNA, deep sea, metabarcoding
Citation: Liu J and Zhang H (2021) Combining Multiple Markers in Environmental DNA Metabarcoding to Assess Deep-Sea Benthic Biodiversity. Front. Mar. Sci. 8:684955. doi: 10.3389/fmars.2021.684955
Received: 24 March 2021; Accepted: 02 August 2021;
Published: 19 August 2021.
Edited by:
Pedro A. Ribeiro, University of Bergen, NorwayReviewed by:
Mauricio Shimabukuro, University of Southern Denmark, DenmarkTianxiang Gao, Zhejiang Ocean University, China
Copyright © 2021 Liu and Zhang. This is an open-access article distributed under the terms of the Creative Commons Attribution License (CC BY). The use, distribution or reproduction in other forums is permitted, provided the original author(s) and the copyright owner(s) are credited and that the original publication in this journal is cited, in accordance with accepted academic practice. No use, distribution or reproduction is permitted which does not comply with these terms.
*Correspondence: Haibin Zhang, aHpoYW5nQGlkc3NlLmFjLmNu