 Li Ma
Li Ma Shangjin Tan3,4
 Hongbin Liu
 Shuh-Ji Kao
 Minhan Dai
 Jin-Yu Terence Yang
- 1State Key Laboratory of Marine Environmental Science, College of Ocean and Earth Sciences, Xiamen University, Xiamen, China
- 2Department of Chemical Engineering, Chengde Petroleum College, Chengde, China
- 3Department of Ocean Science, The Hong Kong University of Science and Technology, Hong Kong SAR, China
- 4Hong Kong Branch of the Southern Marine Science and Engineering Guangdong Laboratory (Guangzhou), The Hong Kong University of Science and Technology, Hong Kong SAR, China
To distinguish between the distribution and activity of ammonia-oxidizing bacteria (AOB) and ammonia-oxidizing archaea (AOA) in the Pearl River estuary (PRE), we investigated the DNA- and cDNA-based β-proteobacterial and archaeal amoA genes on three size-fractionated particles of >3.0 μm, 0.45–3.0 μm, and 0.22–0.45 μm. Results showed that AOB were more abundant in the freshwater with high concentrations of ammonium (NH4+) and low dissolved oxygen, whereas AOA were dominant in the NH4+-depleted seawater and sensitive to temperature. Obvious shifts in ammonia-oxidizing communities were found along the salinity gradient in the PRE. AOB clearly presented a particle-associated nature, as evidenced by higher relative abundance of amoA genes attached to the large particles (>3.0 μm) and their transcripts exclusively detected on this fraction. Moreover, higher transcriptional activity (indicated by the cDNA/DNA ratio) of AOB on the large particles, suggesting AOB were actively involved in ammonia oxidation despite their lower abundance in the mid- and lower estuarine regions. In contrast, AOA exhibited higher transcriptional activity on the 0.45–3.0 μm and 0.22–0.45 μm particles, implying the free-living strategy of these microbes. Together, these findings from field observations provide useful information on the ecological strategies of ammonia-oxidizing communities in response to different environmental conditions.
Introduction
Nitrification is an important process in the marine nitrogen cycle, which determines the distribution of oxidized and reduced nitrogen components in the ocean (Ward, 2008). It is an oxygen- and alkalinity-consuming process, contributing to hypoxia development and the enhancement of ocean acidification especially in coastal waters (Hu and Cai, 2011). The produced greenhouse gas nitrous oxide (N2O) through nitrification pathway highlights its importance in the global climate change (Santoro et al., 2011; Stein, 2011; Löscher et al., 2012; Frame et al., 2017). Ammonia oxidation is the first and rate-limiting step of nitrification, which is microbially mediated oxidation of ammonia (NH3) to nitrite (NO2–). Ammonia-oxidizing bacteria (AOB), including a few genera of β- and γ-Proteobacteria, and ammonia-oxidizing archaea (AOA) belonging to Thaumarchaeota are the two major types of microorganisms that catalyze ammonia oxidation and N2O production in the estuarine and marine ecosystems (Ward, 2008; Santoro et al., 2011; Stein, 2011; Löscher et al., 2012; Frame et al., 2017).
Estuaries, which are highly affected by coastal nutrients and eutrophication due to anthropogenic activity, have been found to occur high rates of nitrification at the land-ocean interface (Bricker et al., 2008; Damashek et al., 2016). Estuaries are also recognized as the hot-spot regions for N2O production and emission (Seitzinger and Kroeze, 1998; Mortazavi et al., 2000; Usui et al., 2001; Kroeze et al., 2010; Allen et al., 2011; Lin et al., 2016). In estuarine regions, the distribution of AOB and AOA generally presents a complex picture; for example, the ratio of AOB to AOA varies extensively and exhibits an inconsistent pattern along a salinity gradient (Caffrey et al., 2007; Mosier and Francis, 2008; Sahan and Muyzer, 2008; Santoro et al., 2008; Bernhard et al., 2010). On the other hand, it is well-established that AOB are in general larger in size than AOA (Holt et al., 1994; Könneke et al., 2005; De La Torre et al., 2008; Hatzenpichler et al., 2008; Jung et al., 2011; Lehtovirta-Morley et al., 2011; Tourna et al., 2011). Related studies in estuaries showed that AOB more clearly attached to particles (>3.0 μm) in the high-turbidity freshwater (Zhang et al., 2014; Hou et al., 2018), whereas the free-living (<3.0 μm) AOA appeared to be more abundant in a low-particle and saline environment (Hou et al., 2018). However, the activity of AOB versus AOA in estuarine systems and their relationship with different size-fractionated particles, are still currently lacking.
The Pearl River estuary (PRE) is one of the complex estuarine systems, which is a funnel-shaped sub-estuary with a surface area of 1,180 km2 (Dai et al., 2014). The low-salinity waters in the upper PRE are characterized by low concentrations of O2 and they are rich in nutrients from anthropogenic sources. NH4+ is the dominant species of inorganic nitrogen with extremely high concentrations of ∼300–800 μmol L–1 in this region, and NO3– becomes more important seaward (Dai et al., 2008). A year-round pattern of dramatic decrease in NH4+ and increase in NO3– is found in the upper estuary. This feature suggests an elevated level of nitrification (Dai et al., 2006, 2008; He et al., 2014), which corresponds to a high concentration of N2O in the water column (Lin et al., 2016; Ma et al., 2019). Moreover, the remineralization of organic matter leads to the formation of hypoxic zones both at the head of the estuary and in the downstream bottom waters, which may enhance the nitrification rates performed by nitrifying microorganisms (He et al., 2014; Su et al., 2017; Qian et al., 2018; Zhao et al., 2020). The hydrological and chemical parameters of the waters in the mid- and lower estuarine regions are primarily controlled by the intermixing of freshwater and seawater (Harrison et al., 2008). The complicated biogeochemical settings of PRE provide an ideal ecosystem for elucidating the distribution patterns of AOB and AOA in response to the environments (Hou et al., 2018; Ma et al., 2019).
To better understand the activity of AOB and AOA and their relationship to the environmental parameters in the PRE, we investigated the abundance and transcripts of AOB and AOA amoA genes on different size-fractionated particles. According to the shapes and sizes of AOB and AOA cells reported in the coastal and estuarine waters (Supplementary Table 1), we found the diameter of AOA cells generally less than 0.3 μm and relatively larger size for AOB cells. Filters of three pore sizes (3.0 μm, 0.45 μm, and 0.22 μm) were applied to fractionate particles in the PRE.
Materials and Methods
Study Sites and Sampling
Our study was based on a summer research cruise that was conducted along the mainstream of the PRE in July 2014 (Figure 1). According to its geographical characteristics, the PRE is divided into an upper region, which is upstream of the Humen outlet, and mid- and lower regions, called Lingdingyang (Figure 1). Surveys of the waters in the mid- and lower estuarine region (Lingdingyang) were conducted during July 19–22 (Section “A”), whereas those conducted in the upper estuary from Humen to Guangzhou (Section “P”) took place during July 28–29. Water samples were taken from the surface (0.5 m) and bottom (2.0–15.0 m) layers of each site by using a conductivity-temperature-depth (CTD) rosette sampling system (SBE 25, Sea-Bird Co., United States) fitted with 4 L Niskin bottles (General Oceanics). Samples for total suspended matter (TSM) were collected by filtering 1–2 L of water onto pre-combusted and pre-weighed GF/F membranes (Whatman), and then stored at −20°C. Samples collected for the determination of inorganic nutrients were filtered with 0.45 μm cellulose acetate membranes and frozen at −20°C until analysis. The exception was NH4+, which was analyzed on board immediately after collection. Samples for N2O were collected into 125 mL headspace glass bottles, to which 100 μL of saturated HgCl2 was added. The bottles were immediately closed with rubber stoppers and aluminum crimp caps, and then stored in the dark at 4°C until analysis.
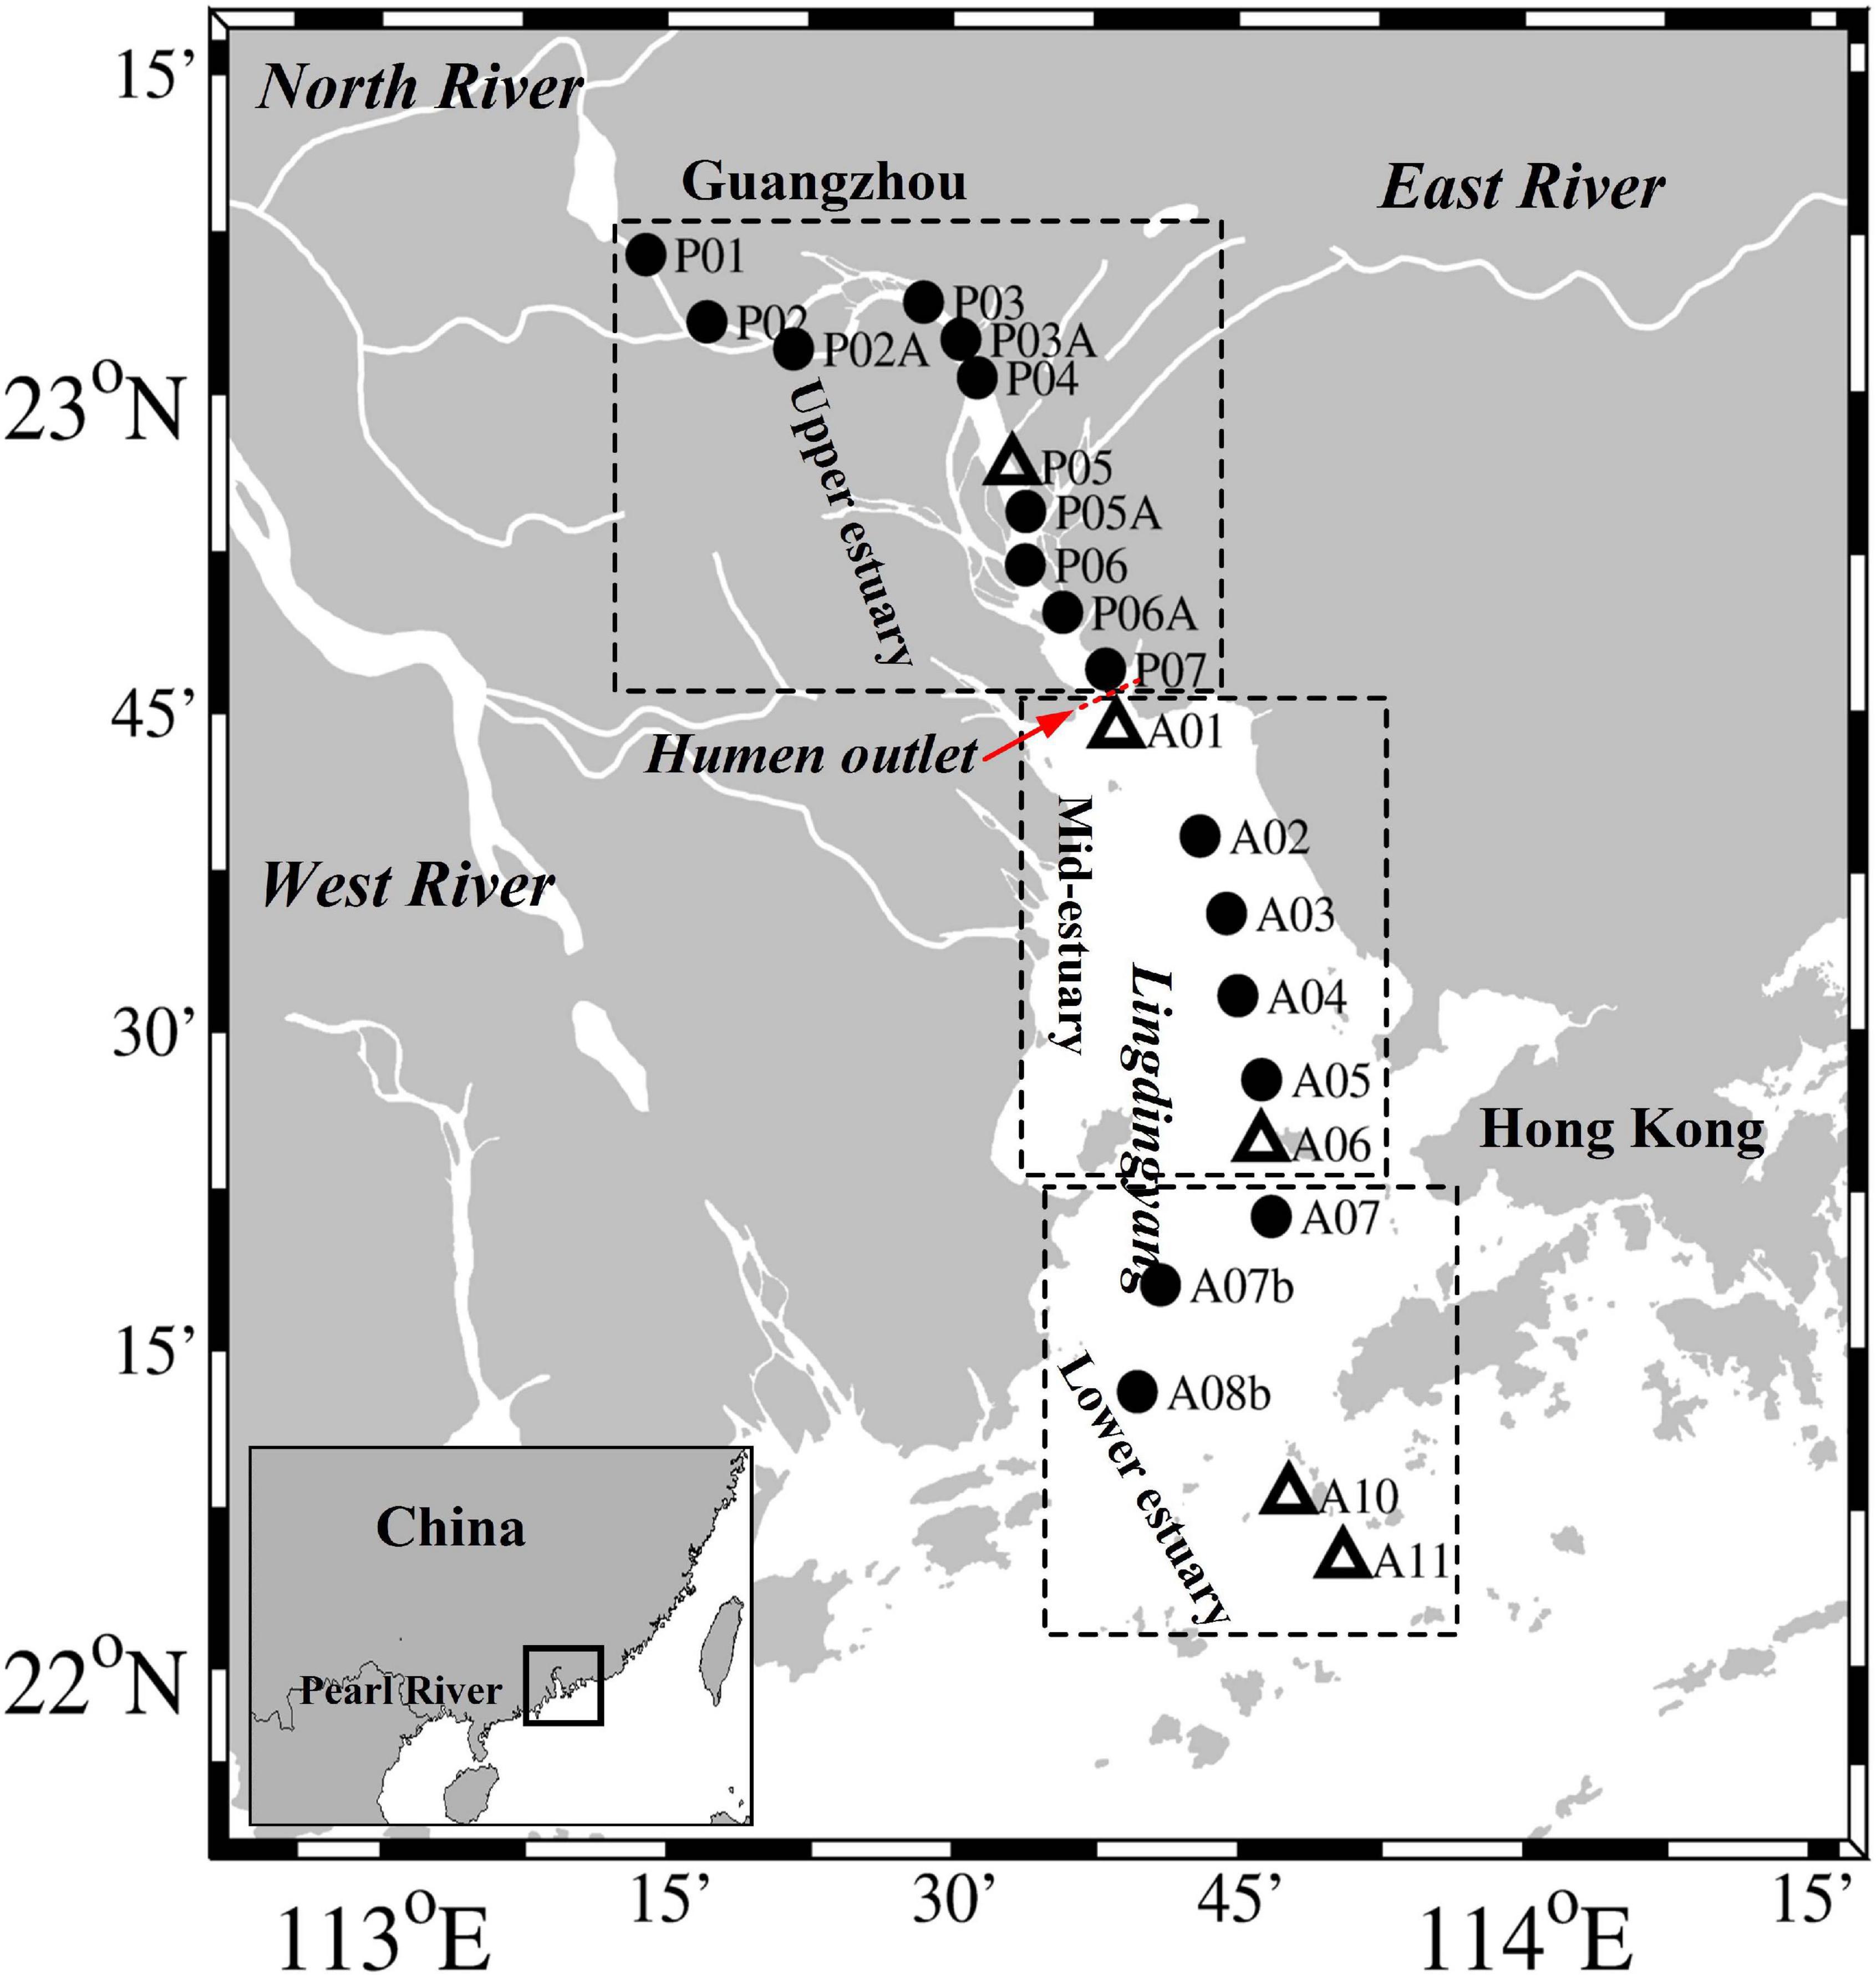
Figure 1. Map of the Pearl River estuary and the sampling sites in July 2014. The dotted boxes separate the study sites into the upper, mid, and lower estuarine regions. The open triangles represent the sites (P05, A01, A06, A10, and A11) where we conducted size fractionation experiments.
Analysis of Biogeochemical Parameters
The temperature and salinity were determined using the CTD system. Dissolved oxygen (DO) was measured using the Winkler titration method (Carpenter, 1965). The TSM on the filters were lyophilized and then weighed. The increase in weight of the filters represents the content of TSM. NH4+ was analyzed using the indophenol blue spectrophotometric method (Pai et al., 2001). Nitrate (NO3–), and nitrite (NO2–) were measured by an automatic analysis system (Bran-Lube, GmbH) (Han et al., 2012). N2O was determined at 25°C using a purge and trap system (Tekmar Velocity XPT, United States) coupled with a gas chromatograph (Agilent 6890, United States) equipped with a μECD detector (Lin et al., 2016; Ma et al., 2019).
Size Fractionation Experiments
Experimental Design
Size fractionation experiments were conducted at site P05, which is located in the upper estuary, sites A01 and A06, which are located in the mid-estuary, and sites A10 and A11, which are located in the lower estuary (Figure 1). For the gene analysis, water samples of 500–1000 mL were sequentially filtered through 3.0 μm, 0.45 μm, and 0.22 μm polycarbonate membranes (47 mm diameters, Millipore, IsoporeTM, United States) within ∼2 h at a pressure <0.03 MPa to retain the size fractionated communities (>3.0 μm, 0.45–3.0 μm, and 0.22–0.45 μm). To avoid the aperture of membrane filters blocked, we carefully monitored the filtration rates and changed the membrane filters when each 250–500 mL of water was filtered. RNAlater solution (Ambion, Austin, TX, United States) was immediately added to the samples to prevent RNA degradation. The filters were then immediately frozen in liquid nitrogen and stored at −80°C until further analyses.
Nucleic Acid Extraction and qPCR Analysis
DNA was extracted using a modified enzyme-phenol/chloroform protocol (Xia et al., 2015). According to Tan et al. (2019), RNA was extracted using the TRIzol reagent (Ambion, Austin, TX, United States) in combination with the PureLinkTM RNA Mini kit (Ambion, Austin, TX, United States), eluted with 50 μL RNase-free water and stored at −80°C. cDNA was obtained by reverse transcribing RNA using the First-Strand cDNA Synthesis kit (Invitrogen, Austin, TX, United States).
The Bact1369F/Prok1541R (Suzuki et al., 2000), 340F/1000R (Gantner et al., 2011), Arch-amoAF/Arch-amoAR (Francis et al., 2005), and amoA-1F/amoA-2R (Rotthauwe et al., 1997) primers were used for qPCR of the bacterial 16S rRNA, archaeal 16S rRNA, AOA-amoA and β-AOB-amoA genes, respectively. qPCR was performed using a LightCycler 480 Instrument II (Roche, Basel, Switzerland). All the samples were measured in triplicate, each in a total volume of 10 μL, comprising 0.5 μL of the template, 5 μL of 2 × SYBR Green Master Mix (Takara, Otsu, Japan), 0.5 μL of each primer, and 0.2 μL of ROX II. Details of the qPCR assays and primer sets are provided in the Supplementary Tables 2, 3. The presence and abundance of γ-AOB-amoA gene were also checked using two primer sets A189-F/A682-R and amoA3F/amoA4R (Holmes et al., 1995; Lam et al., 2009). However, the obtained results may be inaccurate due to its extremely low abundance. This is consistent with the previous study conducted in the PRE that found no trace of γ-AOB sequences in amoA clone libraries (Jin et al., 2011). Therefore, the data of γ-AOB-amoA gene was not included in the present study.
Statistical Analyses
The parametric ANOVA test or non-parametric Mann–Whitney U test was applied for comparing two variables, depending on the normality of the data set. The bivariate correlations between environmental factors and amoA genes were described by Pearson correlation coefficients (Table 1), using SPSS 18.0 (SPSS Inc., Chicago, IL, United States). False discovery rate (FDR)-based multiple comparison procedures were applied to evaluate the significance of multiple hypotheses and identify truly significant results (FDR-adjusted P value) (Pike, 2011). Table 1 shows the environmental parameters correlated significantly (P < 0.05) with at least one of the total abundances of DNA-based and cDNA-based amoA genes of β-AOB and AOA on the three size-fractionated particles. In addition, detrended correspondence analyses (DCA) were conducted based on the environmental parameter datasets and qPCR-based abundance of amoA genes. The maximum gradient length of DCA was >4.0, thus a canonical correspondence analysis (CCA) was used to analyze the variations in the AOB versus AOA distributions on different size-fractionated particles under different environmental constraints using R (version 3.4.4; vegan 2.5-3). The value of variance inflation factor (VIF) was used to check the multicollinearity of correlating variables, and here we used environmental parameters without multicollinearity (i.e., VIF < 10) in CCA (Sadyś et al., 2014). The qPCR-based relative abundances and environmental parameters were normalized via Z transformation (Magalhães et al., 2008). Hypothesis testing was performed using a Monte Carlo analysis (999 permutations).
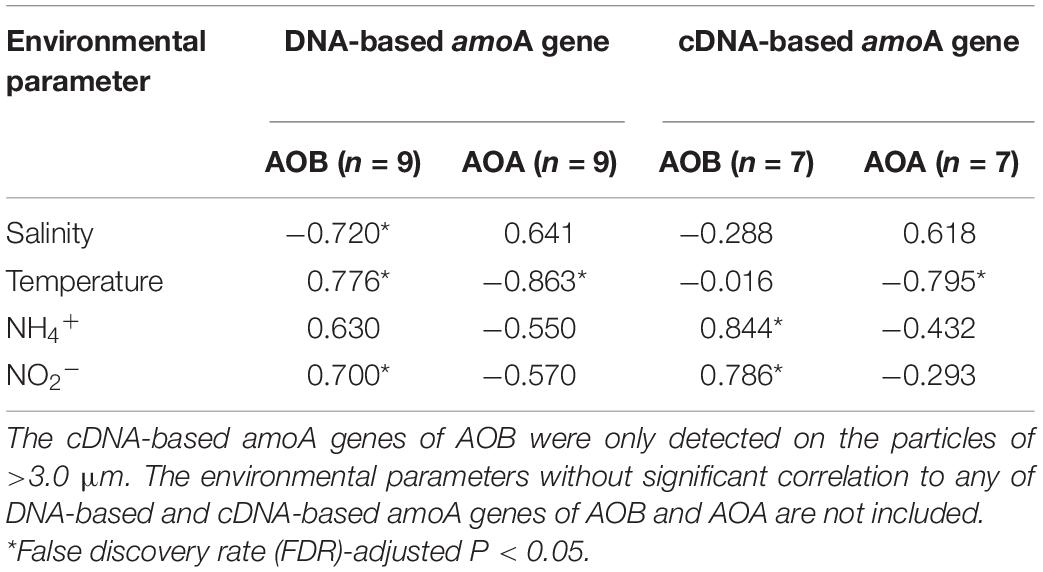
Table 1. The Pearson correlations between environmental parameters and total abundances of DNA-based and cDNA-based amoA genes of AOB and AOA on the three size-fractionated particles.
Results
Hydrochemistry and Biogeochemical Characteristics
In this investigation, we covered 22 sites in the PRE, including the upper (P01–P07), mid (A01–A06), and lower (A07–A11) estuarine regions (Figure 1). Most sites in the upper estuary were characterized by freshwater such that the salinity was close to 0, except for site P07 at which the salinity in the surface and bottom waters was 0.3 and 0.9, respectively. The salinity in the mid and lower estuarine regions increased seaward from 0.7 at site A01 to 16.5 at site A11 in the surface waters and from 1.6 at site A02 to 33.8 at site A11 in the bottom waters (Figure 2A). In general, the concentrations of TSM decreased seaward from the upper estuary. In the surface waters, the highest TSM concentration of 79.9 mg L–1 was found at site P01 and the lowest concentration of 8.2 mg L–1 was detected at site A11. The TSM concentrations were relatively higher in the bottom waters, with highest value of 124.4 mg L–1 at site P01 and lowest value of 16.5 mg L–1 at site A07 (Figure 2B). The total concentrations of NO3– + NO2– increased from 83.4 μmol L–1 at site P01 to >150 μmol L–1 at sites P06 and P07 in the upper estuary, and then decreased seaward to 3.2 μmol L–1 in the bottom water at site A11 (Figure 2C). The NH4+ concentration in the upper estuary was highest 308–314.6 μmol L–1 at site P01 and decreased dramatically to 1–2 μmol L–1 at site P06. Lower concentrations of NH4+ were found in the mid- and lower estuarine regions, ranging from 9.9 μmol L–1 at site A05 to below the detection limit at site A11 (Figure 2D).
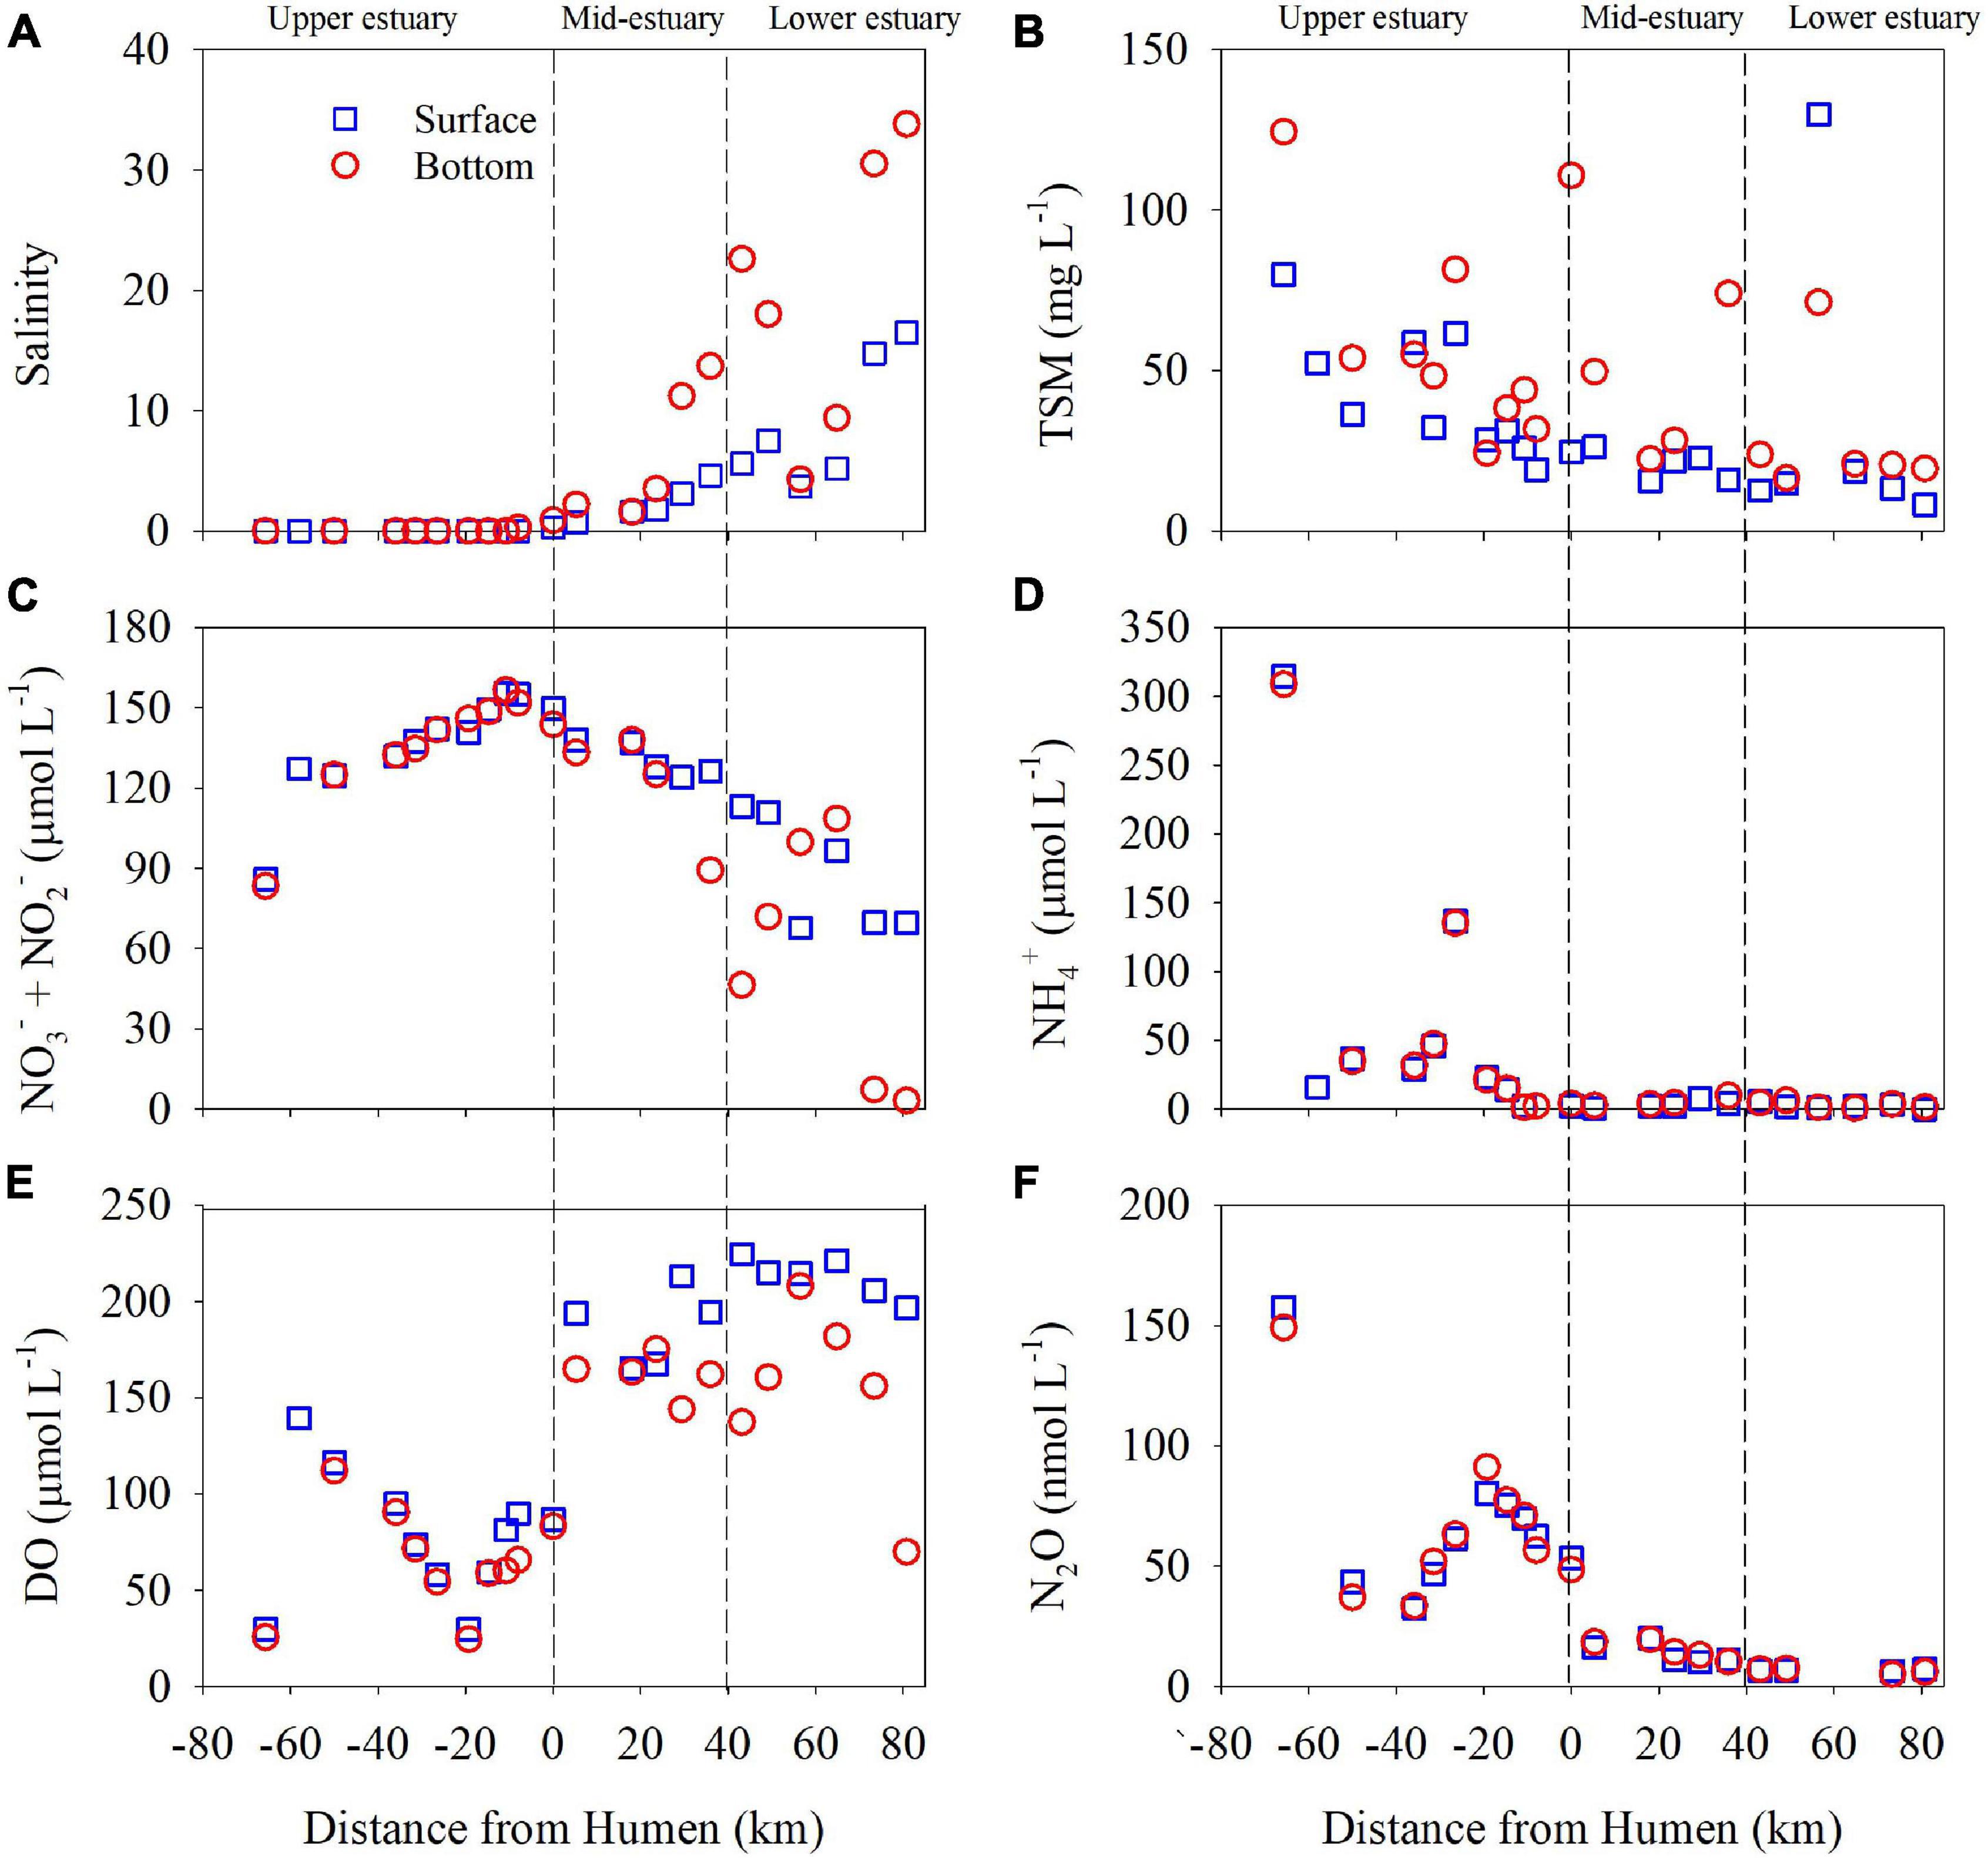
Figure 2. The distributions of salinity (A), total suspended matter (TSM) (B), nitrate (NO3−) + nitrite (NO2−) (C), ammonium (NH4+) (D), dissolved oxygen (DO) (E), and nitrous oxide (N2O) (F) in the Pearl River estuary in July 2014. The dotted vertical lines separate the study sites into the upper, mid, and lower estuarine regions. The salinity and DO datasets in the mid and lower regions (Lingdingyang) were reported previously by Su et al. (2017). The blue open squares and red open dots represent samples collected in the surface and bottom waters, respectively. Humen Outlet is represented here at 0 km. Negative distance values represent sites in the upper estuary, and positive distance values represent sites in the mid- and lower estuary.
As shown in Figure 2E, the DO concentration varied from 24.6 to 139.4 μmol L–1 in the upper estuary with the lowest value in the bottom water at site P05, and it was relatively higher in the mid- and lower estuarine regions, ranging from 69.8 to 224.7 μmol L–1. In addition, the N2O concentration was higher in the upper region, ranging from 32.6 to 157.7 nmol L–1, and decreased seaward in the mid- and lower estuarine regions (20.2 to 5.2 nmol L–1) (Figure 2F). The highest N2O concentration was observed in the bottom water at site P05, corresponding to the lowest DO concentration therein. The concentrations of DO and N2O in the surface and bottom waters had significant negative linear correlations (Supplementary Figure 1). However, the DO concentrations did not significantly correlate with NH4+ concentrations in the surface and bottom waters (Supplementary Figure 1).
Distributions and Transcripts of amoA Genes on the Different Size Fractions
The abundances of the β-AOB and AOA amoA genes were measured on three size-fractionated samples, collected from five sites representing the upper estuary (P05, with surface salinity of ∼0), mid-estuary (A01 and A06, with surface salinity of 0.6–3.3), and lower estuary (A10 and A11, with surface salinity of ∼16.5), respectively. We defined the three size fractions as the large (>3.0 μm), medium (0.45–3.0 μm), and small (0.22–0.45 μm) particles.
The total abundance of the DNA-based β-AOB amoA gene on the three size fractions varied from 1.11 ± 0.20 × 10⁴ to 1.61 ± 0.31 × 10⁵ copies L–1, with higher abundance in the upper estuarine waters and lower abundance in the mid- and lower estuarine waters (Figure 3A). In contrast, the total abundance of the DNA-based AOA amoA gene on the three size fractions increased seaward, varying from 4.72 ± 0.63 × 10³ copies L–1 in the upper estuarine waters to 7.57 ± 0.48 × 10⁶ copies L–1 in the lower estuarine waters (Figure 3B). The ratios of β-AOB/AOA for DNA-based amoA gene varied from 0.002 to 30.1 along the salinity gradient in the PRE (Supplementary Figure 2). Overall, the DNA-based β-AOB amoA genes had higher abundance than AOA only in the freshwater at site P05, whereas the abundance of the DNA-based AOA amoA genes were approximately 1–3 orders of magnitude higher than AOB in the saltwater (non-parametric Mann–Whitney U test, P < 0.01). Such distribution patterns were consistent on the different size fractionated particles (Supplementary Figure 2).
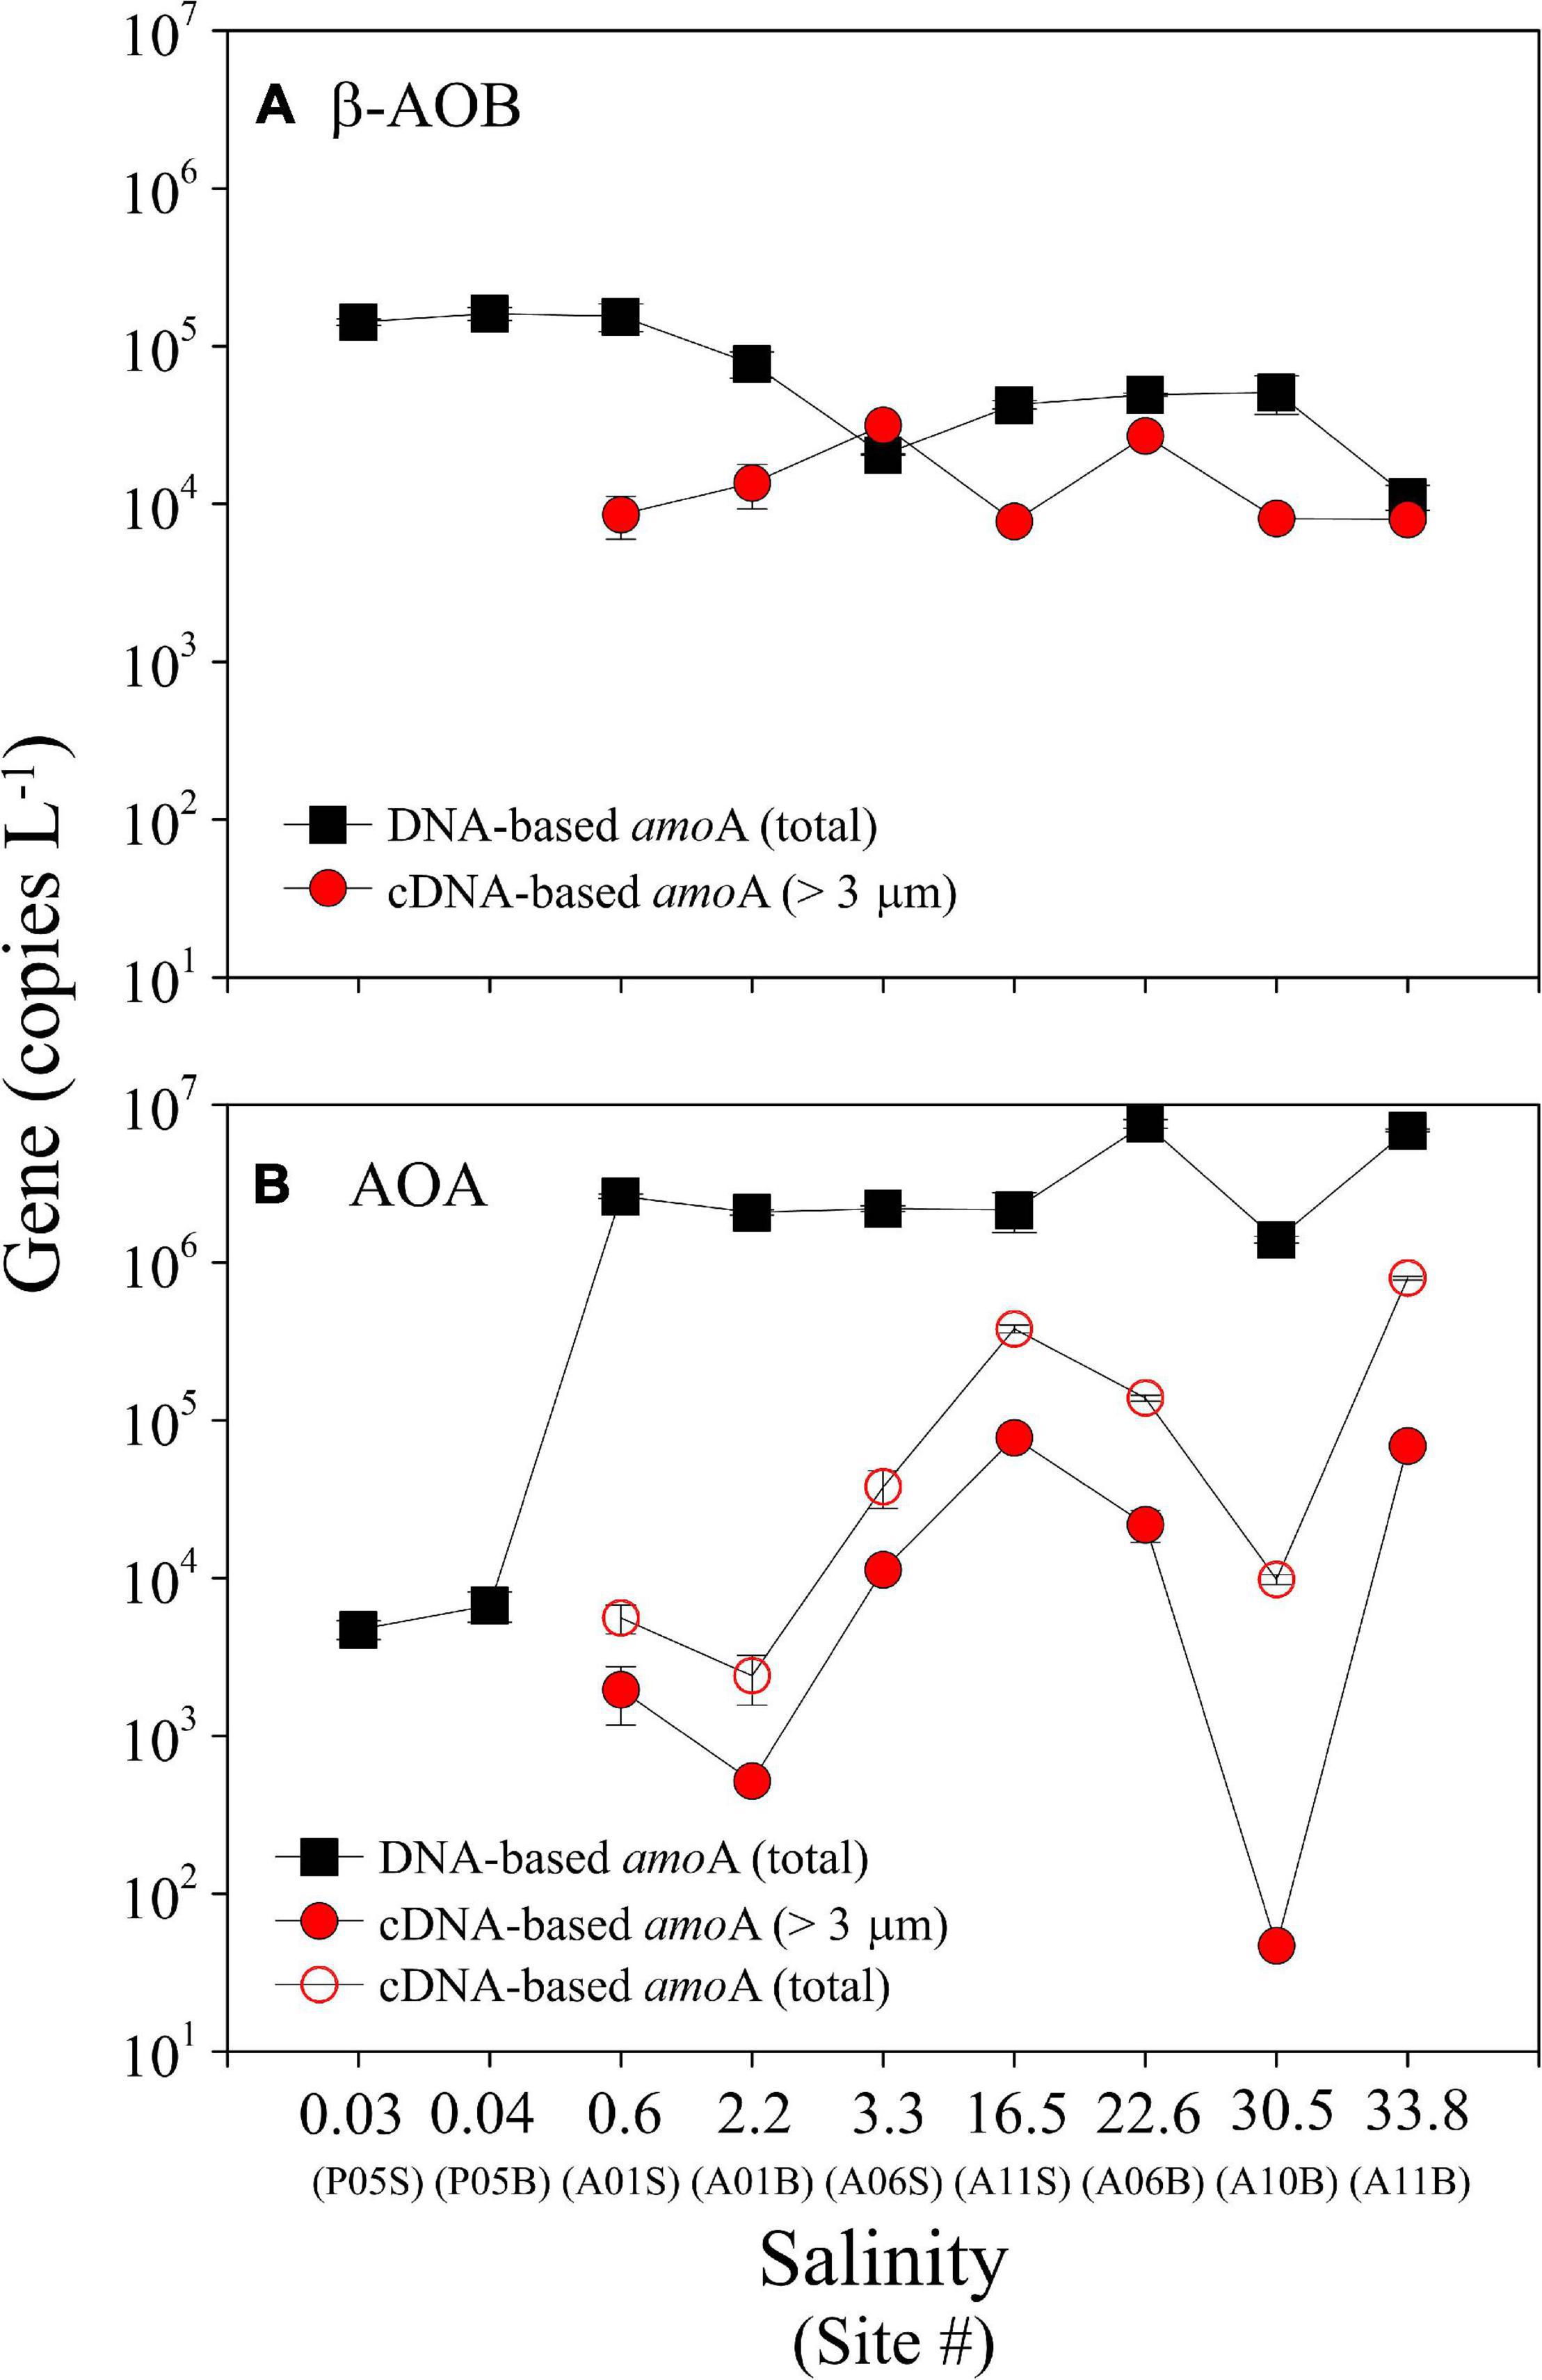
Figure 3. Total abundance of the DNA-based and cDNA-based amoA genes of β-AOB (A) and AOA (B) on three size-fractioned particles (>3.0 μm, 0.45–3.0 μm, and 0.22–0.45 μm) along the salinity gradient in the PRE. Note that the cDNA-based β-AOB amoA genes were only detected on particles of >3.0 μm (red solid circle). cDNA at site P05 was not studied because these samples were not stored with RNAlater (see text). The suffixes “S” and “B” of site information represent the surface and bottom samples at each site, respectively.
In general, the AOB had higher abundance on the large particles. Their relative abundance (when compared with the total amounts of β-AOB amoA genes) on this size-fraction varied from 33.5 to 93.2%, with higher values in the mid-estuary (Figure 4A and Supplementary Table 4). The relative abundances of DNA-based AOA amoA gene were 0.0–82.4% on the large particles, 16.7–70.0% on the medium particles, and 0.9–58.5% on the small particles, respectively (Figure 4B and Supplementary Table 4). Compared with AOB, the AOA were not dominated in any size fractionated particles. In addition, no clear trends in their relative abundances were found on the three size fractions (Figure 4B).
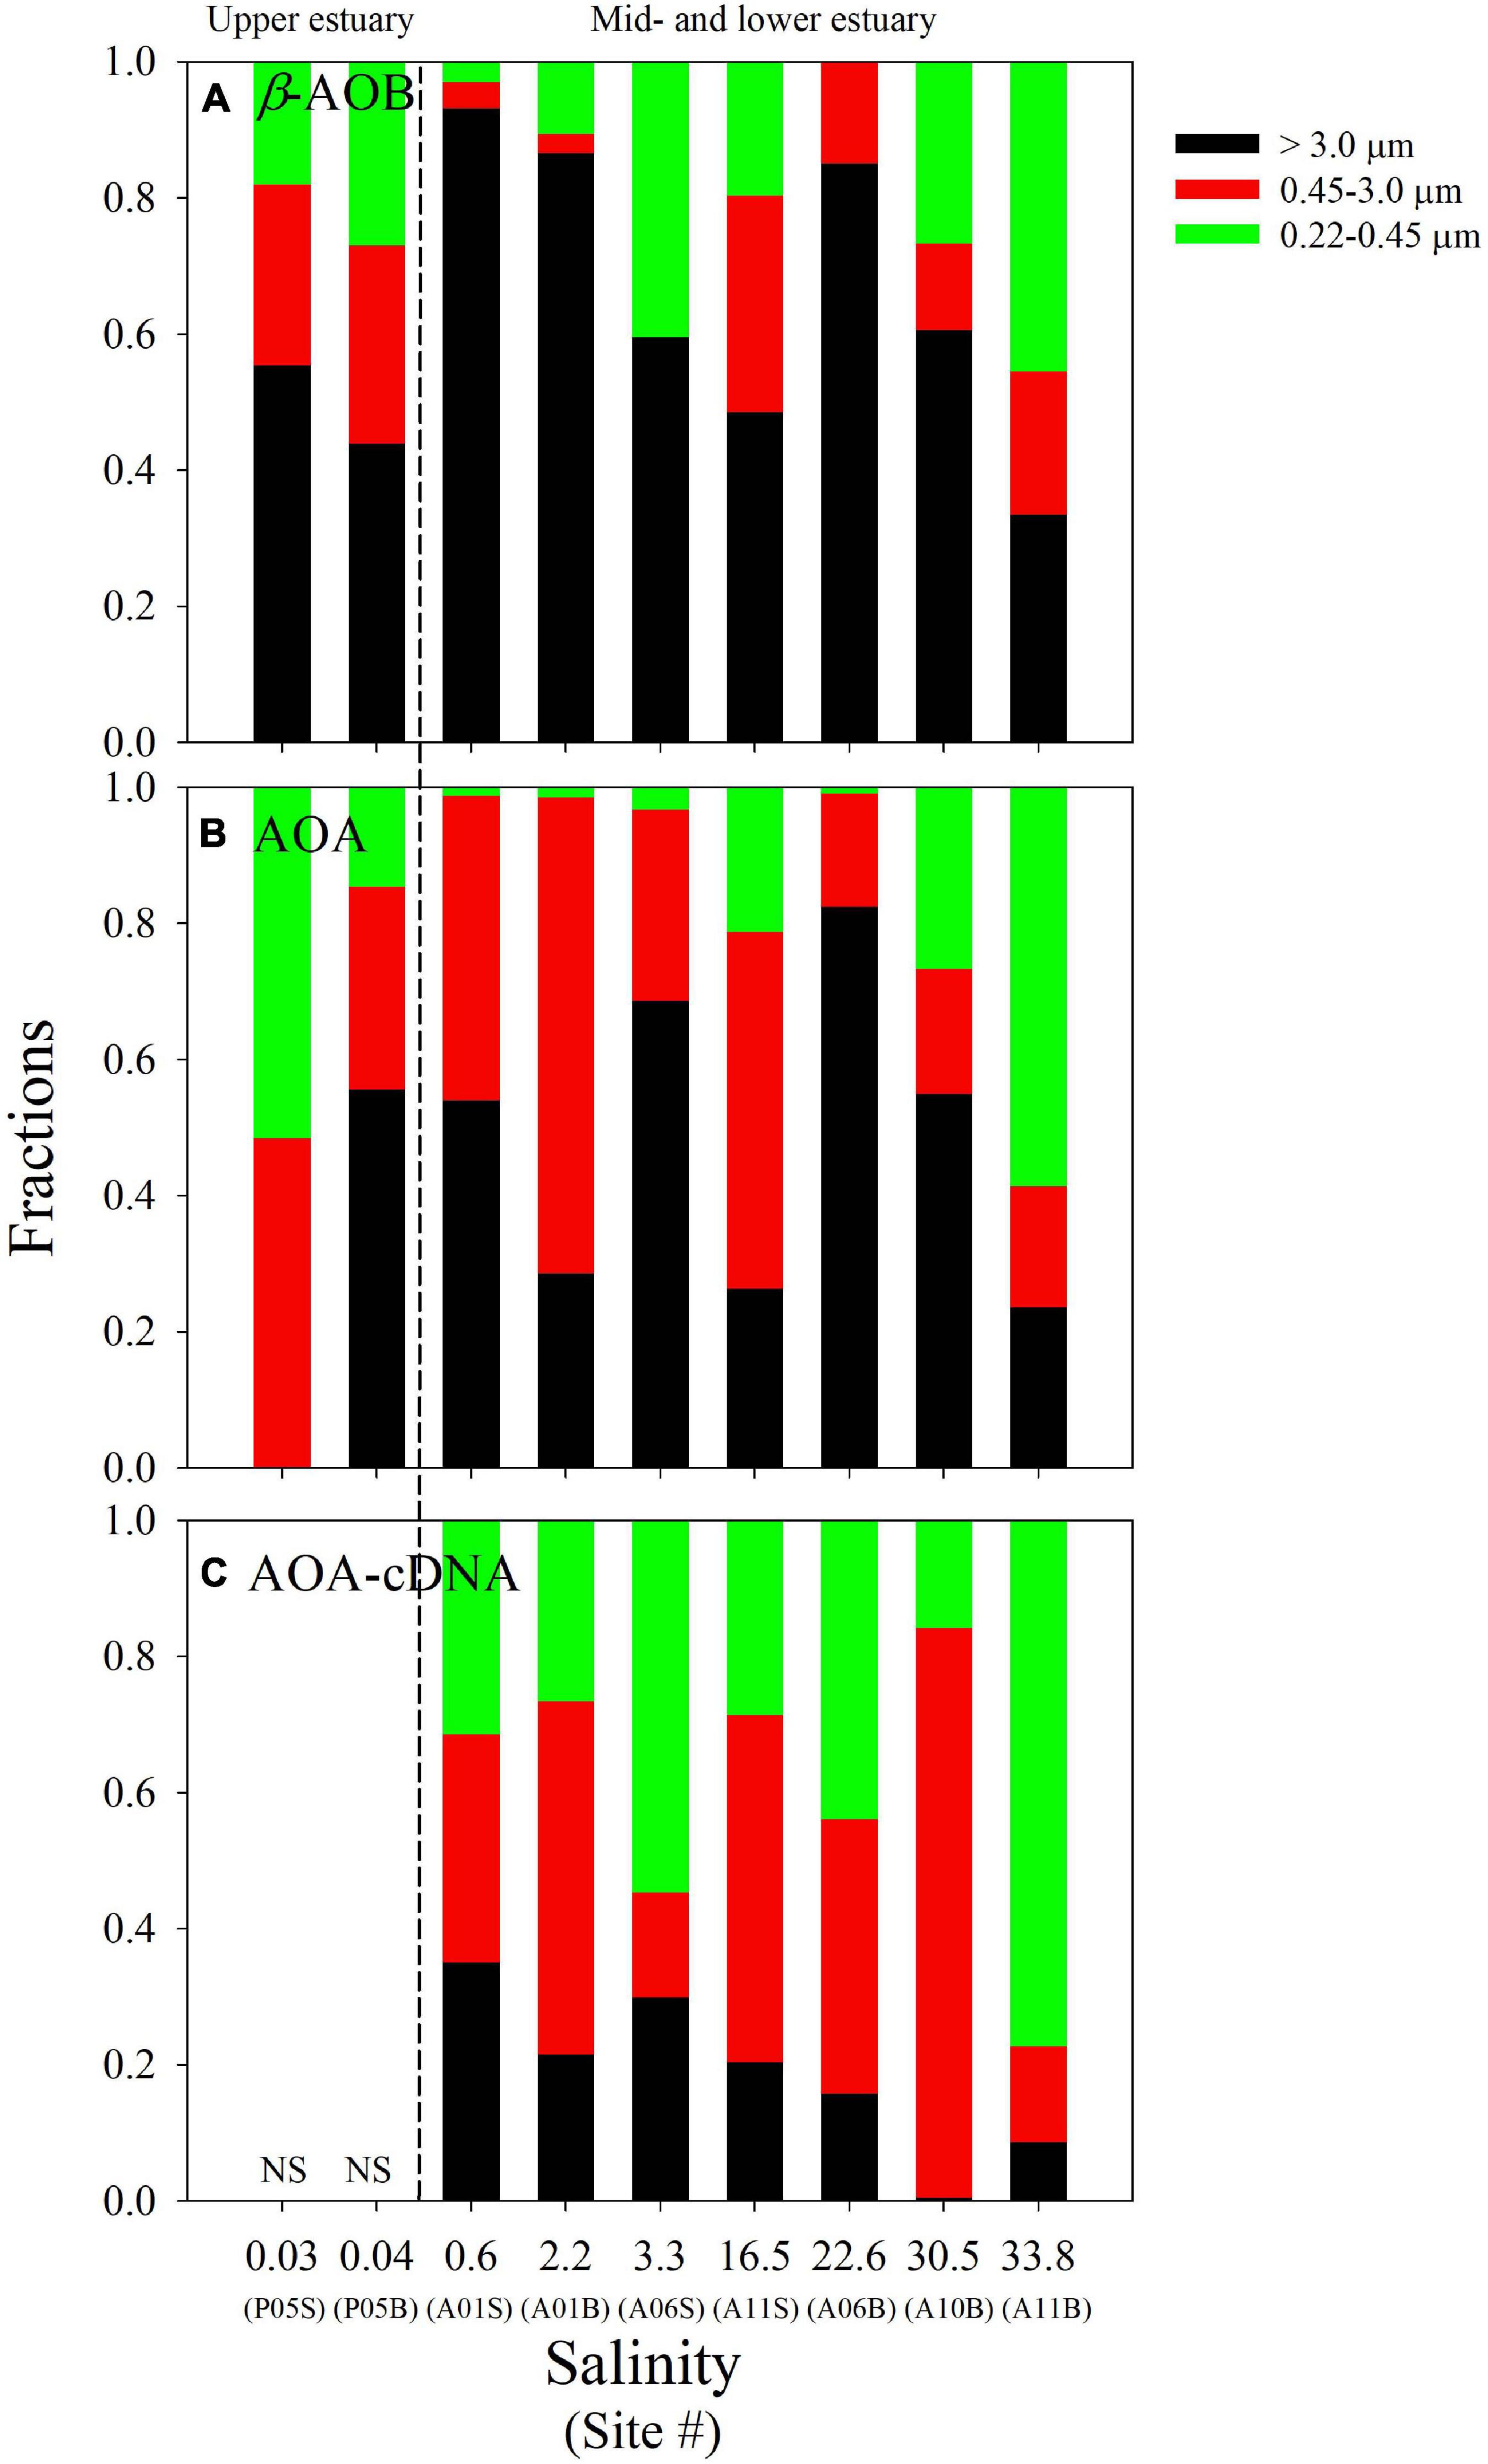
Figure 4. Relative abundance of the DNA-based amoA genes of β-AOB (A) and AOA (B) on the different size fractions along the salinity gradient in the PRE. In addition, the relative abundance of the cDNA-based amoA genes of AOA (C) on the different size fractions are also shown. The dashed line separates the study sites into the upper estuarine region, and the mid- and lower estuarine regions. The suffixes “S” and “B” of site information represent the surface and bottom samples at each site, respectively. The detailed data are presented in Supplementary Table 4.
Notably, β-AOB amoA gene transcripts were only detected on the large samples, where the cDNA-based gene abundances varied from 7.76 ± 0.41 × 10³ to 2.70 ± 0.11 × 10⁴ copies L–1 (Figure 3A). In contrast, AOA amoA gene transcripts were detected on all three of the size fractions with the total cDNA-based genes varying from 2.41 ± 0.84 × 10³ to 7.96 ± 0.22 × 10⁵ copies L–1 (Figure 3B). The cDNA-based AOA amoA genes on the large particles ranging from 47 ± 57 to 7.74 ± 0.26 × 10⁴ copies L–1 (Figure 3B) accounted for a minor contribution to the total abundances (0.5–35.1%), whereas higher contributions were found on the smaller size fractions of 0.22–0.45 and 0.45–3.0 μm (Figure 4C). Unfortunately, we did not obtain cDNA from the samples collected from site P05 in the upper estuary because these samples were stored without RNAlater. Thus, an accurate comparison of the P05 samples with the samples from the other sites, which were stored with RNAlater, was not possible.
Correlations Between the Abundance of the amoA Genes and Environmental Parameters
The bivariate correlations between environmental parameters and total abundances of the amoA genes on the three size-fractionated particles in the PRE were described by Pearson correlation coefficients (R value, see Table 1). The DNA-based β-AOB amoA genes on the three size fractions were significantly correlated (P < 0.05) with temperature (R = 0.776), NO2– (R = 0.700), and salinity (R = −0.720), while the cDNA-based β-AOB amoA genes that were only detected on the large particles were positively correlated (P < 0.05) with NH4+ (R = 0.844) and NO2– (R = 0.786). Unlike to AOB, both DNA-based and cDNA-based AOA amoA genes on the three size fractions were negatively correlated with temperature (P < 0.05-0.01). The correlation between AOA amoA genes and NH4+ concentrations (R = −0.550, P = 0.13) was not significant.
The CCA was further conducted to identify variations in the distributions of the ammonia oxidizers on the large, medium, and small particles under different environmental constraints. As shown in Figure 5, the first two CCA axes explained 93.5% of the variations in the AOB and AOA amoA genes on the different size fractions under the environmental parameters in the PRE. NH4+, DO, temperature, and salinity were the significant variables that determined the distributions of different size-fractionated ammonia oxidizers in the PRE (P < 0.05-0.01), whereas the TSM may play a minor role. It is worth noting that DO was not significantly correlated with the total abundances of DNA- and cDNA-based AOB and AOA amoA genes during the study period. Overall, the AOB-related samples were consistently distributed in the upper estuary. The AOB on all three size fractions were positively correlated with NH4+ and temperature, whereas negatively correlated with DO and salinity. Conversely, the AOA-related samples distributed in the mid- and lower estuarine regions (Lingdingyang), with reverse correlations with the environmental parameters. In addition, the AOA on the small particles, and on both the large and medium particles were divided by the positive and negative half of CCA2 axis.
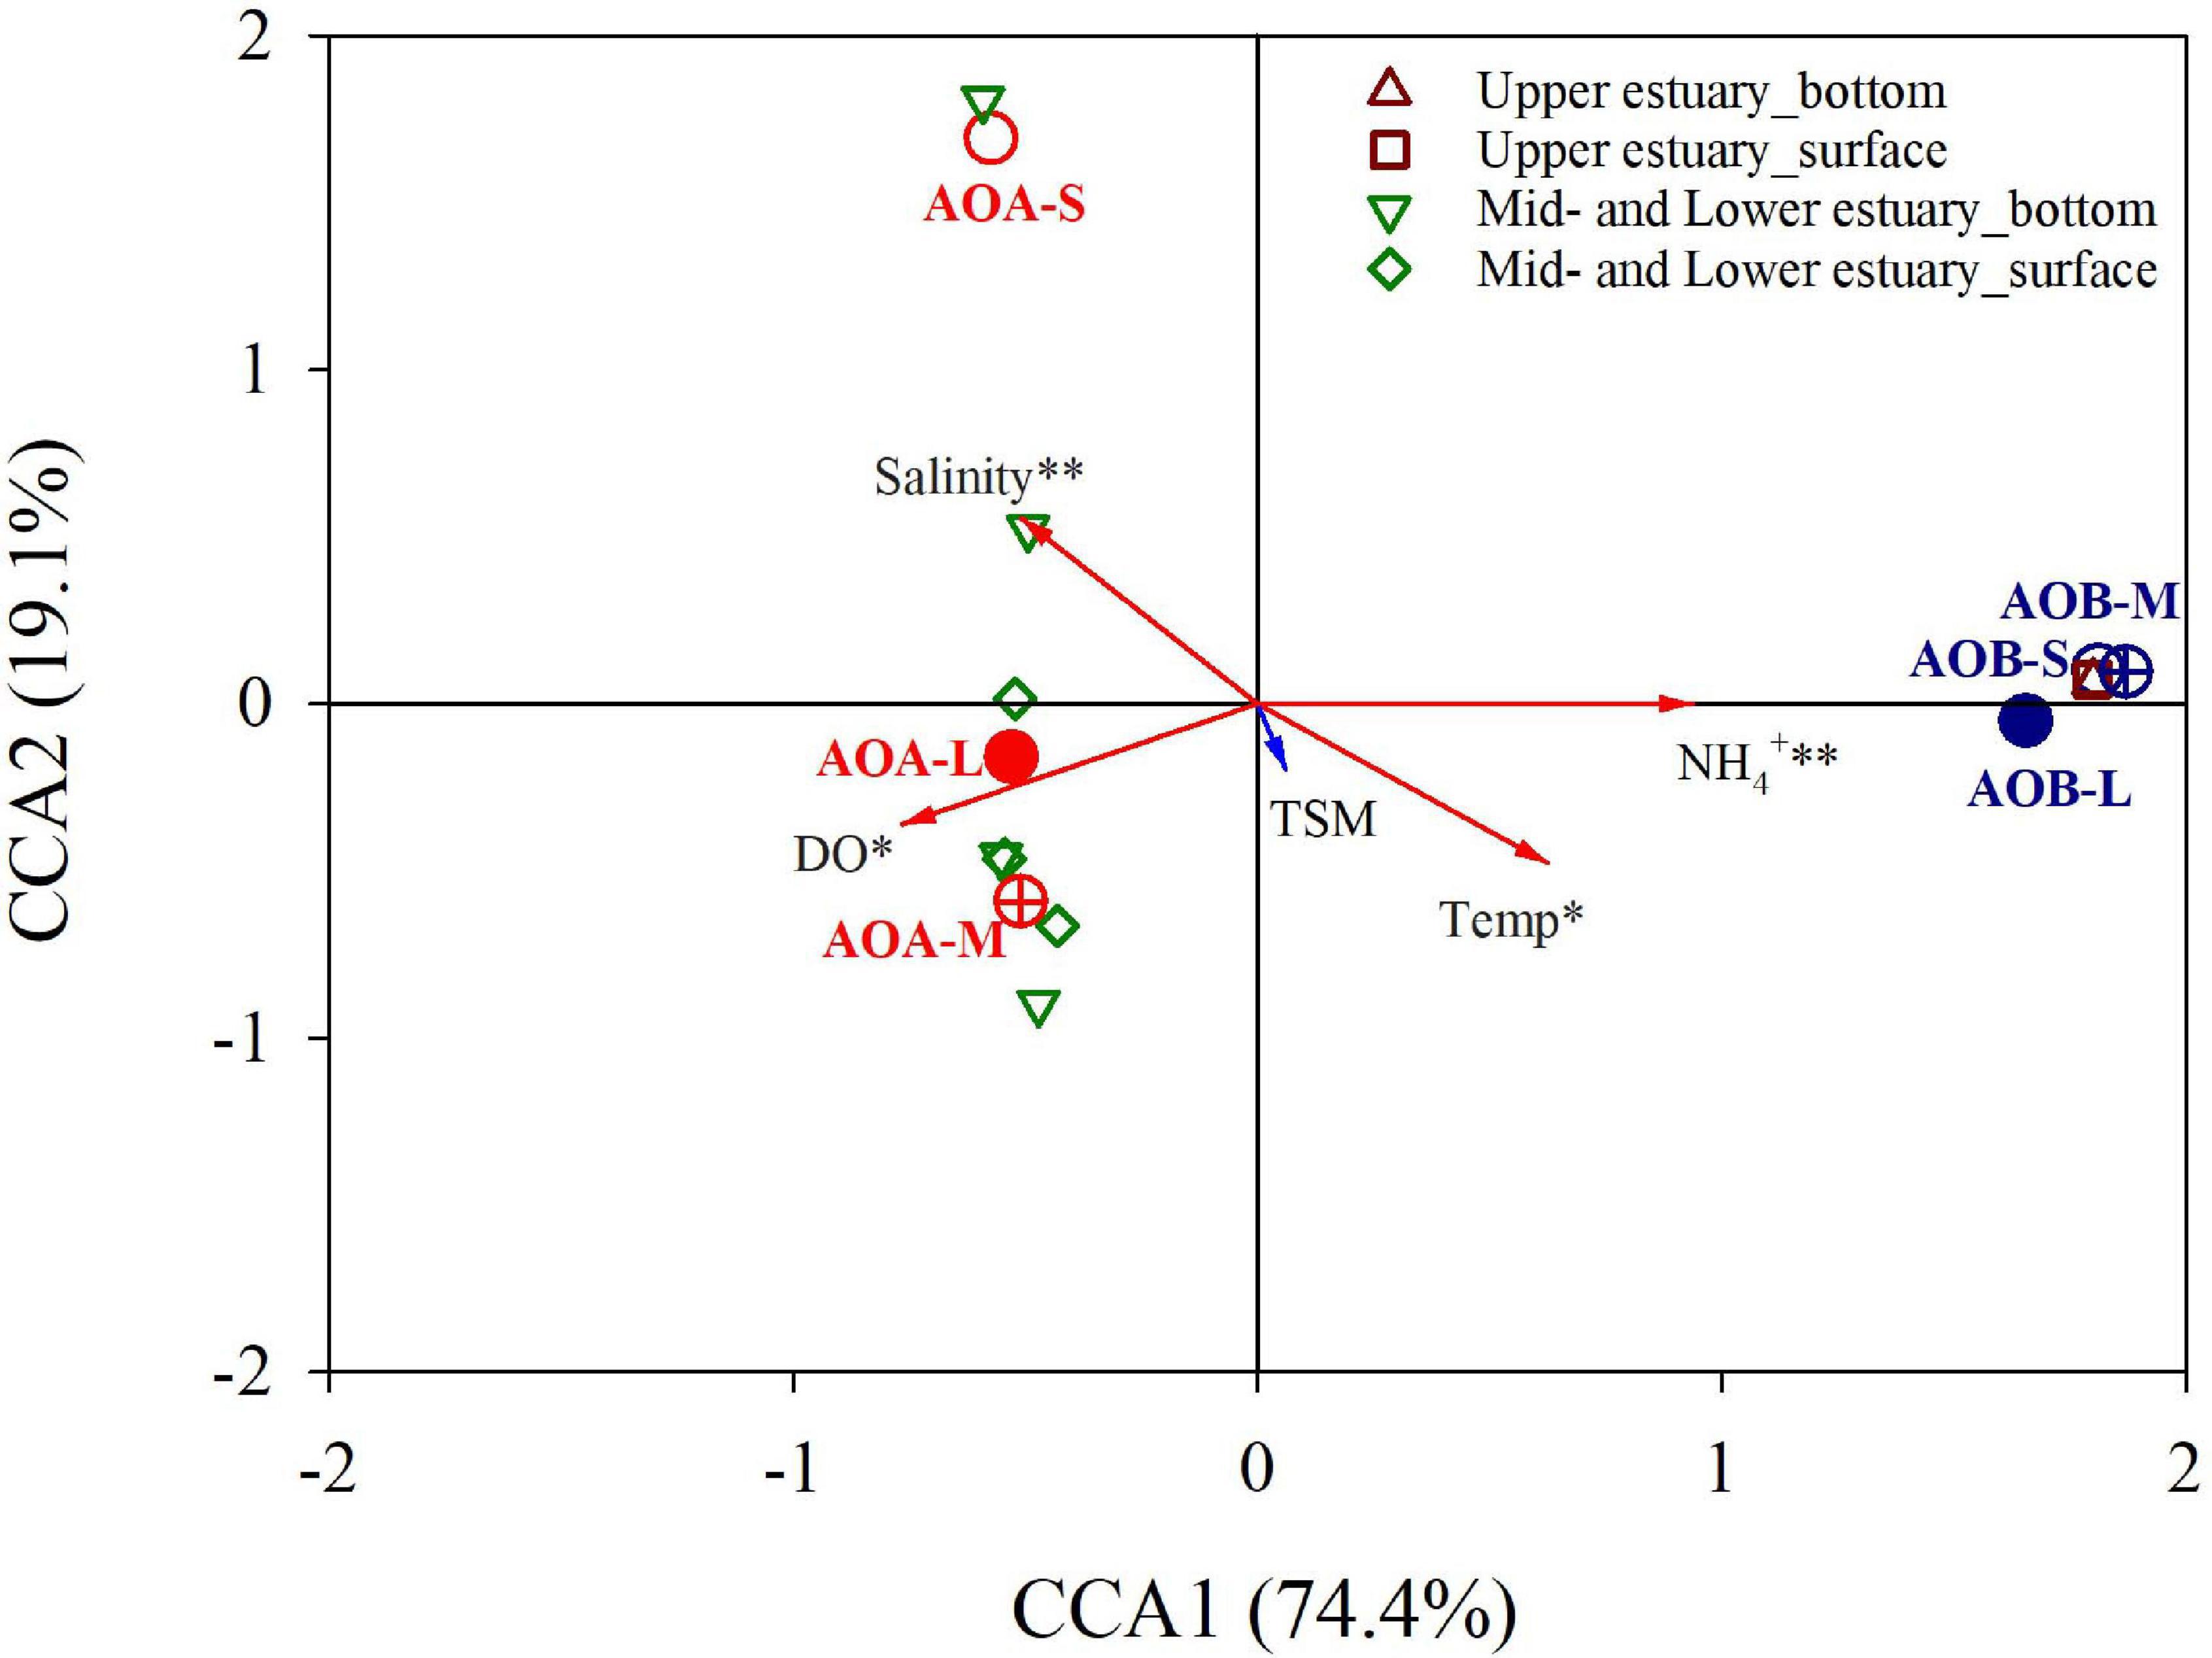
Figure 5. Constrained ordinations of the DNA-based AOB and AOA amoA genes on the large (L; >3.0 μm; solid circle), medium (M; 0.45–3.0 μm; crossed circle), and small (S; 0.22–0.45 μm; open circle) size-fractionated particles with environmental factors by canonical correspondence analysis (CCA). Samples in the surface and bottom waters from the upper estuary (n = 2) and the Lingdingyang (the mid- and lower estuary, n = 7) are also shown. The vectors represent the environmental variables. These variables that have statistically significant influence on the distribution of size-fractionated ammonia oxidizers are marked with asterisk and revealed by the red arrows. Temp stands for temperature.
Discussion
Distribution of AOB Versus AOA in Response to Environmental Factors in the PRE
In estuaries characterized by strong gradients in salinity, TSM and nutrients, the AOB and AOA often display disparate patterns in response to environmental features (Leininger et al., 2006; Wuchter et al., 2006; Santoro et al., 2008; Zhang et al., 2014). In this study conducted in the PRE, the abundance of AOB exceeded that of AOA in the freshwaters. The numbers of AOB decreased with an increase in salinity, whereas the AOA were more abundant in the high-salinity waters of the lower estuary. Similar distribution patterns of AOB and AOA have been reported in Chesapeake Bay (Ward et al., 2007) and Westerschelde estuary (Sahan and Muyzer, 2008). However, other studies showed different distribution patterns of AOB and AOA along the salinity gradients. For example, in San Francisco Bay (Mosier and Francis, 2008) and Weeks Bay (Caffrey et al., 2007) AOB were found to outnumber AOA as the salinity increased. In addition, in Plum Island Sound estuary, the ratios of AOA to AOB generally decreased with increasing salinity, but AOA were more abundant than AOB (Bernhard et al., 2010). The abundances and distribution patterns of AOB and AOA in the estuarine system are not solely regulated by the salinity effect. Our results based on the CCA and Pearson correlation revealed that the distribution patterns of ammonia-oxidizers in the PRE were likely controlled by a combination of temperature, salinity, substrate (NH4+ and NO2), and DO (Table 1 and Figure 5).
The β-AOB amoA genes decreased along the salinity gradient, while the AOA amoA genes increased considerably at sites with salinity higher than 0.5 (Figure 3). The corresponding ratios of β-AOB to AOA amoA genes changed from >30 in the freshwater to 0.002 in the seawater. This result indicates obvious shifts in ammonia-oxidizing communities in the PRE. The disparate distribution patterns of AOB and AOA also reflect differences in their adaptation to the various environmental gradients of the PRE. The β-AOB amoA genes were more abundant in the upper estuary than those in the lower estuarine regions. This finding is consistent with a previous study, which similarly found that AOB had a higher abundance than AOA along the Dongjiang tributary in the upper reach of the PRE (Sun et al., 2014). Low DO (<30 μmol L–1) and enriched NH4+ substrate (25–30 μmol L–1) in the upper estuary (Figure 2) may stimulate the growth and activity of AOB on the large particles, as we found that the abundance and transcripts of β-AOB amoA gene on the large particles were positively correlated with DO and NH4+ (Table 1 and Figure 5). This is supported by the previous studies that indicated higher abundance of DNA-based AOB amoA genes associated with increased potential nitrification rates in the upper PRE (Sun et al., 2014; Hou et al., 2018). Our observation suggests that AOB amoA genes might be more active in rich substrate and oxygen-depleted conditions.
In contrast, AOA were generally more abundant than AOB in the mid- and lower estuarine regions that are characterized by the low concentrations of NH4+, due to mixing with oligotrophic seawater (Figures 2, 3). Recent studies have proposed that the AOA have evolved their substrate-transport mechanisms to thrive in conditions of low NH4+, and they thus have a higher affinity to oligotrophic environments (Martens-Habbena et al., 2009; Kits et al., 2017). Archaea of Marine Group I are generally the abundant archaeaplankton members of the coastal and open ocean (Karner et al., 2001; Könneke et al., 2005). Indeed, the Nitrosopumilus maritimus SCM1 has been recently found as the dominated amoA genotype AOA in the PRE (Zou et al., 2019). In addition, it is reasonable that changes in salinity due to the physical mixing has more effect on the distribution of the AOA on the small particles (Figure 5). Notably, we observed that temperature (27.7–31.5°C) was negatively correlated with AOA amoA gene transcripts and the abundances of AOA amoA gene on the different size fractions in the present study (Table 1 and Figure 5), which supports the finding that increasing temperature (24–34°C) would suppress ammonia oxidation in the oligotrophic offshore where AOA dominate in the ammonia oxidizers (Zheng et al., 2020). Together, these results reveal the AOA are sensitive to temperature and adapt to the NH4+-depleted environment.
Niche Differences of AOB Versus AOA on Size Fractionated Particles
The size-fractionated results clearly showed that in the PRE, the AOB prefer to attach to large particles as evidenced by the highest relative abundance of DNA-based β-AOB amoA gene on the large particles at most sites (33.5–93.2% with an average of 62.8%; Figure 4A and Supplementary Table 4). In contrast, the AOA appear not to be dominated on any size-fractionated particle. This finding is consistent with a previous study by Hou et al. (2018), in which a two-size fraction design (>3.0 μm and 0.22–3.0 μm) and different primer sets for amplifying β-proteobacterial amoA were applied. Moreover, cDNA-based βAOB amoA genes were exclusively detected on the large particles. In this regard, the β-AOB amoA gene on the medium and small particles that accounted for ∼37.2% of total abundances may be inactive. These results suggest the particle-associated nature of AOB. Conversely, more of the cDNA-based AOA amoA genes were detected on the medium and small particles, suggesting the free-living strategy of these microbes. We further compared the transcriptional activity (indicated by the cDNA/DNA ratio) of AOB versus AOA on the large particles. The cDNA/DNA ratios of AOB are significantly higher than those of AOA (Figure 6), suggesting that the AOB community is more metabolically active than the AOA community on the large particles. These findings indicate that the AOB attached to the large particles might be more actively involved in ammonia oxidation than AOA, despite their lower abundance in the mid- and lower estuarine regions.
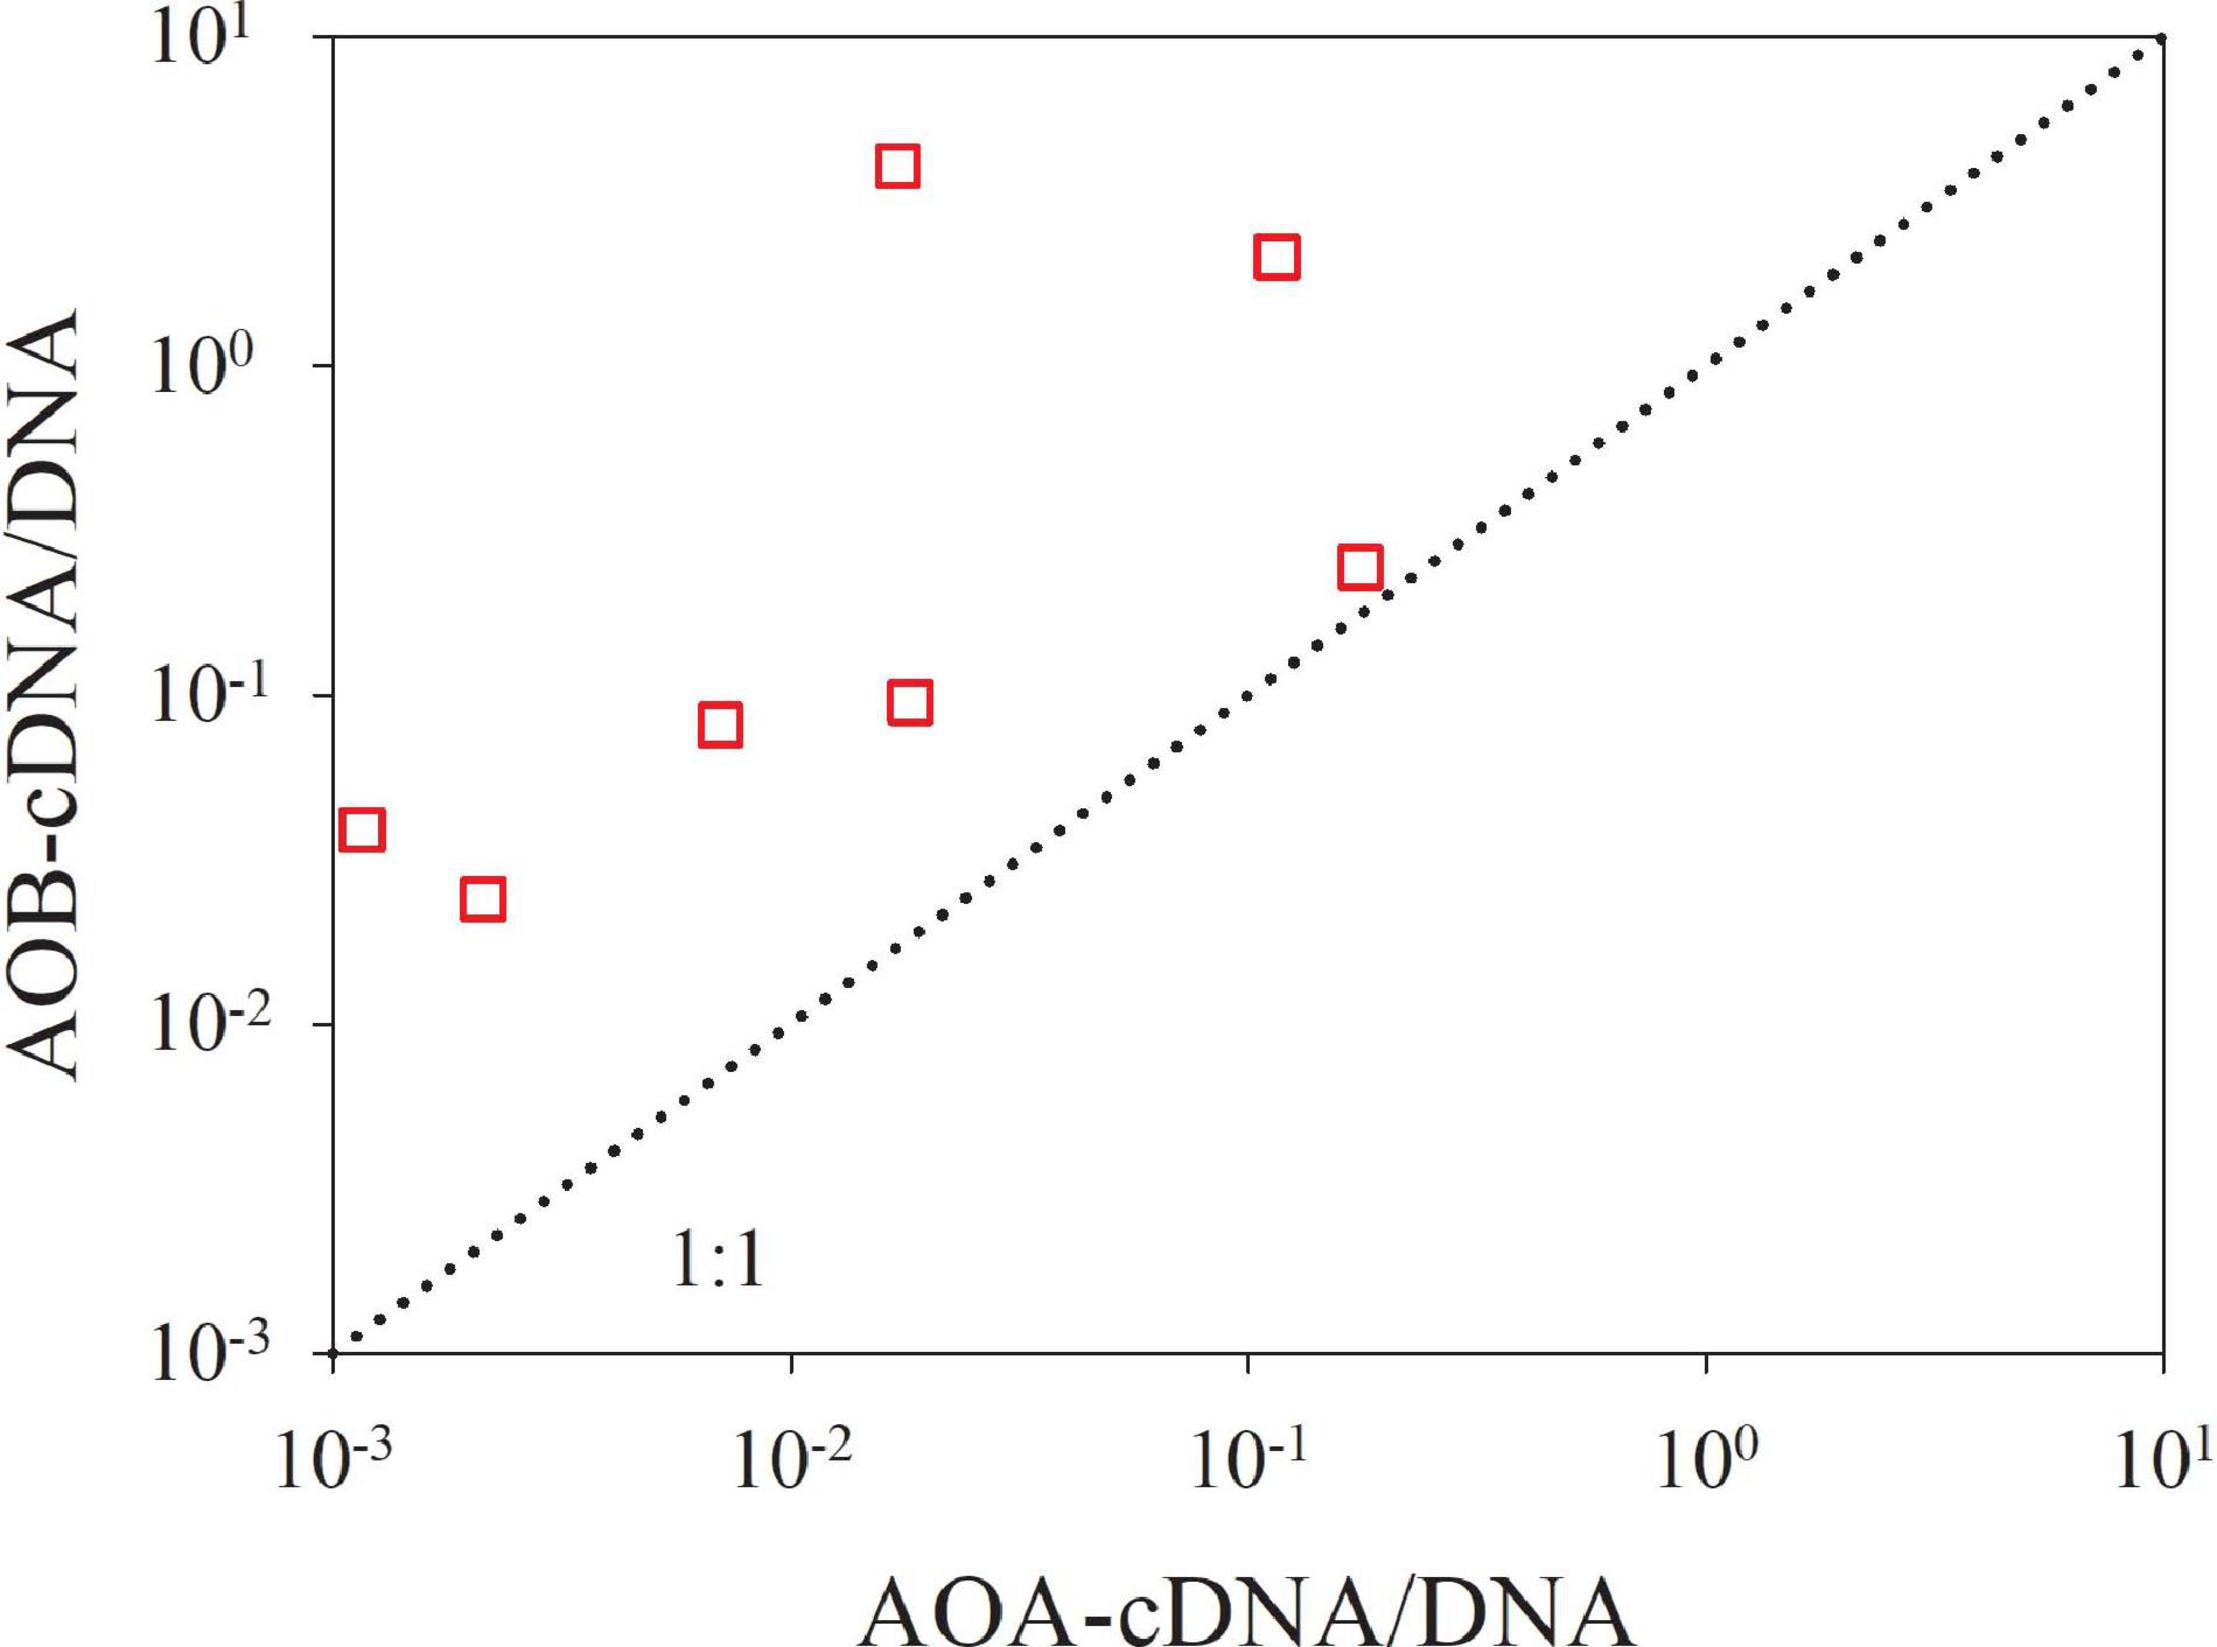
Figure 6. The transcriptional activity of AOB versus AOA on the >3.0 μm size fraction. The ratio of cDNA-based to DNA-based amoA gene (cDNA/DNA) is defined as the transcriptional activity. The dotted line is the 1:1 line.
In addition, it is possible that the recently discovered complete ammonia-oxidizing (comammox) microorganisms may play a role in ammonia oxidation especially in the mid- to lower estuary. This is because that ammonia affinities of comammox bacteria are higher than those of AOB and most species of AOA, except for Nitrosopumilus species (Kits et al., 2017; Zhang et al., 2020). The presence of comammox bacteria has been reported in sediments of some coastal systems (Yu et al., 2018; Sun et al., 2020; Bernhard et al., 2021). However, recent evidence indicates no comammox bacteria found on suspended particles of 0.22–3 μm in the PRE (close to site A11 in this study) (Zou et al., 2019). The contribution of comammox bacteria attached to the large particles could not be ruled out. In order to fully understand the potential importance of comammox bacteria in the estuary, further studies on their distribution and transcriptional activity on different size-fractionated particles should be considered in future field studies.
Data Availability Statement
The original contributions presented in the study are included in the article/Supplementary Material, further inquiries can be directed to the corresponding author. The datasets presented in this study can also be found in the PANGAEA Data Archiving and Publication.
Author Contributions
MD and HL conceived and designed the experiments. LM and ST performed the experiments and analyzed the data. LM, ST, and J-YY wrote the manuscript. All authors contributed to the interpretation of results and critical revision.
Funding
This work was supported by the National Key Scientific Research Project sponsored by the Ministry of Science and Technology of the People’s Republic of China (Grant #2015CB954000) and the Strategic Priority Research Program of Chinese Academy of Sciences (Grant #XDB42000000). This study was also supported by the National Natural Science Foundation of China (Grants #41730533, #41721005, #91851209, #92058204, and #41890804), the Fundamental Research Funds for the Central University (Grants #20720190092 and #20720212005), State Key Laboratory of Marine Resource Utilization in South China Sea (Hainan University) (Grant #MRUKF2021018), and partially supported by a grant from the Research Grants Council of the Hong Kong Special Administrative Region, China (Project N_HKUST609/16 and T21-602/16R).
Conflict of Interest
The authors declare that the research was conducted in the absence of any commercial or financial relationships that could be construed as a potential conflict of interest.
Publisher’s Note
All claims expressed in this article are solely those of the authors and do not necessarily represent those of their affiliated organizations, or those of the publisher, the editors and the reviewers. Any product that may be evaluated in this article, or claim that may be made by its manufacturer, is not guaranteed or endorsed by the publisher.
Acknowledgments
We thank Baiyun Wang, Wenbin Zou, Li Tian, Yangyang Lu, and Qing Li for assisting with the on-deck ammonium measurements, Jianzhong Su for measuring dissolved oxygen, Tao Huang and Lifang Wang for providing the cruise measurements of nitrate and nitrite, Liguo Guo for helping with the DIC data and Huade Zhao for making the site map. We sincerely thank Xiuli Yan, Xiaomin Xia, and Sarah E. Ho for comments on the manuscript. We also thank the editor and three reviewers for their insightful comments.
Supplementary Material
The Supplementary Material for this article can be found online at: https://www.frontiersin.org/articles/10.3389/fmars.2021.685955/full#supplementary-material
Supplementary Figure 1 | Scatter plots of DO vs. N2O (A) and (B) for the surface and bottom waters in the study area.
Supplementary Figure 2 | Ratios of β-AOB/AOA for DNA-based amoA gene on the >3.0 μm (A), 0.45–3.0 μm (B), and 0.22–0.45 μm (C) particles, and on all three size fractionated particles (D). N.D. denotes the β-AOB or AOA undetected on that size fraction.
References
Allen, D., Dalal, R. C., Rennenberg, H., and Schmidt, S. (2011). Seasonal variation in nitrous oxide and methane emissions from subtropical estuary and coastal mangrove sediments, Australia. Plant Biol. 13, 126–133. doi: 10.1111/j.1438-8677.2010.00331.x
Bernhard, A. E., Beltz, J., Giblin, A. E., and Robert, B. J. (2021). Biogeography of ammonia oxidizers in New England and Gulf of Mexico salt marshes and the potential importance of comammox. ISME Commun. 1:9. doi: 10.1038/s43705-021-00008-0
Bernhard, A. E., Landry, Z. C., Blevins, A., De La Torre, J. R., Giblin, A. E., and Stahl, D. A. (2010). Abundance of ammonia-oxidizing archaea and bacteria along an estuarine salinity gradient in relation to potential nitrification rates. Appl. Environ. Microbiol. 76, 1285–1289. doi: 10.1128/AEM.02018-09
Bricker, S. B., Longstaff, B., Dennison, W., Jones, A., Boicourt, K., Wicks, C., et al. (2008). Effects of nutrient enrichment in the nation’s estuaries: a decade of change. Harmful Algae 8, 21–32. doi: 10.1016/j.hal.2008.08.028
Caffrey, J. M., Bano, N., Kalanetra, K., and Hollibaugh, J. T. (2007). Ammonia oxidation and ammonia-oxidizing bacteria and archaea from estuaries with differing histories of hypoxia. ISME J. 1, 660–662. doi: 10.1038/ismej.2007.79
Carpenter, J. H. (1965). The Chesapeake Bay Institute technique for the Winkler dissolved oxygen method. Limnol. Oceanogr. 10, 141–143. doi: 10.4319/lo.1965.10.1.0141
Dai, M., Gan, J., Han, A., Kung, H. S., and Yin, Z. (2014). “Physical dynamics and biogeochemistry of the Pearl River plume,” in Biogeochemical dynamics at major river-coastal interfaces, Linkages with Global Change, eds T. Bianchi, M. Allison, and W.-J. Cai (Cambridge, NY: Cambridge University), 321–352. doi: 10.1017/cbo9781139136853.017
Dai, M., Guo, X., Zhai, W., Yuan, L., Wang, B., Wang, L., et al. (2006). Oxygen depletion in the upper reach of the Pearl River estuary during a winter drought. Mar. Chem. 102, 159–169. doi: 10.1016/j.marchem.2005.09.020
Dai, M., Wang, L., Guo, X., Zhai, W., Li, Q., He, B., et al. (2008). Nitrification and inorganic nitrogen distribution in a large perturbed river/estuarine system: the Pearl River Estuary. China. Biogeosci. 5, 1227–1244. doi: 10.5194/bg-5-1227-2008
Damashek, J., Casciotti, K. L., and Francis, C. A. (2016). Variable Nitrification Rates Across Environmental Gradients in Turbid, Nutrient-Rich Estuary Waters of San Francisco Bay. Estuar. Coasts 39, 1050–1071. doi: 10.1007/s12237-016-0071-7
De La Torre, J. R., Walker, C. B., Ingalls, A. E., Könneke, M., and Stahl, D. A. (2008). Cultivation of a thermophilic ammonia oxidizing archaeon synthesizing crenarchaeol. Environ. Microbiol. 10, 810–818. doi: 10.1111/j.1462-2920.2007.01506.x
Frame, C. H., Lau, E., Joseph Nolan, E. IV, Goepfert, T. J., and Lehmann, M. F. (2017). Acidification Enhances Hybrid N2O Production Associated with Aquatic Ammonia-Oxidizing Microorganisms. Front. Microbiol. 7:104. doi: 10.3389/fmicb.2016.02104
Francis, C. A., Roberts, K. J., Beman, J. M., Santoro, A. E., and Oakley, B. B. (2005). Ubiquity and diversity of ammonia-oxidizing archaea in water columns and sediments of the ocean. Proc. Natl. Acad. Sci. U.S.A. 102, 14683–14688. doi: 10.1073/pnas.0506625102
Gantner, S., Andersson, A. F., Alonso-Sáez, L., and Bertilsson, S. (2011). Novel primers for 16S rRNA-based archaeal community analyses in environmental samples. J. Microbiol. Methods 84, 12–18. doi: 10.1016/j.mimet.2010.10.001
Han, A., Dai, M., Kao, S.-J., Gan, J., Li, Q., Wang, L., et al. (2012). Nutrient dynamics and biological consumption in a large continental shelf system under the influence of both a river plume and coastal upwelling. Limnol. Oceanogr. 57, 486–502. doi: 10.4319/lo.2012.57.2.0486
Harrison, P. J., Yin, K., Lee, J. H. W., Gan, J., and Liu, H. (2008). Physical–biological coupling in the Pearl River estuary. Continent. Shelf Res. 28, 1405–1415. doi: 10.1016/j.csr.2007.02.011
Hatzenpichler, R., Lebedeva, E. V., Spieck, E., Stoecker, K., Richter, A., Daims, H., et al. (2008). A moderately thermophilic ammonia-oxidizing crenarchaeote from a hot spring. Proc. Natl. Acad. Sci. U.S.A. 105, 2134–2139. doi: 10.1073/pnas.0708857105
He, B., Dai, M., Zhai, W., Guo, X., and Wang, L. (2014). Hypoxia in the upper reaches of the Pearl River Estuary and its maintenance mechanisms: A synthesis based on multiple year observations during 2000-2008. Mar. Chem. 167, 13–24. doi: 10.1016/jmarchem.2014.07.003
Holmes, A. J., Costello, A., Lidstrom, M. E., and Murrell, J. C. (1995). Evidence that particulate methane monooxygenase and ammonia monooxygenase may be evolutionarily related. FEMS Microbiol. Lett. 132, 203–208. doi: 10.1111/j.1574-6968.1995.tb07834.x
Holt, J. G., Krieg, N. R., Sneath, P. H. A., Staley, J. T., and Williams, S. T. (eds) (1994). Bergey’s manual of determinative bacteriology, 9th Edn. Maryland: Williams and Wilkins.
Hou, L., Xie, X., Wan, X., Kao, S. J., Jiao, N., and Zhang, Y. (2018). Niche differentiation of ammonia and nitrite oxidizers along a salinity gradient from the Pearl River estuary to the South China Sea. Biogeosciences 15, 5169–5187. doi: 10.5194/bg-2018-189
Hu, X. P., and Cai, W. J. (2011). An assessment of ocean margin anaerobic processes on oceanic alkalinity budget. Glob. Biogeochem. Cycles 25:GB3003. doi: 10.1029/2.10GB003859
Jin, T., Zhang, T., Ye, L., Lee, O. O., Wong, Y. H., and Qian, P. Y. (2011). Diversity and quantity of ammonia-oxidizing archaea and bacteria in sediment of the Pearl River Estuary. China. Appl. Microbiol. Biotechnol. 90, 1137–1145. doi: 10.1007/s00253-011-3107-8
Jung, M.-Y., Park, S.-J., Min, D., Kim, J.-S., Rijpstra, W. I. C., Sinninghe Damste’, J. S., et al. (2011). Enrichment and Characterization of an Autotrophic Ammonia-Oxidizing Archaeon of Mesophilic Crenarchaeal Group I.1a from an Agricultural Soil. Appl. Environ. Microbiol. 77, 8635–8647. doi: 10.1128/AEM.05787-11
Karner, M. B., DeLong, E. F., and Karl, D. M. (2001). Archaeal dominance in the mesopelagic zone of the Pacific Ocean. Nature 409, 507–510. doi: 10.1038/35054051
Kits, K. D., Sedlacek, C. J., Lebedeva, E. V., Han, P., Bulaev, A., Pjevac, P., et al. (2017). Kinetic analysis of a complete nitrifier reveals an oligotrophic lifestyle. Nature 549, 269–272. doi: 10.1038/nature23679
Könneke, M., Bernhard, A. E., de la Torre, J. R., Walker, C. B., Waterbury, J. B., and Stahl, D. A. (2005). Isolation of an autotrophic ammonia-oxidizing marine archaeon. Nature 437, 543–546. doi: 10.1038/nature03911
Kroeze, C., Dumont, E., and Seitzinger, S. (2010). Future trends in emissions of N2O from rivers and estuaries. J. Integr. Environ. Sci. 7, 71–78. doi: 10.1080/1943815X.2010.496789
Lam, P., Lavik, G., Jensen, M. M., van de Vossenberg, J., Schmid, M., Woebken, D., et al. (2009). Revising the nitrogen cycle in the Peruvian oxygen minimum zone. Proc. Natl. Acad. Sci. U.S.A. 106, 4752–4757. doi: 10.1073/pnas.0812444106
Lehtovirta-Morley, L. E., Stoecker, K., Vilcinskas, A., Prossera, J. I., and Nicol, G. W. (2011). Cultivation of an obligate acidophilic ammonia oxidizer from a nitrifying acid soil. Proc. Natl. Acad. Sci. U.S.A. 108, 15892–15897. doi: 10.1073/pnas.1107196108
Leininger, S., Urich, T., Schloter, M., Schwark, L., Qi, J., Nicol, G. W., et al. (2006). Archaea predominate among ammonia-oxidizing prokaryotes in Soils. Nature 442, 806–809. doi: 10.1038/nature04983
Lin, H., Dai, M., Kao, S.-J., Wang, L., Roberts, E., Yang, J.-Y. T., et al. (2016). Spatiotemporal variability of nitrous oxide in a large eutrophic estuarine system: The Pearl River Estuary, China. Mar. Chem. 182, 14–24. doi: 10.1016/j.marchem.2016.03.005
Löscher, C. R., Kock, A., Könneke, M., LaRoche, J., Bange, H. W., and Schmitz, R. A. (2012). Production of oceanic nitrous oxide by ammonia-oxidizing archaea. Biogeosciences 9, 2419–2429. doi: 10.5194/bg-9-2419-2012
Ma, L., Lin, H., Xie, X., Dai, M., and Zhang, Y. (2019). Major role of ammonia oxidizing bacteria in N2O production in the Pearl River estuary. Biogeosciences 16, 4765–4781. doi: 10.5194/bg-16-4765-2019
Magalhães, C., Bano, N., Wiebe, W. J., Bordalo, A. A., and Hollibaugh, J. T. (2008). Dynamics of nitrous oxide reductase genes (nosZ) in intertidal rocky biofilms and sediments of the Douro River Estuary (Portugal), and their relation to N-biogeochemistry. Microbial. Ecol. 55, 259–269. doi: 10.1007/s00248-007-9273-7
Martens-Habbena, W., Berube, P. M., Urakawa, H., de la Torre, J. R., and Stahl, D. A. (2009). Ammonia oxidation kinetics determine niche separation of nitrifying Archaea and Bacteria. Nature 461, 976–979. doi: 10.1038/nature08465
Mortazavi, B., Iverson, R. L., Huang, W., Graham Lewis, F., and Caffrey, J. M. (2000). Nitrogen budget of Apalachicola Bay, a bar-built estuary in the northeastern Gulf of Mexico. Mar. Ecol. Progr. Ser. 195, 1–14. doi: 10.3354/meps195001
Mosier, A. C., and Francis, C. A. (2008). Relative abundance and diversity of ammoniaoxidizing archaea and bacteria in the San Francisco Bay estuary. Environ. Microbiol. 10, 3002–3016. doi: 10.1111/j.1462-2920.2008.01764.x
Pai, S.-C., Tsau, Y.-J., and Yang, T.-I. (2001). pH and buffering capacity problems involved in the determination of ammonia in saline water using the indophenol blue spectrophotometric method. Analyt. Chim. Acta 434, 209–216. doi: 10.1016/S0003-2670(01)00851-0
Pike, N. (2011). Using false discovery rates for multiple comparisons in ecology and evolution. Methods Ecol. Evolut. 2, 278–282. doi: 10.1111/j.2041-210X.2010.00061.x
Qian, W., Gan, J., Liu, J., He, B., Lu, Z., Guo, X., et al. (2018). Current status of emerging hypoxia in a eutrophic estuary: The lower reach of the Pearl River Estuary, China. Estuarine 205, 58–67. doi: 10.1016/j.ecss.2018.03.004
Rotthauwe, J. H., Witzel, K. P., and Liesack, W. (1997). The ammonia monooxygenase structural gene amoA as a functional marker: Molecular fine-scale analysis of natural ammonia-oxidizing populations. Appl. Environ. Microbiol. 63, 4704–4712. doi: 10.1128/aem.63.12.4704-4712.1997
Sadyś, M., Strzelczak, A., Grinn-Gofroń, A., Kennedy, and Roy. (2014). Application of redundancy analysis for aerobiological data. Int. J. Biometeorol. 59, 25–36. doi: 10.1007/s00484-014-0818-4
Sahan, E., and Muyzer, G. (2008). Diversity and spatio-temporal distribution of ammoniaoxidizing archaea and bacteria in sediments of the Westerschelde estuary. FEMS Microbiol. Ecol. 64, 175–186. doi: 10.1111/j.1574-6941.2008.00462.x
Santoro, A. E., Buchwald, C., McIlvin, M. R., and Casciotti, K. L. (2011). Isotopic Signature of N2O Produced by Marine Ammonia-Oxidizing Archaea. Science 333, 1282–1285. doi: 10.1126/science.1208239
Santoro, A. E., Francis, C. A., de Sieyes, N. R., and Boehm, A. B. (2008). Shifts in the relative abundance of ammonia-oxidizing bacteria and archaea across physicochemical gradients in a subterranean estuary. Environ. Microbiol. 10, 1068–1079. doi: 10.1111/j.1462-2920.2007.01547.x
Seitzinger, S. P., and Kroeze, C. (1998). Global distribution of nitrous oxide production and N inputs in freshwater and coastal marine ecosystems. Global Biogeochem. Cycles 12, 93–113. doi: 10.1029/97GB03657
Stein, L. Y. (2011). Surveying N2O-Producing Pathways in Bacteria. Methods Enzymol. 486, 131–152. doi: 10.1016/B978-0-12-381294-0.00006-7
Su, J., Dai, M., He, B., Wang, L., Gan, J., Guo, X., et al. (2017). Tracing the origin of the oxygen-consuming organic matter in the hypoxic zone in a large eutrophic estuary: the lower reach of the Pearl River Estuary. China. Biogeosci. 14, 4085–4099. doi: 10.5194/bg-14-4085-2017
Sun, D., Tang, X., Zhao, M., Zhang, Z., Hou, L., Liu, M., et al. (2020). Distribution and diversity of comammox Nitrospira in coastal wetlands of China. Front. Microbiol. 11:589268. doi: 10.3389/fmicb.2020.589268
Sun, W., Xia, C., Xu, M., Guo, J., Sun, G., and Wang, A. (2014). Community structure and distribution of planktonic ammonia-oxidizing archaea and bacteria in the Dongjiang River. China. Res. Microbiol. 165, 657–670. doi: 10.1016/j.resmic.2014.08.003
Suzuki, M. T., Taylor, L. T., and DeLong, E. F. (2000). Quantitative Analysis of Small-Subunit rRNA Genes in Mixed Microbial Populations via 5’-Nuclease Assays. Appl. Environ. Microbiol. 66, 4605–4614. doi: 10.1128/AEM.66.11.4605-4614.2000
Tan, S., Cheung, S., Ho, T. Y., and Liu, H. B. (2019). Metatranscriptomics of the bacterial community in response to atmospheric deposition in the Western North Pacific Ocean. Mar. Genom. 45, 57–63. doi: 10.1016/j.margen.2019.01.008
Tourna, M., Stieglmeier, M., Spang, A., Könneke, M., Schintlmeister, A., Urich, T., et al. (2011). Nitrososphaera viennensis, an ammonia oxidizing archaeon from soil. Proc. Natl. Acad. Sci. U.S.A. 108, 8420–8425. doi: 10.2307/25830066
Usui, T., Koike, I., and Ogura, N. (2001). N2O production, nitrification and denitrification in an estuarine sediment. Estuarine 52, 769–781. doi: 10.1006/ecss.2000.0765
Ward, B. B. (2008). “Nitrification in marine systems,” in Nitrogen in the Marine Environment, 2nd Edn, eds D. G. Capone, D. A. Bronk, M. R. Mulholl, and E. J. Carpenter (Burlington: Academic Press), 199–261. doi: 10.1016/b978-0-12-372522-6.00005-0
Ward, B. B., Eveillard, D., Kirshtein, J. D., Nelson, J. D., Voytek, M. A., and Jackson, G. A. (2007). Ammonia-oxidizing bacterial community composition in estuarine and oceanic environments assessed using a functional gene microarray. Environ. Microbiol. 9, 2522–2538. doi: 10.1111/j.1462-2920.2007.01371.x
Wuchter, C., Abbas, B., Coolen, M. J. L., Herfort, L., van Bleijswijk, J., Timmers, P., et al. (2006). Archaeal nitrification in the ocean. Proc. Natl. Acad. Sci. U.S.A. 103, 12317–12322. doi: 10.1073/pnas.0600756103
Xia, X., Guo, W., and Liu, H. (2015). Dynamics of the bacterial and archaeal communities in the Northern South China Sea revealed by 454 pyrosequencing of the 16S rRNA gene. Top. Stud. Oceanogr. 117, 97–107. doi: 10.1016/j.dsr2.2015.05.016
Yu, C., Hou, L., Zheng, Y., Liu, M., Yin, G., Gao, J., et al. (2018). Evidence for complete nitrification in enrichment culture of tidal sediments and diversity analysis of clade a comammox Nitrospira in natural environments. Appl. Microbiol. Biotechnol. 102, 9363–9377. doi: 10.1007/s00253-018-9274-0
Zhang, Y., Qin, W., Hou, L., Zakem, E. J., Wan, X., Zhao, Z., et al. (2020). Nitrifier adaptation to low energy flux controls inventory of reduced nitrogen in the dark ocean. Proc. Natl. Acad. Sci. U.S.A. 117, 4823–4830. doi: 10.1073/pnas.1912367117
Zhang, Y., Xie, X., Jiao, N., Hsiao, S. S.-Y., and Kao, S.-J. (2014). Diversity and distribution of amoA-type nitrifying and nirS-type denitrifying microbial communities in the Yangtze River estuary. Biogeosciences 11, 2131–2145. doi: 10.5194/bg-11-2131-2014
Zhao, Y., Liu, J., Uthaipan, K., Song, X., Xu, Y., He, B., et al. (2020). Dynamics of inorganic carbon and pH in a large subtropical continental shelf system: Interaction between eutrophication, hypoxia, and ocean acidification. Limnol. Oceanogr. 65, 1359–1379. doi: 10.1002/lno.11393
Zheng, Z. Z., Zheng, L. W., Xu, M. N., Tan, E., Hutchins, D. A., Deng, W., et al. (2020). Substrate regulation leads to differential responses of microbial ammonia-oxidizing communities to ocean warming. Nat. Commun. 11:3511. doi: 10.1038/s41467-020-17366-3
Keywords: ammonia-oxidizing bacteria, ammonia-oxidizing archaea, size-fractionated particles, Pearl River estuary, environmental factors
Citation: Ma L, Tan S, Liu H, Kao S-J, Dai M and Yang J-YT (2021) Distribution and Activity of Ammonia-Oxidizers on the Size-Fractionated Particles in the Pearl River Estuary. Front. Mar. Sci. 8:685955. doi: 10.3389/fmars.2021.685955
Received: 26 March 2021; Accepted: 12 July 2021;
Published: 02 August 2021.
Edited by:
Arnaud Laurent, Dalhousie University, CanadaReviewed by:
Chris Sedlacek, University of Vienna, AustriaJiapeng Wu, Guangzhou University, China
Haitao Wang, Nankai University, China
Copyright © 2021 Ma, Tan, Liu, Kao, Dai and Yang. This is an open-access article distributed under the terms of the Creative Commons Attribution License (CC BY). The use, distribution or reproduction in other forums is permitted, provided the original author(s) and the copyright owner(s) are credited and that the original publication in this journal is cited, in accordance with accepted academic practice. No use, distribution or reproduction is permitted which does not comply with these terms.
*Correspondence: Jin-Yu Terence Yang, anl5YW5nQHhtdS5lZHUuY24=