 Timothy Hoellein
 Catherine Rovegno1
 Amy V. Uhrin
 Carlie Herring
- 1Depatment of Biology, Loyola University Chicago, Chicago, IL, United States
- 2NOAA Marine Debris Program, Silver Spring, MD, United States
- 3NOAA – National Centers for Coastal Ocean Science, Silver Spring, MD, United States
- 4I.M. Systems Group, Rockville, MD, United States
- 5Lynker Technologies, Leesburg, VA, United States
Invasive zebra and quagga mussels (Dreissena spp.) in the Great Lakes of North America are biomonitors for chemical contaminants, but are also exposed to microplastics (<5 mm). Little research has examined in situ microplastic ingestion by dreissenid mussels, or the relationship between microplastics and chemical contaminants. We measured microplastics and chemical contaminants in mussel tissue from Milwaukee Harbor (Lake Michigan, United States) harvested from reference locations and sites influenced by wastewater effluent and urban river discharge. Mussels were deployed in cages in the summer of 2018, retrieved after 30 and 60 days, sorted by size class, and analyzed for microplastics and body burdens of three classes of contaminants: alkylphenols, polyaromatic hydrocarbons, and petroleum biomarkers. Microplastics in mussels were higher in the largest mussels at the wastewater-adjacent site after 30 days deployment. However, there was no distinction among sites for microplastics in smaller mussels, and no differences among sites after 60 days of deployment. Microplastics and chemical contaminants in mussels were not correlated. Microplastics have a diversity of intrinsic and extrinsic factors which influence their ingestion, retention, and egestion by mussels, and which vary relative to chemicals. While dreissenid mussels may not serve as plastic pollution biomonitors like they can for chemical contaminants, microplastics in dreissenid mussels are widespread, variable, and have unknown effects on physiology, mussel-mediated ecosystem processes, and lake food webs. These data will inform our understanding of the spatial distribution of microplastics in urban freshwaters, the role of dreissenid mussels in plastic budgets, and models for the fate of plastic pollution.
Introduction
Bivalves such as clams, oysters, and mussels, are commonly used to measure chemical contaminants in the environment as they are sessile, considered relatively tolerant to toxic compounds, and abundant in aquatic ecosystems globally (Sericano et al., 1995; Farrington et al., 2016). The National Oceanic and Atmospheric Administration (NOAA) established the National Status and Trends Mussel Watch Program in the mid-1980s to monitor chemicals in US waters, as well as the health of aquaculture bivalves (Farrington et al., 2016). In 1992, invasive zebra and quagga mussels (Dreissena sp.) were added as biomonitors for chemical contaminants of emerging concern (Jaruga et al., 2017) as part of the Great Lakes Mussel Watch Program (North America).
The Mussel Watch Program assesses mussel tissue for basic metrics (e.g., moisture, lipid content), as well as concentration of contaminants of emerging concern including alkylphenols, polycyclic aromatic hydrocarbons (PAHs), and petroleum biomarkers. Alkylphenol ethoxylates are synthetic compounds often used to make surfactants (e.g., detergents), and can biotransform into toxic, estrogenic, and lipophilic compounds (Ahel et al., 1994), including 4-non-ylphenol (4-NP) and 4-octylphenol (4-OP), found in wastewater treatment plant (WWTP) effluent and biosolids (Hale et al., 2000; La Guardia et al., 2001). PAHs are a wide category of materials, designated as “parent” (i.e., no alkyl side chains) or alkylated forms, with 16 types listed as contaminants of concern by the United States Environmental Protection Agency. Finally, petroleum biomarkers (i.e., hopanoids, steranes, and triaromatic steroids; TAS) are assessed in mussel tissue to investigate the source and fate of petroleum hydrocarbons in the environment given their resistance to degradation (Wang and Stout, 2010). These classes of contaminants may co-occur with plastic contamination in aquatic organisms, but this has not yet been examined in mussel tissues for freshwater bivalves.
Microplastics (i.e., particles <5 mm) are a contaminant of emerging concern in ecosystems worldwide (Bucci et al., 2020). Once ingested, biological effects of microplastics include behavioral and physiological responses such as changes to filtration dynamics, impairment of reproductive health, and expression of stress hormones (Rochman, 2015; Foley et al., 2018; Zhang et al., 2020). Alternatively, some microplastics may pass through organisms with limited interaction (Foley et al., 2018). Plastic pollution can leach embedded chemicals and adsorb hydrophobic compounds from aquatic ecosystems (Teuten et al., 2009). For example, given the high surface area and hydrophobic character of some microplastics, PAHs may adsorb to microplastics in the environment, then desorb following ingestion (i.e., the “Trojan Horse” effect) (Krause et al., 2020; Zhang et al., 2020; Sun et al., 2021). Mostly studied in marine ecosystems, the sources, movement, and impacts of microplastics in freshwaters continues to emerge (Windsor et al., 2019a; Bucci et al., 2020; Hoellein and Rochman, 2021).
Research on the abundance and physiological effects of microplastic consumption by marine bivalves is rapidly developing. Results show that microplastics are ubiquitous in bivalves at a global scale, but are highly variable among species, individuals, locations, and time periods (Phuong et al., 2018; Covernton et al., 2019; Li et al., 2019; Zhang et al., 2020). Laboratory-based assessments of microplastics filtration by bivalves also reveal high variation in patterns of ingestion relative to rejection (i.e., pseudofeces production) according to taxon, particle size, and particle shape (Li et al., 2019; Ward et al., 2019b). Thus, while microplastics ingestion by bivalves is variable, bivalves are widely exposed to microplastics, and the long-term consequences on physiology, population dynamics, and ecosystem processes are not yet well known (Zhang et al., 2020).
The relationship between microplastics and bivalves is most often studied in aquaculture and fishery species such as Mytilus edulis (blue mussels) and Crassostrea virginica (eastern oysters) (Bråte et al., 2018; Li et al., 2019; Ward et al., 2019a), while bivalves in freshwaters are less commonly studied (Berglund et al., 2019; Pastorino et al., 2021). Bivalves in freshwater ecosystems can dominate invertebrate biomass, with major impacts on ecosystem processes including water filtration and nutrient cycling (Vaughn and Hoellein, 2018), so examining their interaction with microplastics merits attention (Wardlaw and Prosser, 2020). For example, Dreissena sp. are widespread invasive species which change food webs, water clarity, biogeochemistry, and invertebrate biomass (Karatayev et al., 2002; Li et al., 2021). Microplastic concentrations in the Great Lakes are similar to or higher than levels in oceans (Eriksen et al., 2013), and dreissenids ingest microplastics in the laboratory (Magni et al., 2018; Pedersen et al., 2020). No studies have examined spatial and temporal patterns of microplastics in dreissenids in the Great Lakes.
The goal of this study was to measure microplastics in dreissenid mussels at sites that vary in potential sources of microplastics in the Milwaukee River and near shore Lake Michigan in Milwaukee, WI, United States. Given their role as “sentinels” of chemical pollution in NOAA’s Great Lakes Mussel Watch Program, an important inference from this study was to consider if dreissenid mussels were valuable for monitoring microplastics in the Great Lakes. We aimed to compare abundance of microplastics with chemical contaminants in dreissenid mussels. We predicted microplastics would be found in mussels at all sites, with higher abundance in the largest mussels and in the water column near potential microplastic sources. We expected more microplastics in mussels after 60 days deployment (August) compared to 30 days (July). In addition, we predicted chemical contaminants would be positively correlated with microplastics in mussel tissue. These data are needed to predict exposures to both classes of contaminants and to inform models for the fate and impacts of pollution in the Great Lakes.
Materials and Methods
Study sites were distributed throughout Milwaukee Harbor, WI, United States. From June 11–13, 2018, researchers collected “reference” (ref) mussels from four sites in Lake Michigan: sites Ref-0, Ref-1, Ref-4, and Ref-5 (Figure 1 and Table 1). Reference site selection was based on past measurements of mussel contaminant load, and site numbers were assigned during a separate, long-term monitoring program (Kimbrough et al., 2018). Ref-0, Ref-1, and Ref-4 are each within the harbor breakwalls (Figure 1) and support mussels with measurable levels of a broad suite of legacy and emerging chemicals. Ref-5 is outside the harbor breakwalls (Figure 1), where mussels have lower chemical contaminants compared to the other sites (Kimbrough et al., 2018).
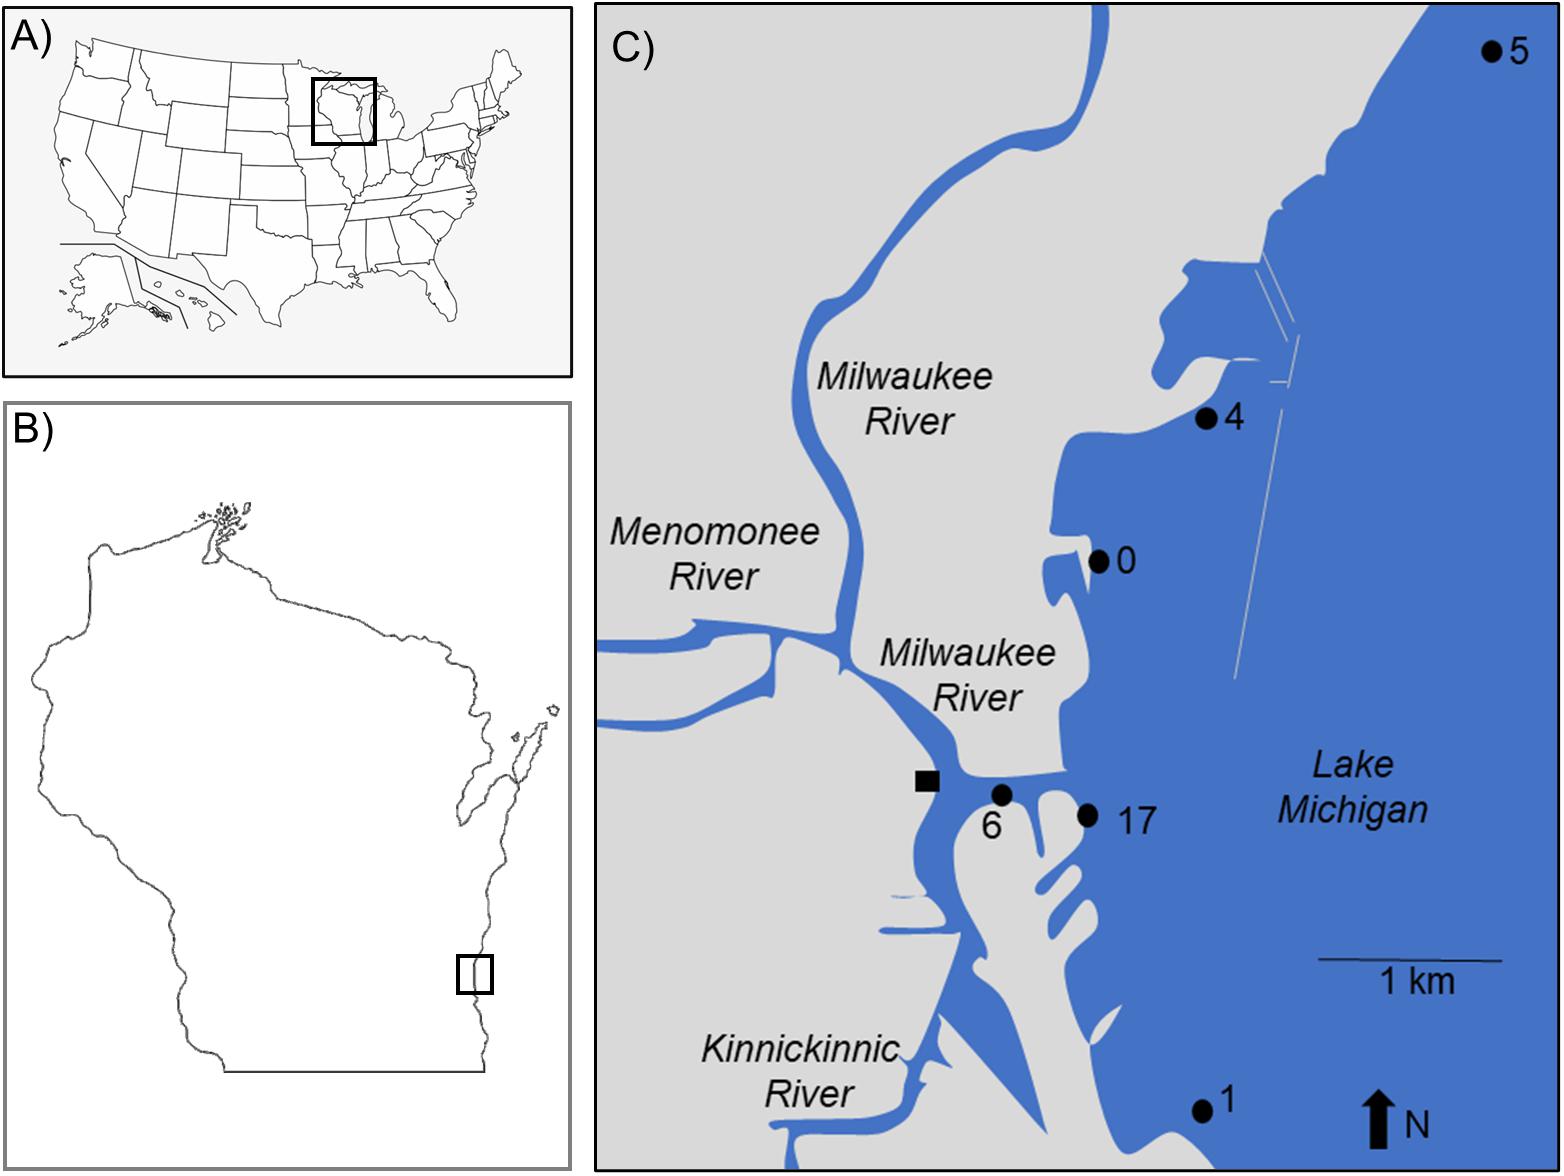
Figure 1. The study sites are locations in (A) the United States of America, (B) State of Wisconsin, and (C) city of Milwaukee. Sites 0–5 are Great Lakes Mussel Watch reference locations. Site 6 is at the confluence of the Milwaukee and Kinnickinnic Rivers. Site 17 is at the outfall of the Jones Island Water Reclamation (i.e., wastewater treatment) Plant. The square at the confluence of the Milwaukee and Kinnickinnic Rivers is the sampling site for fish in McNeish et al. (2018).
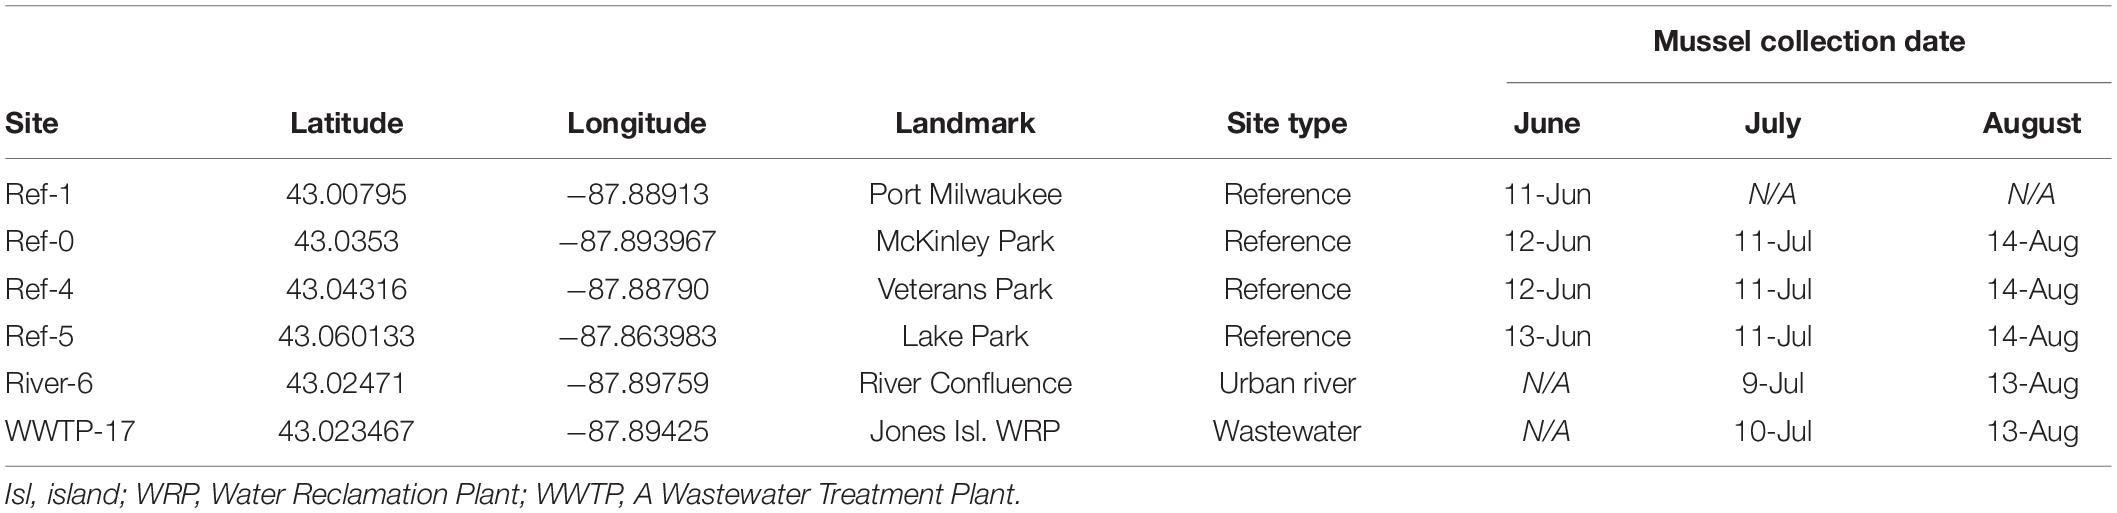
Table 1. Mussel collection locations and 2018 sampling dates.
Divers collected mussel druses from Ref-0, Ref-1, Ref-4, and Ref-5 using stainless steel scrapers. Mussels were brought onto a boat, placed into coolers with aerated lake water, and returned to shore. Approximately 4 L of mussels were collected (goal: 2–3,000 individuals) for measuring chemicals and microplastics in tissues. In June, additional mussels were collected from reference sites for deployment at two experimental sites: the confluence of the Milwaukee River branches (River-6) and the outfall of the Jones Island Water Reclamation Facility (hereafter, wastewater treatment plant; WWTP-17; Figure 1). The experimental sites are near potential contamination sources for microplastics and chemical contaminants (McCormick et al., 2016). Mussels deployed at River-6 originated from Ref-4, and mussels deployed at WWTP-17 were from Ref-5 (Table 1). At each of the two experimental sites, mussels were relocated in four, galvanized steel mesh minnow torpedo traps (i.e., cages; https://Frabrill.com, MD) (Kazour and Amara, 2020), closed with plastic zip ties, and anchored to the sea wall using metal chains. The water depth at River-6 was 7.6 m, and the cages were deployed at a depth of 7 m. At WWTP-17, the WWTP outflow pipe was situated 3–4 m below the water surface and the lake depth was 10 m. The mussels were deployed at 6.5 m depth, approximately 3 m below the outfall and 3 m from the sea wall. Mussel collection occurred at Ref-1 in June, but it was not visited in July or August.
Mussels deployed in June 2018 were collected in July and August 2018 at five sites: Ref-0, Ref-4, Ref-5, River-6, and WWTP-17 (Figure 1 and Table 1). On each date, two cages were removed from each site. Mussels were immediately placed into coolers (Model 35, Yeti, Inc., Austin, TX, United States) with aerated lake water and returned to shore to be frozen, stored, and processed. The transport time from collection to shore was 0.5–1 h. Onshore, half of the mussels (enough to fill a ∼3.75 L zip-top polypropylene bag), were immediately placed in coolers with CO2 ice for later microplastics processing. The remainder of the mussels were sorted and preserved for analysis of chemical contaminants. Mussels were alive during transit from collection sites to the laboratory. This Mussel Watch Program protocol was observed so that data were collected identically to past years. To account for any microplastic depuration during transit we collected three samples of cooler water using pre-cleaned 500 ml bottles (high density polyethylene, Fisher Scientific, Pittsburgh, PA, United States). Pre-cleaning consisted of acid-washing and thorough rinsing with deionized (DI) water that was filtered (0.363 mm mesh in the laboratory) (Miller et al., 2017; McNeish et al., 2018). The “cooler water” samples were refrigerated until processing of microplastics in the laboratory.
Surface water was collected at each site on each date for later processing for microplastics. Water was collected directly in 1 L bottles (N = 3 bottles per site, high density polyethylene, Fisher Scientific, Pittsburgh, PA, United States) that were pre-cleaned as described above. In the field, bottles were uncapped, rinsed three times with lake water, and filled while completely submerged to avoid atmospheric contamination with microplastics. Samples were placed in a cooler with ice packs and returned to the laboratory for later processing.
Mussel Processing for Microplastics and Tissue Mass
Frozen mussels from each site and date (N = 14) required separation of individuals. We cut the byssal threads from the frozen druse with a razor blade while working on an enamel laboratory pan. Mussels, razors, and pans were cleaned with filtered DI water between samples. We removed organic matter (e.g., shell fragments, algae) from each mussel shell, and discarded mussels with broken or open shells. We measured the length of each intact mussel shell to the nearest 0.1 mm with digital calipers (Fisher Scientific), and immediately placed each into a covered foil container by size class: >25.0 mm, 20.1–25.0 mm, 15.1–20.0 mm, 10.1–15.0 mm, and 5.0–10.0 mm (Supplementary Table 1). Classes were delineated based on the size range collected. Mussels were out of the freezer <1 h at a time. Sorted mussels were frozen (−20 C) until processing.
We selected 20 individuals from each size class per date and site for analysis of microplastics. If a size class contained <20 mussels, all were processed. This occurred only once: the 5.0–10.0 mm mussels from July at River-6 (N = 7). We removed the soft tissue with a razor blade and placed it into a 400 mL beaker. The razor, beaker, and enamel pan were cleaned and rinsed with filtered DI water before and after processing each mussel. We set up 22–24 beakers per round of digestion, where each beaker contained soft tissue from one mussel, and 2–4 beakers were controls. Control beakers received the same procedures and reagents as the mussels but contained no mussel tissue. The only protocol edit was for the smallest mussels (5.0–10.0 mm). Due to low mass, we selected five individuals, gently broke the shells to facilitate digestion, and placed all five together (tissue + broken shells) in a beaker. All remaining steps in the digestion protocol was the same as other mussel size classes.
We used wet peroxide oxidation to digest mussel tissue, which removes organic matter without affecting most microplastics (Lusher et al., 2017; Munno et al., 2018). We added 20 mL of 30% H2O2 and 20 mL of an iron sulfate catalyst (0.05 M Fe(II)) to each beaker, covered the beaker with foil, and allowed the solution to digest for at least 18 h at room temperature (20oC). We considered the digestion complete when a yellow color in the solution was observed and no visible tissue pieces remained. Next, we added 20 mL 30% of H2O2 to ensure full digestion and so that all samples contained a uniform amount of peroxide. If visible tissue remnants were noted after 18 h (i.e., the largest mussels), beakers were placed on a shaker table (50 rotations/min for 18 h) to facilitate digestion of tissue. Solutions from each beaker were vacuum filtered (0.45 μm pore size gridded filters; Whatman mixed cellulose nitrate, GE Healthcare, Germany). Each filter was placed into an aluminum dish, covered with foil, and dried at 30°C in a drying oven for four to 24 h for later quantification of microplastics.
Water Sample Processing
We had two types of water samples to process for microplastics: surface water and “cooler water” (i.e., water from coolers after transit from collection site to lab). Surface water samples were filtered directly onto gridded filters, with no digestion or sieving (McNeish et al., 2018). Controls consisted of DI water placed in the same sample bottles (high density polyethylene, Fisher Scientific, Pittsburgh, PA, United States) and processed in identical fashion as the lake water samples. All filters were covered and dried as described above. Cooler water samples were turbid and required additional processing. First, the sample was transferred to a clean glass beaker, covered with foil, and placed in a drying oven at 50°C for at least 7 days for evaporation. Each beaker was subjected to peroxide oxidation, and the samples were filtered, dried, and stored as described for mussel tissue above. Controls consisted of empty glass beakers which we processed simultaneously with the cooler water samples.
Counting and Characterizing Microplastics
Microplastics on all filters were visually identified with a dissecting microscope (25–30×; 0.1–5 mm) (Model ASZ30L3, Bausch & Lomb, United States). We reported shape (fragment, fiber, and sphere) and color. Each sample was assessed by two researchers. If counts did not agree, a third assessment was completed and the two most similar values used. Colors were recorded either as a single color, or those particles which were clear and a single color (i.e., clear + blue) were reported as the color (e.g., blue) and particles >2 colors were considered “multi-colored.”
We selected a sub-sample of suspected microplastic particles for polymer identification that spanned the study sites, mussel size classes, water samples, and laboratory controls. Only samples from July, which had the highest number of microplastics, were selected for polymer identification. We did not include the smallest mussels (5–10 mm) as very few microplastics were found. Each of the remaining four mussel size classes from each site contained 20 filters (N = 80 filters per site for July). To generate our subsample, we chose five filters from each mussel size class at each site using a random number generator (N = 20 filters total per site). All microplastics were removed from each filter for chemical analysis. If the filter did not contain microplastics, we randomly selected another filter from the group. We then randomly selected three control filters for each site for polymer identification. Surface water samples had three filters in July, so all microplastics were selected. Finally, we randomly selected “cooler water” samples from July for polymer analysis. We selected one filter per site (N = 5), along with three additional, randomly selected filters. Color was not a factor in selection, as we randomly selected filters, and removed all particles from each. We found 1,314 total particles (across all sample types and after lab contamination correction), with successful polymer identification for 213 particles (16.2%): 13.3% of particles in mussels (N = 121), 20.6% of particles from mussel controls (N = 59), 43.8% of lake water particles (N = 21), 100% of lake water control particles (N = 4), and 12.7% of cooler water particles (N = 8).
The protocol for preparation of microplastics for μFT-IR identification was adapted from Barrows et al. (2018). We first covered a glass microscope slide in aluminum foil, and carefully cleaned the foil using filtered DI water. Under the dissecting microscope, we moved a single microplastic particle from the filter to the slide using forceps. We used a probe to draw a circle around the particle by gently indenting the foil. The particle was covered by a glass coverslip and taped at the edges. The slides were sent to MicroVision Laboratories, Inc. (Chelmsford, MA, United States) for analysis. Particle identification was completed using a Bruker LUMOS FT-IR in reflectance mode. The LUMOS spectral acquisition range (wavenumber) was 4,000 to 600 cm–1, conducts 32 scans at a spectral resolution of 4 cm–1 with a VCSEL laser (wavelength = 850 nm) (Barrows et al., 2018). Spectrum results were compared to a Bruker reference library and known standards with a target match between environmental samples and standards at 60–80%. Any deviation occurred in reflection mode, where peak matching was also assessed by judgment of experienced analysts and optical microscopy (to confirm natural versus synthetic cellulose; H. Knowles, personal communication).
Minimizing and Accounting for Contamination
Throughout the analysis we instituted efforts to minimize microplastic contamination. Lab benches were cleaned at least one time per day with filtered DI water. Instruments that encountered mussel tissue were rinsed with filtered DI water before and after use. All researchers wore yellow polypropylene-coated fabric smocks (Kleenguard A70, Fisher Scientific, Pittsburgh, PA, United States) throughout processing to standardize and detect potential contamination from clothing as yellow microplastics were not previously detected from the Milwaukee River (McNeish et al., 2018). Samples, filtration devices, and microscopes were covered as much as possible. Fibers were the only type of contamination found. We detected no yellow fibers or fragments in controls, suggesting that the used smocks were effective. We corrected particle counts using the control appropriate for each sample type: mussel tissue, surface water, and cooler water. We subtracted fibers detected in the control sample from any fibers detected in the environmental samples in that batch, using fiber color in the process (Grbiæ et al., 2020). Color matching worked in many cases, but was not always possible, as the contaminant color did not always match the sample color. In that case, we categorized the contaminant fiber as “color” or “clear” for subtraction. The mean fiber correction value was 2.5 fibers/filter for mussels. For surface water samples, the value was 0.8 fibers/filter, and for cooler water it was 0.4 fibers/filter. We rounded up controls to the nearest integer when subtracting to maintain conservative estimates (McNeish et al., 2018).
Mussel Mass and Condition Index
We generated length-mass conversions using the “excess” mussels (Supplementary Table 1). For each site and date, we selected three mussels from each of the five size classes (N = 15 mussels). The shell was measured for length and the soft tissue removed and placed into individual pre-weighed and pre-ashed aluminum weighing pans (Fisherbrand, Pittsburgh, PA, United States). We measured mussel wet weight then dried the pans at 50°C for ≥3 days. Pans were placed in a desiccator for 1 h, and dry mass was recorded (accounting for pan mass). We covered pans with foil and placed them in a muffle furnace (650–126 Isotemp, Fisher Scientific, Waltham, MA, United States) at 550°C for 3 h, stored them in a desiccator overnight, and then ash weight was recorded to calculate tissue ash-free dry mass (AFDM). We generated linear and exponential length-mass regressions. We used the regression with the best R2 value to estimate mass for all mussels digested for microplastics at each site and date. We calculated mussel condition index as dry mass/length (Mann, 1978).
Chemical Contaminants in Mussels
Mussel tissue chemistry data was generated according to Mussel Watch Program protocols. Analytes included tissue metrics (moisture, lipid content), as well as two alkylphenol stable biotransformation products [4-non-ylphenol (4-NP) and 4-octylphenol (4-OP)], PAHs (16 parent, 65 alkylated), and 10 petroleum biomarkers. These compounds were included here as they are chemicals of interest for the Mussel Watch program and may co-occur with microplastics in mussel tissues in urban environments. The mussels sorted for chemical contaminant analyses were double-bagged separately in ∼3.75 L zip-top polypropylene bag, stored on ice, and shipped by overnight courier within 2 days of collection. For alkylphenols, mussel tissues were analyzed by SGS AXYS Analytical Services Ltd. (Sidney, BC, Canada) (Klosterhaus et al., 2013), and for PAHs and petroleum biomarkers by TDI-Brooks International, Inc. (College Station, TX, United States) (Kimbrough et al., 2007). Contaminants from mussels were measured for each study site and date except Ref-0, Ref-5, and WWTP-17 in August.
Data Analysis
We first considered patterns in microplastic abundance and mussel condition index among size classes and sites for each month (June, July, and August). We expressed microplastic abundance in four ways: No./individual, No./g wet weight, No./g dry mass, and No./g AFDM, as each offers a different perspective into contaminant concentration and comparisons to literature values. We used Kruskal–Wallis (K–W) tests for comparisons, as the datasets were a mixture of normal and non-normal Gaussian distributions, and non-parametric analysis allows for conservative assessments of patterns (McNeish et al., 2018; Phuong et al., 2018). Next, we compared microplastic abundance across the three sampling times, for each size class at each site using a K–W test. Significant K–W tests were followed by the Conover-Inman test for multiple comparisons. We conducted the temporal comparisons separate from the spatial comparison because the sampling was not balanced over time (Ref-1 was only assessed in June, and River-6 and WWTP-17 were only assessed in July and August). We compared the surface and cooler water samples across sites and dates using a K-W test. A simple linear regression was used to compare the surface water and cooler water microplastic concentrations. We used simple linear regression to compare the mean microplastic abundance (as No./individual and No./g dry mass) relative to chemical concentrations (alkylphenols: ng/g wet weight, PAHs and petroleum biomarkers: ng/g dry mass) by site and date. We used the Shapiro-Wilk test to assess assumption of normal distribution of residuals prior to conducting regression.
Results
Microplastics in Mussels: Comparison Among Sites and Size Classes
We first compared microplastics in mussels among sites and size classes. In June, mussels were harvested from Ref-0, Ref-1, Ref-4, and Ref-5. When expressed as No./individual, mussels from Ref-5 had fewer microplastics than Ref-1 and Ref-0 (K–W test, p = 0.009; Figure 2A). There was no difference among sites in June when microplastic was quantified as No./g wet weight, dry mass, or AFDM (Figure 3A and Supplementary Figures 1A, 2A). In July, microplastics in mussels was significantly higher at WWTP-17 for every metric of microplastic abundance (K-W test, <0.001; Figures 2B, 3B and Supplementary Figures 1B, 2B). In August, there were no significant differences in microplastic abundance among sites (Figures 2C, 3C and Supplementary Figures 1C, 2C).
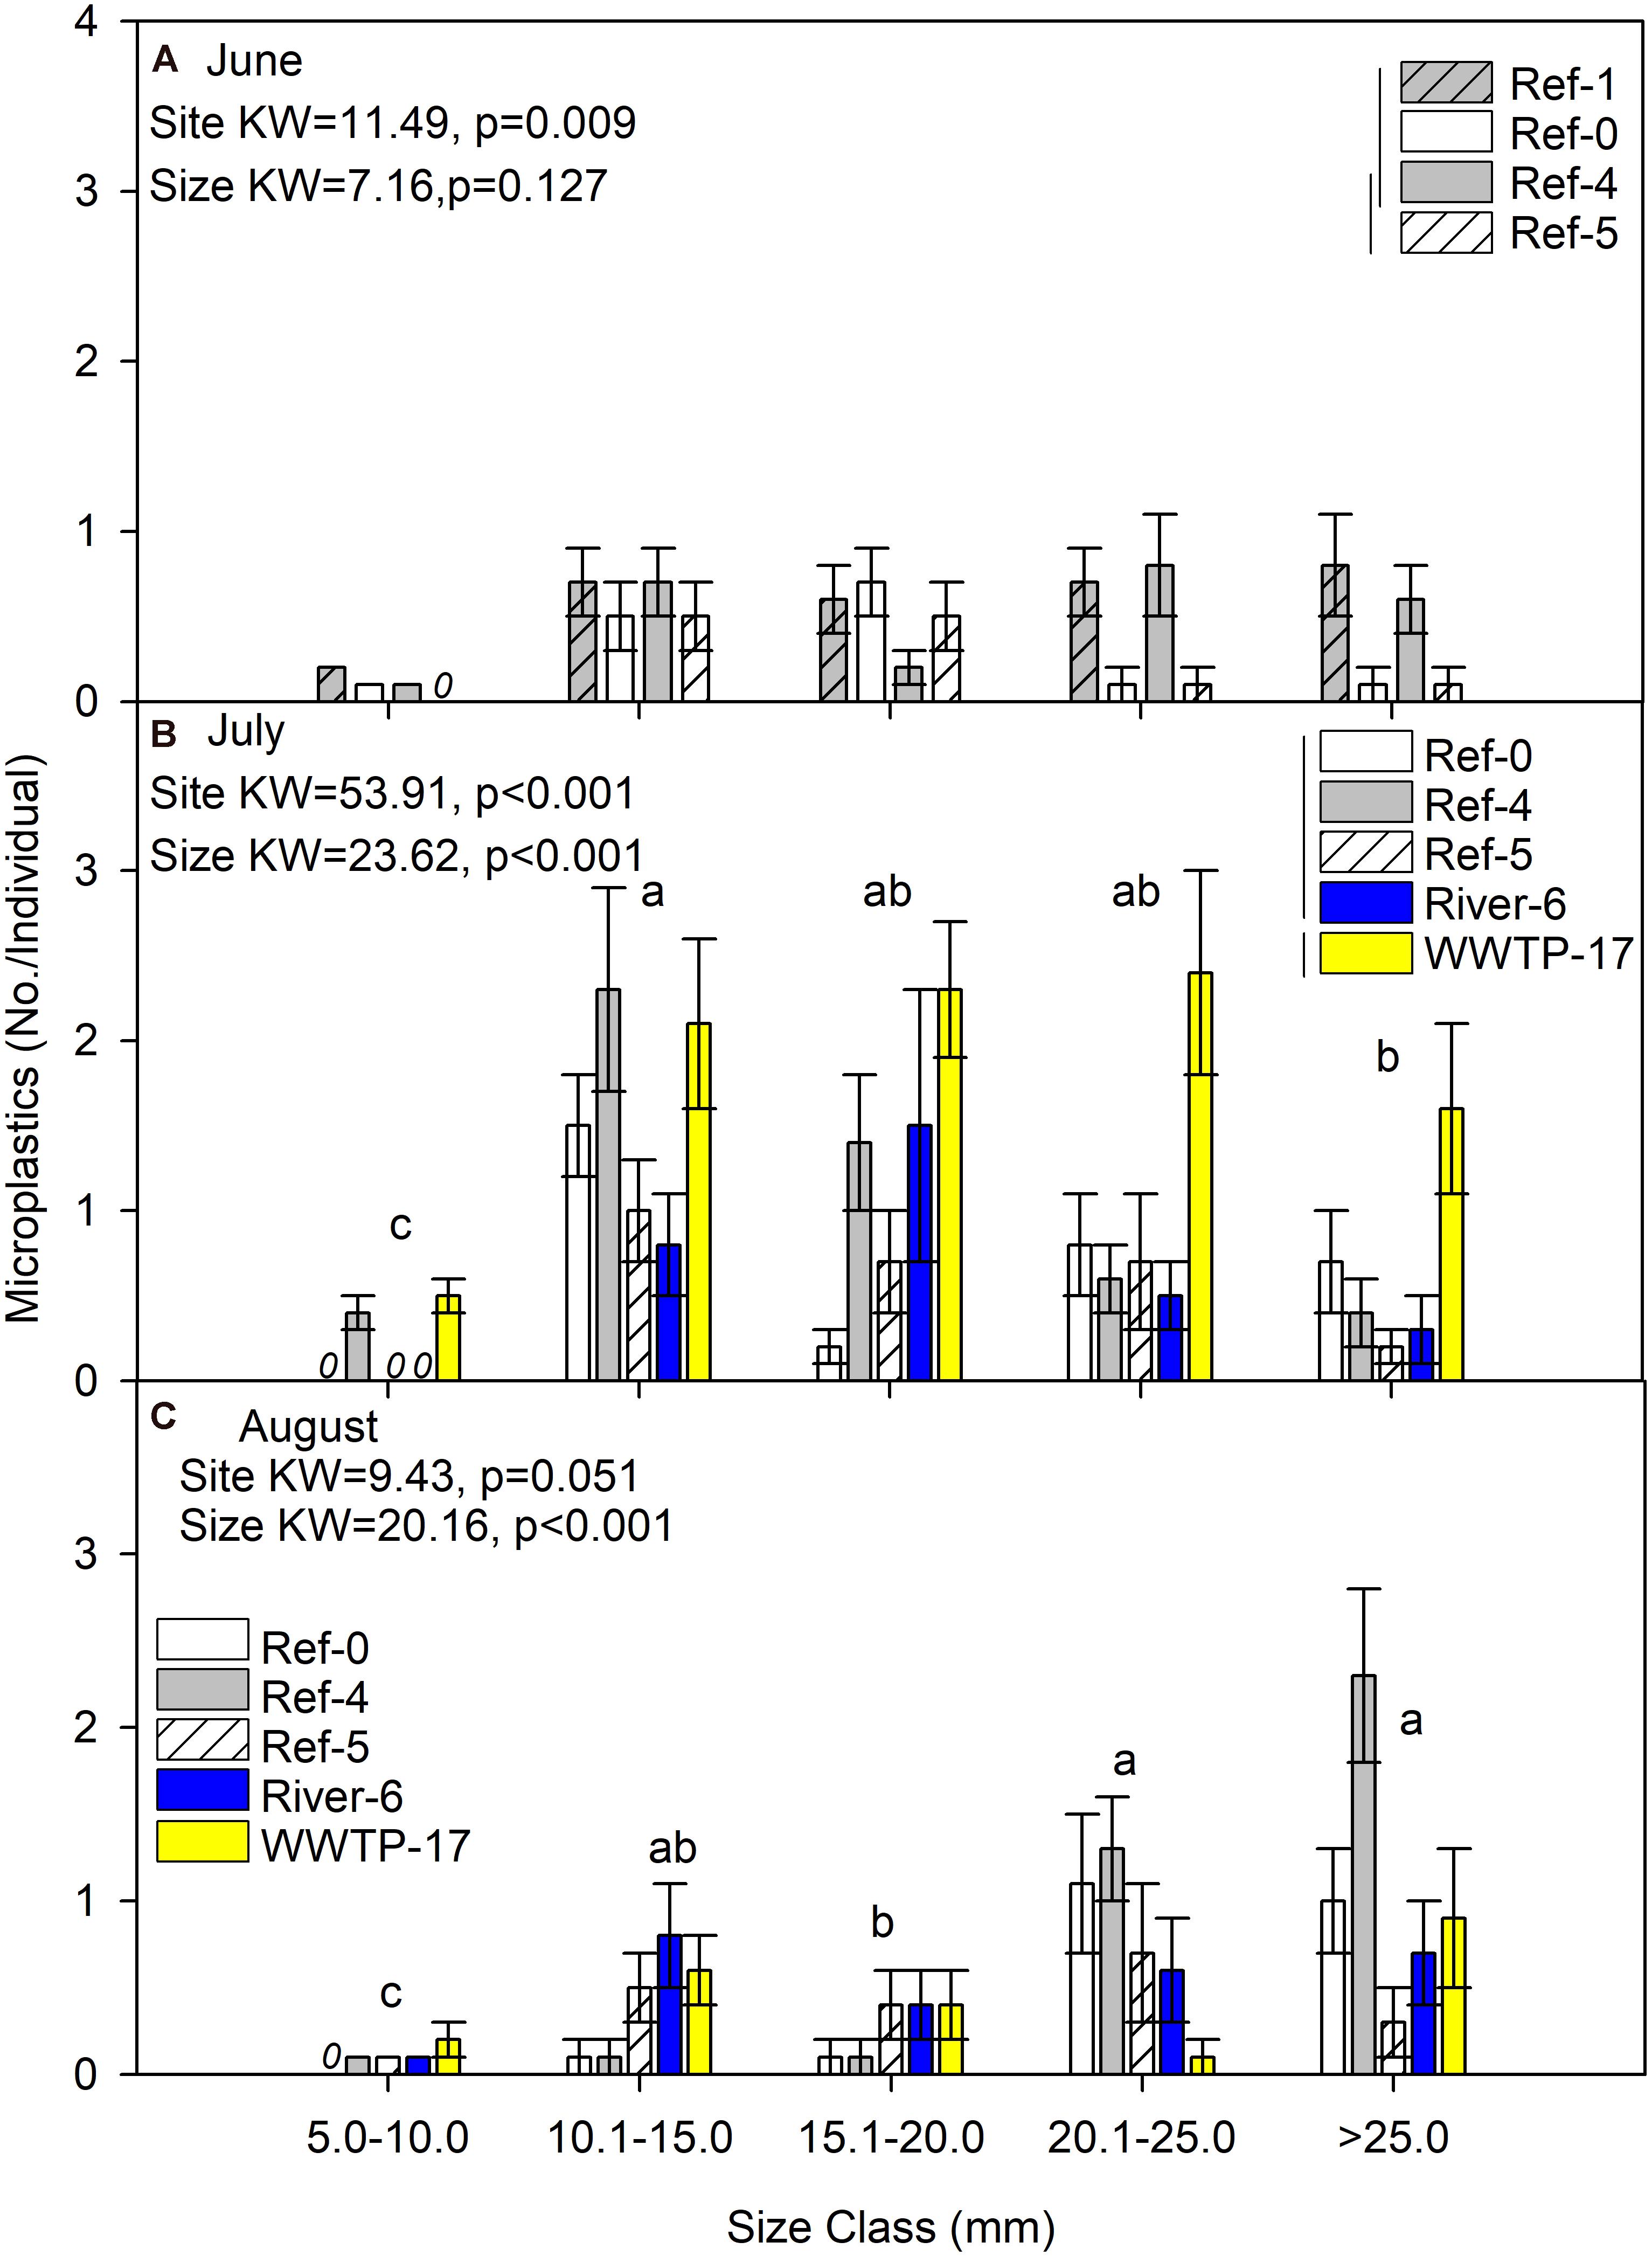
Figure 2. Mean (±SE) microplastic abundance (No./individual) in dreissenid mussels from Milwaukee Harbor in (A) June, (B) July, and (C) August 2018. Kruskal–Wallis (K–W) test results are shown in each panel, where degrees of freedom (df) for size class = 4 in all panels, and df for site = 3 in panel (A) and df = 4 in panels (B,C). In each panel, means with the same lowercase letter are not significantly different among size classes following post hoc comparisons (p ≤ 0.05). Overlapping vertical lines next to the site legend are not significantly different after post hoc comparisons (p ≤ 0.05). Ref, reference; WWTP, wastewater treatment plant.
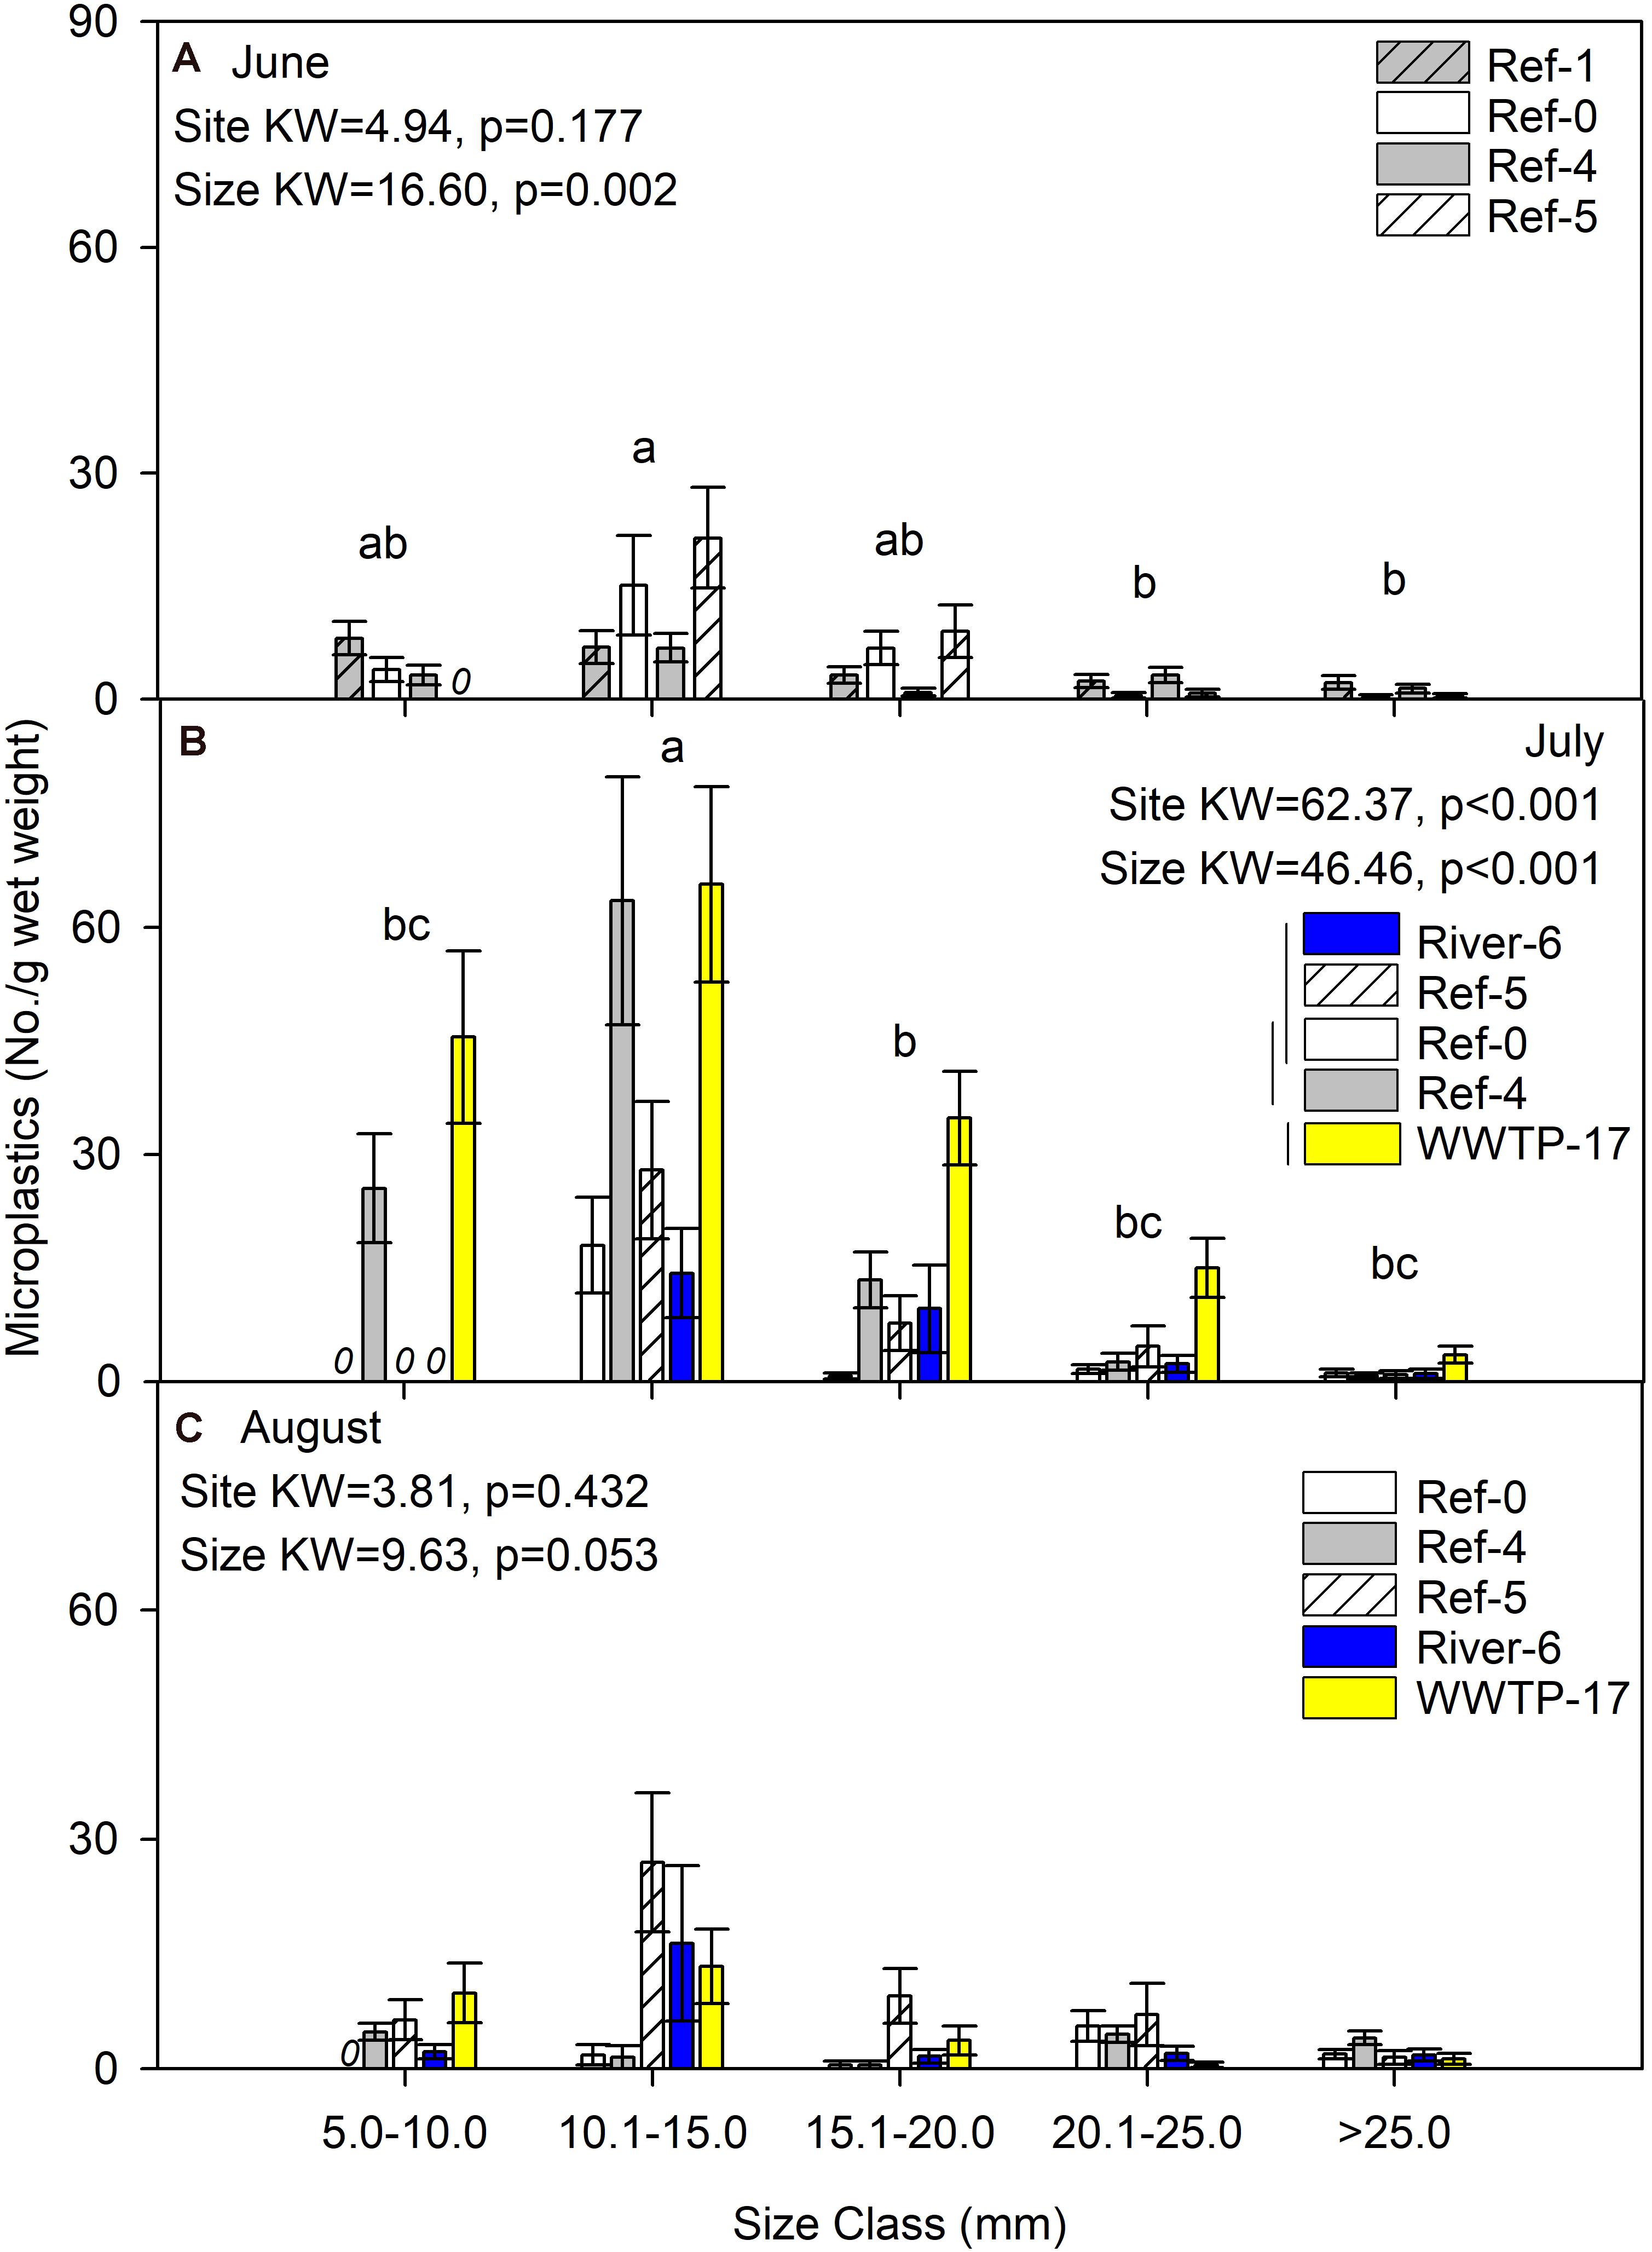
Figure 3. Mean (±SE) microplastic concentration (No./g wet weight) in dreissenid mussels from Milwaukee Harbor in (A) June, (B) July, and (C) August 2018. K–W test results are shown in each panel, where df for size class = 4 in all panels, and df for site = 3 in panel (A) and df = 4 in panels (B,C). In each panel, means with the same lowercase letter are not significantly different among size classes after post hoc comparisons (p ≤ 0.05). Overlapping vertical lines next to the site legend are not significantly different after post hoc comparisons (p ≤ 0.05). Ref, reference; WWTP, wastewater treatment plant.
Differences in microplastics in mussels across size classes varied according to how microplastics were measured: as No./individual or No./mass. In June, microplastic concentration expressed by mussel mass (No./g wet weight, No./g DM, and No./gAFDM) was significantly different among sizes, with highest values in the 10–15 mm mussels (K-W test, p = 0.002, 0.001, and 0.001, respectively; Figure 3A and Supplementary Figures 1A, 2A). In contrast, there was no difference among size classes in June when microplastics were expressed as No./individual (K-W test, p = 0.127; Figure 2A). In July, the highest number of particles relative to mussel mass was also in the 10–15 mm mussels (K-W test, p < 0.001; Figure 3B and Supplementary Figures 1B, 2B). When microplastics were expressed as No./individual in July, the highest values were in the 10–15 mm mussels (Figure 2B). In August, the only significant difference among mussel size classes occurred when expressed as No./individual, which was lowest in the smaller mussels and highest in mussels >20 mm (K-W test, p < 0.001; Figure 2C).
Mussel Condition Index
Mussel condition index was significantly different among sites and size classes each month (K-W test p < 0.001; Figure 4). Across every site and each month, the condition index increased with mussel size. Site Ref-5 always had a lower condition index than the other sites (Figure 4). The highest values for condition index were at Ref-1, Ref-0, and Ref-4.
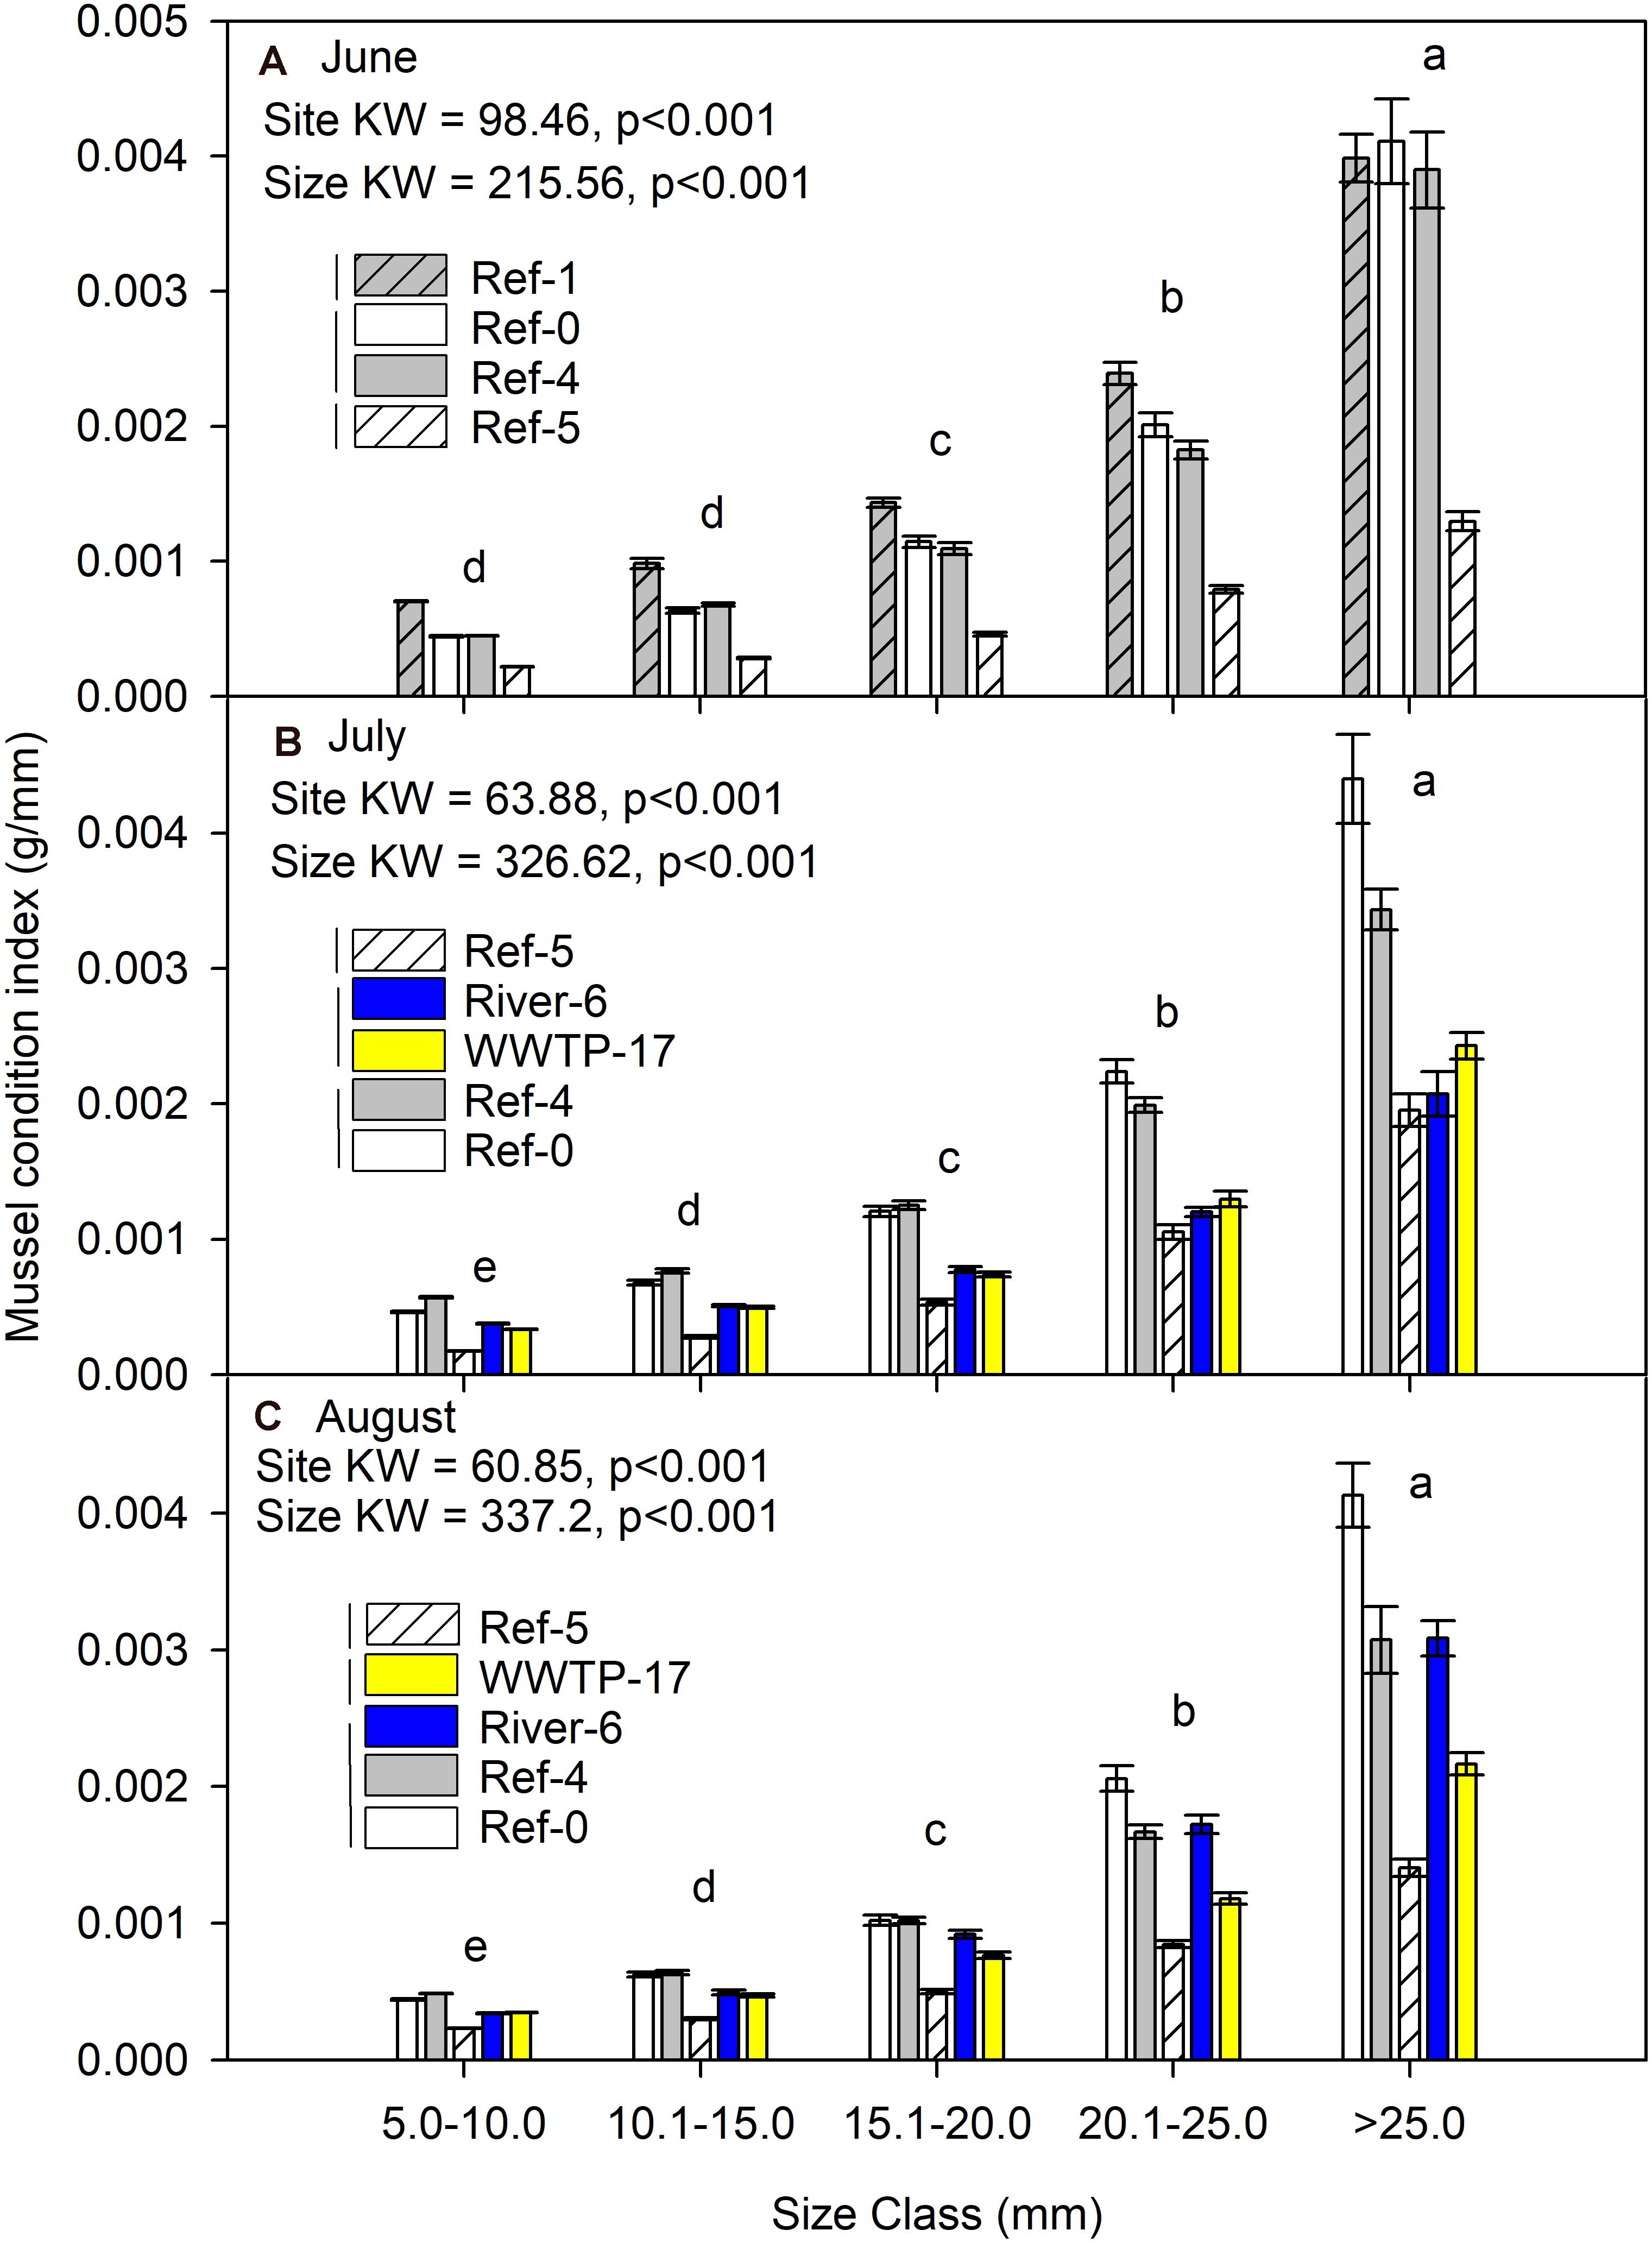
Figure 4. Mean (±SE) condition index (dry mass/length) for in dreissenid mussels from Milwaukee Harbor in (A) June, (B) July, and (C) August 2018. K–W test results are shown in each panel, where df for size class = 4 in all panels, and df for site = 3 in panel (A) and df = 4 in panels (B,C). In each panel, means with the same lowercase letter are not significantly different among sizes using post hoc comparisons (p ≤ 0.05). Overlapping vertical lines next to the site legend are not significantly different after post hoc comparisons (p ≤ 0.05). Ref, reference; WWTP, wastewater treatment plant.
Microplastics in Mussels: Comparison Among Dates
We compared microplastic in mussels over time by examining the patterns for each size class and site individually (Supplementary Figures 3, 4 and Supplementary Tables 2, 3). No mussels were collected at River-6 or WWTP-17 in June, thus only July and August were compared for those sites. As No./individual, microplastics showed highly variable temporal patterns by site and size class (Supplementary Figure 3 and Supplementary Table 2). For the smallest mussels (5–10 mm), each site showed a different temporal pattern, but overall microplastic abundance in this size class was low (Supplementary Figure 3E). For the other size classes, we found no temporal differences at Ref-5 or River-6, but significant differences among dates for Ref-0, Ref-4, and WWTP-17 (Supplementary Figures 3A–D and Supplementary Table 2). The temporal patterns were inconsistent between (and in some cases, within) these three sites. For example, at Ref-0, microplastics were highest in August for the >25 mm mussels, but highest in June for 15.1–20 mm mussels (Supplementary Figures 3A,C). This pattern was repeated when microplastics were quantified as No./g wet weight (Supplementary Figure 4 and Supplementary Table 3). Finally, condition index showed significant differences among dates for almost all size classes and sites, and temporal patterns were highly variable (Supplementary Figure 5 and Supplementary Table 4).
Microplastics in Surface Water and Cooler Water
We compared microplastic concentrations in surface and in cooler water. For the surface water, we found a significant difference among sites and dates (K-W test, p = 0.029), where several measurements were zero, while Ref-5 in June and Ref-4 and Ref-5 in August were the highest (Figure 5A). Patterns for cooler water concentrations were different among sites (K-W test, p = 0.001) where Ref-4 in August and Ref-5 in July had the highest concentrations (Figure 5B). The range of microplastic concentrations in surface water and cooler water was similar (Figure 5), but there was no relationship between the measurements (log + 1 transformation; R2 = 0.002, p = 0.882; Supplementary Figure 6).
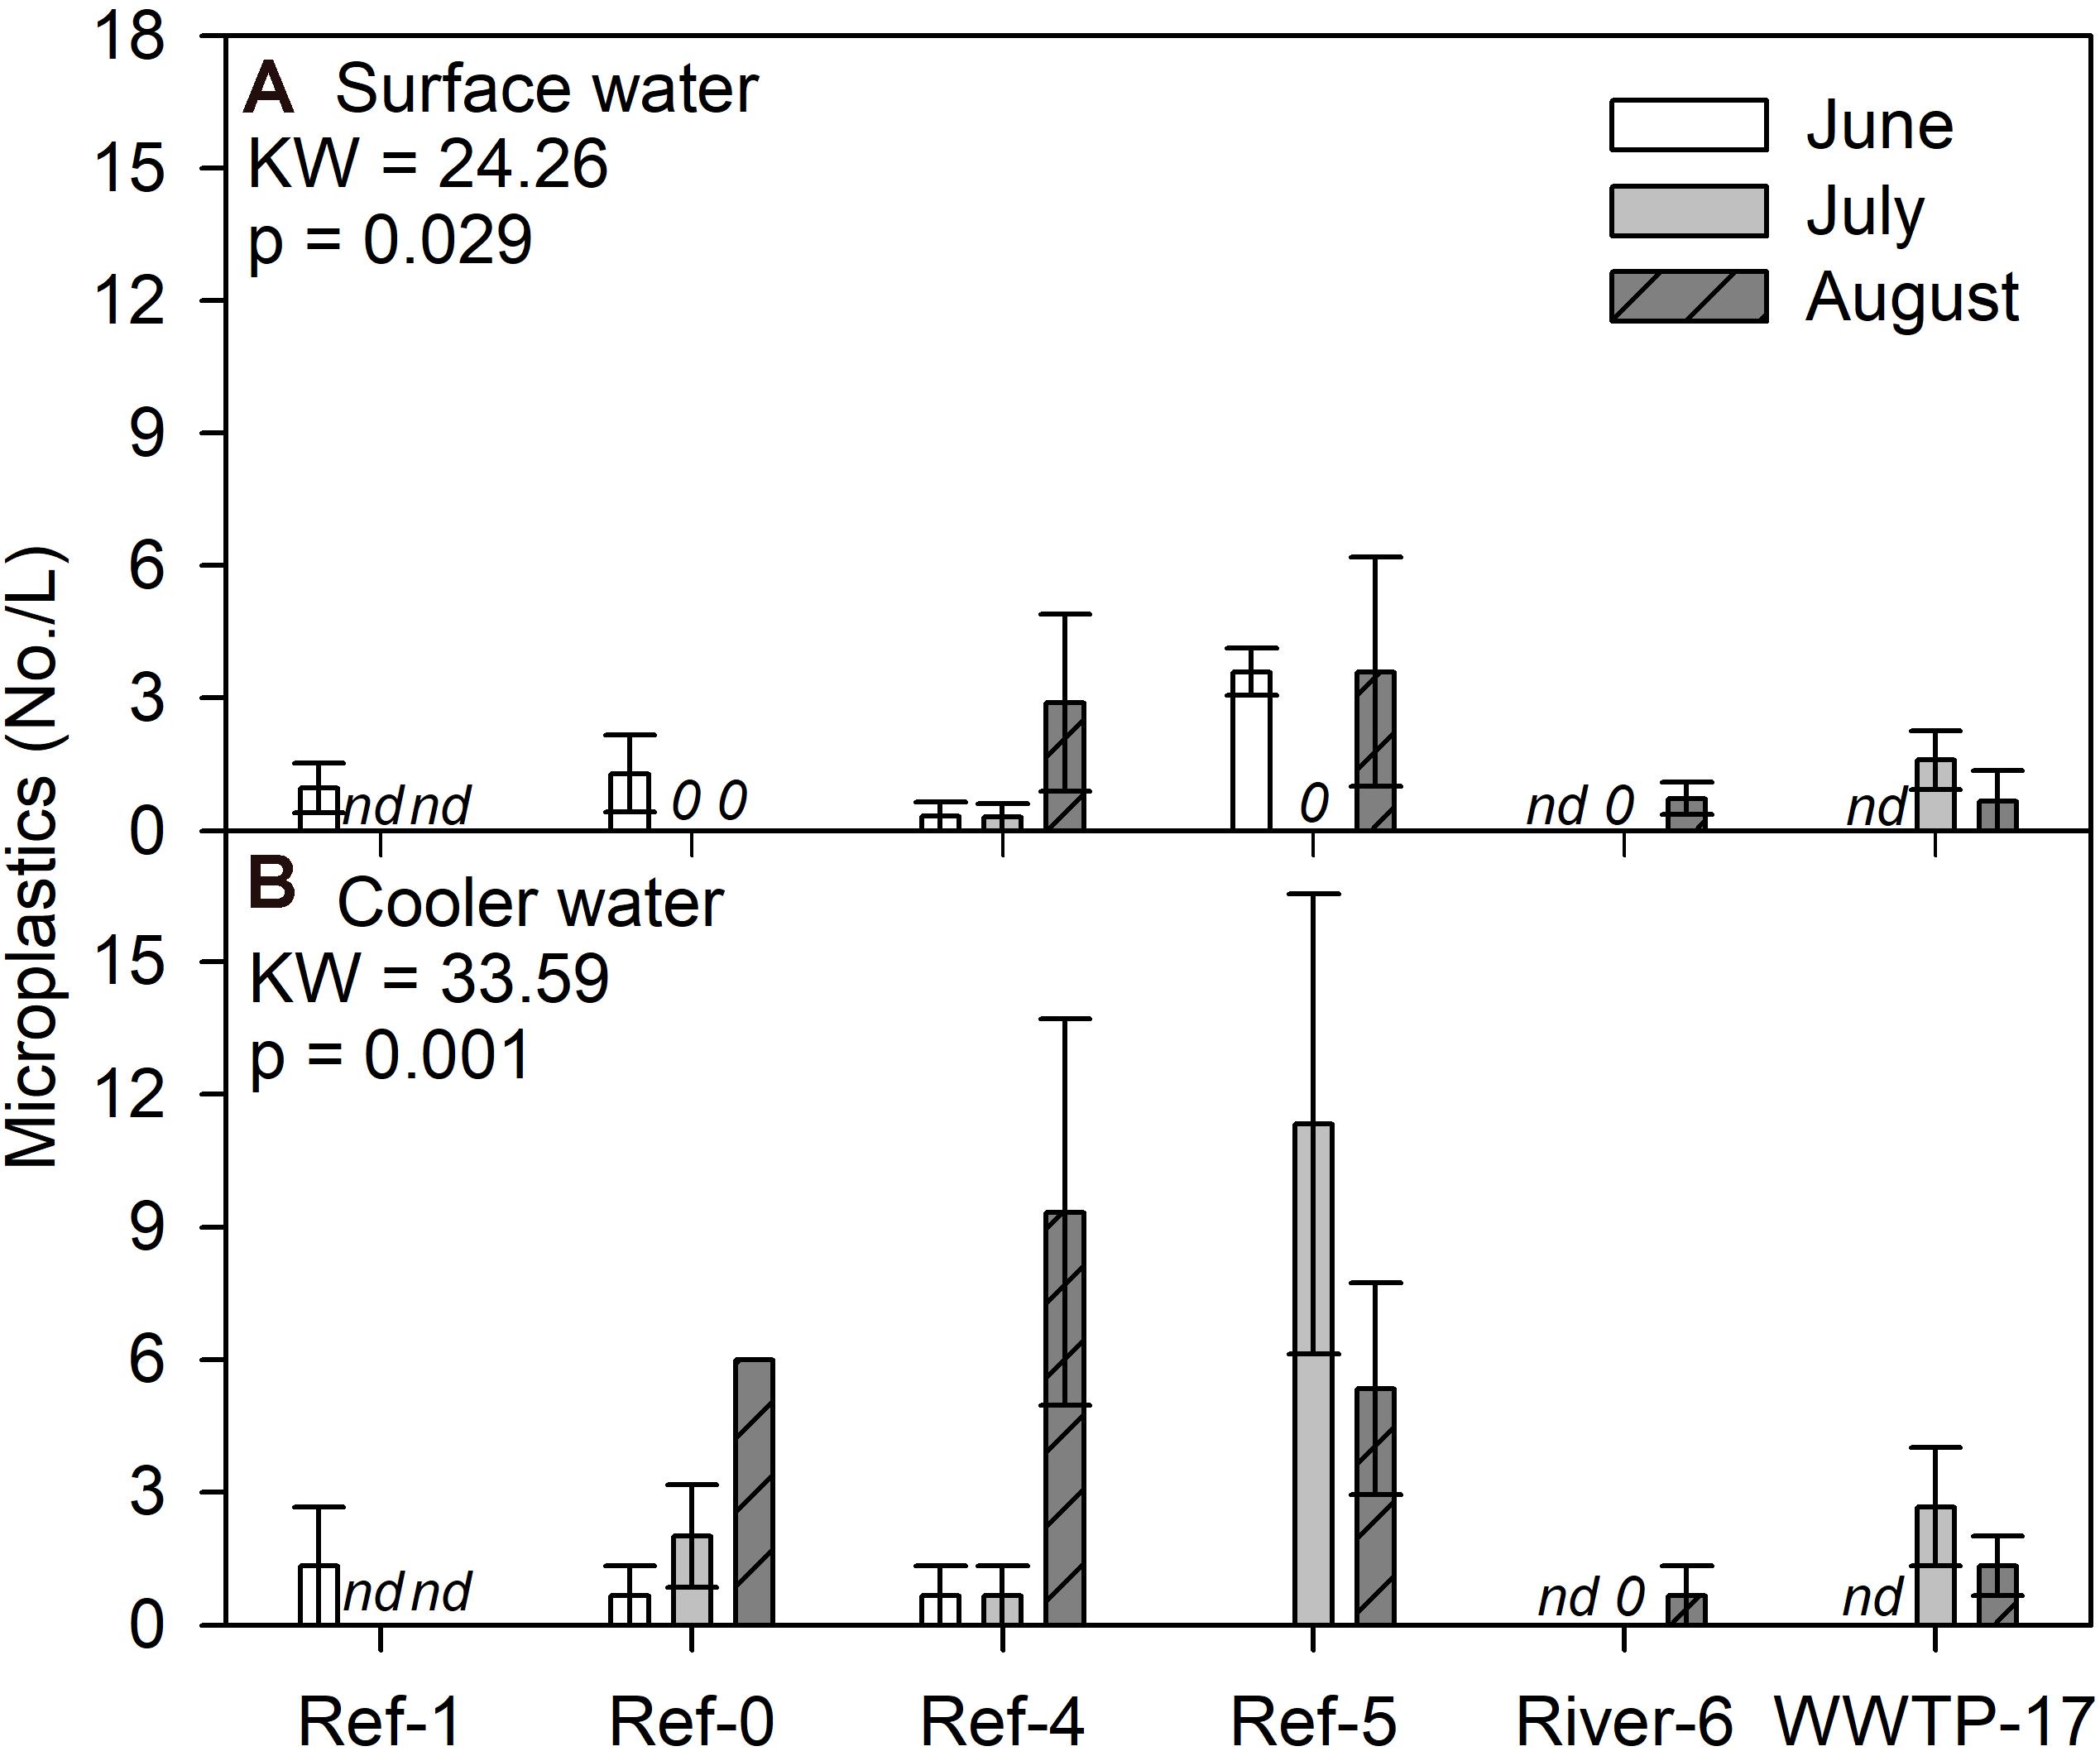
Figure 5. Mean (±SE) microplastic particle concentrations in (A) surface and (B) cooler water from Milwaukee Harbor in summer 2018. K–W test results are shown in each panel, and degrees of freedom = 13. Sites 0–5 are reference (Ref) locations, River-6 is at river confluence, and WWTP-17 is the wastewater treatment plant (WWTP) outfall. nd, no data.
Microplastic Characteristics: Shapes, Color, Material Type
We categorized all microplastic particles by shape to compare among sites and size classes. For mussels, fibers were most abundant (<70%), followed by fragments, whereas spheres were rare (Supplementary Figure 7). We found only fibers in the smallest mussels at all sites (Supplementary Figure 7). The control samples were almost entirely fibers (98%; Supplementary Figure 7). Surface and cooler water samples showed similar patterns, where fibers dominated the assemblage. For surface water, we found fragments only at River-6 (urban river) in August (Supplementary Figure 8A). For cooler water, we found fragments in August at Ref-0, Ref-4, and Ref-5, and in July at Ref-5 (Supplementary Figure 8B).
We compared microplastic color among sites, mussels, and water samples. The most common colors for mussels were clear (34%), blue (28%), black (14%), gray (12%), and red (8%; Supplementary Figure 9). Ref-1 and Ref-0 had more blue particles than other sites, while WWTP-17 had less blue and more clear than other sites. The control samples had a greater abundance of clear than environmental samples (52%; Supplementary Figure 9). In contrast, surface water had few clear particles, and was dominated by blue, red, black, and gray (Supplementary Figure 10A). Colors in cooler water more closely matched patterns in mussels than the surface water, with more clear items than the surface water (Supplementary Figure 10B).
We analyzed a subset of microplastic particles to determine chemical composition. Detected material types included natural (i.e., wool, cotton, cellulose-based), semi-synthetic (i.e., cotton-processed, cellulose-processed, and rayon), and synthetic (i.e., polyester, nylon, and acrylonitrile) (Figure 6). In mussels, there was no pattern in material type among size classes or sites as each was a mixture of natural (range = 59–100%), semi-synthetic (range = 19–50%), and synthetic (range = 22–60%) (Figure 6). Surface water also showed a mixture of material types. River-6 and WWTP-17 were the only sites in which we detected synthetic materials in surface water, and each had the greatest number of material types (Figure 7A). Water from coolers showed less variation in material types than surface water. All materials found in cooler water were of natural origin except at Ref-5, in which we found processed cotton and cellulose (i.e., semi-synthetic materials; Figure 7B).
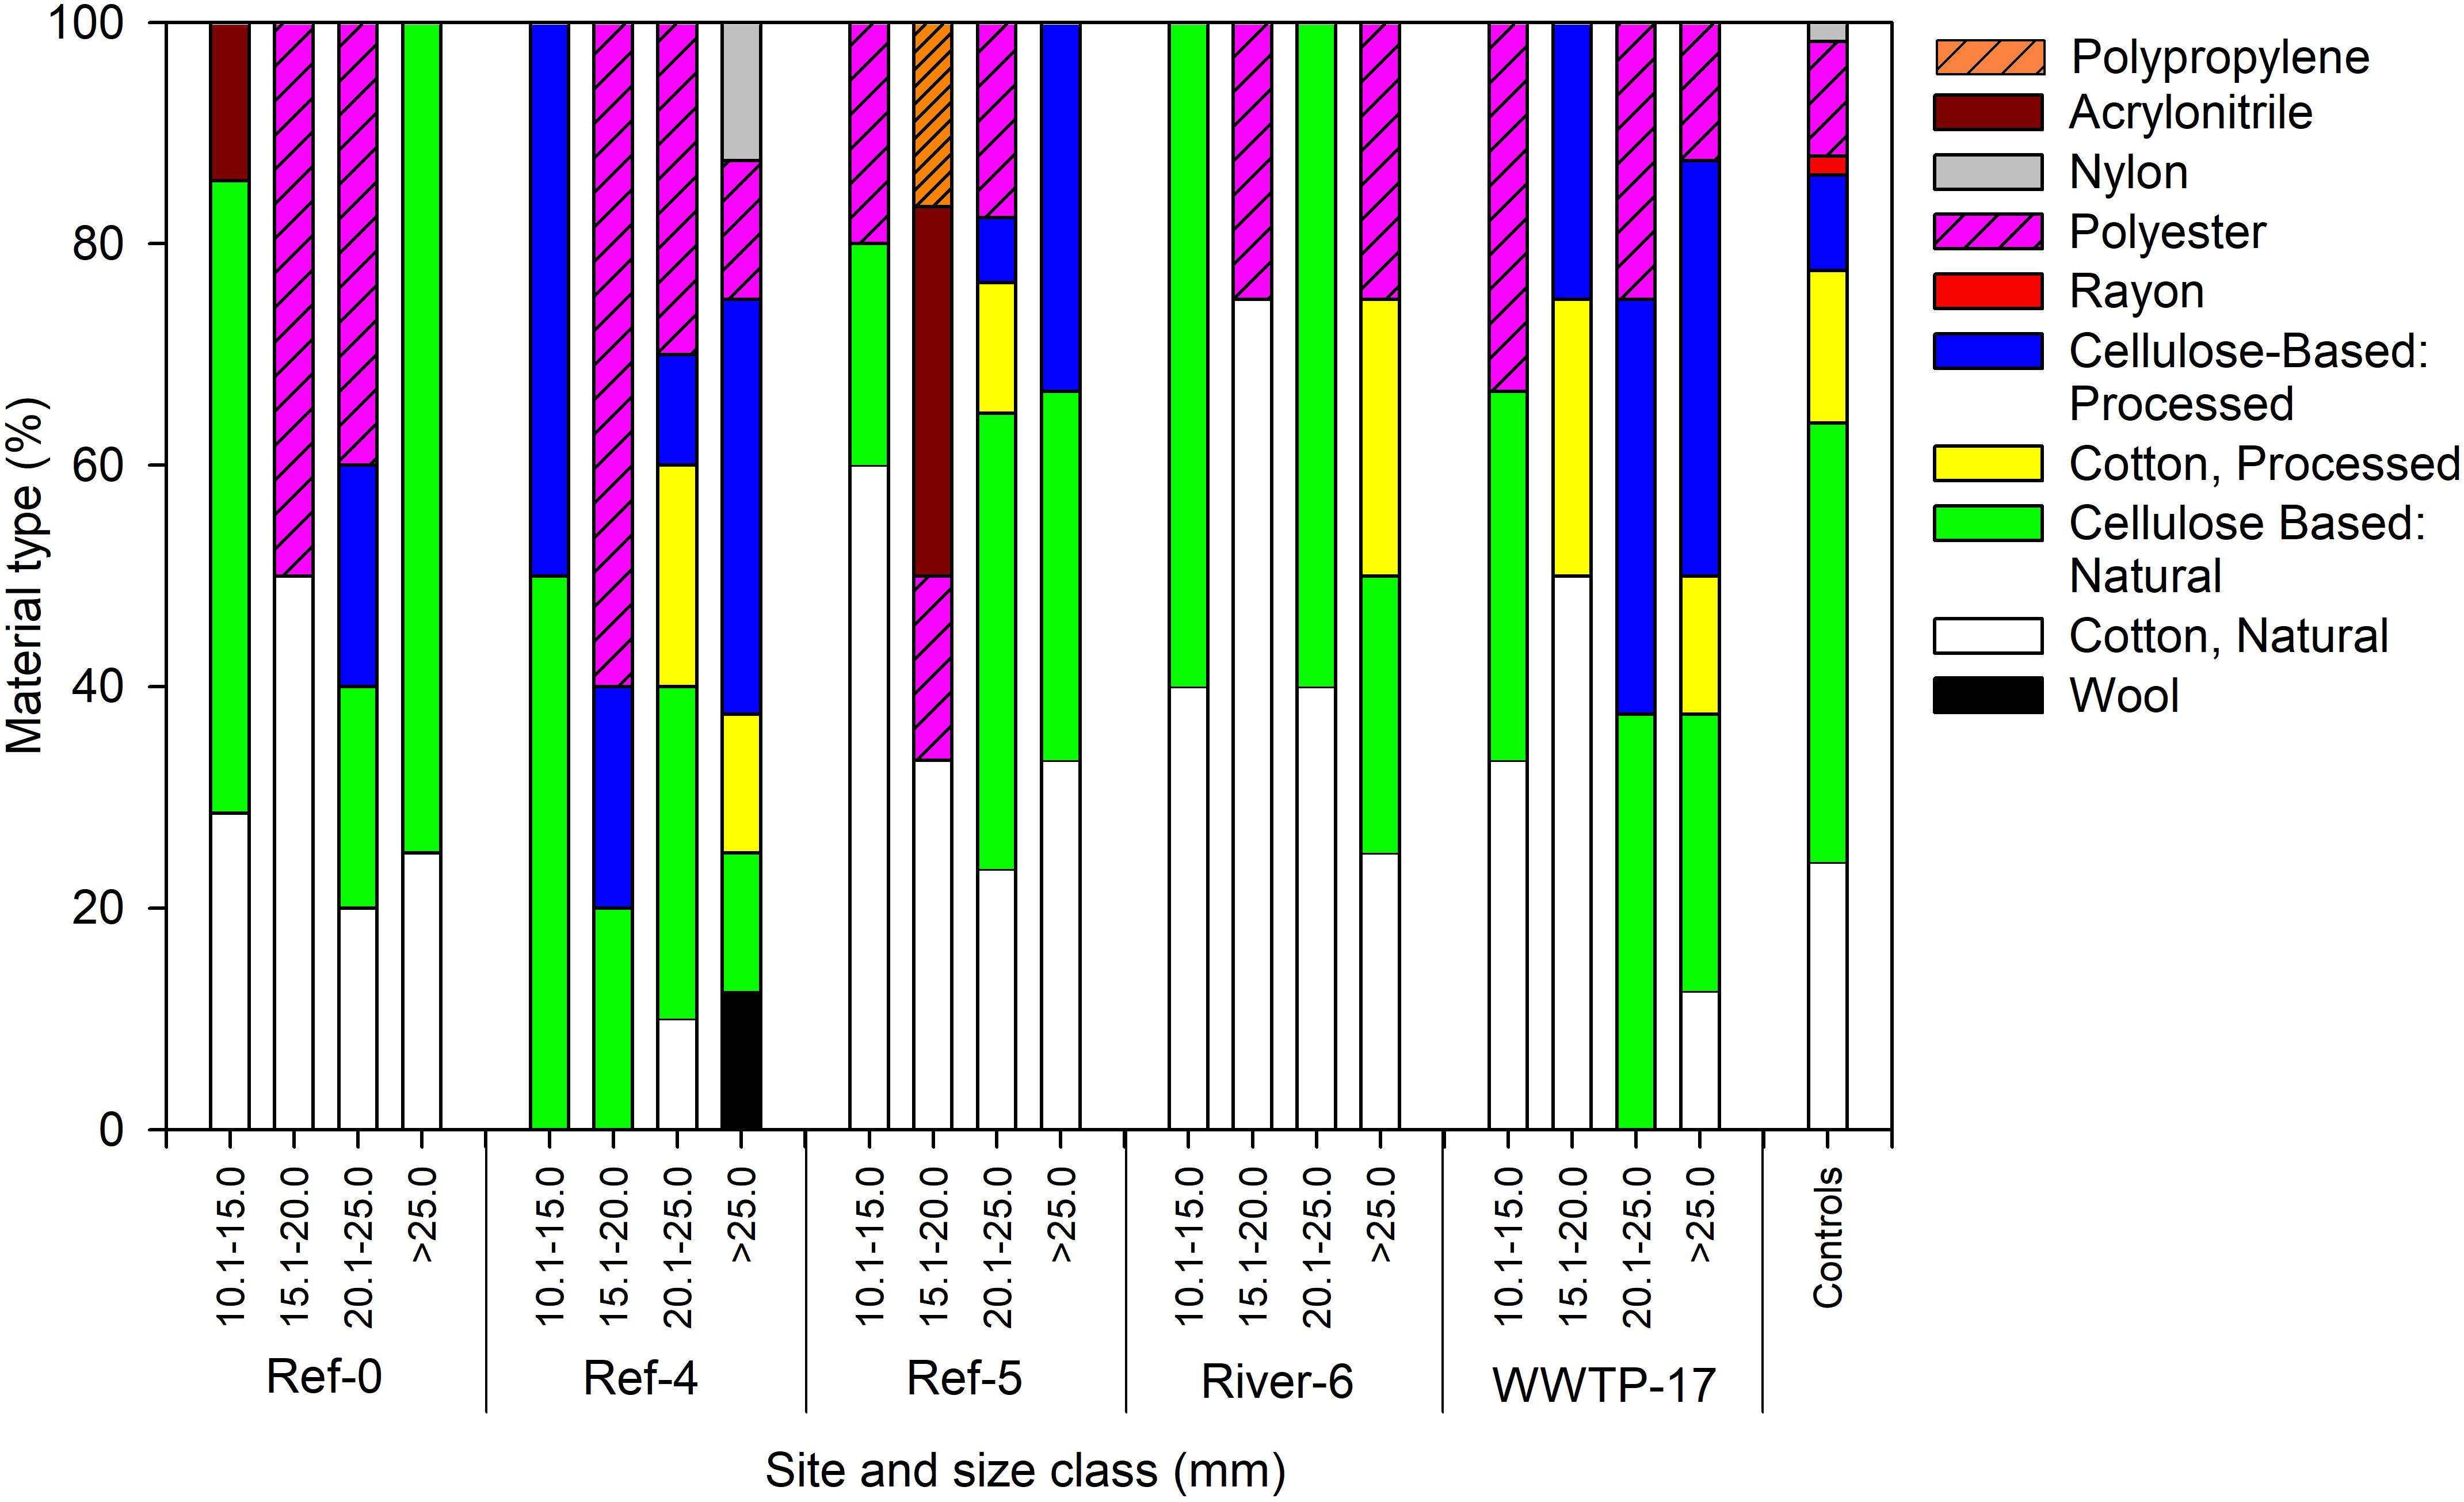
Figure 6. Relative abundance of microplastic particles by polymer type in dreissenid mussels collected from Milwaukee Harbor in July 2018 for mussels at 5 sites across size classes. Ref, reference; WWTP, wastewater treatment plant. The smallest class (5–10 mm) was not sampled due to low particle count.
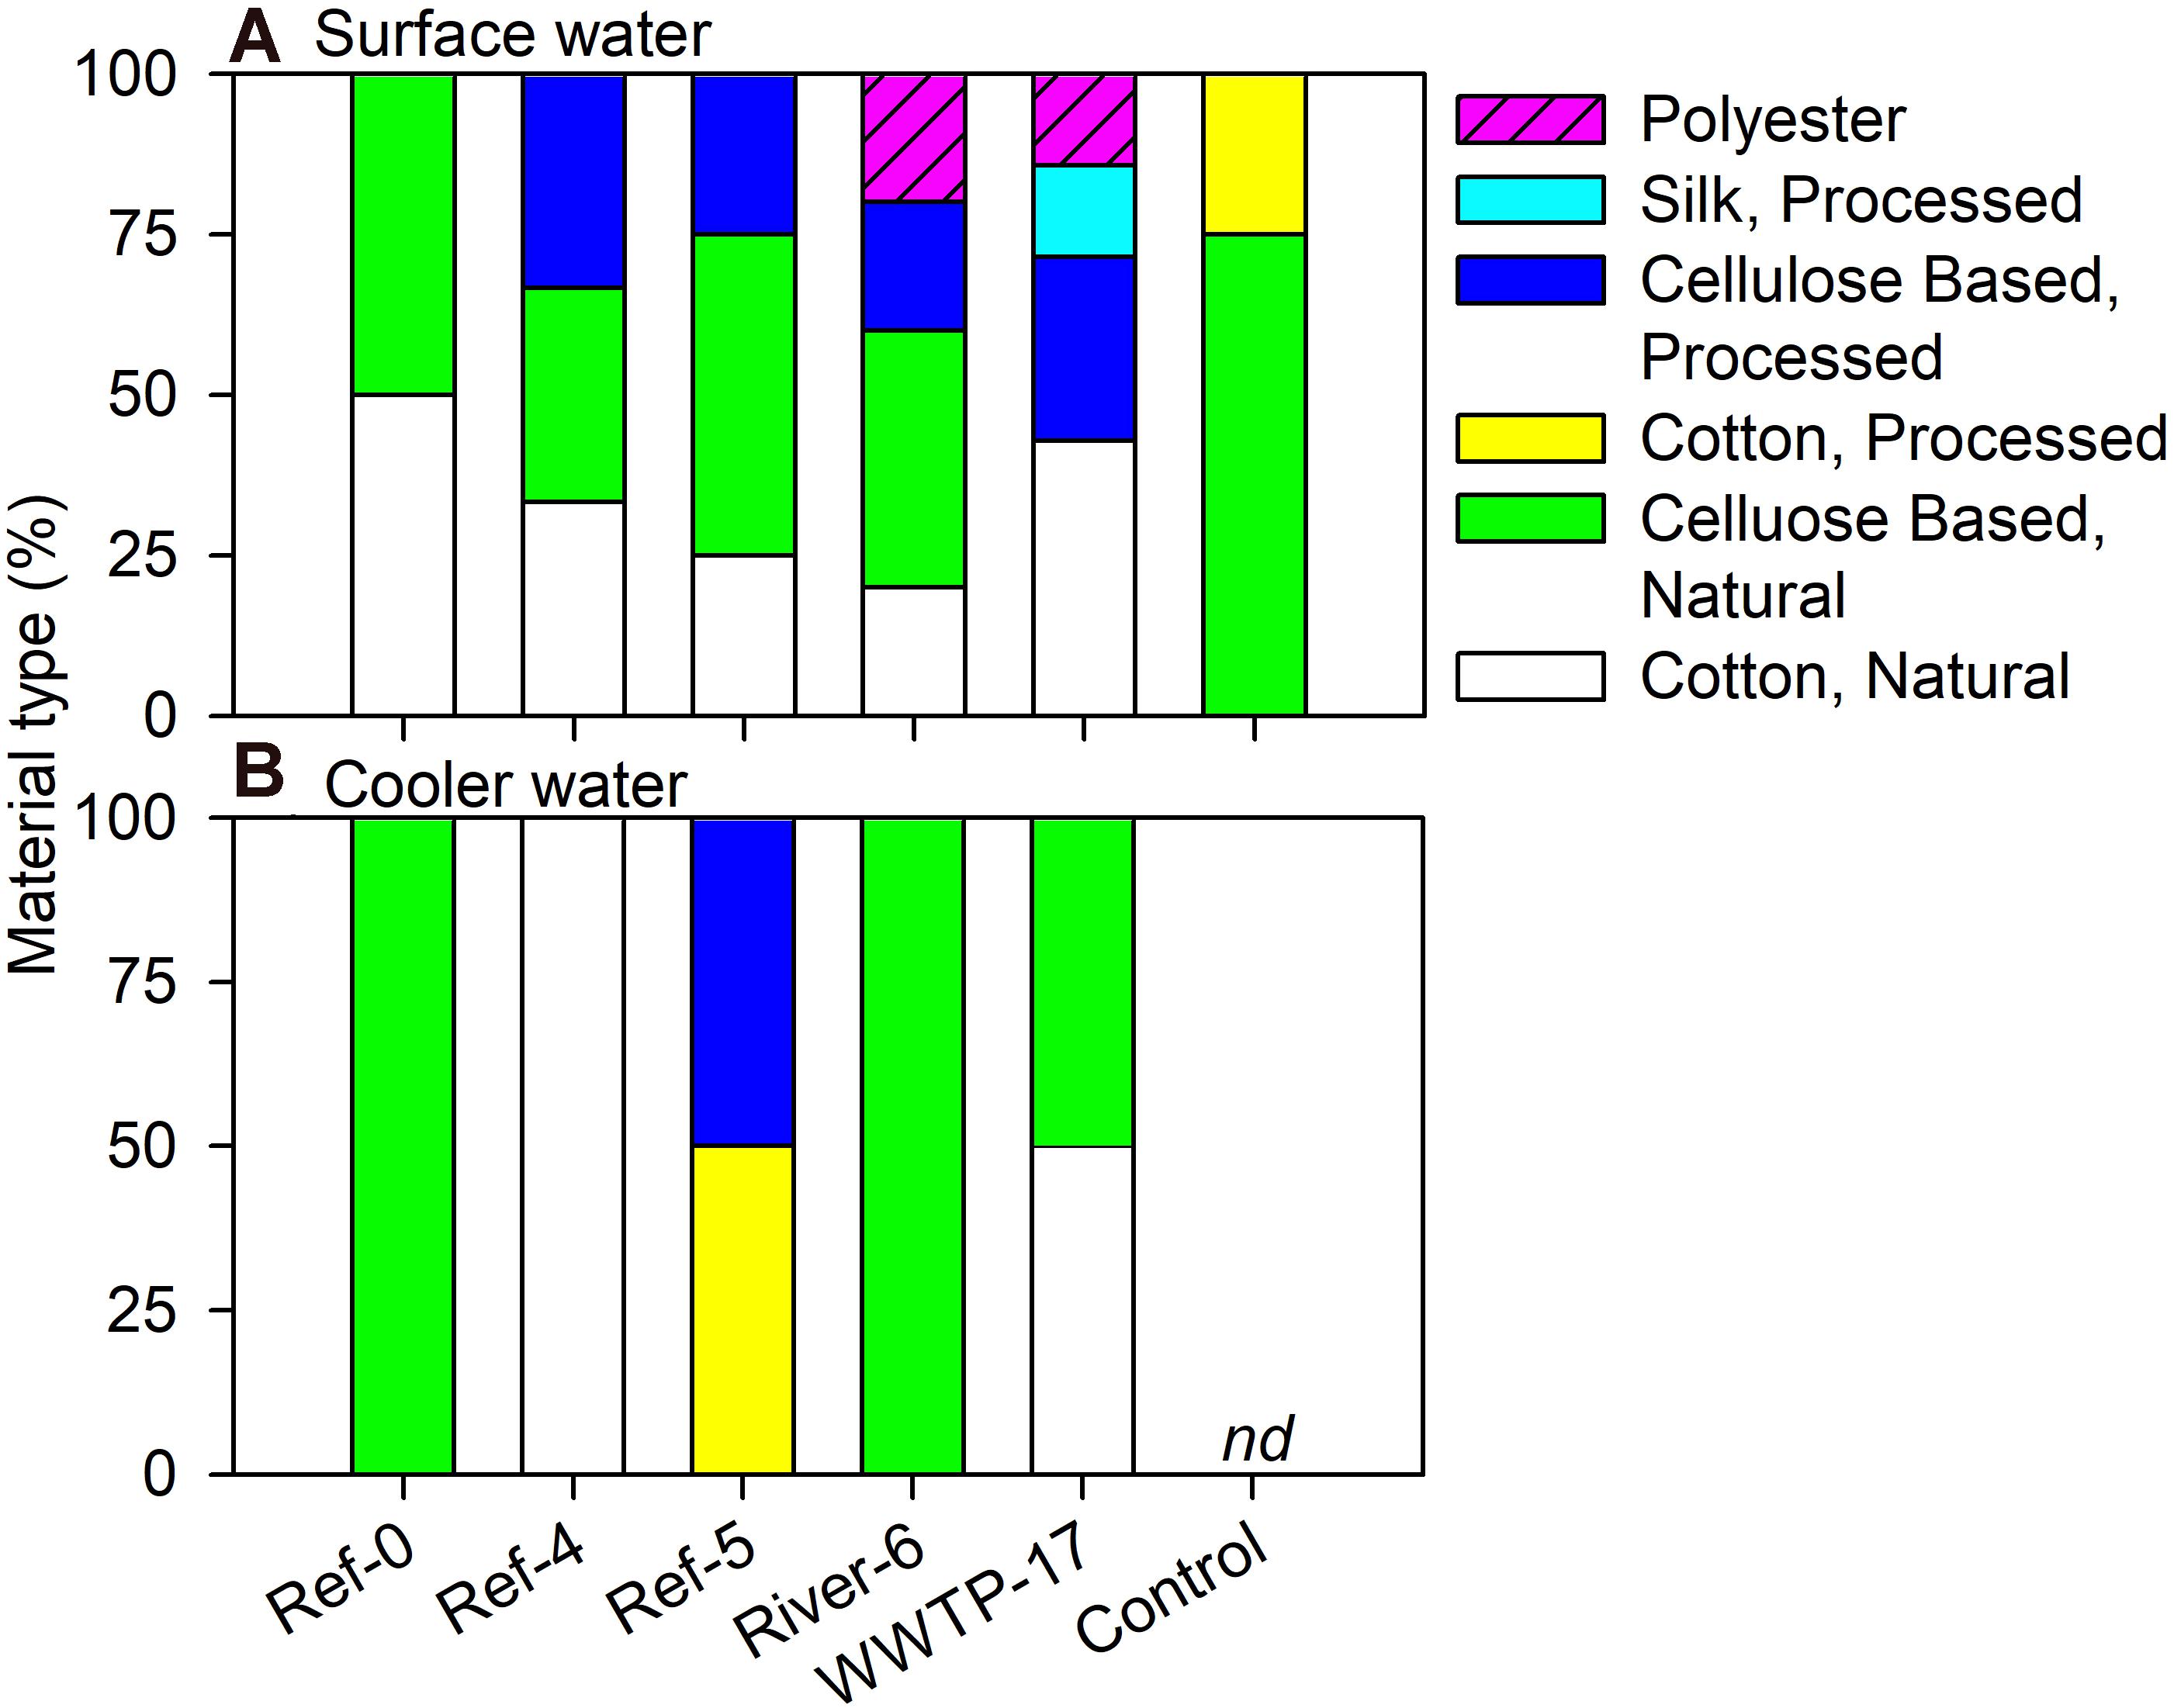
Figure 7. Relative abundance (%) of microplastic particles by polymer type in (A) surface and (B) cooler water in Milwaukee Harbor in July 2018. Ref, reference; WWTP, wastewater treatment plant; nd, no data.
Microplastics in Mussels: Comparison to Chemical Contaminants
We found few significant relationships between microplastics and chemicals in mussels. No relationships were noted between microplastics and alkylphenols (N = 2), petroleum biomarkers (N = 10), or with mussel moisture or lipid content (Supplementary Table 5). For PAHs (N = 81 compounds), when comparing microplastic abundance as No./individual with chemical concentrations, we found a positive relationship to C2, C3, and C4 decalin (Supplementary Table 5). When comparing microplastic in mussels as No./g wet weight with chemical concentrations, we found negative relationships to 1-Methylnaphthalene, 2,6-Dimethylnaphthalene and 1-Methylfluorene, and no other significant relationships (Supplementary Table 5).
Discussion
Microplastics in Mussels: Comparison Among Sites, Size Classes, and Dates
We expected to find higher microplastic concentrations at River-6 and WWTP-17, which were in proximity to likely sources. However, our data showed mixed results. For example, microplastics in mussels were significantly higher at Ref-4 and WWTP-17 in July. We expected high levels at WWTP-17, but not at Ref-4. Possible sources of microplastics at Ref-4 include visitors and recreational activities at a nearby park (e.g., clothing, boating). At the two sites, microplastics varied by mussel size: Ref-4 had the highest microplastics only in the 10.1–15 mm mussels, while WWTP-17 showed high microplastics in all mussels >10 mm. The pattern may indicate more microplastic retention in large mussels at the WWTP site. Although, the pattern was not sustained in August when microplastic in mussels showed no significant difference among sites (Figure 2C). Overall, high variation among mussels precludes any assessment of how location drives microplastics found in dreissenid mussels in Milwaukee Harbor.
In addition to variation among sites, we predicted more microplastics in larger mussels. Once again, evidence to support our prediction was mixed. As expected, microplastic abundance (No./individual) in the smallest mussels was lower than all other size classes in June, July, and August. In contrast, when microplastics were considered as No./mass, the highest microplastic abundance was in 10.1–15 mm size class, and was low in the largest mussels (>25 mm). This was because the mean number of microplastics per mussel was relatively consistent (∼3 particles per individual) across the largest classes (15–25, 20–25, and 25 + mm), even as mass was higher in the larger mussels. However, it is unclear if this potential mean maximum of about 3 per individual relates to microplastics in the environment or the mussels’ retention capacity. More studies on dreissenid mussels’ interaction with microplastics is needed (Pedersen et al., 2020), including filtration, retention, rejection, and egestion (Ward et al., 2019b).
Our third prediction regarding microplastics in mussels was an increase from July to August at River-6 and WWTP-17 due to prolonged exposure to putative microplastic sources. The results did not support this prediction. The temporal patterns for microplastic abundance varied among each of the sites and mussel size classes. For example, at WWTP-17, microplastic in mussels was higher in July relative to August, while at the River-6, there was no difference between dates. The lack of microplastic accumulation in mussels over time could be attributed to changes in surface water concentrations (i.e., exposures; see below). In addition, dreissenids show seasonality in growth, reproduction, and feeding (i.e., filtration, rejection, and egestion), which vary across age classes and may affect microplastics in tissues (Karatayev et al., 2002; Pastorino et al., 2021).
Mussel condition index (i.e., length/mass) is a gross assessment of mussel health (Mann, 1978). Mussels near potential microplastic sources and environmental stressors (e.g., urban rivers and treated wastewater; River-6 and WWTP-17) could be expected to have lower condition index relative to the other sites, but our results showed mixed patterns across sites. The condition index of mussels at Ref-0 and Ref-4 were higher than River-6 and WWTP-17 in July. In August, mussel condition at River-6 improved, but mussel condition remained low at WWTP-17. Ref-5 consistently had the lowest condition index. We attribute the poor condition of mussels at WWTP-17 to wastewater. However, Ref-5 was the only site outside the breakwalls of Milwaukee Harbor, where lower condition may index be related to habitat conditions (i.e., currents) or food availability. Thus, condition index and microplastics were unrelated and were likely driven by different factors.
Overall, we found microplastic abundance in dreissenids was highly variable and without a clear link to sources or a consistent trend among sites, a pattern which is consistent with research on other bivalves. Phuong et al. (2018) assessed microplastics in blue mussels (M. edulis) and Pacific oysters (C. gigas) in France, including aquaculture and wild individuals, different locations, and two seasons. The authors found no significant differences in microplastics in mussel and oyster tissue across the variables examined. Microplastics in mussels (Mytillus spp.) were significantly different among individuals collected across the entire Atlantic coast of Norway (Bråte et al., 2018). However, sites near the urban center of Oslo as well as remote locations in the northern coast had the highest contamination. In contrast, Li et al. (2016) showed more microplastics in wild (relative to aquaculture) mussels near urban centers across a vast region of China’s Pacific coast. Pastorino et al. (2021) found higher microplastics in zebra mussels (D. polymorpha) adjacent to a WWTP relative to more remote locations, in Lake Iseo, Italy. While it may be logical to predict that location and proximity to a point source is a primary driver of microplastics in bivalves, it has not been consistently documented because microplastics are widespread, and filtration and excretion rates, as well as bivalve size, all influence accumulation of microplastics in tissues.
Microplastics in Water Samples
Microplastics in surface water did not support our predictions about the spatial distribution of sources. Microplastic concentrations in surface water were highest at two reference sites (Ref-4 and Ref-5), while River-6 and WWTP-17, our expected polluted sites, were low. The high spatial variation in our surface samples could be attributed to methodology or in situ variability. Our lake water collection was a “snapshot” of a relatively small volume. An improved resolution of microplastics could be generated by using combined approaches and habitats (i.e., bottles, nets, sediment, water column, and wastewater) with more frequency. In addition, we suggest sampling at mussel deployment depth to better capture potential exposures. One consistent finding from microplastic studies is that in situ concentrations are highly variable within sites, among sites, and over time (Baldwin et al., 2016; McNeish et al., 2018; Lenaker et al., 2019). Despite variability in our results, the range of values detected were consistent with recent studies in the area. Using the same methods, microplastic concentration in the Milwaukee River in summer 2016 was 30 particles/L (McNeish et al., 2018), the Kinnickinnic River in summer 2017 was 6 particles/L, and Underwood Creek (a nearby urban stream) had 9.6 particles/L (McNeish, Unpublished data).
We examined microplastic concentrations in the water from the coolers used to transport mussels from the study sites to shore to address concerns of microplastic depuration. We measured microplastic concentration in the cooler water of 0–11.3 particles/L, slightly higher than in the surface water (0–4.5 particles/L), which may indicate limited depuration. We conducted a few calculations to deduce the potential effect on microplastics recorded from mussels. The coolers contained a range of live individuals, from a minimum of 394 (Ref-5, June) to a maximum of 2,752 (Ref-5, August; Supplementary Table 1). The coolers’ interior volume was 27 L. Assuming the coolers contained 25 L of water plus 2 L of mussels, and if all mussels released at least 1 microplastic particle in transit, the cooler water would contain a minimum of 394 particles in 25 L (15 particles/L) in the cooler with the smallest number of mussels, or a maximum of 2,752 particles in 25 L (110 particles/L) in the cooler with the highest number of mussels. Our results were below the minimum (0–11.3 particles/L), suggesting any depuration during transport had a minimal impact on mussel data.
Microplastics in Mussels: Comparison to Chemical Contaminants
We predicted that microplastics in mussels would be positively related to chemicals extracted from mussels but found little supporting evidence. Two mechanisms might support a correlation: (1) microplastics and contaminants are high at some sites relative to others, and mussels are enriched in both due to their location and feeding, and/or (2) chemicals adsorbed to microplastics are ingested together. Plastic surfaces can attract hydrophobic contaminants, and if ingested, chemicals could be released from microplastics inside the organism (Rochman, 2013; Sun et al., 2021). For almost all chemicals, we found no positive correlation to support a mechanistic connection.
The only exceptions to the overall trend were positive relationships between microplastics and a few PAH’s: decalin (C2, C3, and C4 decahydronaphthalene), methylnaphthalene (1-methylnaphthalene and 2,6-dimethylnaphthalene) and 1-methylfluorene. Decalin is a common solvent for fuel additives and plastics processing (Aguado et al., 2006; The Market Publishers, 2013; Sultan and Jabrail, 2019). Methylnaphthalene is used in products such as moth repellent and high-performance polyester, while 1-Methylfluorene is a derivative of fluorene, which is derived from crude oil. Given the long industrial heritage of the region, it is not surprising to find these compounds as pollutants in Milwaukee (along with other chemical contaminants found across sites; Supplementary Table 5; E. Johnson, personal obs.). The positive relationship between these particular contaminants and microplastics may indicate co-accumulation of contaminants and microplastics for a few types of chemicals. However, we caution against extrapolation as most contaminants showed no relationship with microplastics. Further insight into contaminant-microplastic interactions requires experimental studies for individual compounds and a range of environmental conditions (Sun et al., 2021).
Microplastic Characteristics: Shape, Color, Material Type
Consistent with previous work in the region, microplastics in this study were largely fibers, colored blue, clear, red, black, and gray, from a mixture of natural, semi-synthetic, and synthetic compounds. Fibers are the dominant shape type found in Great Lakes tributaries and fish (Baldwin et al., 2016; McNeish et al., 2018; Lenaker et al., 2019). The color distribution in our project was similar to past studies, including the uncommon colors (e.g., purple and yellow; Barrows et al., 2018; McNeish et al., 2018), which are useful to track lab contamination (e.g., yellow lab smocks). Natural materials comprised about half of the particles detected, similar to recent work in Lake Ontario (Grbiæ et al., 2020). By publishing details on microplastic characteristics and comparing to regional datasets, these data help show broad trends and predict microplastics’ potential sources and impacts.
Microplastics in Dreissenids Compared to Other Bivalves and Local Fish Taxa
The range of microplastics we found within dreissenid mussels was similar to published values for other bivalves (reviewed by Li et al., 2019; Zhang et al., 2020). Mean (±SE) across mussels in this study was 0.6 (±1.3) No./individual, identical to blue mussels in France (Mytilus edulis) (Phuong et al., 2018) and US Pacific oysters (C. gigas) (Rochman et al., 2015), but lower than Mytilus edulis in China and the United Kingdom (1.1–7.6 No./individual (Li et al., 2016, 2018; Scott et al., 2019). Our value was slightly higher than a recently published value for microplastics in zebra mussels of 0.23 (±0.43 SD) No./individual at a WWTP-adjacent site in Lake Iseo, Italy (Pastorino et al., 2021). Microplastics in this study, as No./g wet weight (mean ± SE = 8.4 ± 23.0), were similar to Venerupis philippinarum in Canada (9.0 No./g; Davidson and Dudas, 2016), and Scapharca subcrenata in China (10.5 No./g; Li et al., 2015). A literature review by Li et al. (2019) concluded that microplastics are pervasive across taxa, with high variability among species, sites, and seasons. The authors noted the most studied bivalves were fisheries taxa, which are often consumed whole and raw, with important implications for human consumption. Non-seafood bivalve taxa are less commonly studied, but merit attention for microplastics as they are critical for ecosystem processes across aquatic habitats such as salt marshes (Geukensia demissa; ribbed mussels), rivers (Unionidae), and lakes (Dreissena sp.) (Galimany et al., 2013; Vaughn and Hoellein, 2018; Pastorino et al., 2021).
Recent research on microplastics in freshwater biota suggests trophic level may be one factor driving abundance in organisms (Krause et al., 2020), but few studies have compared microplastics across trophic levels that include freshwater invertebrates. Windsor et al. (2019b) found microplastics were ubiquitous in riverine macroinvertebrates (i.e., mayflies and caddisflies), but highly variable and unrelated to functional feeding group. In contrast, McNeish et al. (2018) showed microplastics in freshwater fish were significantly higher abundance in predators relative to detritivores.
To examine trends by trophic level, we compared microplastic in mussels from site River-6 in 2018 to microplastics in fish collected at an adjacent site in summer 2016. Data were mined from McNeish et al. (2018), which collected fish from the confluence of the Kinnickinnic and Milwaukee Rivers (Figure 1). Three species were examined: Neogobius melanostomus (round goby; zoobenthivore, N = 9), Catostomus commersonii (white sucker; detritivore, N = 16) and Pimephales promelas (fathead minnow; omnivore, N = 10). Fish digestive tracts were processed for microplastics using the same protocol as for mussels in this study. Median microplastics in gobies (17.0 No./individual) were significantly higher than the minnow (2.0 No./individual), sucker (3.0 No./individual), and mussels (2.0 No./individual) (K–W-test p < 0.001; Figure 8). The median value for filter feeding dreissenids, which are herbivores (Garton et al., 2005), was about 8.5 times lower than gobies, which are mussel predators with pharyngeal jaws evolved to crush dreissenid shells (Brush et al., 2012). We note data were collected in separate studies, but we cautiously infer that trophic transfer of microplastics from mussels to gobies may be one factor affecting microplastic abundance among organisms. More studies of microplastic in food webs are needed (e.g., in situ and feeding trials).
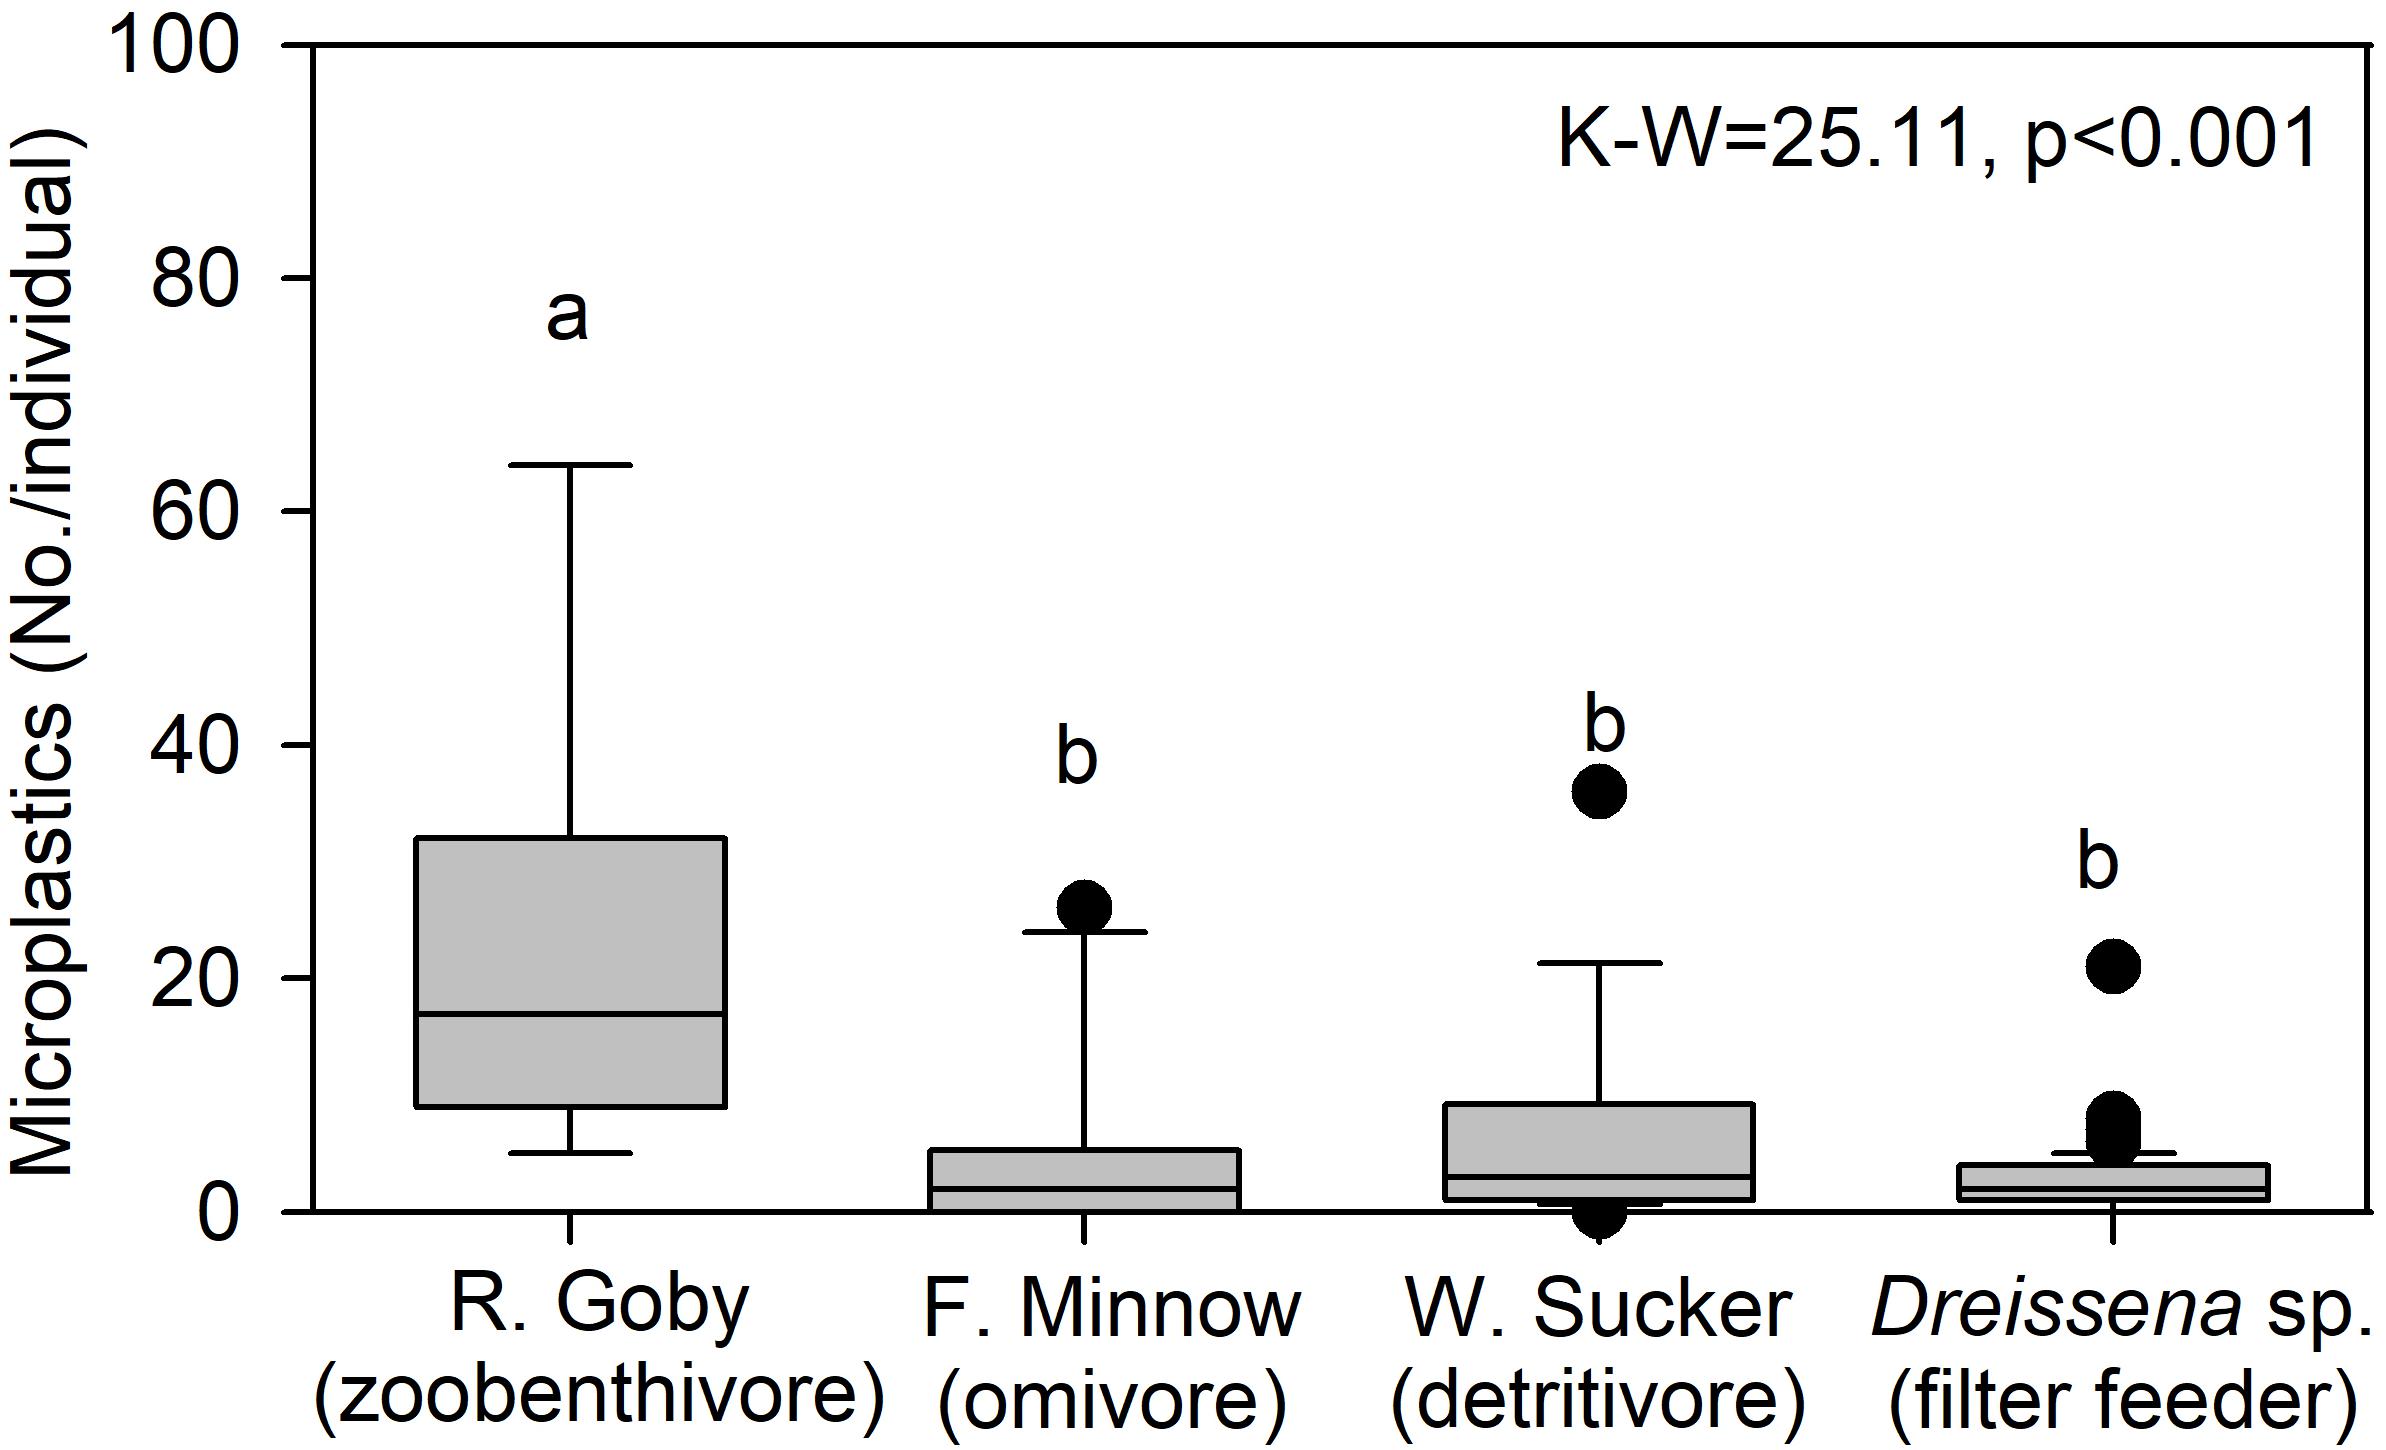
Figure 8. Median (center line), 25th and 75th percentile (box edges), and data outliers beyond 25 and 75 percentiles (dots) for microplastic concentration in Neogobius melanostomus (round goby; zoobenthivore, N = 9), Pimephales promelas (fathead minnow; omnivore, N = 10), Catostomus commersonii (white sucker; detritivore, N = 16), and Dreissena sp. (mussels; filter feeders, N = 82, site River-6). The K–W are indicated, where degrees of freedom = 3, and lowercase letters are not significantly different among taxa via post hoc comparison (p ≤ 0.05).
Dreissenid Mussels May Not Be “Sentinels” of Microplastic Pollution
Understanding the dynamics of microplastic uptake, rejection, and retention by bivalves is a topic of major interest from the public, policy makers, and scientists (Zhang et al., 2020). To date, assessments for dreissenids are rare and focus on laboratory feeding. Pedersen et al. (2020) exposed quagga mussels to high density polyethylene beads (10–45 μm) and found no selective rejection, filtration rates that were positively related to water column concentration, and 95% retention after 24 h of depuration. Magni et al. (2018) fed polystyrene beads (1 and 10 μm; dose = 5(105)–2(106) particles/L) to zebra mussels and tracked accumulation of beads in the gut and hemolymph, with little stress response. Research on dreissenid filtration of microplastics is at an early stage and will benefit from examination of mussel interactions with microplastics types found in situ (e.g., fibers, fragments) and at environmental concentrations (Pastorino et al., 2021).
The literature on microplastic filtration dynamics by bivalves is rapidly emerging for marine species. Ward et al. (2019b) examined microplastic filtration of by eastern oysters and blue mussels, and showed preferential rejection of polystyrene microspheres (median diameter = 0.019–1 mm), but little preferential rejection of nylon microfibers (median length = 0.075–1.075 mm). The authors measured the residence time of fibers >0.5 mm in blue mussels at over 3 h. Our results, while collected in situ and on different species, are consistent with those data. Microplastic fibers in mussel tissues were the most common shape, and we found little circumstantial evidence for fiber depuration during the 0.5–1-h transport from the field to the lab. Woods et al. (2018) exposed blue mussels to high fiber concentrations (30,000 per L) and showed 9% ingestion with 91% rejection as pseudofeces. While these concentrations were 10,000 times higher than microplastics at our sites, the data suggest pre-ingestion sorting and rejection of fibers by dreissenids could occur in situ. The relationship between microfibers and dreissenid filtration has not been studied and will be key for measuring microplastic dynamics in Great Lakes food webs.
Given their role as “sentinels” of chemical pollution in NOAA’s Mussel Watch Program, an important inference from this study was to consider if dreissenid mussels were valuable for monitoring microplastics in the Great Lakes. Our initial conclusion is that these mussels do not serve as indicators of microplastic pollution, because variation in microplastics among individuals, size classes, and time periods was higher or equal to the variation among sites. An important caveat to this conclusion is that we did not conduct extensive assessments of microplastics among the various habitats at each site (e.g., surface, water column, and benthic zone), and our sites were in close proximity compared to the size of the Great Lakes. Further, microplastic dynamics during feeding, excretion, and among life stages of dreissenids are lacking, especially with the shapes (fibers) and concentrations typical in the environment.
Recent assessments of microplastic in marine bivalves provide conflicting conclusions as to their use as sentinels of environmental pollution. Ward et al. (2019b) stated firmly that bivalves are not appropriate in this role, given the body of research on bivalve feeding dynamics (i.e., selective filtration and ingestion), and feeding experiments with microplastics on two well-studied marine species. Li et al. (2019) expressed a different position. These authors acknowledged the effect of filtration and the vast scale of variation in microplastics found among taxa and locations, yet suggested that improvements in methodological uniformity, studies of physiology and behavior relative to microplastic processing by mussels, and enhanced collaboration are still outstanding requirements for completing a comprehensive assessment (Li et al., 2019).
Conclusion
Dreissenid mussels are ecosystem engineers of considerable abundance and ecological importance in the Great Lakes and other freshwater ecosystems (Li et al., 2021). Quantifying their interactions with microplastics is critical for understanding the dynamics of plastic pollution. Dreissenids may not serve as bioindicators of microplastic pollution in the urban littoral habitats of the Great Lakes. However, there is much to learn about factors which drive abundance of microplastics and contaminants in freshwater bivalves and their predators. More studies are needed to examine intrinsic (e.g., filtration, egestion, age, reproductive status) and extrinsic factors (e.g., temperature, exposure, food quality, season) that control mussel-microplastic interactions. We suggest studies are needed that span sites with a wider gradient of water quality, longer time series, across different habitats, and paired field studies and laboratory analyses to quantify chemical interactions and physiological impacts. A suite of approaches and large collaborations will generate the best data on dreissenid mussels’ interaction with plastic pollution.
Data Availability Statement
The raw data supporting the conclusions of this article will be made available by the authors, without undue reservation.
Author Contributions
TH, AU, EJ, and CH conceived the study and conducted field work. TH and CR conducted laboratory analyses for microplastics and mussel mass, conducted statistical analyses and graphing. EJ directed laboratory analyses of chemical contaminants. TH, CR, AU, EJ, and CH wrote, edited, and reviewed the final version of the manuscript which all the authors approved before submission.
Funding
Funding was provided by the NOAA Marine Debris Program with indirect support from Great Lakes Mussel Watch, I.M. Systems Group, and Great Lakes Environmental Research Laboratory. Participation of two high school students was supported by After School Matters and Chicago Public Schools.
Conflict of Interest
CH was employed by the companies Lynker Technologies LLC and I.M. Systems Group.
The remaining authors declare that the research was conducted in the absence of any commercial or financial relationships that could be construed as a potential conflict of interest.
Acknowledgments
For field support we thank Kimani Kimbrough (NOAA, NCCOS), Shelly Tomlinson (NOAA NCCOS), Annie Jacob (CSS), Ammar Hanif (Knauss Fellow NCCOS), Andrew Mason (NOAA MDP), Beau Braymer (Cardinal Point Captains Northeast regional manager with NOAA GLERL), and Katie Miller (CSS). For laboratory support we thank Deeb Omari, Naiha Sharma, Therese Lee, Gloria Selveraj, Audrey Eros, Raul Lazcano, Amy Fetters, Fatima Ghulam, and Amara Ahmad. Comments provided by S. Lundgren, A. Mason, N. Wallace and journal reviewers strengthened the manuscript. The scientific results, conclusions, views, or opinions expressed herein are those of the authors and do not necessarily reflect the views of NOAA or the Department of Commerce.
Supplementary Material
The Supplementary Material for this article can be found online at: https://www.frontiersin.org/articles/10.3389/fmars.2021.690401/full#supplementary-material
References
Aguado, J., Serrano, D. P., Vicente, G., and Sánchez, N. (2006). Effect of decalin solvent on the thermal degradation of HDPE. J. Polym. Environ. 14, 375–384.
Ahel, M., Giger, W., and Koch, M. (1994). Behaviour of alkylphenol polyethoxylate surfactants in the aquatic environment—I. Occurrence and transformation in sewage treatment. Water Res. 28, 1131–1142. doi: 10.1016/0043-1354(94)90200-3
Baldwin, A. K., Corsi, S. R., and Mason, S. A. (2016). Plastic debris in 29 Great Lakes tributaries: relations to watershed attributes and hydrology. Environ. Sci. Technol. 50, 10377–10385. doi: 10.1021/acs.est.6b02917
Barrows, A. P. W., Christiansen, K. S., Bode, E. T., and Hoellein, T. J. (2018). A watershed-scale, citizen science approach to quantifying microplastic concentration in a mixed land-use river. Water Res. 147, 382–392. doi: 10.1016/j.watres.2018.10.013
Berglund, E., Fogelberg, V., Nilsson, P. A., and Hollander, J. (2019). Microplastics in a freshwater mussel (Anodonta anatina) in Northern Europe. Sci. Total Environ. 697:134192. doi: 10.1016/j.scitotenv.2019.134192
Bråte, I. L. N., Hurley, R., Iversen, K., Beyer, J., Thomas, K. V., Steindal, C. C., et al. (2018). Mytilus spp. as sentinels for monitoring microplastic pollution in Norwegian coastal waters: a qualitative and quantitative study. Environ. Pollut. 243, 383–393. doi: 10.1016/j.envpol.2018.08.077
Brush, J. M., Fisk, A. T., Hussey, N. E., and Johnson, T. B. (2012). Spatial and seasonal variability in the diet of round goby (Neogobius melanostomus): stable isotopes indicate that stomach contents overestimate the importance of dreissenids. Can. J. Fish. Aquat. Sci. 69, 573–586. doi: 10.1139/f2012-001
Bucci, K., Tulio, M., and Rochman, C. M. (2020). What is known and unknown about the effects of plastic pollution: a meta-analysis and systematic review. Ecol. Appl. 30:e02044.
Covernton, G. A., Collicutt, B., Gurney-Smith, H. J., Pearce, C. M., Dower, J. F., Ross, P. S., et al. (2019). Microplastics in bivalves and their habitat in relation to shellfish aquaculture proximity in coastal British Columbia, Canada. Aquac. Environ. Interact. 11, 357–374. doi: 10.3354/aei00316
Davidson, K., and Dudas, S. E. (2016). Microplastic ingestion by wild and cultured Manila clams (Venerupis philippinarum) from Baynes Sound, British Columbia. Arch. Environ. Contam. Toxicol. 71, 147–156. doi: 10.1007/s00244-016-0286-4
Eriksen, M., Mason, S., Wilson, S., Box, C., Zellers, A., Edwards, W., et al. (2013). Microplastic pollution in the surface waters of the Laurentian Great Lakes. Mar. Pollut. Bull. 77, 177–182. doi: 10.1016/j.marpolbul.2013.10.007
Farrington, J. W., Tripp, B. W., Tanabe, S., Subramanian, A., Sericano, J. L., Wade, T. L., et al. (2016). Edward D. Goldberg’s proposal of “the Mussel Watch”: reflections after 40 years. Mar. Pollut. Bull. 110, 501–510. doi: 10.1016/j.marpolbul.2016.05.074
Foley, C. J., Feiner, Z. S., Malinich, T. D., and Höök, T. O. (2018). A meta-analysis of the effects of exposure to microplastics on fish and aquatic invertebrates. Sci. Total Environ. 631, 550–559. doi: 10.1016/j.scitotenv.2018.03.046
Galimany, E., Rose, J. M., Dixon, M. S., and Wikfors, G. H. (2013). Quantifying feeding behaviors of ribbed mussels, Geukensia demissa, in two urban sites (Long Island Sound, USA) with different seston conditions. Estuaries Coasts 36, 1265–1273. doi: 10.1007/s12237-013-9633-0
Garton, D. W., Payne, C. D., and Montoya, J. P. (2005). Flexible diet and trophic position of dreissenid mussels as inferred from stable isotopes of carbon and nitrogen. Can. J. Fish. Aquat. Sci. 62, 1119–1129. doi: 10.1139/f05-025
Grbiæ, J., Helm, P., Athey, S., and Rochman, C. M. (2020). Microplastics entering northwestern Lake Ontario are diverse and linked to urban sources. Water Res. 174, 115623. doi: 10.1016/j.watres.2020.115623
Hale, R. C., Smith, C. L., de Fur, P. O., Harvey, E., Bush, E. O., La Guardia, M. J., et al. (2000). Nonylphenols in sediments and effluents associated with diverse wastewater outfalls. Environ. Toxicol. Chem. An Int. J. 19, 946–952. doi: 10.1002/etc.5620190423
Hoellein, T. J., and Rochman, C. M. (2021). The plastic cycle: pools and fluxes of plastic litter at the watershed scale. Front. Ecol. Environ. 19:176–183. doi: 10.1002/fee.2294
Jaruga, P., Coskun, E., Kimbrough, K., Jacob, A., Johnson, W. E., and Dizdaroglu, M. (2017). Biomarkers of oxidatively induced DNA damage in dreissenid mussels: a genotoxicity assessment tool for the Laurentian Great Lakes. Environ. Toxicol. 32, 2144–2153. doi: 10.1002/tox.22427
Karatayev, A. Y., Burlakova, L. E., and Padilla, D. K. (2002). “Impacts of zebra mussels on aquatic communities and their role as ecosystem engineers,” in Invasive Aquatic Species of Europe. Distribution, Impacts and Management, eds E. Leppäkoski, S. Gollasch, and S. Olenin (Dordrecht: Springer), 433–446. doi: 10.1007/978-94-015-9956-6_43
Kazour, M., and Amara, R. (2020). Is blue mussel caging an efficient method for monitoring environmental microplastics pollution? Sci. Total Environ. 710:135649. doi: 10.1016/j.scitotenv.2019.135649
Kimbrough, K. L., Johnson, W. E., Jacob, A. P., Edwards, M. A., and Davenport, E. D. (2018). Great Lakes Mussel Watch: Assessment of Contaminants of Emerging Concern. NOAA Technical Memorandum NOS NCCOS 249. Silver Spring, MD: NCCOS. doi: 10.25923/2jp9-pn57
Kimbrough, K. L., Lauenstein, G. G., and Johnson, W. E. (2007). Organic Contaminant Analytical Methods of the National Status and Trends Program Update 2000-2006. NOAA Technical Memorandum NOS NCCOS 30. Silver Spring, MD: NCCOS.
Klosterhaus, S. L., Grace, R., Hamilton, M. C., and Yee, D. (2013). Method validation and reconnaissance of pharmaceuticals, personal care products, and alkylphenols in surface waters, sediments, and mussels in an urban estuary. Environ. Int. 54, 92–99. doi: 10.1016/j.envint.2013.01.009
Krause, S., Baranov, V., Nel, H. A., Drummond, J., Kukkola, A., Hoellein, T., et al. (2020). Gathering at the top? Environmental controls of microplastic uptake and biomagnification in freshwater food webs. Environ. Pollut. 268:115750. doi: 10.1016/j.envpol.2020.115750
La Guardia, M. J., Hale, R. C., Harvey, E., and Mainor, T. M. (2001). Alkylphenol ethoxylate degradation products in land-applied sewage sludge (biosolids). Environ. Sci. Technol. 35, 4798–4804. doi: 10.1021/es0109040
Lenaker, P. L., Baldwin, A. K., Corsi, S. R., Mason, S. A., Reneau, P. C., and Scott, J. W. (2019). Vertical distribution of microplastics in the water column and surficial sediment from the Milwaukee River Basin to Lake Michigan. Environ. Sci. Technol. 53, 12227–12237. doi: 10.1021/acs.est.9b03850
Li, J., Green, C., Reynolds, A., Shi, H., and Rotchell, J. M. (2018). Microplastics in mussels sampled from coastal waters and supermarkets in the United Kingdom. Environ. Pollut. 241, 35–44. doi: 10.1016/j.envpol.2018.05.038
Li, J., Ianaiev, V., Huff, A., Zalusky, J., Ozersky, T., and Katsev, S. (2021). Benthic invaders control the phosphorus cycle in the world’s largest freshwater ecosystem. Proc. Natl. Acad. Sci. U.S.A. 118:e2008223118. doi: 10.1073/pnas.2008223118
Li, J., Lusher, A. L., Rotchell, J. M., Deudero, S., Turra, A., Bråte, I. L. N., et al. (2019). Using mussel as a global bioindicator of coastal microplastic pollution. Environ. Pollut. 244, 522–533. doi: 10.1016/j.envpol.2018.10.032
Li, J., Qu, X., Su, L., Zhang, W., Yang, D., Kolandhasamy, P., et al. (2016). Microplastics in mussels along the coastal waters of China. Environ. Pollut. 214, 177–184. doi: 10.1016/j.envpol.2016.04.012
Li, J., Yang, D., Li, L., Jabeen, K., and Shi, H. (2015). Microplastics in commercial bivalves from China. Environ. Pollut. 207, 190–195. doi: 10.1016/j.envpol.2015.09.018
Lusher, A. L., Welden, N. A., Sobral, P., and Cole, M. (2017). Sampling, isolating and identifying microplastics ingested by fish and invertebrates. Anal. Methods 9, 1346–1360. doi: 10.1039/c6ay02415g
Magni, S., Gagné, F., André, C., Della Torre, C., Auclair, J., Hanana, H., et al. (2018). Evaluation of uptake and chronic toxicity of virgin polystyrene microbeads in freshwater zebra mussel Dreissena polymorpha (Mollusca: Bivalvia). Sci. Total Environ. 631, 778–788. doi: 10.1016/j.scitotenv.2018.03.075
Mann, R. (1978). “A comparison of morphometric, biochemical, and physiological indexes of condition in marine bivalve mollusks,” in Energy and Environmental Stress in Aquatic Systems: (D.O.E. Symposium Series (Conf. – 771114), eds J. H. Thorp and J. W. Gibbons (Springfield, VA: National Technical Information Service), 484–497.
McCormick, A. R., Hoellein, T. J., London, M. G., Hittie, J., Scott, J. W., and Kelly, J. J. (2016). Microplastic in surface waters of urban rivers: concentration, sources, and associated bacterial assemblages. Ecosphere 7:e01556.
McNeish, R. E., Kim, L. H., Barrett, H. A., Mason, S. A., Kelly, J. J., and Hoellein, T. J. (2018). Microplastic in riverine fish is linked to species traits. Sci. Rep. 8:11639.
Miller, R. Z., Watts, A. J. R., Winslow, B. O., Galloway, T. S., and Barrows, A. P. W. (2017). Mountains to the sea: river study of plastic and non-plastic microfiber pollution in the northeast USA. Mar. Pollut. Bull. 124, 245–251. doi: 10.1016/j.marpolbul.2017.07.028
Munno, K., Helm, P. A., Jackson, D. A., Rochman, C., and Sims, A. (2018). Impacts of temperature and selected chemical digestion methods on microplastic particles. Environ. Toxicol. Chem. 37, 91–98. doi: 10.1002/etc.3935
Pastorino, P., Prearo, M., Anselmi, S., Menconi, V., Bertoli, M., Dondo, A., et al. (2021). Use of the zebra mussel Dreissena polymorpha (Mollusca, Bivalvia) as a bioindicator of microplastics pollution in freshwater ecosystems: a case study from Lake Iseo (North Italy). Water 13:434. doi: 10.3390/w13040434
Pedersen, A. F., Gopalakrishnan, K., Boegehold, A. G., Peraino, N. J., Westrick, J. A., and Kashian, D. R. (2020). Microplastic ingestion by quagga mussels, Dreissena bugensis, and its effects on physiological processes. Environ. Pollut. 260:113964. doi: 10.1016/j.envpol.2020.113964
Phuong, N. N., Poirier, L., Pham, Q. T., Lagarde, F., and Zalouk-Vergnoux, A. (2018). Factors influencing the microplastic contamination of bivalves from the French Atlantic coast: location, season and/or mode of life? Mar. Pollut. Bull. 129, 664–674. doi: 10.1016/j.marpolbul.2017.10.054
Rochman, C. M. (2013). Plastics and priority pollutants: a multiple stressor in aquatic habitats. Environ. Sci. Technol. 47, 2439–2440. doi: 10.1021/es400748b
Rochman, C. M. (2015). “The complex mixture, fate and toxicity of chemicals associated with plastic debris in the marine environment,” in Marine Anthropogenic Litter, eds M. Bergmann, L. Gutow, and M. Klages (Cham: Springer), 117–140. doi: 10.1007/978-3-319-16510-3_5
Rochman, C. M., Tahir, A., Williams, S. L., Baxa, D. V., Lam, R., Miller, J. T., et al. (2015). Anthropogenic debris in seafood: plastic debris and fibers from textiles in fish and bivalves sold for human consumption. Sci. Rep. 5:14340.
Scott, N., Porter, A., Santillo, D., Simpson, H., Lloyd-Williams, S., and Lewis, C. (2019). Particle characteristics of microplastics contaminating the mussel Mytilus edulis and their surrounding environments. Mar. Pollut. Bull. 146, 125–133. doi: 10.1016/j.marpolbul.2019.05.041
Sericano, J. L., Wade, T. L., Jackson, T. J., Brooks, J. M., Tripp, B. W., Farrington, J. W., et al. (1995). Trace organic contamination in the Americas: an overview of the US National Status & Trends and the International ‘Mussel Watch’programmes. Mar. Pollut. Bull. 31, 214–225. doi: 10.1016/0025-326x(95)00197-u
Sultan, A. M. T., and Jabrail, F. H. (2019). Decalin dissolving method for recover of styrene–butadiene rubber from scrap tires. J. Environ. Sci. 15, 145–153. doi: 10.3844/ajessp.2019.145.153
Sun, S., Shi, W., Tang, Y., Han, Y., Du, X., Zhou, W., et al. (2021). The toxic impacts of microplastics (MPs) and polycyclic aromatic hydrocarbons (PAHs) on haematic parameters in a marine bivalve species and their potential mechanisms of action. Sci. Total Environ. 783:147003. doi: 10.1016/j.scitotenv.2021.147003
Teuten, E. L., Saquing, J. M., Knappe, D. R. U., Barlaz, M. A., Jonsson, S., Bjorn, A., et al. (2009). Transport and release of chemicals from plastics to the environment and to wildlife. Philos. Trans. R. Soc. B Biol. Sci. 364, 2027–2045. doi: 10.1098/rstb.2008.0284
The Market Publishers (2013). Decalin (CAS 91-17-8) Market Research Report 2013. Birmingham. Available online at: https://marketpublishers.com/report/industry/chemicals_petrochemicals/decahydronaphthalene_91-17-8_market_research_report.html (accessed October 6, 2020).
Vaughn, C. C., and Hoellein, T. J. (2018). Bivalve impacts in freshwater and marine ecosystems. Annu. Rev. Ecol. Evol. Syst. 49, 183–208. doi: 10.1146/annurev-ecolsys-110617-062703
Wang, Z., and Stout, S. (2010). Oil Spill Environmental Forensics: Fingerprinting and Source Identification. Burlington, MA: Associated Press.
Ward, J. E., Rosa, M., and Shumway, S. E. (2019a). Capture, ingestion, and egestion of microplastics by suspension-feeding bivalves: a 40-year history. Anthr. Coasts 2, 39–49. doi: 10.1139/anc-2018-0027
Ward, J. E., Zhao, S., Holohan, B. A., Mladinich, K. M., Griffin, T. W., Wozniak, J., et al. (2019b). Selective ingestion and egestion of plastic particles by the Blue mussel (Mytilus edulis) and Eastern oyster (Crassostrea virginica): implications for using bivalves as bioindicators of microplastic pollution. Environ. Sci. Technol. 53, 8776–8784. doi: 10.1021/acs.est.9b02073
Wardlaw, C., and Prosser, R. S. (2020). Investigation of microplastics in freshwater mussels (Lasmigona costata) from the grand river Watershed in Ontario, Canada. Water Air Soil Pollut. 231, 1–14.
Windsor, F. M., Durance, I., Horton, A. A., Thompson, R. C., Tyler, C. R., and Ormerod, S. J. (2019a). A catchment-scale perspective of plastic pollution. Glob. Chang. Biol. 25, 1207–1221. doi: 10.1111/gcb.14572
Windsor, F. M., Tilley, R. M., Tyler, C. R., and Ormerod, S. J. (2019b). Microplastic ingestion by riverine macroinvertebrates. Sci. Total Environ. 646, 68–74. doi: 10.1016/j.scitotenv.2018.07.271
Woods, M. N., Stack, M. E., Fields, D. M., Shaw, S. D., and Matrai, P. A. (2018). Microplastic fiber uptake, ingestion, and egestion rates in the blue mussel (Mytilus edulis). Mar. Pollut. Bull. 137, 638–645. doi: 10.1016/j.marpolbul.2018.10.061
Keywords: biomonitoring, freshwater ecosystems, Great Lakes, bivalves, microplastics, emerging contaminants
Citation: Hoellein T, Rovegno C, Uhrin AV, Johnson E and Herring C (2021) Microplastics in Invasive Freshwater Mussels (Dreissena sp.): Spatiotemporal Variation and Occurrence With Chemical Contaminants. Front. Mar. Sci. 8:690401. doi: 10.3389/fmars.2021.690401
Received: 02 April 2021; Accepted: 07 June 2021;
Published: 29 June 2021.
Edited by:
Daniel González-Fernández, University of Cádiz, SpainReviewed by:
Paolo Pastorino, Istituto Zooprofilattico Sperimentale del Piemonte, Liguria e Valle d’Aosta, ItalyOluniyi Olatunji Fadare, Research Center for Eco-Environmental Sciences (CAS), China
Rachel Louise Coppock, Plymouth Marine Laboratory, United Kingdom
Copyright © 2021 Hoellein, Rovegno, Uhrin, Johnson and Herring. This is an open-access article distributed under the terms of the Creative Commons Attribution License (CC BY). The use, distribution or reproduction in other forums is permitted, provided the original author(s) and the copyright owner(s) are credited and that the original publication in this journal is cited, in accordance with accepted academic practice. No use, distribution or reproduction is permitted which does not comply with these terms.
*Correspondence: Timothy Hoellein, dGhvZWxsZWluQGx1Yy5lZHU=