 Zong-Pei Jiang
 Yuqi Tong
 Mengmeng Tong
 Jiajun Yuan
 Qin Cao
 Yiwen Pan
- Ocean College, Zhejiang University, Zhoushan, China
The environmental conditions in estuaries display distinct variability along the river-ocean mixing continuum from turbid, eutrophic freshwater to clear, oligotrophic offshore oceanic water. In order to understand the effects of suspended particulate matter (SPM), nutrient, and salinity on phytoplankton growth, this study investigated the response of a harmful dinoflagellate (Amphidinium carterae Hulburt) to the ecological gradients in estuary environments. Rapid nutrient uptake and growth of A. carterae were detected in the nutrient-rich clear water, while nutrient concentration had little impact on the cellular chlorophyll a (Chl-a) content at the stationary phase. Light attenuation caused by SPM not only inhibited the specific growth rate of A. carterae but also prolonged its adaption period in turbid water, resulting in a delayed and weakened growth response. The elevated cellular Chl-a content under high SPM conditions resulting from photo-acclimation led to the decoupling of cell density and Chl-a concentration, indicating that Chl-a is not a reliable indicator for phytoplankton abundance in turbid environments. The combined effect of SPM and nutrient on specific growth rate of A. carterae can be explained by the comparative effect model, while the multiplicative effect model better predicted their interactive effect on the growth inhibitory rate (GIR). There is a transit of dominant limiting factor for phytoplankton growth along the salinity gradient in estuary environments. Salinity (for marine phytoplankton cannot survive under low salinity condition) and SPM are the dominant limiting factors at low salinities in nearshore turbid environments, while nutrient depletion exerts the dominant inhibitory effect in high salinity offshore water. Depending on the balance between enhancing nutrient limitation and reducing light limitation with increasing salinity, blooms most likely occur in the “optimal growth region” at intermediate salinities where light and nutrient are both suitable for phytoplankton growth.
Introduction
As the symptom of ecosystem imbalance, harmful algal blooms (HABs) may cause seawater discoloration, trigger spread of toxins, further deteriorate marine environment, and cause economic loss (Backer, 2009; O’Boyle et al., 2016; Lin et al., 2020). The duration, frequency, and extent of HABs have increased worldwide recently, especially in coastal regions (Hu et al., 2012; Liu et al., 2013b). These algae blooms are followed by high microbial respiration in bottom water as the exported organic matter is decomposed, which may result in hypoxia when stratification limits the oxygen supply to bottom water (Diaz and Rosenberg, 2008; Rabalais et al., 2014). Because of the metabolic connection between oxygen consumption and CO2 release, the co-occurrence of hypoxia and acidification (Cai et al., 2011; Wallace et al., 2014) represents a potential global threat to the health of coastal marine ecosystems (Fabry et al., 2008; Kroeker et al., 2010; Sunday et al., 2017). Therefore, knowledge of the mechanisms regulating phytoplankton growth is critical to improve our understanding on coastal ecological problems and to provide information for management strategies.
As the interface connecting land and open ocean, coastal oceans are among the most physical and biologically active areas of the biosphere, especially those with significant riverine influences. There is a strong ecological gradient along the river–ocean mixing continuum because of the mixing between turbid, eutrophic freshwater and clear, oligotrophic offshore oceanic water. The river water is generally characterized by higher concentrations of nutrient and suspended particulate matter (SPM) when compared to the receiving coastal water. Previous studies have proven that the increase of nutrient supply accelerates the growth of algae (Qasim et al., 1973; Lai et al., 2011; Huang et al., 2016; Li and Sun, 2016; Tong et al., 2016). The outbreaks of harmful algal species are often correlated to eutrophication in coastal waters with high riverine and anthropogenic inputs which provide the limiting nutrient elements for phytoplankton (Burkholder and Glasgow, 1997; Tang et al., 2006; Liu et al., 2013b). On the contrary, the increase in SPM concentration has a negative impact on the growth of phytoplankton. This can be attributed to (1) the presence of SPM attenuates the light, which is the energy source of photosynthesis, through scattering and absorbing processes (Kirk, 1985; Pierson et al., 2003; Bowers et al., 2009; Peng et al., 2009; Niimura et al., 2010; Liu et al., 2013a). (2) The uptake of nutrient was relatively lower in low light environments (Shi et al., 2015; Minggat et al., 2021), and nitrate reductase and nitrite reductase activities may also decrease under light stress (Li et al., 2004). (3) Some algae showed a physiological adaptation to light attenuation which involves increase in photosynthetic pigments and the changes in the macromolecular composition and ultrastructure of photosynthetic apparatus (Gilbes et al., 1996; MacIntyre et al., 2002; Kim et al., 2013). If algal cell allocates too much resource into photosynthetic machinery, there will be less remaining for cell growth and division (Behrenfeld et al., 2008; Behrenfeld et al., 2015). (4) Clay particles are usually negatively charged and have a high cation-adsorption capacity, algae cells can be adhered to suspended matter and the sinking due to aggregation with SPM is another cause for algal growth inhibition (Guenther and Bozelli, 2004). Therefore, the response of phytoplankton to nutrient inputs is less likely to be found in turbid and eutrophic estuarine ecosystems (Mallin et al., 1999; Painting et al., 2007; Domingues et al., 2017). Cruise surveys in large estuaries (e.g., Amazon estuary, Changjiang estuary, Mississippi estuary) showed that maximum chlorophyll concentration and primary production were generally observed in the “optimal growth region” at intermediate salinities (DeMaster et al., 1996; Song et al., 2017; Jiang et al., 2019), where the concentrations of SPM and nutrient were both lower compared to the river end member. The “optimal growth region” is where phytoplankton blooms most likely to occur, while the high organic matter export in this region could accelerate the formation of hypoxia in bottom water.
Conceptually, three effects (comparative, additive, and multiplicative) are frequently used to describe the interactions among multiple environmental factors (Folt et al., 1999). Comparative effect is that the effect of multiple factors in combination is equal to effect of the single dominant factor (Bruland et al., 1991). For additive effect, the combined effect is equal to sum of effects caused by each single factor. When stress from one factor can be further operated on probabilistically by other factors, the cumulative effect of multiple factors is considered as the multiplicative effect (Folt et al., 1999). It is clear that both nutrient and SPM play an important role in affecting the phytoplankton growth in estuarine and coastal waters. Although the separate effects of SPM and nutrient on phytoplankton growth have previously been described, the studies investigating their combined effects are still limited (Leonardos and Geider, 2004; Domingues et al., 2017; Wang et al., 2019), especially considering their substantial variability in dynamic coastal environments.
Amphidinium carterae Hulburt is a harmful bloom-forming dinoflagellate with cosmopolitan distribution and ecological importance in subtropical-tropical coastal and estuarine waters (Baig et al., 2006; Murray et al., 2012). The optimum temperature and salinity range for A. carterae are 18–23°C and 15–35 (McLachlan, 1961; Han et al., 2004). Taking A. carterae as an example, the primary objective of this work was to understand the interactive effects of key environmental factors (SPM, nutrient, and salinity) regulating the algal growth in coastal environment, as well as the controlling mechanism of the occurrence of “optimal growth region.” In this study, we conducted incubation experiments containing eight levels of SPM, nutrient, and salinity that covers the variation ranges of these variables observed in large estuaries. The growth responses of A. carterae to different environmental factors were investigated both individually (nutrient, SPM) and in combination (nutrient and SPM; nutrient, SPM, and salinity). The interactive effect of SPM and nutrient on A. carterae were further analyzed by the competitive and multiplicative effect models.
Materials and Methods
Organism and Culture Conditions
A. carterae was originally isolated from the East China Sea in 2016 and maintained in artificial seawater (salinity = 30.5) enriched with the f/2-Si medium (Guillard, 1975). The culture was grown at constant temperature (22°C) under the saturation light intensity of 110 μmol m–2 s–1 for A. carterae (Samuelsson and Richardson, 1982; Guinder et al., 2009) with a 12°h light: 12°h dark photoperiod cycle.
The SPMs were collected by filtrating the surface seawater adjacent to the Changjiang Estuary. The collected particles were treated with 10% hydrogen peroxide solution in water bath (60°C) for 12°h to remove the absorbed organic matter. The SPMs were then washed with ultrapure water for three times, crushed, and dried at 105°C for 10 h (Kirk and Gilbert, 1990; Liu et al., 2013a).
Experimental Design
A series of experiments were designed to investigate the effects of nutrient, SPM, and salinity both individually and in combination (Figure 1). Nitrate (DIN) and phosphate (DIP) were considered as the nutrient source in this study. The maximum concentrations of dissolved nutrient (DIN = 98.8 μM, DIP = 2.9 μM) and SPM (2.5 g/L) were set to be close to the properties of river end member observed in natural eutrophic estuaries such as the Changjiang estuary (Shen et al., 2013; Gao et al., 2015; Song et al., 2017) and the Mississippi estuary (Justic et al., 1995; Jiang et al., 2019). The minimum concentrations of nutrient (DIN = 0 μM, DIP = 0.3 μM) and SPM (0 g/L) were similar to the properties of offshore oceanic end member (Gao et al., 2015; Song et al., 2017; Jiang et al., 2019). In each experiment group, eight different levels of nutrient, SPM, and/or salinity were established by proportionally mixing two stock solutions with volume mixing ratio of 0:1, 1:3, 3:5, 1:1, 5:3, 3:1, 7:1, and 1:0 (Figure 1 and Table 1).
(I) Single-factor nutrient experiment. Eight levels of nutrient concentration were generated (columns 2 and 3 in Table 1) through the mixing of stock solution with maximum nutrient, minimum SPM, and salinity of 30.5 (NutmaxSPMminSal30.5 in Figure 1) and stock solution with minimum nutrient, minimum SPM, and salinity of 30.5 (NutminSPMminSal30.5 in Figure 1). Note that the concentrations of DIN and DIP varied simultaneously at different nutrient levels. All treatments in the single-factor nutrient experiment were conducted in clear water (SPM = 0 g/L) with adapted salinity condition (salinity = 30.5). In addition, an experiment containing three nutrient levels (DIN ranging from 37.8 to 141.3 μM, DIP ranging from 0.4 to 3.2 μM, SPM = 0 g/L, salinity = 30.5) were carried out to examine the nutrient assimilation during the growth of A. carterae.
(II) Single-factor SPM experiment: Eight levels of SPM concentration ranging from 0 to 2.5 g/L were established (column 4 in Table 1) under the constant nutrient-rich and adapted salinity condition (DIN = 98.8 μM, DIP = 2.9 μM, salinity = 30.5). The SPM gradient was generated through the mixing of stock solution with maximum nutrient, maximum SPM, and salinity of 30.5 (NutmaxSPMmaxSal30.5 in Figure 1) and stock solution with maximum nutrient, minimum SPM, and salinity of 30.5 (NutmaxSPMminSal30.5 in Figure 1).
(III) Two-factor (SPM and nutrient) experiment: As the combination of treatments of experiment I and II (mixing between NutmaxSPMmaxSal30.5 and NutminSPMminSal30.5, Figure 1), eight levels of covaried concentrations of nutrient and SPM were generated (columns 2, 3, and 4 in Table 1) with the salinity of 30.5.
(IV) Three-factor (SPM, nutrient, and salinity) experiment: Through the mixing of stock solution representing the river end member (NutmaxSPMmaxSal0 in Figure 1) and that representing the oceanic end member (NutminSPMminSal35 in Figure 1), we simulated the gradients of nutrient, SPM, and salinity in estuary environments resulting from the river-ocean mixing scheme (columns 2, 3, 4, and 5 in Table 1).

Figure 1. The design of the four groups of incubation experiment: (1) single-factor nutrient experiment, (2) single-factor SPM experiment, (3) two-factor (SPM and nutrient) experiment, (4) three-factor (SPM, nutrient, and salinity) experiment. The double-headed arrow lines represent the mixing between two stock solutions which generated eight different levels of nutrient, SPM, and/or salinity individually or in combination (Table 1). The maximum concentrations of nutrient (Nutmax: DIN = 98.8 μM, DIP = 2.9 μM) and SPM (SPMmax = 2.5 g/L) was set be close to the properties of river end member observed in natural eutrophic estuaries. The minimum concentrations of nutrient (Nutmin: DIN = 0 μM, DIP = 0.3 μM) and SPM (SPMmin = 0 g/L) were similar with the properties of oceanic end member. The subscripts for “Sal” represent the salinities of different stock solutions.

Table 1. Four groups of incubation experiment were designed to contain eight different levels of nutrient, SPM, and/or salinity both individually and in combination.
The exponential growth of A. carterae was inoculated into 500 mL flask with the initial concentration of ∼3.4 × 10⁴ cells/mL and total culture of 400 mL each. All the flasks were treated by hydrochloric acid solution (1 N) for 24 h, washed by ultrapure water, and through autoclave sterilizer (121°C, 30 min) or dry heat sterilization (140°C, 4 h). As stated above, the cultures were maintained under light of 110 μmol m–2 s–1 (12 h: 12 h light: dark cycle) at 22°C. All flasks were placed on a shaker at 190 rpm which, suggested by our experimental trials, was able to prevent algal cells and SPM from sinking. The photosynthetically active radiation (PAR) in each culture medium was measured by an irradiance meter (ULM-500, WALZ, Germany) with a spherical micro-quantum sensor (US-SQS, WALZ, Germany). Each treatment was conducted in triplicate and subsamples were taken every two days during the 20-day culture period.
Cells were fixed with 5% Lugol’s solution and enumerated under microscope (CX33, OLYMPUS, Japan). Chlorophyll a (Chl-a) samples were collected by filtering culture medium onto Whatman GF/F filters (0.7 μM) and extracted with 90% acetone overnight at 4°C in the dark. The concentration of Chl-a was measured with a fluorometer (F-7100, HITACHI, Japan) using the fluorometric technique (Arar and Collins, 1997). The concentration of DIN was measured through a reverse flow injection analysis referred to Feng et al. (2013), while DIP was measured by the phosphomolybdenum blue method (Hatta et al., 2019) with a UV spectrophotometry (Evolution 300, Thermo Fisher Scientific, United States).
Calculations
Cellular Chl-a content (Chlcell) was calculated by dividing Chl-a concentration by cell density. The specific growth rate (μ, d–1) of A. carterae in the exponential phase was determined by a least square fit to the cell densities after logarithmic transformation. Considering the relative phosphorus limitation (DIN: DIP > 18, Ho et al., 2003) in our study, DIP was applied in the Monod model to illustrate the correlation between specific growth rate and nutrient concentration (Healey, 1980):
where μmax is maximum specific growth rate (d–1), Ks is the nutrient concentration at μmax/2 (half-saturation concentration of nutrient).
The growth inhibitory rate (GIR) was calculated by comparing the area under the growth curves with the control treatment using the equations following Liu et al. (2013a):
where A represents the area under the growth curves, Nn is the cell density at the time Tn, Ai, and Ac are the areas of treatments and control, respectively. The control was selected as the treatment which provided the optimal condition for the growth of A. carterae (with maximum nutrient concentration, SPM = 0 g/L, salinity = 30.5).
The dose-response curve of contaminants (Weibull equation) can be applied to determine the growth inhibition of toxicants on algae (Ramos et al., 1999; Christensen et al., 2009; Dueri et al., 2009). The Weibull equation was suggested suitable for the evaluation of the inhibitory effect of SPM on phytoplankton (Liu et al., 2013a):
where CSPM is the concentration of SPM, β is the scale parameter which indicates the sensitivity of phytoplankton to SPM exposure, and θ is the curve shape parameter. Half maximal algal inhibitory concentration (IC50) was calculated as the SPM concentration that provokes 50% of the GIR.
The interactive effect of nutrient and SPM can be theoretically predicted following Folt et al. (1999):
where X represents μ or GIR; Xnut and XSPM refer to the result from the single-factor nutrient experiment and single-factor SPM experiment; Xcom, Xadd, and Xmul refer to the values predicted from the comparative effect model, additive effect model, and multiplicative effect model, respectively.
Statistical Analysis
Significant differences were analyzed with one or two way analysis of variance (ANOVA) using SPSS 22 (SPSS Inc., Chicago, IL, United States). Differences were considered significant at p < 0.05. All figures were plotted using the Origin software (OriginLab Corp. Northampton, MA, United States).
Results
Single-Factor Nutrient Experiment
No surprisingly, the elevated nutrient concentration promoted the growth of A. carterae (Figure 2A). The maximum cell density observed in each treatment (CDmax) increased from (6.30 ± 0.67) × 104 to (24.58 ± 1.30) × 104 cells/mL as nutrient concentration increased (Figure 2A, level 8 to level 1 in Table 2). The specific growth rate μnut (0.07 ± 0.01 d–1 to 0.33 ± 0.07 d–1) increased progressively with increasing nutrient concentration (level 8 to level 1 in Table 3), while the growth inhibitory rate GIRnut (90–0%) showed the opposite trend (level 8 to level 1 in Table 4). The maximum growth rate μmax of 0.5 d–1 was estimated from the Monod model, with half-saturation phosphate concentration of 1.7 μM (Figure 2D). The value of μmax was in good agreement with the specific growth rates of A. carterae obtained under nutrient replete conditions (0.4–0.5 d–1) (McLachlan, 1961; Franklin and Berges, 2004). The highest μnut under the maximum nutrient condition (0.33 ± 0.07 d–1 when DIN = 98.8 μM, DIP = 2.9 μM) was lower than the value of μmax. Similar to cell density, Chl-a concentration increased with high nutrient exposure (Figure 2B). The maximum cultural Chl-a concentration (Chlmax) appeared at the exponential phase during day 4 to day 8 (Figure 2B). The cellular Chl-a content (Chlcell) was elevated during the early exponential phase in all treatments, but there was no significant difference in Chlcell among different nutrient levels at the stationary phase (Figure 2C).
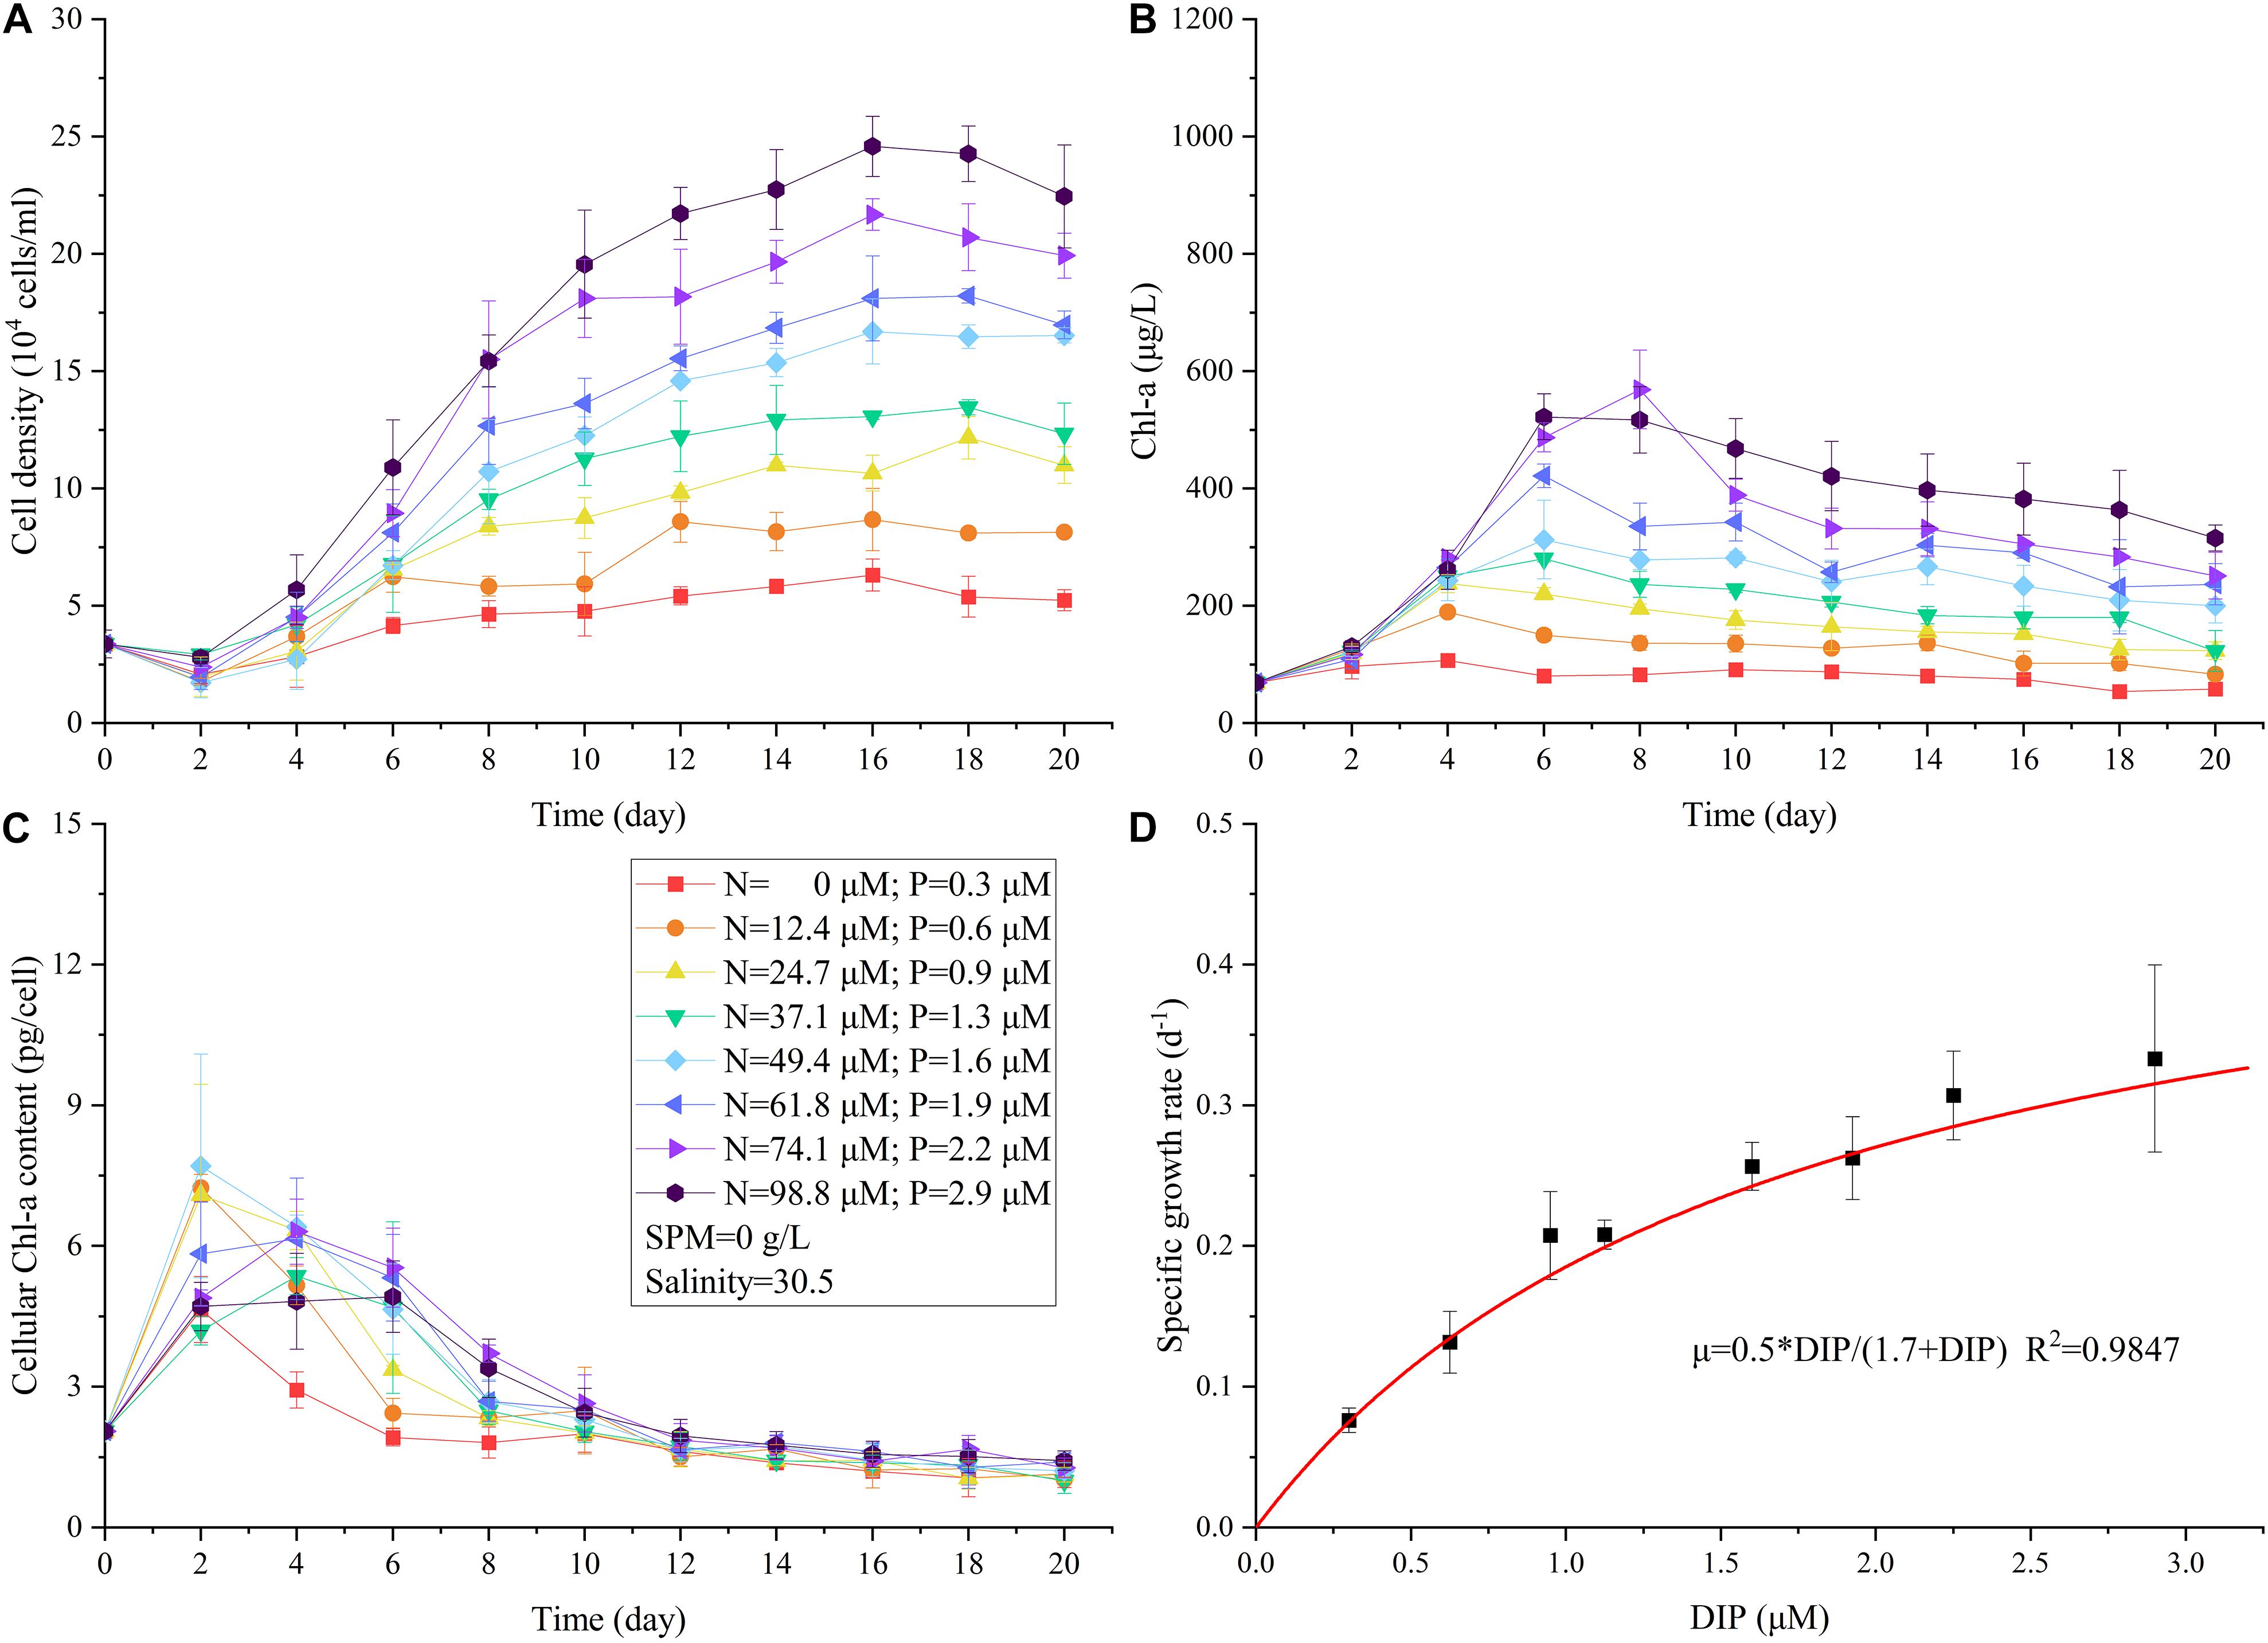
Figure 2. The changes in cell density (A), Chl-a concentration (B), cellular Chl-a content (C) under different nutrient concentrations in the single-factor nutrient experiment. The relationship between specific growth rate of A. carterae and concentration of DIP (D).
Table 2. The maximum cell density (CDmax, 104 cells/mL, mean ± standard deviation) of A. carterae under different culture settings in the four experimental groups.
Table 3. Specific growth rates (d–1, mean ± standard deviation) of A. carterae under different culture settings and the dominant limiting factors in the two-factor and three-factor experiments.
Table 4. Growth inhibitory rate (GIR) of A. carterae under different culture settings.
The additional nutrient assimilation experiment (with higher nutrient supply with DIN up to 141.3 μM and DIP up to 3.2 μM, Figure 3) showed the rapid uptake of nutrient by A. carterae in clear water. As the N:P ratio in our experiment was higher than the Redfield ratio (16:1), DIP was depleted ∼4 days earlier than DIN (Figure 3). The Chlmax was observed at the time when both DIP and DIN were used up (Figure 3).
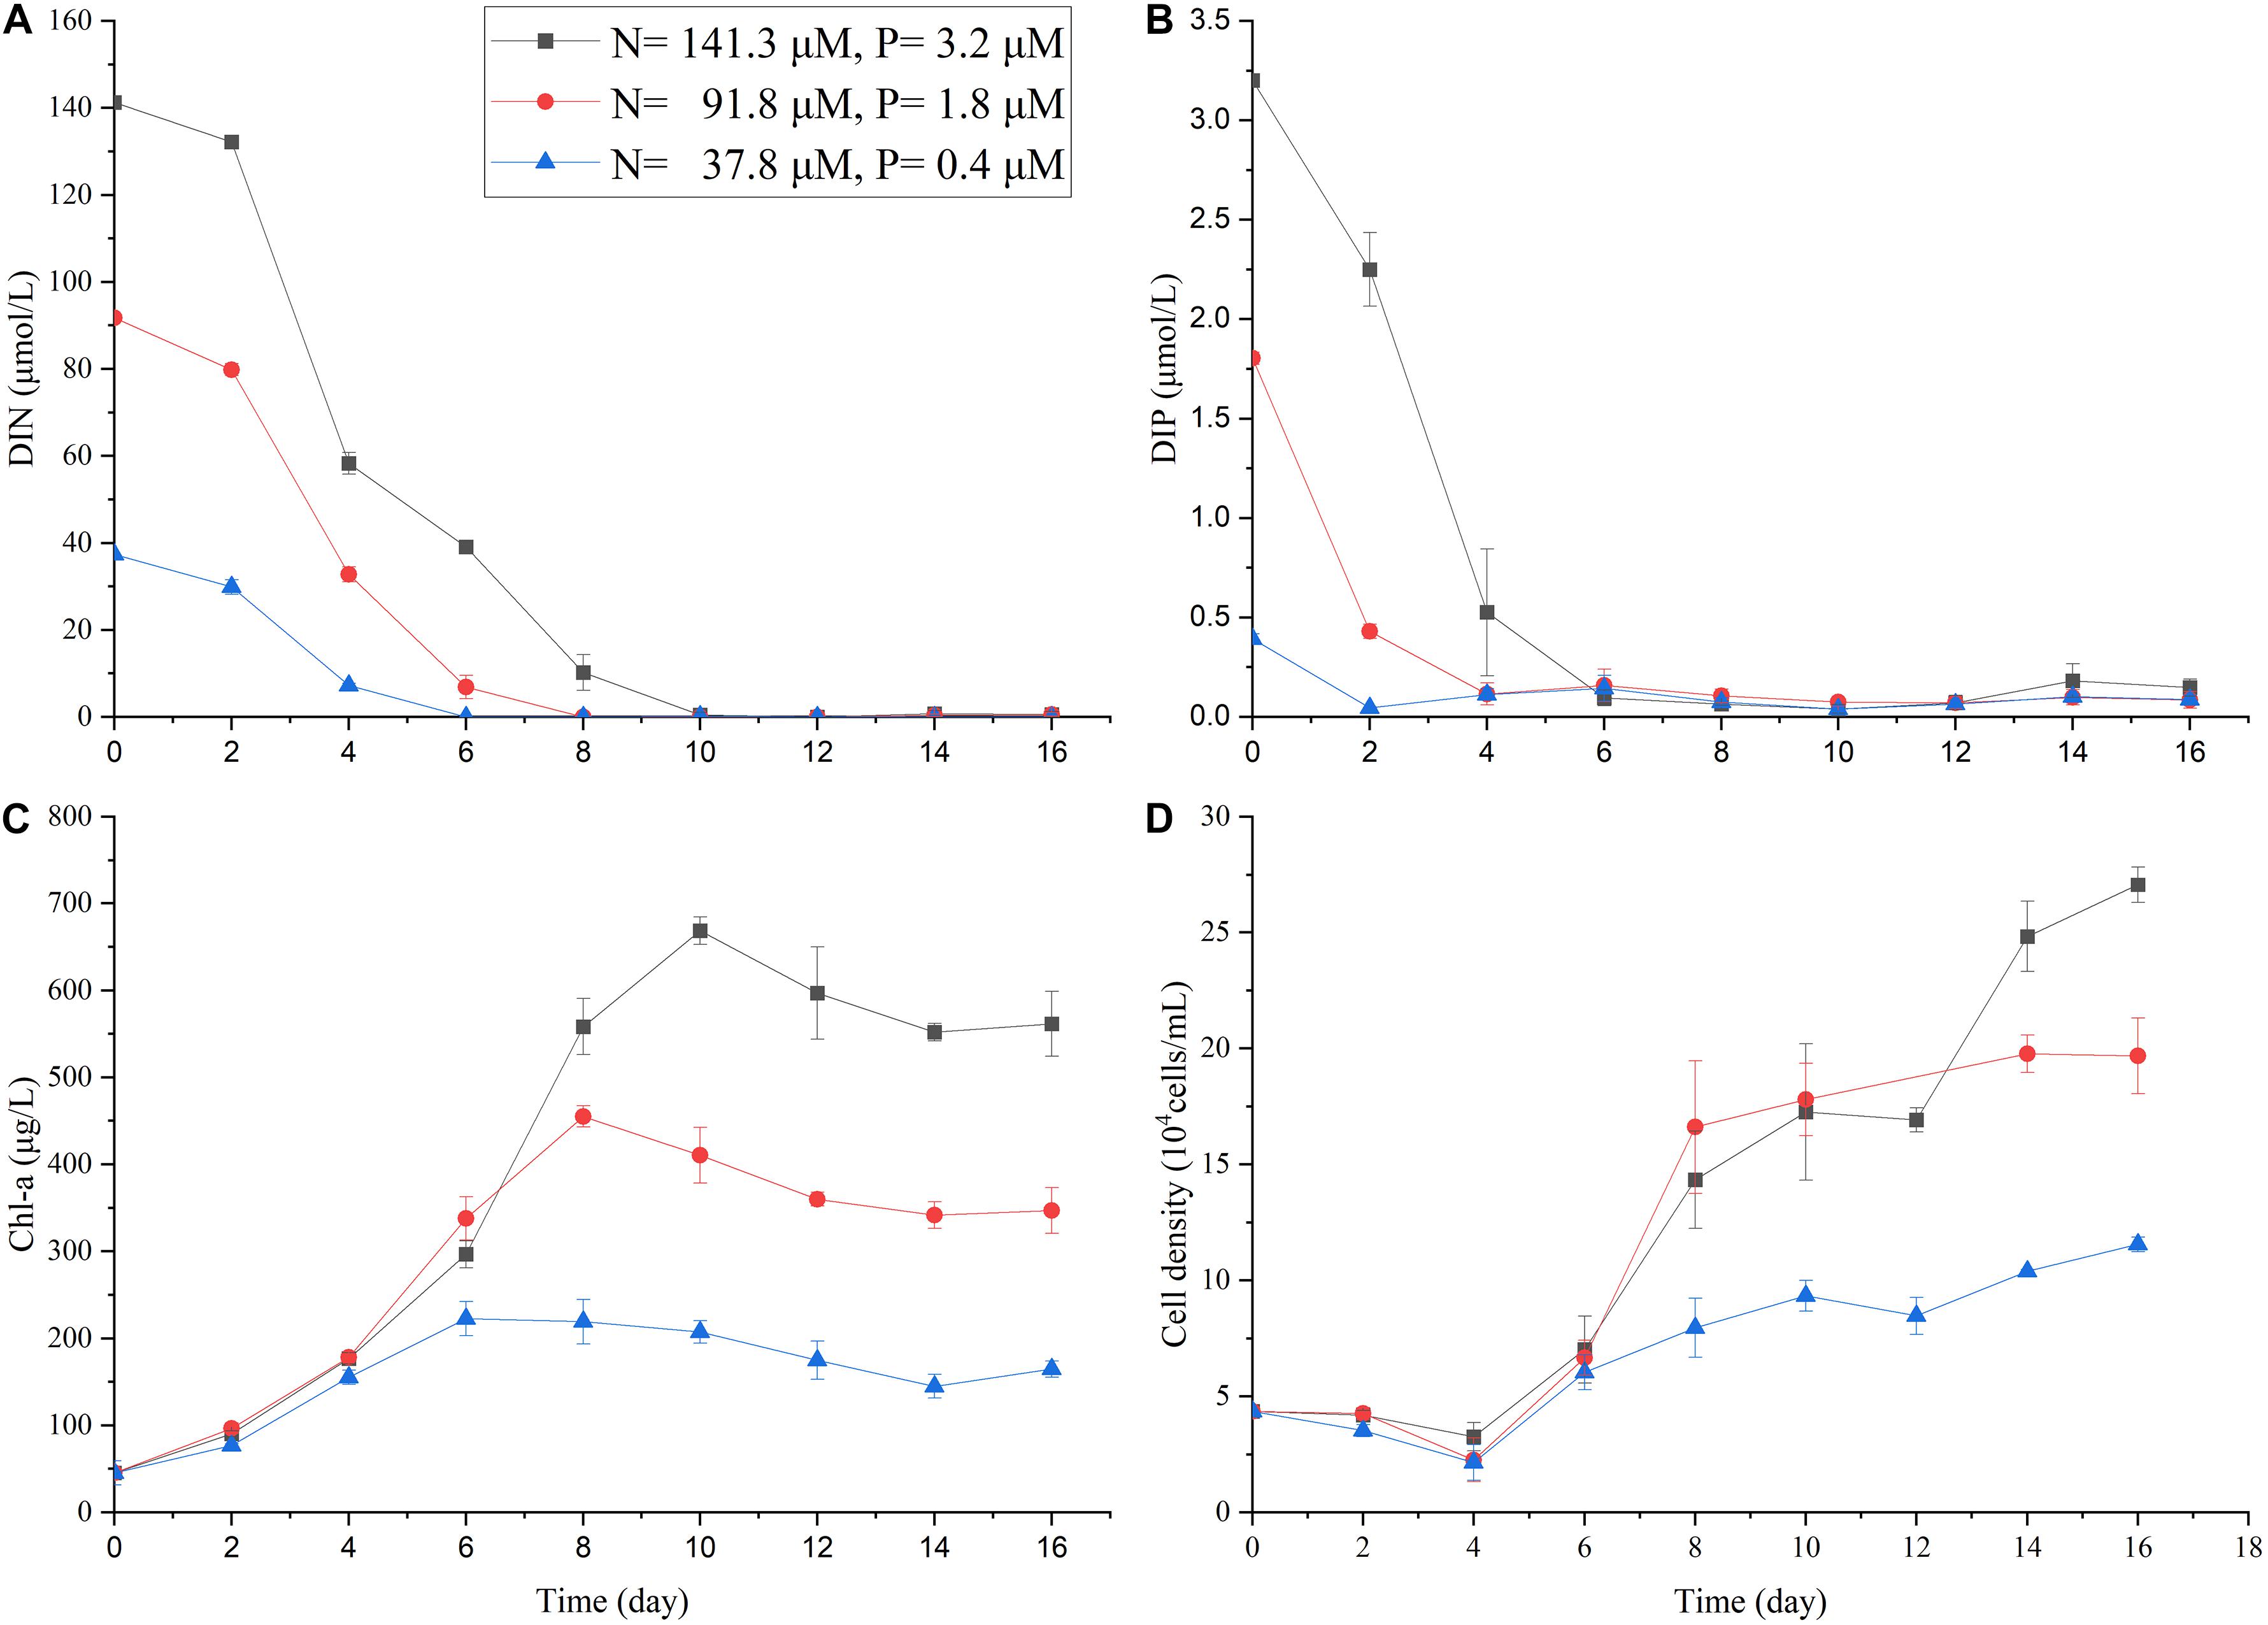
Figure 3. The changes in DIN (A), DIP (B), Chl-a concentration (C), and cell density of A. carterae (D) in the nutrient uptake experiment with three different nutrient concentrations. Other incubation conditions were the same as the single-factor nutrient experiment (SPM = 0 g/L, salinity = 30.5).
Single-Factor SPM Experiment
The presence of SPM attenuated the light in the culture medium. The negative logarithm of the observed light transmittance (T) showed a linear relationship with the concentration of SPM (CSPM): –ln(T) = 0.96∗CSPM (R2 = 0.99, figure not shown). Given the same nutritional and salinity conditions (DIN = 98.8 μM, DIP = 2.9 μM, salinity = 30.5), SPM significantly inhibited the growth of A. carterae and its inhibiting effect on CDmax increased with increasing CSPM (Figure 4A, level 8 to level 1 in Table 2). In general, the lag growth phase of A. carterae was prolonged as CSPM increased (Figure 4A), and higher CSPM also resulted in lower specific growth rate (μSPM decreased from level 8 to level 1 in Table 3). Because of the slow growth rates under high turbidity conditions, there was no “plateau” point observed in the treatments with CSPM higher than 1.6 g/L (Figure 4A). Furthermore, no significant growth of A. carterae was observed under the highest CSPM of 2.5 g/L (Figure 4A). The Weibull equation describing the inhibitory effect of SPM (Eq. 4) was simulated as:
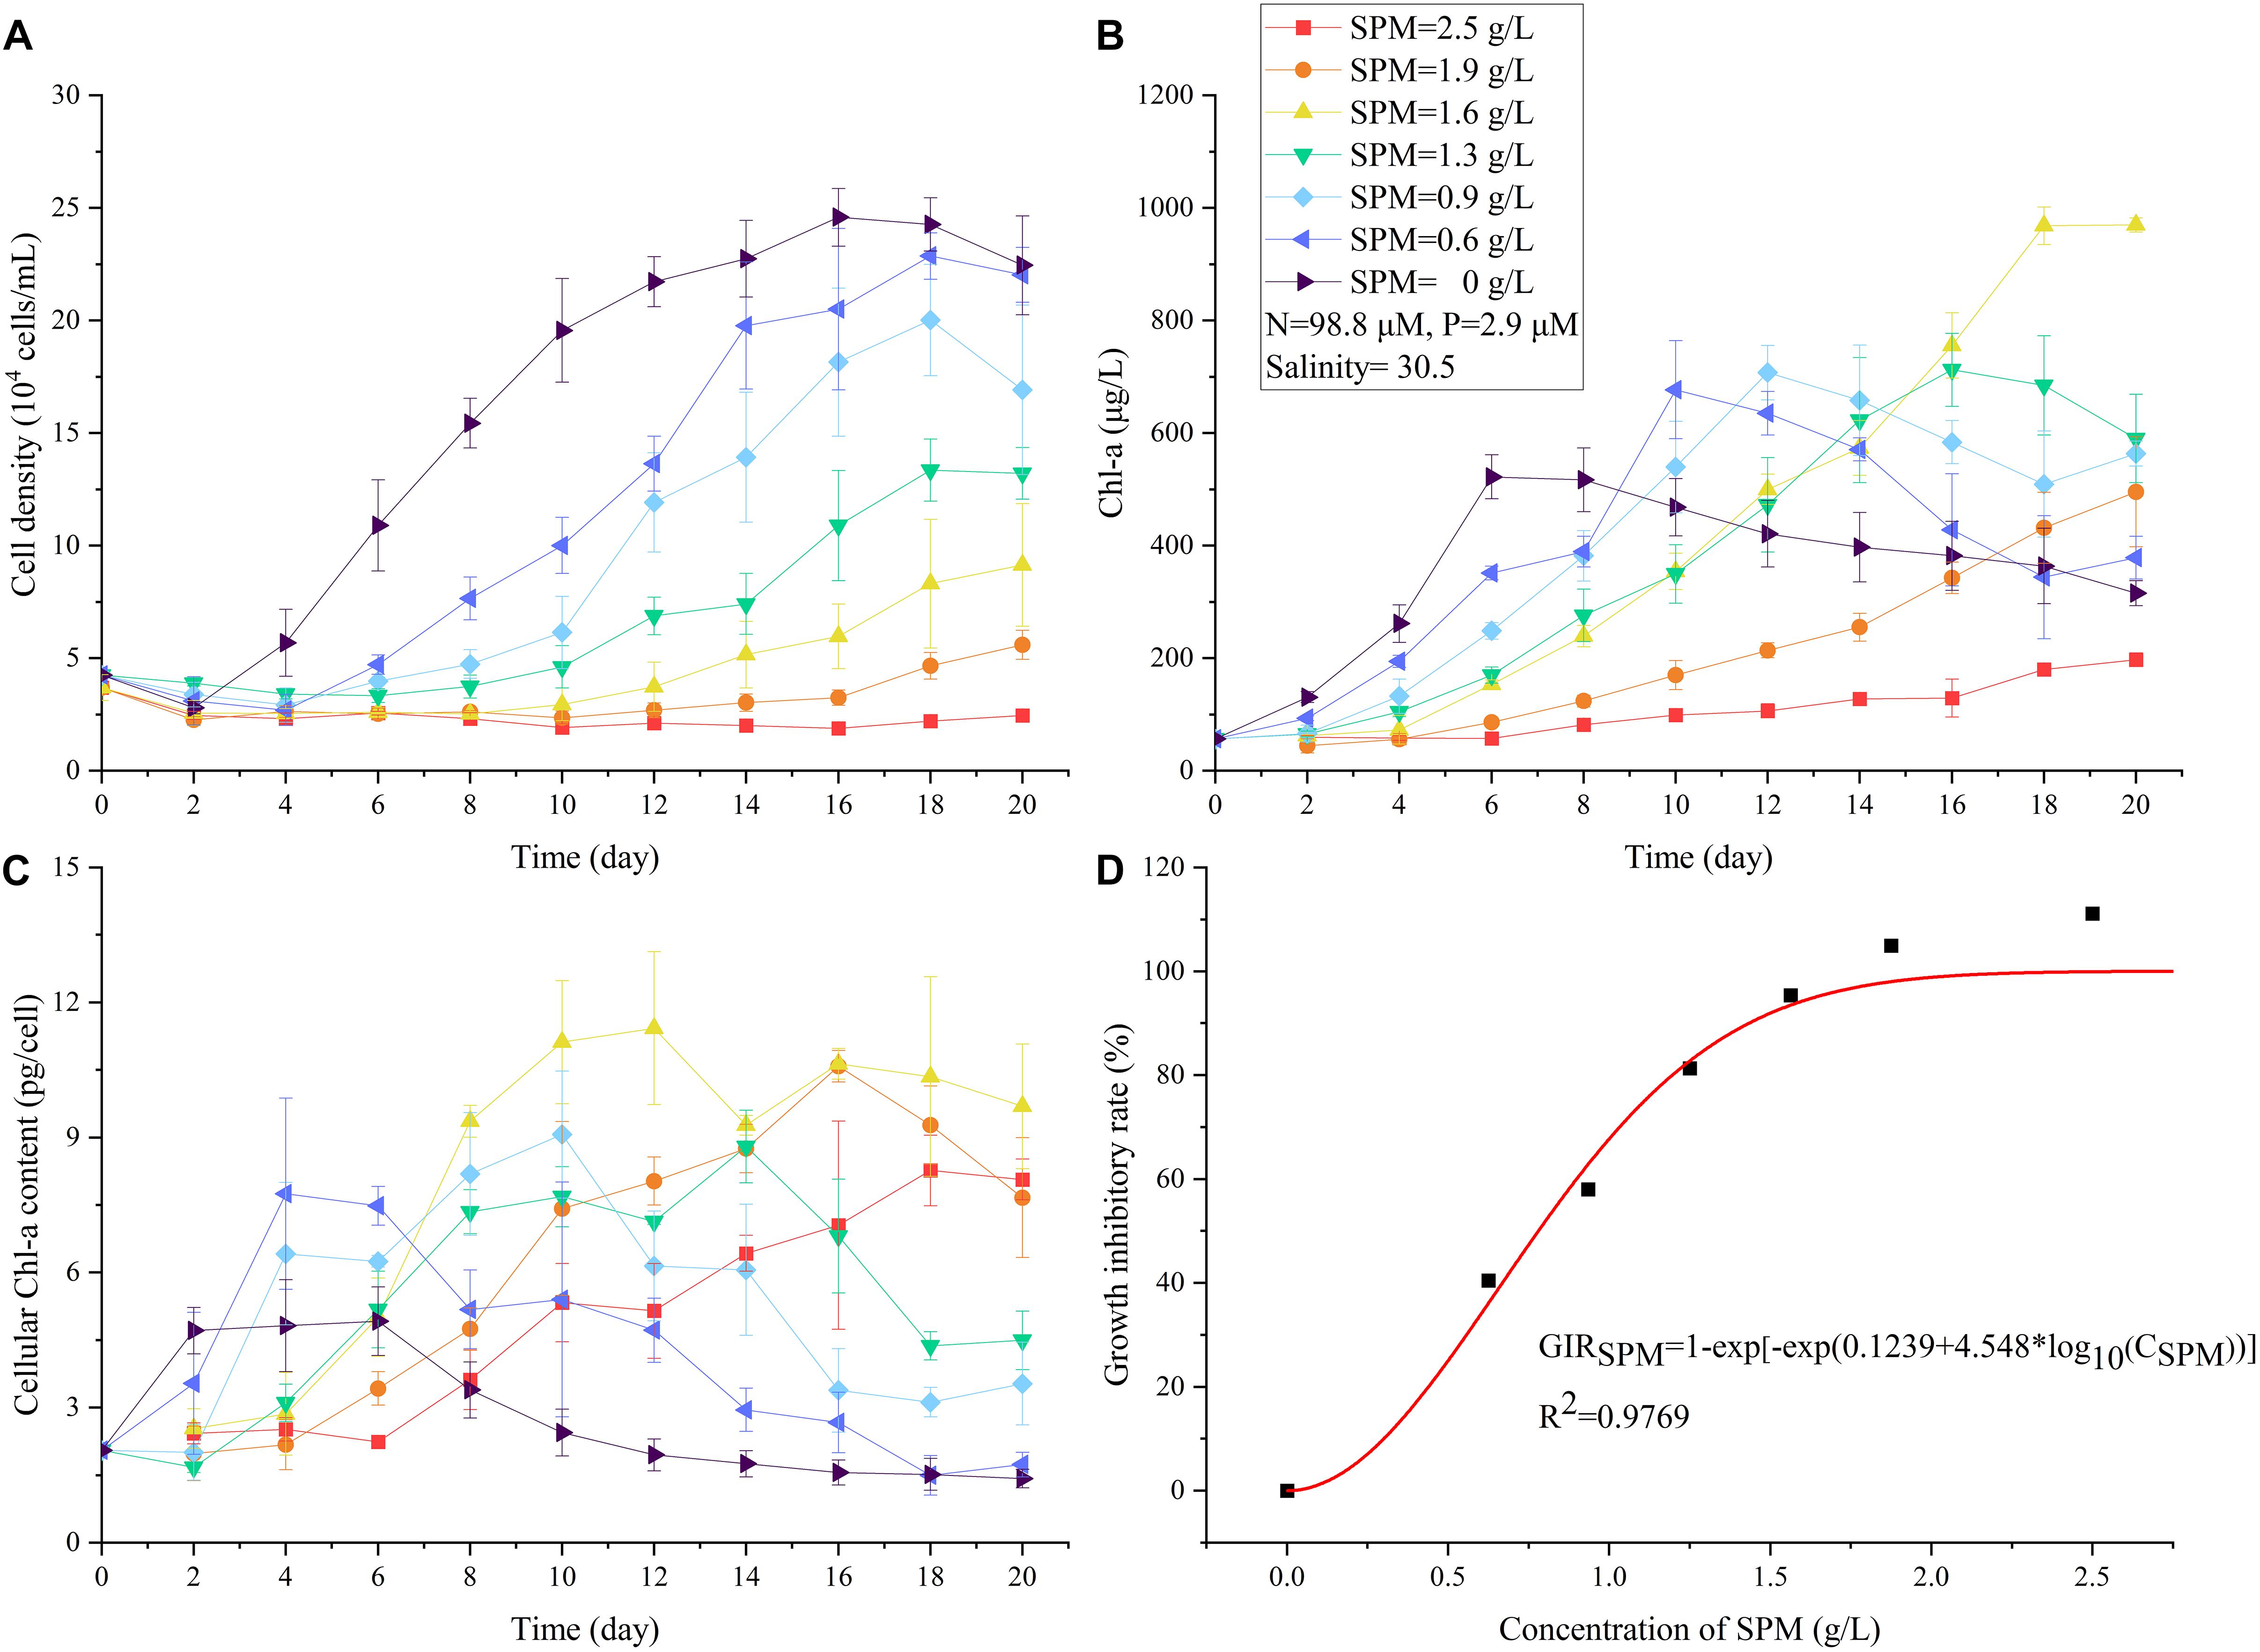
Figure 4. The changes in cell density (A), Chl-a concentration (B), cellular Chl-a content (C) of A. carterae under different SPM concentrations in the single-factor SPM experiment. The relationship between growth inhibitory rate (GIR) and concentration of SPM (D).
which suggested the increasing inhibitory effect with higher SPM exposure (Figure 4D, 0–111% of GIRSPM in Table 4). According to the evaluation of Weibull equation, the half maximal inhibitory concentration of SPM (IC50) of A. carterae was 0.78 g/L.
The response of cultural Chl-a was dramatically different from that of cell density (Figures 4A,B). In turbid environments, A. carterae preferred elevated Chl-a synthesis rather than cell division (Figures 4A,B). For instance, there was no significant increase in cell density under the highest CSPM of 2.5 g/L (Figure 4A) while Chl-a concentration increased steadily (Figure 4B). For these treatments which reached the stationary phase (CSPM ≤ 1.3 g/L), the maximum cultural Chl-a concentration Chlmax increased with increasing CSPM (Figure 4B and Table 5). Moreover, the time corresponding to Chlmax was delayed as CSPM increased (Figure 4B and Table 5). Regrading to the cellular Chl-a content, the values of Chlcell under high SPM conditions were significantly elevated when compared to the low SPM treatments (Figure 4C and Table 5).
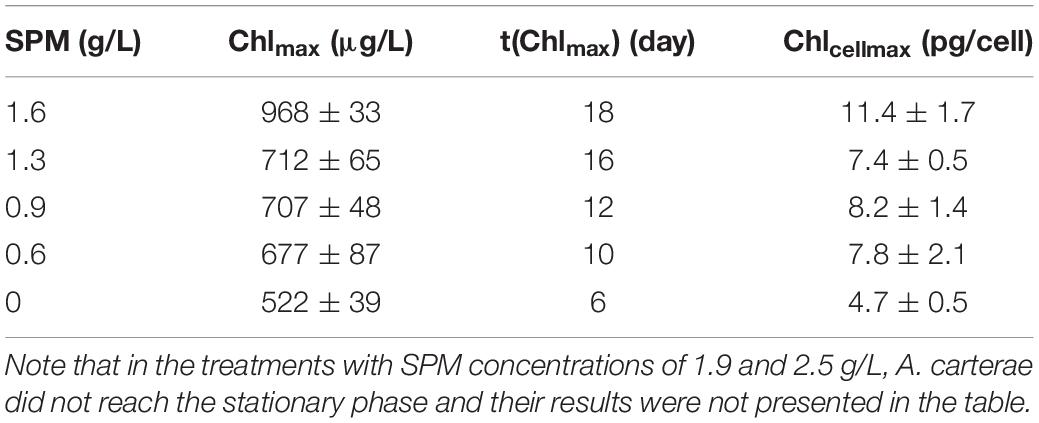
Table 5. The maximum Chl-a concentration (Chlmax), time of the occurrence of Chlmax [t(Chlmax)], and the maximum cellular Chl-a content (Chlcellmax) of A. carterae in the single-factor SPM experiment.
Two-Factor (SPM and Nutrient) Experiment
Comparing to the previous results when nutrient or SPM acted as the single affecting factor (Figures 2, 4), more suppressive effects on cell density and Chl-a concentration were observed in the two-factor experiment (Figures 5, 6A). In the treatment with the highest concentrations of nutrient and SPM (level 1: SPM = 2.5 g/L, DIN = 98.8 μM, DIP = 2.9 μM), A. carterae survived but showing no growth response (Figure 5A). Similar values of CDmax were observed in the treatments with intermedium concentrations of nutrient and SPM (Figures 5A, 6A). The highest specific growth rates under the combined control of SPM and nutrient (μSPM+nut in Table 3) was 0.18 ± 0.03 d–1 (level 6: SPM = 0.6 g/L, DIN = 24.7 μM, DIP = 0.6 μM). The interactive effect of SPM and nutrient on specific growth rate can be well-explained by the comparative effect model (Figure 6B and Table 3): SPM was the dominant control under the high turbidity conditions of levels 1–6 when SPM > 0.9 g/L, while nutrient took over under low nutrient conditions on levels 7 and 8 (DIN < 12.4 μM, DIP < 0.6 μM). On the perspective of the interactive effect of nutrient and SPM on the GIR (Figure 7), GIRSPM+nut obtained in the two-factor experiment generally agreed with the GIRmul predicted from the multiplicative effect model (Eq. 7). The patterns of the variations of Chl-a concentration and Chlcell in the two-factor experiment (Figures 5B,C) were similar to those observed in the single-factor SPM experiment (Figures 4B,C), whereas the values of Chlmax and Chlcell differed because of the differences in nutrient concentrations.
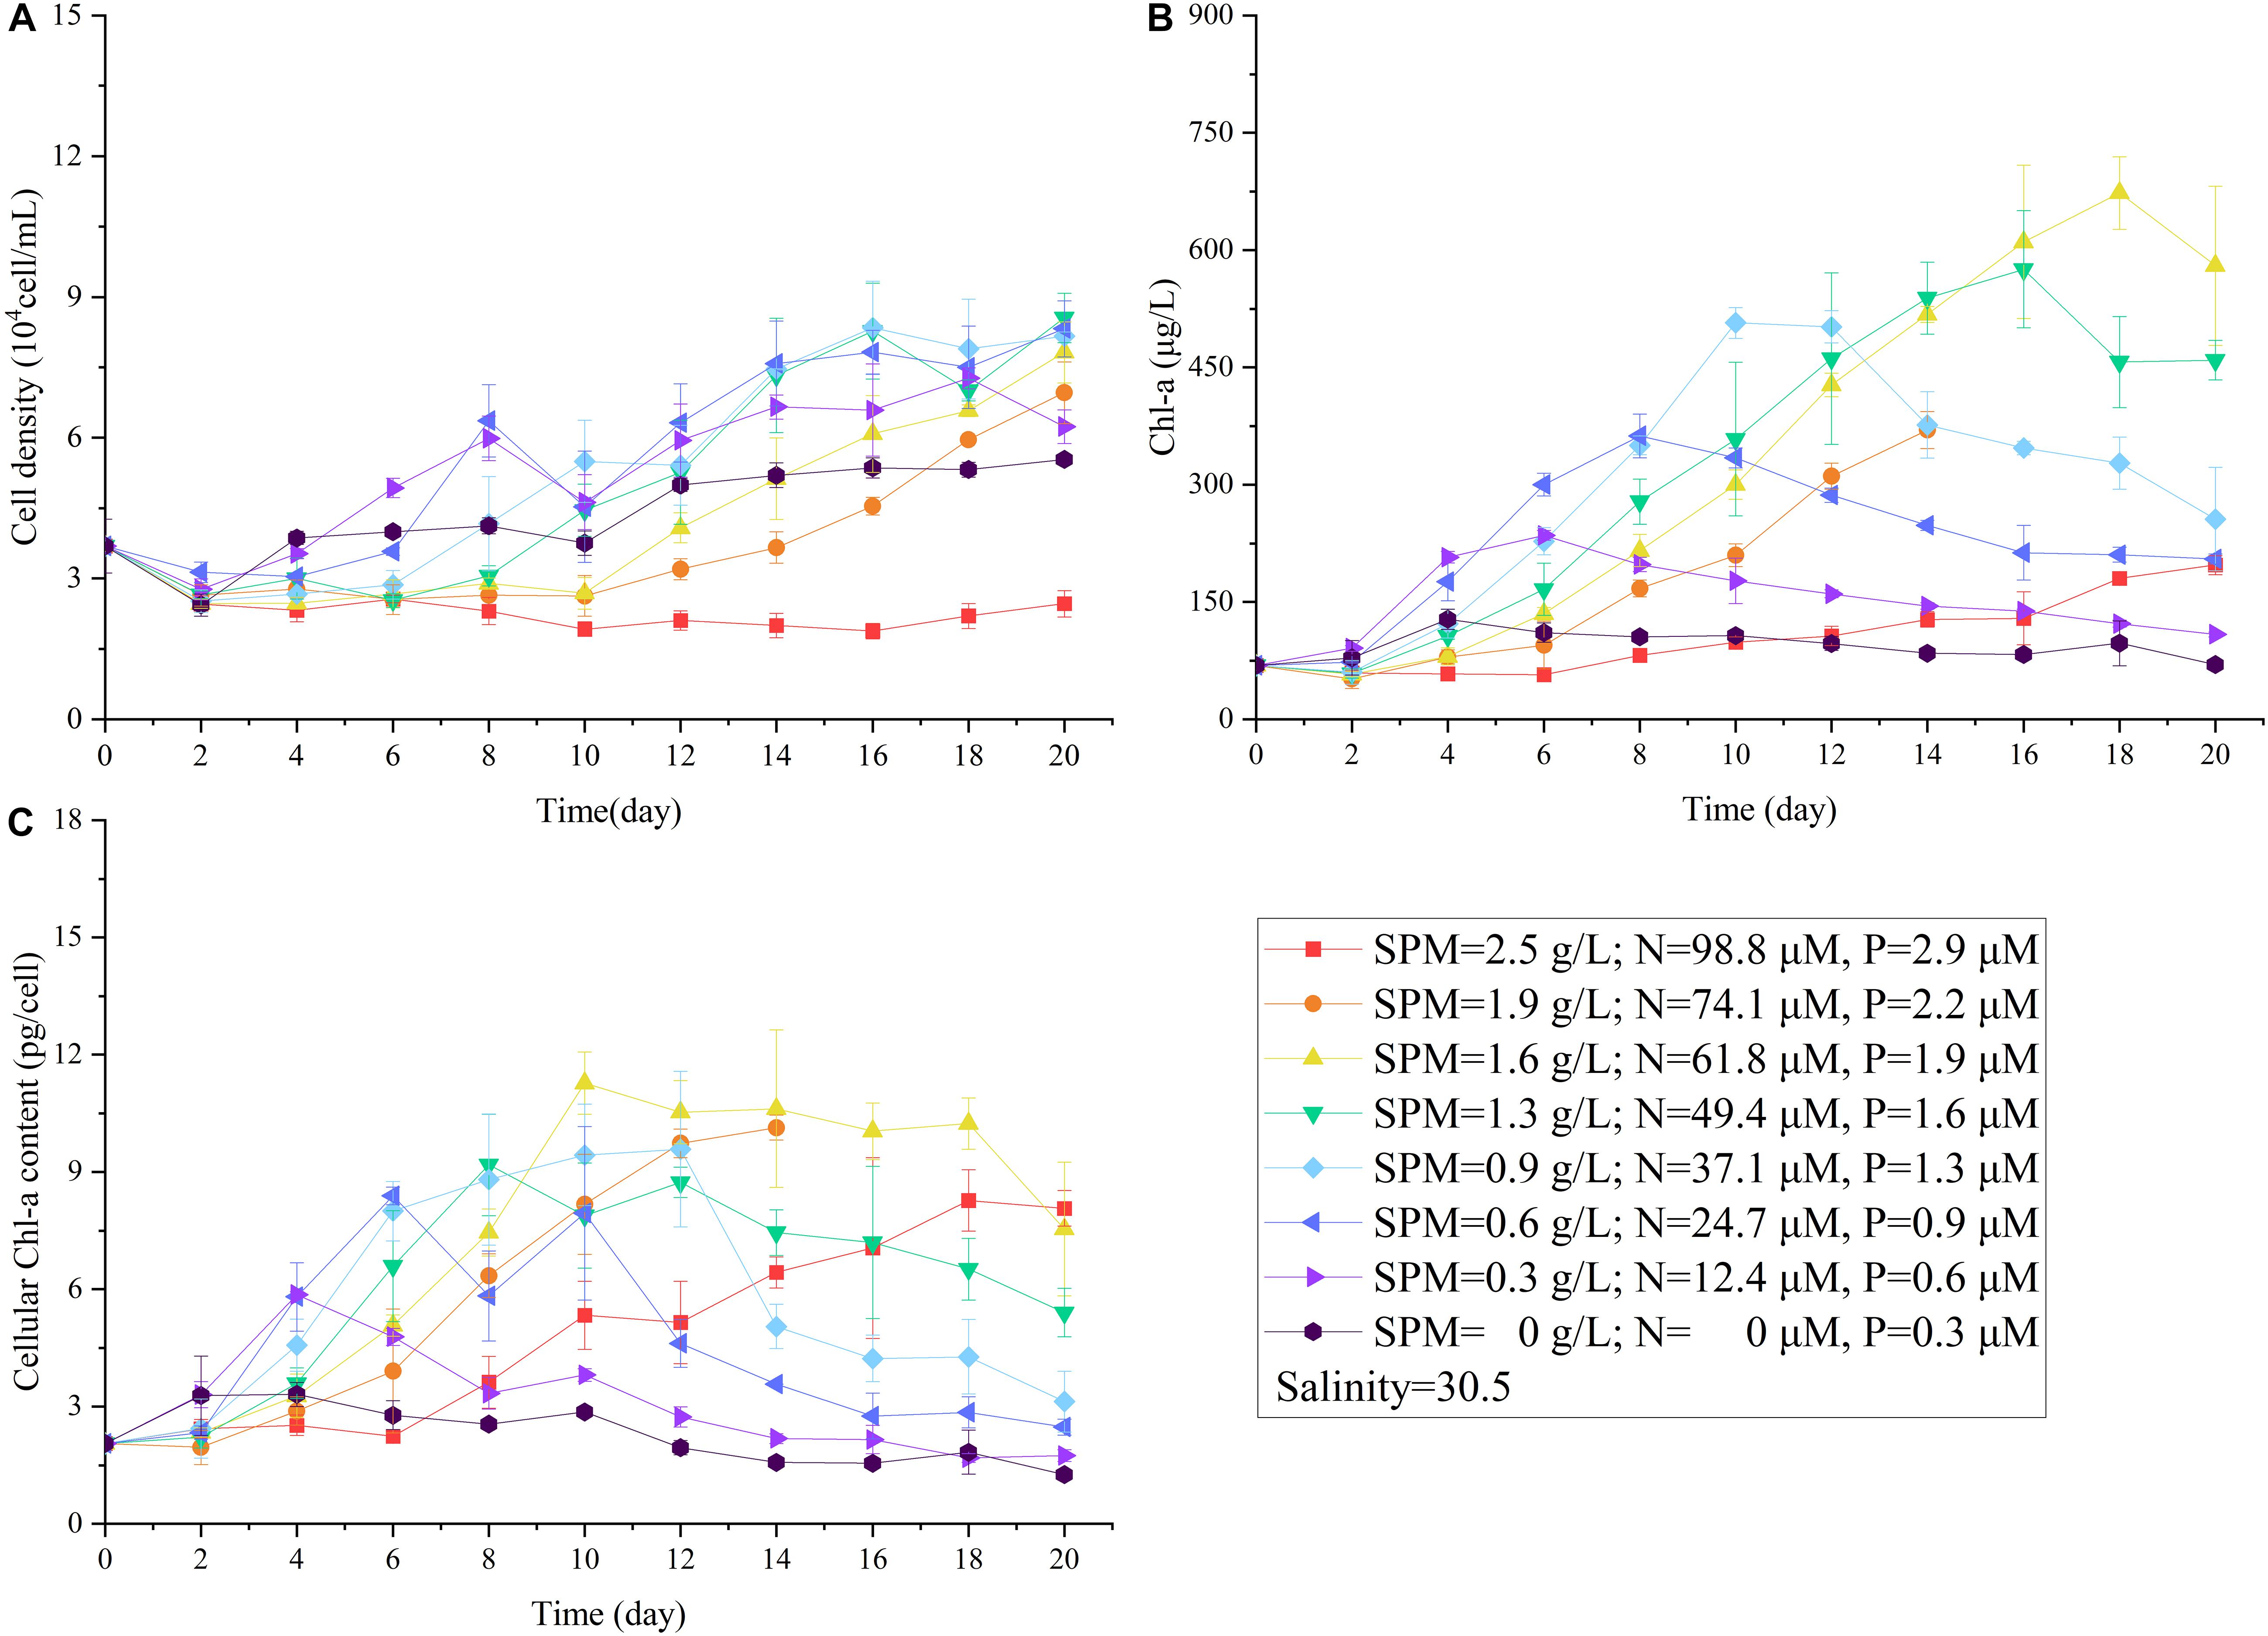
Figure 5. The changes in cell density (A), Chl-a concentration (B), cellular Chl-a content (C) of A. carterae under different concentrations of nutrient and SPM in the two-factor (SPM and nutrient) experiment.
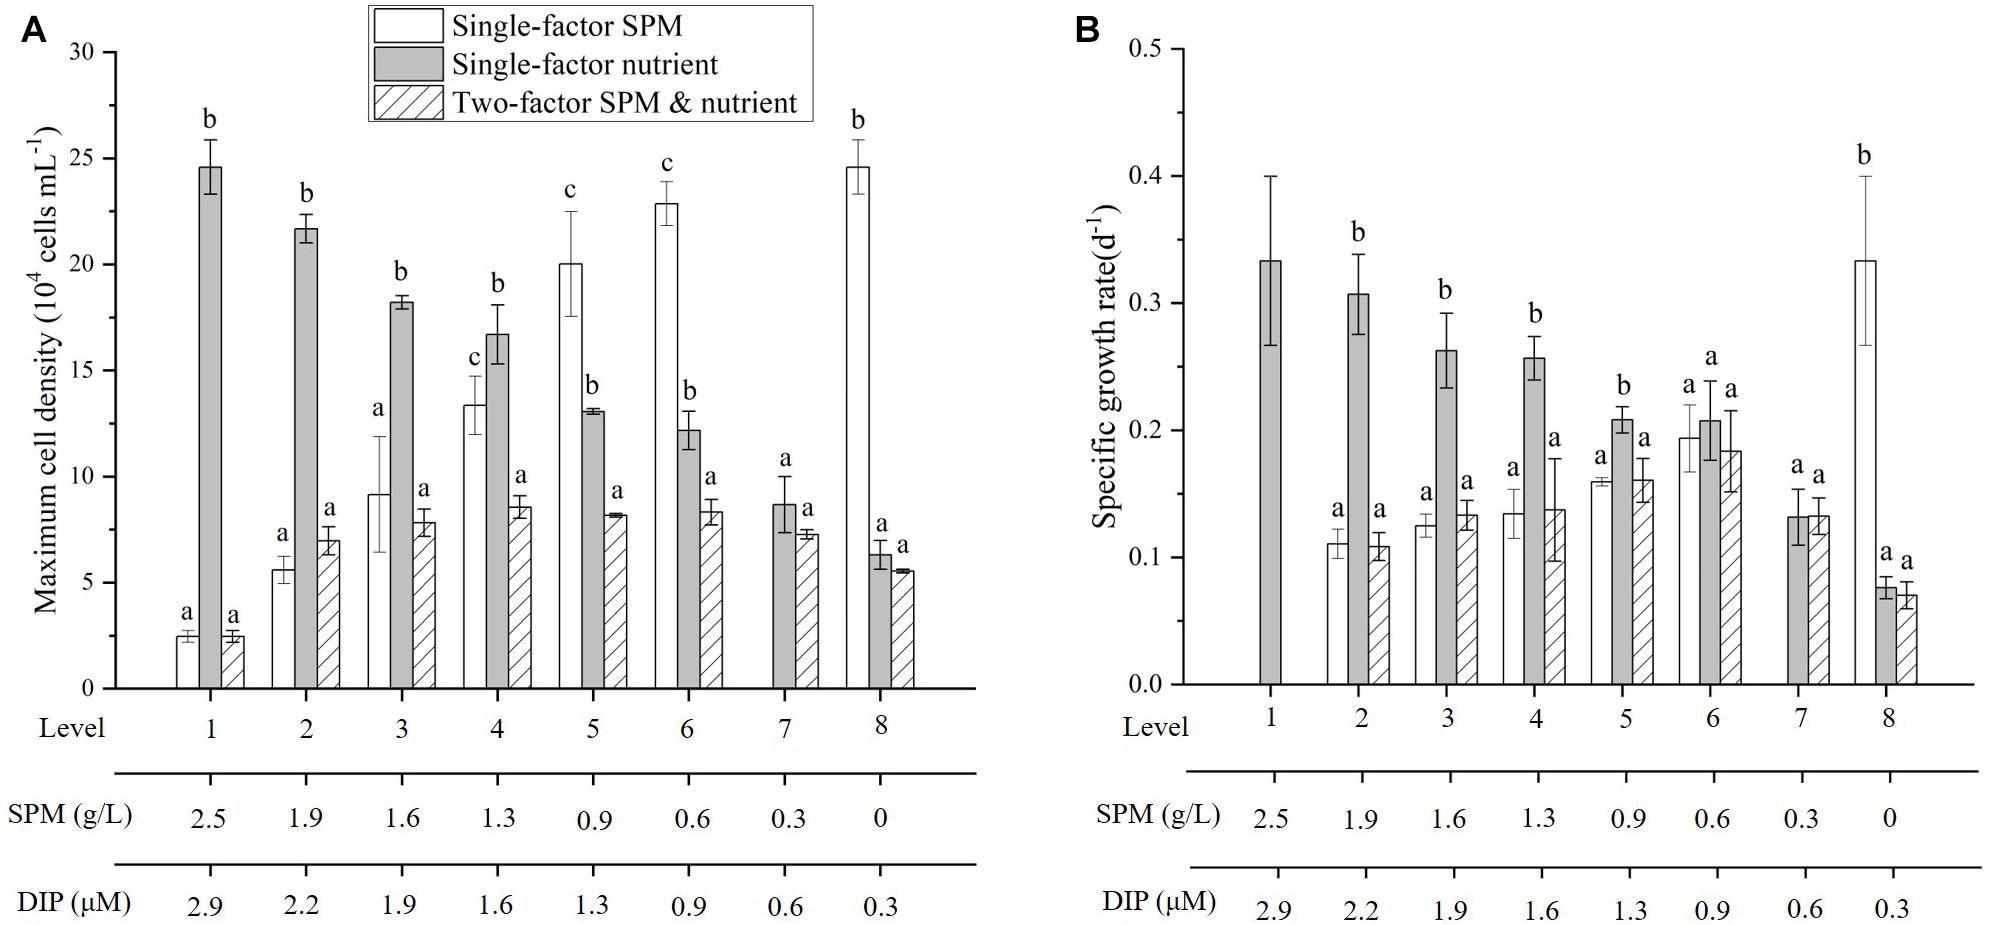
Figure 6. Comparison of maximum cell density (A) and specific growth rate (B) of A. carterae in the single-factor and two-factor experiments. Different letters (a, b, c) indicate significant differences among treatments when compared to the two-factor experiment.
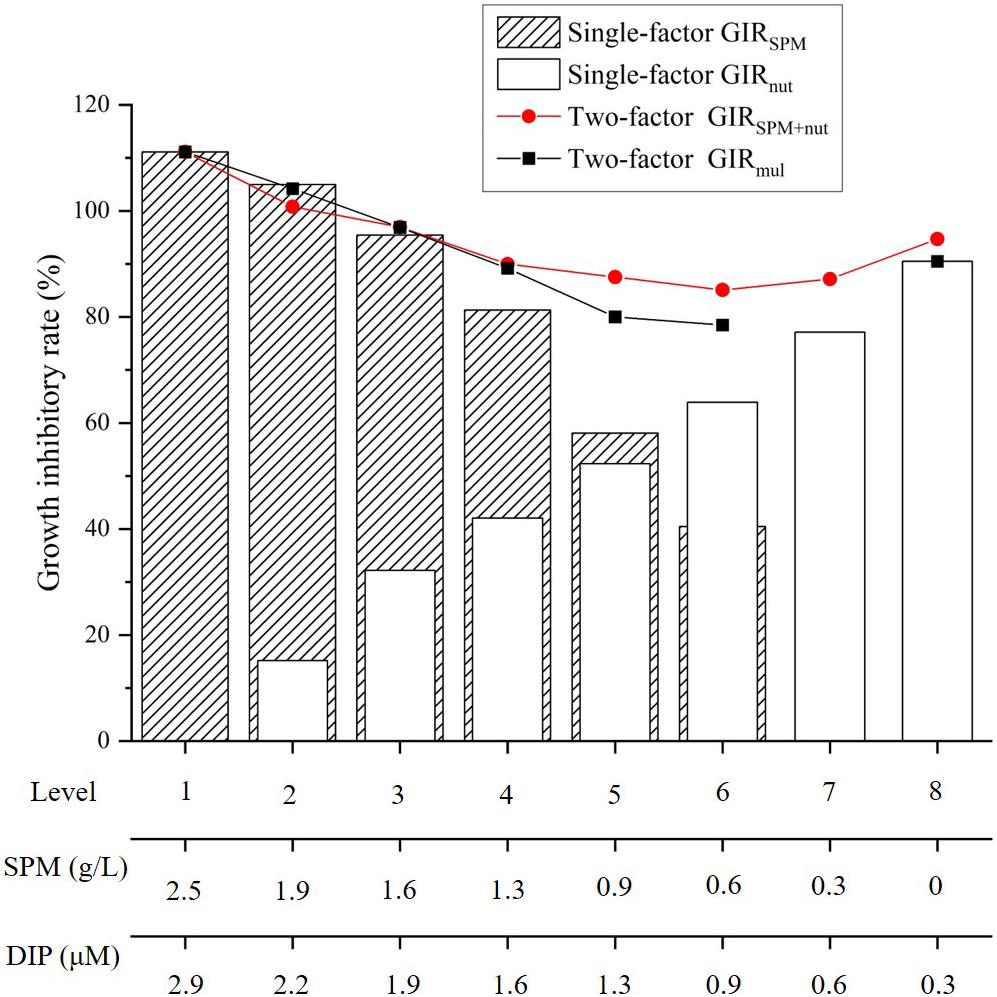
Figure 7. Growth inhibitory rate in the single-factor nutrient experiment (GIRnut), single-factor SPM experiment (GIRSPM), and two-factor experiment (GIRSPM+nut). The black dots represent the GIR predicted from the multiplicative effect of SPM and nutrient (GIRmul).
Three-Factor (SPM, Nutrient, and Salinity) Experiment
Salinity was added as an additional influence factor in the three-factor experiment (Figure 8 and Tables 2, 3) while other conditions remained the same as the two-factor experiment. The result showed that A. carterae could not survive when salinity was below 13.4 (cell density = 0). The inhibiting effect of salinity on CDmax and specific growth rate was observed in the treatment with salinity = 17.8 (Figure 9 and Tables 2, 3). However, there were no significant differences between the results of the two-factor and three-factor experiments when salinity ≥ 22.3 (p > 0.05, Figure 9), indicating the little salinity impact on the growth of A. carterae under high salinity conditions.
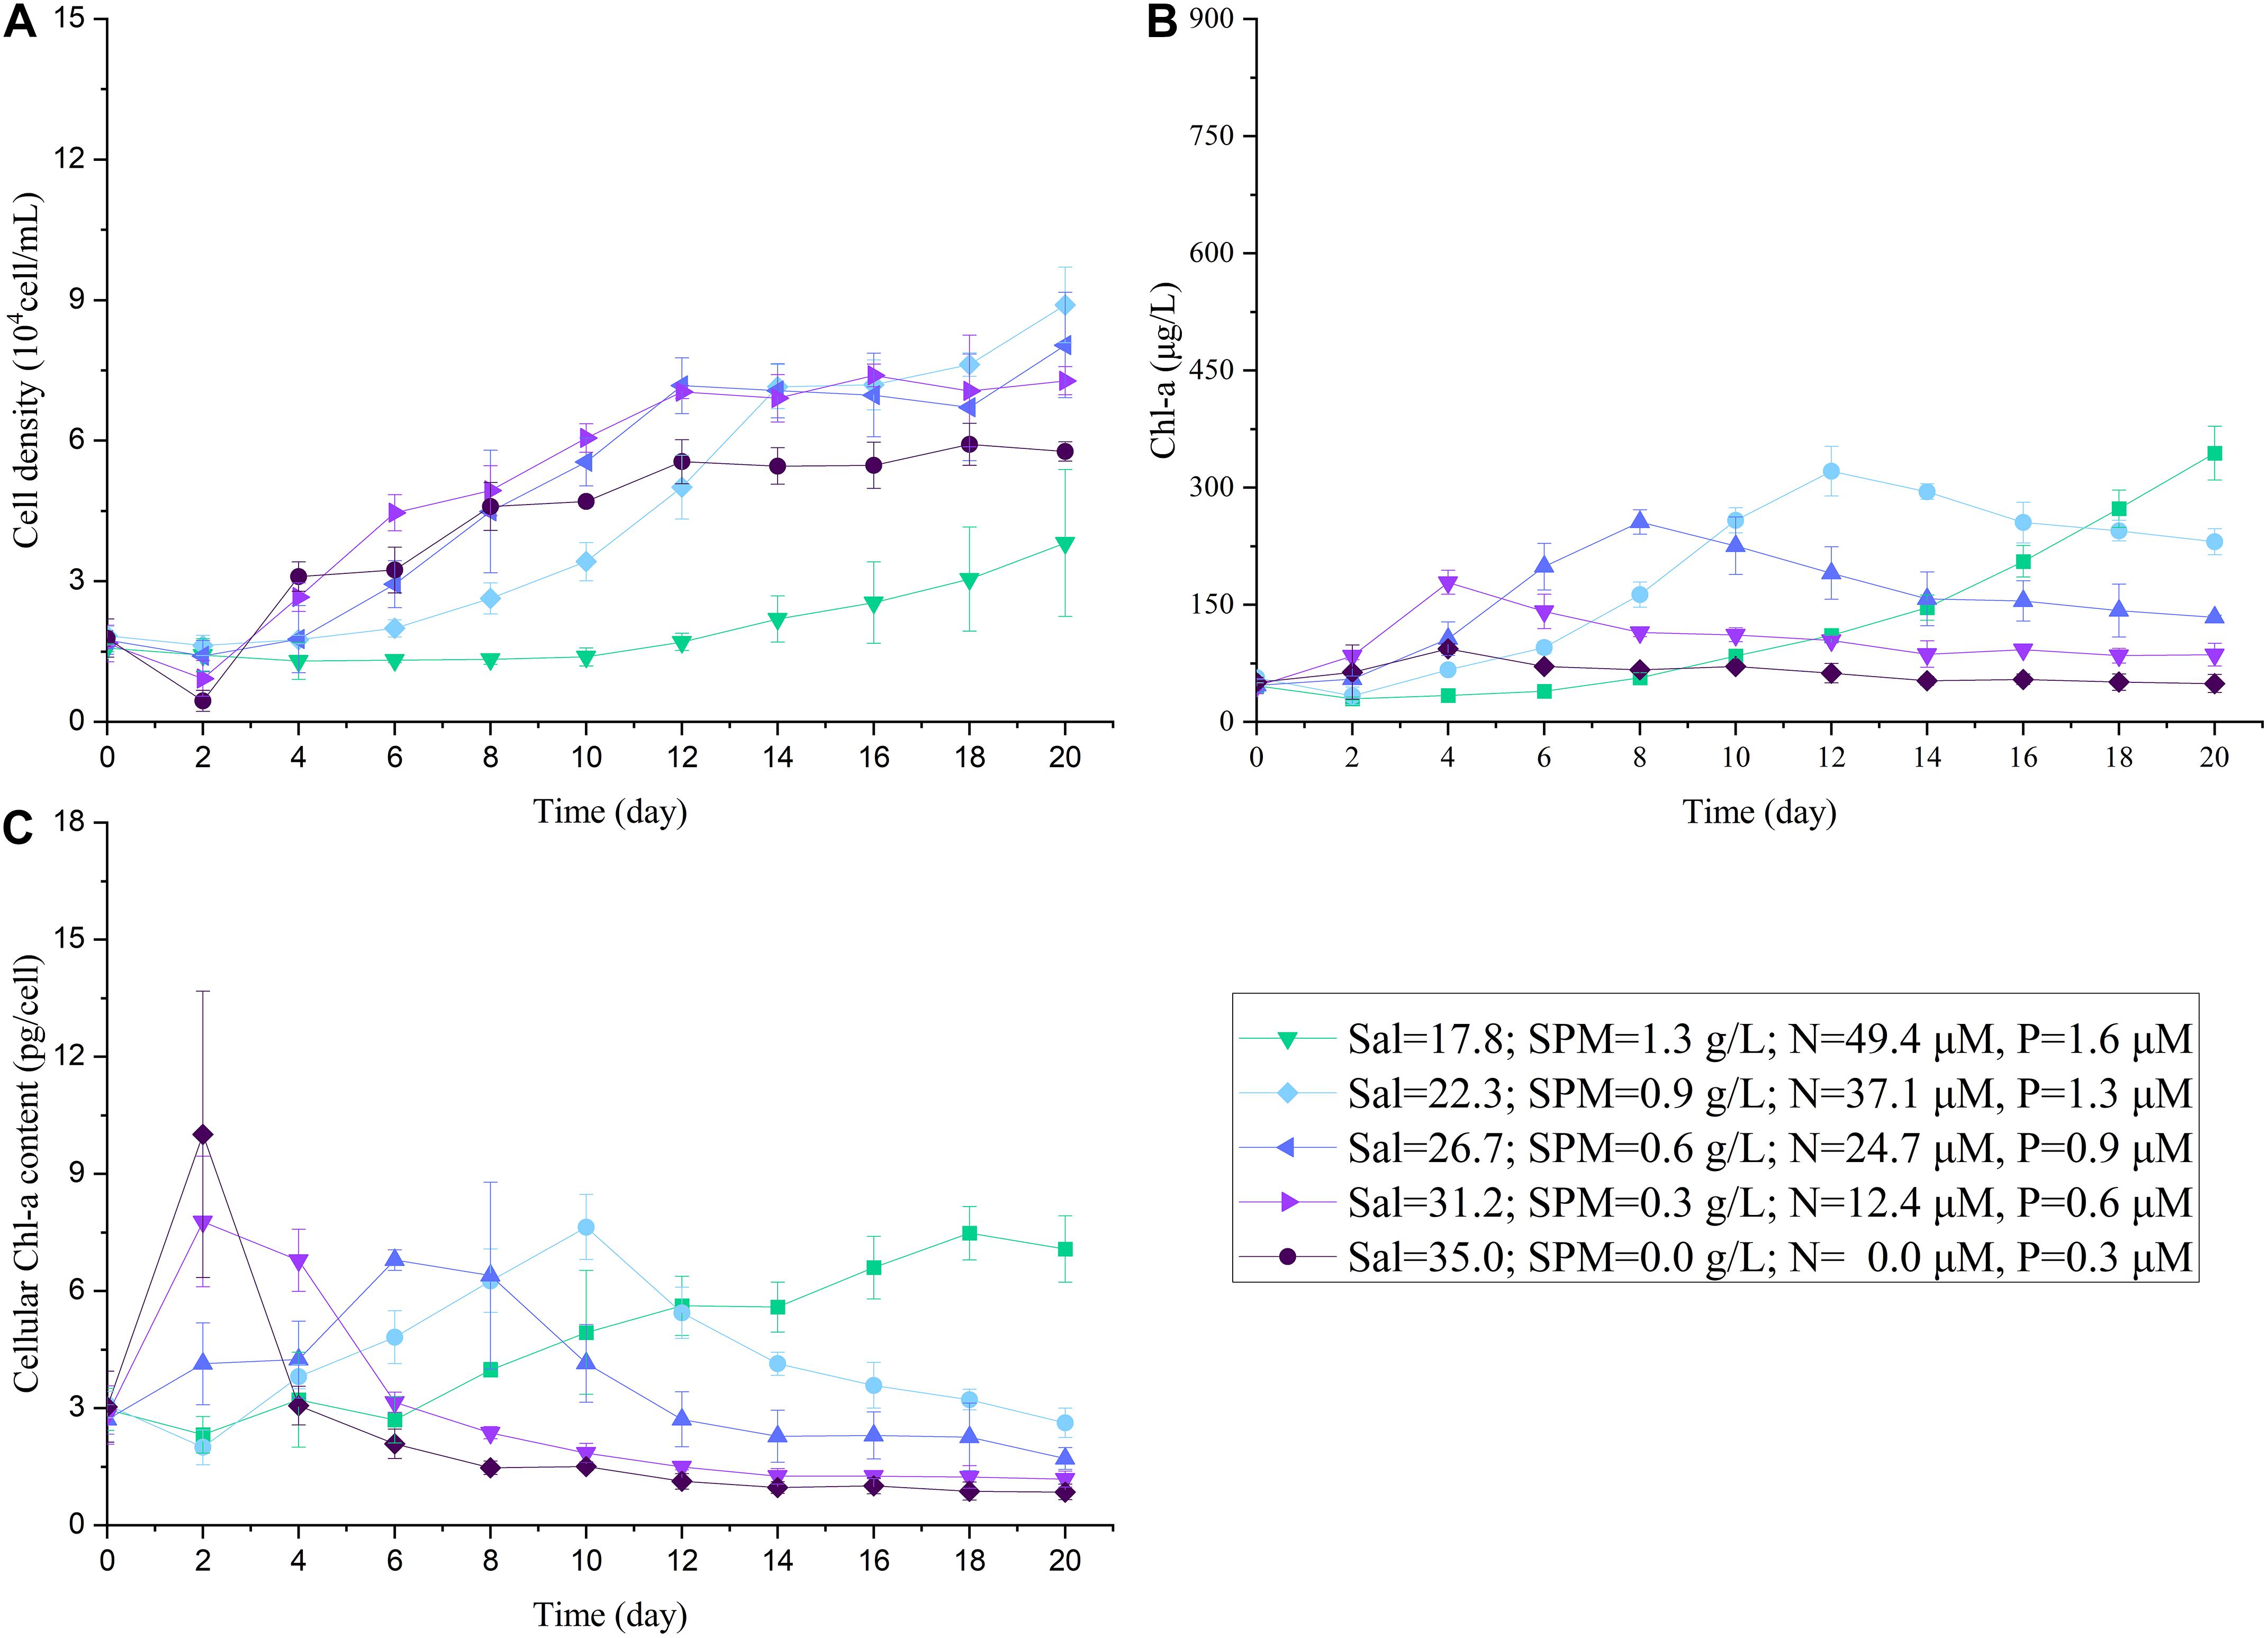
Figure 8. The changes in cell density (A), Chl-a concentration (B), cellular Chl-a content (C) of A. carterae under different salinity and concentrations of nutrient and SPM in the three-factor (SPM, nutrient, and salinity) experiment.
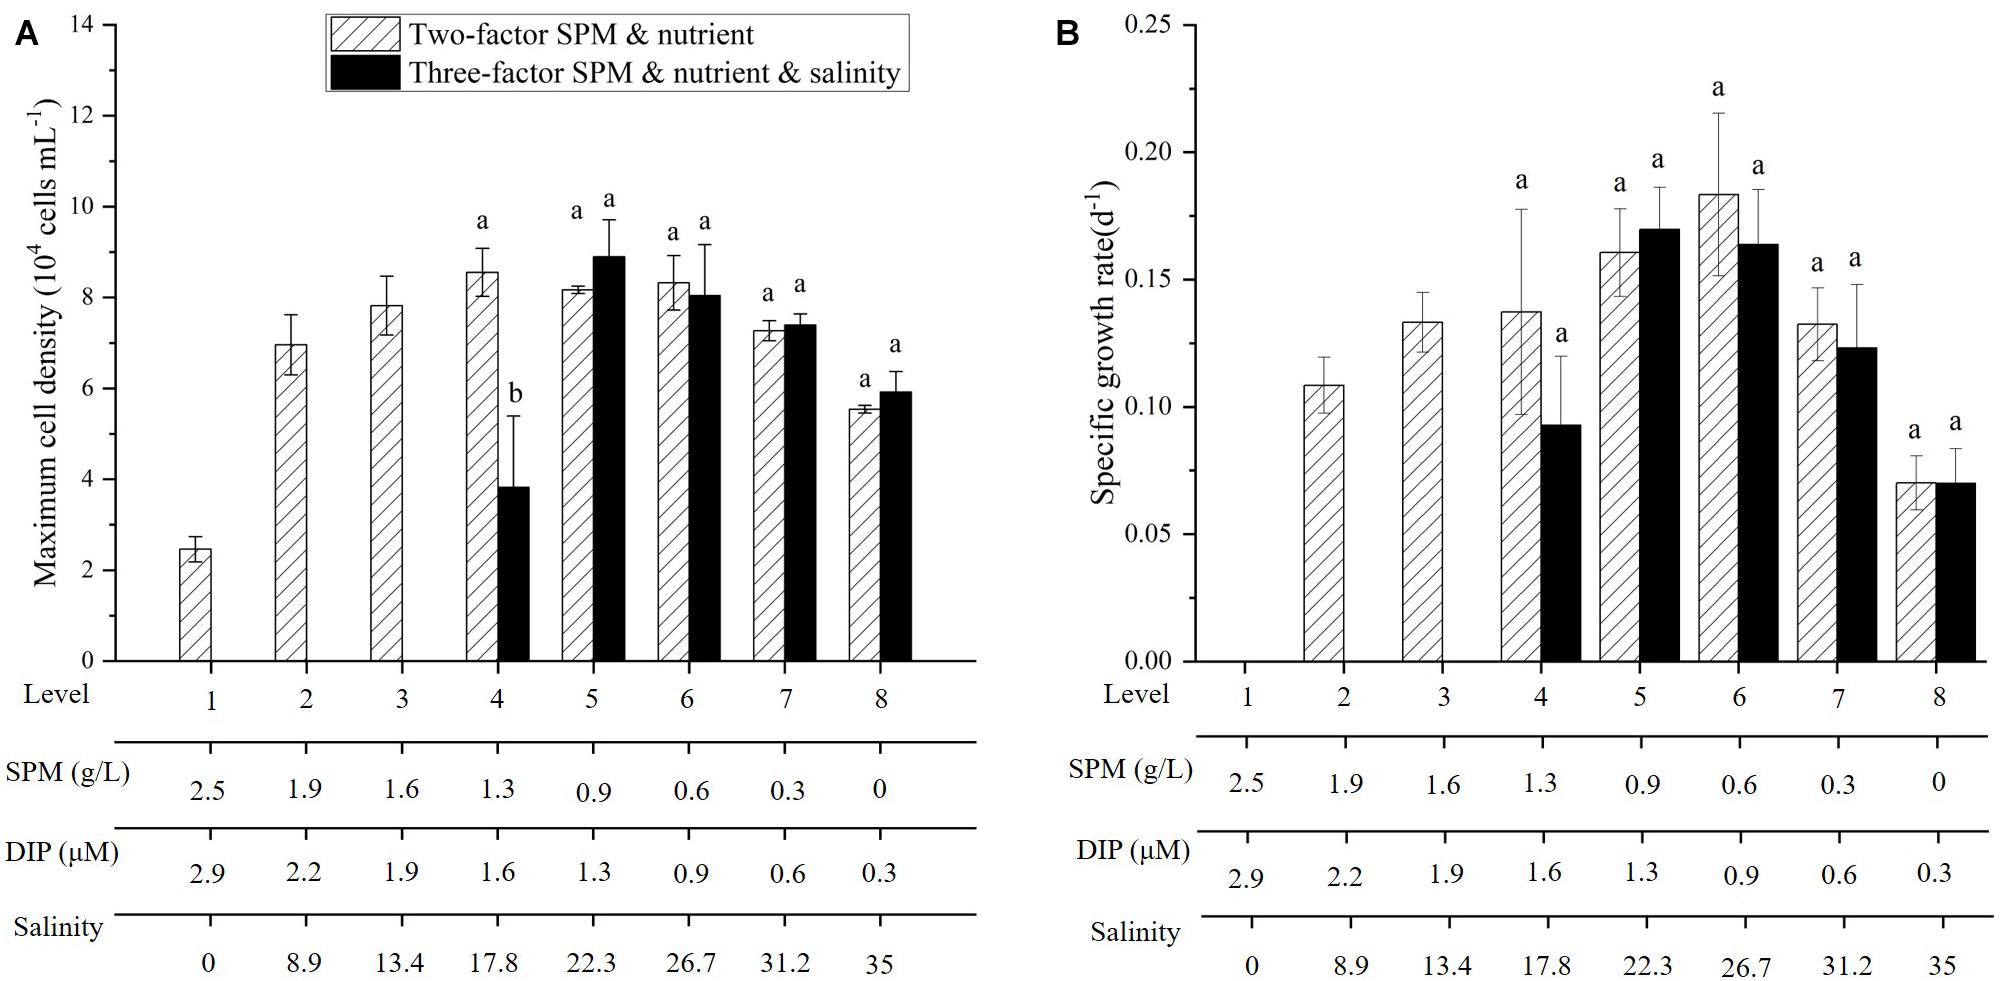
Figure 9. Comparison of maximum cell density (A) and specific growth rate (B) of A. carterae in the two-factor and three-factor experiments. Different letters (a, b) indicate significant differences among treatments when compared to the two-factor experiment.
Discussion
SPM Effects on Chl-a
Chl-a was commonly used as an important indicator of photosynthetic activity and phytoplankton abundance. Flynn et al. (1994) argued that the variability of cellular chlorophyll content severely limited its usefulness in following algal growth dynamics in terms of cell numbers. In clear water, the results of our single-factor nutrient experiment (section “Single-Factor Nutrient Experiment”) showed that the cellular Chl-a content of A. carterae was elevated during the exponential phase but remained relatively constant when reaching the stationary phase (Figure 2C). Because of the constant cellular Chl-a content which was independent of nutrient concentration, there was a positive correlation between Chl-a and cell density (Figures 2A,B). In this case, Chl-a concentration can be used as a good indicator for the cell abundance of A. carterae (Figures 2A,B). In contrast, A. carterae in turbid environment in the single-factor SPM experiment (section “Single-Factor SPM Experiment”) tended to synthesis more Chl-a and proliferate less given the same nutritional condition (Figures 4A,B). The increased cellular chlorophyll content results from photo-acclimation (Laws and Bannister, 1980; Gilbes et al., 1996; Tong et al., 2016), as a physiological adaptation of phototrophs to light attenuation, resulted in the decoupling of cell density and Chl-a (Figures 4A,B). Unlike in clear water, the varying cellular Chl-a content under different SPM conditions indicated that Chl-a concentration may not be a reliable indicator for phytoplankton abundance in turbid environments.
SPM Effects on Algae Growth
In our study, the influence of SPM on the growth of A. carterae was mostly related to the light attenuation (Kirk, 1985; Pierson et al., 2003; Bowers et al., 2009; Peng et al., 2009; Niimura et al., 2010; Liu et al., 2013a), which negatively affect the nutrient uptake and growth of algae (Litchman et al., 2004; Shi et al., 2015; Minggat et al., 2021). Previous studies on phytoplankton growth mostly focused on the exponential phase while the lag growth phase was not fully considered. Our results of the single-factor SPM experiment suggested that A. carterae in turbid water were not only restricted in the specific growth rate, but also took longer time to adapt to the high turbidity environment (section “Single-Factor SPM Experiment”). The extended lag growth phase was related to the need for more Chl-a synthesis under high SPM conditions. The extension of growth cycle and inhibited growth rate indicated that SPM could delay and weaken the nutrient assimilation of A. carterae in turbid water. Neglect of the extended lag growth period would therefore underestimate the suppressive effect of SPM on phytoplankton growth and productivity.
In contrast to specific growth rate which only reflects the growth characteristics in logarithmic phase, GIR considers the whole growth curve including the lag growth phase. Therefore, GIR better evaluates the inhibitory effects of environmental variables when SPM is involved. Liu et al. (2013a) investigated the inhibitory effects of suspended particles on the GIRs of two dominant phytoplankton species in Bohai Bay (Phaeodactylum tricornutum Bohlin and Gymnodinium sp.). Similar to the findings of present study, their results suggested that increase in the SPM concentration (0–0.8 g/L) resulted in significant decrease in the maximum cell densities and the specific growth rates of these two species. Our study covered a wider range of SPM concentration (0–2.5 g/L) providing a better fit for the Weibull equation (Figure 4D). IC50 derived from the Weibull equation indicates the tolerance of the species to SPM, with higher value of IC50 corresponds to higher tolerance. The IC50 of A. carterae (0.78 g/L, this study) was a bit higher than that of Gymnodinium sp. (0.68 g/L, Liu et al., 2013a), but lower than P. tricornutum (1.07 g/L, Liu et al., 2013a). The differences in tolerance to SPM among phytoplankton species may play an important role in affecting the phytoplankton community structure in estuaries. Those species which are more adapted to turbid environments may have the advantage to response firstly and more quickly to riverine nutrient inputs.
Limitations of This Work
In this study, we simulated the gradients of nutrient, SPM, and salinity covering the ranges of these variables as observed in large estuaries (Table 1). It should be pointed out that the setting of concentrations of nutrient and SPM at different salinities only considered the influence of two end-member mixing scheme. However, there are many physical and biogeochemical processes that can drive nutrient and SPM to be deviated from the conservative mixing-induced concentrations. For instance, the settlement of SPM and biological uptake of nutrient can result in concentrations of nutrient and SPM to be lower than those expected from conservative mixing, while coastal upwelling can provide additional nutrient supply. In addition, the irradiance condition in our experiments (110 μmol m–2 s–1) was lower than the actual environment. For instance, the average irradiance in the surface layer was observed to be 500–600 μmol m–2 s–1 in the Changjiang estuary (Sun et al., 2008). Considering that A. carterae is susceptible to varying light intensity (Samuelsson and Richardson, 1982), further study under higher irradiances is necessary to clarify the photoinhibition effect on this species. The living strategy of phytoplankton may also need to be take into consideration. The inhibitory effect of SPM may be alleviated for some phytoplankton species which show clear diurnal vertical migration (Kamykowski et al., 1998; Shikata et al., 2020), although A. carterae in this present study does not exhibit the ability of vertical migrate (Eggersdorfer and Hader, 1991; Kamykowski et al., 1998).
The Changes in Dominant Growth Limiting Factors in Estuary Environments
Despite only three parameters were considered in this study, it still provides insight into the controlling mechanisms of the growth of A. carterae in estuary environments. Here we used a schematic to demonstrate the changes in the dominant growth limiting factor for A. carterae along the salinity gradient in estuary environments (Figure 10), which we argued that can be similarly applied to other marine phytoplankton. For those marine phytoplankton that cannot survive at low salinities, salinity is the primary limiting factor preventing their existences under low salinity conditions. In nearshore water with significant riverine influences, phytoplankton growth is dominantly limited by SPM which creates the unfavorable low light environment for phytoplankton growth despite the high river-borne nutrient supply. SPM significantly affects the adaption period and sensitivity of phytoplankton to nutrient and is the key parameter determining the onset of biological growth. Both the concentrations of SPM and nutrient decrease offshore as river water mixes with seawater, resulting in enhancing nutrient limitation together with reducing light limitation along the increasing salinity in coastal water. The alleviation of light limitation in conjunction with the persistence of riverine nutrient concentration leads to an increase in phytoplankton growth in the river plume. The balance of light limitation and nutrient limitation controls the growth rate of phytoplankton, while the available nutrient determines the upper limit of the potential growth. The maximum growth occurs in the “optimal growth region” at intermediate salinities where light and nutrient were both suitable for phytoplankton growth. The dominant phytoplankton species may rapidly proliferate in the “optimal growth region” to form blooms and the exported organic matter accelerates the oxygen consumption in the bottom. The strong biological consumption of nutrient together with dilution effect of mixing then resulted in rapid decline in nutrient concentration, which causes nutrient to be the dominant factor limiting the phytoplankton growth in high-salinity offshore water.
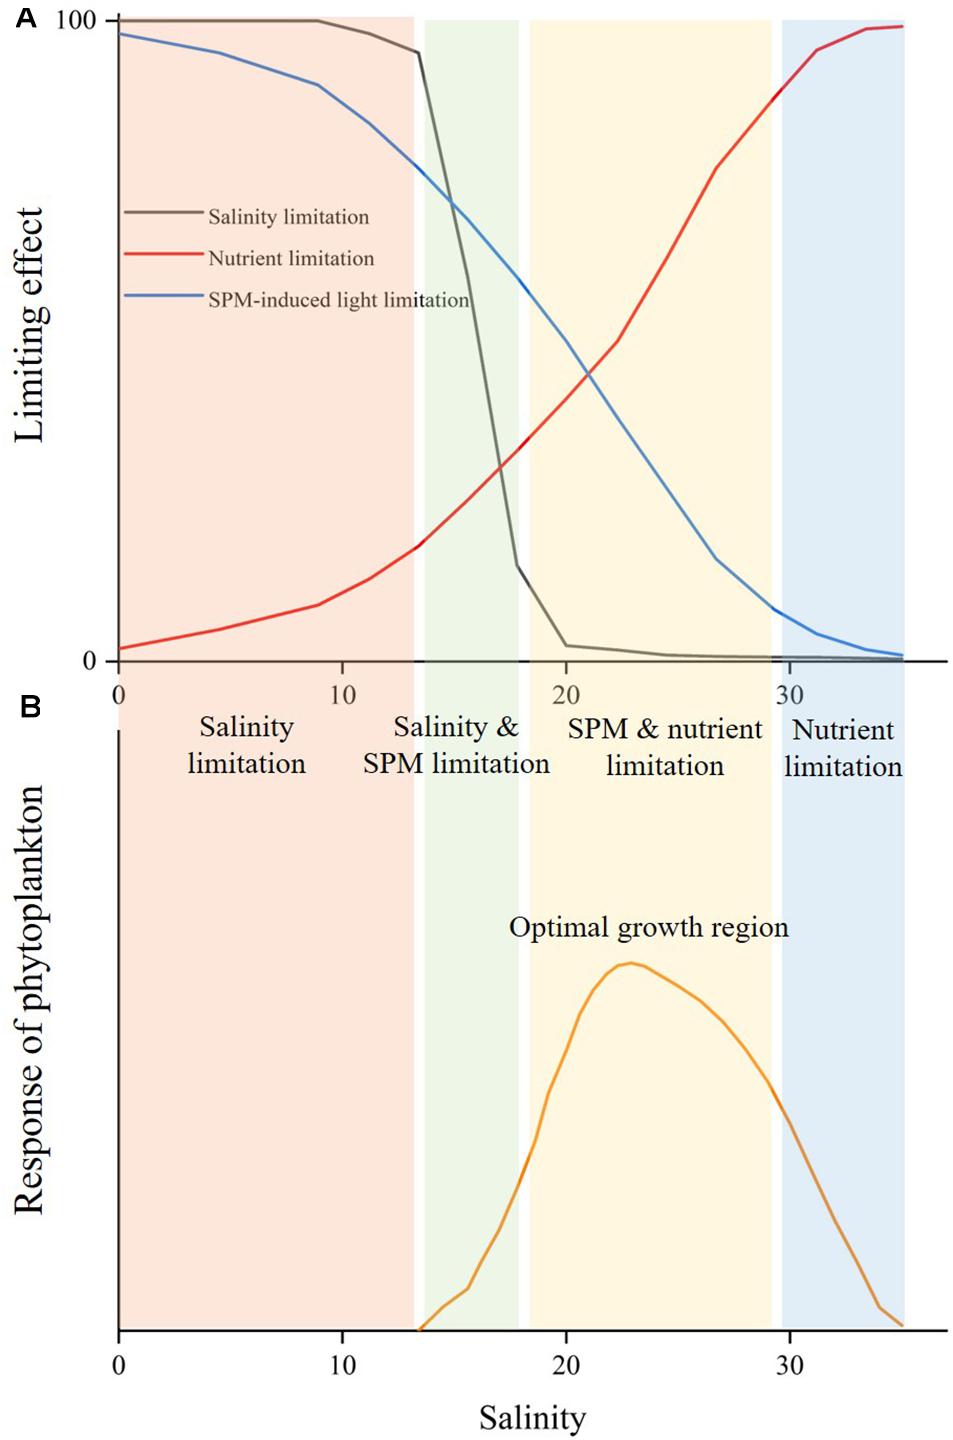
Figure 10. Schematic of the changes in limiting effects (A) and the growth response of marine phytoplankton (B) along the salinity gradient in estuary environments.
Data Availability Statement
The original contributions presented in the study are included in the article/Supplementary Material, further inquiries can be directed to the corresponding author/s.
Author Contributions
Z-PJ, YP, and MT conceived and designed the study. YT, JY, and QC conducted the incubation experiment and sample analysis. YP and MT provided the laboratory support. Z-PJ and YT prepared the manuscript with contributions from all authors.
Funding
This research was funded by the National Key Research and Development Program of China (2016YFA0601404) and the Bureau of Science and Technology of Zhoushan, Zhejiang (2019C81037).
Conflict of Interest
The authors declare that the research was conducted in the absence of any commercial or financial relationships that could be construed as a potential conflict of interest.
Acknowledgments
We thank P. S. Loh, for the helpful discussions on the research topic. We also thank the comments from two reviewers which significantly improve this manuscript.
Supplementary Material
The Supplementary Material for this article can be found online at: https://www.frontiersin.org/articles/10.3389/fmars.2021.690764/full#supplementary-material
References
Arar, E. J., and Collins, G. B. (1997). Method 445: In Vitro Determination of Chlorophyll a and Pheophytin a in Marine and Freshwater Algae by Fluorescence. Washington, DC: Environmental Protection Agency.
Backer, L. C. (2009). Impacts of Florida red tides on coastal communities. Harmful Algae 8, 618–622. doi: 10.1016/j.hal.2008.11.008
Baig, H. S., Saifullah, S. M., and Dar, A. (2006). Occurrence and toxicity of Amphidinium carterae hulburt in the North Arabian Sea. Harmful Algae 5, 133–140. doi: 10.1016/j.hal.2005.06.010
Behrenfeld, M. J., Halsey, K. H., and Milligan, A. J. (2008). Evolved physiological responses of phytoplankton to their integrated growth environment. Philos. Trans. R. Soc. Lond. B. Biol. Sci. 363, 2687–2703. doi: 10.1098/rstb.2008.0019
Behrenfeld, M. J., O’Malley, R. T., Boss, E. S., Westberry, T. K., Graff, J. R., Halsey, K. H., et al. (2015). Revaluating ocean warming impacts on global phytoplankton. Nat. Clim. Change. 6, 323–330. doi: 10.1038/nclimate2838
Bowers, D. G., Braithwaite, K. M., Nimmo-Smith, W. A. M., and Graham, G. W. (2009). Light scattering by particles suspended in the sea: the role of particle size and density. Cont. Shelf. Res. 29, 1748–1755. doi: 10.1016/j.csr.2009.06.004
Bruland, K., Donat, J., and Hutchins, D. (1991). Interactive influences of bioactive trace metals on biological production in oceanic waters. Limnol. Oceanogr. 36, 1555–1577. doi: 10.4319/lo.1991.36.8.1555
Burkholder, J. M., and Glasgow, H. B. (1997). Pfiesteria piscicida and other Pfiesteria-like dinoflagellates: behavior, impacts, and environmental controls. Limnol. Oceanogr. 42, 1052–1075.
Cai, W. J., Hu, X. P., Huang, W. J., Murrell, M. C., Lehrter, J. C., Lohrenz, S. E., et al. (2011). Acidification of subsurface coastal waters enhanced by eutrophication. Nat. Geosci. 4, 766–770. doi: 10.1038/NGEO1297
Christensen, E. R., Kusk, K. O., and Nyholm, N. (2009). Dose-response regressions for algal growth and similar continuous endpoints: calculation of effective concentrations. Environ. Toxicol. Chem. 28, 826–835. doi: 10.1897/08-068r.1
DeMaster, D. J., Smith, W. O., Nelson, D. M., and Aller, J. Y. (1996). Biogeochemical processes in Amazon shelf waters: chemical distributions and uptake rates of silicon, carbon and nitrogen. Cont. Shelf. Res. 16, 617–643. doi: 10.1016/0278-4343(95)00048-8
Diaz, R. J., and Rosenberg, R. (2008). Spreading dead zones and consequences for marine ecosystems. Science 321, 926–929. doi: 10.1126/science.1156401
Domingues, R. B., Guerra, C. C., Barbosa, A. B., and Galvao, H. M. (2017). Will nutrient and light limitation prevent eutrophication in an anthropogenically-impacted coastal lagoon? Cont. Shelf. Res. 141, 11–25. doi: 10.1016/j.csr.2017.05.003
Dueri, S., Dahllof, I., Hjorth, M., Marinov, D., and Zaldivar, J. M. (2009). Modeling the combined effect of nutrients and pyrene on the plankton population: validation using mesocosm experiment data and scenario analysis. Ecol. Model. 220, 2060–2067. doi: 10.1016/j.ecolmodel.2009.04.052
Eggersdorfer, B., and Hader, D. P. (1991). Phototaxis, gravitaxis and vertical migrations in the marine dinoflagellates, Peridinium-faeroense and Amphidinium-caterea. Acta Protozool. 30, 63–71.
Fabry, V. J., Seibel, B. A., Feely, R. A., and Orr, J. C. (2008). Impacts of ocean acidification on marine fauna and ecosystem processes. ICES J. Mar. Sci. 65, 414–432.
Feng, S., Zhang, M., Huang, Y., Yuan, D., and Zhu, Y. (2013). Simultaneous determination of nanomolar nitrite and nitrate in seawater using reverse flow injection analysis coupled with a long path length liquid waveguide capillary cell. Talanta 117, 456–462. doi: 10.1016/j.talanta.2013.09.042
Flynn, K. J., Davidson, K., and Leftley, J. W. (1994). Carbon-nitrogen relations at whole-cell and free-amino-acid levels during batch growth of Isochrysis galbana (Prymnesiophyceae) under conditions of alternating light and dark. Mar. Biol. 118, 229–237. doi: 10.1007/bf00349789
Folt, C. L., Chen, C. Y., Moore, M. V., and Burnaford, J. (1999). Synergism and antagonism among multiple stressors. Limnol. Oceanogr. 44, 864–877.
Franklin, D. J., and Berges, J. A. (2004). Mortality in cultures of the dinoflagellate Amphidinium carterae during culture senescence and darkness. Proc. R. Soc. B Biol. Sci. 271, 2099–2107. doi: 10.1098/rspb.2004.2810
Gao, L., Li, D. J., Ishizaka, J., Zhang, Y. W., Zong, H. B., and Guo, L. D. (2015). Nutrient dynamics across the river-sea interface in the Changjiang (Yangtze River) estuary East China Sea region. Limnol. Oceanogr. 60, 2207–2221. doi: 10.1002/lno.10196
Gilbes, F., López, J. M., and Yoshioka, P. M. (1996). Spatial and temporal variations of phytoplankton chlorophyll a and suspended particulate matter in Mayaguez Bay, Puerto Rico. J. Plankton Res. 18, 29–43. doi: 10.1093/plankt/18.1.29
Guenther, M., and Bozelli, R. (2004). Factors influencing algae-clay aggregation. Hydrobiologia 523, 217–223. doi: 10.1023/B:Hydr.0000033127.05034.32
Guillard, R. R. L. (1975). “Culture of phytoplankton for feeding marine invertebrates,” in Culture of Marine Invertebrate Animals: Proceedings–1st Conference on Culture of Marine Invertebrate Animals Greenport, eds W. L. Smith and M. H. Chanley (Boston, MA: Springer), 29–60.
Guinder, V. A., Popovich, C. A., and Perillo, G. M. E. (2009). Particulate suspended matter concentrations in the bahia blanca estuary, Argentina: implication for the development of phytoplankton blooms. Estuar. Coast. Shelf Sci. 85, 157–165. doi: 10.1016/j.ecss.2009.05.022
Han, X. T., Yan, T., Zou, J. Z., and Yu, Z. M. (2004). Morphological features and growth characteristics of the dinoflagellate Amphidinium carterae Hulburt. Oceanol. Limnol. Sin. 35, 279–283.
Hatta, M., Measures, C. I., and Ruzicka, J. J. (2019). Determination of traces of phosphate in sea water automated by programmable flow injection: surfactant enhancement of the phosphomolybdenum blue response. Talanta 191, 333–341. doi: 10.1016/j.talanta.2018.08.045
Healey, F. P. (1980). Slope of the monod equation as an indicator of advantage in nutrient competition. Microb. Ecol. 5, 281–286. doi: 10.1007/bf02020335
Ho, T. Y., Quigg, A., Finkel, Z. V., Milligan, A. J., Wyman, K., Falkowski, P. G., et al. (2003). The elemental composition of some marine phytoplankton. J. Phycol. 39, 1145–1159. doi: 10.1111/j.0022-3646.2003.03-090.x
Hu, Z. X., Mulholland, M. R., Duan, S. S., and Xu, N. (2012). Effects of nitrogen supply and its composition on the growth of Prorocentrum donghaiense. Harmful Algae 13, 72–82. doi: 10.1016/j.hal.2011.10.004
Huang, X., Huang, B., Chen, J., and Liu, X. (2016). Cellular responses of the dinoflagellate Prorocentrum donghaiense lu to phosphate limitation and chronological ageing. J. Plankton Res. 38, 83–93. doi: 10.1093/plankt/fbv112
Jiang, Z. P., Cai, W. J., Lehrter, J., Chen, B. S., Ouyang, Z. X., Le, C. F., et al. (2019). Spring net community production and its coupling with the CO2 dynamics in the surface water of the northern Gulf of Mexico. Biogeosciences 16, 3507–3525. doi: 10.5194/bg-16-3507-2019
Justic, D., Rabalais, N. N., Turner, R. E., and Dortch, Q. (1995). Changes in nutrient structure of river-dominated coastal waters - Stoichiometric nutrient balance and its consequences. Estuar. Coast. Shelf Sci. 40, 339–356. doi: 10.1016/S0272-7714(05)80014-9
Kamykowski, D., Milligan, E. J., and Reed, R. E. (1998). Relationships between geotaxis/phototaxis and diel vertical migration in autotrophic dinoflagellates. J. Plankton Res. 20, 1781–1796. doi: 10.1093/plankt/20.9.1781
Kim, J.-H., Lam, S. M. N., and Kim, K. Y. (2013). Photoacclimation strategies of the temperate coralline alga corallina officinalis: a perspective on photosynthesis, calcification, photosynthetic pigment contents and growth. Algae 28, 355–363. doi: 10.4490/algae.2013.28.4.355
Kirk, J. T. O. (1985). Effects of suspensoids (turbidity) on penetration of solar-radiation in aquatic ecosystems. Hydrobiologia 125, 195–208. doi: 10.1007/Bf00045935
Kirk, K. L., and Gilbert, J. J. (1990). Suspended clay and the population-dynamics of planktonic rotifers and cladocerans. Ecology 71, 1741–1755. doi: 10.2307/1937582
Kroeker, K. J., Kordas, R. L., Crim, R. N., and Singh, G. G. (2010). Meta-analysis reveals negative yet variable effects of ocean acidification on marine organisms. Ecol. Lett. 13, 1419–1434. doi: 10.1111/j.1461-0248.2010.01518.x
Lai, J. X., Yu, Z. M., Song, X. X., Cao, X. H., and Han, X. T. (2011). Responses of the growth and biochemical composition of Prorocentrum donghaiense to different nitrogen and phosphorus concentrations. J. Exp. Mar. Biol. Ecol. 405, 6–17. doi: 10.1016/j.jembe.2011.05.010
Laws, E. A., and Bannister, T. T. (1980). Nutrient-limited and light-limited growth of Thalassiosira-fluviatilis in continuous culture, with implications for phytoplankton growth in the ocean. Limnol. Oceanogr. 25, 457–473. doi: 10.4319/lo.1980.25.3.0457
Leonardos, N., and Geider, R. J. (2004). Responses of elemental and biochemical composition of Chaetoceros muelleri to growth under varying light and nitrate: phosphate supply ratios and their influence on critical N: P. Limnol. Oceanogr. 49, 2105–2114. doi: 10.4319/lo.2004.49.6.2105
Li, D., Cong, W., Cai, Z., Shi, D., and Ouyang, F. (2004). Effect of iron stress, light stress, and nitrogen source on physiological aspects of marine red tide alga. J. Plant. Nutr. 27, 29–41. doi: 10.1081/pln-120027545
Li, J. L., and Sun, X. X. (2016). Effects of different phosphorus concentrations and N/P ratios on the growth and photosynthetic characteristics of Skeletonema costatum and Prorocentrum donghaiense. Chin. J. Oceanol. Limnol. 34, 1158–1172. doi: 10.1007/s00343-016-5169-z
Lin, G., Xu, X., Wang, P., Liang, S., Li, Y., Su, Y., et al. (2020). Methodology for forecast and control of coastal harmful algal blooms by embedding a compound eutrophication index into the ecological risk index. Sci. Total Environ. 735:139404. doi: 10.1016/j.scitotenv.2020.139404
Litchman, E., Klausmeier, C. A., and Bossard, P. (2004). Phytoplankton nutrient competition under dynamic light regimes. Limnol. Oceanogr. 49, 1457–1462. doi: 10.4319/lo.2004.49.4_part_2.1457
Liu, C. G., Wang, J. L., Feng, J. F., and Peng, S. T. (2013a). Effects of suspended particles on the growth of two dominant phytoplankton species of Bohai Bay. China. Mar. Pollut. Bull. 74, 220–224. doi: 10.1016/j.marpolbul.2013.06.054
Liu, L. S., Zhou, J., Zheng, B. H., Cai, W. Q., Lin, K. X., and Tang, J. L. (2013b). Temporal and spatial distribution of red tide outbreaks in the yangtze river estuary and adjacent waters. China. Mar. Pollut. Bull. 72, 213–221. doi: 10.1016/j.marpolbul.2013.04.002
MacIntyre, H. L., Kana, T. M., Anning, T., and Geider, R. J. (2002). Photoacclimation of photosynthesis irradiance response curves and photosynthetic pigments in microalgae and cyanobacteria. J. Phycol. 38, 17–38. doi: 10.1046/j.1529-8817.2002.00094.x
Mallin, M. A., Cahoon, L. B., McIver, M. R., Parsons, D. C., and Shank, G. C. (1999). Alternation of factors limiting phytoplankton production in the Cape Fear River Estuary. Estuaries 22, 825–836. doi: 10.2307/1353064
McLachlan, J. (1961). The effect of salinity on growth and chlorophyll content in representative classes of unicellular marine algae. Can. J. Microbiol. 7, 399–406. doi: 10.1139/m61-048
Minggat, E., Roseli, W., and Tanaka, Y. (2021). Nutrient absorption and biomass production by the marine diatom Chaetoceros muelleri: effects of temperature, salinity, photoperiod, and light intensity. J. Ecol. Eng. 22, 231–240. doi: 10.12911/22998993/129253
Murray, S. A., Garby, T., Hoppenrath, M., and Neilan, B. A. (2012). Genetic diversity, morphological uniformity and polyketide production in dinoflagellates (Amphidinium, Dinoflagellata). Plos One 7:e38253. doi: 10.1371/journal.pone.0038253
Niimura, Y., Kajita, A., Terawaki, T., Yoshida, G., Hamaguchi, M., and Iseki, K. (2010). Comparison of absorption coefficients between accumulated matter on the thalli of Ecklonia kurome and suspended matter in the water surrounding Ecklonia bed. Biosph. Sci. 49, 39–47.
O’Boyle, S., McDermott, G., Silke, J., and Cusack, C. (2016). Potential impact of an exceptional bloom of Karenia mikimotoi on dissolved oxygen levels in waters off western Ireland. Harmful Algae 53, 77–85. doi: 10.1016/j.hal.2015.11.014
Painting, S. J., Devlin, M. J., Malcolm, S. J., Parker, E. R., Mills, D. K., Mills, C., et al. (2007). Assessing the impact of nutrient enrichment in estuaries: susceptibility to eutrophication. Mar. Pollut. Bull. 55, 74–90. doi: 10.1016/j.marpolbul.2006.08.020
Peng, F., Effler, S. W., O’Donnell, D., Weidemann, A. D., and Auer, M. T. (2009). Characterizations of minerogenic particles in support of modeling light scattering in Lake superior through a two-component approach. Limnol. Oceanogr. 54, 1369–1381. doi: 10.4319/lo.2009.54.4.1369
Pierson, D. C., Markensten, H., and Strombeck, N. (2003). Long and short term variations in suspended particulate material: the influence on light available to the phytoplankton community. Hydrobiologia 494, 299–304. doi: 10.1023/A:1025455424972
Qasim, S. Z., Bhattathiri, P. M. A., and Devassy, V. P. (1973). Growth kinetics and nutrient requirements of two tropical marine phytoplankters. Mar. Biol. 21, 299–304. doi: 10.1007/bf00381086
Rabalais, N. N., Cai, W. J., Carstensen, J., Conley, D. J., Fry, B., Hu, X. P., et al. (2014). Eutrophication-driven deoxygenation in the coastal ocean. Oceanography 27, 172–183. doi: 10.5670/oceanog.2014.21
Ramos, E. U., Vaes, W. H. J., Mayer, P., and Hermens, J. L. M. (1999). Algal growth inhibition of Chlorella pyrenoidosa by polar narcotic pollutants: toxic cell concentrations and QSAR modeling. Aquat. Toxicol. 46, 1–10.
Samuelsson, G., and Richardson, K. (1982). Photoinhibition at low quantum flux densities in a marine dinoflagellate (Amphidinium-carterae). Mar. Biol. 70, 21–26. doi: 10.1007/Bf00397292
Shen, F., Zhou, Y. X., Li, J. F., He, Q., and Verhoef, W. (2013). Remotely sensed variability of the suspended sediment concentration and its response to decreased river discharge in the Yangtze estuary and adjacent coast. Cont. Shelf. Res. 69, 52–61. doi: 10.1016/j.csr.2013.09.002
Shi, P., Shen, H., Wang, W., Chen, W., and Xie, P. (2015). The relationship between light intensity and nutrient uptake kinetics in six freshwater diatoms. J. Environ. Sci. 34, 28–36. doi: 10.1016/j.jes.2015.03.003
Shikata, T., Kitatsuji, S., Abe, K., Onitsuka, G., Matsubara, T., Nakayama, N., et al. (2020). Vertical distribution of a harmful red-tide dinoflagellate, Karenia mikimotoi, at the decline stage of blooms. J. Sea. Res. 165:101960. doi: 10.1016/j.seares.2020.101960
Song, S. Q., Li, Z., Li, C. W., and Yu, Z. M. (2017). The response of spring phytoplankton assemblage to diluted water and upwelling in the eutrophic Changjiang (Yangtze River) Estuary. Acta Oceanol. Sin. 36, 101–110. doi: 10.1007/s13131-017-1094-z
Sun, B., Wang, X., Li, Y., Wang, C., Wang, A., Liang, S., et al. (2008). Effects of irradiance on blooms of the dinoflagellate Prorocentrum donghaiense Lu in the coastal area in East China Sea. Environ. Sci. 29, 362–367, (in Chinese, with English abstract).
Sunday, J. M., Fabricius, K. E., Kroeker, K. J., Anderson, K. M., Brown, N. E., Barry, J. P., et al. (2017). Ocean acidification can mediate biodiversity shifts by changing biogenic habitat. Nat. Clim. Change 7:81. doi: 10.1038/nclimate3161
Tang, D., Di, B., Wei, G., Ni, I.-H., Oh, I. S., and Wang, S. (2006). Spatial, seasonal and species variations of harmful algal blooms in the South Yellow Sea and East China Sea. Hydrobiologia 568, 245–253. doi: 10.1007/s10750-006-0108-1
Tong, S., Hutchins, D. A., Fu, F., and Gao, K. (2016). Effects of varying growth irradiance and nitrogen sources on calcification and physiological performance of the coccolithophore Gephyrocapsa oceanica grown under nitrogen limitation. Limnol. Oceanogr. 61, 2234–2242. doi: 10.1002/lno.10371
Wallace, R. B., Baumann, H., Grear, J. S., Aller, R. C., and Gobler, C. J. (2014). Coastal ocean acidification: the other eutrophication problem. Estuari. Coast. Shelf. Sci. 148, 1–13. doi: 10.1016/j.ecss.2014.05.027
Keywords: suspended particulate matter, nutrient, Amphidinium carterae, bloom, optimal growth region, estuary
Citation: Jiang Z-P, Tong Y, Tong M, Yuan J, Cao Q and Pan Y (2021) The Effects of Suspended Particulate Matter, Nutrient, and Salinity on the Growth of Amphidinium carterae Under Estuary Environmental Conditions. Front. Mar. Sci. 8:690764. doi: 10.3389/fmars.2021.690764
Received: 04 April 2021; Accepted: 17 June 2021;
Published: 12 July 2021.
Edited by:
Jian Ma, Xiamen University, ChinaReviewed by:
Tomoyuki Shikata, National Research Institute of Fisheries and Environment of Inland Sea (FEIS), JapanBangyi Tao, Second Institute of Oceanography, Ministry of Natural Resources, China
Copyright © 2021 Jiang, Tong, Tong, Yuan, Cao and Pan. This is an open-access article distributed under the terms of the Creative Commons Attribution License (CC BY). The use, distribution or reproduction in other forums is permitted, provided the original author(s) and the copyright owner(s) are credited and that the original publication in this journal is cited, in accordance with accepted academic practice. No use, distribution or reproduction is permitted which does not comply with these terms.
*Correspondence: Yiwen Pan, ZXZlbHlucGFuQHpqdS5lZHUuY24=