 Nina Wootton
 Marta Ferreira2†‡
 Patrick Reis-Santos
 Bronwyn M. Gillanders
- 1Southern Seas Ecology Laboratories, School of Biological Sciences, University of Adelaide, Adelaide, SA, Australia
- 2Faculty of Science Technology and Environment, School of Marine Studies, University of the South Pacific, Suva, Fiji
Awareness surrounding plastic pollution has increased significantly in the past decade, leading to concerns on potential adverse effects on biota, including the consumption of microplastic by fish. Globally, plastic has been found in many species of fish, but little research has been undertaken in the southern hemisphere. We assessed the abundance and type of plastic in fish captured and sold for human consumption in Australia and Fiji. Fish (goatfish, sea mullet, paddletail, and common coral trout) had their gastrointestinal tracts dissected and microplastic quantified under a microscope. Plastic polymer types were confirmed using μ-FTIR. In Australia, plastic was found in 61.6% of fish gastrointestinal tracts, while in Fiji, 35.3% of fish had plastic. Fish from Australia had almost double the amount of plastic on average than fish caught in Fiji, with 1.58 (± 0.23) pieces per fish in Australia compared to 0.86 (± 0.14) in fish caught in Fiji. The types of plastic differed between countries, with fibers comprising 83.6% of microplastic pieces in fish from Australia whereas 50% of microplastic found in fish from Fiji was film. Polyolefin was the most abundant polymer type in both fibers from Australia and film from Fiji. We hypothesize variations in abundance and plastic type are a reflection of the population density and coastal geomorphology, but may also be a result of legislation and waste management strategies in the two countries. This work adds evidence to the pervasive presence of plastic in fish gastrointestinal tracts, reinforcing the urgent need for efficient plastic waste management, but also a better understanding of the impacts of microplastic on marine biota.
Introduction
Plastic debris is accumulating in marine environments at a rapid rate, with recent research finding plastic to be ubiquitous in oceans globally (Barnes et al., 2009; Wilcox et al., 2015; Worm et al., 2017). Plastics are highlighted as a major environmental hazard and can have a variety of health impacts on marine organisms, including suffocation, entanglement and contamination throughout all trophic levels (Page et al., 2004; Pierce et al., 2004; Stamper et al., 2009; Rochman et al., 2013). A highly prevalent type of plastic in the environment are microplastic, which are defined as pieces of plastic less than 5 mm in size (Eriksen et al., 2014; da Costa et al., 2016). Microplastic is either manufactured to be this size (primary microplastic) or the result of environmental weathering and forces breaking down pieces of larger plastic (secondary microplastic) (Worm et al., 2017). Recently, there has been a rise in research surrounding microplastic as an environmental contaminant, initiated by an increase in concern and awareness from the scientific community, policymakers and the general public on the impacts these small particles are having on marine environments and biota (Rochman et al., 2013). Studies have now found microplastic in all areas of the water column, including deep-sea floors, coastal sediments and the ocean surface (Reisser et al., 2013; Eriksen et al., 2014; Peng et al., 2018). Furthermore, they have been identified to be ingested by a range of marine organisms, including whales, fish and larvae (Besseling et al., 2015; Steer et al., 2017; Burkhardt-Holm and N’Guyen, 2019).
Microplastic ingestion in marine fish is well documented (Markic et al., 2019; Sequeira et al., 2020; Savoca et al., 2021), with field studies reporting microplastic ingestion in wild-caught fish of both commercial and non-commercial interest from a broad range of trophic levels, habitats and benthic zones (Foekema et al., 2013; Nadal et al., 2016; Murphy et al., 2017; Baalkhuyur et al., 2018; Burkhardt-Holm and N’Guyen, 2019; Garnier et al., 2019). Despite this, the literature surrounding microplastic in fish sold through seafood markets and supermarkets is limited. With seafood consumption increasing worldwide, understanding the potential risks of human consumption of microplastic needs further attention. Apart from the reported physical impacts of microplastic when ingested by marine organisms (Wright et al., 2013), there is also concern that the small particles could act as a vector for toxic chemicals either added during manufacturing stages, or pollutants [e.g., persistent organic pollutants (POPs), flame retardants and heavy metals] sorbed onto the surface of the microplastic (Teuten et al., 2009; Bakir et al., 2014). Laboratory observations show these chemicals are capable of causing adverse impacts on fish (e.g., Rochman et al., 2014; Pedà et al., 2016), however, the extent to which microplastic ingestion is exposing individuals to chemical pollutants or its potential implications to seafood safety is far from well understood (Hermabessiere et al., 2017; Hantoro et al., 2019; Walkinshaw et al., 2020).
Land-based activities, such as unprotected landfill, mismanagement of household and commercial waste, sewage, littering, and industrial pollution are major sources of marine plastic (Jambeck et al., 2015; Li et al., 2016; Turrell, 2020). Therefore, to some extent the plastic found in the ocean is a reflection of the waste produced and how it is managed in different countries. Australia and Fiji have different waste management strategies, as well as differing population sizes, cultures, and lifestyles. Marine litter generation is predicted to be high in countries that have under-performing waste management systems. Small Island Developing States (SIDS), such as Fiji, have unique problems in waste collection and disposal due to their lack of space for landfill, inadequate expertise and technology and particularly their remote locations creating exhaustive costs to transport waste and recycling (Mohee et al., 2015). Furthermore, Fiji’s increase in urbanization alongside growth in tourism have amplified the imbalance between the abundance of waste produced and the country’s ability to manage it correctly (Kelman and West, 2009; Lachmann et al., 2017). Although Jambeck et al. (2015) estimated that Australia produces over eleven times the amount of plastic waste that Fiji does (1,902,591 kg per day compared to 168,430 kg per day in 2010), the amount of mismanaged waste in Fiji is almost four times that of Australia (13,889 tonnes in Australia compared to 49,257 tonnes in Fiji) (Jambeck et al., 2015).
In this study, we investigate the abundance and type of plastic found in the gastrointestinal tracts of a suite of species of fish captured and sold for human consumption in two regions of the South Pacific (Australia and Fiji) with distinct economic development levels and waste management strategies. In doing so, we provide essential information on microplastic contamination in fish from a vastly understudied region (Markic et al., 2019; Savoca et al., 2021), which can be used as key baseline data for future studies to monitor the presence and patterns in microplastic type and abundance in the South Pacific. Overall, the extent of microplastic contamination in commercially sold fish from the South Pacific is unknown, as are the types of plastics and polymers present, and how they compare among different sized countries, regarding landmass, population, economy and waste management strategies.
Materials and Methods
Sample Collection
Fish samples (193 total) from five species of commercially important species were collected from fish markets in Suva, Fiji, and Brisbane and Sydney, Australia in 2019 (Figure 1). Fish were selected based on local availability, as well as covering a range of trophic levels and habitats (e.g., reef-associated, benthic, pelagic) (Table 1). Three species were collected in both countries (common coral trout, paddletail, sea mullet), the other species were closely related (Family Mullidae) and chosen based on similarity in feeding habits, habitats and trophic levels. All 73 fish (∼20 individuals from 4 species) purchased in Australia were from the same commercial fishing areas in Queensland and were purchased in June 2019. In Fiji, 120 fish (∼30 individuals from 4 species, see Table 1) were purchased from the Suva Municipal Markets in February and March 2019. All fish were locally fished. Most fish were purchased whole, although some samples (eight coral trout from Australia) were collected as frames, with the gastrointestinal tracts still intact, following filleting for human consumption. All fish were transported on ice to the laboratory and stored in the freezer at –20°C until further processing.
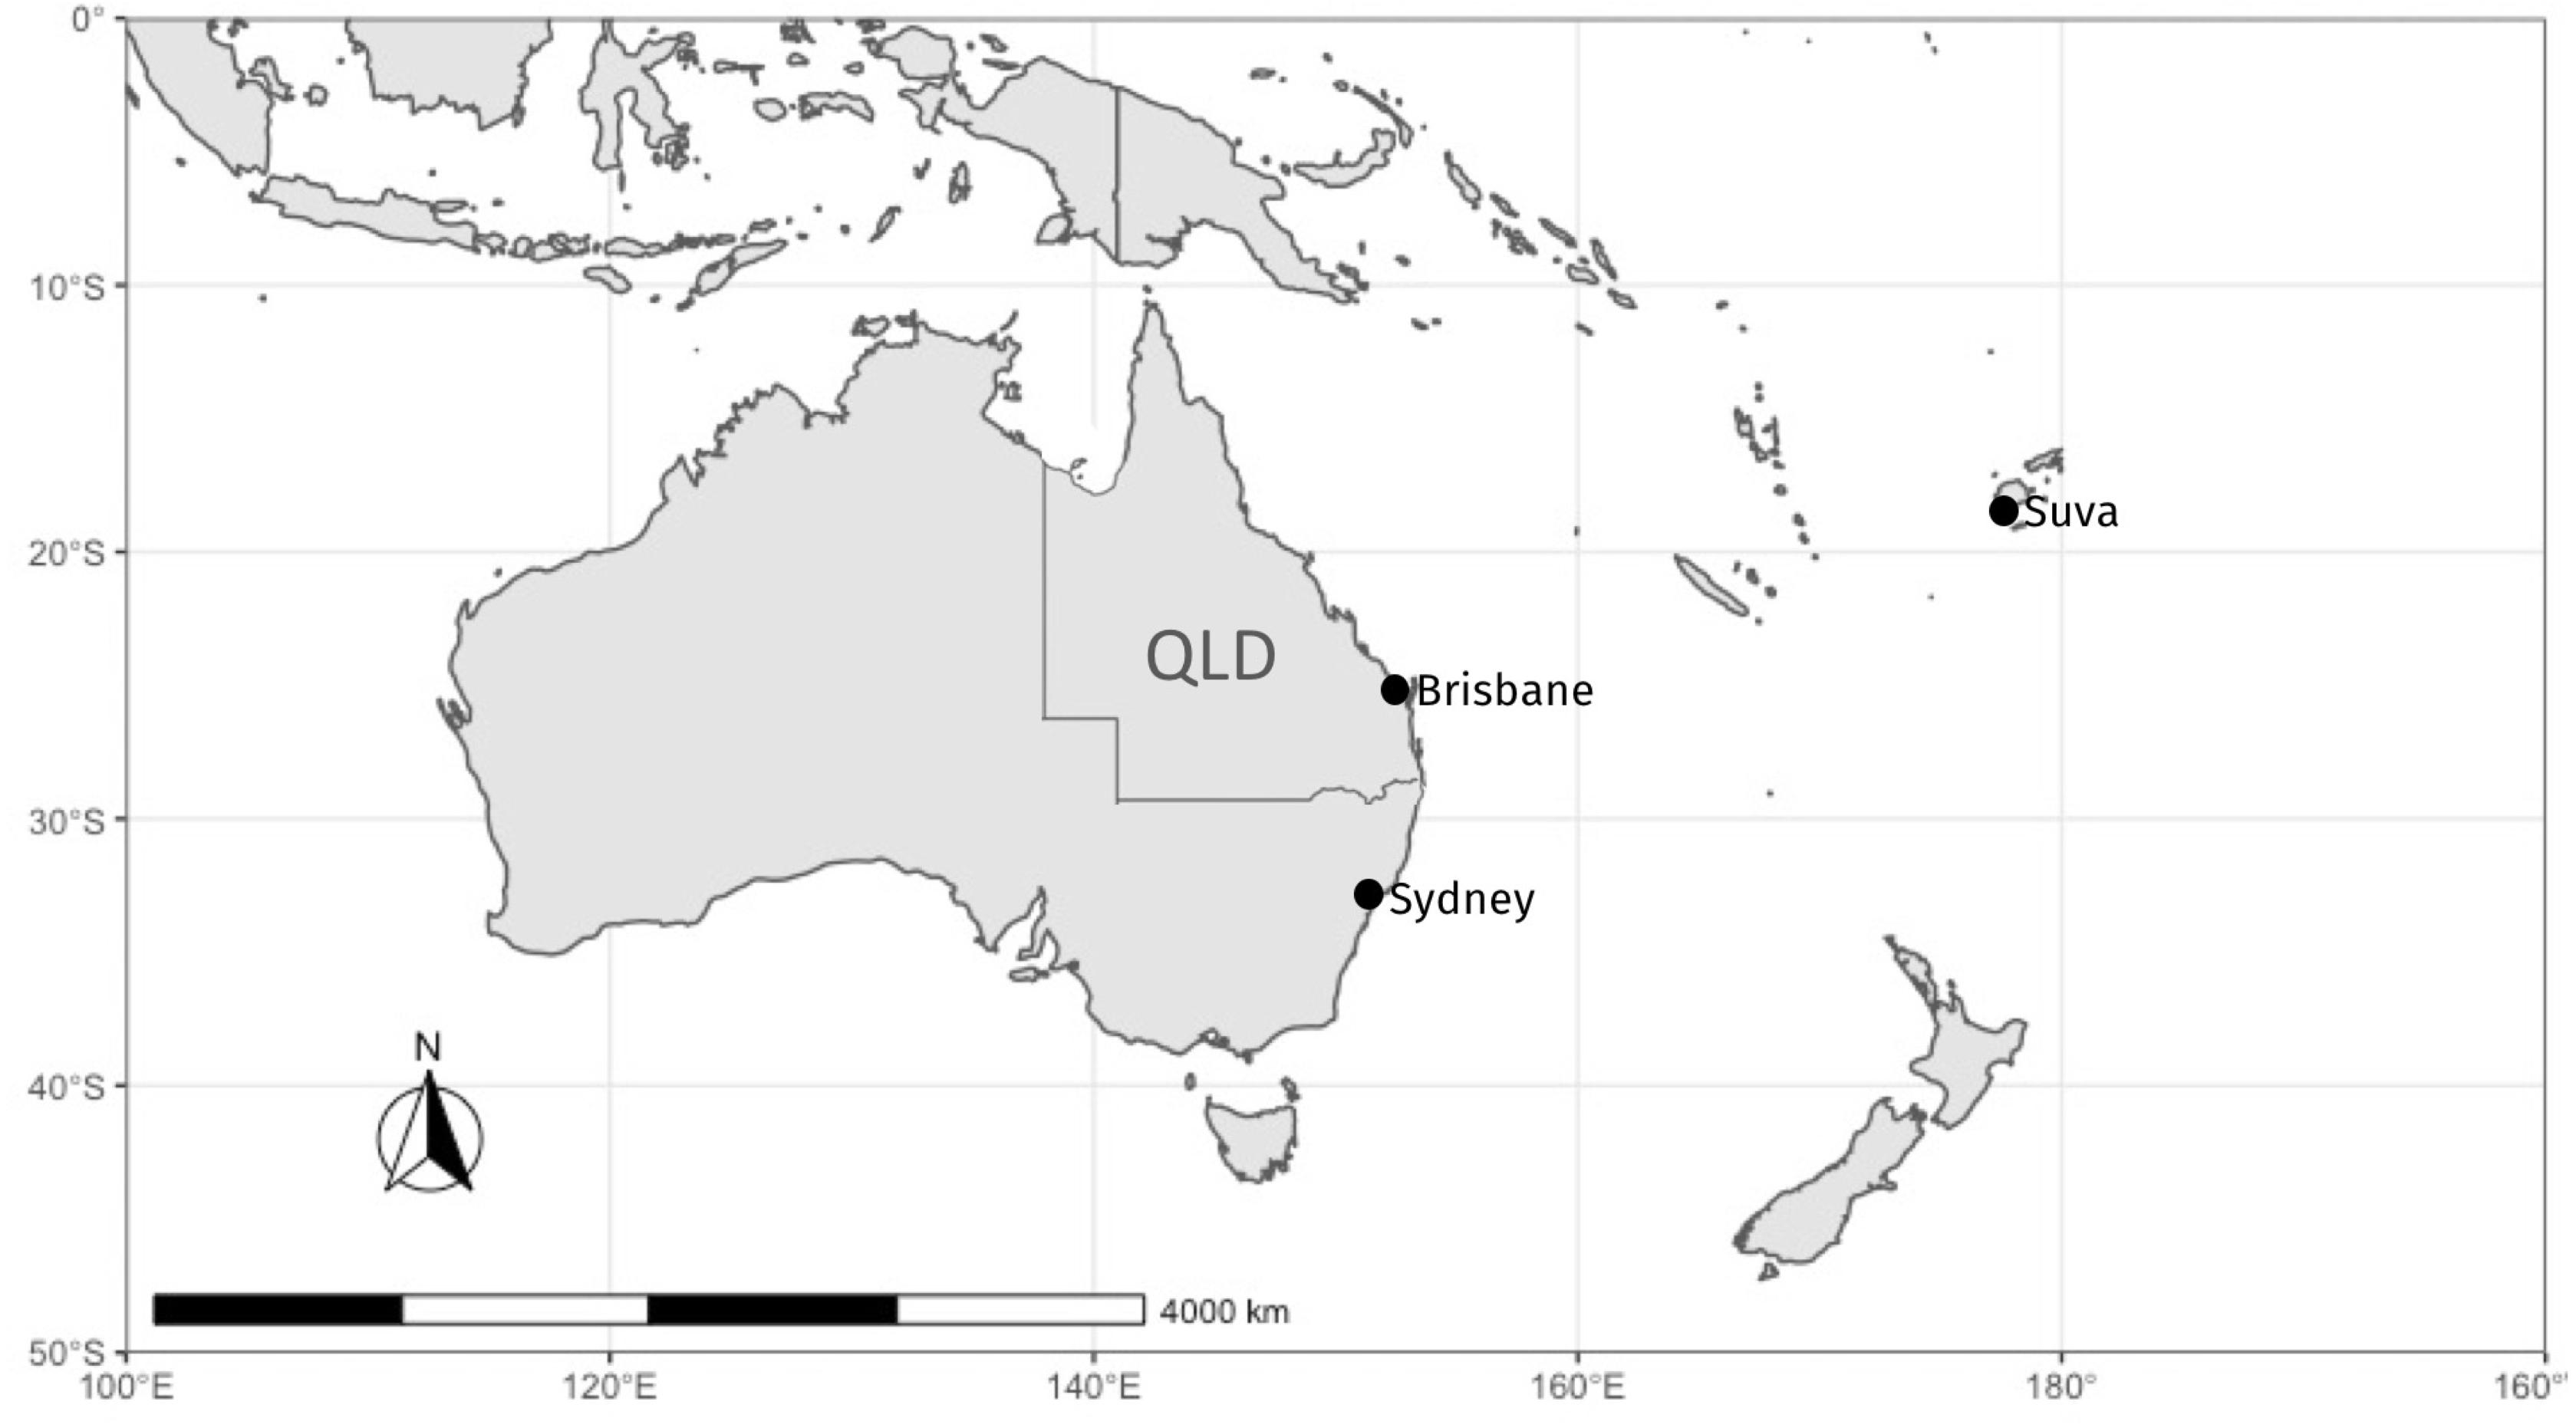
Figure 1. Map of sampling locations in Australia and Fiji. Samples in Australia were fished in the coastal region of Queensland (QLD), and purchased from fish markets in Sydney and Brisbane. Samples from Fiji were fished and purchased locally at the Suva fish markets.
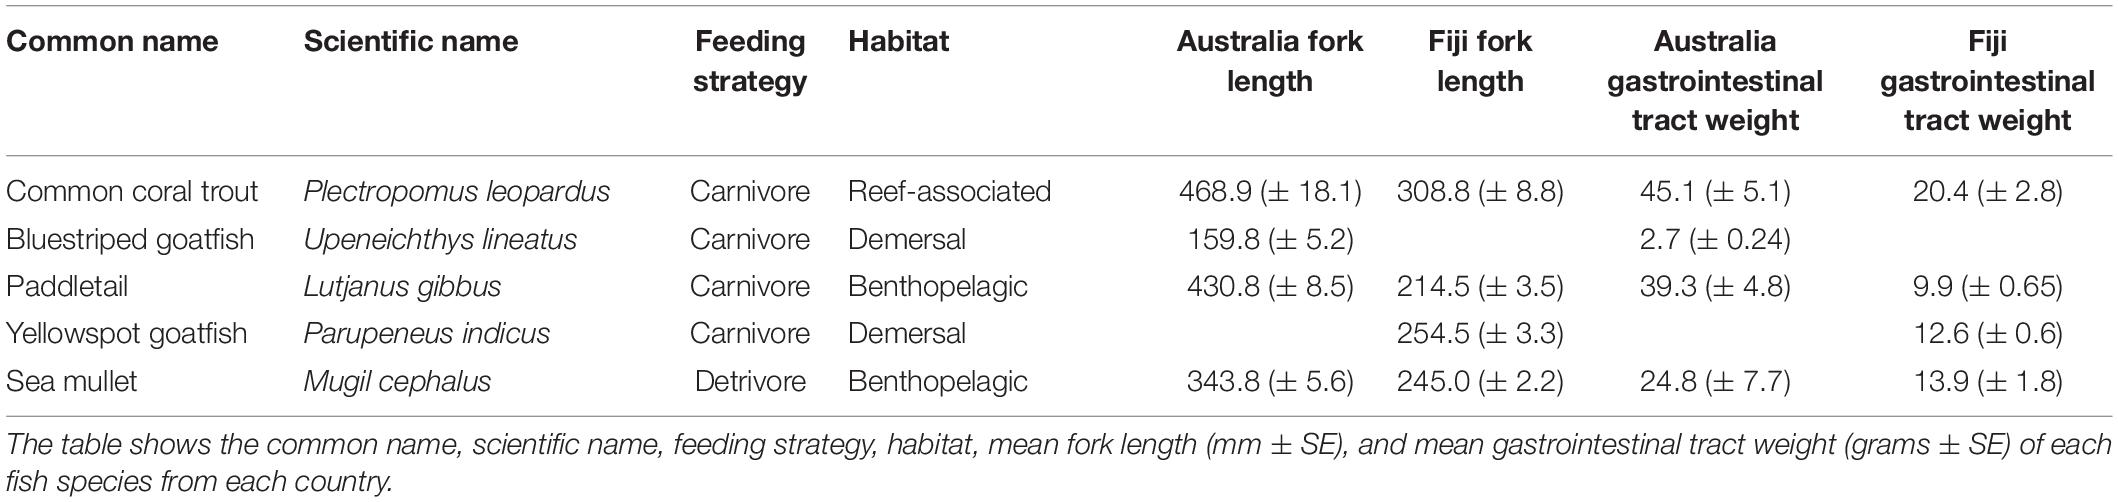
Table 1. Fish purchased in Australia and Fiji.
Laboratory Methods
All processing of fish occurred inside a laminar flow cabinet. Fork length of the whole fish or fish frame was measured (Table 1). The fish were rinsed with ultrapure (Milli-Q) water, dissected, and the gastrointestinal tracts removed. The fish that were collected as frames had the outside rinsed thoroughly with ultrapure water to ensure any external contamination was removed. The entire gastrointestinal tracts were weighed, rinsed in ultrapure water, and placed in individual previously cleaned polypropylene sample jars (Table 1). Due to interstate travel restrictions, dissections of some species (common coral trout, sea mullet, paddletail) from Queensland occurred in the field, under open airflow, and all surfaces cleaned thoroughly. In these cases, dissected gastrointestinal tracts were rinsed with ultrapure water, stored and sealed in previously cleaned vials, and transported to the laboratory until further processing, as described above.
Organic material in the gastrointestinal tracts was digested with 10% potassium hydroxide (KOH) solution in ultrapure water (Foekema et al., 2013; Rochman et al., 2015). The samples were then left to digest in closed vials overnight at 60°C in an oven. The digestion method using 10% KOH has been documented as the best method to extract microplastics with the highest isolation efficiency (Dehaut et al., 2016; Lusher et al., 2017; Thiele et al., 2019).
The resultant liquified samples were sieved through two sieves (1 mm and 38 μm), catching any hard objects, including microplastic. All of the sieving process was completed in the laminar flow cabinet. The sieves were examined under a stereo microscope (Leica M80) and any objects thought to be plastic were recorded and collected for further chemical analysis. Microplastic color, size group (>38 μm and <1 mm or >1 mm) and type (i.e., fibers, fragments or film; Figure 2) were all recorded.
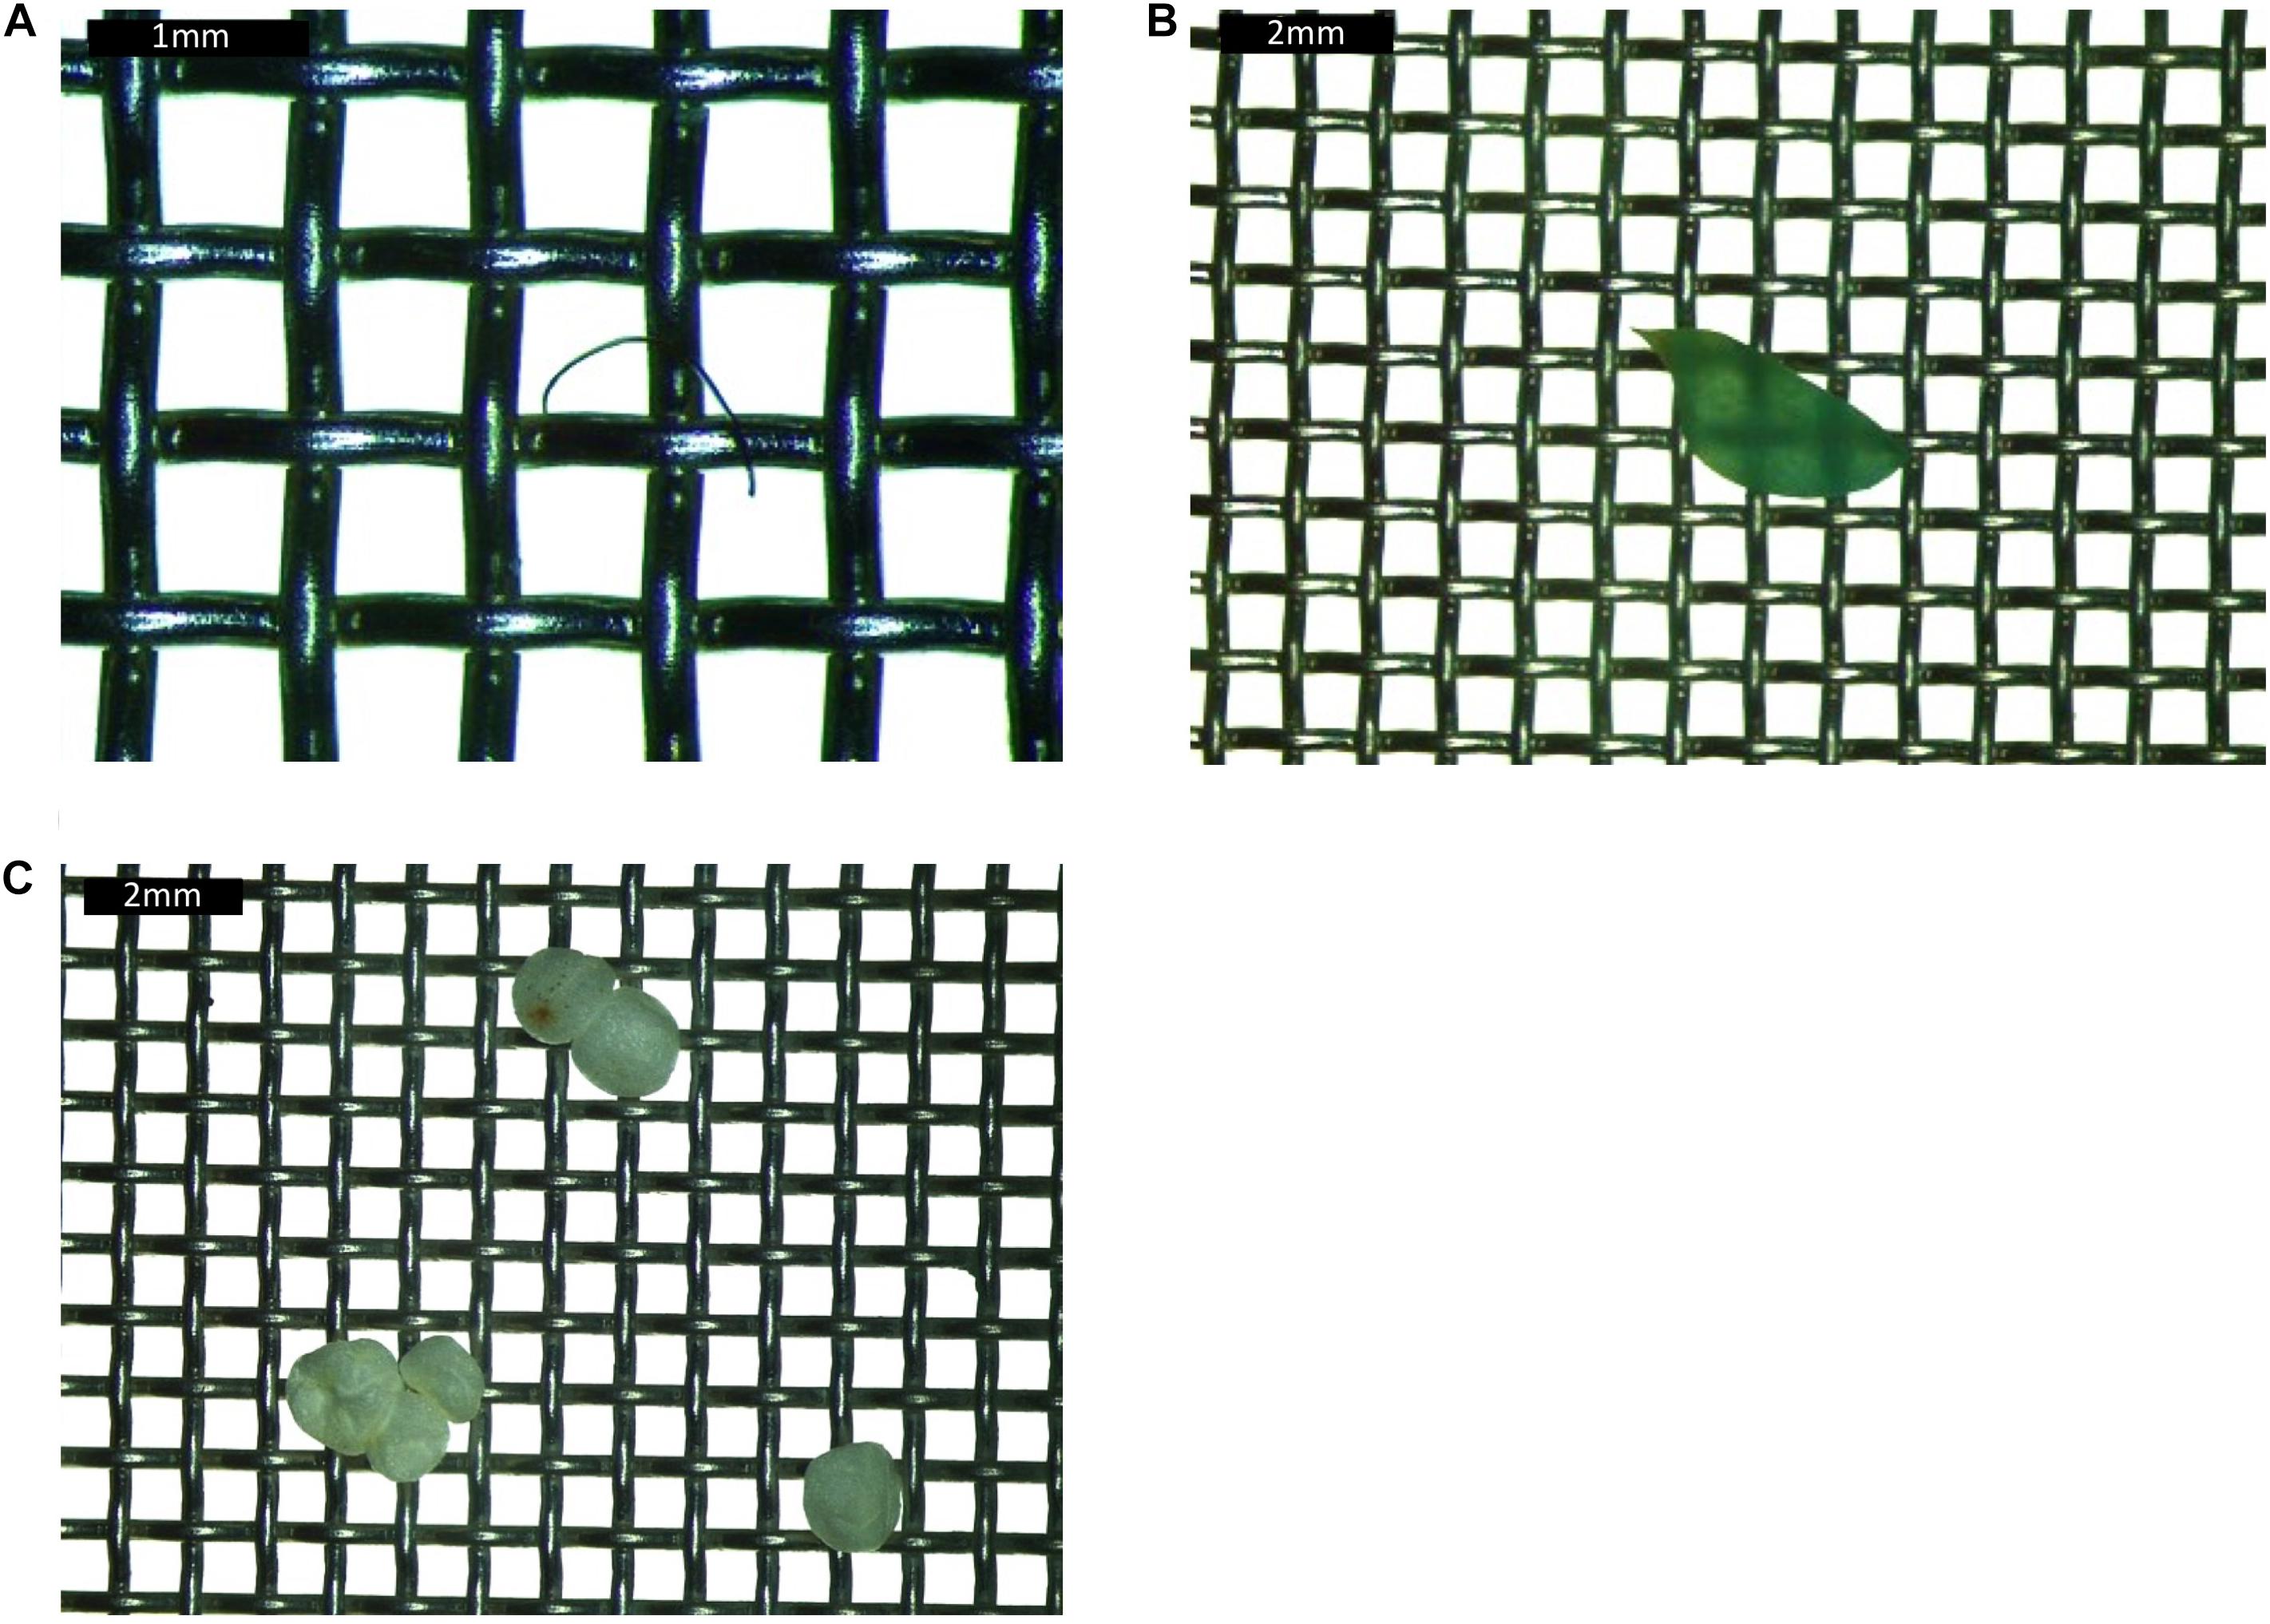
Figure 2. Images of (A) fiber, (B) film, and (C) fragment collected from the gastrointestinal tract of fish. Each grid is 1 × 1 mm square.
Contamination Controls
All surfaces, vials and utensils were cleaned beforehand with ultrapure water and dried in a laminar flow. Throughout all processing and analysis, strict protocols were undertaken to ensure that contamination risk was minimized (Lusher et al., 2017; Provencher et al., 2017; Hermsen et al., 2018). The laboratory work area was cleaned methodically before dissections occurred, and between each fish. All fish were rinsed and dissections performed in a laminar flow cabinet to avoid external contamination. Bright pink lab coats and clothing made from natural fibers were worn at all times. Only two pink fibers were found in the samples, and they were excluded. Both procedural and environmental blank samples were prepared during every stage of the methodology (open vials during dissection, polypropylene jars with 10% KOH during digestion and open Petri dishes during sieving and microscope analysis) (Hermsen et al., 2017; Kroon F. et al., 2018). Blank samples were placed directly alongside the work area and processed, filtered and analyzed using the same methods we used for fish gastrointestinal tracts. No evidence of contamination was found in the blank samples.
Characterization and Identification of Microplastics
We tested microplastic pieces using micro-Fourier Transformed Infrared Spectroscopy (μ-FTIR) (Bruker Hyperion) to identify polymer type (Jung et al., 2018). Attenuated Total Reflection (ATR) was applied to all cleaned samples at a resolution of 4 cm–1. Aperture size was readjusted to as small as necessary depending on sample size. Three randomly selected measurement positions were chosen within each sample, and 64 co-scans for each measurement were taken. The spectrum range was set between 3,900 and 650 cm–1, with the atmospheric water/CO2 region between 2,500 and 1,900 cm–1 excluded when compared to spectral libraries, as recommended by Primpke et al. (2018) and Jensen et al. (2019). All spectra outputs were compared to the libraries of reference (Bruker ATR Library for Polymers, Bruker ATR Library for Chemicals, Bruker ATR Library for Pharma, Bruker ATR Library for Forensics) to verify the polymer type (Supplementary Figure 1). A hit quality value (i.e., percent match) between the sample and the library reference spectrum was obtained for each item. The polymer was only confirmed if the match was >50% and additionally if the stringent visual analysis of the peaks were identified as the same.
We aimed to test all pieces of microplastic, however, some pieces were too small to analyze on the μ-FTIR slide (24% of all samples) so we did not include these in our final plastic counts. When there were multiple pieces of microplastic from the same fish that visually appeared to be the same plastic piece and polymer type, we tested a portion of the pieces first (e.g., if there were three pieces of plastic that visually appeared the same we would test two of them). If polymer type was found to be the same, we assumed that the remaining pieces were of the same polymer type.
Data Interpretation and Statistical Analysis
The color, type and size of microplastics were quantified for each individual fish. The average amount of microplastic per fish of each species and country was calculated; this is referred to as the plastic load (PL). This value includes all fish sampled, even those which were found to have no plastic present, hence the average PL can be a value less than one. The percentage of fish with at least one piece of plastic was quantified for each species and country. This value represents the frequency of occurrence of plastic ingestion (FO).
We tested for a relationship between plastic load and fork length or gastrointestinal tract weight but none were found. The data were analyzed using a negative binomial generalised linear model (GLM) to investigate the influence of location of capture (country) and species on the estimated frequency of occurrence of plastic and plastic load per fish. We used the Akaike’s information criterion value corrected for small sample sizes (AICc) to select the best model fit. For the best fit model (Location + Species), estimates of the species means were made, followed by ANOVA and pairwise tests to determine any differences between species and countries. Residual plots were analyzed to ensure data met assumptions. Graphical outputs were produced from the model predictions. Statistical analyses were conducted using R studio software (Version 3.6.1), including the maps (Becker et al., 2018), ggplot2 (Wickham, 2016), emmeans (Length et al., 2020), doBy (Højsgaard and Halekoh, 2020), rgeos (Bivand and Rundel, 2020), rnaturalearth (South, 2017a), rnaturalearthdata (South, 2017b), sf (Pebesma, 2018), treemap (Tennekes, 2017), tidyverse (Wickham et al., 2019), and sunburstR (Bostock et al., 2020) packages.
Subsequently, Primer-e was used to run Canonical Analysis of Principal Coordinates (CAP) on the multivariate polymer dataset. CAP was used to assess the ability to classify fish to their country of origin based on the types of microplastic they contain. CAP is a constrained ordination that allows an unbiased measure of how different groups are in multivariate space (Anderson and Willis, 2003). Variables were log(x + 1) transformed and unrestricted random permutations of the transformed data were applied. Cross-validated classification accuracies were analyzed for all species combined.
Results
Differences in Abundance of Plastic Between Countries
A total of 296 pieces of microplastic were collected using visual microscope techniques (148 from Fiji and 148 from Australia), of which 212 were confirmed as microplastic using the μ-FTIR (102 from Fiji and 110 from Australia). The majority of microplastic pieces were larger than 1 mm in size (88.9% of pieces from Australia and 86.4% of pieces from Fiji), with the remainder of pieces being between 38 μm and 1 mm.
There were no trends between fish size, or the weight of the gastrointestinal tract, and the amount of microplastic counted. Overall, the frequency of occurrence of plastic ingestion in fish from Australia was higher than Fiji (61.6% in Australia compared to 35.3% in Fiji) and there was a significant difference between countries (p < 0.001, Figure 3). The overall plastic load found in fish was higher in Australia compared to Fiji (1.58 ± 0.23 and 0.86 ± 0.14 pieces per fish, respectively) (p < 0.05). Both countries had a large percentage of fish (38.4% in Australia and 64.7% in Fiji) that had zero pieces of microplastic (Figures 3A,B). The highest number of microplastic found in any one fish was eight pieces, found in a common coral trout and paddletail in Australia, and a common coral trout from Fiji (Figures 3A,B, respectively).
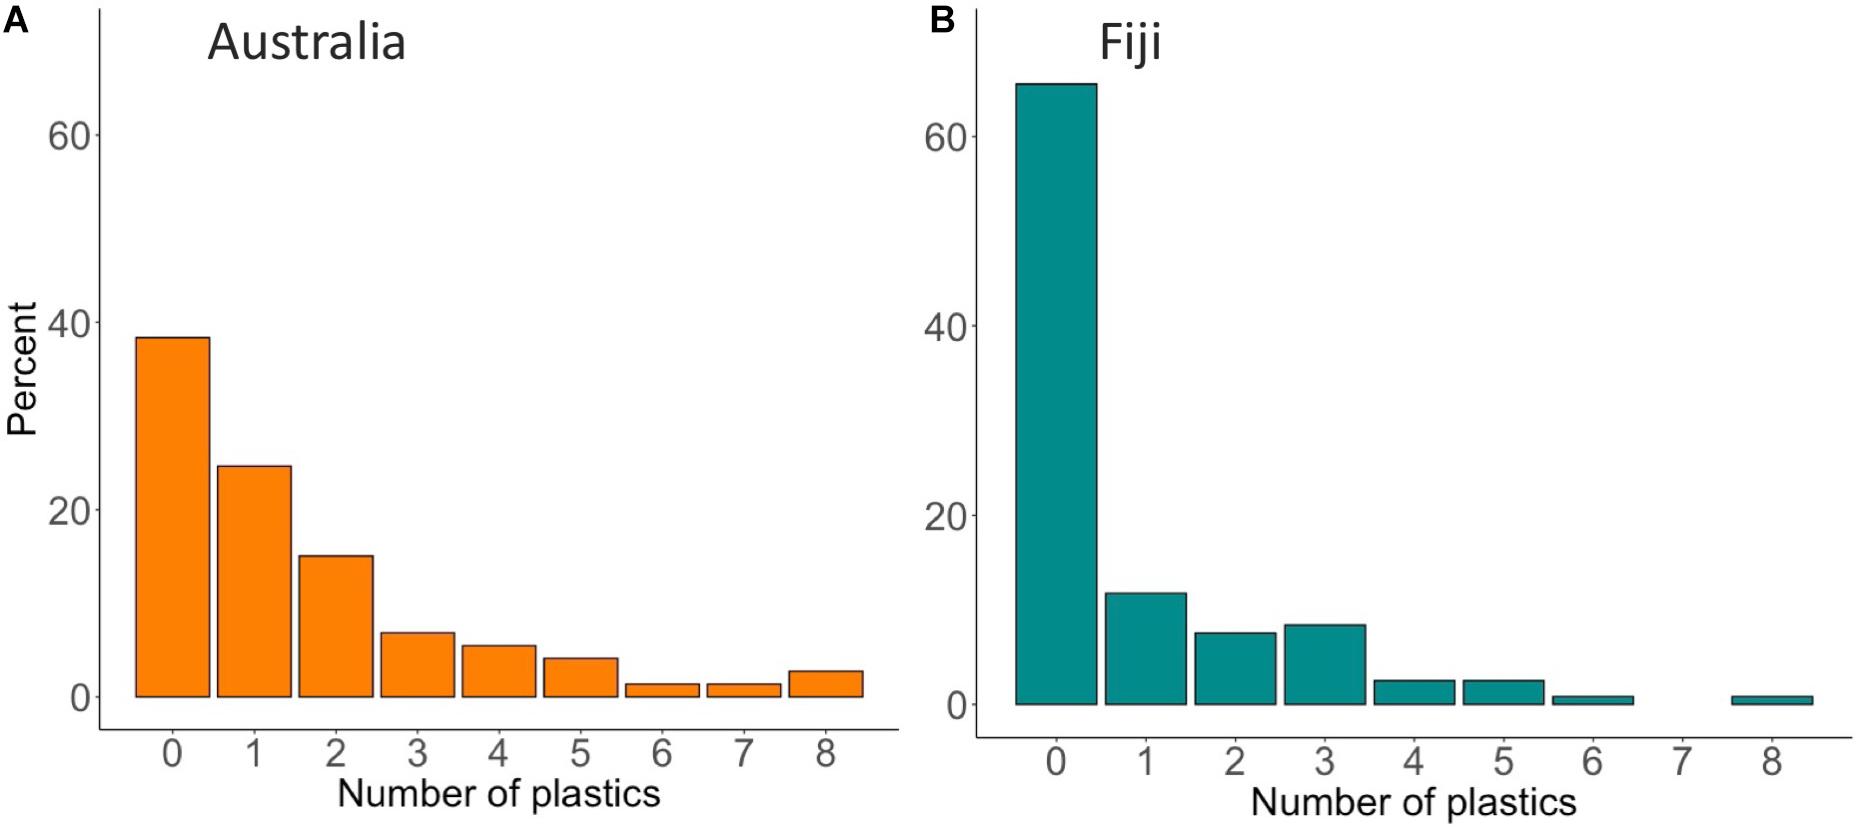
Figure 3. Percentage of the total count of plastics found in the gastrointestinal tract of individual fish from (A) Australia (n = 73 fish) and (B) Fiji (n = 120 fish).
All species from both countries had microplastic present, however, the predicted frequency of occurrence of plastic ingestion varied depending on the species and which location they were captured (Figure 4). In Fiji, the common coral trout was the species with the most fish with at least one piece of plastic, whilst yellowspot goatfish had the least (Figure 4). In Australia, the paddletail had the most fish with microplastic and the sea mullet had the least (Figure 4).
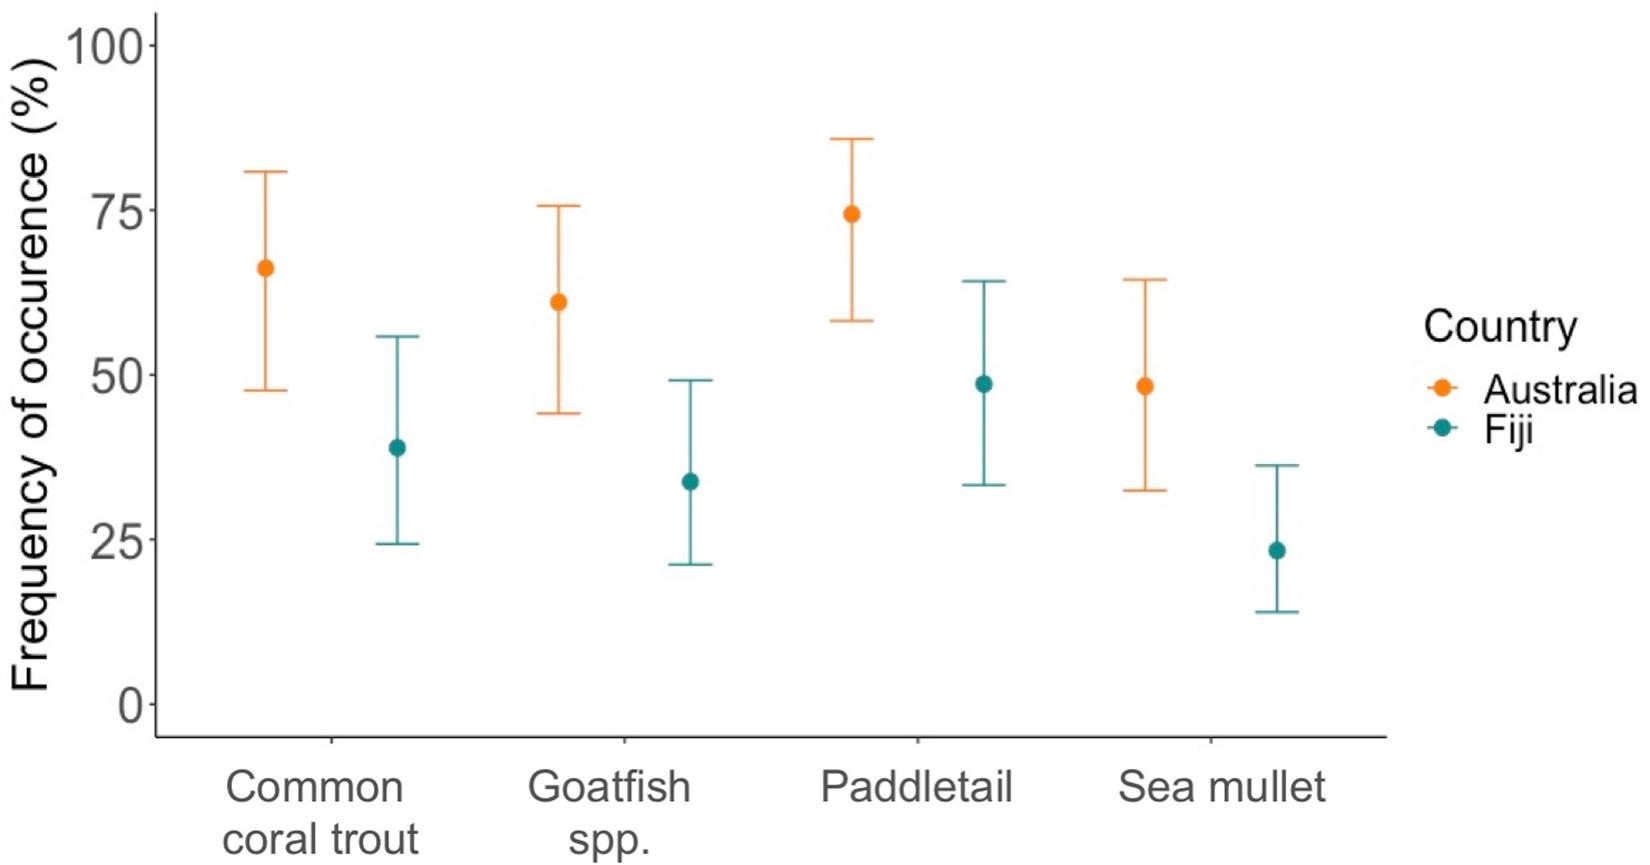
Figure 4. Frequency of occurrence of plastic ingestion (FO). The graph shows the expected percentage of fish from each species that had at least one piece of microplastic present in their gastrointestinal tract based on a negative binomial GLM. The error bars show the lower and upper 95% confidence intervals. The blue points and lines represent fish purchased in Fiji and the orange points and lines represent those purchased in Australia. Refer to Table 1 for scientific species names, where goatfish is yellowspot goatfish for Fiji and bluestriped goatfish for Australia.
The plastic load also changed between species and locations. In Fiji, the highest expected microplastic load was in paddletail and the lowest in sea mullet (Figure 5), whereas, in Australia, common coral trout had the most pieces of microplastic on average in their gastrointestinal tract and similarly to Fiji, sea mullet had the least (Figure 5).
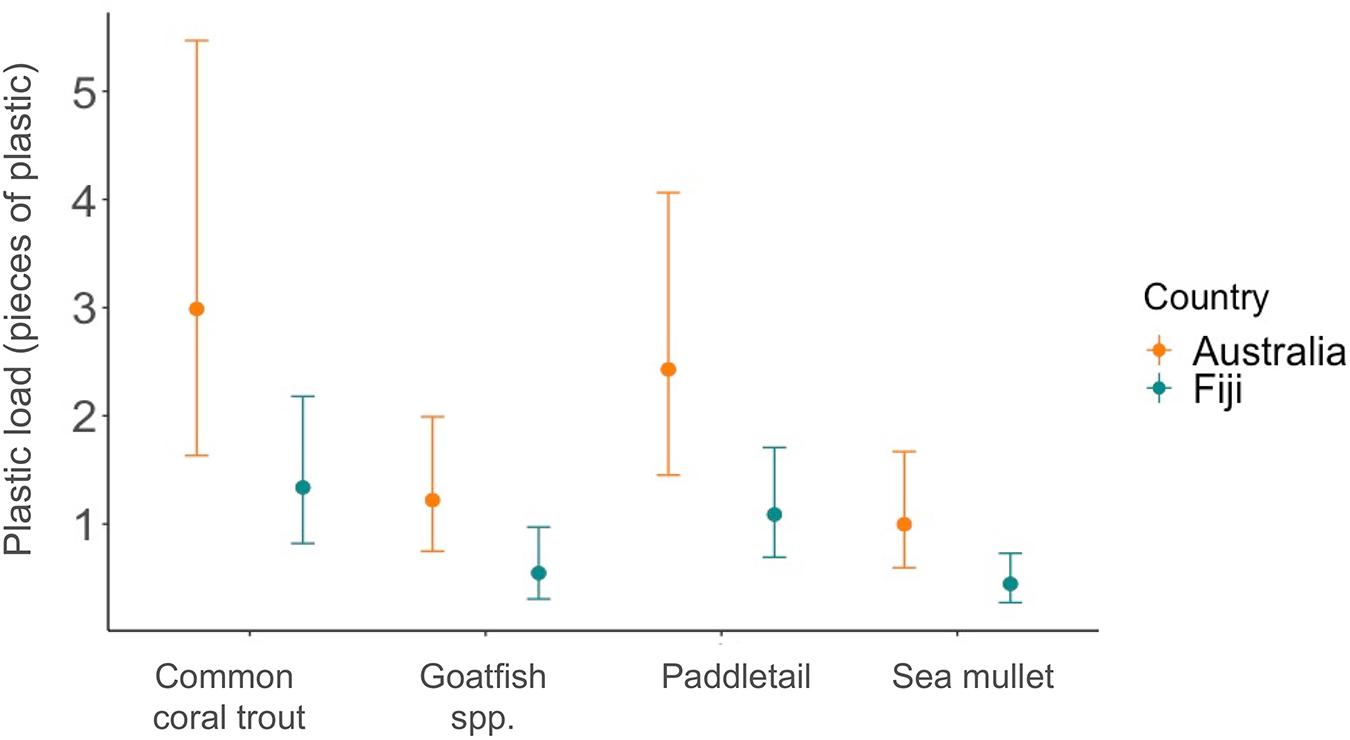
Figure 5. Average plastic load per fish. The points show the expected mean number of microplastics found in the gastrointestinal tract of each species from a negative binomial GLM fitted to the data. The vertical lines represent the lower and upper 95% confidence intervals. The blue points and lines represent fish purchased in Fiji, while the orange points and lines are those purchased in Australia. Table 1 provides scientific species names, where goatfish is yellowspot goatfish for Fiji and bluestriped goatfish for Australia.
Differences in Types of Plastic Between Countries
Of the 296 pieces initially identified under the microscope as microplastic, we analyzed 124 pieces using the μ-FTIR (Figure 5). This number of analyses in the μ-FTIR is due to, first, some pieces of microplastic being too small (e.g., not visible to the naked eye) and thus we were unable to transfer and verify their polymers onto the μ-FTIR slide, with these pieces removed from the reported total counts of plastic (n = 71). Second, when multiple pieces of plastic in the same fish visually appeared identical we tested a portion of microplastic pieces, with the μ-FTIR confirming these pieces were all the same polymer. Overall, of the 124 pieces we tested, 111 were confirmed as microplastic, an 89.5% accuracy. After the pieces of plastic that were visually identified, and confirmed by the μ-FTIR as being the same were combined back into our total (n = 101), we had a total of 212 confirmed pieces of microplastic.
There were differences in the types of microplastic found in fish between the two countries. Half of the microplastics found from fish in Fiji were film (50.0%), with the remaining split between fragments (25.5%) and fibers (24.5%) (Figure 6A). In contrast, in Australia, fibers dominated (82.4%), with fewer fragments (10.2%) and film (7.4%) present (Figure 6B).
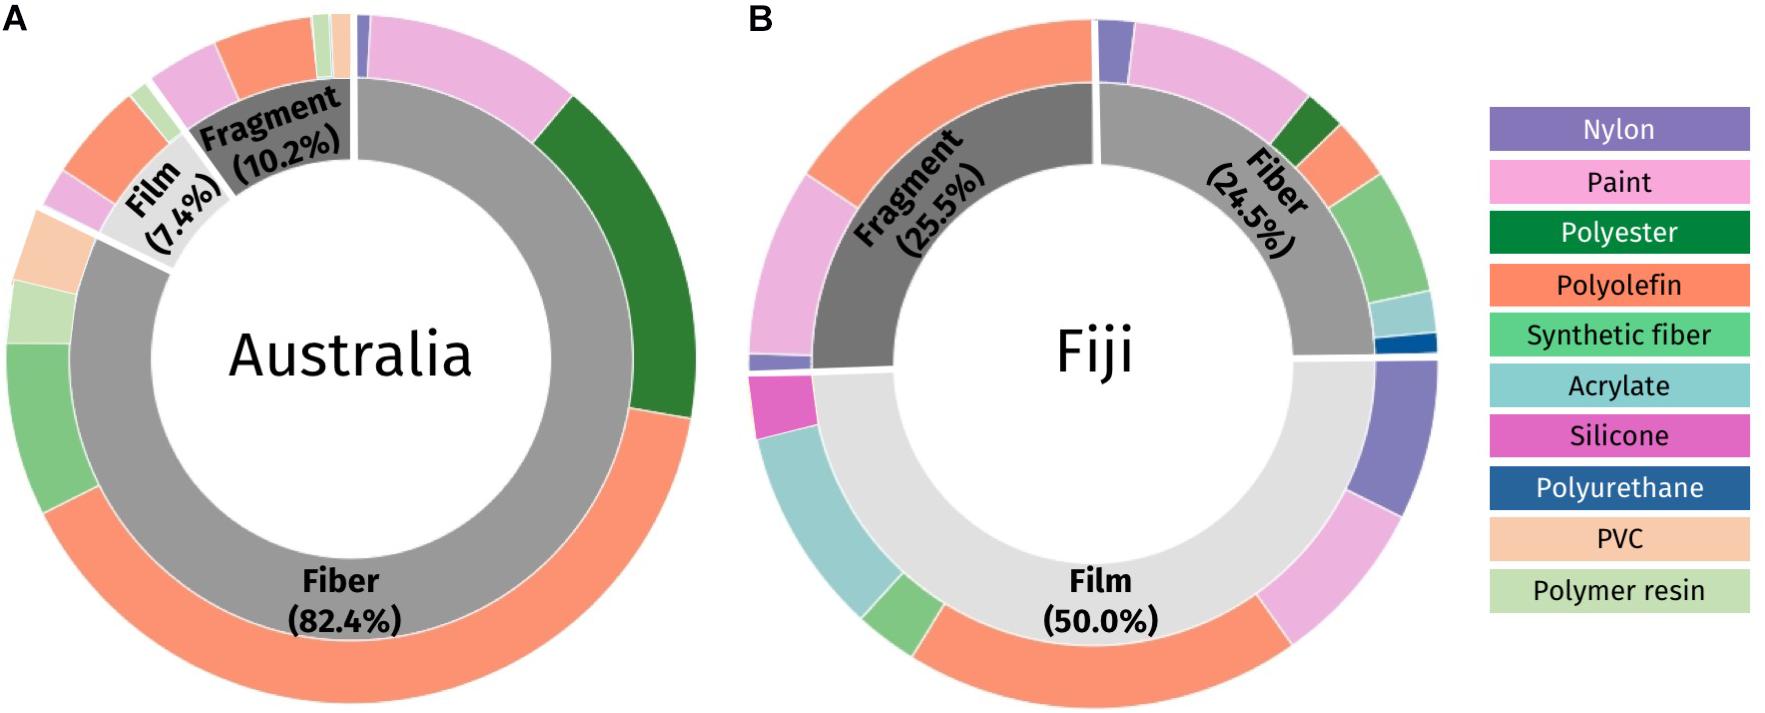
Figure 6. Different types of microplastic found in the gastrointestinal tract of fish in Australia (A) and Fiji (B). The inner layer shows the plastic types identified under the microscope (fiber, fragment, and film) in shades of gray; the outer layer shows the plastic polymer groups confirmed using the μ-FTIR (Supplementary Table 1).
The polymer type of plastic pieces varied between countries and within the type of microplastic (fiber, fragment and film, Figure 6). In fish from Australia, pieces of microplastic were dominated by polyolefin (48.2% of all fibers, film and fragments from Australia; Figure 6A). Polyolefins are a broad polymer group that includes polyethylene (75% of all Australian polyolefins), ethylene-vinyl acetate (11%), synthetic rubber (5.5%), polypropylene (5.5%), and polystyrene (3%) (see Supplementary Table 1). In fish from Fiji, polyolefin was also the most abundant polymer group identified, with 38% of all plastic falling in this category. This included polyethylene (36% of Fiji polyolefins), ethylene-vinyl acetate (26%), polypropylene (15%), polystyrene (10%), and other polymers such as polyurethane and synthetic rubber (Supplementary Table 1).
Within the fiber morphotype, polyolefin fibers (49.5% of all Australian fibers) were the most prominent, followed by polyester with 20% (Figure 6A and Supplementary Table 1). Synthetic fibers (10.1% of Australian fibers), were also substantial and were composed of a combination of elastane, lycra, rayon and spandex mixed with natural materials such as cotton and wool. In Fiji, the fibers were dominated by paint (36.0% of fibers from Fiji). Despite this, a total of seven polymer groups were identified in fibers from both countries, with five present in both (pure nylon, paint, polyester, polyolefin and synthetic fiber). Fiji additionally had small numbers of acrylate and polyurethane filaments (n = 2, n = 1, respectively) and Australia had PVC (Poly Vinyl Chloride) and polymer resin filaments identified (n = 4, n = 3, respectively).
In general, film pieces from Australia had less diversity in their polymer types compared to Fiji, with only three polymers identified (Supplementary Table 1) while Fiji had six different polymer groups, including polyolefin (37.3%), acrylate (19.6%), paint, nylon, and silicone (Figure 6B and Supplementary Table 1). Within these six polymer groups there were 14 polymers identified, with polyethylene dominating (24% of all film pieces from Fiji). Fragments were less common in both countries but when present were mostly polyolefin and paint. Additionally, Australia had one piece of both polymer resin and PVC; while Fiji had one piece of nylon.
Results of the CAP analysis revealed an overall high level of accuracy of classification of fish to their country of origin, based on the amount and type of plastic found in their gastrointestinal tracts. Cross-validated classification results varied between countries, with an overall correct classification of 73.96% to the respective country where the fish were caught.
Discussion
All of our five species of fish (L. gibbus, M. cephalus, P. indicus, P. leopardus, U. lineatus) consumed microplastic. Overall, 61.6% of fish from Australia and 35.3% of fish from Fiji had microplastic in their gastrointestinal tract contents, with higher average plastic loads in Australian (1.58 pieces) fish compared with those from Fiji (0.86 pieces). Microplastic was found in fish species across different trophic levels (carnivores, detrivores) and habitats (reef, seagrass, sediment/sand, open seas, and rocky reef). All five species sampled are important fishery species in both countries, supporting the economy, employment, and food sources of their respective populations. Therefore, quantifying the base levels of microplastic in these species provides leverage for future risk assessment and an understanding of the levels of potential contamination present in seafood to evaluate potential risks to human consumption.
Research on microplastic ingestion in fish from the South Pacific is limited. One of the more recently published studies (Markic et al., 2018), collected fish from markets across four South Pacific countries (New Zealand, Samoa, Tahiti and Rapa Nui), finding that across all regions on average 24.3% of fish ingested plastic, much lower than the 61.6% in our Australian fish and 35.3% in Fijian fish that we found in our study. The range between countries is broad, but encompasses values similar to those in which we found, with 49.2% of fish from Rapa Nui containing microplastic. Another study investigating fish from a variety of small islands across the South Pacific (Lord Howe Island, French Polynesia and Henderson Island) also found lower numbers of fish with plastic than what our study identified, with Forrest and Hindell (2018) only detecting ten fish from the 126 individuals (7.9%) collected to have microplastic present. Both studies (Forrest and Hindell, 2018; Markic et al., 2018) include species from similar habitats (benthic and rocky reef) to the fishes in our study, however, plastic contamination still varied to our results, with both higher and lower amounts of plastic found in similar species. The only study to our knowledge investigating fish from Fiji found 68% of fish to ingest microplastic, with an average of 5.5 pieces per fish (Ferreira et al., 2020), and these findings are much higher than what we found in the fish we sampled from Fiji (FO–35.3%, PL–0.86). Research is more prominent in Australia where at least six separate studies have identified microplastic in fish from the region (Cannon et al., 2016; Halstead et al., 2018; Kroon J. F. et al., 2018; Jensen et al., 2019; Su et al., 2019; Crutchett et al., 2020). Kroon J. F. et al. (2018) and Jensen et al. (2019) found much higher levels of contamination than our fish, with both studies finding 95% of fish sampled from the Great Barrier Reef had micro debris present. Clearly, there are discrepancies across currently published data investigating microplastic in fish from the South Pacific; with differences potentially caused by the locations sampled and the waste management from these regions, population sizes of countries, currents and environments retaining or depositing microplastic from offshore, or due to the methodology implemented.
Methods used for detection of microplastic have varied over time, with improvements in technical abilities since microplastic research has increased in popularity (Savoca et al., 2021). Some researchers used only naked-eye (e.g., Forrest and Hindell, 2018) or microscope detection (e.g., Cannon et al., 2016) to visualize the gastrointestinal tract content. Although these methods were initially accepted in microplastic research, the trend in analytical methods are moving toward more robust and standardized laboratory procedures, including a digestion of the gastrointestinal tract content and chemical verification of the polymers (Markic et al., 2019; Savoca et al., 2021). In our study, we ensured we followed the highest standard of methodology, using a chemical digestion, large sample sizes, contamination controls and confirmation of polymers using a chemical verification, such as FTIR (Wesch et al., 2016; Hermsen et al., 2017; Lusher et al., 2017). Although we understand the difficulty with implementing a more complex procedure, particularly in countries were resources are limited, it is likely that previous studies may have underestimated the abundance of microplastic in fish from the South Pacific (e.g., Cannon et al., 2016 where only 0.3% of fish sampled contained microplastic). It is thought that increasing counts of plastic in recent studies is a combination of an improvement in analytical methodology, as well as a likely increase in the fish ingesting plastic more frequently as it becomes more abundant in the environment (Savoca et al., 2021).
Initially, it was predicted that Australia may have less microplastic in fish than Fiji because in recent years Australia has made positive moves forward in its waste management and legislation surrounding plastic use. Specifically, in 2018 the Queensland state government released a comprehensive “Waste Management and Resource Recovery Strategy,” including the implementation of “Queensland’s Plastic Pollution Reduction Plan”(Queensland Government, 2018a, b). These legislations included the execution of a single-use plastic bag ban, a container deposit scheme, as well as stricter enforcement on illegal dumping and littering (Queensland Government, 2018a). In contrast, in Fiji, waste management strategies are rare, and at the time of sampling the fish in our study, there were no bans on plastic bags, and very limited waste management facilities. In a positive move, there have been recent advances in the management of plastics in Fiji, with a plastic bag ban being enforced at the beginning of 2020, and prohibitions on other plastic items (e.g., Styrofoam and plastic straws) commencing at the start of 2021. With our sampling occurring at the beginning of 2019, these policies had not yet been implemented or had an effect. Despite our initial predictions that Fiji would have higher levels of microplastic in their fish, this was not found to be evident, as overall Australia had both higher frequency of occurrence of plastic ingestion and the plastic load in their fish compared to Fiji. It is likely that neither Australia nor Fiji’s recent plans to reduce their plastic output would have had substantive effect on the microplastic presence in such a short time period. Due to the long breakdown time of plastic, the microplastic identified in this study may have been introduced in the environment before the new regulations, nevertheless we expect to see positive effects of these plastic reduction plans over the years and in future assessments. This perpetual microplastic may have been amassing in oceanic accumulation zones, where ocean currents and gyres cause microplastic to gather in particular marine regions. Fish with exposure to these regions are likely to consume more microplastic as a consequence of higher likelihood of microplastic interactions, as well as a limitation to food availability due to the oligotrophic nature of the water (Sigman and Hain, 2012). Although neither Fiji or Australia are located specifically within a microplastic gyre, the currents surrounding both regions suggest high levels of microplastic present in the water, which are likely linked to the microplastic found in fish (Lebreton et al., 2012; Eriksen et al., 2014).
Overall, differences in in population size between the two countries could explain the results, with highly populated coastal regions generally associated with higher densities of plastic debris (Lebreton et al., 2012). Fiji is relatively sparsely populated, with a population size of roughly 900,000, of which around 896,000 live on the coastline (Jambeck et al., 2015). In contrast, in Australia the population is 25 million people, of which 80% reside on the coast (Yang and Kelly, 2015). The east coast, where the fish from this study were caught is particularly dense. The differences in population sizes also mean there is a stark difference in the amount of waste produced each day, with Australia predicted to produce eleven times more plastic waste than Fiji (Jambeck et al., 2015). Land-based effluent discharges are a contributor of microplastic in our waterways, with quality sewage treatment systems acting as a filter to limit their outflow (Siegfried et al., 2017). Depending on the treatment type, one treatment plant in Sydney, on Australia’s eastern coast, is thought to discharge between 3.6 and 460 million microplastic pieces into marine systems daily (Ziajahromi et al., 2017). Australia’s increase in plastic waste production, as well as land-based effluent discharges, could be influencing the difference in plastic abundance between the countries, however waste management strategies and differing lifestyles could also be having an impact, particularly in the type of plastics identified.
The microplastic found in Fiji fish were dominated by sheets of plastic film, which are commonly secondary microplastic, broken down from original larger pieces of plastic. These could be from a range of sources such as polypropylene or polyethylene (29% of film from Fiji), potentially from plastic bags and soft food packaging, or acrylate and paint chips (also 29% of film from Fiji) possibly from boats. The issues surrounding waste management strategies in small island developing states such as Fiji could be contributing to this, as incorrect use of landfill and disposal could mean larger plastic items are entering the waterways and subsequently eroded into microplastic (Mohee et al., 2015; Hardesty et al., 2017). In contrast, the landfill management in Australia, as well as legislation, policies and education programs, could be contributing to the lower numbers of fragments and film, as the likelihood of hard or larger pieces of plastic are prevented from entering the ocean in the first place (Willis et al., 2018). In Australia, over 80% of the microplastic identified were fibers, a pervasive microplastic in the marine environment, commonly formed from synthetic clothing and fishing gear (Browne et al., 2011; De Falco et al., 2019). Australia’s larger population, as well as the fact that one load of washing may contribute up to 1.5 million pieces of microplastic, may both be contributing to these large numbers of fibers (De Falco et al., 2019). High levels of fibers in fish from developed countries with large populations is evident in other studies. Markic et al. (2018) found New Zealand fish had higher quantities of fibers compared to fish from Samoa, which had more fragments and film. Further, a study from Rochman et al. (2015) comparing fish and bivalves purchased from markets in Indonesia and the United States found that the United States had much larger proportions of microplastic fibers in their fish compared to Indonesia. These comparison studies showing high quantities of fibers in developed countries are noteworthy, and perhaps indicative of a further link between differing lifestyles of populations and environmental plastic contamination.
With global consumption of seafood on the rise, understanding the potential risks and challenges that could transpire from microplastic contamination in seafood is more important than ever (FAO, 2020). The physical and toxicological harm that microplastic could potentially cause to fish and their ecosystems could be a threat to local food security, particularly in communities that rely on seafood as a key source of protein (Béné, 2006; Rochman et al., 2016). The long term exposure of microplastic, and the chemicals associated with them, have the ability to negatively affect fish health, potentially impacting the long term sustainability of fisheries (Smith et al., 2018). The spread of microplastic throughout global marine ecosystems have generated concern about whether microplastic ingestion in seafood could penetrate the food web and eventually be consumed by humans. The fish species sampled in this study are mostly eaten after their gastrointestinal tracts are removed, thus the chance of human consumption of the microplastic in this case is low (Dawson et al., 2021). It is important consumers ensure fish are appropriately gutted prior to consumption. In doing so, they are lowering the risk of microplastic contamination from their diets. However, there is still a potential risk to humans as a result of the uptake and translocation of microplastics and their associated chemicals into the flesh of the fish (Teuten et al., 2009). The mechanisms behind this uptake, and the link between long term exposure of microplastic, and the potential for chemicals to translocate is still understudied, and requires more research effort in the future (Ory et al., 2018; Smith et al., 2018). Furthermore, the risk of consumption of microplastic from a human health perspective is still far from being well understood (Smith et al., 2018; Vethaak and Legler, 2021).
Linking variations in the abundance and type of microplastic present in coastal environments and local biota is an area that requires further investigation. Likewise, understanding the type of plastic present, their location of origin and unraveling the pathways these plastics take to reach the marine environment is crucial to developing solutions for microplastic contamination (Kane and Clare, 2019; Petersen and Hubbart, 2021). While plastic presence across coastal environments is widespread, there are a suite of reasonable intervention points that could help lower its impact, from initial production, to disposal, which would assist in reducing plastic entering the marine environment in the first place (Tibbetts et al., 2018; Prata et al., 2019; Petersen and Hubbart, 2021). By further investigating these avenues, we can begin to create answers to limit the presence of microplastic in marine wildlife and fish species. As yet, we do not yet know how these microplastic may be negatively affecting fish health (Ory et al., 2018), how plastic may be impacting human health or if bioaccumulation and biomagnification of chemicals are occurring (Walkinshaw et al., 2020). However, for now, we can say that fish in the South Pacific are consuming microplastics, and the numbers differ between the two countries. Our results provide important baseline data which can be combined with future data to give a broad picture of microplastic contamination in seafood in the South Pacific.
Data Availability Statement
The raw data supporting the conclusions of this article will be made available by the authors, without undue reservation.
Ethics Statement
Ethical review and approval was not required for the animal study because samples were purchased through seafood markets.
Author Contributions
NW collected the data, undertook the data analysis, wrote the manuscript, and prepared the figures and tables. BG and PR-S reviewed the manuscript, figures, and tables. BG, PR-S, and MF provided advice and guidance throughout the study. All authors conceived the project idea and designed the data analysis.
Funding
This research was supported by the Australian Government Research Training Program Scholarship awarded to NW. This research is supported by funding from the UK’s Department for Business, Energy & Industrial Strategy (BEIS), and provided open access by funding from Waitrose & Partners, through the Blue Charter programme implemented by the Association of Commonwealth Universities (ACU). We also acknowledge the Fisheries Research Development Corporation (2017-199) and the University of Adelaide for supplying the generous funds to complete this research. The authors declare that this study received funding from Waitrose and Partners. The funder was not involved in the study design, collection, analysis, interpretation of data, the writing of this article or the decision to submit it for publication.
Conflict of Interest
The authors declare that the research was conducted in the absence of any commercial or financial relationships that could be construed as a potential conflict of interest.
Acknowledgments
We are grateful to Koster Sarakinis, Rufino Varea, Andrew Paris, Jasha Dehm, and Laura Williams for assisting with sample processing and support. We are very thankful to all the seafood suppliers who provided samples for this study. We thank Steven Delean who assisted greatly in some of the statistical analysis included in this study.
Supplementary Material
The Supplementary Material for this article can be found online at: https://www.frontiersin.org/articles/10.3389/fmars.2021.690991/full#supplementary-material
References
Anderson, M. J., and Willis, T. J. (2003). Canonical analysis of principal coordinates: a useful method of constrained ordination for ecology. Ecology 84, 511–525. doi: 10.1890/0012-9658(2003)084[0511:caopca]2.0.co;2
Baalkhuyur, F. M., Bin Dohaish, E. J. A., Elhalwagy, M. E. A., Alikunhi, N. M., Alsuwailem, A. M., Røstad, A., et al. (2018). Microplastic in the gastrointestinal tract of fishes along the Saudi Arabian Red Sea coast. Mar. Pollut. Bull. 131, 407–415. doi: 10.1016/j.marpolbul.2018.04.040
Bakir, A., Rowland, S. J., and Thompson, R. C. (2014). Transport of persistent organic pollutants by microplastics in estuarine conditions. Estuar. Coast. Shelf Sci. 140, 14–21. doi: 10.1016/j.ecss.2014.01.004
Barnes, D. K. A., Galgani, F., Thompson, R. C., and Barlaz, M. (2009). Accumulation and fragmentation of plastic debris in global environments. Philos. Trans. R. Soc. B Biol. Sci. 364, 1985–1998. doi: 10.1098/rstb.2008.0205
Becker, R., Wilks, R. A., Brownrigg, R., Minka, T. P., and Deckmyn, A. (2018). “maps: Draw Geographical Maps”. R Package Version 3.3.0.
Béné, C. (2006). Small-scale Fisheries: Assessing Their Contribution to Rural Livelihoods in Developing Countries. Rome: FAO.
Besseling, E., Foekema, E. M., Van Franeker, J. A., Leopold, M. F., Kühn, S., Bravo Rebolledo, E. L., et al. (2015). Microplastic in a macro filter feeder: humpback whale Megaptera novaeangliae. Mar. Pollut. Bull. 95, 248–252. doi: 10.1016/j.marpolbul.2015.04.007
Bivand, R. R., and Rundel, C. (2020). rgeos: Interface to Geometry Engine - Open Source (‘GEOS’) R Package Version 0.5-5.
Bostock, M., Rodden, K., Warne, K., and Russell, K. (2020). sunburstR: Sunburst ‘Htmlwidget. R Package Version 2.1.5.
Browne, M. A., Crump, P., Niven, S. J., Teuten, E., Tonkin, A., Galloway, T., et al. (2011). Accumulation of microplastic on shorelines Woldwide: sources and sinks. Environ. Sci. Technol. 45, 9175–9179. doi: 10.1021/es201811s
Burkhardt-Holm, P., and N’Guyen, A. (2019). Ingestion of microplastics by fish and other prey organisms of cetaceans, exemplified for two large baleen whale species. Mar. Pollut. Bull. 144, 224–234. doi: 10.1016/j.marpolbul.2019.04.068
Cannon, S. M. E., Lavers, J. L., and Figueiredo, B. (2016). Plastic ingestion by fish in the Southern Hemisphere: a baseline study and review of methods. Mar. Pollut. Bull. 107, 286–291. doi: 10.1016/j.marpolbul.2016.03.057
Crutchett, T., Paterson, H., Ford, B. M., and Speldewinde, P. (2020). Plastic ingestion in sardines (Sardinops sagax) from Frenchman Bay, Western Australia, highlights a problem in a ubiquitous fish. Front. Mar. Sci. 7:526. doi: 10.3389/fmars.2020.00526
da Costa, J. P., Santos, P. S. M., Duarte, A. C., and Rocha-Santos, T. (2016). (Nano)plastics in the environment - Sources, fates and effects. Sci. Total Environ. 566–567, 15–26. doi: 10.1016/j.scitotenv.2016.05.041
Dawson, A. L., Santana, M. F. M., Miller, M. E., and Kroon, F. J. (2021). Relevance and reliability of evidence for microplastic contamination in seafood: a critical review using Australian consumption patterns as a case study. Environ. Pollut. 276:116684. doi: 10.1016/j.envpol.2021.116684
De Falco, F., Di Pace, E., Cocca, M., and Avella, M. (2019). The contribution of washing processes of synthetic clothes to microplastic pollution. Sci. Rep. 9:6633.
Dehaut, A., Cassone, A. L., Frère, L., Hermabessiere, L., Himber, C., Rinnert, E., et al. (2016). Microplastics in seafood: benchmark protocol for their extraction and characterization. Environ. Pollut. 215, 223–233. doi: 10.1016/j.envpol.2016.05.018
Eriksen, M., Lebreton, L. C. M., Carson, H. S., Thiel, M., Moore, C. J., Borerro, J. C., et al. (2014). Plastic pollution in the world’s oceans: more than 5 trillion plastic pieces weighing over 250,000 tons afloat at sea. PLoS One 9:e111913. doi: 10.1371/journal.pone.0111913
Ferreira, M., Thompson, J., Paris, A., Rohindra, D., and Rico, C. (2020). Presence of microplastics in water, sediments and fish species in an urban coastal environment of Fiji, a Pacific small island developing state. Mar. Pollut. Bull. 153:110991. doi: 10.1016/j.marpolbul.2020.110991
Foekema, E. M., De Gruijter, C., Mergia, M. T., Van Franeker, J. A., Murk, A. J., and Koelmans, A. A. (2013). Plastic in North Sea fish. Environ. Sci. Technol. 47, 8818–8824. doi: 10.1021/es400931b
Forrest, A. K., and Hindell, M. (2018). Ingestion of plastic by fish destined for human consumption in remote South Pacific Islands. Austr. J. Maritime Ocean Affairs 10, 81–97. doi: 10.1080/18366503.2018.1460945
Garnier, Y., Jacob, H., Guerra, A. S., Bertucci, F., and Lecchini, D. (2019). Evaluation of microplastic ingestion by tropical fish from Moorea Island, French Polynesia. Mar. Pollut. Bull. 140, 165–170.
Halstead, J. E., Smith, J. A., Carter, E. A., Lay, P. A., and Johnston, E. L. (2018). Assessment tools for microplastics and natural fibres ingested by fish in an urbanised estuary. Environ. Pollut. 234, 552–561. doi: 10.1016/j.envpol.2017.11.085
Hantoro, I., Löhr, A. J., Van Belleghem, F. G. A. J., Widianarko, B., and Ragas, A. M. J. (2019). Microplastics in coastal areas and seafood: implications for food safety. Food Addit. Contamin. Part A Chem. Analys. Control Exposure Risk Assess. 36, 674–711. doi: 10.1080/19440049.2019.1585581
Hardesty, B. D., Lawson, T. J., Van Der Velde, T., Lansdell, M., and Wilcox, C. (2017). Estimating quantities and sources of marine debris at a continental scale. Front. Ecol. Environ. 15, 18–25. doi: 10.1002/fee.1447
Hermabessiere, L., Dehaut, A., Paul-Pont, I., Lacroix, C., Jezequel, R., Soudant, P., et al. (2017). Occurrence and effects of plastic additives on marine environments and organisms: a review. Chemosphere 182, 781–793. doi: 10.1016/j.chemosphere.2017.05.096
Hermsen, E., Mintenig, S. M., Besseling, E., and Koelmans, A. A. (2018). Quality criteria for the analysis of microplastic in biota samples: a critical review. Environ. Sci. Technol. 52, 10230–10240. doi: 10.1021/acs.est.8b01611
Hermsen, E., Pompe, R., Besseling, E., and Koelmans, A. A. (2017). Detection of low numbers of microplastics in North Sea fish using strict quality assurance criteria. Mar. Pollut. Bull. 122, 253–258. doi: 10.1016/j.marpolbul.2017.06.051
Højsgaard, D., and Halekoh, U. (2020). doBy: Groupwise Statistics, Lsmeans, Linear Contrasts, Utilities R Package Version. 4.6.7.
Jambeck, J. R., Geyer, R., Wilcox, C., Siegler, T. R., Perryman, M., Andrady, A., et al. (2015). Plastic waste inputs from land into the ocean. Science 347, 768–771. doi: 10.1126/science.1260352
Jensen, L. H., Motti, C. A., Garm, A. L., Tonin, H., and Kroon, F. J. (2019). Sources, distribution and fate of microfibres on the Great Barrier Reef, Australia. Sci. Rep. 9:9021.
Jung, M. R., Horgen, F. D., Orski, S. V., Rodriguez, C. V., Beers, K. L., Balazs, G. H., et al. (2018). Validation of ATR FT-IR to identify polymers of plastic marine debris, including those ingested by marine organisms. Mar. Pollut. Bull. 127, 704–716. doi: 10.1016/j.marpolbul.2017.12.061
Kane, I. A., and Clare, M. A. (2019). Dispersion, accumulation, and the ultimate fate of microplastics in deep-marine environments: a review and future directions. Front. Earth Sci. 7:80. doi: 10.3389/feart.2019.00080
Kelman, I., and West, J. J. (2009). Climate change and small Island developing states: a critical review. Ecol. Environ. Anthropol. 5, 1–16. doi: 10.1002/9781119132851.ch1
Kroon, F., Motti, C., Talbot, S., Sobral, P., and Puotinen, M. (2018). A workflow for improving estimates of microplastic contamination in marine waters: a case study from North-Western Australia. Environ. Pollut. 238, 26–38. doi: 10.1016/j.envpol.2018.03.010
Kroon, J. F., Motti, C., Jensen, L., and Berry, K. (2018). Classification of marine microdebris: a review and case study on fish from the Great Barrier Reef, Australia. Sci. Rep. 8:16422.
Lachmann, F., Almroth, B. C., Baumann, H., Broström, G., Corvellec, H., Gipperth, L., et al. (2017). Marine plastic litter on small island developing States (SIDS): impacts and measures. Swed. Instit. Mar. Environ. 4, 1–76.
Lebreton, L. C. M., Greer, S. D., and Borrero, J. C. (2012). Numerical modelling of floating debris in the world’s oceans. Mar. Pollut. Bull. 64, 653–661. doi: 10.1016/j.marpolbul.2011.10.027
Length, R., Buerkner, P., Herve, M., Love, J., Hannes, R., and Singmann, H. (2020). Estimated Marginal Means, aka Least-Squares Means. R Package Version. 1.6.0.
Li, W. C., Tse, H. F., and Fok, L. (2016). Plastic waste in the marine environment: a review of sources, occurrence and effects. Sci. Total Environ. 566–567, 333–349. doi: 10.1016/j.scitotenv.2016.05.084
Lusher, A. L., Welden, N. A., Sobral, P., and Cole, M. (2017). Sampling, isolating and identifying microplastics ingested by fish and invertebrates. Analyt. Methods 9, 1346–1360. doi: 10.1039/c6ay02415g
Markic, A., Gaertner, J. C., Gaertner-Mazouni, N., and Koelmans, A. A. (2019). Plastic ingestion by marine fish in the wild. Critic. Rev. Environ. Sci. Technol. 50, 657–697. doi: 10.1080/10643389.2019.1631990
Markic, A., Niemand, C., Bridson, J. H., Mazouni-Gaertner, N., Gaertner, J. C., Eriksen, M., et al. (2018). Double trouble in the South Pacific subtropical gyre: increased plastic ingestion by fish in the oceanic accumulation zone. Mar. Pollut. Bull. 136, 547–564. doi: 10.1016/j.marpolbul.2018.09.031
Mohee, R., Mauthoor, S., Bundhoo, Z. M. A., Somaroo, G., Soobhany, N., and Gunasee, S. (2015). Current status of solid waste management in small island developing states: a review. Waste Manag. 43, 539–549. doi: 10.1016/j.wasman.2015.06.012
Murphy, F., Russell, M., Ewins, C., and Quinn, B. (2017). The uptake of macroplastic & microplastic by demersal & pelagic fish in the Northeast Atlantic around Scotland. Mar. Pollut. Bull. 122, 353–359. doi: 10.1016/j.marpolbul.2017.06.073
Nadal, M. A., Alomar, C., and Deudero, S. (2016). High levels of microplastic ingestion by the semipelagic fish bogue Boops boops (L.) around the Balearic Islands. Environ. Pollut. 214, 517–523. doi: 10.1016/j.envpol.2016.04.054
Ory, N. C., Gallardo, C., Lenz, M., and Thiel, M. (2018). Capture, swallowing, and egestion of microplastics by a planktivorous juvenile fish. Environ. Pollut. 240, 566–573. doi: 10.1016/j.envpol.2018.04.093
Page, B., Mckenzie, J., Mcintosh, R., Baylis, A., Morrissey, A., Calvert, N., et al. (2004). Entanglement of Australian sea lions and New Zealand fur seals in lost fishing gear and other marine debris before and after Government and industry attempts to reduce the problem. Mar. Pollut. Bull. 49, 33–42. doi: 10.1016/j.marpolbul.2004.01.006
Pebesma, E. (2018). Simple features for R: standardized support for spatial vector data. R J. 10, 439–446. doi: 10.32614/rj-2018-009
Pedà, C., Caccamo, L., Fossi, M. C., Gai, F., Andaloro, F., Genovese, L., et al. (2016). Intestinal alterations in European sea bass Dicentrarchus labrax (Linnaeus, 1758) exposed to microplastics: preliminary results. Environ. Pollut. 212, 251–256. doi: 10.1016/j.envpol.2016.01.083
Peng, X., Chen, M., Chen, S., Dasgupta, S., Xu, H., Ta, K., et al. (2018). Microplastics contaminate the deepest part of the world’s ocean. Geochem. Perspect. Lett. 9, 1–5. doi: 10.7185/geochemlet.1829
Petersen, F., and Hubbart, J. A. (2021). The occurrence and transport of microplastics: the state of the science. Sci. Total Environ. 758:143936. doi: 10.1016/j.scitotenv.2020.143936
Pierce, K. E., Harris, R. J., Larned, L. S., and Pokras, M. A. (2004). Obstruction and starvation associated with plastic ingestion in a Northern Gannet Morus bassanus and a Greater Shearwater Puffinus gravis. Mar. Ornithol. 32, 187–189.
Prata, J. C., Silva, A. L. P., Da Costa, J. P., Mouneyrac, C., Walker, T. R., Duarte, A. C., et al. (2019). Solutions and integrated strategies for the control and mitigation of plastic and Microplastic pollution. Intern. J. Environ. Res. Public Health 16:2411. doi: 10.3390/ijerph16132411
Primpke, S., Wirth, M., Lorenz, C., and Gerdts, G. (2018). Reference database design for the automated analysis of microplastic samples based on Fourier transform infrared (FTIR) spectroscopy. Analyt. Bioanalyt. Chem. 410, 5131–5141. doi: 10.1007/s00216-018-1156-x
Provencher, J. F., Bond, A. L., Avery-Gomm, S., Borrelle, S. B., Rebolledo, E. L. B., Hammer, S., et al. (2017). Quantifying ingested debris in marine megafauna: a review and recommendations for standardization. Analytic. Methods 9, 1454–1469. doi: 10.1039/c6ay02419j
Queensland Government (2018a). Queensland’s Plastic Pollution Reduction Plan. Queensland: Queensland Government. doi: 10.1039/c6ay02419j (accessed July 30, 2020).
Queensland Government (2018b). Waste Management and Resource Recovery Strategy. Queensland: Queensland Government. (accessed July 30, 2020).
Reisser, J., Shaw, J., Wilcox, C., Hardesty, B. D., Proietti, M., Thums, M., et al. (2013). Marine plastic pollution in waters around Australia: characteristics, concentrations, and pathways. PLoS One 8:e80466. doi: 10.1371/journal.pone.0080466
Rochman, C. M., Browne, M. A., Halpern, B. S., Hentschel, B. T., Hoh, E., Karapanagioti, H. K., et al. (2013). Policy: classify plastic waste as hazardous. Nature 494, 169–170.
Rochman, C. M., Browne, M. A., Underwood, A. J., Van Franeker, J. A., Thompson, R. C., and Amaral-Zettler, L. A. (2016). The ecological impacts of marine debris: unraveling the demonstrated evidence from what is perceived. Ecology 97, 302–312. doi: 10.1890/14-2070.1
Rochman, C. M., Lewison, R. L., Eriksen, M., Allen, H., Cook, A. M., and Teh, S. J. (2014). Polybrominated diphenyl ethers (PBDEs) in fish tissue may be an indicator of plastic contamination in marine habitats. Sci. Total Environ. 476–477, 622–633. doi: 10.1016/j.scitotenv.2014.01.058
Rochman, C. M., Tahir, A., Williams, S. L., Baxa, D. V., Lam, R., Miller, J. T., et al. (2015). Anthropogenic debris in seafood: plastic debris and fibers from textiles in fish and bivalves sold for human consumption. Sci. Rep. 5:14340.
Savoca, M. S., Mcinturf, A. G., and Hazen, E. L. (2021). Plastic ingestion by marine fish is widespread and increasing. Glob. Chang. Biol. 27, 2188–2199. doi: 10.1111/gcb.15533
Sequeira, I. F., Prata, J. C., Da Costa, J. P., Duarte, A. C., and Rocha-Santos, T. (2020). Worldwide contamination of fish with microplastics: a brief global overview. Mar. Pollut. Bull. 160:111681. doi: 10.1016/j.marpolbul.2020.111681
Siegfried, M., Koelmans, A. A., Besseling, E., and Kroeze, C. (2017). Export of microplastics from land to sea. A modelling approach. Water Res. 127, 249–257. doi: 10.1016/j.watres.2017.10.011
Sigman, D. M., and Hain, M. P. (2012). The biological productivity of the ocean. Nat. Educ. Knowl. 3, 1–16.
Smith, M., Love, D. C., Rochman, C. M., and Neff, R. A. (2018). Microplastics in seafood and the implications for human health. Curr. Environ. Health Rep. 5, 375–386. doi: 10.1007/s40572-018-0206-z
South, A. (2017a). “rnaturalearth: World Map Data from Natural Earth” R Package Version 0.1.0. Available online at: https://cran.r-project.org/web/packages/rnaturalearth/rnaturalearth.pdf (accessed July 30, 2020).
South, A. (2017b). “rnaturalearthdata: World Vector Map Data from Natural Earth Used in ‘rnaturalearth”’ R Package Version 0.1.0. Available online at: https://CRAN.R-project.org/package=rnaturalearthdata (accessed July 30, 2020).
Stamper, M. A., Spicer, C. W., Neiffer, D. L., Mathews, K. S., and Fleming, G. J. (2009). Morbidity in a juvenile green sea turtle (Chelonia mydas) due to ocean-borne plastic. J. Zoo Wildlife Med. 40, 196–198. doi: 10.1638/2007-0101.1
Steer, M., Cole, M., Thompson, R. C., and Lindeque, P. K. (2017). Microplastic ingestion in fish larvae in the western English Channel. Environ. Pollut. 226, 250–259. doi: 10.1016/j.envpol.2017.03.062
Su, L., Nan, B., Hassell, K. L., Craig, N. J., and Pettigrove, V. (2019). Microplastics biomonitoring in Australian urban wetlands using a common noxious fish (Gambusia holbrooki). Chemosphere 228, 65–74. doi: 10.1016/j.chemosphere.2019.04.114
Teuten, E. L., Saquing, J. M., Knappe, D. R. U., Barlaz, M. A., Jonsson, S., Björn, A., et al. (2009). Transport and release of chemicals from plastics to the environment and to wildlife. Philos. Trans. R. Soc. B Biol. Sci. 364, 2027–2045.
Thiele, C. J., Hudson, M. D., and Russell, A. E. (2019). Evaluation of existing methods to extract microplastics from bivalve tissue: adapted KOH digestion protocol improves filtration at single-digit pore size. Mar. Pollut. Bull. 142, 384–393. doi: 10.1016/j.marpolbul.2019.03.003
Tibbetts, J., Krause, S., Lynch, I., and Sambrook Smith, G. H. (2018). Abundance, distribution, and drivers of microplastic contamination in urban river environments. Water 10:1597. doi: 10.3390/w10111597
Turrell, W. R. (2020). Estimating a regional budget of marine plastic litter in order to advise on marine management measures. Mar. Pollut. Bull. 150:110725. doi: 10.1016/j.marpolbul.2019.110725
Walkinshaw, C., Lindeque, P. K., Thompson, R., Tolhurst, T., and Cole, M. (2020). Microplastics and seafood: lower trophic organisms at highest risk of contamination. Ecotoxicol. Environ. Saf. 190:110066. doi: 10.1016/j.ecoenv.2019.110066
Wesch, C., Bredimus, K., Paulus, M., and Klein, R. (2016). Towards the suitable monitoring of ingestion of microplastics by marine biota: a review. Environ. Pollut. 218, 1200–1208. doi: 10.1016/j.envpol.2016.08.076
Wickham, H., Averick, M., Bryan, J., Chang, W., D’agostino Mcgowan, L., Francois, R., et al. (2019). Welcome to the tidyverse. J. Open Source Softw. 4:1686. doi: 10.21105/joss.01686
Wilcox, C., Van Sebille, E., Hardesty, B. D., and Estes, J. A. (2015). Threat of plastic pollution to seabirds is global, pervasive, and increasing. Proc. Natl. Acad. Sci. U.S.A. 112, 11899–11904. doi: 10.1073/pnas.1502108112
Willis, K., Maureaud, C., Wilcox, C., and Hardesty, B. D. (2018). How successful are waste abatement campaigns and government policies at reducing plastic waste into the marine environment? Mar. Policy 96, 243–249. doi: 10.1016/j.marpol.2017.11.037
Worm, B., Lotze, H. K., Jubinville, I., Wilcox, C., and Jambeck, J. (2017). Plastic as a persistent marine pollutant. Ann. Rev. Environ. Resour. 42, 1–26. doi: 10.1146/annurev-environ-102016-060700
Wright, S. L., Thompson, R. C., and Galloway, T. S. (2013). The physical impacts of microplastics on marine organisms: a review. Environ. Pollut. 178, 483–492. doi: 10.1016/j.envpol.2013.02.031
Yang, S.-Q., and Kelly, S. (2015). The use of coastal reservoirs and spp strategy to provide sufficient high quality water to coastal communities. J. Geosci. Environ. Protect. 03, 80–92. doi: 10.4236/gep.2015.35010
Keywords: microplastic, ingestion, fish research, South Pacific, plastic pollution, contamination
Citation: Wootton N, Ferreira M, Reis-Santos P and Gillanders BM (2021) A Comparison of Microplastic in Fish From Australia and Fiji. Front. Mar. Sci. 8:690991. doi: 10.3389/fmars.2021.690991
Received: 05 April 2021; Accepted: 14 May 2021;
Published: 09 June 2021.
Edited by:
Gabriel Machovsky-Capuska, The University of Sydney, AustraliaReviewed by:
Muhamed Ashraf P, Central Institute of Fisheries Technology (ICAR), IndiaOlga Pantos, Institute of Environmental Science and Research (ESR), New Zealand
Copyright © 2021 Wootton, Ferreira, Reis-Santos and Gillanders. This is an open-access article distributed under the terms of the Creative Commons Attribution License (CC BY). The use, distribution or reproduction in other forums is permitted, provided the original author(s) and the copyright owner(s) are credited and that the original publication in this journal is cited, in accordance with accepted academic practice. No use, distribution or reproduction is permitted which does not comply with these terms.
*Correspondence: Nina Wootton, bmluYS53b290dG9uQGFkZWxhaWRlLmVkdS5hdQ==
†ORCID: Nina Wootton, orcid.org/0000-0001-5624-8441; Marta Ferreira, orcid.org/0000-0003-2098-066X; Patrick Reis-Santos, orcid.org/0000-0001-9843-9465; Bronwyn M. Gillanders, orcid.org/0000-0002-7680-2240
‡Deceased