 Mark Baskaran*
 Katherine Krupp
- Department of Environmental Science and Geology, Wayne State University, Detroit, MI, United States
We collected surface ocean water, snow, grab ice, ice core, melt pond and ice-rafted sediment (IRS) from 5 ice stations during the Western Arctic US GEOTRACES cruise (USGCG Healy; August 10 – October 7, 2015) and analyzed for 210Po (T1/2 = 138.4 days) and 210Pb (T1/2 = 22.3 years) in dissolved and particulate phases (snow, grab ice, ice core, surface seawater) to investigate the 210Po:210Pb disequilibria in these matrices. Thirteen aerosol samples, using a large-volume aerosol sampler (PM10), from Dutch Harbor, AK to North Pole, were also collected and analyzed for 210Po/210Pb to quantify the atmospheric depositional input to the snow and surface waters. Falling snowfall is tagged with 210Po/210Pb ratio (AR) similar to that in the air column from the cloud condensation height to air-sea interface. From the measured AR in aerosol and snow, modeling the sources of 210Po and 210Pb input to the melt pond, and measured disequilibrium in ice core and ice-rafted sediment, we show 210Po/210Pb AR is a novel chronometer to date snow, ice core, melt pond, and IRS. The calculated mean ages of aerosol, snow, melt pond and IRS are 12 ± 7 (n = 13), 13 ± 11 (n = 6), 60 ± 14 (n = 4), and 87 ± 23 (n = 6) days, respectively. The average IRS age corresponds to an average drift velocity of sediment-laden ice of 0.18 ± 0.06 (n = 6) m s–1. We report highly elevated levels of 210Po and 210Pb in snow and melt pond compared to those in Arctic surface seawater and enrichment of 210Po compared to 210Pb onto particles extracted from snow, ice and melt ponds. The observed disequilibrium between 210Po and 210Pb in ice could serve as a quantitative tool in delineating multiple-year ice from seasonal ice as well as a metric in quantifying the speed of ice/snow melting and delay in autumn freeze.
Introduction
The Arctic is undergoing drastic environmental change which has manifested in decrease in the areal extent of sea ice cover, from 6.95 million km2 in 1980 to 3.95 million km2 in 2015, ∼45% decrease which is attributed to increase in sea surface as well as surface air temperature. Earlier melt of sea ice and later freeze in the Arctic shelves lead to a longer open-water season which has impacted the biogeochemical cycling of key trace elements and isotopes due to wind-driven vertical mixing (Kipp et al., 2018; Rutgers van der Loeff et al., 2018; Grenier et al., 2019). In addition, early retreat of sea ice edge is expected to result in higher wave action which in turn, expected to affect the amount of energy transferred from wind to surface water. Ice-free shelf waters are anticipated to result in higher wind-driven upwelling which in turn is expected to increase the amount of deeper waters onto the shelf (Carmack and Chapman, 2003). Thus, the residence time of snow, ice, and melt ponds is of great interest and has bearing on the changes in the biogeochemical cycling. The age of snow, melt pond, ice and ice-rafted sediment (IRS) in the Arctic Ocean has direct relevance to the total heat energy absorbed by surface water due to differences in their albedo and heat transfer during phase change (e.g., heat absorbed by snow/ice to become liquid water) (Uttal et al., 2002).
Polonium-210 (210Po, T1/2 = 138.4 days) and lead-210 (210Pb, T1/2 = 22.3 years), progeny of radon-222 [222Rn, half-life (T1/2) = 3.82 days], the heaviest and longest-lived noble gas in the U-Th series, are particle-reactive and thus have been utilized as tracers and chronometers in environmental studies (Robbins, 1978; Turekian et al., 1977; Cochran and Masque, 2003; Rutgers van der Loeff and Geibert, 2008; Baskaran, 2016). A major fraction of 210Pb in surface ocean waters is derived from direct atmospheric deposition, which is derived from the decay of atmospheric Radon (e.g., Bacon et al., 1976). A small fraction of 222Rn, daughter of 226Ra, produced in rocks and mineral grains on the Earth’s upper crust escapes through cracks and crevices to the atmosphere. From there, it embarks on its journey in the atmosphere via advection and diffusion and produces 12 different isotopes, including 210Po and 210Pb (Turekian et al., 1977). The radon emanation rates from continents decrease with increasing latitude by a factor of 5, from 1 atom cm–2 s–1 at 30°N to 0.2 atom cm–2 s–1 at 70°N (Conan and Robertson, 2002; Baskaran, 2011). In addition, the average 222Rn emanation rate from the continental area (including land area covered by glaciers and permafrost with negligible 222Rn release) of 0.75 atom cm–2 s–1 is ∼1-2 orders of magnitude higher compared to surface waters (rivers, lakes, and ocean) (e.g., Wilkening and Clements, 1975). In the absence of 210Po from sources other than the radioactive decay of atmospheric 222Rn-derived 210Pb (such as volcanic, industrial release, etc.), the 210Po/210Pb activity ratio (AR) in aerosols has been utilized to determine the ‘age’ of aerosols (Moore et al., 1973; Robbins, 1978; Marley et al., 2000) and is generally reported to be <0.1 in the lower and middle troposphere (Turekian et al., 1977; Baskaran, 2011).
The upper end of the dating range of a radioactive daughter-parent pair, where the parent half-life is much longer than the daughter half-life, is typically about 5-6 half-lives of the daughter isotope and hence 210Po:210Pb disequilibrium is useful from a few days up to 2 years. From simultaneous measurements of 210Po and 210Pb in aerosols and precipitation, it was shown that the initial 210Po/210Pb AR was similar in rain/snow and aerosols (McNeary and Baskaran, 2007). During precipitation in the Arctic (and elsewhere), the falling snow underneath the cloud cover is tagged with the 210Po/210Pb AR of aerosols generally with values of <0.1 (Baskaran, 2011); as time elapses, this ratio in snow increases due to 210Po ingrowth from the decay of 210Pb. With time, the accumulated snow becomes ice or undergoes melting. During the beginning of the melt season, generally in June, meltwater from snow and ice, mostly freshwater, begins to form a pond at the surface and grow, both in areal extent and depth (Polashenski et al., 2012). From the estimated initial and measured 210Po/210Pb AR of the melt pond, its age can be determined. During storm events in early autumn, atmospherically delivered 210Po and 210Pb, with 210Po/210Pb AR of <0.1, are scavenged by resuspended sediments and eventually incorporated into coastal sea ice which are subsequently transported to the interior Arctic (Nürnberg et al., 1994). The in-growth of 210Po from the decay of 210Pb provides the time elapsed since incorporation of these radionuclides. Here, we report a novel application of disequilibrium between 210Po and 210Pb in dating snow, melt pond, ice core and IRS collected from the Arctic Ocean.
The primary goal of the present study, is to test the following hypotheses: (i) The in-growth of 210Po from the decay of 210Pb in snowfall provides a tool to determine the age of snow; (ii) From quantifying the fractional input of the sources of water to the melt pond and knowing the end-member activities of 210Po and 210Pb, the age of the melt ponds can be determined; (iii) Since the time range for daughter-deficient 210Po:210Pb dating is up to ∼ 2 years (or 210Po/210Pb ∼0.97), multi-year ice in ice-pack can be recognized; and (iv) Most of the atmospherically delivered 210Pb, with 210Po/210Pb AR similar to that in aerosol, is scavenged by resuspended sediment which gets incorporated into sea ice in the coastal areas and thus, we can date the IRS using 210Po/210Pb pair. The ages of snow, melt pond and ice core are relevant to the exchange of latent heat with the surrounding, changes in the albedo while ages of IRS are relevant to the transport velocity of coastal sediments and sediment-laden contaminants. In addition, transport of nutrients from coastal zone to the deep Arctic through sea ice makes a coupling between coastal and deep arctic benthic community.
Materials and Methods
Sample Collection
During US GEOTRACES Arctic cruise (HLY1502; R/V Icebreaker USCGC Healy; August 10 – October 7, 2015), the following samples were collected from 6 ice stations (ST-31, -33, -39, -42, -43, and -46, Figure 1): snow, melt pond (only 5 stations) and ice core; IRS, often are sporadically distributed in the ice, from two ice stations (E-6195 and -6244); and 13 aerosol samples (Figure 1), using a large-volume aerosol sampler (PM10), from Dutch Harbor, AK to North Pole, where each deployment averaged ∼30 h of run time (Figure 1 and Table 1). Aliquots of GFF aerosol filters, corresponding to filtered air volume, 72 to 463 m3 (Table 1), were provided for analysis from the aerosol group of the U.S. GEOTRACES program. Details on aerosol collection were published in Morton et al. (2013). Appropriate care was taken in preventing plume discharged from the ship’s chimney when sailing. Since a large number of trace metals were also analyzed in the same aerosol filters, extreme caution was exercised in sample collection. At ice stations, bulk snow deposited on sea ice were collected into precleaned plastic bags and melted onboard to a volume of 20 L and filtered. For melt pond water samples, a hole was drilled in the frozen closed melt ponds using a TM-clean corer. A battery-powered peristaltic pump with silicone tube was used to fill a carboy with unfiltered water (Kadko and Landing, 2015; depth of the melt pond not known) and was filtered onboard. In each of the 6 ice stations, 2 ice cores next to each other, from surface to all the way down to the seawater, were collected with the Kovaks corer (9 cm ID), evenly divided into 5-6 segments approximately 20-40 cm each and same segments were combined, and melted in the onboard laboratory. The melt water from snow, ice core, and melt pond water were filtered using 0.4 μm Whatman Nuclepore track-etched membrane filter in a vacuum filtration system and the material retained in the filter were considered particulate matter. All filters were retained for particulate analysis, and filtered water samples were acidified to a pH of 2 with 6M HCl and the preconcentration was done following Fe(OH)3 method (details in Methodology). The IRS was collected by shoveling sediment-laden ice (sediment found both at the surface and inside of the ice fragments), into pre-cleaned 20 L buckets, melted, sediments were allowed to settle, and the ‘supernatant’ meltwater was poured off to concentrate the sample. The sediment solution was then dried in an oven at 100°C and used for further analysis.
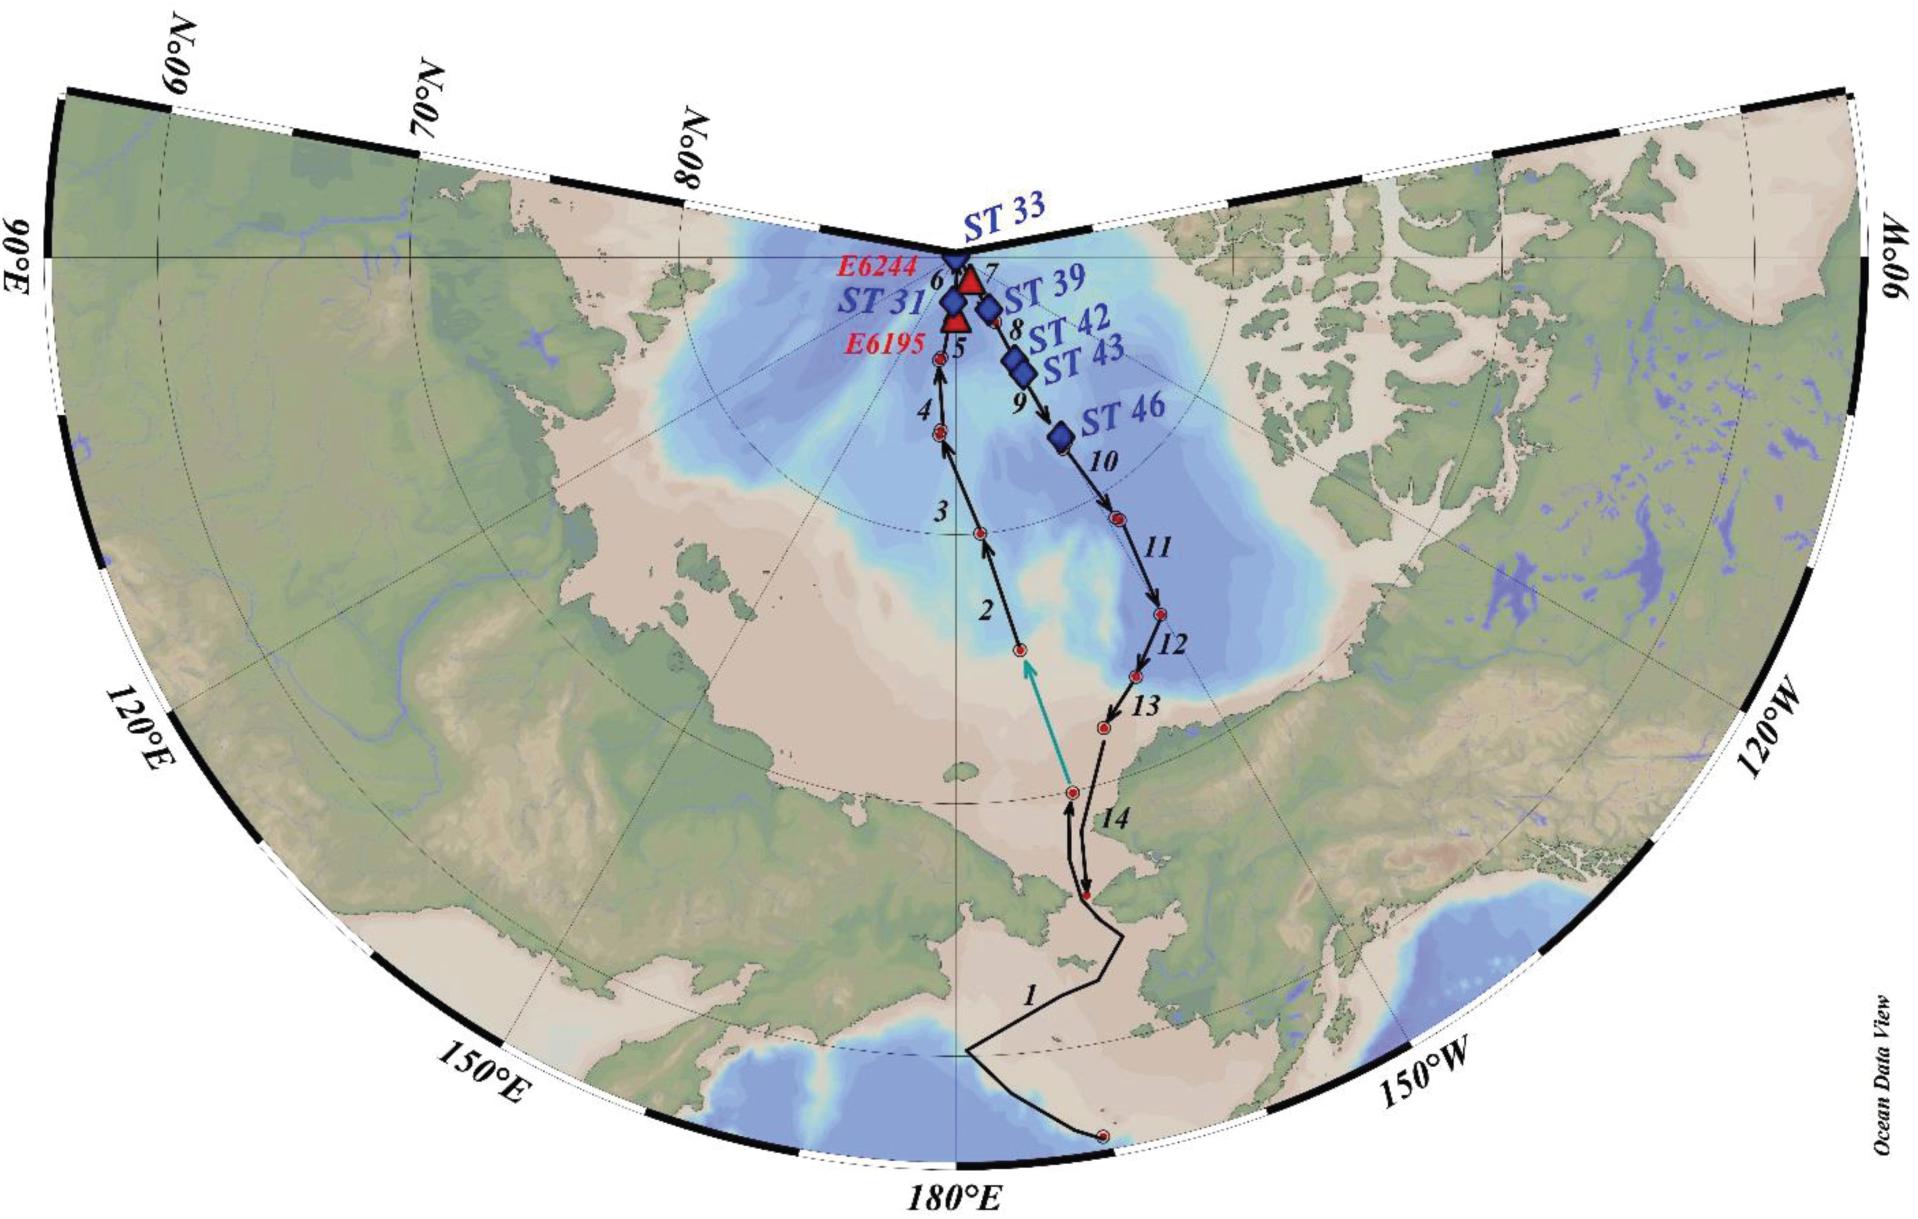
Figure 1. Sampling stations for aerosols, ice-rafted sediment and ice stations. Green arrow shows transit with no sampling; distance between successive red dots denote aerosol sampling (starting and ending of location) for that particular sample; pumps didn’t work for ST-5 and no sample. Two red lettered stations (E6244 and E6195 in red triangle) denote the dirty sea ice sample collection; Blue lettered stations 31, 33, 39, 42, 43, and 46 denote ice stations (US GEOTRACES Arctic cruise, HLY1502, R/V Icebreaker USCGC Healy).
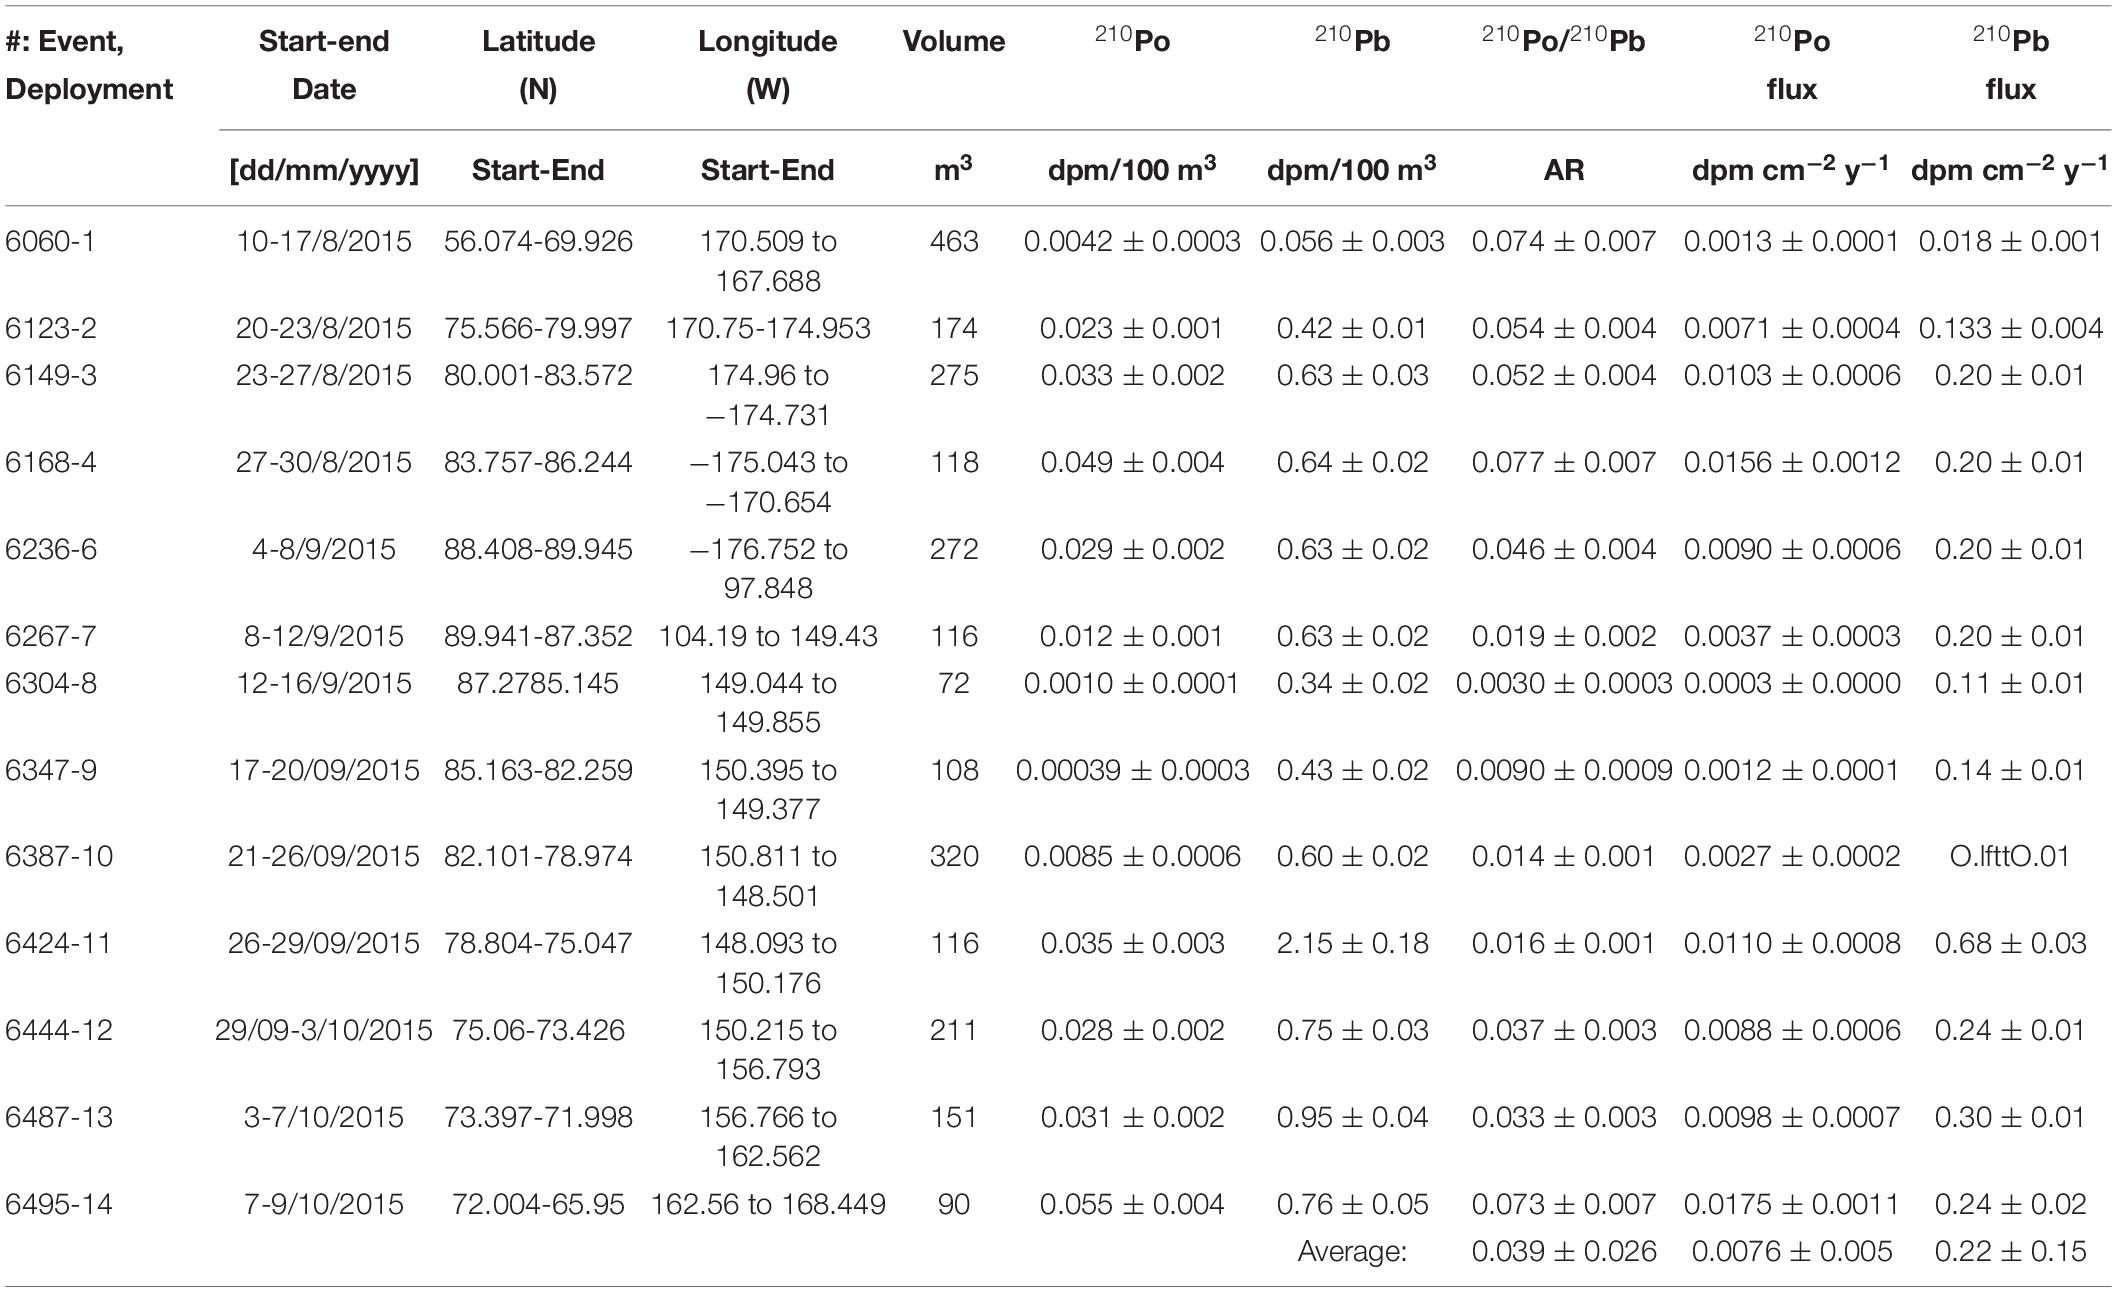
Table 1. Aerosol collection time, location, volume, activities and depositional fluxes of 210Po and 210Pb and 210Po/210Pb AR.
Development of Chemical Leaching Method for Aerosol Filter and Ice-Rafted Sediment for 210Po and 210Pb
The general procedure for measuring 210Po and 210Pb in aerosol and involves complete digestion using concentrated hydrochloric acid, nitric acid, and hydrofluoric acid, followed by drying, and then taken in dilute HCl solution for electroplating. Since the in situ 210Po/210Pb AR in aerosol is generally less than 0.1 (Baskaran, 2011), it is a prerequisite that in situ 210Po is separated from in situ 210Pb soon after the sample collection (note: in 30 days from sample collection to Po plating, 14% in-growth 210Po would take place). In order to avoid usage of concentrated hydrofluoric acid on the ship, prior to the cruise we tested a series of different leaching procedures in one aerosol filter (aerosol sample collected at Wayne State University campus, Detroit, MI, United States) by both leaching and total digestion, and compared the amount of 210Po extracted by each method performed on separate aliquots of the same filter. The aerosol sample was filtered through one 8″ × 10″ QFF filter at a flow rate of 1.4 m3/min for approximately 24 h, similar to the arctic aerosol samples collection (Table 1). The filter was cut into 4 quarters and were weighed. Visual observation of the filter and the weights indicated uniform aerosol mass distribution. The aerosol collection occurred from May 23 to May 24, 2015 and 210Po plating was performed on the same day of retrieval. To each aliquot, varying concentrations of hydrochloric and nitric acid were used (Table 2). For leaching, an aliquot of the filter along with the acids (Table 2) was taken in a centrifuge tube and placed in an ultrasonic bath at 70°C. The filtrate was then separated from filter by vacuum filtration and the process was repeated once more. The solutions were combined and processed further for 210Po plating (Krupp, 2017). The typical time involved are: leaching (2 h total), digestion (12 h), and drying (∼6-8 h). Additional details are given in Krupp (2017).
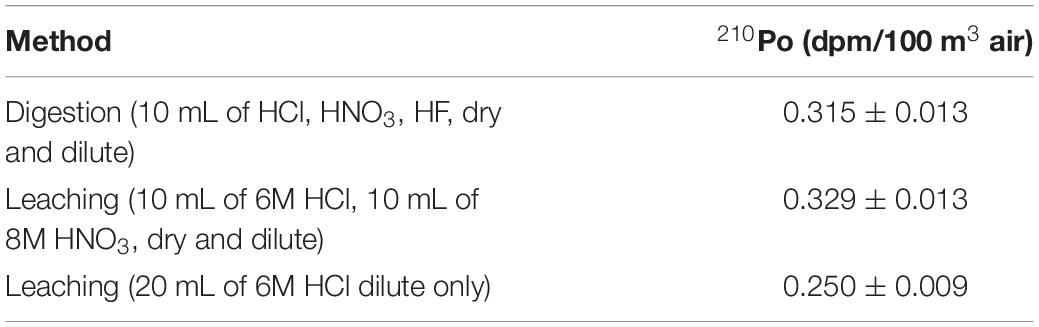
Table 2. Activities for aerosol filter aliquots processed by total digestion or two leaching methods.
The calculated 210Po activities are given in Table 2. We report that leaching of the filter with 6M hydrochloric acid + 8M nitric acid, followed by drying (necessary to prevent dissolution of planchet in nitric acid medium) and dilution, provided results consistent with total digestion with HF (210Po = 0.329 ± 0.013 dpm 100 m–3 vs. 0.315 ± 0.013 dpm 100 m–3 for leaching and HF digestion, respectively). The results show that 6M hydrochloric acid leaching alone is not sufficient (210Po = 0.250 ± 0.009 dpm 100 m–3), suggesting that nitric acid is necessary as an oxidizing agent to quantitatively extract 210Po from the aerosol filter due to possible presence of 210Po-laden organic aerosol particles. These results also suggest that the complete destruction of the quartz fiber by hydrofluoric acid is not necessary to extract 210Po from the filter media, implying that sorbed 210Po onto lithogenic particles can be quantitatively removed by a mixture of 6M HCl + 8M HNO3 alone. This leaching method was used in place of total digestion on the cruise in order to eliminate the need for hydrofluoric acid and concentrated nitric and hydrochloric acid, as well as reduce the time usually needed to digest the aerosol filters, which is important when considering the time-sensitivity of the 210Po isotope and the volume of work involved onboard the ship.
In most of the enriched 210Po and 210Pb are sorbed onto sediment surface, we tested a set of leaching methods. Approximately 12 L of dirty lake ice using a 20 L plastic bucket was collected on March 14-15, 2015 near the mouth of the Clinton River which discharges into Lake St. Clair in southeast Michigan. After melting (melt volume = 8.7 L), settling (after 48 h), decanting, and drying the concentrated solution in an oven (48-72 h), the total amount of dried silty-clay sediment collected was 3.617 g. To ensure fine clays were collected, the decanted ice solution was subsequently allowed to settle (48 h) and then dried in the same manner, providing a total amount of clay sediment of 0.242 g. This was combined with the other aliquot of 3.617 g. The collected sediments overall were fine-textured and grayish-brown, and included a small amount of macro-organic material (grass and hairs) which was removed before leaching. About 0.2 g of the homogenized sediment sample was leached for 1 h at ∼90°C with 10 mL of 6M HCl twice and the leachate were combined. The combined solution was dried and taken in 5 mL 1 M HCl and gamma counted. To minimize time, acid consumption and waste generation onboard, results from a leaching experiment showed that 6M HCl leaching of ice-rafted sediment collected from Lake St. Clair quantitatively extracts 210Po and 210Pb from IRS (Krupp, 2017).
Analytical Procedure for 210Po and 210Pb
Polonium-210 and 210Pb activities of snow, ice, melt pond, seawater and aerosol were measured on the same sample. IRS samples were divided into two fractions, one for gamma spectrometry to measure 210Pb and the other for 210Po by alpha spectrometer. Precise determination of in situ 210Po requires that the sample be analyzed soon after the collection to minimize in-growth of 210Po. The dissolved phase (filtrate of melt water of snow, ice core and melt pond) was acidified with 5 ml/L of 6M HCl (Trace-Metal grade) to prevent the loss of 210Po and 210Pb by sorption on to the container wall. Each acidified sample was spiked with: (i) a known amount of 209Po US-NIST Standard Reference Material as an internal yield tracer; (ii) 20 mg stable lead via a stable lead carrier of PbCl2 in order to determine chemical efficiency of 210Pb recovery; and (iii) iron carrier (FeCl3; 5 mg Fe/L of water) to co-precipitate 210Po and 210Pb with Fe(OH)3 precipitate. After 12-24 h equilibration period and periodic vigorous shaking of the sample, ammonium hydroxide was added to samples to increase the pH from 2 to 4, and then, 1 mL of 10% sodium chromate was added to samples to increase the lead yield by the co-precipitation of lead chromate. Then, the pH was increased to ∼8. This rise in pH causes the iron to flocculate to co-precipitate 210Po and 210Pb with Fe(OH)3. Details on separation of precipitate and solution, chemical processing and plating of Po are given in Niedermiller and Baskaran (2019). After Po plating, each solution was transferred to a precleaned 60 ml Nalgene bottle and stored for further onshore 210Pb analysis. After polonium plating, any residual 210Po (and 209Po) must be removed from sample solution for the future measurement of in situ 210Pb, which is measured by in-growth of 210Po from the decay of 210Pb. Details on the quantitative removal of 210Po using a column separation technique, chemical efficiency determination for 210Pb are given in Niedermiller and Baskaran (2019). Details on decay and in-growth corrections for 210Po and 210Pb are given in Baskaran et al. (2013), Rigaud et al. (2013), Cookbook (2014).
All particulate samples (from snow, ice, melt pond samples) processing was performed using leaching methods. The particulate sample was taken in a 50-ml centrifuge tube and was leached with 10 mL 6M Omni-trace HCl and 10 mL 8M HNO3 mixture with agitation for 1 h at 70°C in an ultrasonic bath. Subsequently, the solution was filtered, spiked, with a known amount of 209Po and stable Pb, and dried. To the residue, 2 mL of HCl was added and warmed it to bring the residue to solution and then diluted to 40 ml with deionized water. This solution was used for electroplating.
The 210Po-plated discs were assayed in an Octete PC-8 input alpha spectrometer. The background subtraction in most of the samples was less than 0.1% of the net counts for both 210Po and 210Pb. The activities of 210Pb in IRS samples were measured directly in a high-resolution, high-purity Ge well detector coupled to DSA multi-channel analyzer. The gamma-ray spectrometer was calibrated with RGU-1, RGU-Th, both IAEA Certified Reference Materials, periodically. Details on the chemical procedures, counting methods and reagent blanks subtracted, QA/QC and intercalibration results are given below.
Blanks and QA/QC
We ran a total of 17 blanks (6 blank aerosol filters with reagent blanks, 2 reagent blanks for IRS, and 9 reagent blanks for snow, ice core, and melt ponds) for both 210Po and 210Pb. Due to very low activities of 210Po in aerosols (generally ∼5% as that of 210Pb), the blank levels are relatively high, as expected. The average blank activity accounted for 43-83% (mean: 60%, n = 6) for 210Po and 10.4-60.9% (mean: 28.2%, n = 6) for 210Pb. For snow samples, the reagent blank for particulate 210Po (210Pop) and 210Pbp accounted for 0.2-12.5% (mean: 5.5%), and 0.5-14.0% (mean: 4.3%, n = 6), respectively. The corresponding values for dissolved 210Po (210Pod) and 210Pbd accounted for 0.3-5.3% (mean: 2.0%, n = 6) and 0.2-0.8% (mean: 0.4%, n = 6), respectively. The 210Po blank in ice-rafted sediment varied from 0.3 to 3.2% (mean: 1.1%, n = 6). For melt pond samples, the reagent blank values for particulate 210Pop and 210Pbp are higher due to lower activities, accounting for 16.8-48.7% (mean: 24.8%, n = 5), and 8.8-66.0% (mean: 28.3%, n = 5), respectively. The corresponding values for 210Pod and 210Pbd accounted for 0.6-3.9% (mean: 2.0%, n = 5) and 0.9-9.4% (mean: 3.5%, n = 6), respectively. The melt volume of segment of ice core sample was small with lower 210Po and 210Pb activities compared to snow and hence the reagent blanks are higher, accounting for 2.8-89.7% (mean: 48.9%, n = 31) for 210Pop, and 3.5-96.3% (mean: 49.3%, n = 31) for 210Pbp and 2.0-68.9% (mean: 33.3%, n = 31) for 210Pod, and 4.9-82.9% (mean: 28.2%, n = 31)210Pbd.
We analyzed Certified Reference Material (CRM) RGU-1 (238U concentration 400 ± 2 ppm, with all the progeny of 238U in secular equilibrium, including 210Pb and 210Po; IAEA CRM) eight different times as blind samples following the same procedure as the samples determined by alpha spectrometry to assess the accuracy. About 30 mg (weighed to a precision of ±0.1 mg) of the standard (∼9 dpm) was taken each time and about 5.5 dpm of 209Po spike was added. The same chemical procedure was followed as was outlined in Baskaran et al. (2013). Agreement between the measured and certified value is excellent. The ratio of measured activity to certified value of RGU-1 varied between 0.96 ± 0.01 and 1.02 ± 0.00, with a mean value of 1.00 ± 0.01.
The intercalibration exercise between Wayne State University and Louisiana State University (LSU) showed that the 210Po and 210Pb activities on four water samples (two from GEOTRACES station in the Arctic and two collected from Gulf of Mexico collected by Dr. Kanchan Maiti, LSU) agreed within 1 standard deviation from each other and hence our 210Po and 210Pb data are of high quality. The results from the intercalibration was submitted to BCO-DMO data center along with all of our 210Po and 210Pb data obtained during 2015 GEOTRACES cruise.
Results and Discussion
Residence Time and Depositional Velocity of Aerosol Using 210Po and 210Pb and Their Fluxes
The mean specific activity of 210Po and 210Pb in aerosols, 0.023 ± 0.018 (range: 0.0004-0.055, n = 13) dpm 100 m–3 (1 dpm = 1 disintegration per minute = 1 atom decaying per minute; 60 dpm = 1 Bq) and 0.69 ± 0.18 (range: 0.06-2.15, n = 13) dpm 100 m–3, respectively (Table 1), are significantly lower than those reported in sub-Arctic latitudes (e.g., 210Po: 0.43 (range: 0.11-0.71, n = 30) dpm 100 m–3; 210Pb: 6.9 range: 1.8-25.3, n = 30) dpm 100 m–3 in Detroit, MI, United States (42°25′N, McNeary and Baskaran, 2003). Land-derived air masses have significantly higher 210Pb activity compared to maritime air masses due to differences in the 222Rn emanation rates between ocean surface, 0.102 dpm cm–2 day–1, and land surface, 7.8-10.8 dpm cm–2 day–1 (Baskaran, 2011). Long-term global 222Rn fluxes were found to decrease with increasing latitude, from 0.57 ± 0.38 atom cm–2 s–1 (n = 46) at 30-40°N latitudinal belt to ≤0.12 ± 0.11 atom cm–2 s–1 (n = 19) at north of 60-70°N belt (Baskaran, 2011). An order of magnitude variations in 210Pb activities is mainly attributed to variations in sources of air masses. Since samples were collected during transit covering large distances (Figure 1 and Table 1), it is not possible to quantitatively assess the influence of land-derived vs. maritime air masses.
The calculated depositional flux of 210Po or 210Pb (FPo or Pb), using eq. (1), from the measured activity of 210Po (CPo) or 210Pb (CPb) (Table 1), assuming aerosol deposition velocity (Vd) of 1 cm s–1 (average of 8 global sites, McNeary and Baskaran, 2003), varied from 0.0003 to 0.018 dpm cm–2 year–1 (mean: 0.0076 ± 0.0055, n = 13 for 210Po; note: here and elsewhere the error is 1σ on data) and 0.018 to 0.68 dpm cm–2 year–1 (mean: 0.22 ± 0.05, n = 13 for 210Pb; Table 1).
The calculated depositional fluxes critically depend on the assumed Vd value of 1 cm s–1. An independent validation for Vd in the Arctic can be obtained from the published FPb values. From the summarized sedimentary inventory of FPb in lakes, coastal regions and glaciers/ice cores, the calculated Vd ranged from 0.3 to 1.6 cm s–1 (mean: 0.9 ± 0.4 cm s–1 (n = 13)), indicating Vd for Arctic is similar to subarctic (Turekian et al., 1977; McNeary and Baskaran, 2003).
The residence time of aerosols (τPo–Pb) has been calculated from the measured 210Po-210Pb disequilibrium using the equation (Moore et al., 1973).
where a = APb – APo; b = -APo (τBi + τPo) and c = -APo (τBi τPo); APb and APo are activities of 210Po and 210Pb respectively; τBi: 210Bi mean-life, 7.2 days; τPo: 210Po mean-life, 199.7 days. The 210Po/210Pb AR in aerosols varied between 0.003 and 0.077 (mean: 0.039 ± 0.026, n = 13) corresponding to a mean residence time of 12 ± 7 days which is comparable to the mean residence time of water vapor as well as the residence times reported in regions where anthropogenic inputs of 210Po and 210Pb were reported to be negligible (Moore et al., 1973; Baskaran and Shaw, 2001; Baskaran, 2011). If there are additional contributions of 210Po from sources such as volcanic eruption, transport from urban setting, and other anthropogenic sources, the estimated residence time will be an upper estimate (Kim et al., 2000, 2005; Su and Huh, 2002; summarized in Baskaran, 2011).
Age of Snow Using 210Po/210Pb AR
During the sampling expedition, in each ice station, a composite sample was collected and the snow depth was not measured. However, the average snow depth has been reported to vary from 30-40 cm, with up to 150 cm after a snowstorm (Sturm et al., 2002). The total 210Po (210PoT = particulate, ≥0.4 μm, 210Pop + dissolved, <0.4 μm, 210Pod) and 210PbT activities varied from 6 to 323 (mean: 89 ± 123, n = 6) and 192 to 1659 (mean: 689 ± 545, n = 6) dpm 100L–1 water equivalent, respectively (Table 3), about 1-2 orders of magnitude higher than those in Arctic surface ocean waters (Moore and Smith, 1986; Smith et al., 2003; Chen et al., 2012; Roca-Marti et al., 2016; Bam et al., 2020; Figures 2A,B). The particulate 210Po fraction, 12.0 to 68.1% (mean: 36 ± 19%), is significantly higher than that of 210Pbp, 1.2 to 17.7% (mean: 10.3 ± 6.6%, Table 3). The observed higher fraction of 210Pop in snow (and melt pond and ice cores) is intriguing as it may be due to production of higher amounts of gelatinous exopolymeric substances (EPS) by microorganisms underneath the snow which serve as agents for increased primary productivity (Krembs et al., 2011). Laboratory experiments have shown that Po strongly adsorbed on to biogenic organic matter such as chitin compared to lithogenic elements such as Pb and, with fractionation factor (=KdPo/KdPb ratio; Kd, partition coefficient = (particulate activity/dissolved activity)∗ (1/particulate concentration, μg/L)) of ∼4 compared to 0.2 to 1.0 for commonly occurring clay minerals (Fowler, 2011; Yang et al., 2013; Wang et al., 2019). Since no measurements of POC, macronutrients or pigments were made on collected snow or ice or melt pond samples, we cannot corroborate this hypothesis. Note that the higher fraction of 210Pop has no bearing on the age determination, as age calculation involves only total 210Po (210PoT) and total 210Pb (210PbT) (see below). The (210Po/210Pb)p ARs varied from 0.08 to 0.83 (mean: 0.38 ± 0.27) which are significantly higher than that in the dissolved phase (range: 0.016 to 0.128, mean: 0.062 ± 0.044; calculated from data in Figures 3A,B and Table 3).
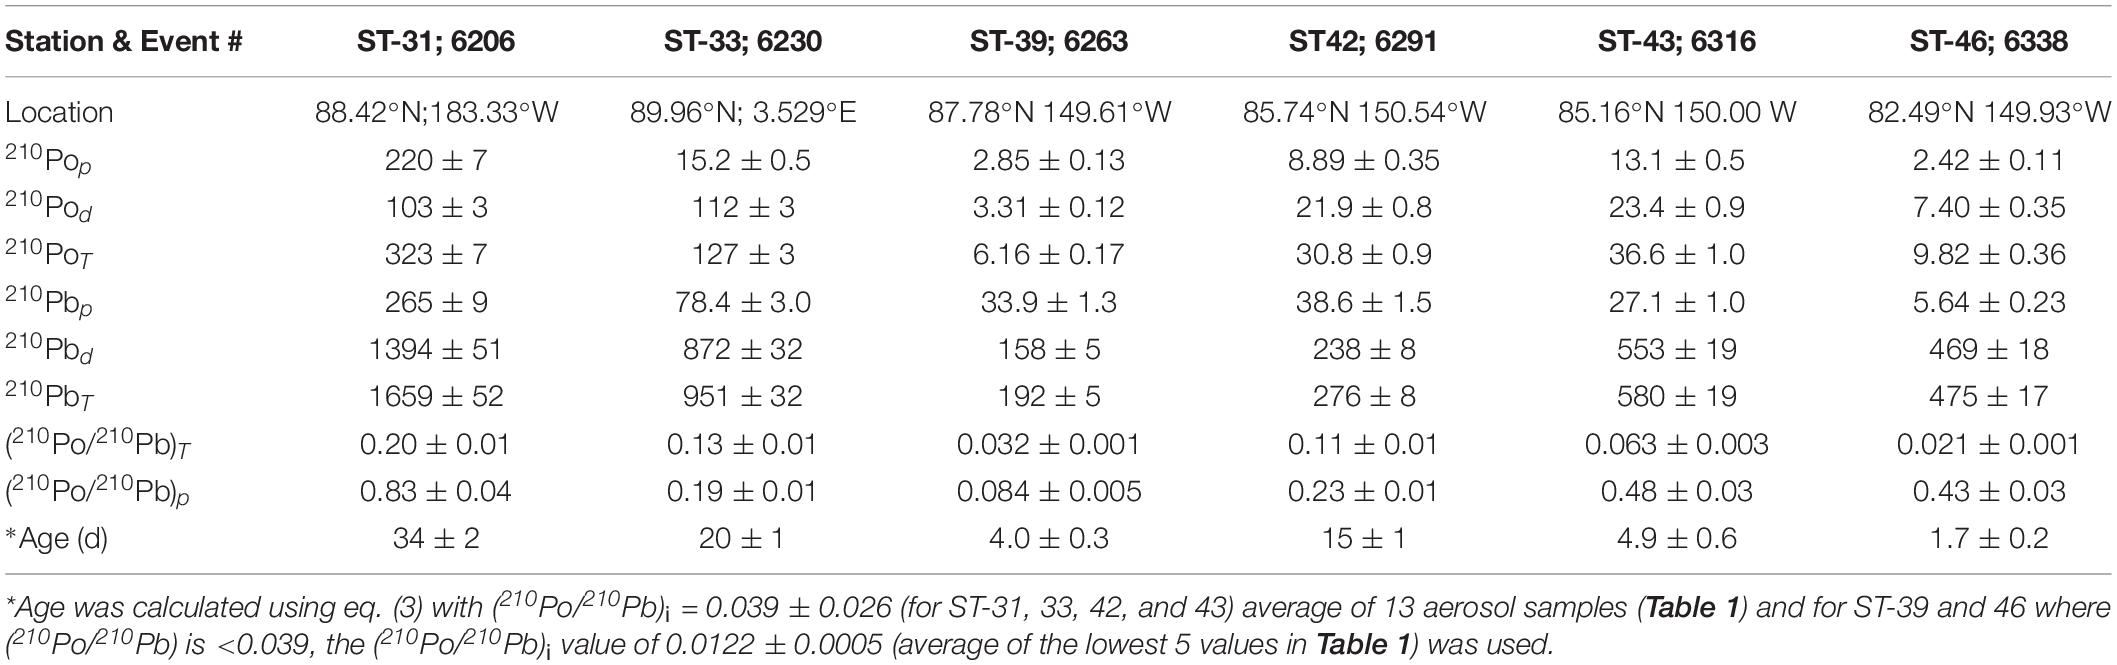
Table 3. Activity of particulate (p), dissolved (d) and total (T) 210Po and 210Pb (in dpm 100L–1), 210Po/210Pb activity ratio, and age of snow.
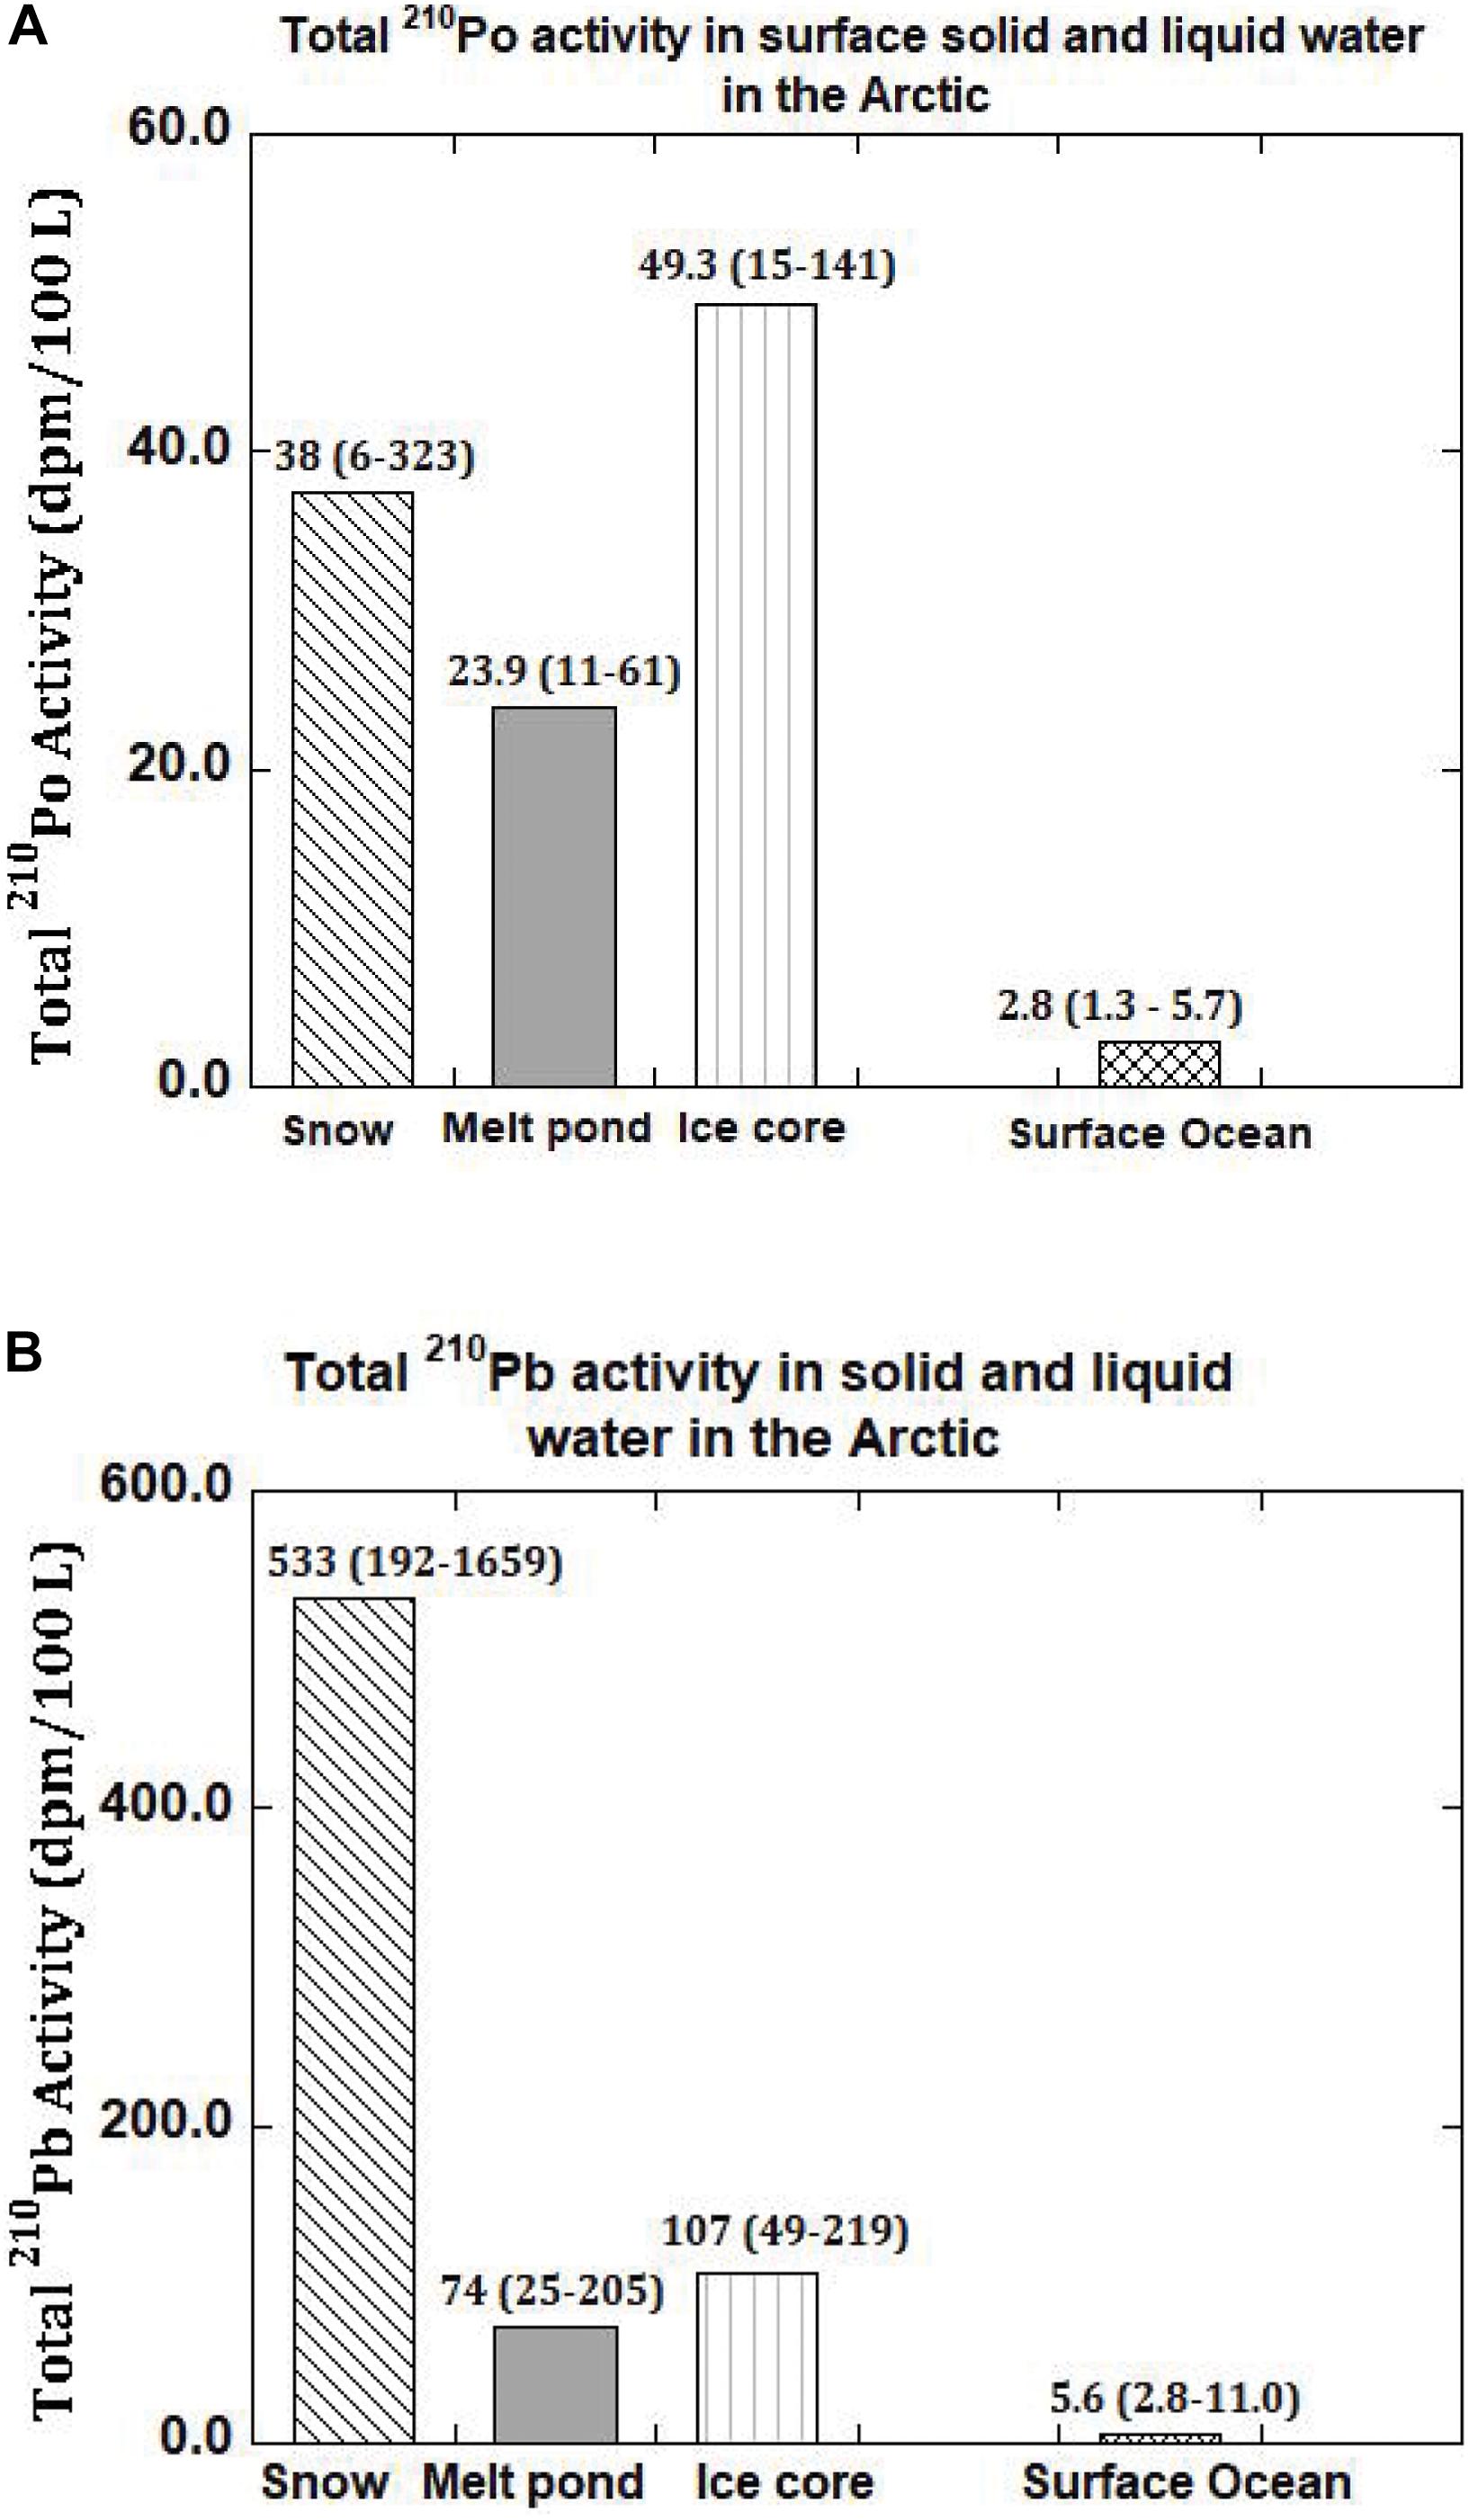
Figure 2. (A) Activity of total (= particulate + dissolved) 210Po and 210Pb in snow, melt pond, ice core and surface ocean in the Arctic. The mean values are given and numbers in parenthesis denote the range (US GEOTRACES Arctic cruise, HLY 1502, R/V Icebreaker USCGC Healy). (B) Activity of total (= particulate + dissolved) 210Pb and 210Pb in snow, melt pond, ice core and surface ocean in the Arctic. The mean values are given and numbers in parenthesis denote the range (US GEOTRACES Arctic cruise, HLY 1502, R/V Icebreaker USCGC Healy).
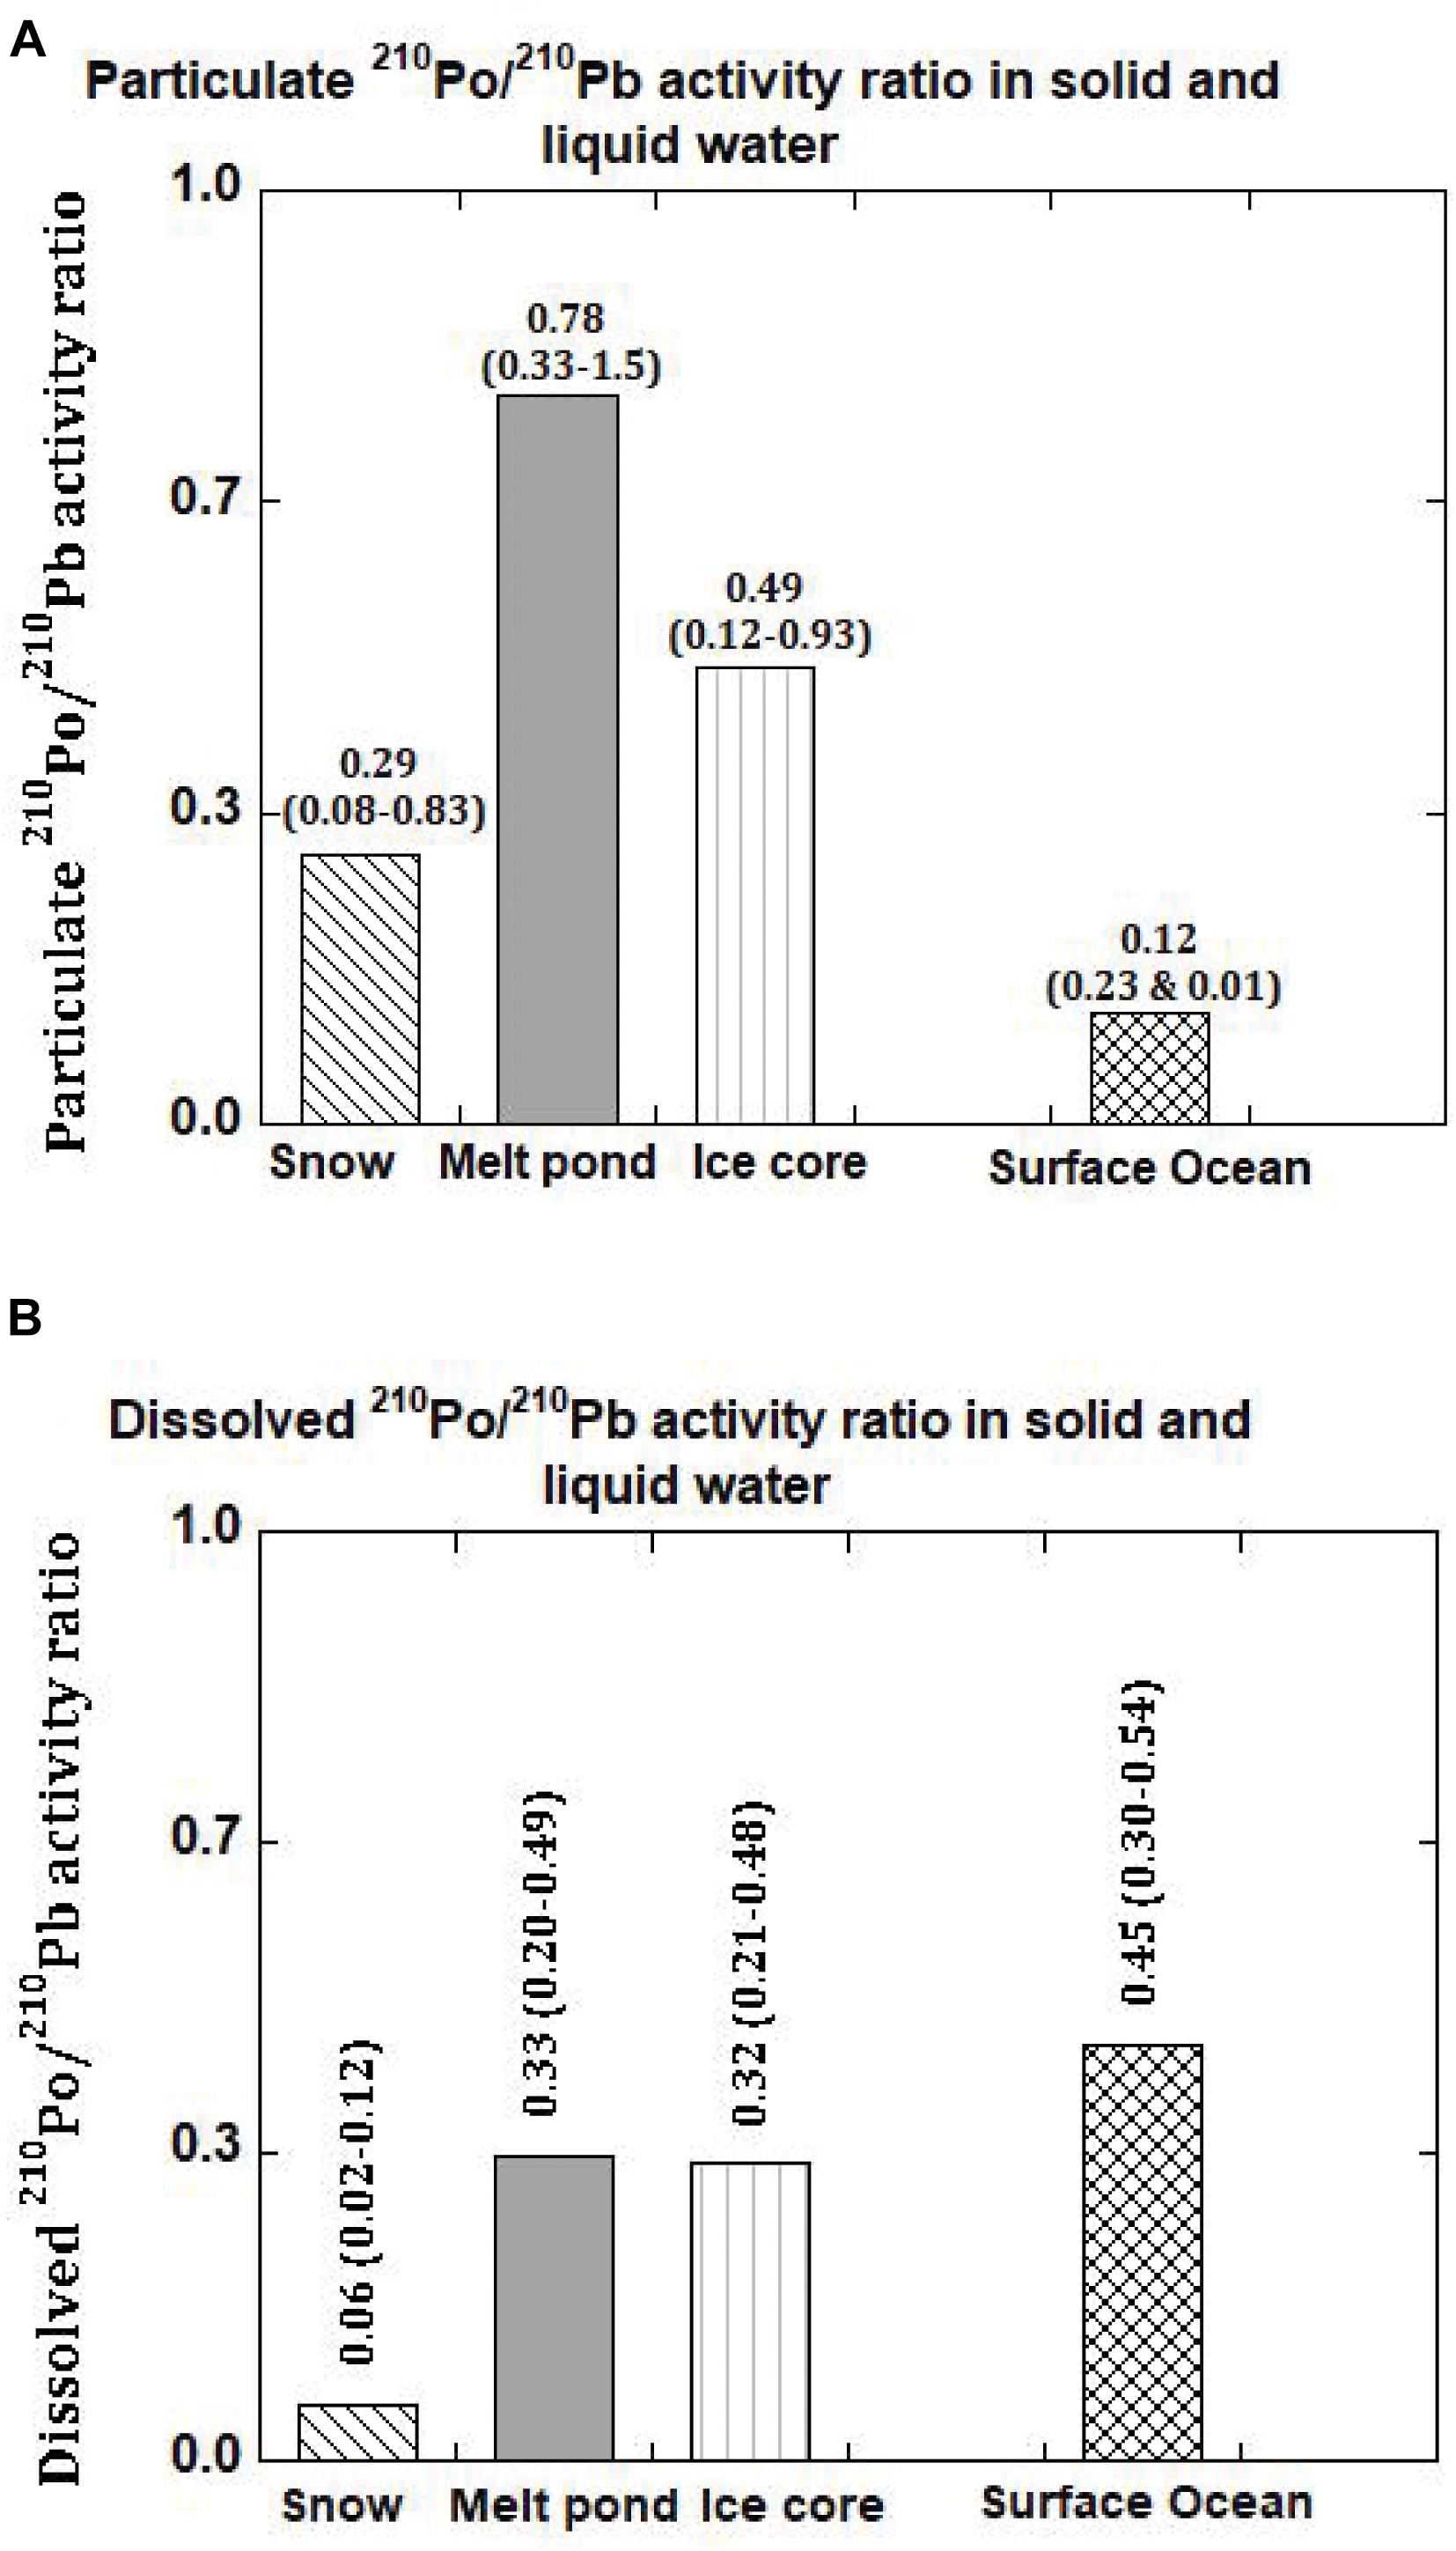
Figure 3. (A) 210Po/210Pb activity ratio in the particulate matter in snow, melt pond, ice core and surface ocean in the Arctic. The mean values are given and numbers in parenthesis denote the range (US GEOTRACES Arctic cruise, HLY 1502, R/V Icebreaker USCGC Healy). (B) 210Po/210Pb activity ratio in the dissolved phase in snow, melt pond, ice core and surface ocean in the Arctic. The mean values are given and numbers in parenthesis denote the range (US GEOTRACES Arctic cruise, HLY 1502, R/V Icebreaker USCGC Healy).
The age of snow (and ice core, melt pond or IRS) can be obtained from eq. (3). Age of snow refers to time elapsed between the snow fall to the ground and sample collection; age of ice core is the time elapsed between the formation of ice core and sample collection; age of melt pond is the time elapsed between the formation of melt pond and the sample collection; and age of ice-rafted sediment (IRS) is the time elapsed between the incorporation of excess 210Pb in to the sediment and the time of collection IRS. The age can be obtained from eq. (3):
The (210Po/210Pb)i is initial AR at the time of deposition, taken to be 0.039 ± 0.026, average (210Po/210Pb) AR of aerosols (n = 13, Table 1); λ is 210Po decay constant (λ = 5.01 × 10⁻³ day–1). Instead of taking average of 13 samples, taking a sub-set (station 4, 6-10), the initial ratio becomes 0.031 ± 0.029 and it made very little difference on the age of snow. Since there is large spatial and temporal variability on the activities of 210Po and 210Pb in aerosols, we chose to use the average of all 13 samples.
The age of snow obtained from eq. (3) varied between 1.7 to 34 days (mean: 13 ± 11 days, Figure 4 and Tables 1, 3). If the analyzed snow is from multiple snow events at different times, then this is a composite age. The snowfall in the Arctic is highly patchy and no weather records are available for individual ice stations. The low-end age likely represents recent snow deposition. It is commonly assumed that once 210Pb and 210Po are delivered from the Arctic atmosphere to the air-sea interface through snowfall, they remain as a closed system and the changes in their activities are caused only by their radioactive decay as well as in-growth of 210Po from the decay of 210Pb until sample collection. This study shows generally that the age of snow is less than a month, and thus, snow deposited more than a month ago likely has undergone changes to become ice with associated exchange of heat energy with the surroundings. The implication of this study is that the changes in the ages of snow and ice due to global climate change (e.g., earlier melt and later freeze of ice) will affect the latent heat exchanged with the surroundings.
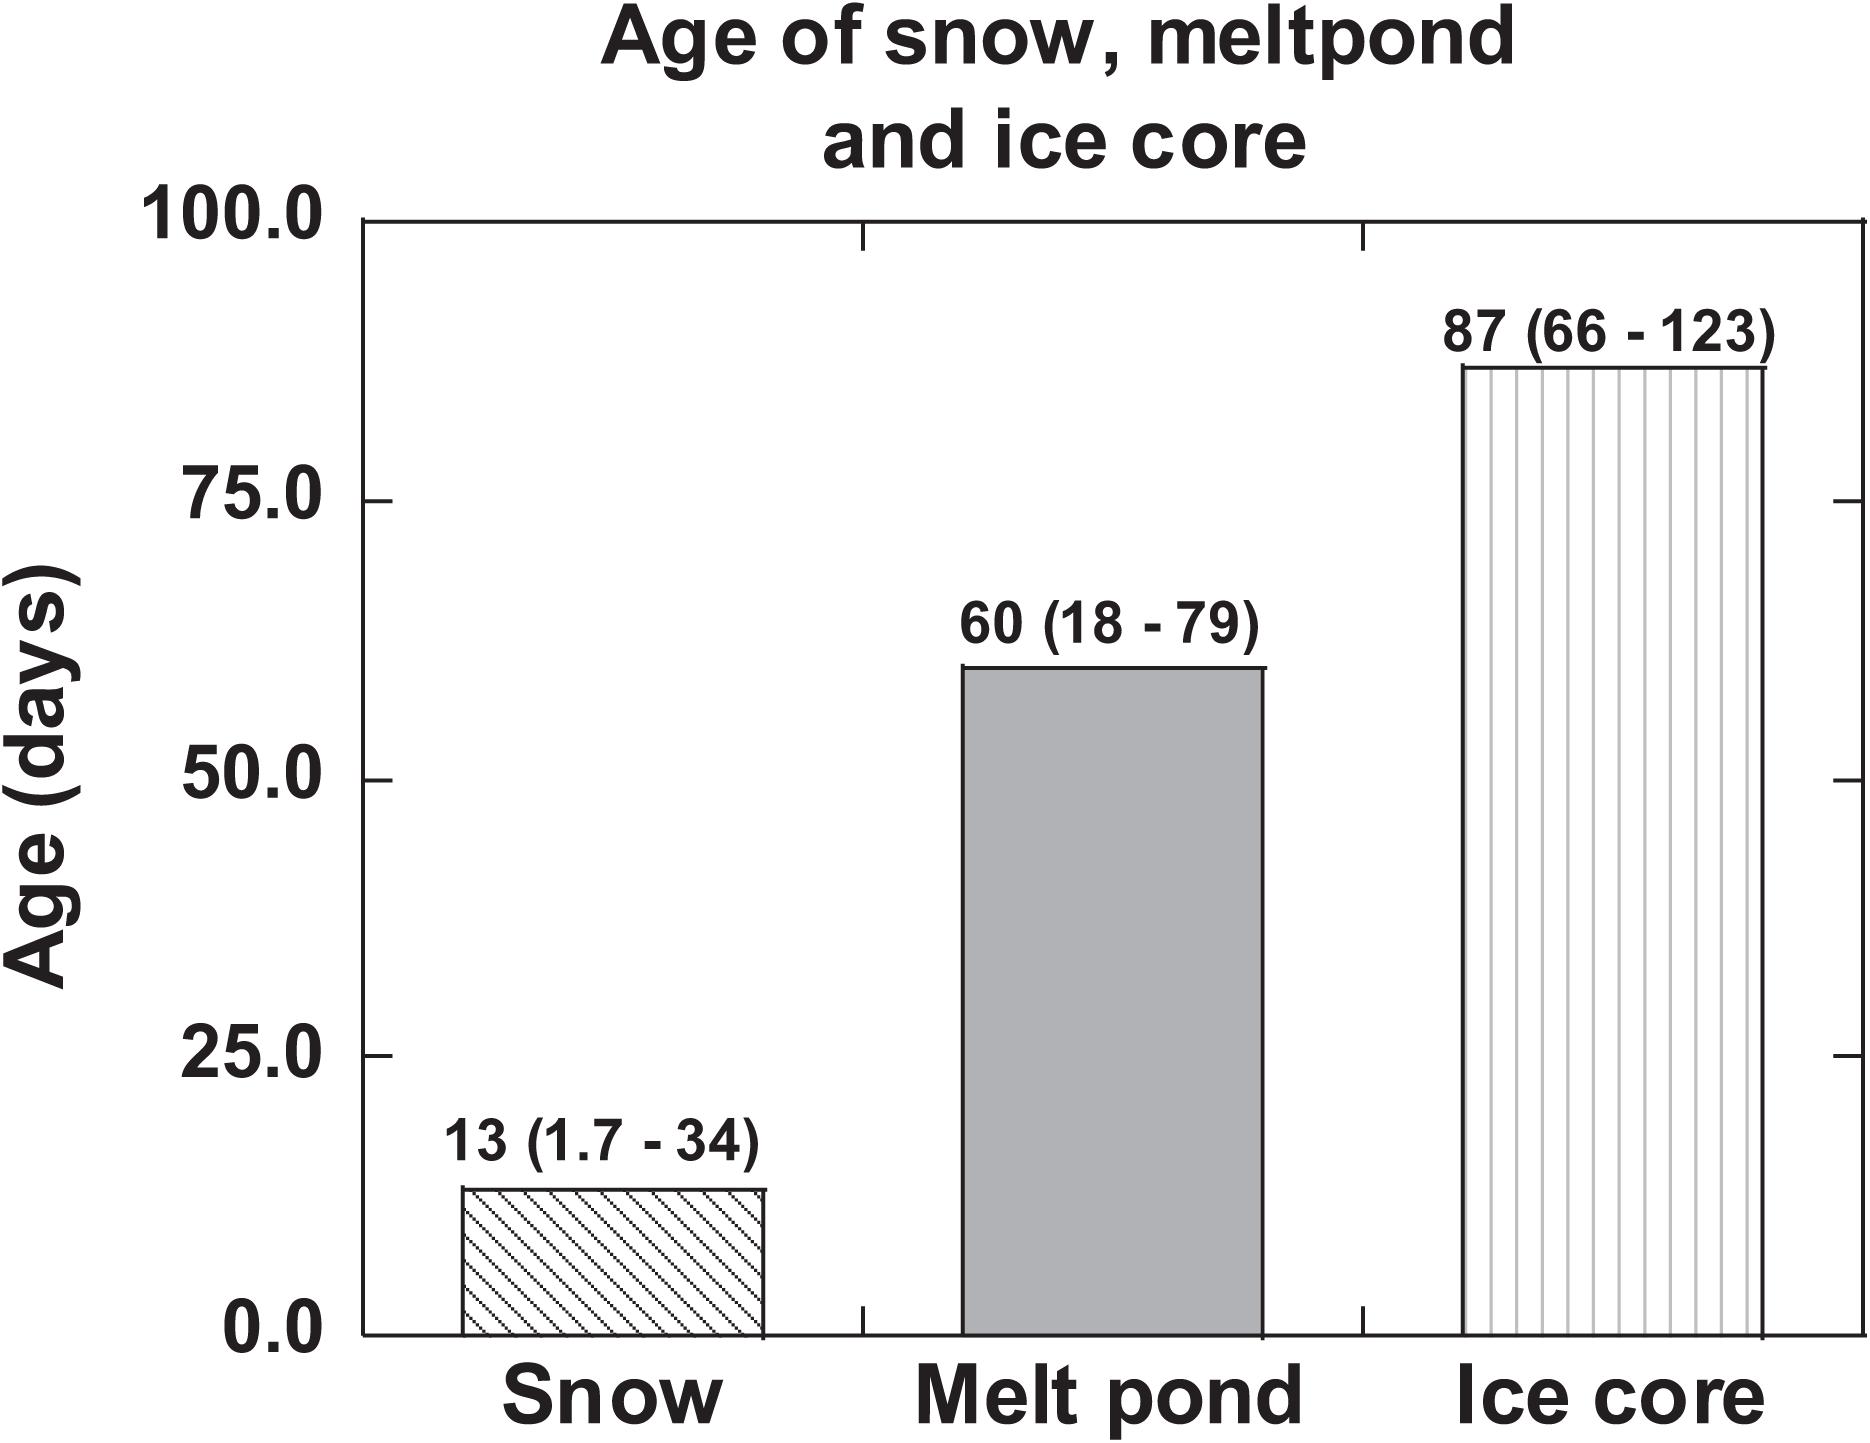
Figure 4. 210Po:210Pb-disequilibrium-based age/residence time of snow, melt pond ice core and compared to the residence time of surface ocean water. The mean values are given and numbers in parenthesis denote the range (US GEOTRACES Arctic cruise, HLY 1502, R/V Icebreaker USCGC Healy).
Age of Ice-Rafted Sediment Using 210Poxs/210Pbxs Activity Ratio
Sea ice in the Arctic plays an important role in the biogeochemical cycling of key trace metals, transport and subsequent dispersal of coastal sediments and nutrients to the deep Arctic as well as impacting radiation balance. Three proposed mechanisms for sediment entrainment into sea ice include: (i) incorporation of fine suspended sedimentary particles into frazil-ice crystals in shallow coastal areas; (ii) uplift of sediments by anchor ice; and (iii) discharge of river-borne ice-laden sediments into the sea (Reimnitz et al., 1987; Hebbeln and Weber, 1991; Nürnberg et al., 1994; Eicken et al., 1997). The concentration and composition of IRS, incorporated in coastal sea ice which are subsequently transported to the deep Arctic by the Beaufort Gyre and Transpolar Drift, has direct bearing on the albedo, long-range redistribution of contaminants, and particle flux to the deep sea (Hebbeln and Weber, 1991; Nürnberg et al., 1994; Pfirman et al., 1995; Eicken et al., 1997; Landa et al., 1997; Meese et al., 1997; Cooper et al., 1998; Charette et al., 2020).
The excess 210Pbxs activities (210Pbxs = 210Pbtotal – 226Ra; average measured 226Ra: 0.95 ± 0.18) in IRS, range between 19 and 186 dpm g–1 (mean: 96 ± 76, Table 4), similar to earlier published data and is up to 2 orders of magnitude higher than the average total 210Pb activity, 1.90 dpm g–1 (n = 134) of Russian Arctic surface sediments (Roberts et al., 1997; Baskaran, 2005). The 210Poxs (210Poxs = 210Pototal – 226Ra) ranged from 5 to 76 dpm g–1 (mean: 40 ± 33, Table 4). This is the first 210Po published data in IRS showing high 210Po enrichment as well disequilibrium between 210Po and 210Pb. Note that enrichment of 210Po onto particulate matter will not affect the total 210Po/total 210Pb activity ratio (total 210Po = particulate 210Po + dissolved 210Po) of the ages calculated based on 210Po/210Pb activity ratio. The 210Poxs/210Pbxs AR varied from 0.27 to 0.50 (mean: 0.38 ± 0.09, n = 6) and the differences in the AR and enrichment of 210Pb are attributed to the differences in their extent of initial interaction with seawater, and the time elapsed since the incorporation of 210Pb into IRS.
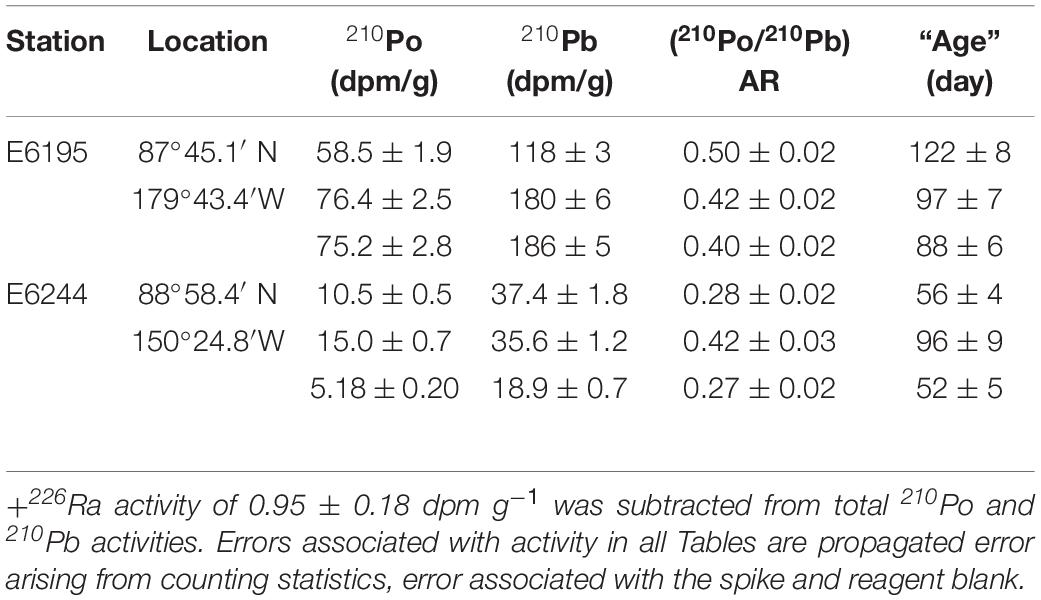
Table 4. Activities+ of excess 210Po, 210Pb, 210Po/210Pb AR and age of ice-rafted sediment.
Assuming the incorporation of atmospherically delivered 210Pb into IRS is a one-time event (e.g., 210Pb-laden sediment incorporation in to sea ice sediment taking place in one freeze over a short period of time), and the 210Po and 210Pb in IRS remains a closed system, the calculated age ranged from 52 to 122 days (mean = 85 ± 27 days, n = 6, Table 4). Although there is no direct observation from the Arctic for this assumed one-time incorporation of radionuclides, a serendipitous observation from collection and analysis of sediment-laden ice from Lake St. Clair in southeast Michigan showed that the sediment extracted from ice during a snow storm during March 14-15, 2015 had an average 210Pbxs activity of 555 ± 138 (n = 3) dpm g–1 (Krupp, 2017). This is ∼6 times higher than that in the Arctic and about 100 times that of surficial sediments in Lake St. Clair (Robbins et al., 1990; Jweda and Baskaran, 2011). Note that the average atmospheric depositional flux of 210Pb in 60-80°N belt of 0.18 dpm cm–2 year–1 is only 13% as that of Detroit, MI (1.41 dpm cm–2 year–1), a mid-latitude site, and such larges differences are due to low emanation rate of 222Rn as well as low annual amount of precipitation in the Arctic (McNeary and Baskaran, 2003; Baskaran, 2011). The corresponding transport velocities (transport velocity = shortest distance between sampling site and the nearest coastal site, taking in to consideration the currents in the sampling area and back tracked the trajectory of the ice since its formation/age) varied between 0.12 ± 0.01 and 0.27 ± 0.02 m s–1 (mean: 0.18 ± 0.06 m–1, Table 4). These velocities can be compared to 0.082-0.086 m s–1 obtained using buoys in Laptev Sea and 0.09 ± 0.04 m s–1 (range: 0.04-0.18 m s–1, n = 23, monthly, April 1996 – February 1998) over Eastern Beaufort Sea using Acoustic Doppler Current Profiler (Melling and Riedel, 2003). Note that the calculated velocities are based on 210Po/210Pb initial AR value of 0.039 (Table 1) and if AR is higher due to significant contribution of 210Po from resuspension of superfine sedimentary material with initial AR > 0.039, then, the age will be lower and the transport velocities will be higher.
Dating of Melt Pond Using 210Po/210Pb AR
During late spring and early summer, melt from snow (meteoric water) and surface ice (ice core salinity range: 0-5.2 ppt, surface to 169 cm, Supplementary Figure 1) mixing with a fraction of surface seawater result in the formation of melt ponds. The melt ponds are generally darker compared to ice leading to more absorption of incident radiation (lower albedo) compared to snow and ice. Furthermore, the vertical and horizontal fluxes of melt water from snow and ice play a key role in the evolution of albedo, heat transfer, and mass balance of the Arctic ice pack (Eicken, 1994; Eicken et al., 2002; Perovich et al., 2003). Surface area and depth of the melt ponds were not recorded during the field expedition; however, an average surface area of 30 m2 and depth of 0.2 m have been reported (Eicken et al., 2002). The fractions of these three contributing sources to these melt ponds were estimated using a three end-member mixing model using salinity, δ18O and 7Be data (Marsay et al., 2018; Table 5).
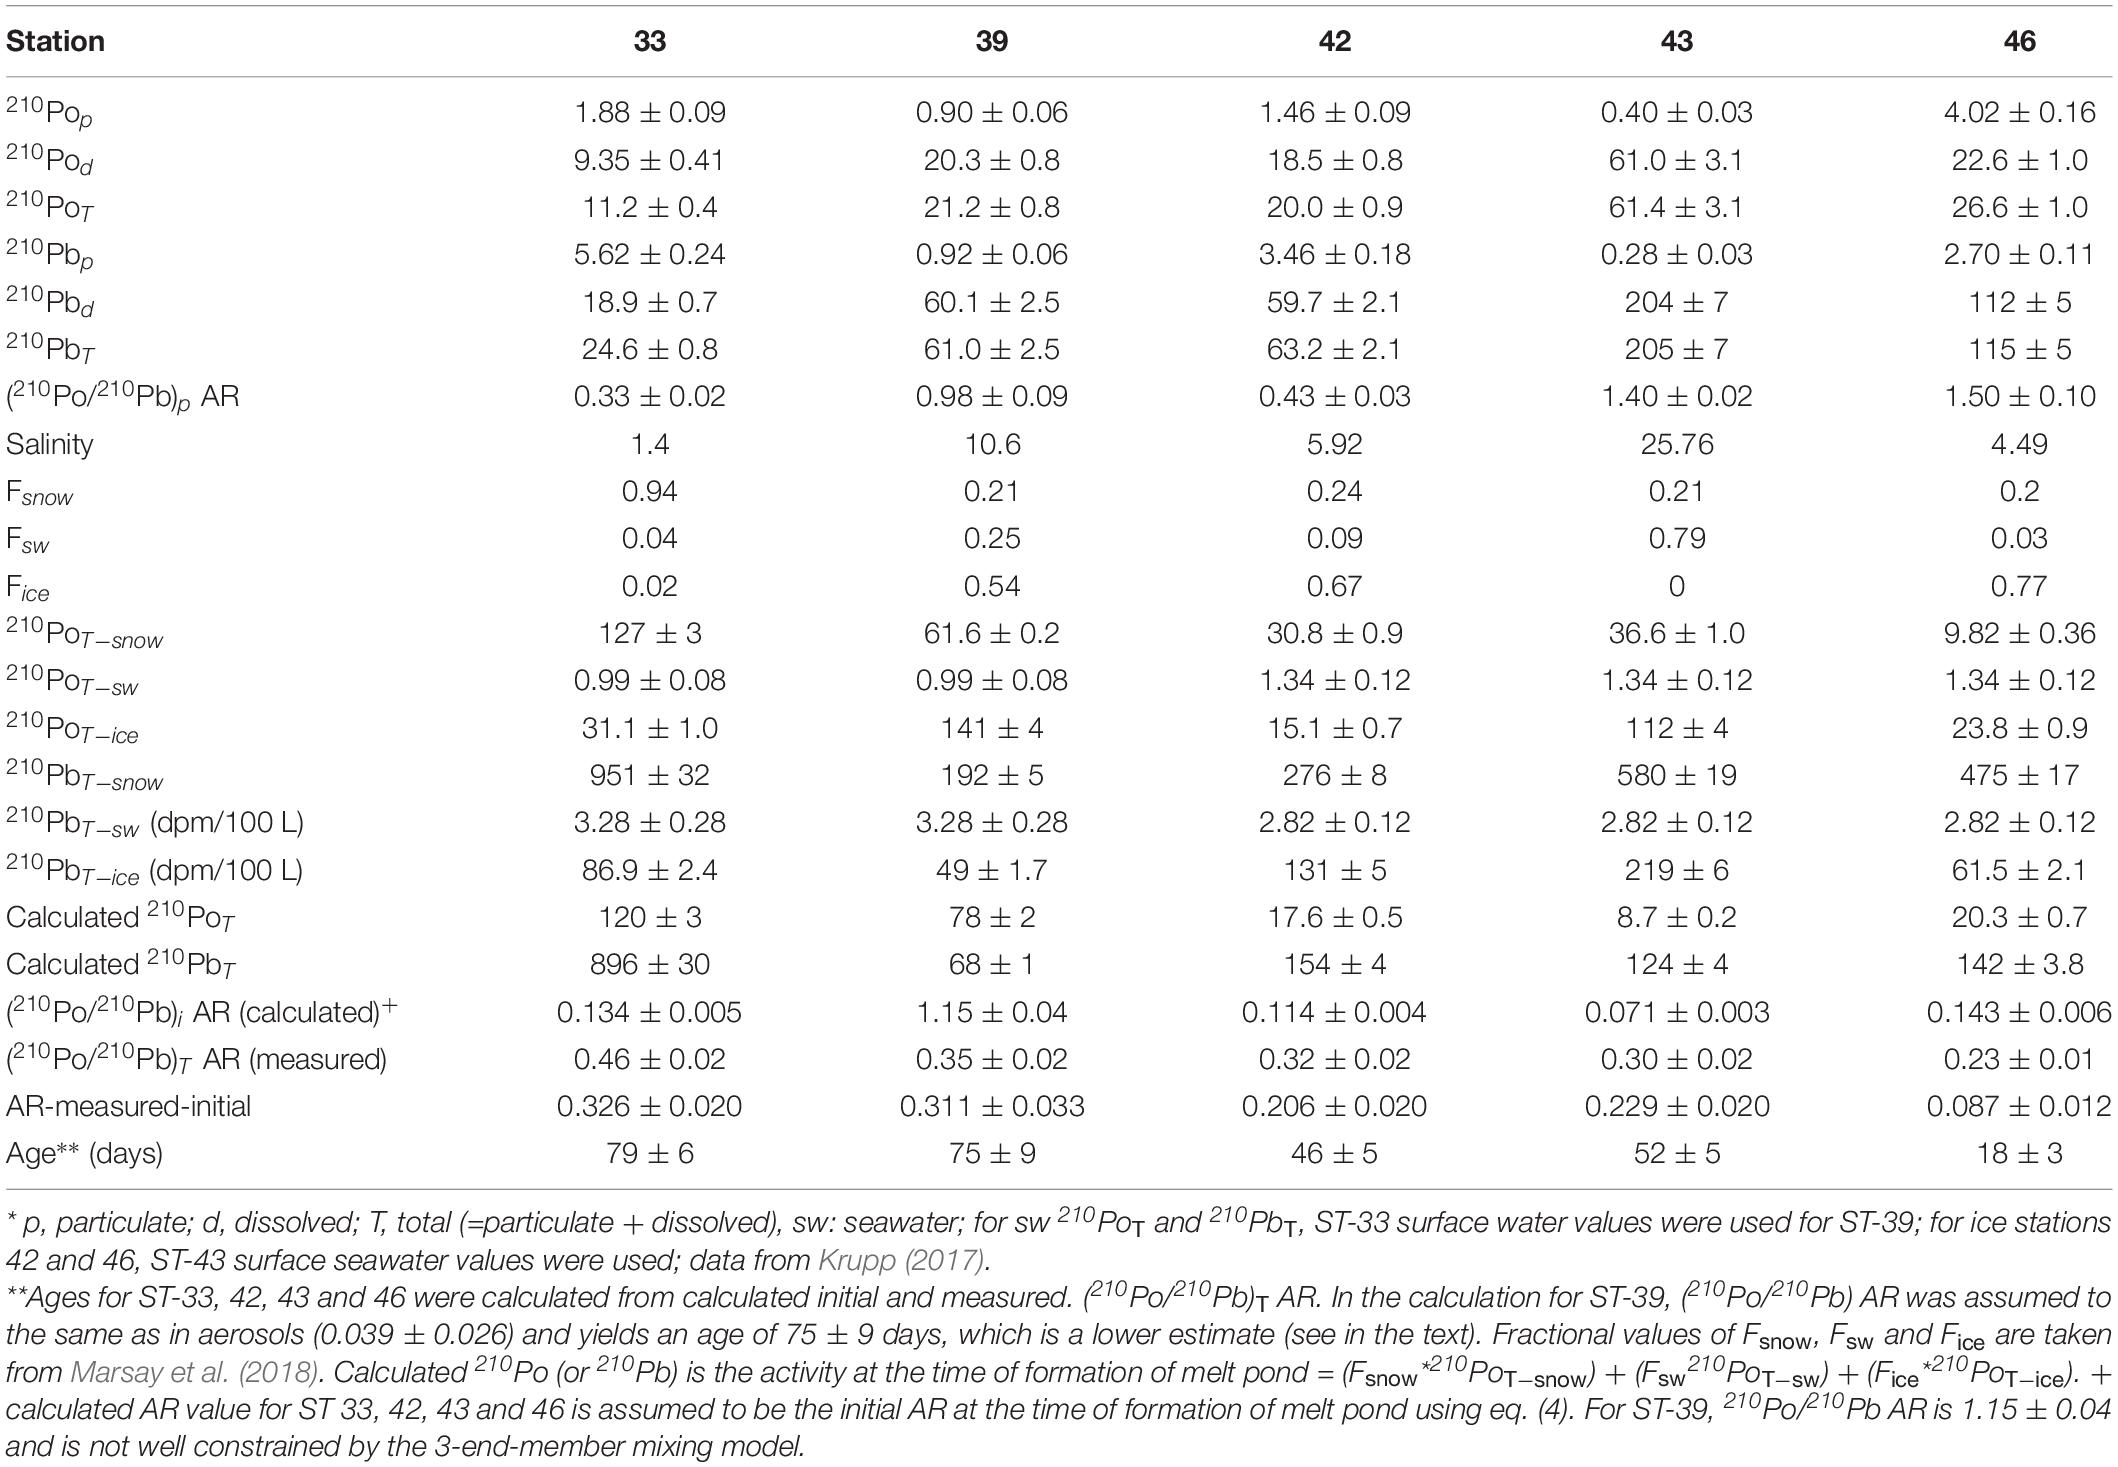
Table 5. *Activities of 210Po and 210Pb (dpm/100 L), fractional amounts snow (Fsnow), ice (Fice), and seawater (Fsw), and age** of melt ponds.
The activities of 210Pop range from 0.4 to 4.0 (mean: 1.7 ± 0.2 dpm 100L–1, n = 5) while the corresponding 210Pbp range from 0.3 to 5.6 (mean: 2.6 ± 0.4 dpm 100L–1, n = 5) which are comparable to values in Arctic surface waters (Moore and Smith, 1986; Smith et al., 2003; Roca-Marti et al., 2016; Bam et al., 2020). However, the 210PoT range from 11 to 61 (mean: 28 ± 3, n = 5) dpm 100L–1 and 210PbT range from 25 to 205 (mean: 94 ± 8, n = 5) dpm 100L–1, which are about 5 to 10 times higher than those found in surface seawater from the same or nearby stations (Figures 2A,B and Table 5). Such differences between particulate and total activities are attributed to differences in the sources of water to the melt ponds, with differences in the activities between the three source waters (Figures 2A,B and Table 5). The activities of 210PoT and 210PbT at the time of melt pond formation were calculated using three end-member (snow, ice, and surface seawater) mixing model, as given in (eq. 4). The initial (210PoT/210PbT) AR varied between 0.071 and 0.143 (n = 4); however, in ST-39, the ratio is >1.0.
and likely the assumptions are not well constrained; taking the initial AR to be the same as that of the aerosols (Table 1), we get an age of 75 ± 9 days, although no other rationale can be given for using this ratio. Assuming the melt pond was formed in a relatively short timescale compared to the age of the pond, its age calculated using eq. (3) varied between 18 ± 3 and 79 ± 6 days (mean: 60 ± 14 days, n = 4, Table 5). If this assumption is not strictly valid, then, the calculated age reported in Table 5 is an overestimate. The ages (Figure 4 and Table 5) indicate that ST-33 pond formed in late spring while ST-42, 43 in early summer and ST-46 in mid-summer.
If the particulate matter present in some of the melt ponds had undergone multiple melt-freeze cycles spanning over more than a year, then, we expect secular equilibrium between 210Pop and 210Pbp with 210Pop/210Pbp AR ∼ 1.0, under a closed system for 210Po and 210Pb. In two samples where (210Po/210Pb)p AR is >1.0, the particulate matter could have undergone multiple melt-freeze cycles although we have no other supporting evidence (Figure 3A and Table 5). Note that average particulate fraction of 210Po is only 8.8% (range: 0.7-16.7%), and even if some of the particulate matter is derived from multiple melt-freeze cycles that will not affect the (210Po/210Pb)T AR-based-ages. However, in 3 samples (210Po/210Pb)p AR is < 1.0 and (210Po/210Pb)T AR is <1.0 in all 5 samples (Table 5).
Activity of 210Po and 210Pb, Their AR and Dating of Ice Core
The 210Pop,d and 210Pbp,d activities in the upper segment of 6 ice cores varied by more than an order of magnitude, from 4.4 to 75 dpm 100L–1 for 210Pop and 11 to 120 dpm 100 L–1 for 210Pbp and 11 to 96 dpm 100L–1 for 210Pod and 0.8 to 174 dpm 100 L–1 for 210Pbd. The activities of particulate, dissolved and total phases varied over two orders of magnitude in all 31 split samples (Table 6), similar to an earlier study (Masqué et al., 2007). Although there is no excess 210Po (i.e., 210Po/210Pb AR < 1.0) in the inventory-based particulate or dissolved phases (Table 7), excess 210Pod (and 210PoT) were observed in three discrete layers: ST-31 (100-130 cm), ST-33 (84-112 cm), and ST-39 (0-38 cm); the (210Po/210Pb)T AR in those layers ranged between 2.88 and 4.58 (Table 6), indicating preferential sorption of 210Po and/or preferential loss of 210Pb. This contrasts with observed 210Po-210Pb equilibrium in 87%, (within ± 1σ) of the 38 segments from two ice cores from Fram Strait, although reported associated errors in majority of the samples were high in Masqué et al. (2007).
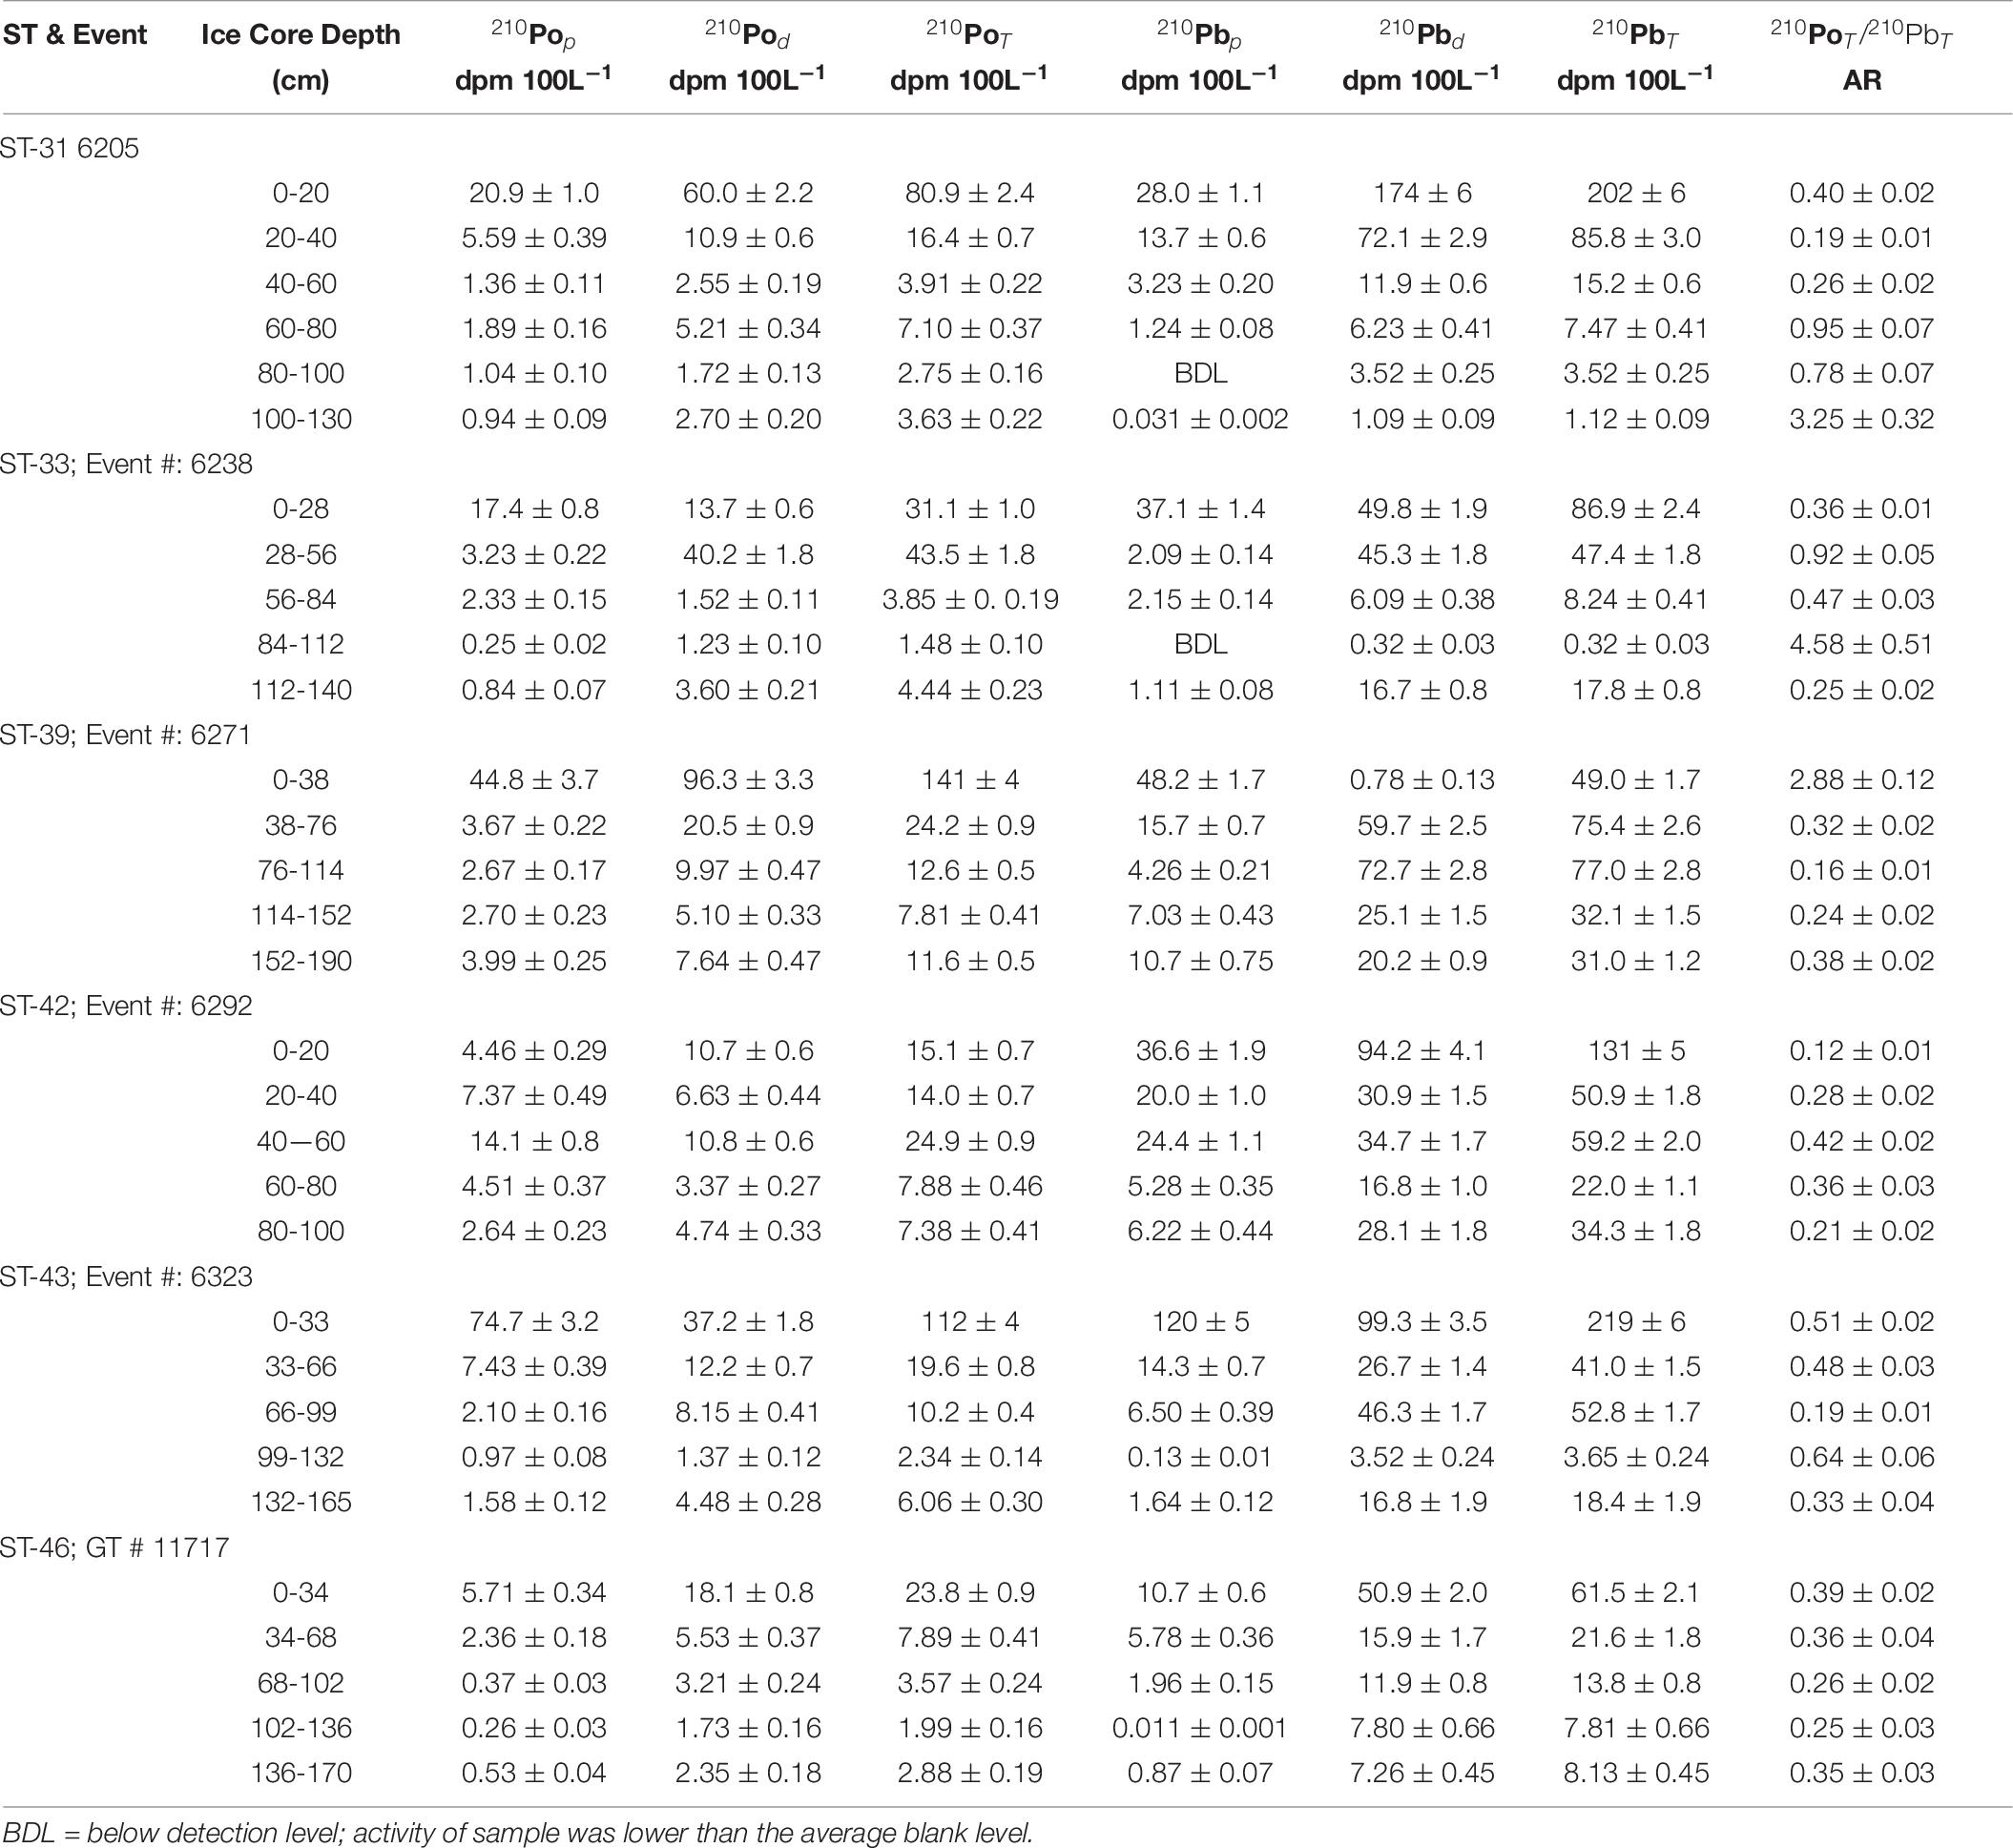
Table 6. Dissolved, particulate, total activities and activity ratios for ice station samples.
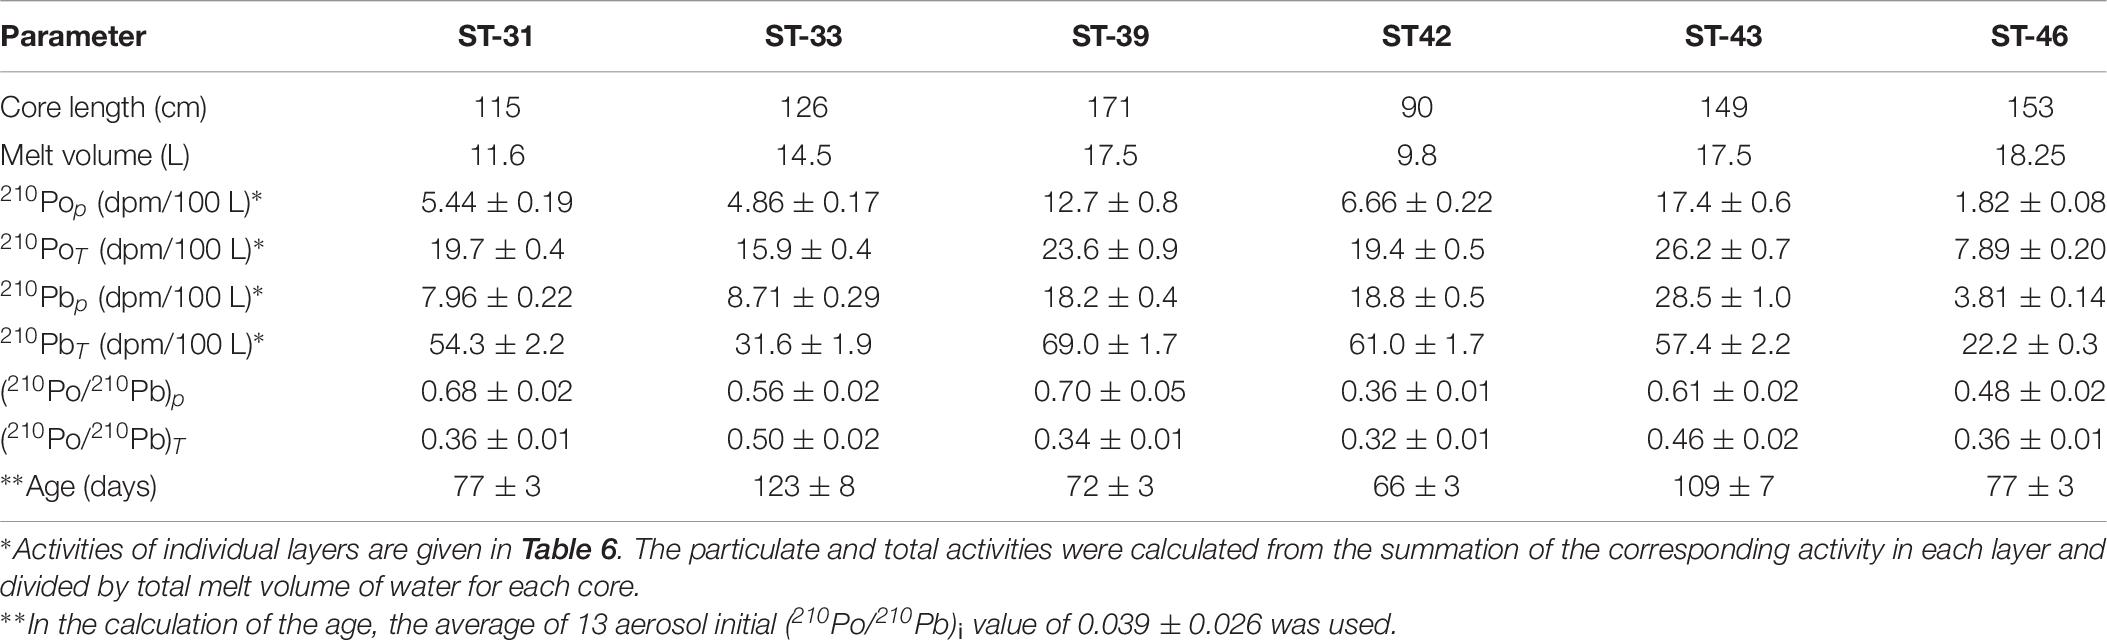
Table 7. Calculated inventory-based particulate (p) and total (T = p + d) activity of 210Po and 210Pb and their activity ratio in whole ice core collected during US GEOTRACES Arctic cruise (HLY 1502).
If the accumulation and ablation of ice takes place uniformly, with accretion from the top and ablation from the bottom, the (210Po/210Pb)T AR profile is expected to increase with increasing depth; however, when multiple processes such as meltwater deformation, seawater congelation, and false bottom formation takes place, the measured (210Po/210Pb)T AR will result in a more complicated profile. If a multi-year (≥2 year) ice is present, the (210Po/210Pb)T AR is expected to be ∼1.0 under the assumption that the 210Po-210Pb has remained a closed system. We contend that ice that are >2 year old should have an 210Pop/210Pbp AR of ∼1.0, because any disequilibrium broken earlier in the decay chain will adjust to radioactive secular equilibrium in about two years, and thus paving the way to delineate >1 year old ice from more recent ones. The 210Po/210Pb AR of 0.95 ± 0.07 in only one sample (ST-30, 60-80 cm, Table 6) could be a part of multi-year ice segment; thus, we report the ice samples we collected are mostly first-year ice, with 210Po/210Pb ARs ranging between 0.12 ± 0.01 and 0.78 ± 0.07 (n = 25, Table 6).
The inventory-based (=Σ activities in each segment of the ice core, dpm/Σ volume of melt water, L) activities of 210Pop, 210Pbp, 210Pod and 210Pbd varied widely: 210Pop, varied about an order of magnitude, from 1.8 to 17.4 (mean: 8.1 ± 5.8, n = 6) dpm 100L–1; 210PoT varied within a factor of ∼3, from 7.9 to 26.2 (mean: 18.8 ± 6.4, n = 6, calculated from Table 7) dpm 100L–1. The range of 210Pbp activities is similar to 210Pop, from 3.8 to 28.5 (mean: 14.3 ± 9.2, n = 6) dpm 100L–1, while the corresponding values for 210PbT varied within a factor of ∼3, from 22 to 69 (mean: 49 ± 18, n = 6, dpm 100L–1). These values are almost an order of magnitude higher than those for the Arctic surface waters (Figures 2A,B and Tables 6, 7), suggesting a significant fraction of the source of water is from snow melt and possibly some recycled component of melt ponds. During spring and summer, melt pond water can percolate through the depth of the ice floe forming a lens of super-cooled freshwater at the interface between the ice floe and surface seawater, which ultimately grows into a horizontal ice sheet known as false-bottom ice (Eicken, 1994; Eicken et al., 1997; Polashenski et al., 2012) and thus the signature of the melt pond could have been be imprinted on bottom ice. It seems this is a novel observation presenting a radioisotope-based evidence that the ice core derived some component of water from snow.
The (210Po/210Pb)p AR for the whole ice core varied between 0.36 and 0.70 (mean: 0.56 ± 0.13, n = 6) which is significantly higher than the range of values and mean for (210Po/210Pb)T AR, 0.32 to 0.50 (mean: 0.39 ± 0.07, n = 6, Table 7). The higher (210Po/210Pb)p AR compared to (210Po/210Pb)d and (210Po/210Pb)T are similar to snow and melt pond, confirming enrichment of 210Po in particulate matter. The calculated composite ages of the ice core, based on the inventory of 210PoT and 210PbT and assuming initial (210Po/210Pb) AR = 0.039, ranged between 66 and 123 days (mean: 87 ± 23 days; Figure 4 and Table 7). If the initial ARs are higher, the calculated ages are upper limits.
Conclusion and Future Outlook
We measured the disequilibrium between 210Po and 210Pb in a suite of aerosols and ice-rafted sediment as well in particulate and dissolved phases of snow, water from melt pond and surface seawater. We report, for the first time, highly elevated levels of 210Po in biogenic particulate matter in snow and melt pond compared to 210Pb indicating biogeochemical cycling of biogenic elements such as polonium is different in the Arctic. We also report one to two orders of magnitude higher 210Pb and 210Po activities in ice-rafted sediments (IRS) compared to benthic source sediments which indicate that the sea ice-sediment (i.e., IRS) is a powerful vector in the transport of land- and atmospherically delivered particle-reactive contaminants from the coastal area to the deep Arctic. Furthermore, transport of ice-rafted sediments through sea ice is one of the major mechanisms by which coastal sediments are transported and dispersed in the deep Arctic (during melt season) and nutrients associated with coastal sediments serve as food resource for deep benthic organisms in the open Artic, thus indicating coupling between coastal and deep arctic benthic ecosystems. The key findings are given below:
(i) From the measured 210Po/210Pb AR in snow and using the mean AR in aerosol as the initial AR in snow, the calculated age of snow collected from 6 different ice stations varied between 1.7 and 34 days (mean: 13 days);
(ii) The ages of 5 different melt ponds, based on the measured 210Po/210Pb AR and three end-member mixing modeling, ranged between 18 and 79 days (mean: 60 days). The activities of 210Po and 210Pb in melt-ponds is about 10 times higher compared to the surface seawater in the Arctic Ocean;
(iii) From the measured 210Po-210Pb activities in aerosols, collected from 13 different stations covering the entire 10 weeks of Western Arctic GEOTRACES cruise track from Dutch Harbor, AK to the North Pole, we show that the mean 210Po/210Pb activity ratio (AR) of 0.039 ± 0.026 (n = 13) corresponds to a residence time of 12 ± 7 days;
(iv) The transport velocity of the ice-rafted sediment in the shelf and interior Arctic Ocean, estimated based on the age obtained using 210Po/210Pb AR, 0.12 and 0.27 m/s, (mean: 0.18 ± 0.06 m/s) agree with the data obtained using buoys and Acoustic Doppler current profiler; and
(v) The 210Po/210Pb AR serves as a quantitative tool in delineating multiple-year ice from seasonal ice.
The residence time of snow and melt pond has direct bearing on the energy exchange between surface ocean and atmosphere as well as the heat exchange between Arctic and sub-arctic global oceans. The disequilibrium between 210Po and 210Pb provide not only a powerful tool in establishing chronology but also insight on the mechanism(s) of Po enrichment onto biogenic particulate matter. Routine identification of multi-year (those that survived more than one melt cycle) ice is now possible using 210Po/210Pb AR as a metric. Furthermore, long-term longitudinal study on the annual variations in the age of snow and melt pond in a particular region caused by climate change in the Arctic may enable us to quantify the radiation balance changes caused by faster melting of snow and later freeze. Highly enriched 210Po in particulate matter in snow, ice and melt ponds suggest that the biological organisms play a key role in the enrichment of biogenic elements. The factors and processes that cause high enrichment of polonium in the particulate matter obtained from snow, ice and melt pond remains unknown. A systematic study on the distribution of 210Po and 210Pb in particulate and dissolved phases along with characterization of particulate matter including quantification of acid polysaccharides and other biogenic molecular compounds will yield valuable information to understand the mechanisms of Po enrichment onto particulate matter in the Arctic.
Data Availability Statement
The original data for this study are presented in the article/Supplementary Material. The data also can be obtained from https://www.bco-dmo.org/dataset/794064; and further inquiries can be directed to the corresponding author.
Author Contributions
MB developed the idea, secured the funding, oversaw the project from conception to the end, and wrote most of the manuscript. KK participated in the cruise, collected and analyzed the samples, and interpreted the data. Both authors contributed to the article and approved the submitted version.
Funding
The work presented was a part of a master’s thesis of KK. This work was supported by the National Science Foundation grant (NSF-PLR-1434578).
Conflict of Interest
The authors declare that the research was conducted in the absence of any commercial or financial relationships that could be construed as a potential conflict of interest.
Publisher’s Note
All claims expressed in this article are solely those of the authors and do not necessarily represent those of their affiliated organizations, or those of the publisher, the editors and the reviewers. Any product that may be evaluated in this article, or claim that may be made by its manufacturer, is not guaranteed or endorsed by the publisher.
Acknowledgments
We thank Captain, crew, and US GEOTRACES Western Arctic Management team for collection of water, snow, ice, and aerosol samples.
Supplementary Material
The Supplementary Material for this article can be found online at: https://www.frontiersin.org/articles/10.3389/fmars.2021.692631/full#supplementary-material
Supplementary Figure 1 | Vertical profiles of salinity in 5 ice cores.
References
Bacon, M. P., Spencer, D. W., and Brewer, P. G. (1976). 210Pb/226Ra and 210Po/210Pb disequilibria in seawater and suspended particulate matter. Earth Planet. Sci. Lett. 32, 277–296.
Bam, W., Maiti, K., Baskaran, M., Krupp, K., Lam, P. J., and Xiang, Y. (2020). Variability of 210Pb and 210Po partition coefficients (Kd) along the US GEOTRACES Arctic Transect. Mar. Chem. 219:103749. doi: 10.1016/j.marchem.2020.103749
Baskaran, M. (2005). Interaction of sea ice sediments and surface sea water in the Arctic Ocean: Evidence from excess 210Pb. Geophys. Res. Lett. 32:L12601.
Baskaran, M. (2011). Po-210 and Pb-210 as atmospheric tracers and global atmospheric Pb-210 fallout: a Review. J. Environ. Radioact. 102, 500–513. doi: 10.1016/j.jenvrad.2010.10.007
Baskaran, M. (2016). Applications of Radon progeny in atmospheric studies. In: Radon: A Tracer for Geological, Geophysical and Geochemical Studies. Berlin: Springer.
Baskaran, M., Church, T. M., Hong, G.-H., Kumar, A., Qiang, M., Choi, H., et al. (2013). Effects of flow rates and composition of the filter, and decay-in-growth correction factors involved with the determination of in-situ particulate 210Po and 210Pb in seawater. Limnol. Oceanogr. Methods 11, 126–138. doi: 10.4319/lom.2013.11.126
Baskaran, M., and Shaw, G. E. (2001). Residence time of arctic haze aerosols using the concentrations and activity ratios of 210Po, 210Pb, and 7Be. J. Aerosol Sci. 32, 17–26.
Carmack, E., and Chapman, D. C. (2003). Wind-driven shelf/basin exchange on the Arctic shelf: the joint roles of ice cover extent and shelf-break bathymetry. Geophys. Res. Lett. 30:1778.
Charette, M. A., Kipp, L. E., Jensen, L. T., Dabrowski, J. S., Whitmore, L. M., Fitzsimmons, J. N., et al. (2020). The transpolar drift as a source of riverine and shelf-derived trace elements to the Central Arctic Ocean. J. Geophys. Res. 125:e2019JC01520.
Chen, M., Ma, Q., Guo, L. D., Qiu, Y., Li, Y., and Yang, W. (2012). Importance of lateral transport processes to 210Pb budget in the eastern Chukchi Sea during summer 2003. Deep-Sea Res. II 81-84, 53–62. doi: 10.1016/j.dsr2.2012.03.011
Cochran, J. K., and Masque, P. (2003). Short-lived U/Th-series radionuclides in the ocean: tracers for scavenging rates, export fluxes and particle dynamics. Rev. Mineral. Geochem. 52, 461–492. doi: 10.2113/0520461
Conan, F., and Robertson, L. B. (2002). Latitudinal distribution of radon-222 flux from continents. Tellus 54B, 127–133. doi: 10.1034/j.1600-0889.2002.00365.x
Cookbook (2014). Sampling and Sample-handling Protocols for GEOTRACES Cruises. Available Online at: http://www.geotraces.org/images/stories/documents/intercalibration/Cookbook_v2.pdf
Cooper, L. W., Larsen, I. L., Beasley, T. M., Dolvin, S. S., Grebmeier, J. M., Kelley, J. M., et al. (1998). The distribution of radiocesium and plutonium in sea ice-entrained Arctic sediments in relation to potential sources and sinks. J. Environ. Radioact. 39, 279–303. doi: 10.1016/s0265-931x(97)00058-1
Eicken, H. (1994). Structure of under-ice melt ponds in the Central Arctic and their effect on sea-ice cover. Limnol. Oceanogr. 39, 682–694. doi: 10.4319/lo.1994.39.3.0682
Eicken, H., Krouse, H. R., Kadko, D., and Perovich, D. K. (2002). Tracer studies of pathways and rates of meltwater transport through Arctic summer sea ice. J. Geophys. Res. 107:8046. doi: 10.1029/2000JC000583
Eicken, H., Reimnitz, E., Alexandrov, V., Martin, T., Kassens, H., and Viehoff, T. (1997). Sea-ice processes in the Laptev Sea and their importance for sediment export. Cont. Shelf Res. 17, 205–233. doi: 10.1016/s0278-4343(96)00024-6
Fowler, S. W. (2011). 210Po in the marine environment with emphasis on its behavior within the biosphere. J. Environ. Radioact. 102, 448–461. doi: 10.1016/j.jenvrad.2010.10.008
Grenier, M., Francois, R., Soon, M., van der Loeff, M. R., Yu, X., Valk, O., et al. (2019). Changes in circulation and particle scavenging in the Amerasian Basin of the Arctic Ocean over the last three decades inferred from the water column distribution of geochemical tracers. J. Geophys. Res. 124, 9338–9363. doi: 10.1029/2019jc015265
Hebbeln, D., and Weber, G. (1991). Effects of ice coverage and ice-rafted material on sedimentation in the fram strait. Nature 350, 409–411. doi: 10.1038/350409a0
Jweda, J., and Baskaran, M. (2011). Interconnected riverine-lacustrine systems as sedimentary repositories: A case study in southeast Michigan using excess 210Pb- and 137Cs-based sediment accumulation and mixing models. J. Great Lakes Res. 37, 432–446. doi: 10.1016/j.jglr.2011.04.010
Kadko, D., and Landing, W. M. (2015). U.S. Arctic GEOTRACES Cruise Report. Available Online at: https://www.bodc.ac.uk/resources/inventories/cruise_inventory/reports/healy1502.pdf
Kim, G., Hong, Y.-L., Jang, J., Lee, I., Hwang, D.-W., and Yang, H.-S. (2005). Evidence for anthropogenic 210Po in urban atmosphere of Seoul, Korea. Environ. Sci. Technol. 39, 1519–1522. doi: 10.1021/es049023u
Kim, G., Hussain, N., and Church, T. M. (2000). Excess 210Po in the coastal atmosphere. Tellus B 52, 74–80. doi: 10.1034/j.1600-0889.2000.00975.x
Kipp, L. E., Charette, M. A., Moore, W. S., Henderson, P. B., and Rigor, I. G. (2018). Increased fluxes of shelf-derived materials to the central Arctic Ocean. Sci. Adv. 4:eaao1302. doi: 10.1126/sciadv.aao1302
Krembs, C., Eicken, H., and Deming, J. W. (2011). Exopolymer alteration of physical properties of sea ice and implications for ice habitability and biogeochemistry in a warmer Arctic. Proc. Natl. Acad. Sci. 108, 3653–3658. doi: 10.1073/pnas.1100701108
Krupp, K. D. (2017). Using 210Po/210Pb disequilibria to characterize the biogeochemistry and quantify the dynamics of sea ice in the Arctic. M.S. thesis. Detroit: Wayne State University.
Landa, E. R., Reimnitz, E., Beals, D. M., Pochkowski, J. M., Winn, W. G., and Rigor, I. (1997). Transport of 137Cs and 239,240Pu with ice-rafted debris in the Arctic Ocean. Arctic 51, 27–39.
Marley, N. A., Gaffney, J. S., and Drayton, P. J. (2000). Measurement of 210Pb, 210Po and 210Bi in size-fractionated atmospheric aerosols: an estimate of fine-aerosol residence times. Aerosol. Sci. Technol. 32, 569–583. doi: 10.1080/027868200303489
Marsay, C. M., Aguilar-Islas, A., Fitzsimmons, J. N., Hatta, M., Jensen, L. T., John, S. G., et al. (2018). Dissolved and particulate trace elements in late summer Arctic melt ponds. Mar. Chem. 204, 70–85. doi: 10.1016/j.marchem.2018.06.002
Morton, P. L., Landing, W. M., Hsu, S. C., Milne, A., Aguilar-Islas, A. M., Baker, A. R., et al. (2013). Methods for the sampling and analysis of marine aerosols: results from the 2008 GEOTRACES aerosol intercalibration experiment. Limnol. Oceanogra. Methods 11, 62–78. doi: 10.4319/lom.2013.11.62
Masqué, P., Cochran, J. K., Hirschberg, D. J., Dethleff, D., Hebbeln, D., Winkler, A., et al. (2007). Radionuclides in Arctic sea ice: Tracers of sources, fates, and ice transit time scales. Deep-Sea Res. I 54, 1289–1310. doi: 10.1016/j.dsr.2007.04.016
McNeary, D., and Baskaran, M. (2003). Depositional characteristics of 7Be and 210Pb in Southeastern Michigan. J. Geophys. Res. 108:D04210. doi: 10.1029/2002JD003021
McNeary, D., and Baskaran, M. (2007). Residence times and temporal variations of 210Po in aerosols and precipitation from Southeastern Michigan, USA. J. Geophys. Res. 112:D04208. doi: 10.1029/2006JD007639
Meese, D. A., Reimitz, E., Tucker, W. B., Gow, A. J., Bischoff, J., and Darby, D. (1997). Evidence for radionuclide transport by sea ice. Sci. Total Environ. 202, 267–278. doi: 10.1016/s0048-9697(97)00121-6
Melling, M., and Riedel, D. A. (2003). Ice draft and ice velocity data in the Beaufort Sea, 1990-2003, Versions. 1. Boulder, Colorado: National Snow and Ice Data Center.
Moore, H. E., Poet, S. E., and Martell, E. A. (1973). 222Rn, 210Pb, 210Bi, and 210Po profiles and aerosol residence times versus altitude. J. Geophys. Res. 78, 7065–7075.
Moore, R. M., and Smith, J. N. (1986). Disequilibria between 226Ra, 210Pb and 210Po in the Arctic Ocean and the implications for chemical modification of the Pacific water inflow. Earth Planet. Sci. Lett. 77, 285–292. doi: 10.1016/0012-821x(86)90140-8
Niedermiller, J., and Baskaran, M. (2019). Comparison of the scavenging intensity, remineralization and residence time of 210Po and 210Pb at key zones (biotic, sediment-water and hydrothermal) along the East Pacific GEOTRACES transect. J. Environ. Radioact. 198, 165–188. doi: 10.1016/j.jenvrad.2018.12.016
Nürnberg, D., Wollenburg, I., Dethleff, D., Eicken, H., Kassens, H., Letzig, T., et al. (1994). Sediments in Arctic sea ice – implications for entrainment, transport and release. Mar. Geol. 119, 185–214. doi: 10.1016/0025-3227(94)90181-3
Perovich, D. K., Grenfell, T. C., Richter-Menge, J. A., Light, B., Tucker, W. B. III, and Eicken, H. (2003). Thin and thinner: sea ice mass balance measurements during SHEBA. J. Geophys. Res. 108:8050.
Pfirman, S. L., Eicken, H., Bauch, D., and Weeks, W. F. (1995). The potential transport of pollutants by Arctic sea ice. Sci. Total Environ. 159, 129–146. doi: 10.1016/0048-9697(95)04174-y
Polashenski, C., Perovich, D., and Courville, Z. (2012). The mechanisms of sea ice melt pond formation and evolution. J. Geophys. Res. 117:C01001.
Reimnitz, E., Kempema, E. W., and Barnes, P. W. (1987). Anchor ice, seabed freezing, and sediment dynamics in shallow arctic seas. J. Geophys. Res. 92, 14671–14678. doi: 10.1029/jc092ic13p14671
Rigaud, S., Puigcorbe, V., Camara-Mor, P., Casacuberta, N., Roca-Marti, M., Garcia-Orellana, J., et al. (2013). A method assessment and recommendations for improving calculations and reducing uncertainties in the determination of 210Po and 210Pb activities in seawater. Limnol. Oceanogr. Methods 11, 561–571. doi: 10.4319/lom.2013.11.561
Robbins, J. A. (1978). “Geochemical and geophysical applications of radioactive lead,” in The Biogeochemistry of Lead in the Environment, ed. J. O. Nriagu (Amsterdam: Elsevier/North-Holland Biomedical Press), 285–393.
Robbins, J. A., Murdock, A., and Oliver, B. G. (1990). Transport and storage of 137Cs and 210Pb in sediments of Lake St. Clair. Can. J. Fish. Aquat. Sci. 47, 572–587.
Roberts, K. A., Cochran, J. K., and Barnes, C. (1997). 210Pb, 239,240Pu in the Northeast Water Polynya, Greenland: Particle dynamics and sediment mixing rates. J. Mar. Syst. 10, 401–413. doi: 10.1016/s0924-7963(96)00061-9
Roca-Marti, M., Puigcorbe, V., Rutgers van der Loeff, M. M., Katlein, C., Fernandez-Mendez, M., Peeken, I., et al. (2016). Carbon export fluxes and export efficiency in the central Arctic during the record sea-ice minimum in 2012: a joint 234Th/238U and 210Po/210Pb study. J. Geophys. Res. 121, 5030–5049. doi: 10.1002/2016jc011816
Rutgers van der Loeff, M., Kipp, L., Charette, M. A., Moore, W. S., Black, E., Stimac, I., et al. (2018). Radium isotopes across the Arctic Ocean show time scales of wáter mass ventilation and increasing shelf inputs. J. Geophys. Res. 123, 4853–4873. doi: 10.1029/2018jc013888
Rutgers van der Loeff, M. M., and Geibert, W. (2008). “U/Th series nuclides as tracers of particle dynamics, scavenging and biogeochemical cycles in the ocean,” in U-Th Series radionuclides in aquatic systems, eds S. Krishnaswami and J. K. Cochran (Amsterdam: Elsevier).
Smith, J. N., Moran, S. B., and Macdonald, R. W. (2003). Shelf-basin interactions in the Arctic Ocean based on 210Pb and Ra isotope tracer distributions. Deep-Sea Res. I 50, 397–416. doi: 10.1016/s0967-0637(02)00166-8
Sturm, M., Holmgren, J., and Perovich, D. K. (2002). Winter snow cover on the sea ice of the Arctic Ocean at the Surface Heat Budget of the Arctic Ocean (SHEBA): Temporal evolution and spatial variability. J. Geophys. Res. 107:8047.
Su, C. C., and Huh, C. A. (2002). Atmospheric 210Po anomaly as a precursor of volcanic eruptions. Geophys. Res. Lett. 29:1070. doi: 10.1029/2001GL013856
Turekian, K. K., Nozaki, Y., and Benninger, K. (1977). Geochemistry of atmospheric radon and radon products. Ann. Rev. Earth Planetary Sci. 5:227. doi: 10.1146/annurev.ea.05.050177.001303
Uttal, T., Curry, J. A., McPhee, M. G., Perovich, D. K., Moritz, R. E., Maslanik, J. A., et al. (2002). Surface heat budget of the Arctic Ocean. Bull. Am. Meteo. Soc. 83, 255–275.
Wang, J., Zhong, Q., Baskaran, M., and Du, J. Z. (2019). Investigations on the time-series partitioning of 210Pb, 207Bi and 210Po between marine particles and solution under different salinity and pH conditions. Chem. Geol. 528:119275. doi: 10.1016/j.chemgeo.2019.119275
Wilkening, M. H., and Clements, W. E. (1975). Radon-222 from ocean surface. J. Geophys. Res. 80, 3828–3830. doi: 10.1029/jc080i027p03828
Keywords: Po-210/Pb-210 dating, Arctic pollutant transport, dating ice-rafted sediment, dating of snow and melt pond, Po-210 enrichment in particulate matter, environmental changes in the Arctic
Citation: Baskaran M and Krupp K (2021) Novel Application of 210Po-210Pb Disequilibria to Date Snow, Melt Pond, Ice Core, and Ice-Rafted Sediments in the Arctic Ocean. Front. Mar. Sci. 8:692631. doi: 10.3389/fmars.2021.692631
Received: 08 April 2021; Accepted: 18 June 2021;
Published: 30 July 2021.
Edited by:
Laodong Guo, University of Wisconsin–Milwaukee, United StatesReviewed by:
Guebuem Kim, Seoul National University, South KoreaXilong Wang, Beibu Gulf University, China
Copyright © 2021 Baskaran and Krupp. This is an open-access article distributed under the terms of the Creative Commons Attribution License (CC BY). The use, distribution or reproduction in other forums is permitted, provided the original author(s) and the copyright owner(s) are credited and that the original publication in this journal is cited, in accordance with accepted academic practice. No use, distribution or reproduction is permitted which does not comply with these terms.
*Correspondence: Mark Baskaran, QmFza2FyYW5Ad2F5bmUuZWR1; orcid.org/0000-0002-2218-4328