 Kerrylee Rogers1*
 Neil Saintilan2
- 1School of Earth, Atmospheric and Life Sciences, University of Wollongong, Wollongong, NSW, Australia
- 2Department of Earth and Environmental Science, Macquarie University, Sydney, NSW, Australia
The fate of coastal wetlands and their ecosystem services is dependent upon maintaining substrate elevations within a tidal frame that is influenced by sea-level rise. Development and application of morphodynamic models has been limited as few empirical studies have measured the contribution of key processes to surface elevation change, including mineral and organic matter addition, autocompaction of accumulating sediments and deep subsidence. Accordingly, many models presume that substrates are in equilibrium with relative sea-level rise (RSLR) and the composition of substrates are relatively homogenous. A 20-year record of surface elevation change and vertical accretion from a large tidal embayment in Australia coupled with analyses of inundation frequency and the character of sediments that have accumulated above mean sea level was analyzed to investigate processes influencing surface elevation adjustment. This study confirms the varying contribution of addition, decomposition and compression of organic material, and mineral sediment consolidation. Autocompaction of substrates was proportional to the overburden of accumulating sediments. These processes operate concurrently and are influenced by sediment supply and deposition. Vertical accretion was linearly related to accommodation space. Surface elevation change was related to vertical accretion and substrate organic matter, indicated by carbon storage above mean sea level. Surface elevation change also conformed to models that initially increase and then decrease as accommodation space diminishes. Rates of surface elevation change were largely found to be in equilibrium with sea-level rise measured at the nearest tide gauge, which was estimated at 3.5 mm y–1 over the period of measurements. As creation of new accommodation space with sea-level rise is contrary to the longer-term history of relative sea-level stability in Australia since the mid-Holocene, striking stratigraphic variation arises with deeper sediments dominated by mineral sands and surficial sediments increasingly fine grained and having higher carbon storage. As the sediment character of substrates was found to influence rates of surface elevation gain, we caution against the unqualified use of models derived from the northern hemisphere where substrates have continuously adjusted to sea-level rise and sediment character is likely to be more homogenous.
Introduction
The influence of accelerating sea-level rise (SLR) (Church et al., 2013) on tidal dynamics has directed attention to the fate of saline coastal wetlands and the ecosystem services they provide (Reed, 1990; Morris et al., 2002; Krauss et al., 2014). The response of coastal wetlands to SLR is dependent upon feedbacks between hydrodynamics, sedimentation, plant productivity, sediment diagenesis, and organic matter decomposition (Pethick, 1981; Allen, 2000; Morris et al., 2002; Alongi, 2008). These feedbacks influence wetland substrate elevations and are important when considering the fate of coastal wetlands exposed to rising sea level. As such, there has been increasing focus on measuring and parameterizing processes contributing to elevation adjustment (see reviews by Fagherazzi et al., 2012; Wiberg et al., 2020). Allen (2000) conceptualized a relatively simple one dimensional model describing substrate elevation adjustment relative to a moving tidal frame that is influenced by SLR (ΔE). In this model, the change in tidal position of a wetland surface is attributed to the addition of mineral sediment (ΔSmin) and organic material (ΔSorg), and the degree of change due to autocompaction (ΔP). Critically, this adjustment is relative to the additional vertical space created by SLR for sediment accumulation (ΔM). The term “accommodation space” is used to describe the vertical space for mineral and sediment accumulation. In the context of this model, the variable ΔM incorporates available accommodation space created by both eustatic, tectonic and isostatic processes influencing relative SLR, whilst ΔP describes the additional accommodation space created by autocompaction.
Resolving spatial and temporal patterns in surface elevation change is crucial for developing and validating morphodynamic models of the response of coastal wetlands to a shifting tidal frame as sea level rises, and some efforts have been directed toward this task. Early empirical studies found that accretion was proportional to tidal position and proposed that this was due to negative feedbacks between these factors; the ensuing outcome of negative feedbacks was proposed to be an asymptote in substrate elevations as they age (Kestner, 1975; Pethick, 1981). Subsequent empirical models described sedimentation in the context of inundation depth and distances to sediment sources, such as creeks and channels, with functions taking an exponential (Temmerman et al., 2003) or linear form (Krone, 1987; French, 1993). Physical models built upon Exner’s equation of conservation of mass applied advection diffusion equations (Rinaldo et al., 1999) that could be modified to account for distances to sediment sources. As empirical data of processes contributing to surface elevation change became available, models have evolved and increased in complexity. The empirically developed model of Morris et al. (2002) ascribed surface elevation change to both organic matter addition and mineral sediment addition that was proportional to depth below mean high tide and organic matter addition was parameterized as a function of the standing density of plant biomass or above ground productivity. The productivity function was expressed as a second order polynomial that describes the relationship between productivity of Spartina alterniflora and depth below mean high tide, and coefficients describe the tolerance of vegetation to inundation and the inundation depth of peak productivity. Application of a modified form of Exner’s equation by Marani et al. (2013) quantified sediment deposition on the basis of settling velocity, bulk density and sediment porosity, and was governed by hydrodynamic transport regulated by tidal flooding. It also allowed for the rate of organic matter production to be modulated by compaction and decomposition processes, and incorporated the varying tolerance of different species to inundation and associated feedbacks with organic matter addition to substrates. The Organic-Inorganic Marsh Accretion and Stratigraphy-Numerical (OIMAS-N) model (Mudd et al., 2009) takes a one-dimensional form and simulates the evolution of a sediment column with SLR. It specifically incorporates organic matter addition, decay of three carbon pools (refractory, fast labile, and slow labile), inorganic sedimentation, and compaction. The model is parameterized so that organic matter declines linearly away from the surface and is proportional to above-ground biomass (as per Morris et al., 2002) and inorganic sedimentation is linearly related to and inundation. Compaction is a function of void space and the compressibility of substrate material of varying fabric (i.e., mineral or organic) and size (i.e., sand and silt). The Wetland Accretion Rate Model of Ecosystem Resilience (WARMER) model (Swanson et al., 2014; Thorne et al., 2018) has a similar structure and incorporates mineral sediment accretion, organic matter addition and decomposition and compaction. Mineral sediment is parameterized to increase linearly with increasing inundation depth, organic matter addition follows Morris et al. (2002), organic matter decomposition declines exponentially from the surface, and compaction varies with sediment porosity (as per Callaway et al., 1996).
Currently there is general agreement that net vertical accretion, arising from mineral sedimentation and erosion, is a function of accommodation space. This is commonly and expressed in models on the basis of elevation or depth below mean high tide and related to energy pathways that transport sediment for deposition or erosion (Fagherazzi et al., 2012). Model functions variably take a linear form (for example Krone, 1987; French, 1993) or exponential form (for example Temmerman et al., 2003). Organic matter accretion may also be expressed as a function of accommodation space, either linearly (D’Alpaos et al., 2007), or as a second-order polynomial with peak productivity delimited by the vertical distribution of vegetation (Morris et al., 2002). However, there is less agreement on attribution of the post-depositional behavior of mineral and organic matter in substrates (Wiberg et al., 2020; Zhang et al., 2020).
Empirical data and associated models are commonly derived from wetlands of the mid-Atlantic coasts of the United States and Europe, southern coasts of the North Sea, and Pacific coasts of the United States, where wetlands have been adjusting to relative sea-level rise (RSLR) for millennia (Fagherazzi et al., 2012; Wiberg et al., 2020). These locations, often termed intermediate-field locations due to their proximity to extensive areas of land-based ice, have been undergoing vertical land movement due to glacio-isostatic adjustment (Murray-Wallace and Woodroffe, 2014; Khan et al., 2015). This adjustment has contributed to ongoing RSLR throughout the Holocene, despite relatively stable eustatic sea levels over the past ∼7,000 years. Holocene sea level records at intermediate-field locations contrast far-field locations, predominantly in the southern hemisphere, where sea level records generally exhibit a mid-Holocene highstand (the timing and magnitude is spatially variable) before falling to present levels over the past few millennia. Rogers et al. (2019) proposed that movement of the tidal frame relative to land surfaces at intermediate-field locations over the past few millennia promotes preservation of organic matter and creation of new accommodation space. Conversely, sea-level stability, or a fall following a highstand, promotes decomposition of organic matter and accommodation space becomes increasingly limited (Rogers et al., 2019). This hypothesis was confirmed in global-scale analyses of carbon content within saltmarsh sediments, which found carbon content is generally lower at far-field locations than intermediate-field locations, and carbon is generally concentrated near the active rooting zone of saltmarsh vegetation at far field locations. The predominance of models derived from intermediate-field empirical data may be problematic when applied to the southern hemisphere as they commonly presume substrates are relatively homogenous with little variation in stratigraphy, or that elevations gain corresponds to RSLR. Empirical data from a range of settings, particularly in the southern hemisphere where there are considerable data gaps, are needed to fully elucidate controls on coastal wetland evolution under SLR.
This paper seeks to address some of these data gaps by analyzing a 20-year observational record of surface elevation change, vertical accretion and by deduction, autocompaction of wetland surfaces from a tidal embayment in southern Australia. Westernport Bay, located east of Melbourne, has a complex intertidal vegetation composition that includes zones dominated by mangroves, saltbush, herbaceous saltmarsh and rushes. Differentiation of processes contributing to autocompaction, namely addition/decomposition of organic matter, compression of organic matter and consolidation of mineral sediments was facilitated by analyses of substrate composition. The overall aim of this study was to conceptualize processes contributing to surface elevation adjustment with SLR. The specific objectives were to:
i) identify processes influencing surface morphodynamics that account for variation in substrate characteristics, autocompaction and vertical accretion;
ii) validate existing modeling approaches by applying functions of varying structure (i.e., linear, exponential, peak models) to develop relationships between vertical accretion, surface elevation change, autocompaction, and indicators of tidal position (i.e., elevation and inundation frequency); and
iii) verify whether surface elevation change is in equilibrium with the shifting tidal frame.
Materials and Methods
Study Site and Design
Westernport Bay (38°21′S, 145°13′E) is a large coastal embayment (∼680 km2). It drains a catchment area of 3,433 km2 and is located east of Melbourne Victoria, Australia (Figure 1). The region is relatively tectonically and isostatically stable and vertical land movement of tide gauges is negligible (White et al., 2014; Khan et al., 2015). Post-glacial sea level is reported to have increased to a highstand of 1–1.5 m above present levels approximately 6,900 cal. yr BP before falling to present levels after 2,000 cal. yr BP (Lewis et al., 2013; Dougherty et al., 2019). The region is also prone to periodic drought associated with negative phases of the Southern Oscillation, and an increase in the frequency of positive phases of the Southern Annular Mode and the Indian Ocean Dipole (Dey et al., 2019). The influence of drought on rainfall has been associated with changes in substrate elevations of coastal wetlands around Westernport Bay (Rogers et al., 2005b).
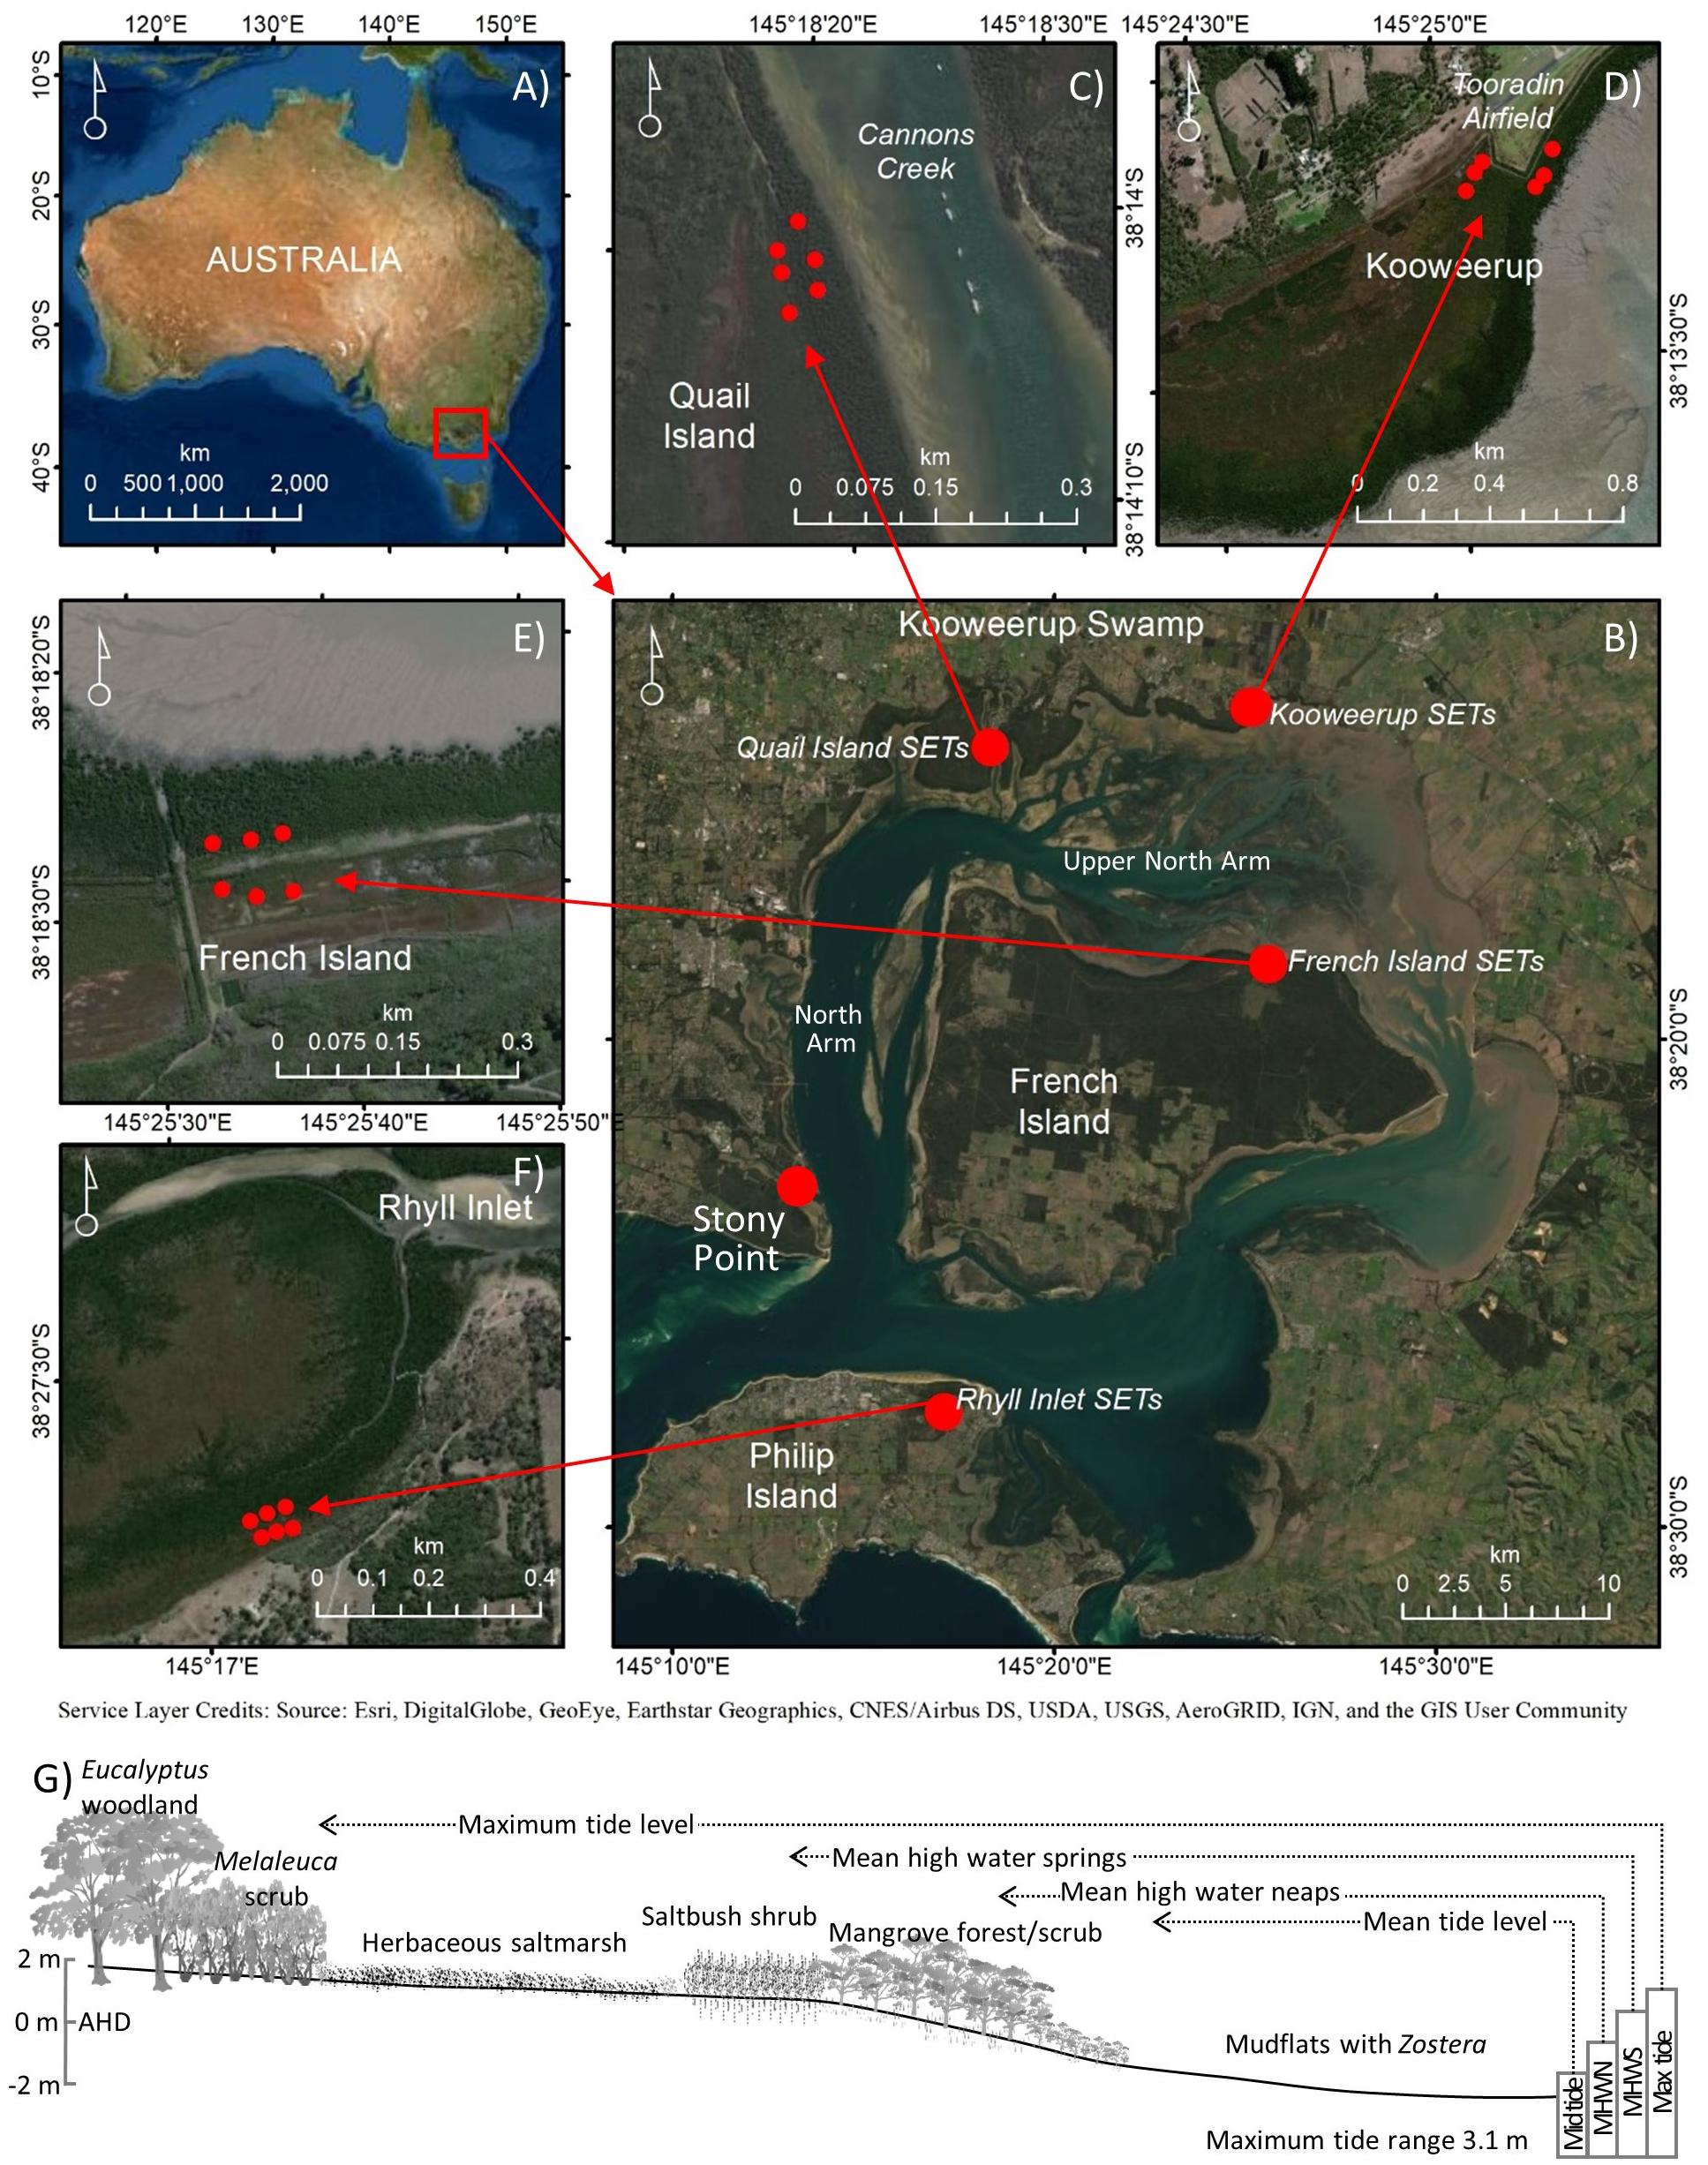
Figure 1. Location of (A) Westernport Bay, Australia, and the (B) focal sites in this study at (C) Quail Island, (D) Kooweerup, (E) French Island, (F) Rhyll, and (G) distribution of vegetation communities with respect to the tidal frame [adapted from Bird (1986)].
Westernport Bay has two entrances to Bass Strait; the constriction of the eastern entrance near San Remo causes tides to propagate relatively freely through the Western entrance, clockwise around French Island until they converge with anticlockwise tidal movement. The tidal regime is semi diurnal with a tidal range of up to 3.1 m. Significant tidal amplification occurs along the upper North Arm of Westernport Bay (Water Technology, 2014). Despite its size, the embayment is relatively shallow and tides comprise approximately 30% of the total volume at high tide (Lee in Boon et al., 2011). Westernport Bay includes extensive intertidal flats (∼270 km2) that supports mangrove and saltmarsh communities along its low energy intertidal shorelines, estimated to cover approximately 12.3 and 10.9 km2, respectively (Boon et al., 2011). These wetlands comprise a lower elevation mangrove zone that supports the cold tolerant mangrove, Avicennia marina, which is near its most latitudinal limit at this location. The upper intertidal zone also supports a dense thicket of saltmarsh shrubs of the genus Tecticornia and a landward zone of herbs, grasses and sedges that are regarded to be highly diverse (Boon et al., 2011).
Rogers et al. (2005b) presented results from a network of surface elevation tables (SET) and marker horizons (MH) established in 2000. These SETs were established to provide quantitative information on the dynamics of mangrove and saltmarsh vegetation and changes in rates of sedimentation and surface elevation. This network comprised 24 SET-MH stations in a nested design whereby six SETs were co-located at French Island, Kooweerup, Quail Island, and Rhyll (Figure 1). At each location, SETs were positioned in groups of three within structurally similar vegetation; three were located in the mangrove zone, lower in the tidal frame, and three were located in herbaceous saltmarsh zones higher in the tidal frame. Some saltmarsh SET locations have become increasingly dominated by Tecticornia over the 20 year analysis period, particularly at Kooweerup (pers. obs.). This paper provides an updated analysis from this network.
Inundation Frequencies and Water Levels
Analyses of variation in water levels associated with tidal inundation at co-located mangrove and saltmarsh SETs at each study site were undertaken using hobo water level loggers. The vertical and horizontal position of each SET and hobo water level logger was determined using RTK-GPS during field campaigns. All vertical positions are henceforth reported according to the Australian height datum (AHD). The frequency of inundation was determined for each logger on the basis of whether the logger was inundated for each 15 min logging increment over the logging period; logging periods exceeded 6 months at each study site and included highest high spring tides. The nearest tide gauge is managed by the local port authority and is located at Stony Point (Station no. 586268). This gauge underwent repositioning in 2017, and to control for inaccuracies that may arise from moving the tide gauge, processed data was only used for the period of August 1981 to July 2017. Processed data was converted to AHD. Maximum daily water level from each logger (logged at 15-min intervals) and the Stony Point tide gauge (logged at 6-min intervals) was compared to identify tidal modification at study sites. The maximum, minimum and mean recorded water level recorded at the tide gauge at Stony Point over the period of water-level logging was also determined. This facilitated the development of a relationship between elevation and inundation frequency. To do so, the elevations above the maximum water level were presumed to be rarely inundated; elevations below the minimum water level were presumed to be inundated 100% of the time, whilst the mean water level was presumed to represent the elevation with an inundation frequency of 50%. Inundation frequencies were plotted against elevation and the best model was used to determine a relationship between elevation and inundation frequencies. This model was used to determine inundation frequency of each SET-MH monitoring station and core locations.
Processed minimum, mean and maximum monthly water-level data for the Stony Point tide gauge was also accessed for the full record length. Conversion of this data to be relative to AHD meant the position of SETs and the tidal frame were determined using the same datum. This processed tide gauge data underwent additional processing to remove any months where data gaps were greater than 10% of the gauging frequency each month. Linear regressions were used to identify the rate of change in minimum, mean, and maximum monthly water levels for the full record length. As intertidal vegetation is typically positioned above mean sea level, mean and maximum linear regressions were subsequently used to indicate change in intertidal vegetation tidal position.
Sediment Characterization
Sediment cores of approximately 1.5 m length were collected in 2017. Cores were collected adjacent to mangrove and saltmarsh SET monitoring stations at each study site. Cores were extracted in aluminum tube of 75 mm diameter. The degree of sediment compaction that occurred during core collection was determined and cores were capped to ensure they remained continuous and intact. Cores were placed in cold storage at 4°C until sample preparation was undertaken. The position of each core at the time of extraction was determined using an RTK-GPS. Sediment cores were split longitudinally and half of the core was subsampled at intervals of 2 cm for the upper 10 cm of sediment, every 5 cm to 1 m depth and every 10 cm below 1 m depth for further analysis. The remaining core was placed in storage. Grain size of each sample was determined (μm) using a Malvern Mastersizer 2000 laser diffractometer. To determine dry bulk density (g cm–3), samples were oven dried to constant weight at 60°C. Dry sample weight was determined and bulk density (BD) was estimated as the ratio of dry sample mass to wet sample volume. Each sample was then homogenized by grinding to a fine powder using a Retsch three-dimensional vibrator mill (Type-MM-2: Haan, Germany). Samples were analyzed for percentage carbon (%C) using dry combustion techniques by the Environmental Analysis Laboratory at Southern Cross University.
Sediment profiles were developed that characterized grainsize, bulk density and carbon content for each core. Core depths were calibrated to AHD to facilitate comparisons on the basis of elevation. Depth constrained cluster analysis was undertaken for grainsize fraction, bulk density and carbon content in R using the Rioja package. The depth of clusters, with respect to AHD were used to identify consistent patterns between study sites. Total carbon content in the upper 30 cm was quantified to indicate near surface carbon content of each core. Total carbon content was also quantified for sediments positioned between 0 m AHD (approximating MSL) and the wetland surface to represent carbon storage across the vertical distribution of intertidal vegetation. ANOVAs were undertaken on both estimates of carbon in the upper 30 cm and above MSL to identify statistical differences between cores extracted from mangrove and saltmarsh. C content above MSL was standardized for the volume of sediment above MSL; this characterized the C content per meter of substrate (i.e., g cm–2 m–1). Linear regression analyses were undertaken to establish relationships between C content either in the upper 30 cm, C content above MSL (i.e., above 0 m AHD), standardized C content, and elevation and inundation frequency.
Surface Elevation Morphodynamics
SET-MH techniques were used to characterize surface elevation morphodynamics and SETs were established in Westernport Bay in 2000 (Rogers et al., 2005b). The SET acts as a stable benchmark against which measurements in substrate elevation change can be determined (Cahoon et al., 2002). Each SET monitoring station includes a platform that protects substrates from compression and compaction during installation and whilst taking measurements. At each SET monitoring station, a vertical benchmark pole was inserted to the point of refusal and extends to substrate depths of up to 6 m. The original SET design was used in this study and is composed of a horizontal arm that is positioned on the vertical benchmark pole; this horizontal arm is positioned in the same location using a spirit level. A plate at the end of the horizontal arm accommodates pins that are lowered to the wetland surface, and the height of each pin above the horizontal plate is measured. At each SET monitoring station, measurements of nine pins are taken in four arm directions; this generated 36 measurements of substrate elevation at each monitoring station. Repeated measurements of the height of pins above the horizontal plate were taken in four arm directions at each station. This provided time-series data of relative surface elevation change for each pin. This large dataset was subsequently reduced to determine the mean relative surface elevation change for each SET monitoring station at each measurement time. Measurements of SET elevation using an RTK-GPS allowed measurements of surface elevation change to be calibrated to AHD and for distances to the wetland edge and main channel at Rhyll to be calculated. Due to the multi-decadal period of measurements, some benchmark poles had undergone corrosion or were damaged by debris. In some cases, damage became substantial enough that the benchmark was no longer regarded to be stable. This was evident for one mangrove SET at Quail Island and one saltmarsh SET at Kooweerup. Deficits in funding limited the capacity to undertake annual measurements. Measurements were taken initially in October 2000 and repeated measurements were taken in November 2001, November 2003, December 2009, May 2015, April 2016, May 2017, December 2018, and November 2019.
Feldspar marker horizons were established in three replicate plots of 50 cm × 50 cm at the margins of each SET monitoring station platform when baseline measurements were undertaken in 2000. When subsequent SET measurements were taken, mini cores were extracted from each MH plot and the vertical increase in sediment that had accumulated above the MH was determined. This provided time-series data of vertical accretion at each plot; this data was subsequently reduced to indicate vertical accretion at each monitoring station over time. The MH is prone to loss due to dispersal associated with bioturbation and tides (Cahoon and Turner, 1989). Over the study period, the ability to detect MH diminished and results were reported only when the MH could be detected; this was particularly apparent for mangrove MH.
Statistical Analyses of Surface Elevation Morphodynamics
Linear regression analyses of surface elevation change and vertical accretion were undertaken to determine mean rates of surface elevation change and vertical accretion for each SET-MH monitoring station. Analyses of coefficient of determination (r2) and rates of change were undertaken to determine confidence in linear regression analyses of rates of vertical accretion and surface elevation change. Results of surface elevation change at one SET monitoring station in the mangrove at Quail Island was excluded from subsequent analyses due to damage.
Subsequent analyses were undertaken to identify processes influencing rates of surface elevation change (i.e., ΔSmin + ΔSorg−△P). Linear regression analyses were undertaken to determine the relationship between rates of surface elevation gain, vertical accretion and available accommodation space; the elevation of SET-MH monitoring stations and modeled inundation frequency was used to indicate accommodation space. These relationships were assessed on the basis of coefficient of determination and Akaike information criterion with correction for small sample sizes (AICc). An exponential model that relates accretion to elevation, and distances to sediment sources (i.e., wetland edge and main channel) was also applied to measurements of vertical accretion using elevation and also substituting inundation for elevation (Temmerman et al., 2003). This model describes sedimentation rates on the basis of depth below mean high tide (H), distance to nearest creek edge (Dc), and marsh edge (De), and parameters (k, l, m, n), and has the form indicated in equation 2. Parameters were solved on the basis of 1,000 iterations until convergence was achieved at a significance level of 0.05.
For measurements of surface elevation change, we also investigated whether peaks associated with organic matter production were evident in rates of surface elevation change. As surface elevation change describes the combined influence of surface accretion and processes operating within the substrate, it was not appropriate to fit a second order polynomial, as per Morris et al. (2002). Rather, best-fit Gaussian and Lorentzian peak models were applied to the relationship between surface elevation change, and elevation and inundation; care was taken to recognize zonation by generating a peak for mangrove and saltmarsh surface elevation change.
A two-way paired t-test was undertaken to determine whether rates of surface elevation change differed from rates of vertical accretion at each SET-MH monitoring station. The deficit between rates of vertical accretion (i.e., ΔSmin) and surface elevation change, which incorporates the combined influence of sediment consolidation, organic matter addition/decomposition and compression (i.e., ΔSorg−△P) was determined; for simplicity this was termed autocompaction. Autocompaction error was determined by propagating errors in rates of surface elevation change and vertical accretion. Linear regression analyses were undertaken to establish relationships between rates of surface elevation change, vertical accretion, autocompaction and substrate organic matter, using carbon storage above MSL to indicate volume of organic matter. A mixed model linear regression analysis was undertaken to determine the relationship between surface elevation change, vertical accretion and substrate carbon storage above MSL, with the hypothesis confirmed on the basis of coefficient of determination and p-value.
Equilibrium Analysis: Changing Tidal Position
Maintenance of tidal position (i.e., ΔE = 0) indicates that the wetland substrate is adjusting in equilibrium with increasing accommodation space created by RSLR and autocompaction (i.e., ΔSmin + ΔSorg−−ΔP−−ΔM). Analyses of maximum, mean and minimum monthly water levels confirmed that rates of change to boundaries defining intertidal vegetation accommodation space were not consistent; that is, the rate of rise of mean water level was higher than the rate of rise of maximum water level between 1981 and 2017 (see Figure 2F). A more sophisticated approach for measuring changes to the tidal frame was required prior to assessing changes to tidal position. Changes to the tidal frame relevant to intertidal vegetation (i.e., from mean water level to maximum water level) was defined at each time step. The relative increase in substrate elevation was then defined as the difference between the substrate surface elevation and mean water level at each time step. By deduction, change in tidal position (i.e., ΔE ) was determined as the difference between the rate of change in the tidal frame and relative substrate elevation at each time step. All measurements were made relative to AHD. Accordingly, values near zero were presumed to indicate maintenance of tidal positions, positive values indicate an increase in tidal position and negative values indicate decreasing tidal position. To account for any errors in SET measurements and subsequent analyses, a buffer of ±2 mm y–1 was applied to all values, particularly when determining values near zero Values exceeding 2 mm y–1 were regarded to be increasing their position in the tidal frame and values lower than −2 mm y–1 were regarded to be decreasing their position in the tidal frame.
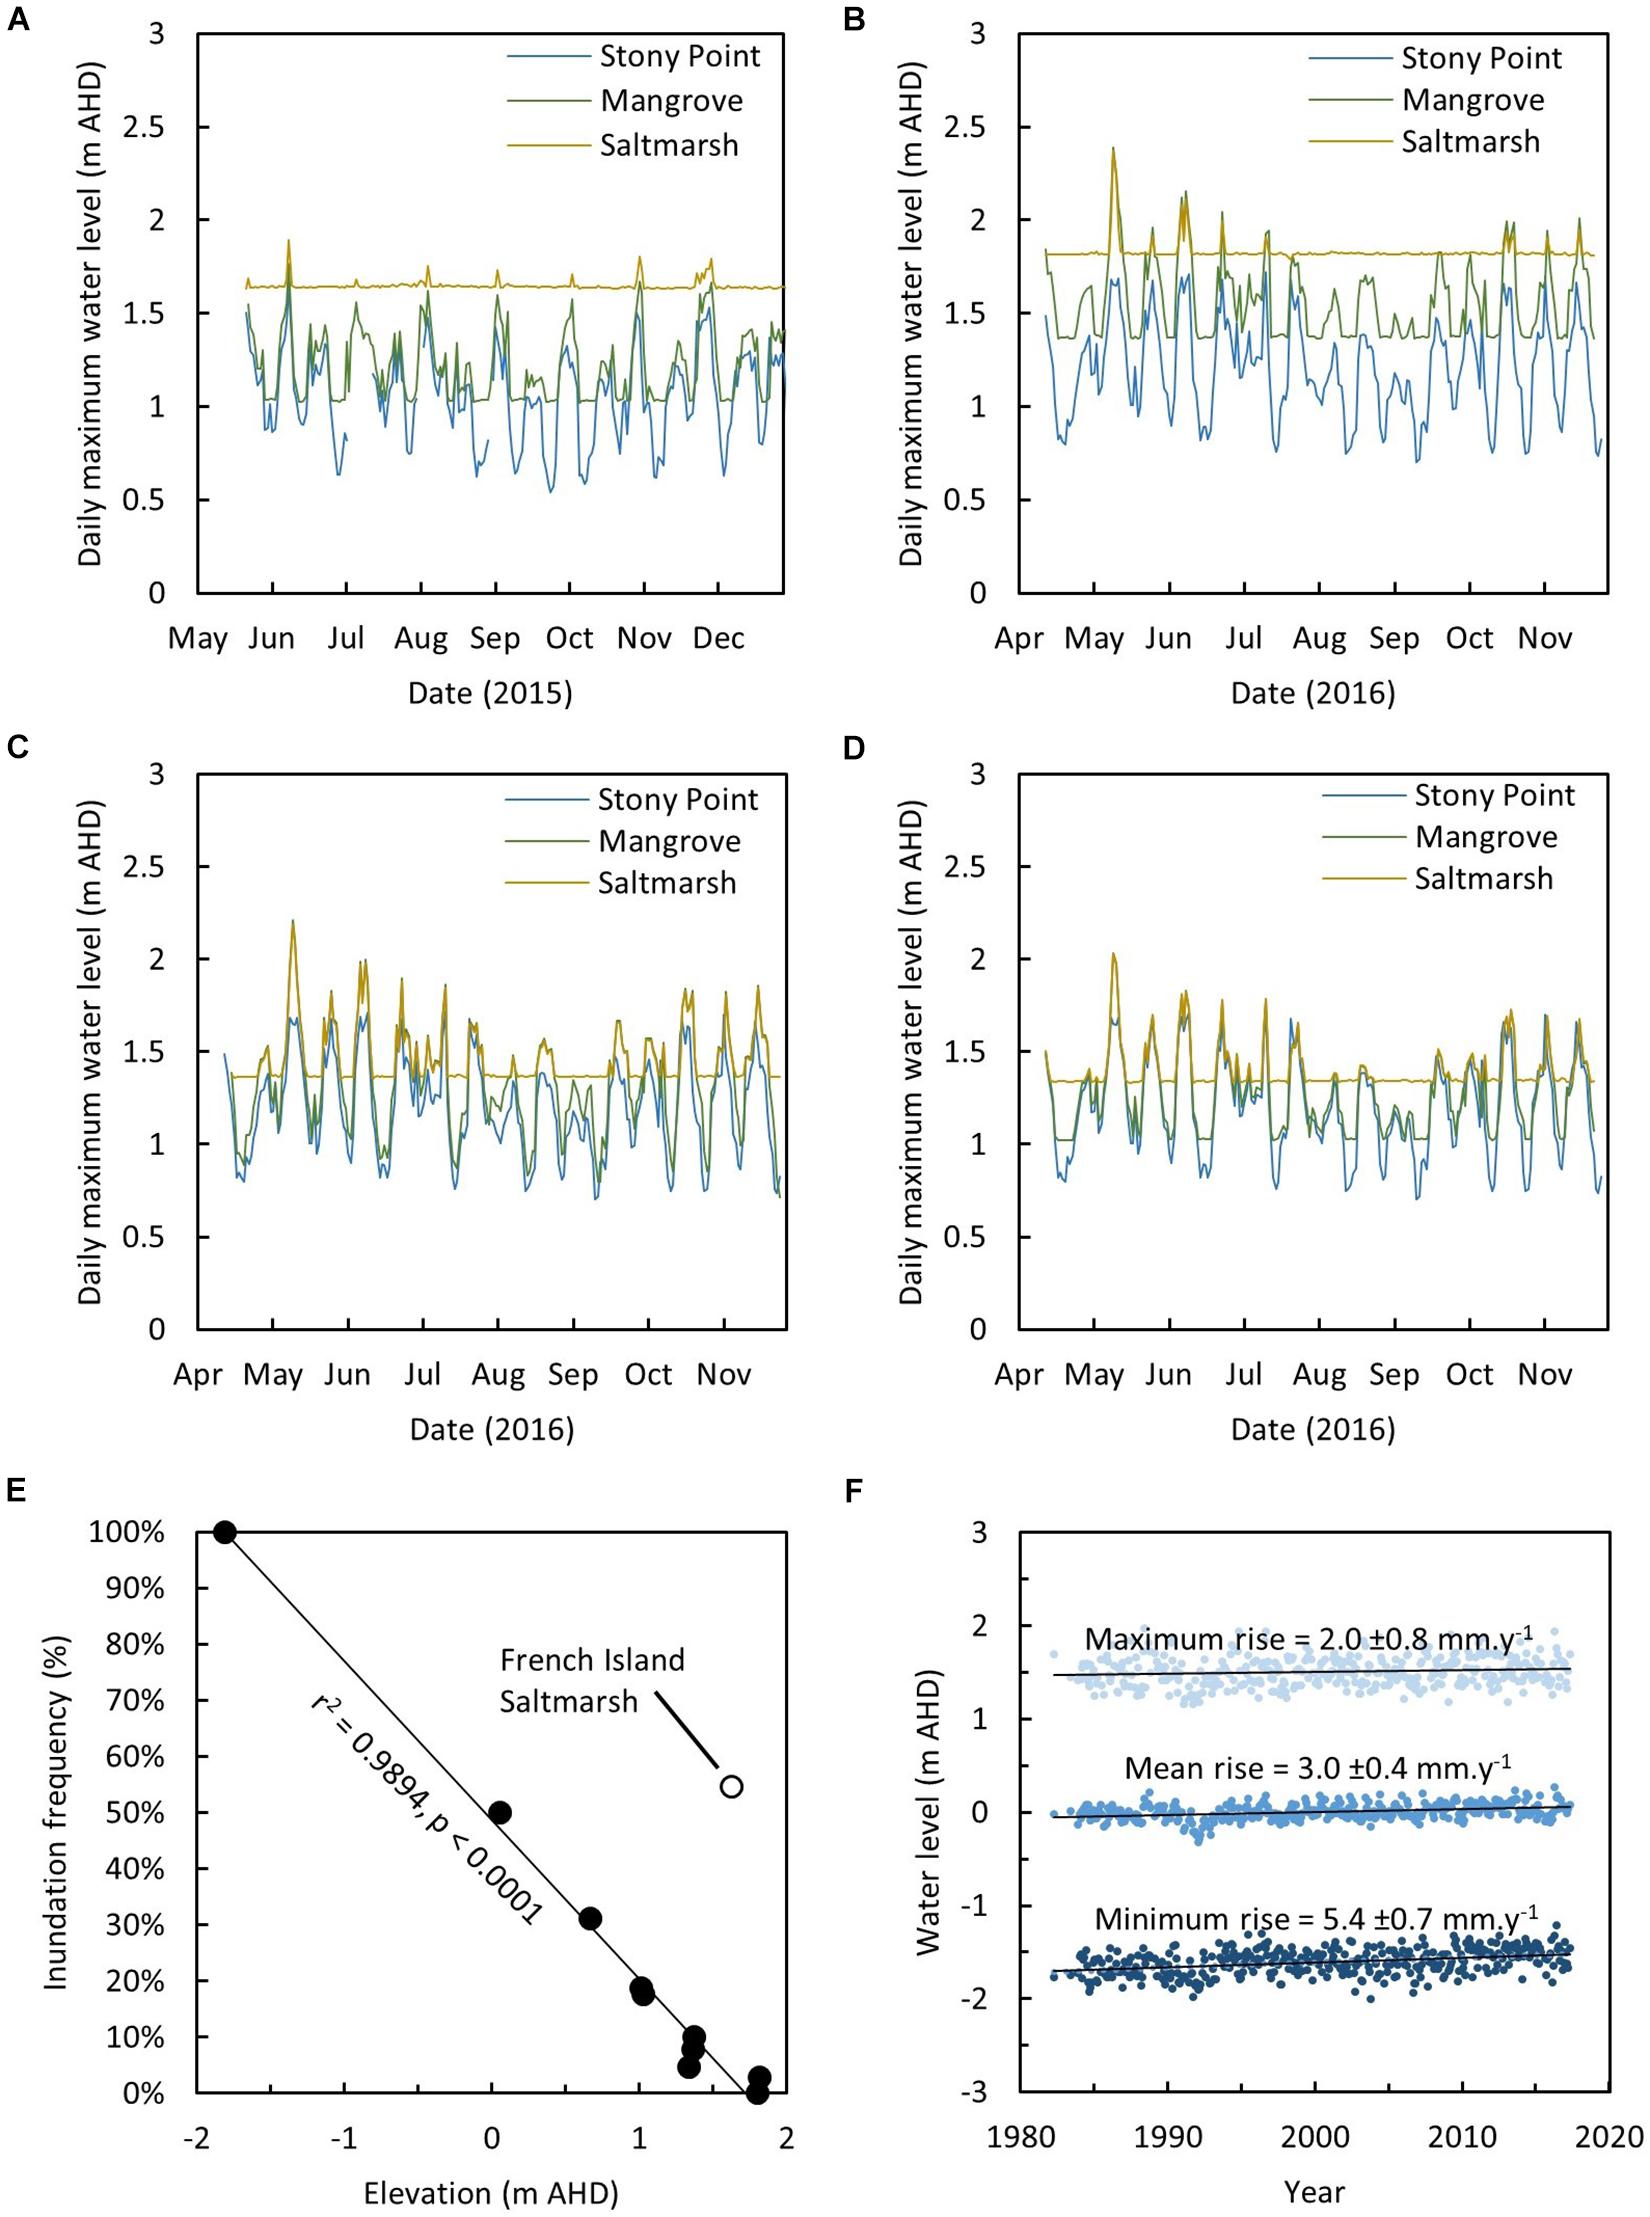
Figure 2. Daily maximum water levels recorded in the mangrove and saltmarsh at (A) French Island, (B) Kooweerup, (C) Quail Island, and (D) Rhyll, (E) relationship between inundation frequency and elevation (m AHD) and (F) increase in maximum, mean, and minimum monthly water levels at the Stony Point tide gauge.
Variation in tidal position (i.e., ΔE ) should be interpreted in the context of available accommodation space or substrate elevation, particularly as mineral vertical accretion and organic matter accumulation (i.e., ΔSmin + ΔSorg) are likely to vary on the basis of accommodation space. Hence, rates of change in tidal position were compared to substrate elevation at the time of last SET measurement. This also provided the capacity to determine the elevation at which substrate elevation gain corresponded to the rate of increase in accommodation space, or the equilibrium elevation. The mean elevation of all values where tidal position was maintained (i.e., ΔE = 0 ± 2 mm y–1) were used to approximate the equilibrium elevation range across Westernport Bay.
The longer-term resilience of locations where tidal positions were diminishing were estimated by projecting observed surface elevation change, mean water level and maximum water level trajectories. Resilience was presumed to be exhausted when substrate elevations were less than mean water level, as this elevation delimits the lower boundary of mangrove vegetation and inundation frequencies at lower elevations are presumed to be beyond the physiological tolerance of mangroves. This analysis does not incorporate anticipated projections in SLR or loss of tidal position due to erosion rates beyond that already incorporated in rates of surface elevation change.
Results
Inundation Frequencies and Increasing Water Levels
Inundation frequency was variable between study site logging locations, but was generally higher in the mangrove where substrate elevations are lower than in the saltmarsh (Supplementary Figure 1). The saltmarsh SETs at French Island were the only exception where inundation frequency was estimated at approximately 55%. This high inundation frequency was attributed to ponding of water within areas that were previously used as a salt works and that has since been abandoned. The maximum tidal height at Stony Point was less than the maximum inundation height recorded at each study site (Figures 2A–D), and the timing of maximum water level at all study sites coincided with the tidal peak recorded at Stony Point. The deviation between tidal height at study sites and the Stony Point tide gauge increased as the tidal height increased, indicating significant amplification of tides as they propagate around French Island and along the Upper North Arm. This was most prominent in the mangrove at Kooweerup where tides on 10 May 2016 were amplified to an elevation of 2.388 m AHD and was markedly greater than the maximum tide gauge height of 1.652 m AHD on the same day. The observed pattern of amplification of tides was consistent with analyses of spatial variation in the mean high water springs tidal plane throughout Westernport Bay (Water Technology, 2014).
Inundation frequency was anomalously high in the saltmarsh at French Island, whilst tidal peaks were attenuated. Analyses focused on areas where salt ponds had been abandoned, and earthworks associated with salt generation remain evident in aerial photography, and likely influence both drainage of the saltmarsh and tidal incursion into the saltmarsh. A linear relationship was established between surface elevation and inundation frequency when inundation patterns in the saltmarsh at French Island were excluded (r2 = 0.9894, AICc = −31.8384, p < 0.0001, Figure 2E). The relationship remains significant when the saltmarsh at French Island was included in the analysis (r2 = 0.7358, AICc = −1.2417, p < 0.0001).
Mean water level at Stony Point tide gauge increased at a rate of 3.0 ± 0.4 mm y–1 over the ∼40 years of tide gauge records and increased at a higher rate than the monthly maximum water level (2.0 ± 0.8 mm y–1). This implies a decrease in the vertical space between mean water level and maximum water level over the tide gauge period (Figure 2F); crucially, this is the component of accommodation space occupied by intertidal vegetation. However, since 2000 when SET-MH were established, monthly maximum water level (3.5 ± 2.3 mm y–1) increased at approximately the same rate as monthly mean water level (3.5 ± 1.2 mm y–1).
Sediment Characterization
For most cores, sediments increasingly comprised sand fractions at lower elevations beyond approximately 0.8 m AHD (Supplementary Figures 2–5). The inverse pattern was evident in the saltmarsh core at Rhyll where the grainsize was finer at depths of 0.4–1.0 m AHD and then increased at depths below approximately 0.4 m AHD. Above 0.8 m AHD, sediments were typically finer grained, and sediments from the saltmarsh at Rhyll exhibited a tendency toward finer grain sizes with increasing elevation in the core. Bulk density reflected this pattern of increasing grain size as elevation decreased with sediments typically becoming less bulky toward the surface. Carbon content was generally higher in the topmost-cluster where grainsize was typically smaller, and diminished to negligible volumes at depths corresponding to mean sea level (i.e., approximately 0 m AHD). Anomalous carbon peaks were evident in some cores, and these sediment depths clustered separately.
Overall, C stock increased with elevation within the core, decreased with inundation frequency and was generally higher in the saltmarsh; however, the density of C was greater in the mangrove and increased with inundation frequency. No statistical difference was found in total C content in cores extracted from mangrove and saltmarsh for C in the upper 30 cm (p = 0.3528) where living root material dominates. There was also no statistical difference in C to MSL (p = 0.6001), and this is likely due to the greater sediment volume above mean sea level in the saltmarsh than the mangrove. As inundation frequency was disproportionately high despite the high elevation of the saltmarsh at French Island, subsequent analyses of relationships between C content and elevation and inundation excluded data from the saltmarsh at French Island. C content in the upper 30 cm (r2 = 0.1309, p = 0.3784) and above MSL (r2 = 0.1779, p = 0.2980) were positively related to elevation. Standardized C content was negatively related to elevation (r2 = 0.2870, p = 0.1703), confirming a greater concentration of C within mangrove dominated sediments (Figure 3A). The inverse pattern was evident for relationships with inundation frequency. C content in the upper 30 cm (r2 = 0.3476, p = 0.0005) and above MSL (r2 = 0.3791, p = 0.0003) was negatively related to inundation frequency. Standardized C content was positively correlated to inundation frequency (r2 = 0.0017, p = 0.0190), although the relationship was weak when French Island study sites were excluded (Figure 3B).
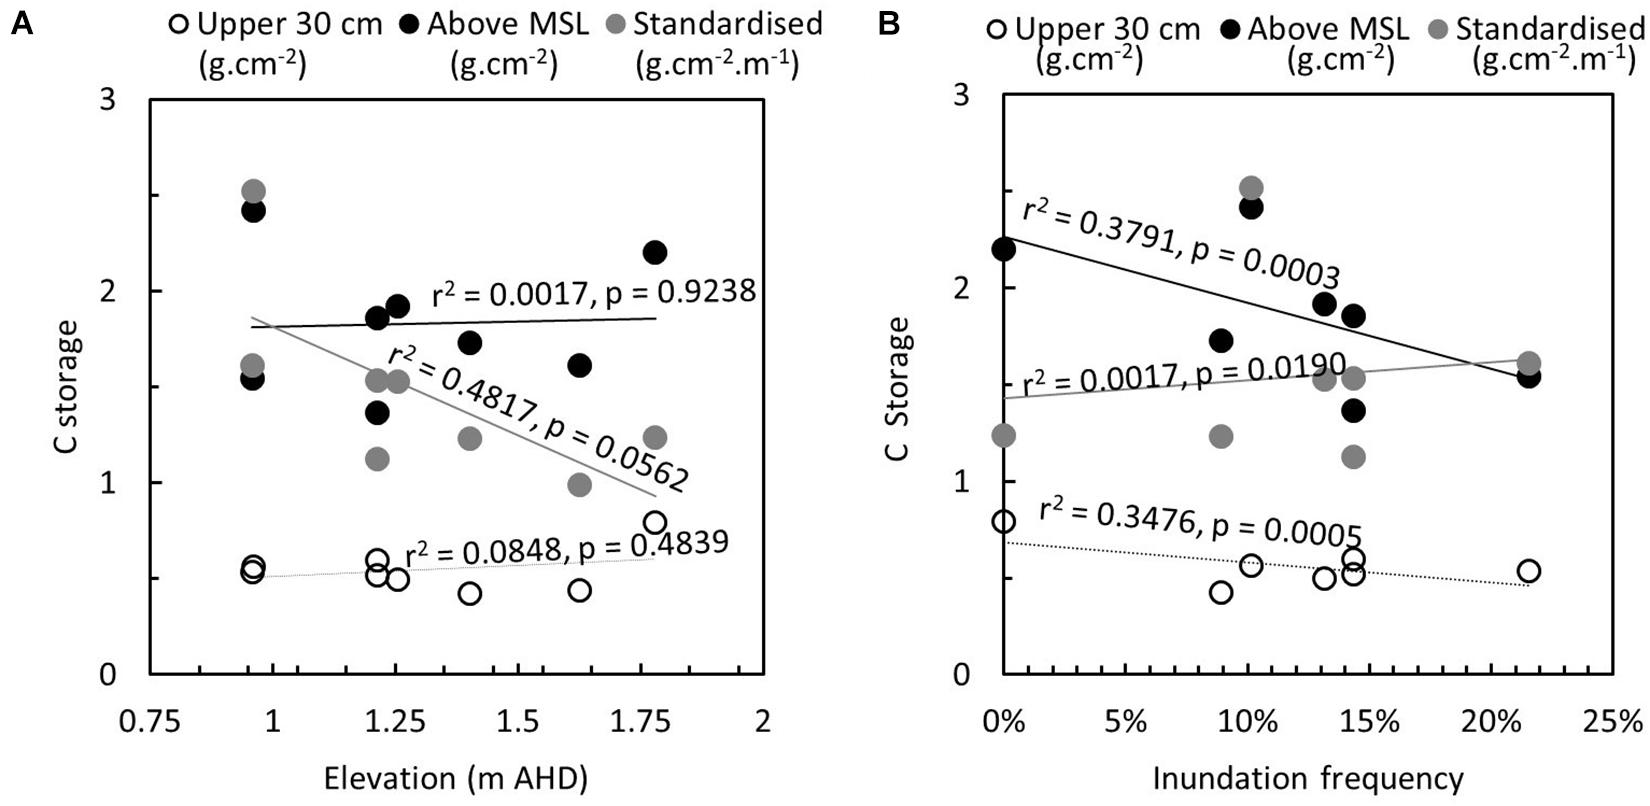
Figure 3. Relationship between carbon storage, estimated in the upper 30 cm (g cm–2), above mean sea level (estimated at 0 m AHD, g cm–2), and standardized over depth (g cm–2m–1) and (A) elevation of the core (m AHD) and (B) inundation frequency, estimated from model presented in Figure 2E.
Surface Elevation Morphodynamics
Vertical accretion trends were reasonably well-modeled using linear regression analyses over time, with analyses indicating that 96% of SETs had r2-values exceeding 0.5 (Supplementary Table 1); however there was considerable loss of feldspar marker horizons at mangrove SETs due to bioturbation. Similarly, surface elevation change was modeled with reasonable confidence using linear regression analyses and 75% of SETs exhibited r2 >0.5. Where the coefficient of determination was less than 0.5, surface elevation change was negligible (<1 mm y–1) (Supplementary Table 1 and Supplementary Figure 6). Based on patterns of vertical accretion or surface elevation over time (Supplementary Figures 7–10), low r2-values and insignificant p-values were regarded to be indicative of little vertical accretion or surface elevation change and were therefore included in subsequent analyses. Rates of change for the saltmarsh at French Island were excluded from analyses involving inundation as pooling of water within abandoned ponds was regarded to be unrepresentative of other saltmarsh locations in Westernport Bay.
Temporal variation in vertical accretion was particularly evident in the mangrove zone and this was likely related to bioturbation of MH and the shorter duration over which they were detectable. Irrespectively, vertical accretion was linearly related to elevation (Figure 4A, r2 = 0.2821, p = 0.0076) and inundation (Figure 4B, r2 = 0.2736, p = 0.0150). This relationship was improved with an exponential model (as per Temmerman et al., 2003) that accounted for distances to sediment sources for both elevation (Figure 4C, r2 = 0.3429, p = 0.0026) and inundation (Figure 4D, r2 = 0.3297, p = 0.0065). The strength of these relationships was not maintained in linear regression analyses relating rates of surface elevation change to elevation (Figure 5A, r2 = 0.0098, p = 0.6530) or inundation (Figure 5B, r2 = 0.0021, p = 0.5317). Lorentzian peak models provided the best fit when mangrove surface elevation change was related to elevation (r2 = 0.3022, AICc = 45.67) or inundation (r2 = 0.3022, AICc = 45.67), whilst Gaussian peak models provided the best fit when saltmarsh surface elevation change was related to elevation (r2 = 0.6070, AICc = 38.33) or inundation (r2 = 0.2414, AICc = 34.66). When both peak models were merged to provide a bimodal distribution the fit markedly improved upon linear models for elevation (Figure 5C, r2 = 0.4558, p = 0.0004) or inundation (Figure 5D, r2 = 0.3364, p = 0.0073).
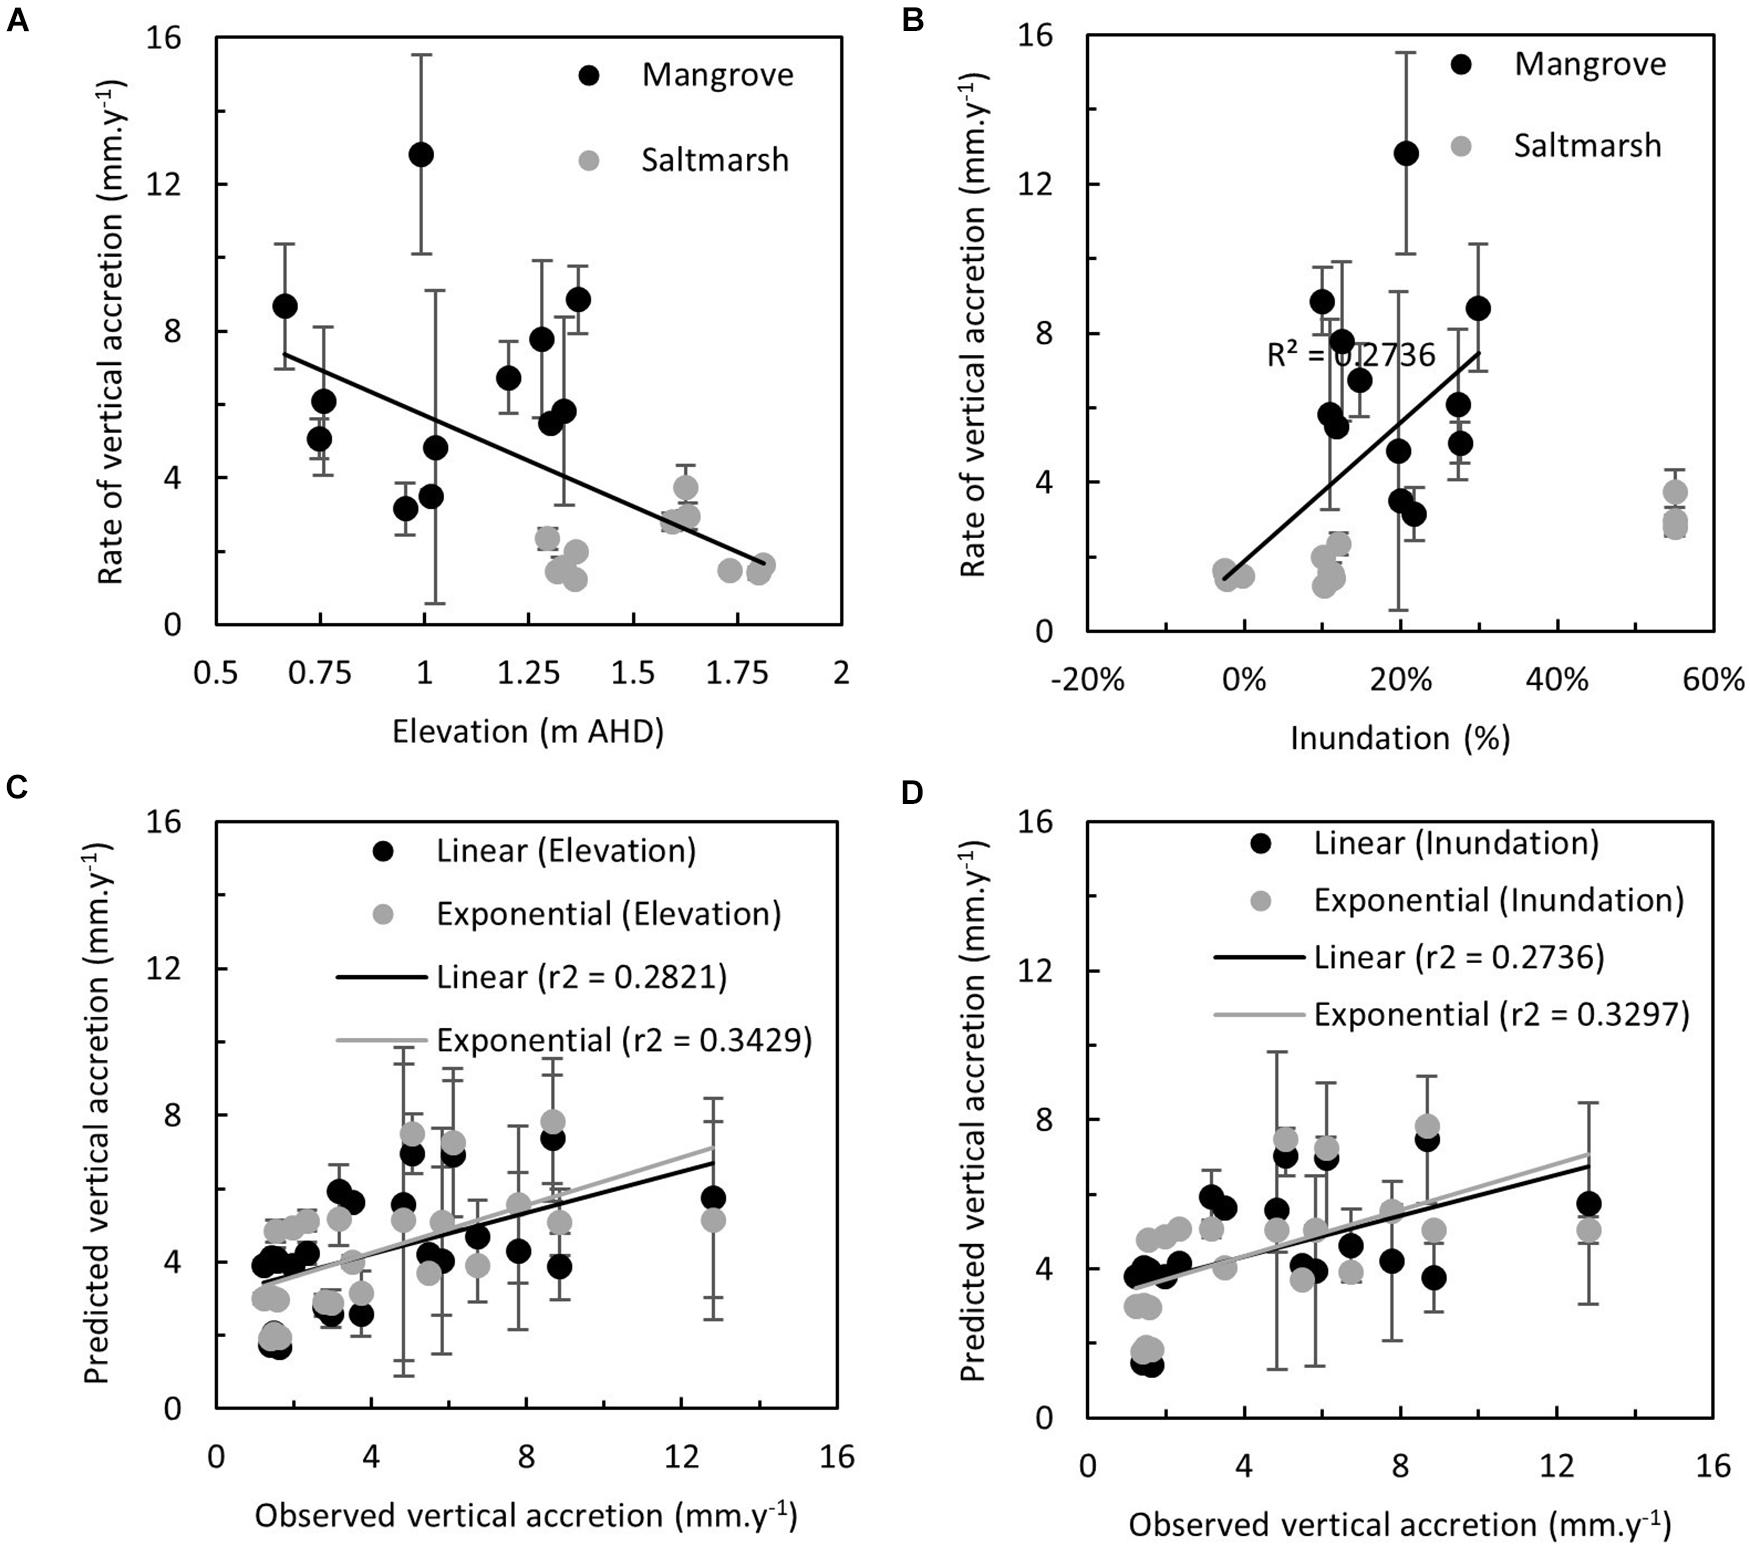
Figure 4. Relationship between the observed rate of vertical accretion in mangrove and saltmarsh at study sites and (A) elevation (m AHD), and (B) modeled inundation (percentage, derived from Figure 2E). Relationship between observed and predicted rate of vertical accretion (mm y–1) derived from linear and exponential models of rates of vertical accretion proportional to (C) elevation (m AHD) and (D) modeled inundation (%, derived from Figure 2E).
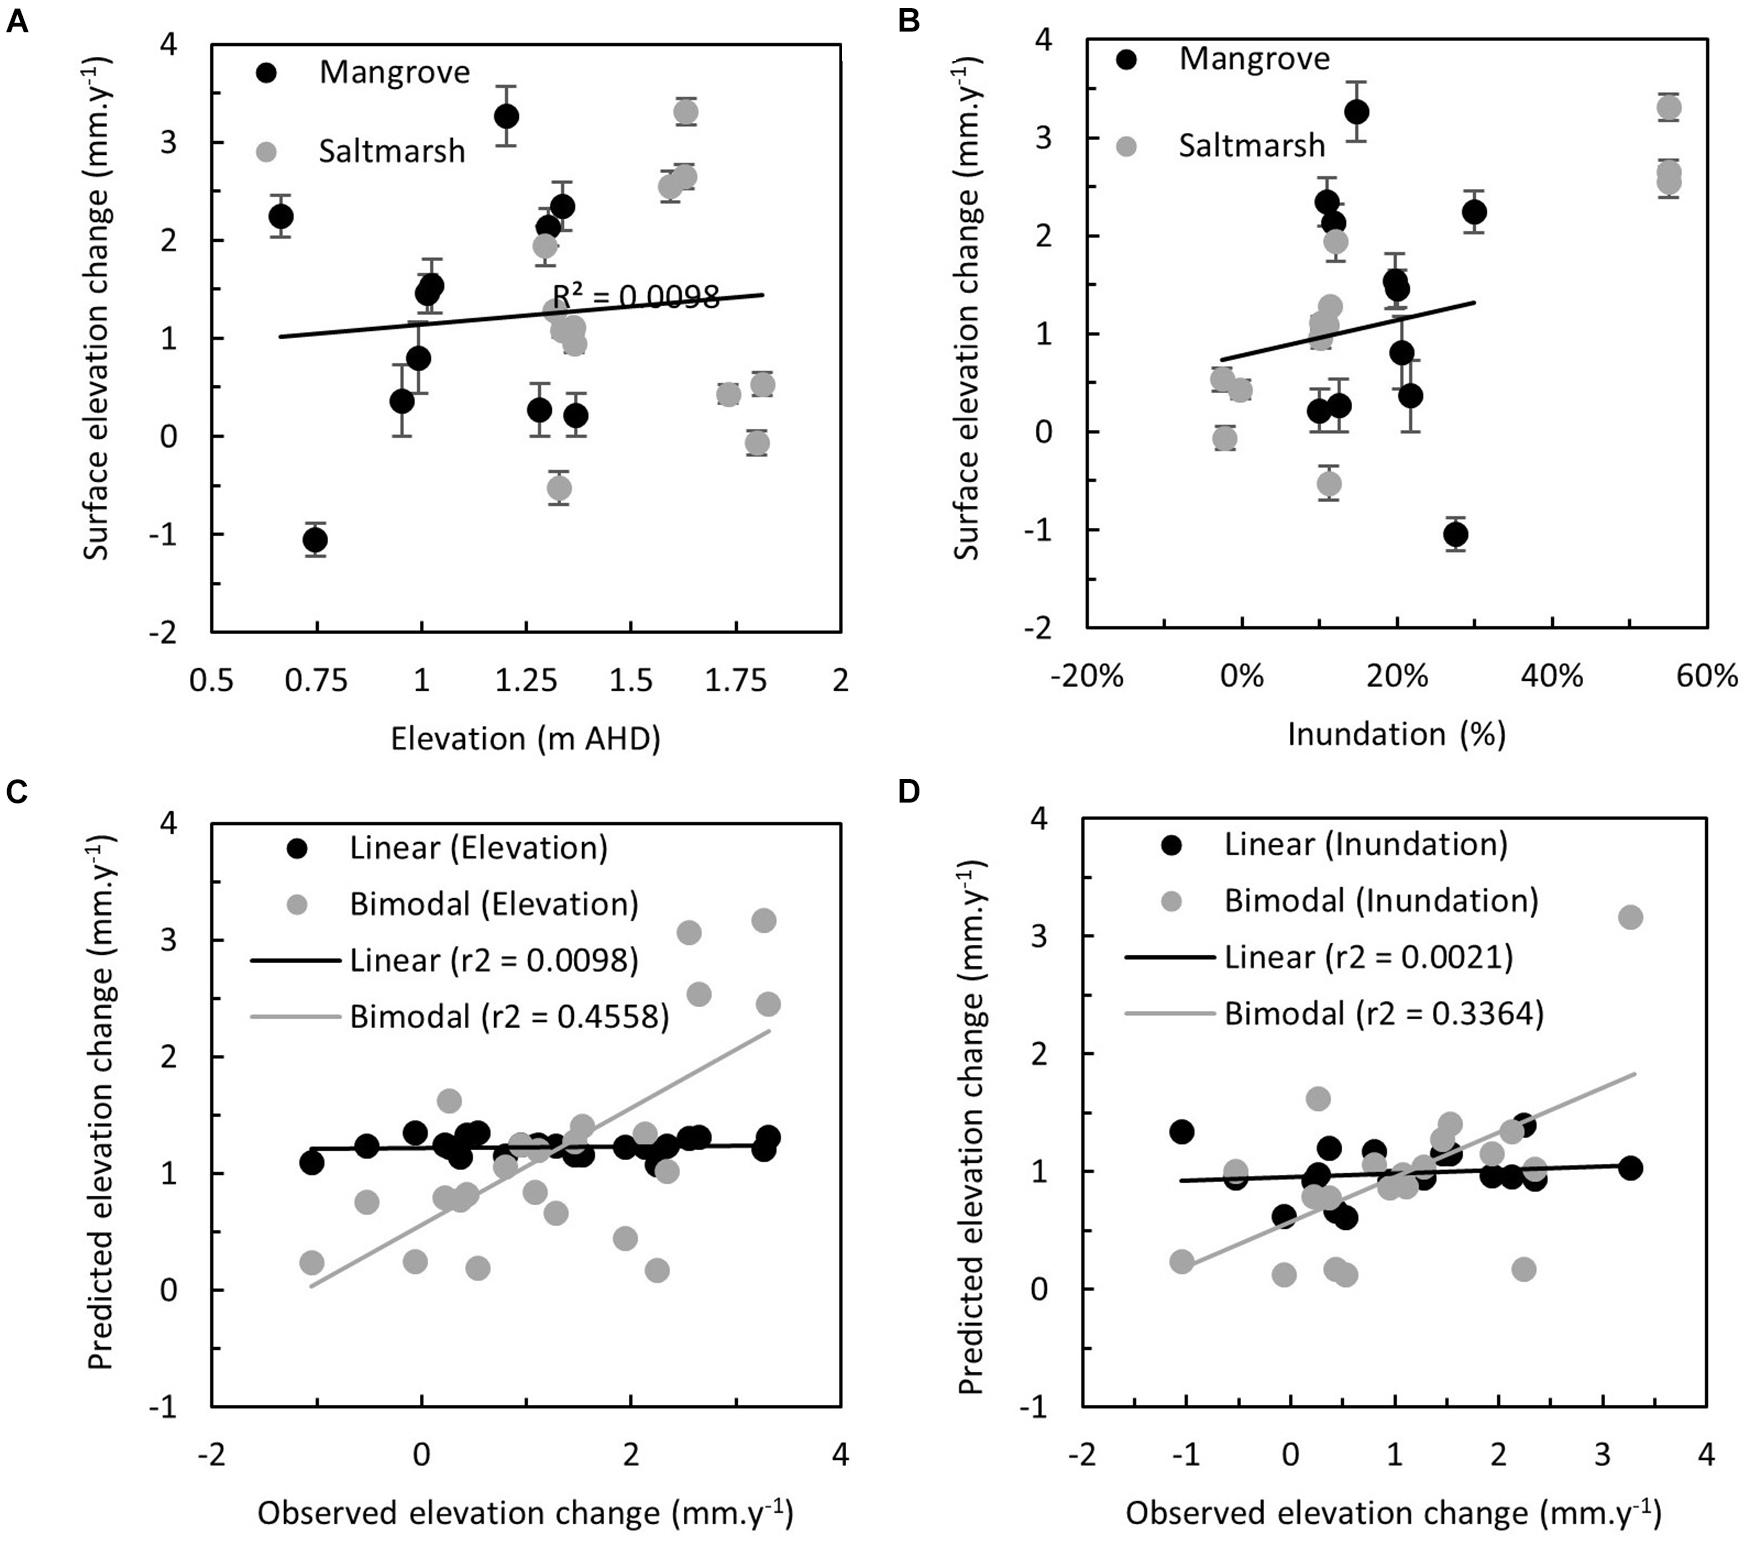
Figure 5. Relationship between the observed rate of surface elevation change (mm y–1) in mangrove and saltmarsh at study sites and (A) elevation (m AHD), and (B) modeled inundation (percentage, derived from Figure 2E). Relationship between observed and predicted rate of surface elevation change (mm y–1) derived from linear and exponential models of rates of vertical accretion proportional to (C) elevation (m AHD) and (D) modeled inundation (%, derived from Figure 2E).
Paired t-test confirmed rates of surface elevation change were statistically different to rates of vertical accretion (Figure 6A, r2 = 0.0076, p = 0.6927). Differences between vertical accretion and surface elevation change were attributed to autocompaction operating on both mineral and organic material. Vertical accretion was related autocompaction (Figure 6B, r2 = 0.8632, p < 0.0001). However, this did not translate to a similar correlation with surface elevation change (Figure 6C, r2 = 0.0802, p = 0.1905). Processes modulating the relationship between vertical accretion and accommodation space were influential, but were not related to accommodation space. Mixed model linear regression analysis, which excluded anomalous values at French Island saltmarsh, confirmed the contribution of vertical accretion and substrate organic matter (indicated by carbon storage above MSL) to surface elevation change (Figure 6D, r2 = 0.9343, p = 0.0280).
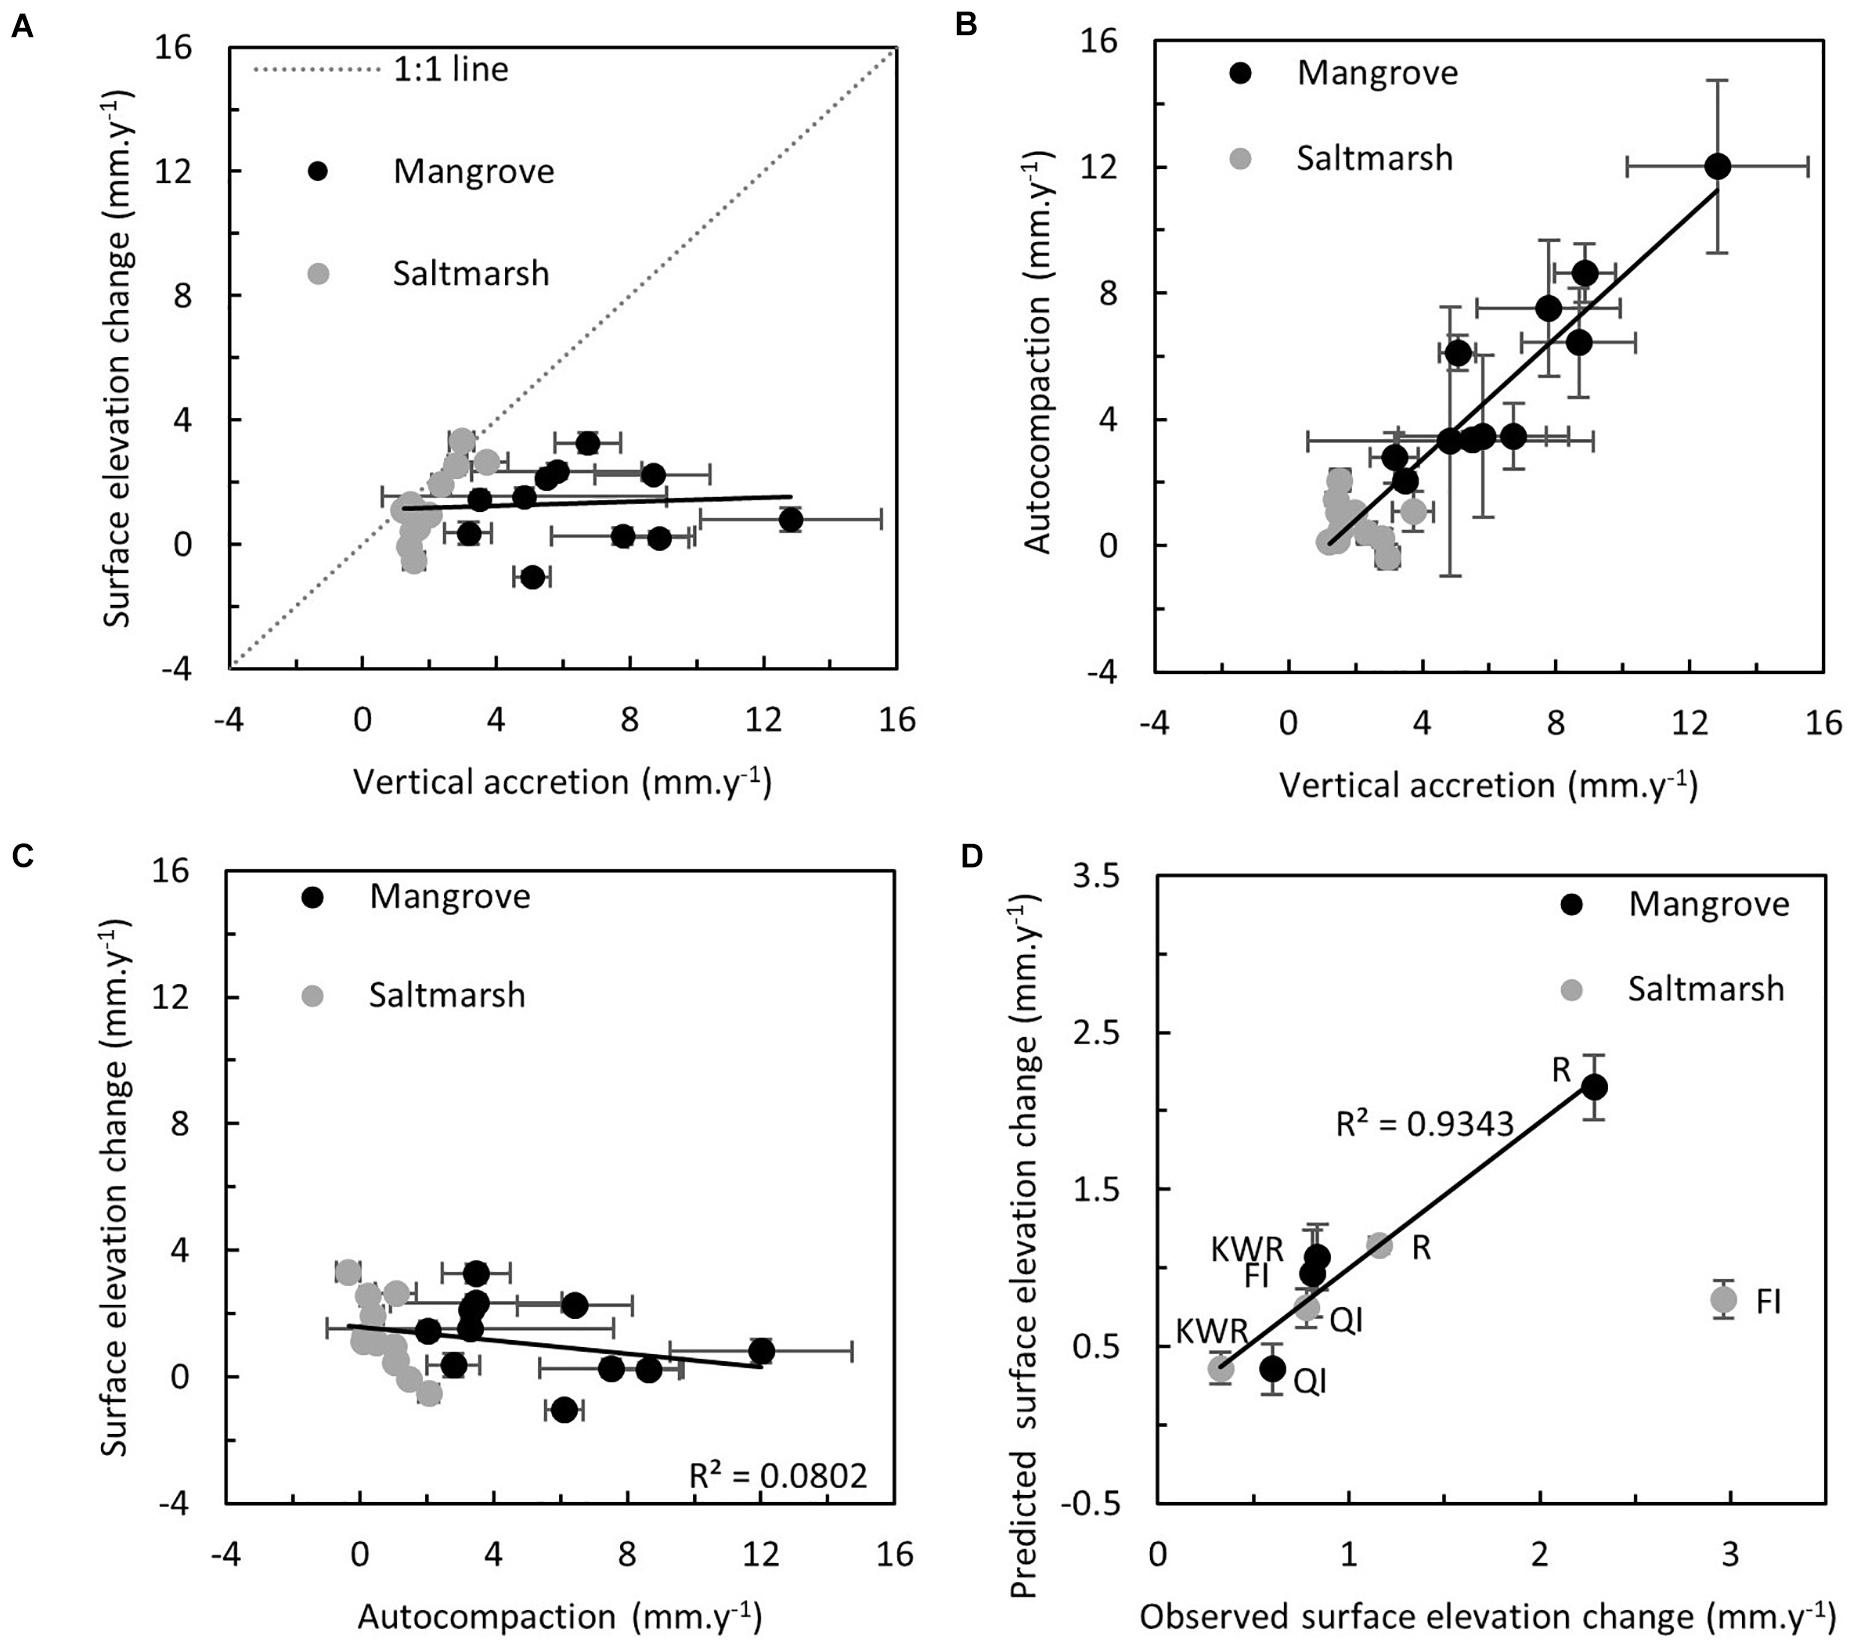
Figure 6. (A) Relationship between rate of surface elevation change (mm y–1) and rate of vertical accretion (mm y–1). (B) Relationship between rate of autocompaction (mm y–1) and rate of vertical accretion (mm y–1). (C) Relationship between rate of surface elevation change (mm y–1) and rate of autocompaction (mm y–1). (D) Relationship between observed and predicted rate of surface elevation change (mm y–1) derived from mixed linear regression model of rates of surface elevation change proportional to rates of vertical accretion (mm y–1) and carbon storage above MSL (g cm–2).
Equilibrium Analysis: Changing Tidal Position
Most SET locations exhibited a surface elevation gain that ensured that tidal position was maintained under observed rates of RSLR; few locations exhibited a marked decline in tidal position or an increase tidal position (Figure 7A). The equilibrium elevation at which changes to the tidal frame corresponded to an increase in substrate elevation was centered around 1.2 ± 0.3 m. This value is remarkably close to estimated mean high water springs tidal plane, reported to be at an elevation of 1.15 m (Water Technology, 2014), and the height at which mangroves give way to saltmarsh vegetation and both vegetation types may occur (Water Technology, 2014). A mangrove SET at Kooweerup exhibited a decline in tidal position that is of little concern given its elevated position in the tidal frame (corresponds to saltmarsh tidal positions). A mangrove and a saltmarsh SET at Quail Island also exhibited a decline in tidal position; these SETs are positioned at the lower end of the vertical distribution for mangrove and saltmarsh, respectively. Given the declining tidal position of the mangrove SET at Quail Island, and the increasing tidal position of the other mangrove SET at Quail Island, it is probable that the location adjacent to the creek draining Kooweerup Swamp (i.e., Cannons Creek) provides considerable hydrodynamic energy that is highly variable, even at the scale of distances between SET monitoring stations. The declining saltmarsh SET remains positioned relatively high in the tidal frame. However, should it continue to loose elevation and the tidal frame shifts according to current rates, this location may transition to being mangrove dominated. Projections indicate that this is not likely to occur until approximately the year 2190 under current rates of change (Figure 7B).
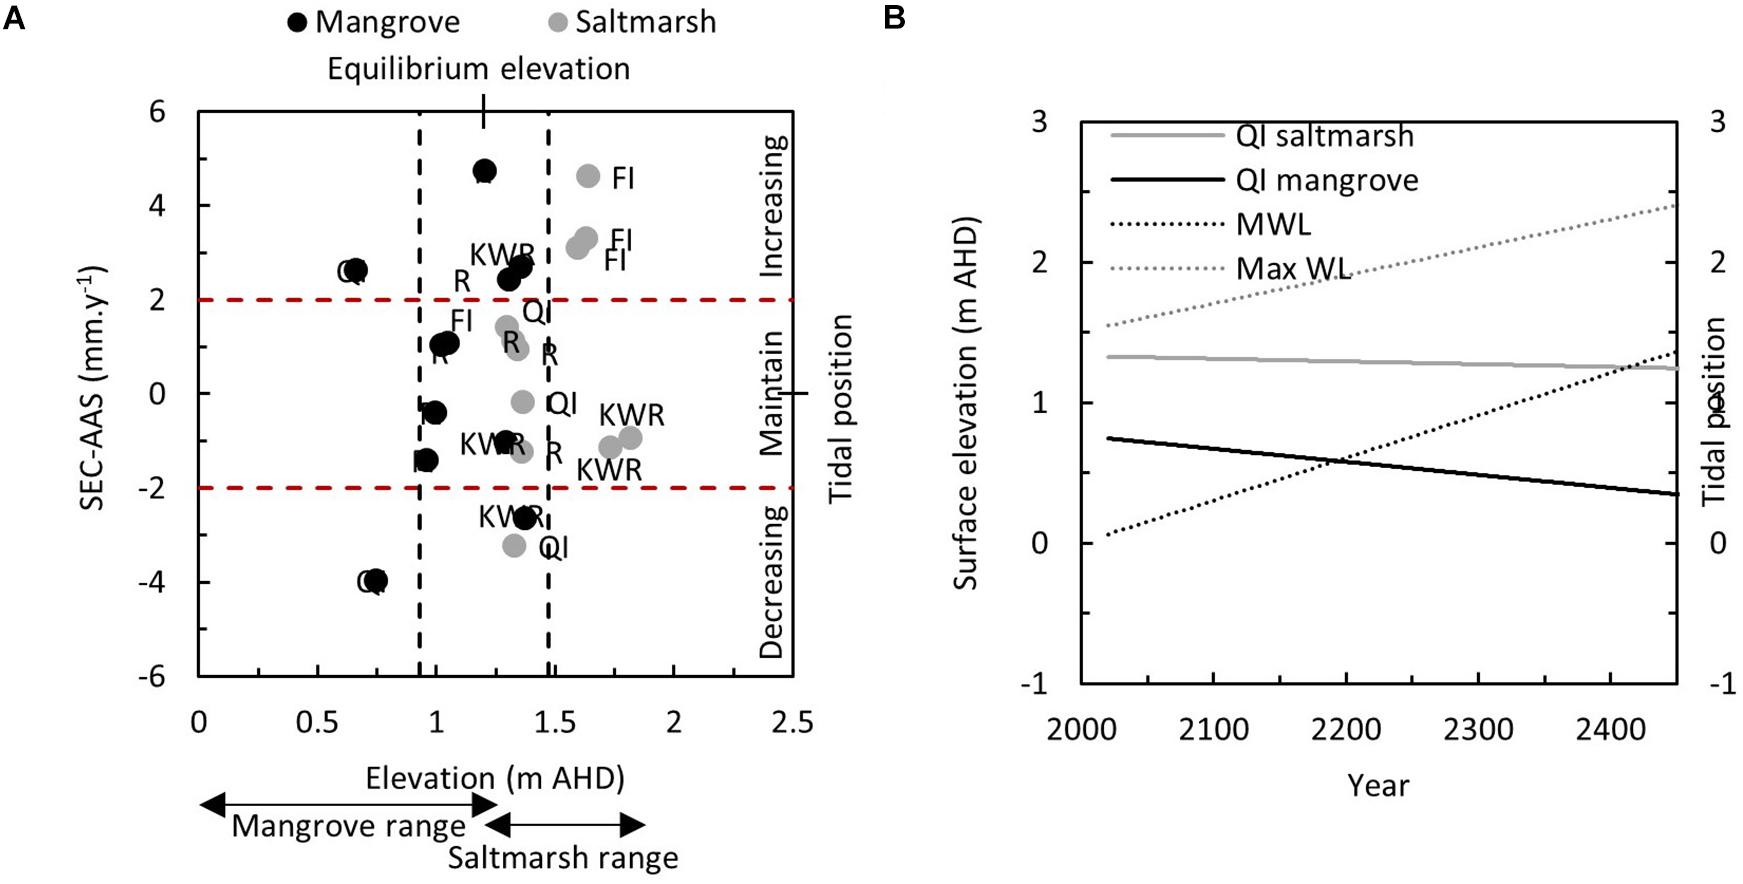
Figure 7. (A) Relationship between changing tidal position (mm y–1) [estimated using Eq. 1 and defined as the deficit between the rate of surface elevation change (mm y–1)] and rate of increase in accommodation space associated with RSLR (mm y–1), and substrate elevation at the time of last measurement in 2019. Where rates of surface elevation change match rates of increase in available accommodation space (±2 mm y–1), rates of surface elevation change are presumed to be at or near equilibrium with change to available accommodation space. The mean elevation of these location were used to define the equilibrium elevation range of 1.2 ± 0.3 m. (B) Projected decline in tidal position of SETs at Quail Island with trajectory of declining tidal position based on continuing rates of decline in tidal position and increase in water level trajectories, indicated by mean and maximum water levels. This projection indicates that it is some time before substrates at Quail Island are below mean water level, and the time is modulated by their starting elevation within the tidal frame.
Discussion
Processes Influencing Morphodynamics
This study confirmed that wetland surfaces positioned lower in the tidal frame were inundated more frequently, which provided additional opportunities for sediments to be removed from suspension and deposited on wetland surfaces. The role of tidal inundation in facilitating vertical accretion within the vegetated intertidal zone has been established for mangroves and saltmarshes (Pethick, 1981; Rogers et al., 2005a; Kirwan and Megonigal, 2013). However, this observed pattern did not translate into a similar degree of surface elevation gain as processes influencing substrate organic matter and mineral sediment volume caused significant autocompaction and modulated the degree of elevation gain. More specifically, no relationship was found between surface elevation gain, substrate elevation or inundation frequency. This deviation was attributed to processes that alter the substrate volume and contribute to autocompaction. These processes, including decomposition/addition of organic material, consolidation of mineral sediments and compression of organic material, do not operate linearly with inundation.
Higher carbon storage toward surfaces in most cores implies that there is some degree of organic matter turnover near substrate surfaces with living vegetation contributing new organic material to substrates as decomposition occurs. The outcome of this is net accumulation of organic material at wetland surfaces. Depletion of carbon away from the rooting zone of in situ vegetation was particularly evident in saltmarsh cores (except Kooweerup saltmarsh), where rooting zones are generally shallower and deeper organic material is likely to have had considerably more time for decomposition. This decomposition of older organic material is consistent with global-scale analyses that relate depleted carbon storage in saltmarshes of the southern hemisphere to relatively stable sea levels since the mid-Holocene (Rogers et al., 2019). The compensatory role of organic matter addition was further validated by relatively high rates of surface elevation change in the mangrove zone at Rhyll being associated with high substrate carbon storage and relatively low rates of autocompaction, despite modest vertical accretion.
The degree of autocompaction that occurred was positively related to the degree of vertical accretion on wetland surfaces, indicating that either recently deposited sediments underwent significant consolidation and/or the overburden of accumulating material contributed to deeper consolidation and compression of organic matter. As autocompaction is measured on the basis of changes occurring below marker horizons, processes of autocompaction are operating on mineral sediments below marker horizons and that accumulated prior to the commencement of this study. Autocompaction is regarded to be asymptotic and there is a limit to the reduction in substrate volume that can be achieved (Allen, 2000). Additionally, larger grain sizes are more resistant to consolidation (Bandini and Sathiskumar, 2009). The general trend of increasing grain size with depth below 0.8 m AHD implies consolidation largely operates on sediments above 0.8 m. The predominance of silt and clay grain sizes near wetland surfaces provides further support that consolidation is likely to dominate surface sediments. Paradoxically and unlike other locations, the saltmarsh at Rhyll exhibited both low rates of autocompaction and vertical accretion. This was attributed to the predominance of sand fractions at the surface that are resistant to consolidation. Low rates of surface elevation change, high rates of autocompaction and high substrate carbon content in the saltmarsh at Kooweerup imply that compression of organic material may be the primary process contributing to autocompaction at this location. Despite this autocompaction, substantial substrate carbon and low bulk density was quantified in the upper 40 cm of sediments, indicating that vertical growth of the saltmarsh was more recently associated with organic matter addition. Due to the relatively high position of the saltmarsh at this location and low inundation frequency, compression of this thickness of organic material is critical for maintaining substrates within the vertical range of accommodation space, else accommodation space will become exhausted and terrestrialization of vegetation cover may occur.
The varying contribution of addition, decomposition and compression of organic material, and mineral sediment consolidation to autocompaction limits the capacity to develop relationships between trajectories of surface elevation change and accommodation space. This problem was predicted by Allen (2000) who recognized the difficulty in realistically modeling autocompaction of Holocene coastal deposits due to the diversity and complexity of process involved and the environmental context. However, this is contrary to the structure of many existing empirical and physical models. Many models either presume processes causing autocompaction operate solely on organic material through decomposition (For example, Zhang et al., 2020), are implicitly incorporated in models of net surface elevation change (Morris et al., 2002; Rogers et al., 2012), or apply a constant rate of autocompaction irrespective of tidal position (For example, Marani et al., 2013). There are exceptions: the WARMER (Swanson et al., 2014) model includes parameters of mineral sediment accretion, organic matter addition and decomposition, and compaction; and OIMAS-N (Mudd et al., 2009) includes parameters of mineral and organic matter addition, decay of carbon pools and compaction. This study confirms that sandy substrates tend to undergo less autocompaction than substrates where surface sediments are largely fine grained. The upward fining of sediments within substrates (with the exception of Rhyll saltmarsh) indicates that grain size of accreting material and associated resistance to consolidation is positively related to available accommodation space. Given the elevation at which sandy and carbon-depleted sediments have typically accumulated in wetland substrates (i.e., <0.8 m AHD, though some peaks in carbon are preserved at lower elevations, particularly in mangrove-dominated locations), it is probable that the high-energy conditions required for sand deposition occurred some time ago. If this is the case, most of the autocompaction that could have occurred on these sediments is nearing completion.
Conceptualizing Processes of Autocompaction
The physical, biological and chemical processes contributing to autocompaction operate across different timescales (Allen, 2000). However as these processes are asymptotic, we propose that the bulk of autocompaction at Westernport Bay occurs in sediments either above approximately 0.8 m AHD or corresponding to the active rooting zone of mangrove vegetation. Autocompaction is also dependent upon the proportion of organic material in substrates, sediment characteristics and prior rates of surface elevation gain. We identify four critical factors that influence the degree of autocompaction: rooting depths of vegetation, sediment characteristics, rates of surface elevation gain, and vegetation distribution changes.
i) Rooting depths of vegetation: Whilst mangrove species diversity is low at Westernport Bay, saltmarsh species diversity is extraordinarily high with discernible zones dominated by saltbush, highly diverse herbaceous saltmarsh, and landward rushes. The varying rooting depth of this vegetation influences whether addition of organic material to substrates exceeds processes of decomposition. In this study, mangrove cores typically exhibited deeper zones of higher carbon storage near the surface, whilst the surficial zones of higher carbon storage at saltmarsh locations were typically shallower (i.e., with the exception of the saltmarsh at Kooweerup). Despite herbaceous saltmarshes generally having shallower, carbon-rich surficial zones, their overall deeper sediment columns above MSL (i.e., 0 m AHD) resulted in carbon storage above MSL being relatively consistent across the intertidal gradient. However, it is feasible to characterize the variation in rooting depths associated with optimal tidal positions to generate multi-peak models of organic matter addition, as was coarsely undertaken in this study by merging peak models to relate surface elevation change to elevation and inundation.
ii) Sediment characteristics: Supply of high volumes of fine-grained sediments generates a larger volume of substrate that is prone to processes of sediment consolidation. This was particularly evident in mangrove cores as they generally exhibited high accretion rates and greater silt to sand ratios in surficial sediments. The exception was Quail Island mangrove locations where sands dominated most of the substrate. The dominance of sands at wetlands surfaces attests to higher energy conditions and the possibility of erosion. The supply and subsequent deposition of sediments are hydro-dynamically governed and improvements on hydrodynamic models such that they account for sediment characteristics and their contribution to processes of autocompaction could be considered.
iii) Rates of surface elevation gain: Surface elevation gain, achieved through either organic matter and/or mineral sediment addition exceeding the rate of autocompaction, creates conditions favorable for increasing tidal position of wetland surfaces. When this occurs rapidly, either rooting zones of vegetation are transposed vertically, or lateral vegetation transitions occur (e.g., replacement of mangrove by saltmarsh) with a corresponding change in the depth of the active root zone. In both situations, the overall outcome is an increase in the depth of surficial carbon-rich zones until the deeper zones associated with prior root zones undergoes decomposition. High rates of vertical accretion may transition substrate elevations rapidly from lower positions in the tidal frame to optimal positions for organic matter addition (as per Morris et al., 2002), although the inverse may also occur. Whilst deeper active rooting zones will be increasingly abandoned and exposed to processes of decomposition, insufficient time may have passed for processes of decomposition and compression of organic material and consolidation of mineral sediments to significantly influence autocompaction. Increases in the height of the tidal frame with RSLR has been related to greater carbon storage (McKee et al., 2007; Toscano et al., 2018), and is likely facilitated by increasing exposure to anaerobic conditions (Rogers et al., 2019). It is feasible that this process may have resulted in instances of increasing tidal positions at “equilibrium elevations” as occurred for mangrove locations at Rhyll and Kooweerup, and for saltmarsh locations at French Island.
iv) Vegetation distribution changes: Changes in tidal position of vegetation may occur when surface elevation gain does not correspond to changes to the tidal frame with RSLR. As mangroves at Westernport Bay are positioned at lower tidal positions and have relatively deep rooting zones, and herbaceous saltmarsh positioned at higher tidal positions has shallower rooting zones, vegetation encroachment upon herbaceous saltmarsh may promote rapid addition of organic material to substrates. When this occurs, surficial carbon stocks may markedly increase and offset processes of autocompaction occurring deeper in the substrate. There is substantial evidence in southeastern Australia and elsewhere (Doughty et al., 2016; Kelleway et al., 2016) of increasing surficial carbon storage as mangroves have encroached upon saltmarsh over the past few decades. In Westernport Bay, this process is further promoted as the intermediary saltbush zone dominated by Tecticornia arbuscula grows to heights of approximately 2 m (pers. obs.), and are likely to have deeper rooting zones than herbaceous saltmarsh. This subsidy may be critical for achieving the high rates of surface elevation change in mangrove locations at Rhyll where relatively recent encroachment of mangrove along the nearby tidal creek and across formerly saltmarsh-dominated surfaces has been documented (Rogers et al., 2005b; Whitt et al., 2020).
Validation of Model Structure
Processes of net vertical accretion are typically related to accommodation space and our analyses confirmed this; minor improvements in vertical accretion model fit were achieved when distances to sediment sources were incorporated according to an exponential function, as per Temmerman et al. (2003). Whether accretion behaves linearly or exponentially is of little consequence when accommodation space becomes limited at high tidal positions (i.e., in saltmarsh) as modeled values converge, as demonstrated by Mogensen and Rogers (2018). Nevertheless, it is particularly important at lower tidal positions where differences between values derived from linear or exponential models can be significant. Unfortunately, preservation of marker horizons in mangrove zones at Westernport Bay was poor due to bioturbation and this markedly reduced confidence and increased variability in vertical accretion data. Hence, our ability to discern optimal model functions for vertical accretion was limited. Complementary analyses of sedimentation derived from measurements of 210Pb activity in sediments and using a time for space substitution indicate that peak models (Gaussian or Lorentzian) improved predictive ability (Rogers et al. in prep). More specifically, peak models can account for lower rates of sedimentation when accommodation space and hydrodynamic energy is high, accelerating sedimentation as accommodation space infills, and decelerating sedimentation as accommodation space becomes limited.
The linear relationship between vertical accretion and autocompaction indicates that autocompaction may also behave according to an inundation depth/frequency-constrained model; models may be either peak or linear in behavior. Disaggregating processes contributing to autocompaction that operate on organic and mineral material in substrates requires further investigation of intertidal variation in the behavior of these processes. Stratigraphic controls on compression were related to accommodation space with sandy, compression-resistant sediments dominating when accommodation space was high, and conforms closest to the OIMAS-N model structure of Mudd et al. (2009). Due to the greater complexity of vegetation at Westernport Bay, more information is needed to describe the vertical distribution of vegetation within the tidal frame, rooting depths of in situ vegetation, and time-depth dependence of decomposition. Application of merged peak models to describe surface elevation change within mangrove and saltmarsh zones indicate that quantifying the range and peak productivity of vegetation may correlate with the full range of processes operating on organic matter that modulates surface elevation change. Irrespective of these data gaps, our data indicates that processes influencing surface elevation change are largely depth constrained, and their behavior is more likely to conform with peak model structures rather than linear. There remains considerable scope to calibrate this data against OIMAS-N model to characterize changing tidal position and substrate carbon storage.
Equilibrium Analysis
Given the relatively recent change in trajectory of sea level across the southern hemisphere, it was feasible that equilibration of processes to recent SLR may be lagging. Additionally, there remains some concern that short-term datasets, such as those derived from SET-MH approaches, may not have sufficient temporal range to characterize surface elevation trajectories with confidence (Breithaupt et al., 2018; Wiberg et al., 2020). There was a surprising degree of confidence in elevation trajectories over the 20-year analysis period. We found that relatively few locations exhibited surface elevation trajectories beyond that required to maintain tidal positions (i.e., 0 ± 2 mm y–1). This implies that presumptions of equilibrium may not be misplaced, particularly when models are parameterized using high confidence data that is not influenced by perturbations operating over shorter timescales. Mean trajectories of elevation change and vertical accretion in this study were generally within the error range of rates reported in the earlier study of Rogers et al. (2005b); with the exception of rates of surface elevation change at French Island, and surface elevation change in the mangroves at Quail Island. We recommend analyses of confidence in trajectories before model application, as undertaken in this study and others (Jankowski et al., 2017).
Some locations that exhibited an increase in tidal position were associated with relatively recent transition of mangrove into saltmarsh (i.e., Rhyll mangrove locations were saltmarsh prior to the commencement of this study). Organic matter addition to substrates achieved by vegetation encroachment plays a critical role in increasing substrate surface elevations. Hydrological alterations in the saltmarsh at French Island appeared to provide a productivity subsidy and improve sediment-trapping efficiency, resulting in an increase in tidal position beyond that expected for its elevation. Increasing hydrodynamic energy along the creek draining Kooweerup Swamp and adjacent to Quail Island (i.e., Cannons Creek) may be influencing lateral movement of sediment on the eastern shores of Quail Island and contributing to declines in tidal positions at this location (Figure 1). The dominance of larger grain sizes in sediments and relatively low rates of vertical accretion at Quail Island indicate that hydrodynamic energy is generally too high for finer grain sediment deposition within the mangrove zone. Hydrodynamic modeling will be critical for conceptualizing the restructuring of shorelines of Quail Island and other locations where hydrodynamic energy is changing.
The analysis of equilibrium elevation undertaken in this study intriguingly indicated an equilibrium elevation corresponding to both the height of mean high tide and the approximate elevation that the mangrove niche transitions into the saltmarsh niche. The reported equilibrium elevation of 1.2 m is approximately 0.3 m below the upper boundary of accommodation space and where only ∼15% of total accommodation space remains for sediment accumulation. Saltmarsh is evidently a climax intertidal community in this region, and mangroves are a pioneering community. However, it would be misplaced to describe mangroves as “land-builders,” as proposed by Bird (1971, 1986) following work in Westernport Bay. This is because mineral sediment supply to create an intertidal surface at an elevation suitable for mangroves is a critical precursor for their establishment. This was confirmed in this study by the predominance of sandy substrates with little organic material at elevations at or below MSL. Accordingly, the most critical component of “land-building” is related to sediment supply, driven by hydrodynamic energy, and occurs prior to mangrove establishment. Commentary from Spenceley (1987) implied that there was not enough evidence to confirm that sedimentation would not have occurred in the absence of mangroves and proposed that sediment characteristics, prevailing energy conditions and faunal activity may be more critical for erosion and deposition than the presence of pneumatophores at Westernport Bay. Spenceley (1987) lamented the absence of more data and research into the role of mangrove roots in promoting mineral sediment deposition, and unfortunately, little has changed in subsequent years.
Projected acceleration in SLR (Oppenheimer et al., 2019) is proposed to deepen equilibrium elevations (Fagherazzi et al., 2012) and should this occur mangroves forests will increasingly dominate the intertidal zone of Westernport Bay by encroaching upon adjacent saltmarsh. Mangrove forests may eventually give way to un-vegetated mudflat and subtidal elevations should SLR acceleration exceed the capacity for maintaining equilibrium elevations. There is substantial evidence that this is already occurring with mangrove encroachment of saltmarsh well-documented in Westernport Bay (Rogers et al., 2005b; Whitt et al., 2020). Management efforts to maintain the areal distribution of saltmarsh and limit mangrove encroachment should recognize the subsidizing effect mangroves provide by adding considerably more organic material to substrates than herbaceous saltmarsh vegetation. Actions that limit expansion, such as controlling propagule dispersal and removing seedlings, may be detrimental and promote the development of ponds and open water within saltmarshes (Coleman et al., 2021).
Conclusion
This study established that a range of processes influence autocompaction; these processes vary spatially, are proportional to vertical accretion, and can feasibly be modeled with reference to accommodation space or depth below high water. Surface elevation change was related to vertical accretion and substrate organic matter, as indicated by carbon storage above mean sea level. Additionally, surface elevations do not adjust linearly with accommodation space and peak model structures will likely improve model performance. More research is required to improve characterization of model structures; however, it may be reasonable to presume equilibration with current rates of SLR providing models are parameterized with highly accurate data.
We propose that the outcomes of this study can only be achieved by analyzing processes of surface elevation change at locations with a longer history of stable or falling sea level, as occurred in much of the southern hemisphere over the mid- to late-Holocene. Relatively stable sea levels over the past 7,000 years provided favorable conditions for estuarine infill and this has been demonstrated in numerous studies (Woodroffe et al., 1993, 2000; Hashimoto et al., 2006; Kennedy et al., 2021). Since the mid-Holocene, processes influencing autocompaction operating on older/deeper sediments have had more time to reach completion and this is evident by depleted carbon stocks in saltmarsh sediments below 0.8 m AHD. This provides local-scale confirmation of the global-scale pattern of lower saltmarsh carbon stocks along coastlines where sea level was relatively stable throughout the mid- to late-Holocene (Rogers et al., 2019).
Recent increases in sea level are contrary to antecedent conditions and new accommodation space is now being created for mineral and organic material accumulation. Striking stratigraphic variation is generated as new accommodation space infills with mineral and organic material above older strata that have undergone processes of autocompaction and are increasingly dominated by mineral sediments. The sediment character of these new strata subsequently influences the degree of surface elevation occurring today. This stratigraphy contrasts locations where wetlands are exposed to a longer history of rising sea levels and creation of new accommodation space, as conditions influencing vertical accretion and processes of autocompaction are more likely to equilibrate, and the homogeneity of substrates will be higher. Considerably more research is required in the southern hemisphere to characterize spatial variation in processes influencing surface elevation change to improve and validate model structures and confidently parameterize models. We caution the use of models derived from the northern hemisphere, particularly those that presume constant rates of autocompaction or linear behavior of surface elevation change.
Data Availability Statement
The raw data supporting the conclusions of this article will be made available by the authors, without undue reservation, to any qualified researcher.
Author Contributions
KR and NS undertook data collection, analysis, and writing. This has been a collaborative research project since its inception. Both authors contributed to the article and approved the submitted version.
Funding
The Victorian Government provided financial support to establish this research in 2000 and subsequent funding in 2017 to maintain research continuity and deliver knowledge that assists with management of coastal wetlands of Westernport Bay. KR received an Australian Research Council Future Fellowship (FT130100532) that provided financial support for measurements and sediment analyses from 2014 to 2018.
Conflict of Interest
The authors declare that the research was conducted in the absence of any commercial or financial relationships that could be construed as a potential conflict of interest.
Acknowledgments
We acknowledge the custodians of the Western Port area, the Bunurong (Boonerwrung) people of the Kulin Nation. We recognize the contribution of field and laboratory assistants in undertaking this work; over 20 years of analysis there are too many to mention but we remember every field trip fondly. Special thanks given to Lawrance Ferns who has supported this research and the Victorian Government who has provided financial support with the initial establishment and recent measurements.
Supplementary Material
The Supplementary Material for this article can be found online at: https://www.frontiersin.org/articles/10.3389/fmars.2021.694039/full#supplementary-material
References
Allen, J. R. L. (2000). Morphodynamics of holocene salt marshes: a review sketch from the Atlantic and Southern North sea coasts of Europe. Quat. Sci. Rev. 19, 1155–1231. doi: 10.1016/s0277-3791(99)00034-7
Alongi, D. M. (2008). Mangrove forests: resilience, protection from tsunamis, and responses to global climate change. Estuar. Coast. Shelf Sci. 76, 1–13. doi: 10.1016/j.ecss.2007.08.024
Bandini, P., and Sathiskumar, S. (2009). Effects of silt content and void ratio on the saturated hydraulic conductivity and compressibility of sand-silt mixtures. J. Geotech. Geoenviron. Eng. 135, 1976–1980. doi: 10.1061/(asce)gt.1943-5606.0000177
Bird, E. C. F. (1986). Mangroves and intertidal morphology in Westernport Bay, Victoria, Australia. Mar. Geol. 69, 251–271. doi: 10.1016/0025-3227(86)90042-3
Boon, P. I., Allen, T., Brook, J., Carr, G., Frood, D., Harty, C., et al. (2011). “Mangroves and coastal saltmarsh of Victoria: distribution, condition, threats and management,” (Melbourne, VIC: Institute for Sustainability and Innovation, Victoria University).
Breithaupt, J. L., Smoak, J. M., Byrne, R. H., Waters, M. N., Moyer, R. P., and Sanders, C. J. (2018). Avoiding timescale bias in assessments of coastal wetland vertical change. Limnol. Oceanogr. 63, S447–S495.
Cahoon, D. R., Lynch, J. C., Hensel, P., Boumans, R., Perez, B. C., Segura, B., et al. (2002). High-precision measurements of wetland sediment elevation: i. recent improvements to the sedimentation-erosion table. J. Sediment. Res. 72, 730–733. doi: 10.1306/020702720730
Cahoon, D. R., and Turner, R. E. (1989). Accretion and canal impacts in a rapidly subsiding wetland II. Feldspar marker horizon technique. Estuaries 12, 260–268. doi: 10.2307/1351905
Callaway, J., Nyman, J., and Delaune, R. D. (1996). Sediment accretion in coastal wetlands: a review and a simulation model of processes. Curr. Top. Wetl. Biogeochem. 2, 2–23.
Church, J. A., Clark, P. U., Cazenave, A., Gregory, J. M., Jevrejeva, S., Levermann, A., et al. (2013). “Sea level change,” in Climate Change 2013: The Physical Science Basis. Contribution of Working Group I to the Fifth Assessment Report of the Intergovernmental Panel on Climate Change, eds T. F. Stocker, D. Qin, G.-K. Plattner, M. Tignor, S. K. Allen, J. Boschung, et al. (Cambridge: Cambridge University Press).
Coleman, D. J., Rogers, K., Corbett, D. R., Owers, C. J., and Kirwan, M. L. (2021). The geomorphic impact of mangrove encroachment in an Australian salt marsh. Estuar. Coast. Shelf Sci. 251:107238. doi: 10.1016/j.ecss.2021.107238
D’Alpaos, A., Lanzoni, S., Marani, M., and Rinaldo, A. (2007). Landscape evolution in tidal embayments: modeling the interplay of erosion, sedimentation, and vegetation dynamics. J. Geophys. Res. 112, 1–17. doi: 10.1007/978-1-4615-0575-4_1
Dey, R., Lewis, S. C., Arblaster, J. M., and Abram, N. J. (2019). A review of past and projected changes in Australia’s rainfall. Wiley Interdiscip. Rev. Clim. Change 10:e577.
Dougherty, A. J., Thomas, Z. A., Fogwill, C., Hogg, A., Palmer, J., Rainsley, E., et al. (2019). Redating the earliest evidence of the mid-holocene relative sea-level highstand in Australia and implications for global sea-level rise. Plos one 14:e0218430. doi: 10.1371/journal.pone.0218430
Doughty, C. L., Langley, J. A., Walker, W. S., Feller, I. C., Schaub, R., and Chapman, S. K. (2016). Mangrove range expansion rapidly increases coastal wetland carbon storage. Estuar. Coasts 39, 385–396. doi: 10.1007/s12237-015-9993-8
Fagherazzi, S., Kirwan, M. L., Mudd, S. M., Guntenspergen, G. R., Temmerman, S., D’alpaos, A., et al. (2012). Numerical models of salt marsh evolution: ecological, geomorphic, and climatic factors. Rev. Geophys. 50:RG1002.
French, J. R. (1993). Numerical simulation of vertical marsh growth and adjustment to accelerated sea-level rise, North Norfolk, U.K. Earth Surf. Process. Landf. 18, 63–81. doi: 10.1002/esp.3290180105
Hashimoto, T. R., Saintilan, N., and Haberle, S. G. (2006). Mid-holocene development of mangrove communities featuring rhizophoraceae and geomorphic change in the richmond river estuary, New South Wales, Australia. Geogr. Res. 44, 63–76. doi: 10.1111/j.1745-5871.2006.00360.x
Jankowski, K. L., Törnqvist, T. E., and Fernandes, A. M. (2017). Vulnerability of Louisiana’s coastal wetlands to present-day rates of relative sea-level rise. Nat. Commun. 8:14792.
Kelleway, J. J., Saintilan, N., Macreadie, P. I., Skilbeck, C. G., Zawadzki, A., and Ralph, P. J. (2016). Seventy years of continuous encroachment substantially increases ‘blue carbon’capacity as mangroves replace intertidal salt marshes. Glob. Change Biol. 22, 1097–1109. doi: 10.1111/gcb.13158
Kennedy, D., Wong, V., and Jacobsen, G. J. (2021). Holocene infill of the Anglesea Estuary, Victoria: a keep-up estuary in a geologically constrained environment. Aust. J. Earth Sci. doi: 10.1080/08120099.2021.1879266 [Epub ahead of print].
Kestner, F. J. (1975). The loose-boundary regime of the wash. Geogr. J. 141, 388–414. doi: 10.2307/1796474
Khan, N. S., Ashe, E., Shaw, T. A., Vacchi, M., Walker, J., Peltier, W. R., et al. (2015). Holocene relative sea-level changes from near-, intermediate-, and far-field locations. Curr. Clim. Change Rep. 1, 247–262. doi: 10.1007/s40641-015-0029-z
Kirwan, M. L., and Megonigal, J. P. (2013). Tidal wetland stability in the face of human impacts and sea-level rise. Nature 504, 53–60. doi: 10.1038/nature12856
Krauss, K. W., Mckee, K. L., Lovelock, C. E., Cahoon, D. R., Saintilan, N., Reef, R., et al. (2014). How mangrove forests adjust to rising sea level. New Phytol. 202, 19–34. doi: 10.1111/nph.12605
Krone, R. B. (1987). “A method for simulating historic marsh elevations,” in Coastal Sediments ‘87, ed. N. C. Krause (New Orleans, LA: American Society of Civil Engineers).
Lewis, S. E., Sloss, C. R., Murray-Wallace, C. V., Woodroffe, C. D., and Smithers, S. G. (2013). Post-glacial sea-level changes around the Australian margin: a review. Quat. Sci. Rev. 74, 115–138. doi: 10.1016/j.quascirev.2012.09.006
Marani, M., Da Lio, C., and D’alpaos, A. (2013). Vegetation engineers marsh morphology through multiple competing stable states. Proc. Natl. Acad. Sci. U.S.A. 110, 3259–3263. doi: 10.1073/pnas.1218327110
McKee, K. L., Cahoon, D. R., and Feller, I. C. (2007). Caribbean mangroves adjust to rising sea level through biotic controls on change in soil elevation. Glob. Ecol. Biogeogr. 16, 545–556. doi: 10.1111/j.1466-8238.2007.00317.x
Mogensen, L., and Rogers, K. (2018). Validation and comparison of a model of the effect of sea-level rise on coastal wetlands. Sci. Rep. 8:1369.
Morris, J. T., Sundareshwar, P. V., Nietch, C. T., Kjerfve, B., and Cahoon, D. R. (2002). Responses of coastal wetlands to rising sea-levels. Ecology 83, 2869–2877. doi: 10.1890/0012-9658(2002)083[2869:rocwtr]2.0.co;2
Mudd, S. M., Howell, S. M., and Morris, J. T. (2009). Impact of dynamic feedbacks between sedimentation, sea-level rise, and biomass production on near-surface marsh stratigraphy and carbon accumulation. Estuar. Coast. Shelf Sci. 82, 377–389. doi: 10.1016/j.ecss.2009.01.028
Murray-Wallace, C. V., and Woodroffe, C. D. (2014). Quaternary Sea-Level Changes: A Global Perspective. Cambridge: Cambridge University Press.
Oppenheimer, M., Glavovic, B., Hinkel, J., Van De Wal, R., Magnan, A. K., Abd-Elgawad, A., et al. (2019). “Chapter 4: sea level rise and implications for low lying islands, coasts and communities,” in IPCC Special Report on the Ocean and Cryosphere in a Changing Climate, eds H.-O. Pörtner, D. C. Roberts, V. Masson-Delmotte, P. Zhai, M. Tignor, E. Poloczanska, et al. (Geneva: Intergovenmental Panel on Climate Change).
Pethick, J. S. (1981). Long-term accretion rates on tidal salt marshes. J. Sediment. Res. 51, 571–577.
Reed, D. J. (1990). The impact of sea-level rise on coastal salt marshes. Prog. Phys. Geogr. 14, 465–481. doi: 10.1177/030913339001400403
Rinaldo, A., Fagherazzi, S., Lanzoni, S., Marani, M., and Dietrich, W. E. (1999). Tidal networks: 2. watershed delineation and comparative network morphology. Water Res. Res. 35, 3905–3917. doi: 10.1029/1999wr900237
Rogers, K., Kelleway, J. J., Saintilan, N., Megonigal, J. P., Adams, J. B., Holmquist, J. R., et al. (2019). Wetland carbon storage controlled by millennialscale variation in relative sea-level rise. Nature 567, 91–95. doi: 10.1038/s41586-019-0951-7
Rogers, K., Saintilan, N., and Cahoon, D. (2005a). Surface elevation dynamics in a regenerating mangrove forest at Homebush Bay, Australia. Wetl. Ecol. Manag. 13, 587–598. doi: 10.1007/s11273-004-0003-3
Rogers, K., Saintilan, N., and Copeland, C. (2012). Modelling wetland surface elevation and its application to forecasting the effects of sea-level rise on estuarine wetlands. Ecol. Model. 244, 148–157. doi: 10.1016/j.ecolmodel.2012.06.014
Rogers, K., Saintilan, N., and Heijnis, H. (2005b). Mangrove encroachment of salt marsh in Western Port Bay, Victoria: the role of sedimentation, subsidence and sea level rise. Estuaries 28, 551–559. doi: 10.1007/bf02696066
Spenceley, A. P. (1987). Mangroves and intertidal morphology in Westernport Bay, Victoria, Australia — Comment. Mar. Geol. 77, 327–330. doi: 10.1016/0025-3227(87)90121-6
Swanson, K. M., Drexler, J. Z., Schoellhamer, D. H., Thorne, K. M., Casazza, M. L., Overton, C. T., et al. (2014). Wetland accretion rate model of ecosystem resilience (WARMER) and its application to habitat sustainability for endangered species in the San Francisco estuary. Estuar. Coasts 37, 476–492. doi: 10.1007/s12237-013-9694-0
Temmerman, S., Govers, G., Wartel, S., and Meire, P. (2003). Spatial and temporal factors controlling short-term sedimentation in a salt and freshwater tidal marsh, scheldt estuary, Belgium, SW Netherlands. Earth Surf. Process. Landf. 28, 739–755. doi: 10.1002/esp.495
Thorne, K., Macdonald, G., Guntenspergen, G., Ambrose, R., Buffington, K., Dugger, B., et al. (2018). US Pacific coastal wetland resilience and vulnerability to sea-level rise. Sci. Adv. 4:eaao3270. doi: 10.1126/sciadv.aao3270
Toscano, M. A., Gonzalez, J. L., and Whelan, K. R. T. (2018). Calibrated density profiles of Caribbean mangrove peat sequences from computed tomography for assessment of peat preservation, compaction, and impacts on sea-level reconstructions. Quat. Res. 89:201. doi: 10.1017/qua.2017.101
Water Technology (2014). Western Port Local Coastal Hazard Assessment. Inundation Hazards Report 04 (R04). Melbourne, VIC: Melbourne Water Technology.
White, N. J., Haigh, I. D., Church, J. A., Koen, T., Watson, C. S., Pritchard, T. R., et al. (2014). Australian sea levels—trends, regional variability and influencing factors. Earth Sci. Rev. 136, 155–174. doi: 10.1016/j.earscirev.2014.05.011
Whitt, A. A., Coleman, R., Lovelock, C. E., Gillies, C., Ierodiaconou, D., Liyanapathirana, M., et al. (2020). March of the mangroves: drivers of encroachment into southern temperate saltmarsh. Estuar. Coast. Shelf Sci. 240:106776. doi: 10.1016/j.ecss.2020.106776
Wiberg, P. L., Fagherazzi, S., and Kirwan, M. L. (2020). Improving predictions of salt marsh evolution through better integration of data and models. Ann. Rev. Mar. Sci. 12, 389–413. doi: 10.1146/annurev-marine-010419-010610
Woodroffe, C. D., Mulrennan, M. E., and Chappell, J. (1993). Estuarine infill and coastal progradation, Southern van Diemen Gulf, Northern Australia. Sediment. Geol. 83, 257–275. doi: 10.1016/0037-0738(93)90016-x
Woodroffe, C. W., Buman, M., Kawase, K., and Umitsu, M. (2000). Estuarine infill and formation of Deltaic Plains, Shoalhaven River. Wetlands 18, 72–84. doi: 10.31646/wa.232
Zhang, Y., Rowland, J. C., Xu, C., Wolfram, P. J., Svyatsky, D., Moulton, J. D., et al. (2020). Understanding the eco-geomorphologic feedback of coastal marsh under sea level rise: vegetation dynamic representations, processes interaction, and parametric sensitivity. J. Geophys. Res. Earth Surf. 125:e2020JF005729.
Keywords: accommodation space, sedimentation, vertical accretion, subsidence, consolidation, surface elevation tables, marker horizons
Citation: Rogers K and Saintilan N (2021) Processes Influencing Autocompaction Modulate Coastal Wetland Surface Elevation Adjustment With Sea-Level Rise. Front. Mar. Sci. 8:694039. doi: 10.3389/fmars.2021.694039
Received: 12 April 2021; Accepted: 16 June 2021;
Published: 21 July 2021.
Edited by:
Simon Marius Mudd, University of Edinburgh, United KingdomReviewed by:
Begoña Pérez-Gómez, Ports of the State, SpainInmaculada Rodríguez-Santalla, Rey Juan Carlos University, Spain
Copyright © 2021 Rogers and Saintilan. This is an open-access article distributed under the terms of the Creative Commons Attribution License (CC BY). The use, distribution or reproduction in other forums is permitted, provided the original author(s) and the copyright owner(s) are credited and that the original publication in this journal is cited, in accordance with accepted academic practice. No use, distribution or reproduction is permitted which does not comply with these terms.
*Correspondence: Kerrylee Rogers, a2VycnlsZWVAdW93LmVkdS5hdQ==