 Aoife E. Parsons
 Ole B. Samuelsen*
- Institute of Marine Research, Bergen, Norway
To achieve a sustainable salmonid aquaculture industry, the environmental impacts of chemicals used to treat sea lice (Caligidae) infestations need to be considered. Our ability to assess the risks associated with these treatments in relation to human and wildlife health is limited by the lack of information on their concentrations in marine coastal environments. Diflubenzuron and teflubenzuron are chitin synthesis inhibiting insecticides frequently used to treat sea lice infestations on Norwegian salmon farms. In the present study, the distribution, persistence and bioaccumulation of both compounds were assessed in marine sediments and benthic macrofauna collected at four Norwegian aquacultures sites. Both compounds were detected in sediments sampled at 30–1400 m from the selected farms and 8–22 months after the last treatments took place. Diflubenzuron was detected above the limit of quantification (LOQ) in 76% of sediment samples and measured levels ranged between 2.4 and 257 μg/kg dry weight (dw). Teflubenzuron was detected above the LOQ in 92% of sediment samples, at concentrations ranging between 1.3 and 3474 μg/kg dw. In all samples where diflubenzuron and teflubenzuron were detected, the measured levels exceeded the Norwegian environmental quality standards (EQSsediment; 0.2 and 0.0004 μg/kg dw, respectively), indicating that these compounds may pose a risk to benthic marine species living near fish farms. Both compounds were detected in wild fauna collected near the selected aquaculture sites with measured residue levels in the low micro-gramme per kilogramme wet weight range. The residue levels detected in economically important species caught for human consumption, such as pink shrimp (Pandalus montagui) and Norway lobster (Nephrops norvegicus), were substantially lower than biota EQS’s and maximum residue limits (MRL) set by the EU for salmon tissue. Further studies are needed to fully understand the ecological impacts of these compounds in the marine environment, with the potential for lethal and sub-lethal effects to occur in non-target organisms following chronic exposures.
Introduction
Aquaculture has expanded rapidly across the globe in the past three decades, producing 114 million tonnes of seafood in 2018 (Food and Agriculture Organization [FAO], 2020). Norway is the world’s largest producer of farmed Atlantic salmon (Salmo salar), with 1.4 million tonnes produced annually (Grefsrud et al., 2021). With salmonid aquaculture production predicted to reach five million tonnes by 2050, there are concerns over the industry’s impact on water quality, natural ecosystems, and human health (Páez-Osuna, 2001; Liu et al., 2017). One of the key environmental issues associated with salmonid farms relates to the use, and subsequent release into the surrounding marine environment, of chemotherapeutants in the treatment of sea lice infestations.
Sea lice, of the genera Caligus and Lepeophtheirus, are naturally occurring marine ectoparasites common in salmonid fish, but when present in high numbers sea lice pose a major challenge to the salmonid aquaculture industry globally. Sea lice infestations reduce the general welfare of farmed fish and cause economic losses due to reduced growth, increased mortality, and reduced fish quality (Burka et al., 2012). In order to manage these infestations on fish farms, the Norwegian Salmon Lice Directive limits the number of mature female lice per fish to 0.2–0.5, depending on the geographical location and time of the year (Nærings og fiskeridepartementet, 2012). Chemotherapeutant treatment, administered either as in-feed additives or applied topically via bath treatments, are one of several methods for controlling sea lice infestations on salmonid farms. Diflubenzuron [1-(4-chlorophenyl)-3-(2,6-difluorobenzoyl)urea] and teflubenzuron [1-(3,5-dichloro-2,4-difluorophenyl)-3-(2,6-difluorobenzoyl)urea] are benzoylphenylurea insecticides used as in-feed anti-sea lice drugs on Norwegian fish farms and are licenced under the trade names Releeze vet ®, respectively. Despite the reduction in the use of chemotherapeutants on Norwegian salmon farms in recent years, a total of 1000 and 1603 kg of diflubenzuron and teflubenzuron were used in 2020 (Folkehelseinstituttet, 2020).
Benzoylphenylurea insecticides are transmitted to sea lice via the mucus, skin, and blood of their host and act by interfering with chitin synthesis within the exoskeleton (Merzendorfer, 2013). They are administered as medicated pellets containing either 0.6 g active compound per kg feed (diflubenzuron) or 2 g active compound per kg feed (teflubenzuron). The intended oral dose of diflubenzuron is 3–6 mg per kg fish biomass administered once a day for 14 consecutive days (Felleskatalogen, 2012). For teflubenzuron, the recommended dose is 10 mg per kg fish biomass administered once a day for 7 consecutive days (Felleskatalogen, 2018). The absorption of both diflubenzuron and teflubenzuron from the gastrointestinal tract of salmon is relatively poor with approximately 4–30% of the administered dose retained by the salmon (European Medicines Evaluation Agency, 1999a, b). Consequently, 70–90% of the parent compound is released from fish via faeces in the period immediately following treatment. In addition, diflubenzuron and teflubenzuron can enter the marine environment around fish farms in the form of uneaten waste feed. Since diflubenzuron and teflubenzuron have low water solubility’s (9.4 and 89 μg/L and, respectively) and high hydrophobicity (Log Kow values of 3.8 and 5.4) (Marsella et al., 2000), they are likely to bind to suspended particulate matter. Once released from salmon farms, they subsequently distribute to the sediment directly under the pens or disperse further afield (Langford et al., 2014; Samuelsen et al., 2015).
Several studies have shown that benzoylphenylurea insecticides are highly toxic to crustaceans that undergo moulting, including shrimp, and lobsters (Samuelsen et al., 2014; Bechmann et al., 2018; Samuelsen et al., 2020). There is, however, limited information currently available on the levels of these compounds present in the marine environment around Norwegian fish farms consequently, it is difficult to assess whether diflubenzuron and teflubenzuron pose a risk to marine biota in the wild as well as to human health. Here we carried out a field investigation to assess the levels of these compounds present in the marine environment near four Norwegian fish farms, all of which had a history of treating with diflubenzuron, teflubenzuron, or both in the 4 years prior to sampling. The objectives of this study were to (1) determine the concentration, distribution, and persistence of diflubenzuron and teflubenzuron in marine sediments, (2) assess their concentrations in wild fauna, and (3) compare the measured concentrations in sediment and biota with environmental quality standards (EQS) and maximum residue limits (MRL).
Materials and Methods
Sampling Location
Four aquaculture sites (Farms A–D) were chosen based on publicly available information about their past use of benzoylphenylurea insecticides (BarentsWatch, 2019). The four sites were all located within the same large fjord system on the west coast of Norway. Farm A and B were located in a narrow branch of the main fjord, approximately 4.3 and 2.0 km from the main fjord, respectively. The distance between the two farms was 2.3 km. Farm C was located above a submarine ridge in the main fjord and Farm D was located in a bay in a large basin connected to the main fjord via a narrow and shallow strait (Figure 1). Each location was sampled once between September and October 2015. The field investigation took place several months after the last treatments had taken place on these farms in order to assess the persistence of these compounds in the marine environment. Farm A and D reported using both diflubenzuron and teflubenzuron in the 4 years pior to sampling, whereas Farm B and C reported only using diflubenzuron. The quantity of diflubenzuron and teflubenzuron used by each of the farms is provided in Table 1. The last diflubenzuron treatments on Farms A, B, C, and D took place 18, 22, 18, and 8 months prior to sampling, while the last teflubenzuron treatments on Farm A and D took place 12 and 21 months prior to sampling, respectively. A reference site was selected in an adjacent fjord system, where aquaculture activities are not permitted.
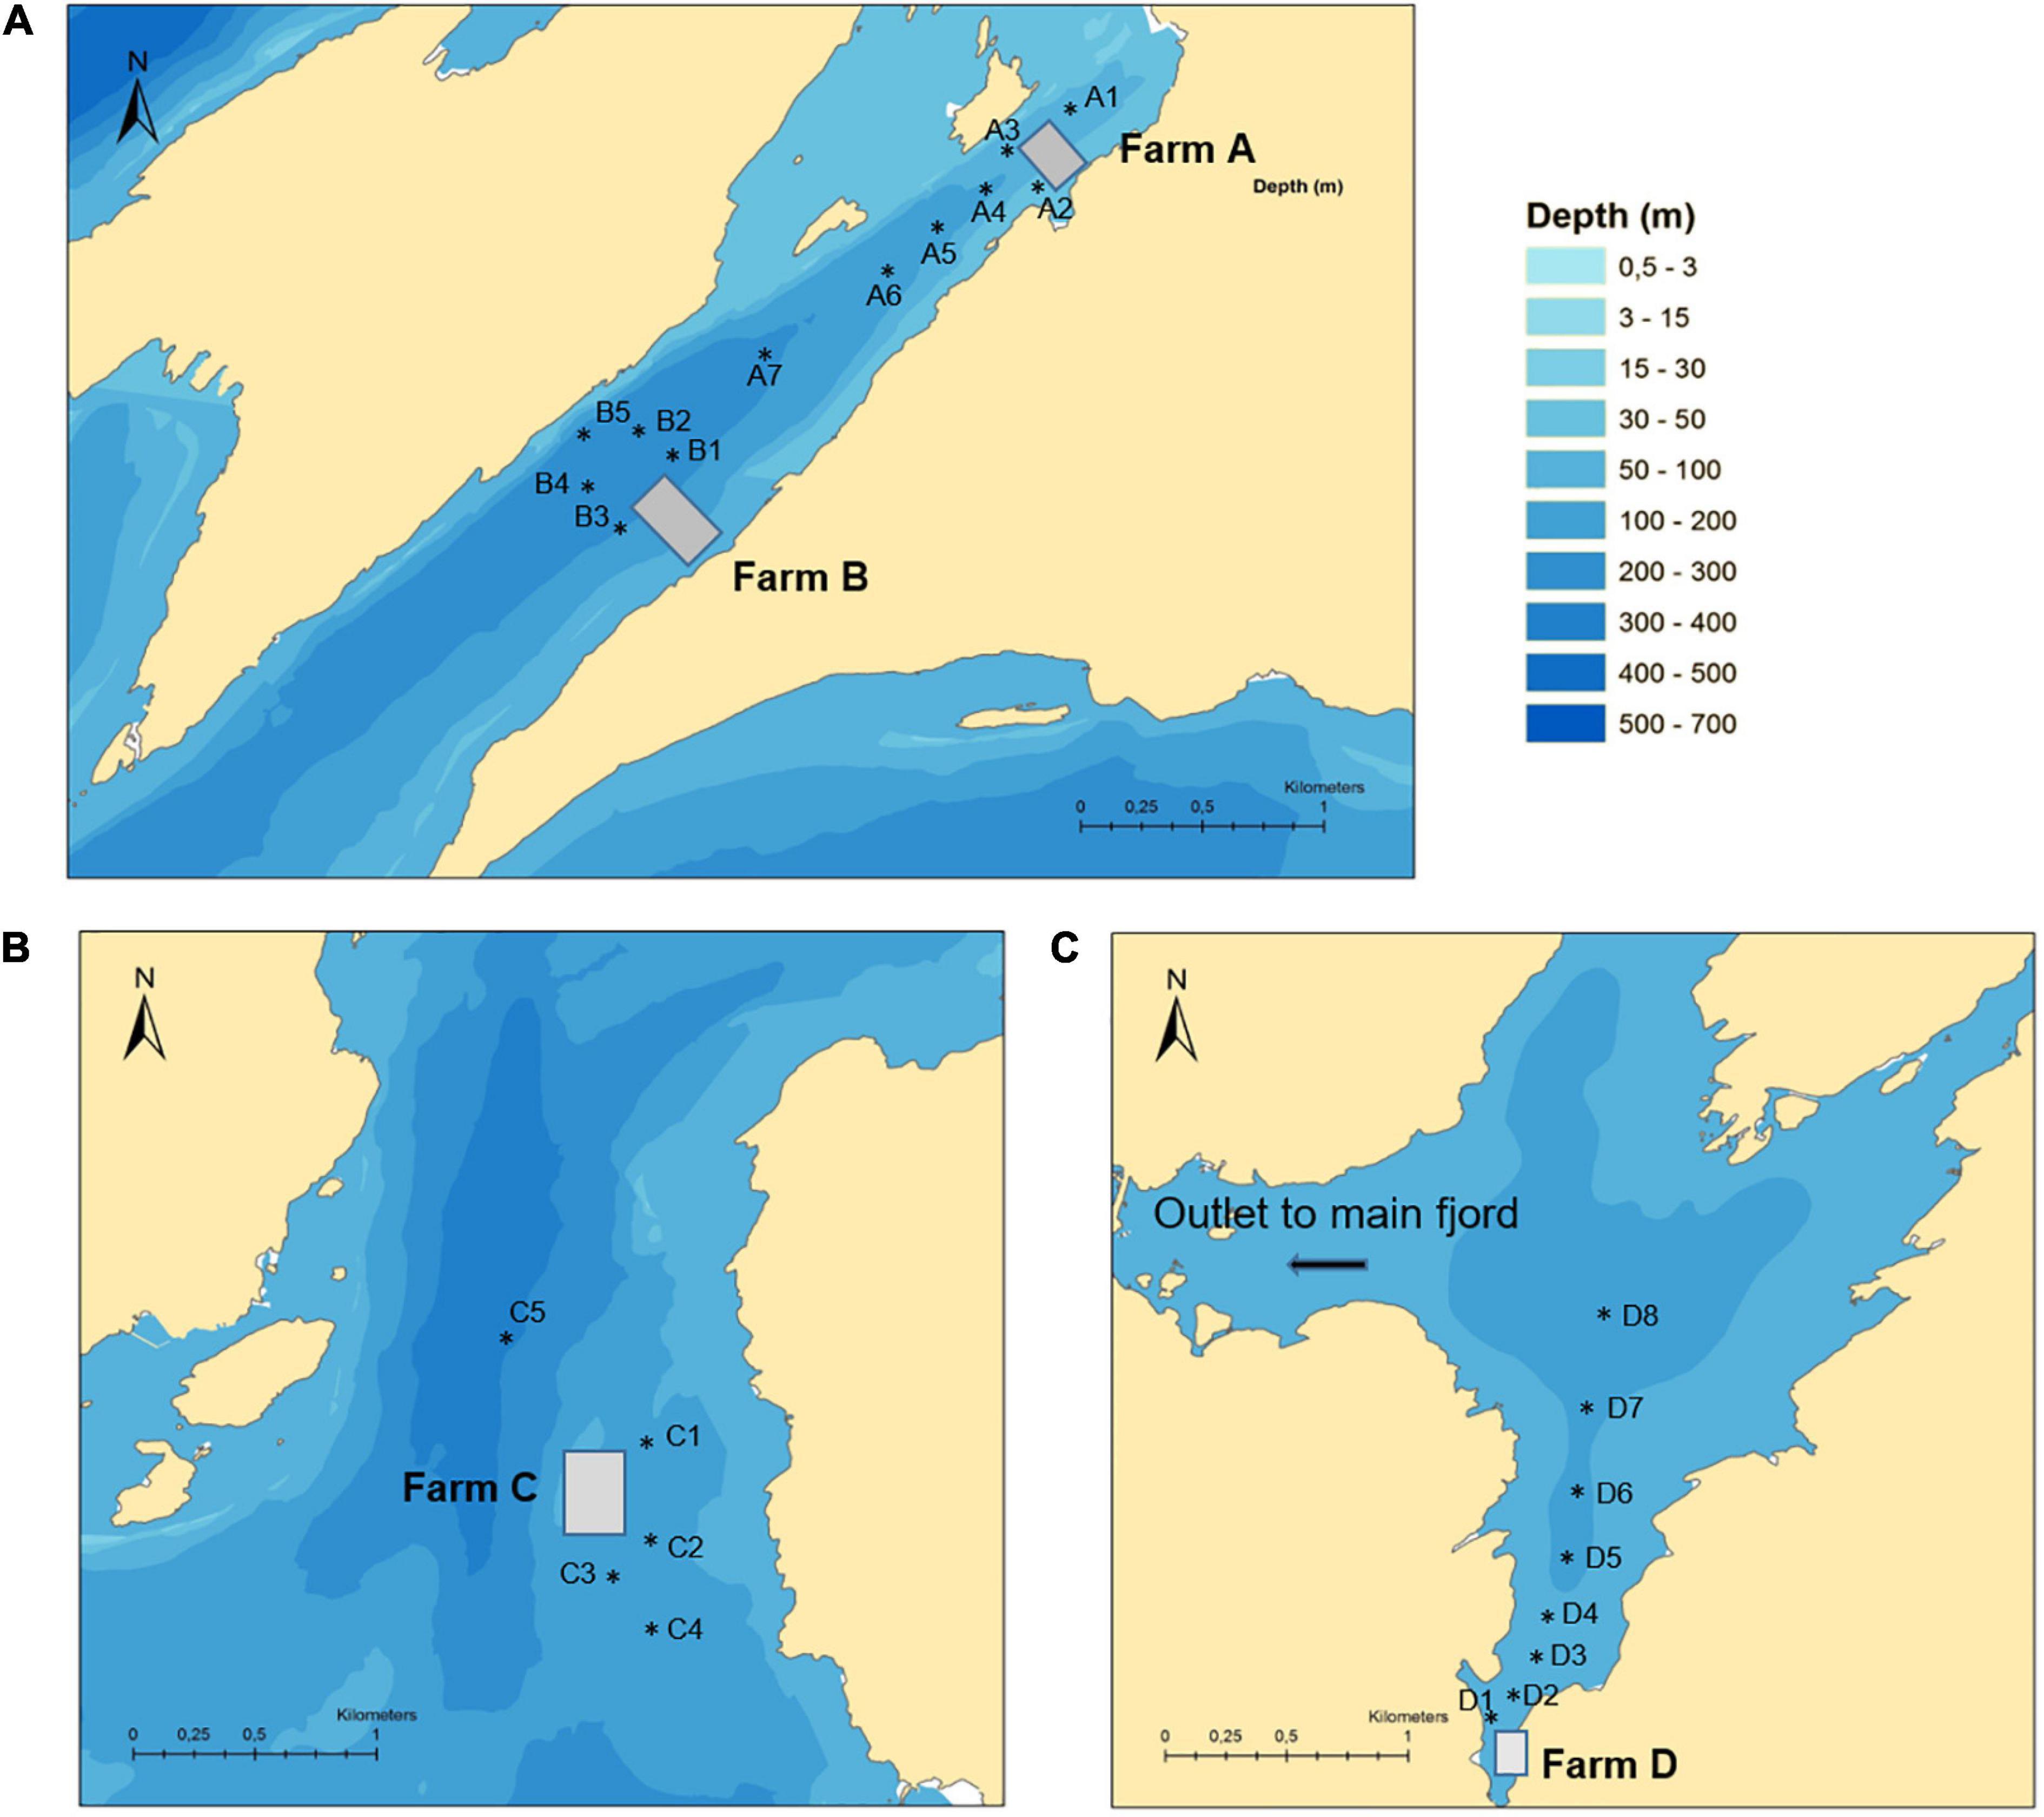
Figure 1. Locations of the four farms in a Norwegian fjord situated along the west coast. Farm A and Farm B are shown in panel (A), Farm C is shown in panel (B) and Farm D is shown in panel (C).
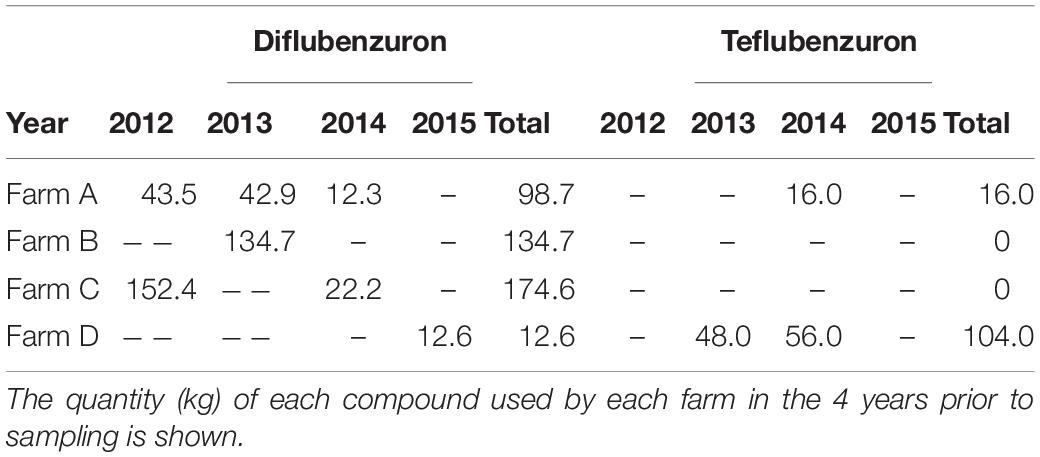
Table 1. A summary of the historical use of diflubenzuron and teflubenzuron at each of the Norwegian fish farms (A–D).
Ocean Current Model
In order to discuss the environmental concentrations of diflubenzuron and teflubenzuron in the context of the oceanographic conditions around the farms, a numerical model (NorKyst800), an implementation of the Regional Ocean Model System (ROMS), was used to simulate the ocean currents at each farm location. The model was set up with a 160 m horizontal resolution and 25 sigma layers in the vertical and includes recorded input data from atmosphere, tides, and rivers. Further details of the model have been reported previously (Albretsen et al., 2011). As the farm net pens extend approximately 30 m below the sea surface, ocean currents were selected from the model at 30 m depth. For all farm locations, ocean currents are presented graphically using current roses. The plots represent a 1 month simulation, including a full tidal cycle (May 2019). Current roses show the frequency of the current magnitude and direction in compass direction. The distance of the bands from the centre shows the frequency of the current in the different directions. The magnitude of the current (m/s) is shown by the intensity of the bands.
Sampling
Sediment
A total of 25 locations were selected across Farms A–D, while 10 locations were selected at the reference site. A single sediment sample was taken at each location, except for A4, A5, and C2 where duplicate grabs were taken and the mean values are reported for these locations. The sampling locations were selected based on pre-collected data about seabed topography and bottom hardness around the farms using the Olex system for marine charting and navigation (Olex AS, Trondheim, Norway). Samples of bottom sediment were collected using a van Veen grab (sampling area of 0.04 m2), and the upper 2–3 cm of undisturbed sediment was sub-sampled through top-opening flaps on the grab. The samples were stored at −18°C until chemical analysis was performed.
The sampling location for Farm A (A1–A7), Farm B (B1–B5), Farm C (C1–C5), and Farm D (D1–D8) are shown in Figure 1.
Biota
To collect polychaete samples, the sediment from the grab was sieved through a 1 mm screen and all polychaetes from one location were pooled into one sample to obtain enough material for the chemical analysis. The collection of the remaining biota was carried out using traps, designed to catch shrimp and lobsters, at locations A1, A6, and A7 (Farm A), B1 and B4 (Farm B), C4 and C5 (Farm C), and D2 and D5 (Farm D). Three traps were deployed at each location for 4–7 days. The number of species and individuals were recorded, and selected samples were transferred to the laboratory on the same day and stored at −18°C until chemical analysis was performed.
Chemical Analysis
Chemicals and Standards
Diflubenzuron-d4 was obtained from CDN Isotopes INC (Pointe-Claire, QC, Canada), diflubenzuron (analytical standard), teflubenzuron (analytical standard), acetonitrile, heptane, diethyl ether, and acetone (all HPLC grade) were from Sigma–Aldrich (Steinheim, Germany), whereas tetrahydrofuran (HPLC grade) was purchased from Merck (Darmstadt, Germany). The water used was purified with a Milli-Q water purification system from Millipore. Stock solutions of teflubenzuron, diflubenzuron, and diflubenzuron-d4 were prepared at a concentration of 1 mg/mL in tetrahydrofuran. Working standards were prepared by dilution of stock solutions with a mixture of acetonitrile: water (50:50, v/v).
Sediment
Sediment samples were defrosted and kept at room temperature for approximately 20 h to remove excess water. After this period, the water content (mean ± standard deviation, SD) of the sediments was 3.2 ± 2.6%. Subsequently, 1–2 g of the sediments were weighed into plastic tubes. Diflubenzuron-d4 (internal standard) and acetonitrile were added to each sediment sample. The mixtures were vortex-mixed, sonicated, and centrifuged before the extracts were transferred to new vials and concentrated at 40°C under nitrogen flow. The residues were dissolved in acetonitrile/water (75:25) and filtered through a 0.45 μm nylon filter.
The samples were analysed using an Agilent 1200 LC-system (Agilent Technologies, Waldbronn, Germany) coupled to an Agilent 6460 triple quadrupole mass spectrometer (Agilent Technologies, Waldbronn, Germany). Masshunter software (Agilent Technologies, Waldbronn, Germany) was used for instrument control and data analysis. The analytical column used was a ZORBAX SB-C18, 2.1 mm × 50 mm, 1.8 μm (Agilent Technologies, Waldbronn, Germany). The injection volume was 0.5 μL. The mobile phase was a mixture of acetonitrile and water (75:25, v/v) at an isocratic flow rate of 0.4 mL/min at 25°C. The retention time was 0.6 min for diflubenzuron and diflubenzuron-d4 and 0.9 min for teflubenzuron. Details of the mass spectrometer parameters are described in Olsvik et al. (2015).
Procedural blank, matrix blank, matrix−matched calibration curve, and controls were prepared together with the samples. The LOQ was 1.0 μg/kg for both diflubenzuron and teflubenzuron. The method was linear over the range studied and the relative SD was <20%. Diflubenzuron and teflubenzuron concentrations in sediment are reported on a wet weight basis and dry weight (dw) basis. dw concentrations were calculated based on the following equation:
where Cdw is the concentration corrected for dw, Cwt is wet weight concentration and Ps is percent solid.
The organic matter content (%) in the sediments were determined by means of a loss on ignition test performed at 450°C in a furnace for 24 h (Heiri et al., 2001; Fang et al., 2013).
Biota
Chemistry analysis was performed on homogenised whole individual shrimps (0.6–6.2 g), pooled polychaetes (0.5 g), the muscle (abdominal tissue; 1 g) and hepatopancreas (0.4–1.0 g) of Norway lobster, and whole body samples (hard shells were removed) of Buccinum undatum and Paguridae spp. (0.4–22 g).
For the sample preparation, diflubenzuron-d4 (internal standard), and acetone were added to each sample. The mixtures were vortex-mixed, sonicated, and centrifuged. The extracts were evaporated to dryness under nitrogen at 40°C, the residues were dissolved in heptane and cleaned-up by solid phase extraction using an automated solid phase extraction system as described in Samuelsen et al. (2014). The eluate was evaporated to dryness using nitrogen at 40°C and re-dissolved in acetonitrile/water (75:25) and filtered through a 0.45-μm nylon filter. The samples were analysed by LC–MS/MS as described above for the sediments.
Procedural blank, matrix blank, calibration curves, and controls were prepared together with the samples. Muscle tissue from Atlantic salmon was used as biological matrix for the calibration curve. The fauna samples had an LOQ of 0.03–0.59 μg/kg for diflubenzuron, while for teflubenzuron the LOQ varied from 0.02 to 0.59 μg/kg. The method was linear over the range studied, and the relative SD was <20%.
Statistical Analysis
All graphs were plotted using the ggplot2 package in R Studio (1.4.1103) (Wickham, 2009; RStudio Team, 2016).
Results
Organic Matter in Sediments
At Farm A, B, and C, the sediment consisted mainly of sand and shell sand. Organic matter (mean ± SD) amounted to 3.8 ± 0.7, 5.8 ± 2.9, and 3.0 ± 0.5% of the total sediment weight in samples collected near Farm A, B, and C, respectively. At Farm D, a visual inspection of the sediment samples revealed that it contained what appeared to be saw-dust remnants, most likely deposited waste material from a sawmill previously operating in the area. The organic matter in sediments collected at locations around Farm D amounted to 9.6 ± 1.3% of the total weight of the samples. Individual values for each location are provided in Supplementary Table 1.
Modelling of Ocean Currents
The current plots revealed different hydrodynamical condition at the four farm locations (Figure 2). Farm A and B showed directional currents, which will disperse organic matter from the farms in north-easterly direction. The currents were slightly stronger at Farm B than at Farm A, with an average and maximum speed of 0.02 and 0.07 m/s at Farm B, respectively, compared to the average and maximum ocean current speeds of 0.01 and 0.04 m/s at Farm A. The ocean current at Farm D were very low, with an average and maximum speed of 0.01 and 0.03 m/s, respectively, without any clear dominant direction. Organic matter from this farm is likely to aggregate under the farm site, with low transport distance from the farm. The ocean currents at Farm C were stronger compared to the other farm sites, with an average speed of 0.08 m/s (maximum speed: 0.46 m/s). Organic matter from Farm C is likely to be transported further form the farm site and be dispersed in north–south direction.
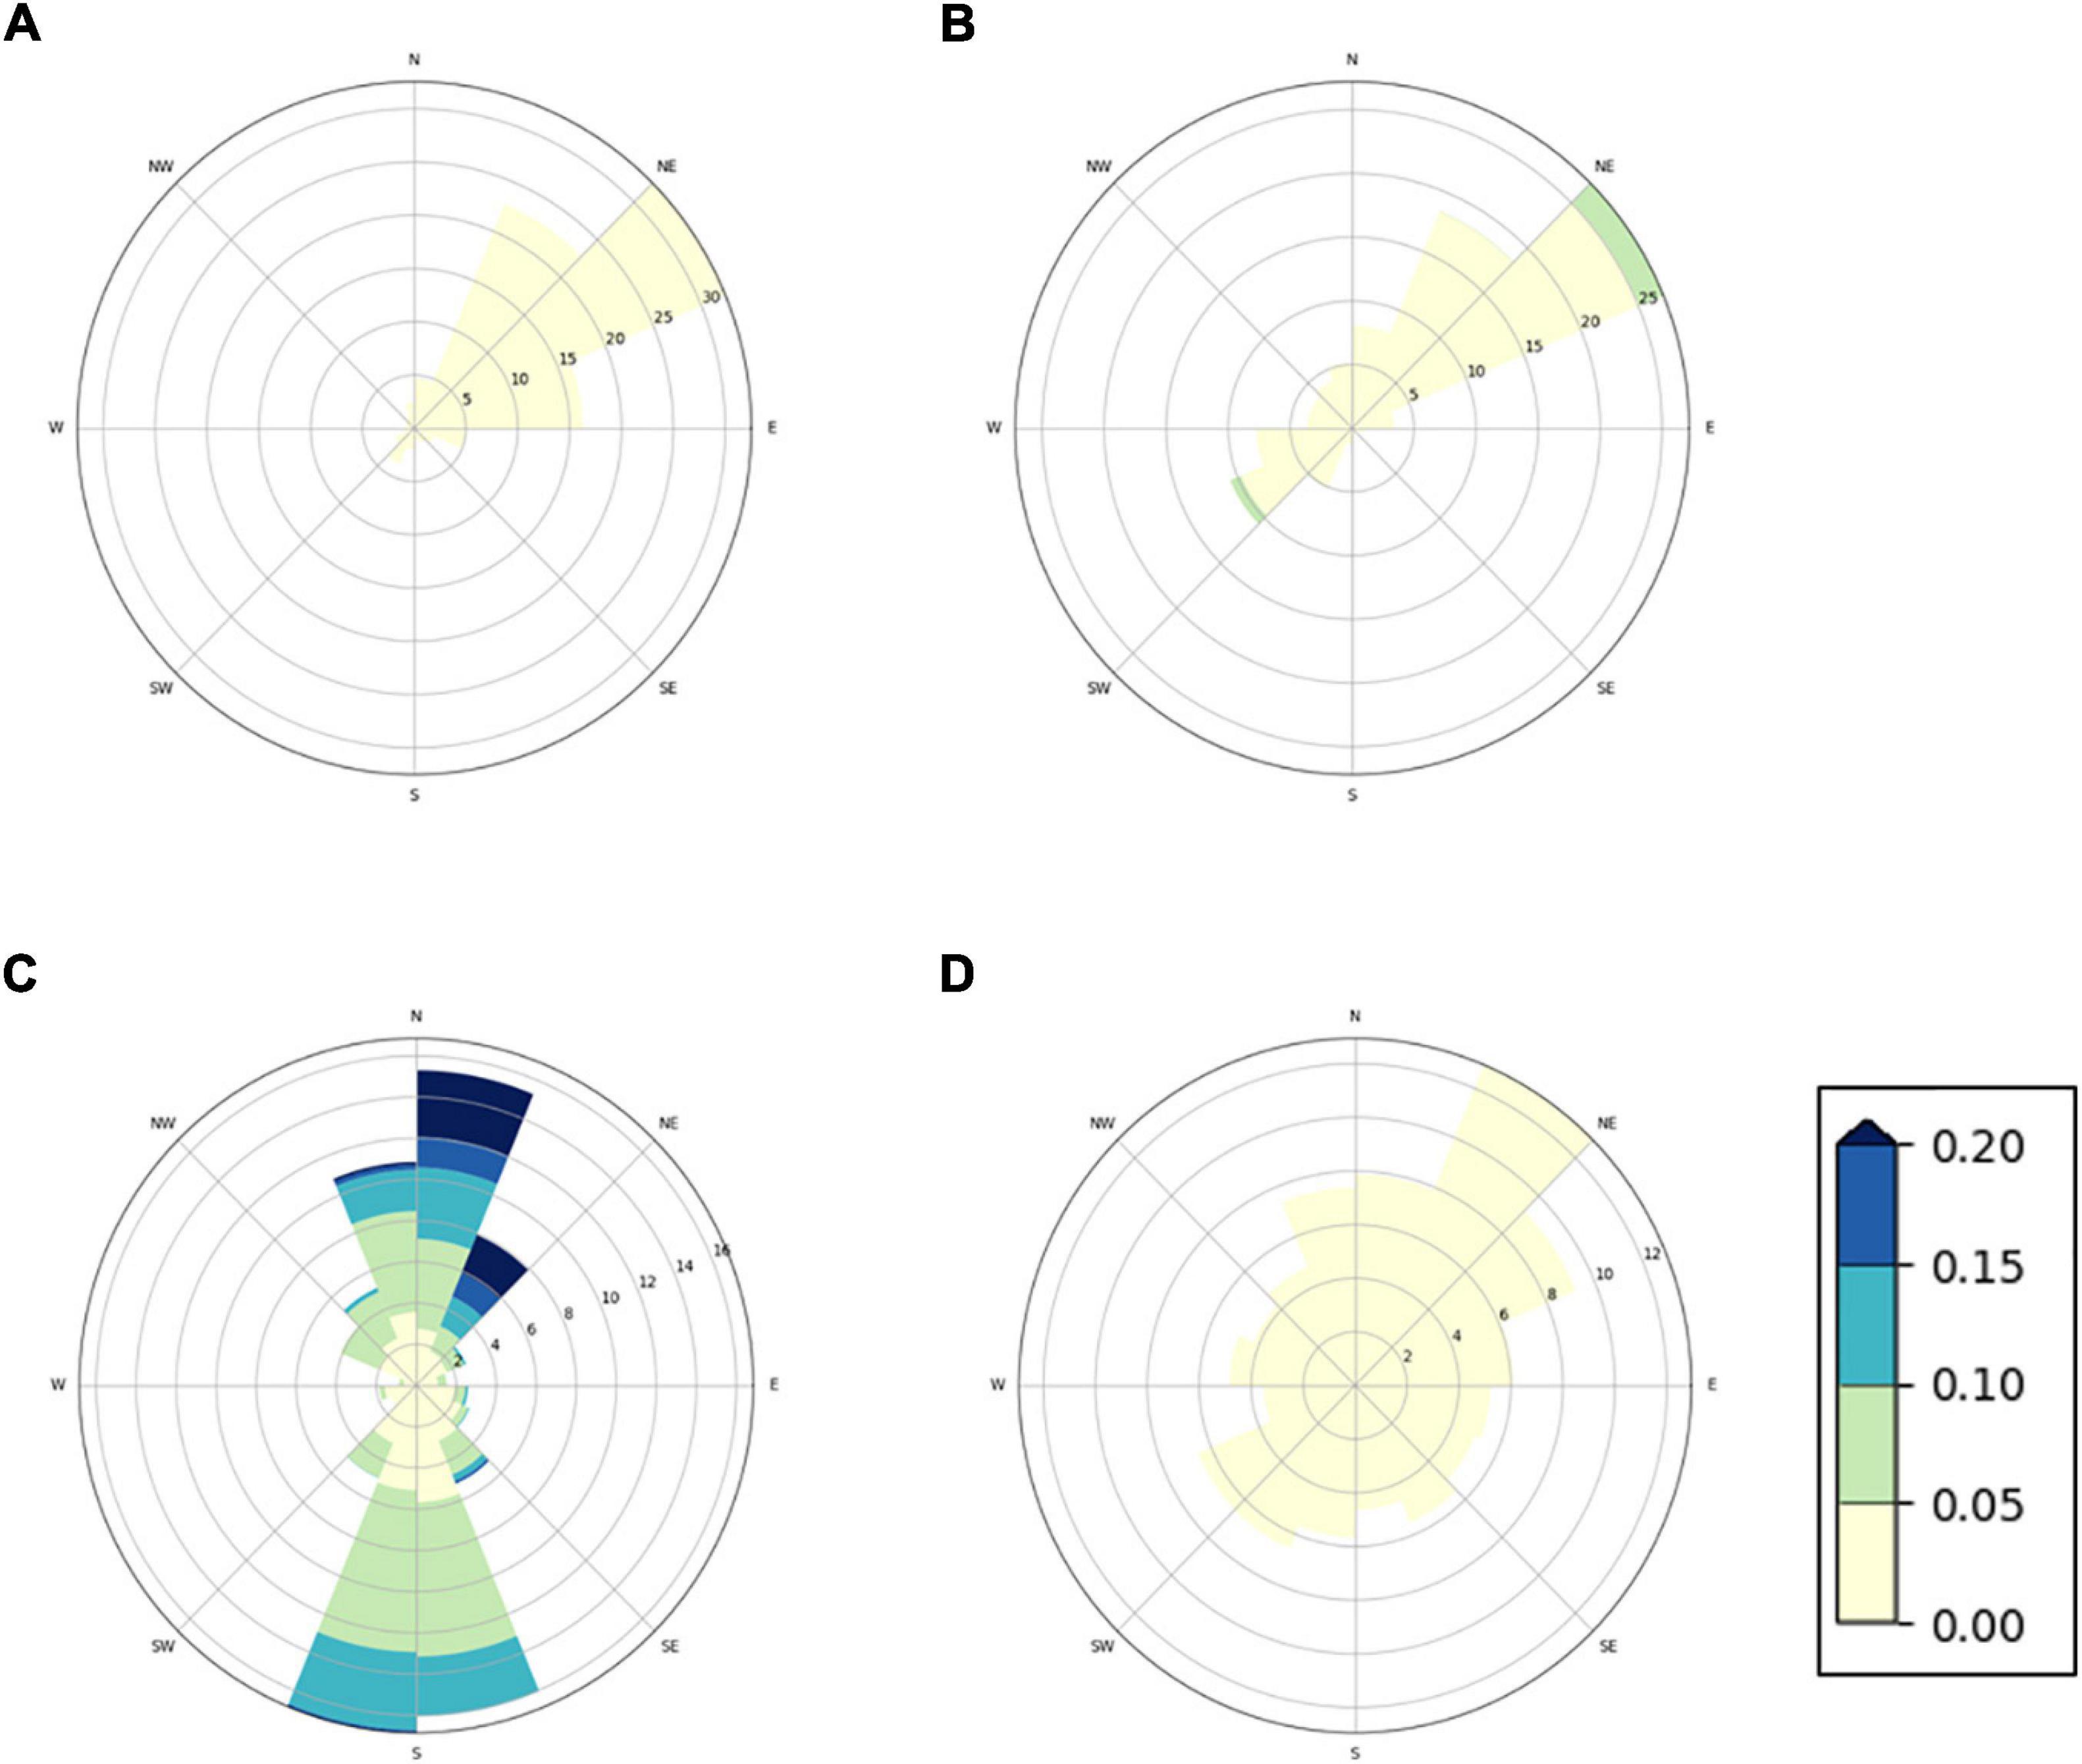
Figure 2. Current rose distribution plots showing velocity, frequency, and direction of ocean currents simulated at four Norwegian fish farms. Simulated ocean currents are shown for (A) Farm A, (B) Farm B, (C) Farm C, and (D) Farm D at a depth of 30 m. The coloured bands show the strength of the current (m/s).
Diflubenzuron and Teflubenzuron Levels in Sediments
Both diflubenzuron and teflubenzuron were detected in sediments at Farms A–D (Figure 3 and Supplementary Table 1). In total, diflubenzuron was detected above the LOQ in 76% of sediment samples, while teflubenzuron was detected above the LOQ in 92% of sediment samples. At all 10 sampling locations at the selected reference site, diflubenzuron and teflubenzuron levels were below the LOQ.
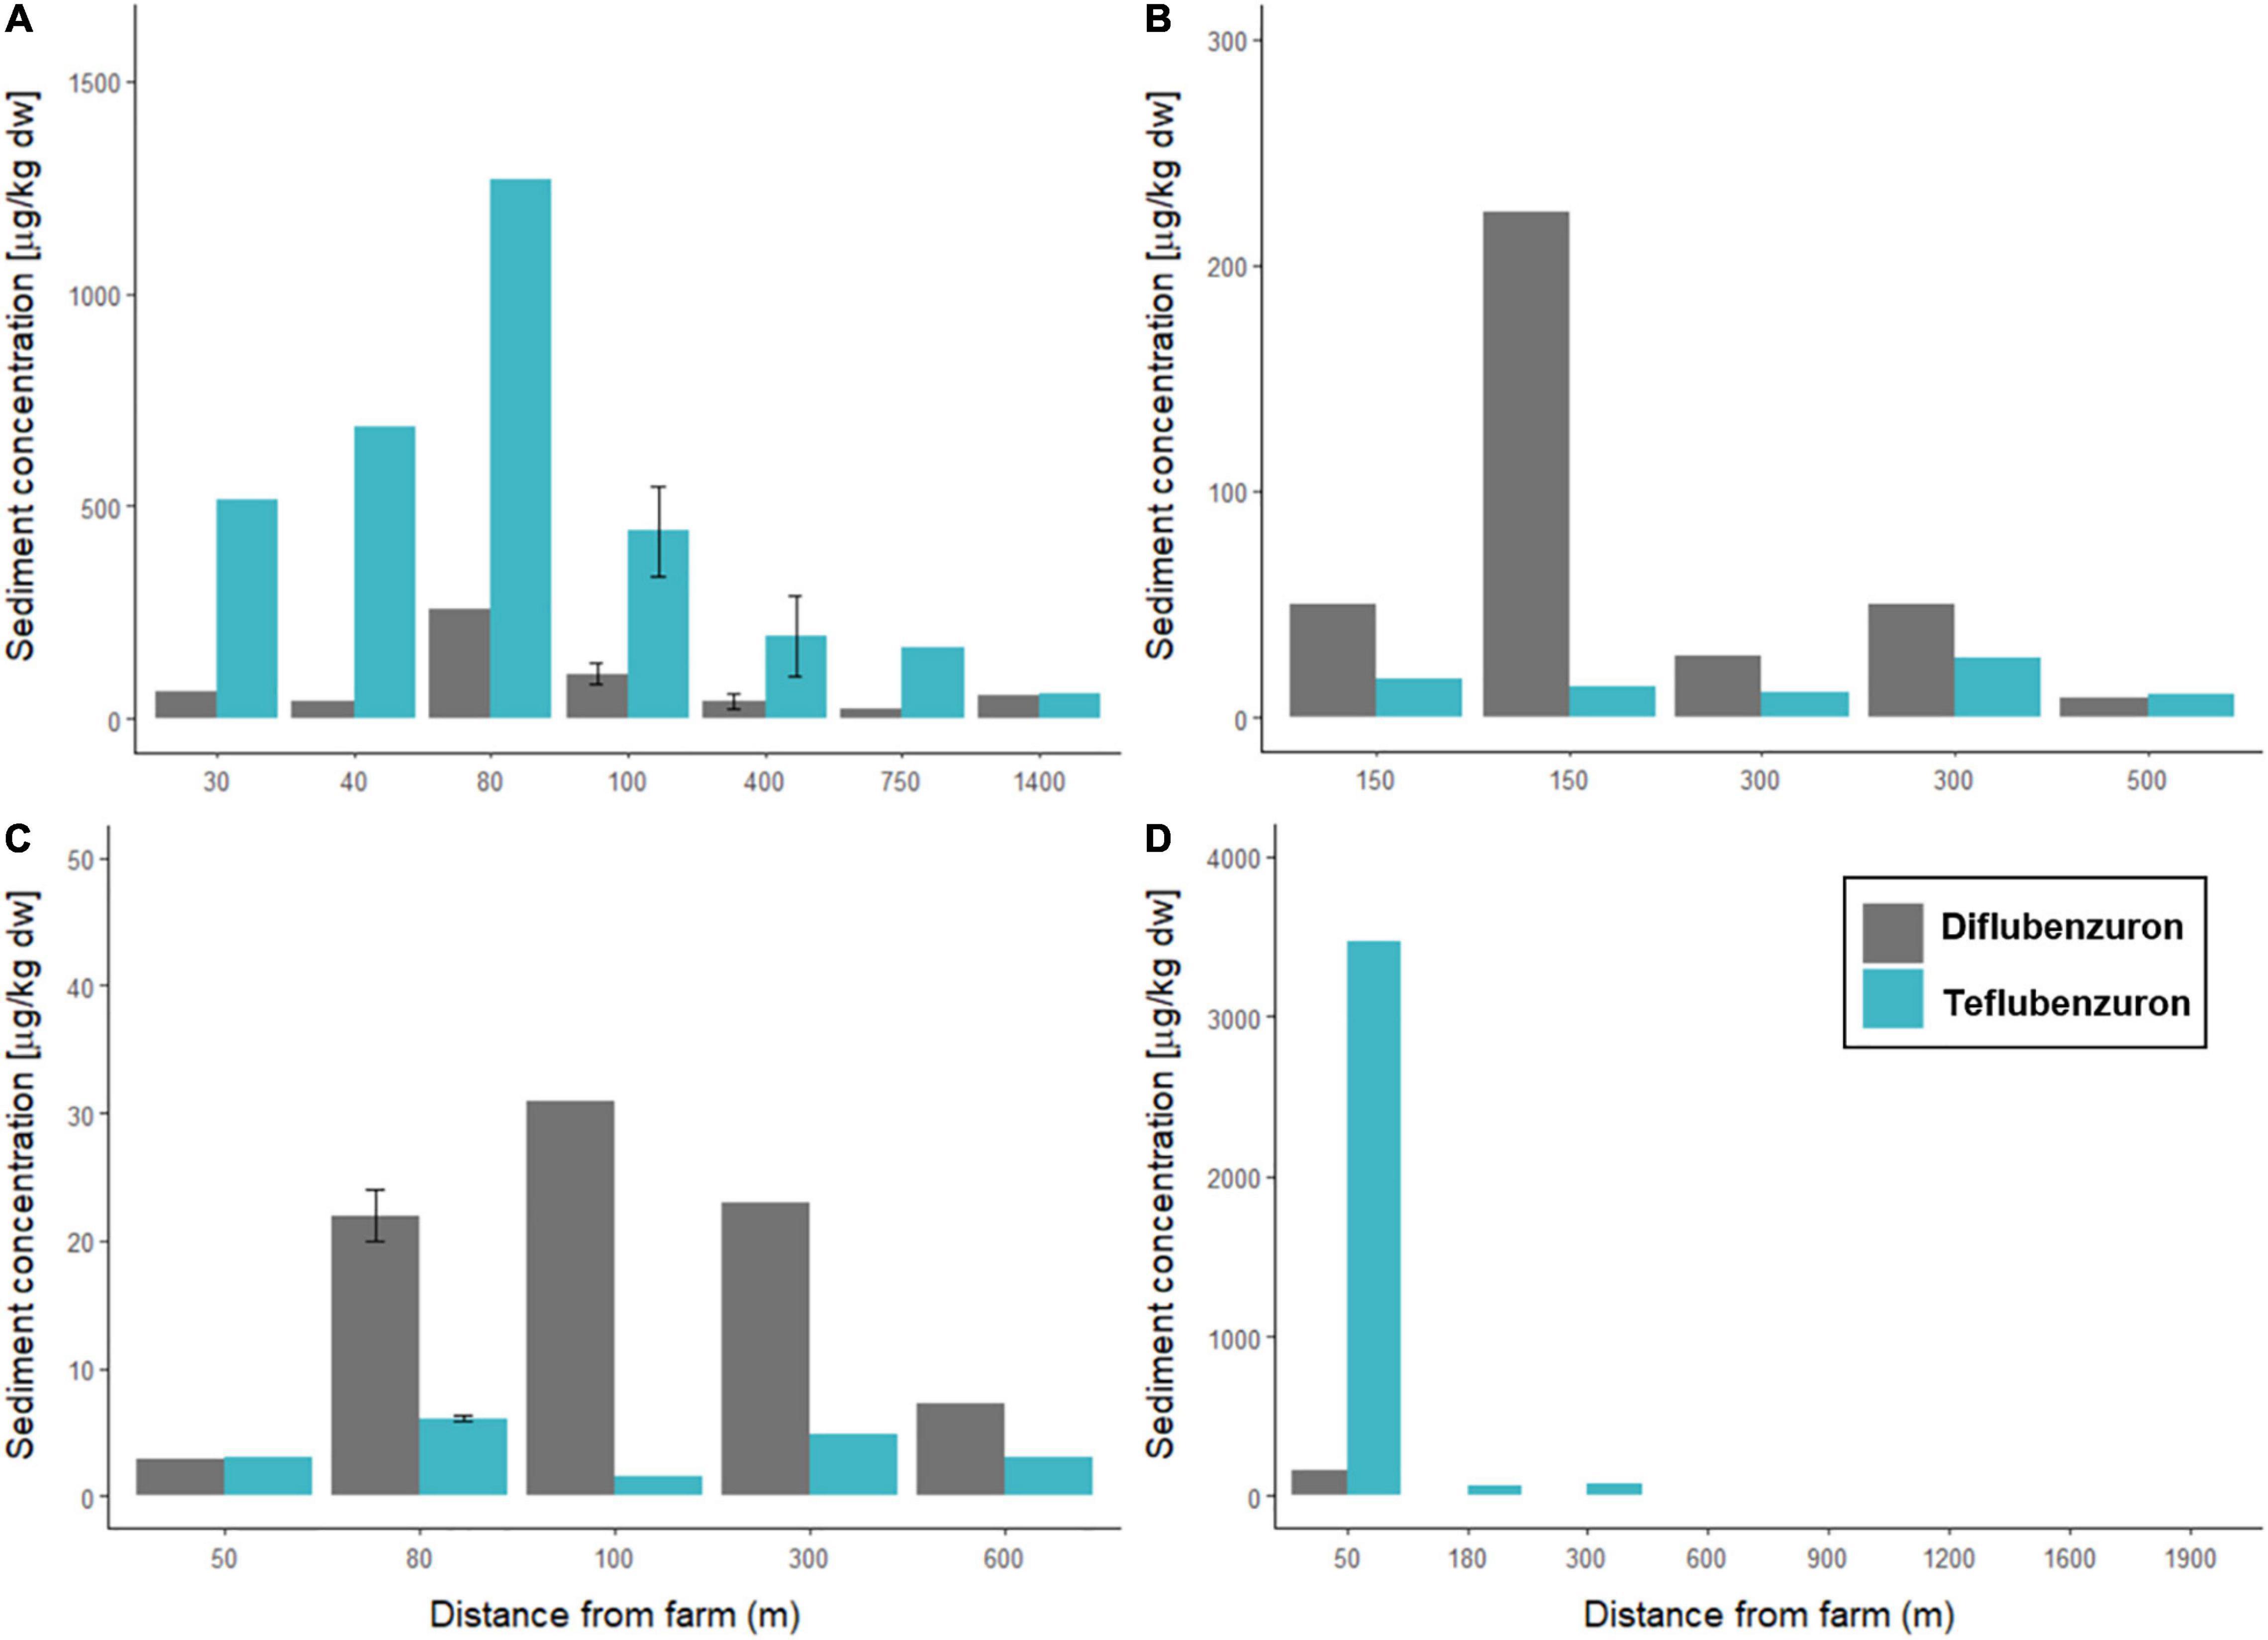
Figure 3. Concentrations of anti-sea lice insecticides measured in marine sediments sampled around four Norwegian fish farms. Diflubenzuron (grey) and teflubenzuron (light blue) levels (μg/kg dw) are shown for sediments sampled at varying distances (m) from (A) Farm A, (B) Farm B, (C) Farm C, and (D) Farm D.
At Farm A, the highest concentrations of diflubenzuron (257 μg/kg dw) and teflubenzuron (1271 μg/kg dw) were detected in sediments sampled at station A1, which was located 80 m northeast of the farm. The lowest concentrations of diflubenzuron and teflubenzuron (24 and 60 μg/kg dw) were detected at station A6 and A7, respectively, located approximately 750 and 1400 m southwest of the farm.
At Farm B, the highest (224 μg/kg dw) and lowest (8.3 μg/kg dw) concentrations of diflubenzuron were detected in sediments sampled at station B1 and B5, respectively, which were located approximately 150 m north and 500 m northwest of the farm. Teflubenzuron levels were relatively low in sediments sampled at all Farm B stations, ranging from 10 to 26 μg/kg dw, with the highest level detected at station B2, located 300 m northeast of the farm.
At Farm C, the highest diflubenzuron (31 μg/kg dw) and teflubenzuron (6.1 μg/kg dw) concentrations were detected in sediment sampled at stations C3 and C2, respectively, which were located 100 m south and 80 m east of the farm.
At Farm D, diflubenzuron was detected in sediments sampled at two of the eight sampling locations, at stations D1 and D2, located 50 and 180 m north of the farm. At station D1, the measured concentration of diflubenzuron in the sediment was 163 μg/kg dw, while at station D2 the measured concentration was substantially lower at 2.4 μg/kg dw. Teflubenzuron was detected in sediments from five of the eight sampling sites from Farm D. The teflubenzuron concentration in sediment sampled at station D1 was 3474 μg/kg dw, and concentrations decreased with increasing distance from the farm. At the two stations, furthest from the farm (D7 and D8), teflubenzuron levels were below the LOQ.
Diflubenzuron and Teflubenzuron Levels in Marine Benthic Biota
At Farm A, B, and C, the total number of individuals caught in the deployed traps were low, except for B. undatum. All traps deployed near Farm D were empty. Diflubenzuron and teflubenzuron were detected in 61 and 81% of individual biota samples, respectively, and residues were detected in all taxa (Figure 4). The measured concentration in biota at each location are provided in Supplementary Table 2.
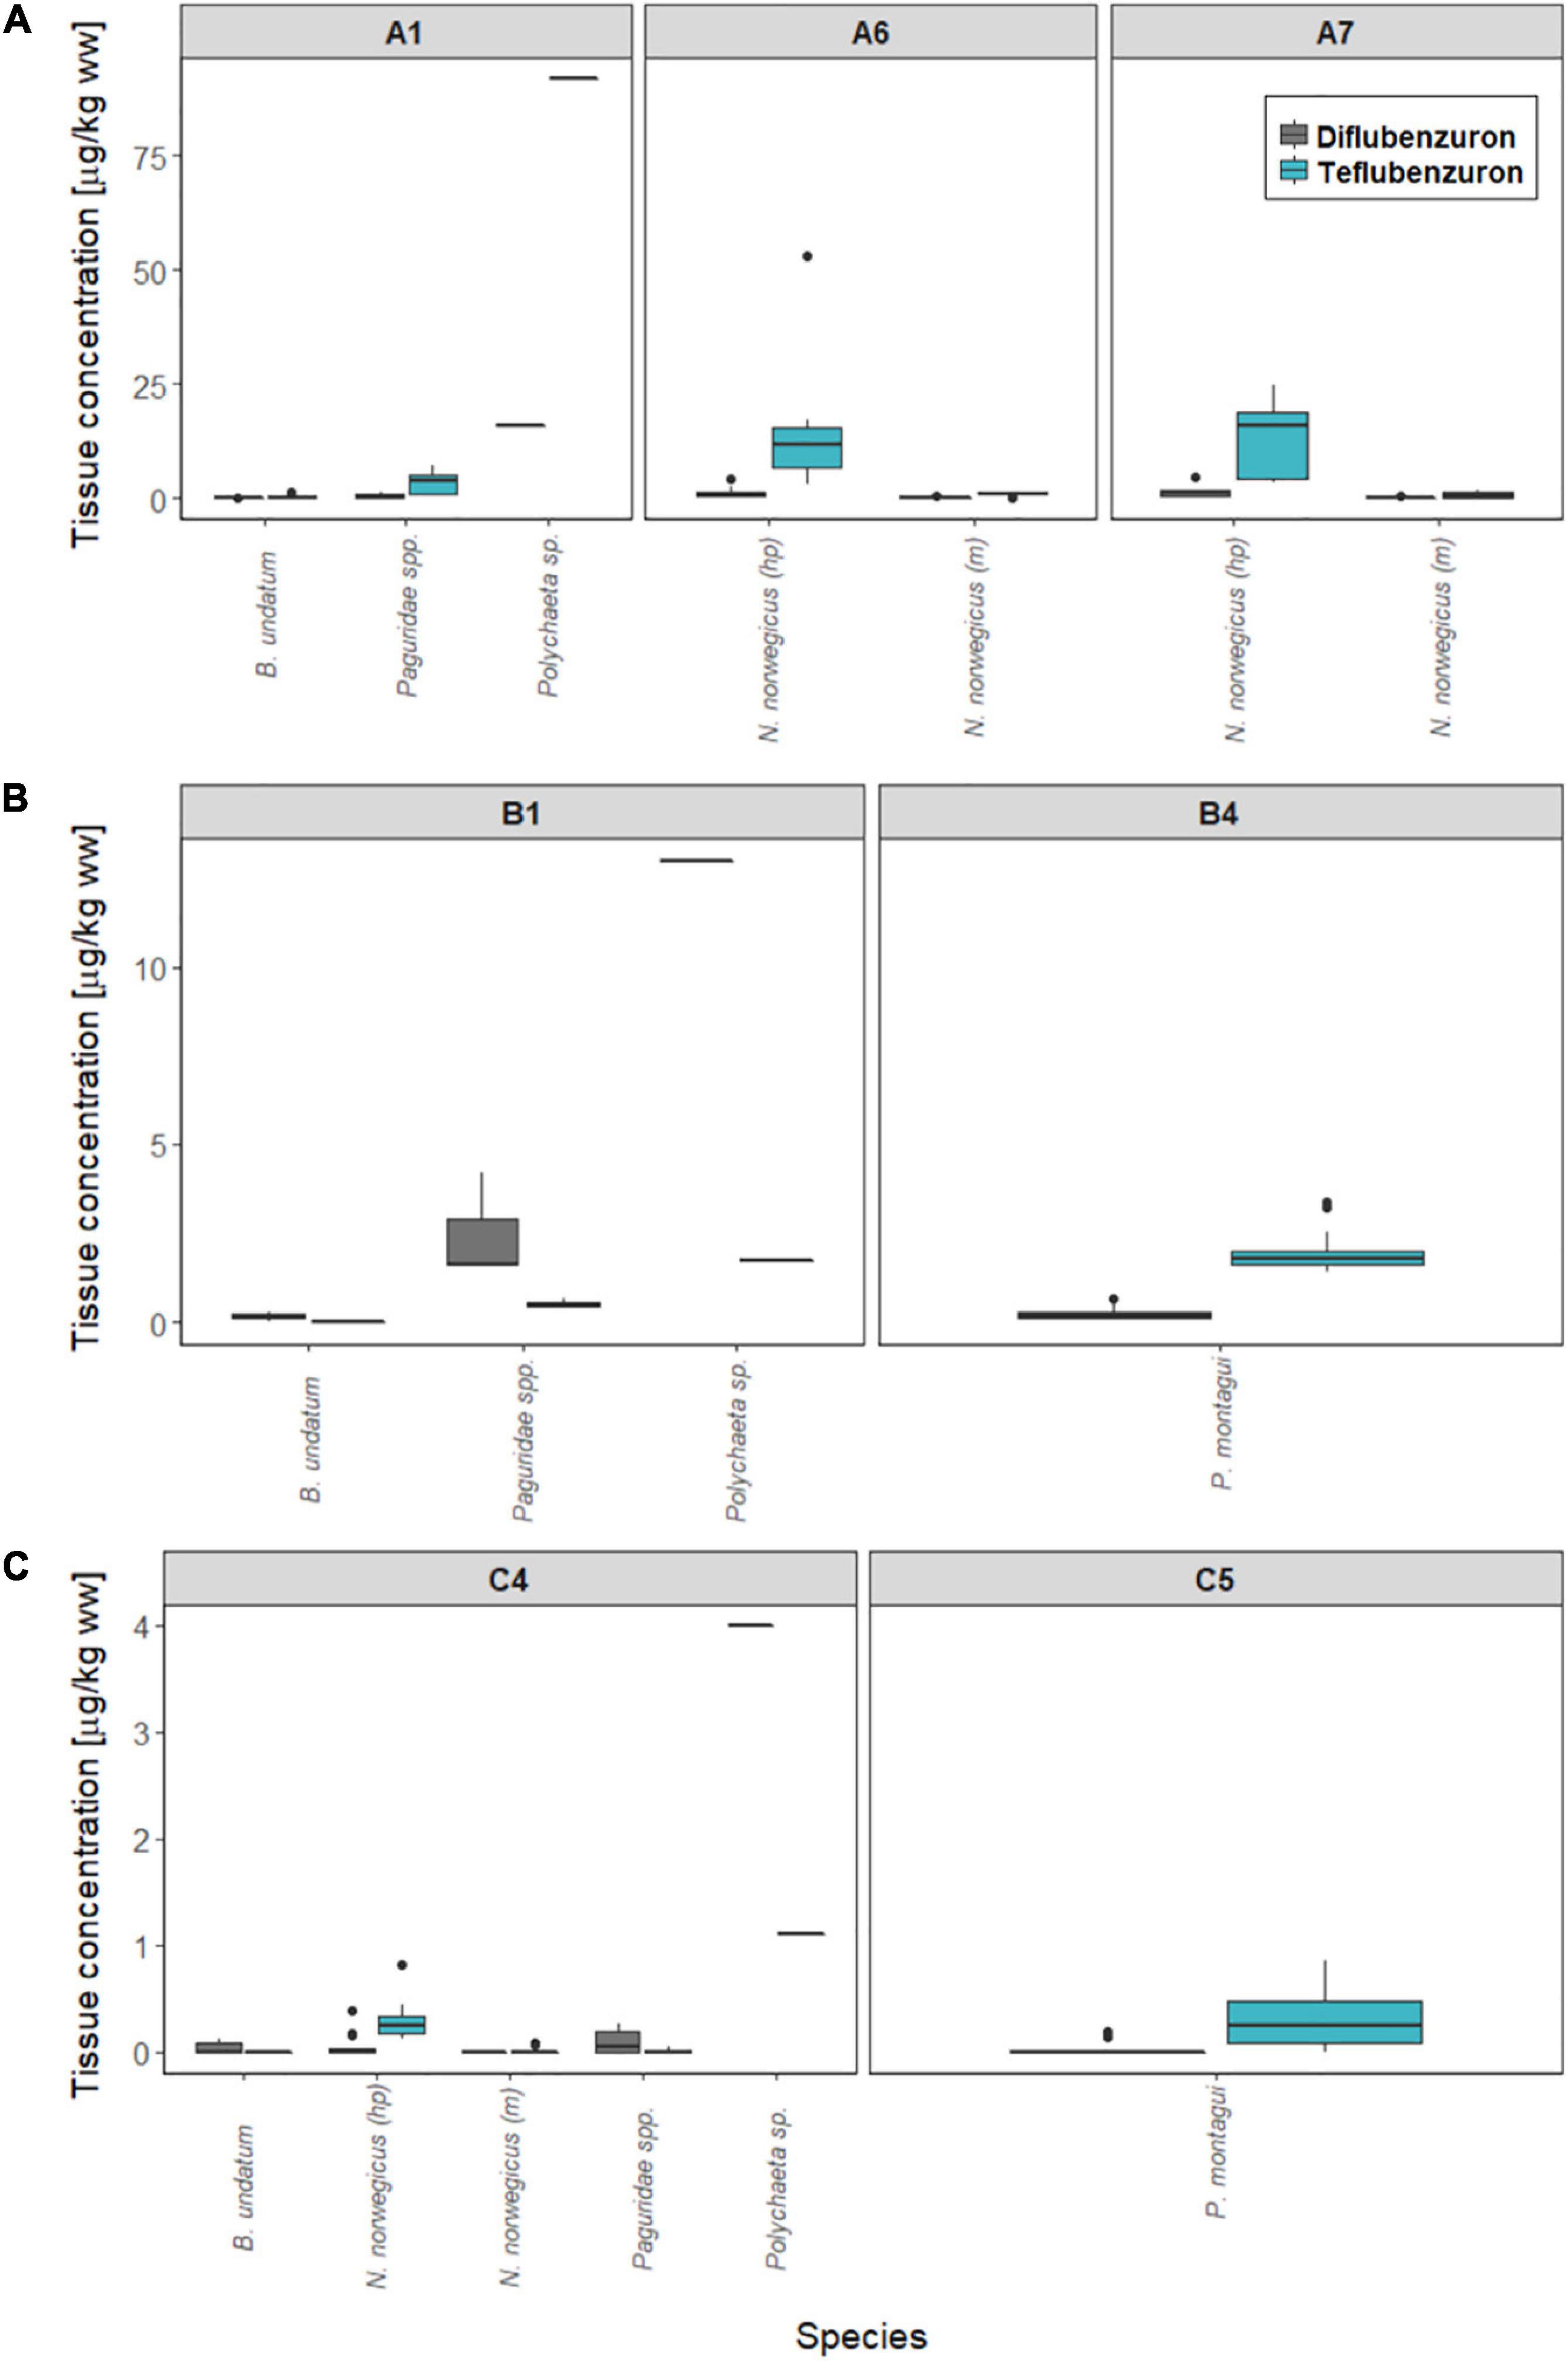
Figure 4. Concentrations of anti-sea lice insecticides measured in marine biota sampled around Norwegian fish farms. Diflubenzuron (grey) and teflubenzuron (light blue) levels (μg/kg ww) are shown for each sampling station at (A) Farm A, (B) Farm B, and (C) Farm C. hp, hepatopancreas tissue; m, muscle tissue.
B. undatum, Paguridae spp., and Polychaeta sp., were collected in traps deployed at locations close to the Farms A, B, and C (stations A1, B4, and C4). Diflubenzuron concentrations ranged from <LOQ-0.3 < LOQ-4.2 and 4–16 μg/kg ww in B. undatum, Paguridae spp., and Polychaeta sp., respectively, while teflubenzuron concentrations ranged from <LOQ-1.3, <LOQ-7.3, and 1.1–9.2 μg/kg ww. N. norvegicus were collected in traps deployed at stations A1 and C4, with diflubenzuron concentrations ranging from <LOQ-4.8 μg/kg ww (hepatopancreas) and <LOQ-0.6 μg/kg ww (muscle). Teflubenzuron concentrations in N. norvegicus samples ranged from <LOQ-53 μg/kg ww (hepatopancreas) and <LOQ-1.6 μg/kg ww (muscle). P. montagui were collected in traps at stations B4 and C5. Diflubenzuron and teflubenzuron concentrations ranged from <LOQ-0.7 and <LOQ-3.4 μg/kg ww, respectively.
Discussion
Diflubenzuron and Teflubenzuron Levels in Sediments
To date only a limited number of studies have examined the occurrence of the anti-sea lice insecticides, diflubenzuron, and teflubenzuron, in the marine environment near aquaculture facilities (Langford et al., 2014; Samuelsen et al., 2015). The results of the present study demonstrate a widespread detection of both diflubenzuron and teflubenzuron in sediments (76 and 92% of samples, respectively) several months after sea lice treatments had taken place on four Norwegian fish farms (Table 2). Previous laboratory studies have reported that both compounds are stable in the marine environment when associated to organic particles, with estimated half-lives of 100 and 170 days for diflubenzuron and teflubenzuron, respectively (Scottish Environmental Protection Agency [SEPA], 1999; Samuelsen et al., 2015; Samuelsen, 2016). Our results confirm the persistence of these chemotherapeutants in marine sediments beyond these half-life estimates, with both compounds detected 8–22 months after treatments took place.
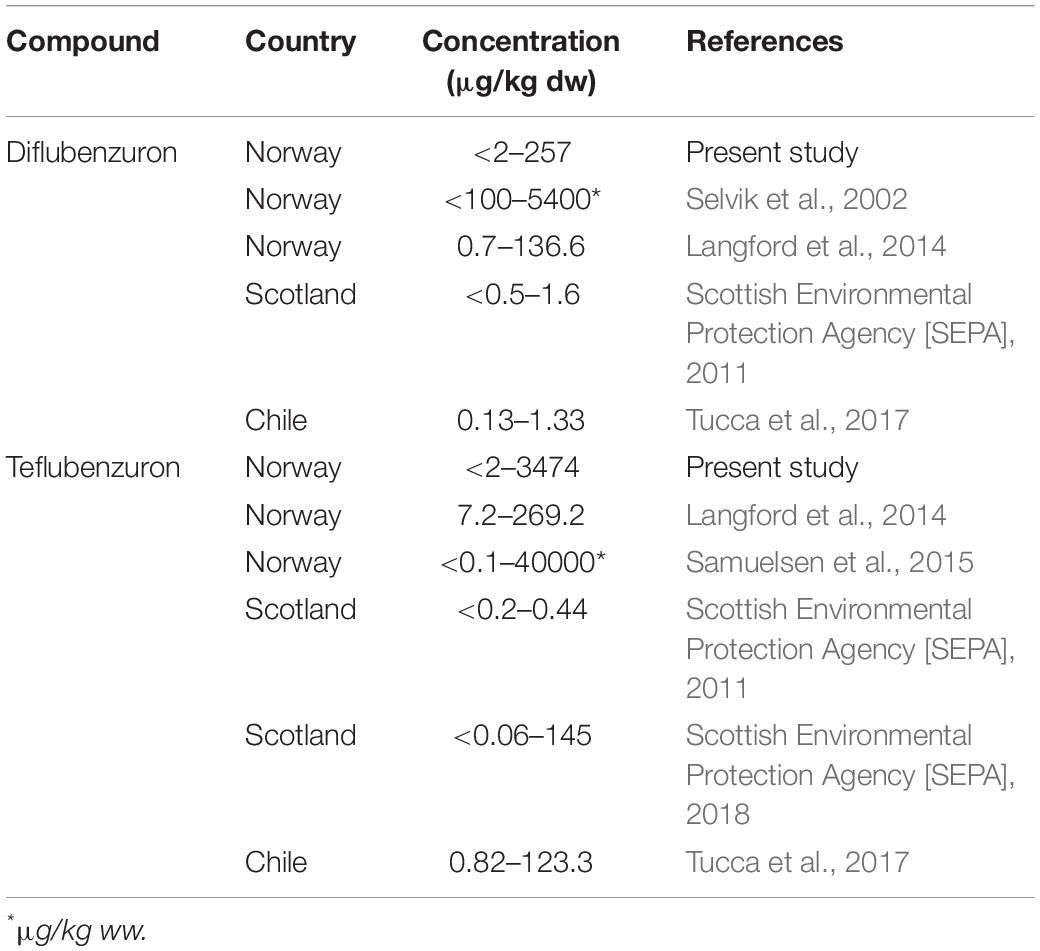
Table 2. Comparative ranges of anti-parasitic pesticide levels in marine sediments from other areas of the world with intensive salmon aquaculture activities.
Diflubenzuron and teflubenzuron concentrations varied considerably between the selected farms, with higher levels measured in sediments sampled near Farm A, Farm B, and Farm D compared to Farm C (Figure 3). These geographical variations may be related to the differential hydrodynamic conditions, the carbon content of the sediments and the treatment history for each of the farms (both quantity and the timing of the previous treatments). In the case of diflubenzuron, the higher levels measured in the sediments at Farm A and B are in line with the relatively high use of diflubenzuron on these farms prior to sampling (99 and 135 kg in total, respectively). In contrast, the low diflubenzuron levels measured in sediments from Farm C were inconsistent with the high quantity of diflubenzuron used on the farm (total of 174.6 kg), while the high diflubenzuron levels measured in sediments at Farm D were inconsistent with the relatively low quantity of diflubenzuron (total 12.8 kg) used. Previous modelling studies demonstrate that the area of the seabed impacted by farms are larger and more diffuse at sites with strong ocean currents (Giles et al., 2009; Keeley et al., 2013). This might explain the relatively low diflubenzuron levels measured in sediments around Farm C, which was located in a more exposed area of the fjord with the strongest ocean currents of the selected sites, according to the hydrodynamic model. Farm D on the other hand, was located in an unusually sheltered area of the fjord, with ocean currents estimated to be slow at the farm. These slower currents would therefore limit the dispersal of particulates from the farm and hence might explain the higher than expected sediment diflubenzuron concentrations at the sampling stations in this location.
Regarding teflubenzuron, the high levels measured in sediments from Farm A and D were generally in line with the quantity of teflubenzuron used on these farms (16 and 104 kg, respectively). It is, however, interesting to note that teflubenzuron levels were higher than diflubenzuron levels in sediments sampled at all locations around Farm A, despite a greater volume of diflubenzuron used on this farm prior to sampling. This may be a result of teflubenzuron being less soluble in water and significantly more hydrophobic than diflubenzuron (Marsella et al., 2000) and therefore the resuspension from sediments and subsequent dispersal of teflubenzuron in the water column is less likely to occur. Surprisingly, teflubenzuron was also detected in all sediments sampled near Farm B and Farm C, despite not having been used on these farms in the 4 years prior to sampling. Given the presence of other fish farms near Farms B and C, there is a possibility that contaminated particles may have been dispersed from these farms. Alternatively, the presence of teflubenzuron at these locations may be an indication that low levels of teflubenzuron have persisted in the sediments here for a substantial period (>4 years). Similar to our findings, a recent study reported detectable levels of teflubenzuron in marine sediments around three salmon marine cage fish farms in Shetland and Scotland approximately 4 years after they were last used on the farms (Bloodworth et al., 2019).
The dispersal of diflubenzuron and teflubenzuron into the marine environment around the selected farms in this study was substantial, with both compounds detected in sediments up to 1400, 500, and 600 m from Farm A, B, and C, respectively. At Farm D, the dispersal of diflubenzuron was less extensive and was not detected beyond 180 m, though teflubenzuron was detected up to 1200 m away from the farm. In line with our findings, recent hydrodynamic modelling studies used to predict near- and far-field dispersion effects of finfish aquaculture, reported that particles and organic waste may disperse as far as 2 km away from fjord located farms (Law et al., 2014; Bannister et al., 2016). In 2017, in response to a growing number of reports from fishers on declining abundance or disappearance of shrimp in their fishing grounds, the Norwegian Ministry of Trade, Industries and Fisheries introduced new regulations banning the use of diflubenzuron and teflubenzuron at sites located within 1000 m of shrimp fields (Nærings og fiskeridepartementet, 2016). Given the field evidence presented here, and the results of the aforementioned modelling studies, the current regulations may need to be reconsidered in the near future.
At Farm A and D, diflubenzuron and teflubenzuron concentrations were generally arranged along a gradient, with the highest concentrations observed nearer to the farms (within 50–100) and levels decreasing with increasing distances from the edge of the farm. This is likely a consequence of the slower ocean currents around these farms, indicating that much of the organic material released from these farms, and the pesticides associated with it, will be deposited close to the farms. Previous studies examining the dispersal of particulate organic material around non-dispersive fish farms, i.e., no strong ocean currents or direct influence from open ocean conditions, describe a clear organic enrichment gradient that is severely impacted directly beneath farms and this impact degrades gradually with increasing distance from farms (Kutti et al., 2007; Keeley et al., 2013).
Comparison With Sediment Levels in Other Regions
In general, diflubenzuron and teflubenzuron levels in marine sediments collected near Norwegian fish farms appear to be higher than those collected in other major aquaculture regions around the world (Table 2). Previous field studies conducted near several Norwegian fish farms reported similar or higher diflubenzuron and teflubenzuron levels to those reported here in marine sediments (Selvik et al., 2002; Langford et al., 2014; Samuelsen et al., 2015). In contrast, the concentrations of both compounds in marine sediments collected from aquaculture regions in Scotland and Chile, were approximately 10–100-fold lower than those measured in the present study (Scottish Environmental Protection Agency [SEPA], 2011; Tucca et al., 2017). This disparity may be a reflection of the fact that the salmon aquaculture industry in Norway is substantially larger than any of these other countries (Iversen et al., 2020), and consequently there is a greater need for using chemical anti-sea lice treatments.
Diflubenzuron and Teflubenzuron Levels in Marine Benthic Biota
Diflubenzuron and teflubenzuron were detected in a total of 61 and 81% of wild benthic macro fauna samples in the present study, respectively, with both compounds occurring in all species collected (Table 3). Given the low bioavailability and quick elimination of diflubenzuron and teflubenzuron in salmonids (European Medicines Evaluation Agency, 1999a, b) and European lobster (Homarus gammarus) juveniles (Samuelsen et al., 2014), our results suggest that benthic biota are continuously exposed to these compounds around aquaculture sites in Norway resulting in the widespread detection of these compounds in the organism sampled here. It appears that there are interspecific variations in the concentrations measured, with polychaeta sp., exhibiting a greater tendency to accumulate both diflubenzuron and teflubenzuron compared to B. undatum, Paguridae spp., N. norvegicus, and P. montagui (Figure 4). While these variations may be related to a number of factors including their different dietary routes, metabolic abilities and physiological activities, it is important to note that a sufficient number of polychaetes for chemical analysis were only found in the sediments closest to the Farms A, B, and C and therefore this may be a key underlying factor behind the observed differences. Many polychaete species burrow in sediments and/or consume organic waste from fish farms and this may also be a reason for the higher contaminant levels measured in polychaetes compared to the other epibenthic biota sampled. Interesting, lower levels of diflubenzuron and teflubenzuron were measured in B. undatum and Paguridae spp., despite being sampled at some of the most contaminated locations (A1, B1, and C4) and suggest that oral absorption of these compounds may be particularly low in these species or they are metabolised/eliminated very quickly. In addition, diflubenzuron and teflubenzuron may be associated to biological matrixes such as organic waste and prey species (e.g., polychaetes) that B. undatum and Paguridae do not utilise.
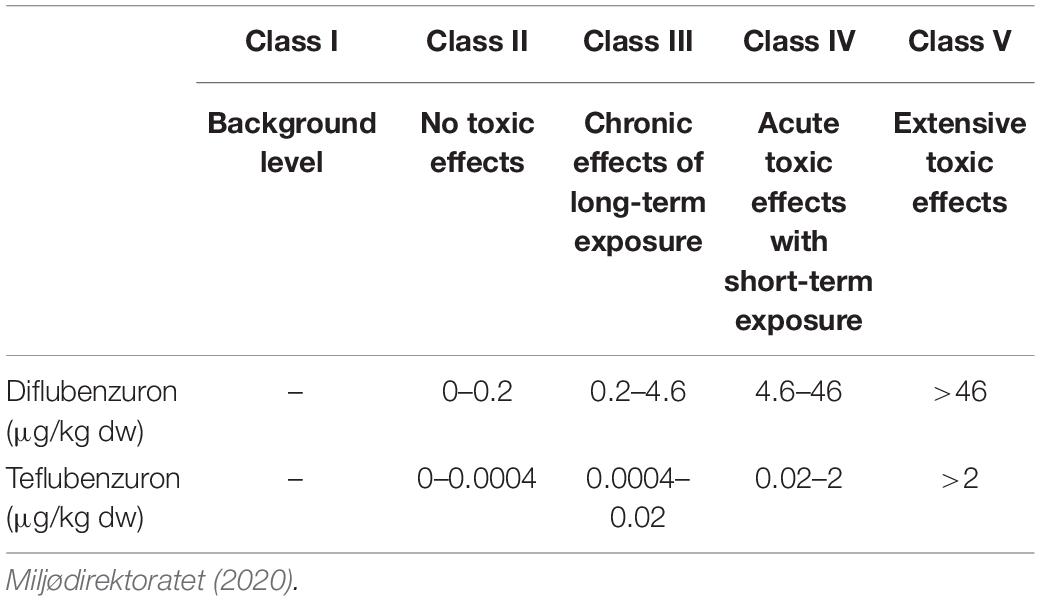
Table 3. EQS classification system for diflubenzuron and teflubenzuron in Norwegian sediments.
At Farms B and C, diflubenzuron levels were higher than teflubenzuron levels across most species’ groups, except for P. montagui and N. norvegicus. In contrast, teflubenzuron levels were higher than diflubenzuron levels in all biota from Farm A. The bioavailability of diflubenzuron in salmonids is greater than teflubenzuron (European Medicines Evaluation Agency, 1999a, b) and if this difference also applies for other organisms, along with the higher use and frequency of diflubenzuron treatments on Farms A, B, and C, it is reasonable to expect that diflubenzuron levels in biota would be higher than teflubenzuron levels. The discrepancy at Farm A, may be a consequence of the higher teflubenzuron levels present in the sediments at this farm.
Assessment of Measured Environmental Concentrations Relative to EQS’s
In 2020, the Norwegian Environment Agency revised EQS’s in water, sediments, and biota for a large number of chemical substances, including diflubenzuron and teflubenzuron (Miljødirektoratet, 2020). Here we compare the diflubenzuron and teflubenzuron levels measured in sediments and biota in the present study to the Norwegian EQS’s for both matrices (EQSsediment and EQSbiota). In addition, the teflubenzuron sediment concentrations from this study were also compared to the United Kingdom (UK) sediment EQS (Scottish Environmental Protection Agency [SEPA], 1999), which was often used to evaluate the risks associated with anti-parasitic compounds in the Norwegian marine environment prior to the establishment of the Norwegian EQS (Langford et al., 2014).
The sediment EQS’s for diflubenzuron and teflubenzuron in the Norwegian marine environment are 0.2 and 0.0004 μg/kg dw, respectively. In addition, a classification system was established grouping the sediment concentrations of both compounds into different classes, from background (class I) to very bad (class V), with each class limit representing an increasing degree of damage expected to impact communities of marine biota living in sediments (Table 3). A UK far-field sediment EQS of 2 μg/kg dw was established for areas located outside an allowable zone of effect (AZE) which extend beyond 25 m from fish farms (Scottish Environmental Protection Agency [SEPA], 1999). Where diflubenzuron and teflubenzuron concentrations were detected in sediments sampled in the present study, the measured levels were above the Norwegian EQSsediment. In contrast, the levels of teflubenzuron were above the UK EQSsediment in 84% of sediments. According to the Norwegian Environment Agency’s classification system, teflubenzuron levels in sediments at two locations (stations C3 and D6) fell into Class IV and therefore acute toxic effects in wildlife would be expected following short-term exposures. At 91% of locations, the measured concentrations of teflubenzuron in the sediments fell into Class V, and therefore extensive toxic effects are expected to occur in wildlife. Sediments at stations D7 and D8, where teflubenzuron concentrations were below the LOQ, could potentially fall into Class II, III, and IV, however, without more sensitive analytical assays available it is impossible to say whether wildlife at these sites are at risk of exposure to potential harmful teflubenzuron concentrations. In relation to diflubenzuron, 11% of sediments fell into Class III, 47% into Class VI and 42% into Class V. The sediments at locations D3–D8 may fall into either Class II or III, though again the LOQ would need to be substantially improved before this is known for certain. It is worth noting that limited toxicity data is available for both diflubenzuron and teflubenzuron in regards to marine species and consequently the EQSsediment were derived using a deterministic approach with an appropriate assessment factor (AF) applied to the lowest reliable toxicity data. In the case of teflubenzuron, the EQSsediment was derived from the 28 day NOEC (0.2 μg/kg) for the sediment dwelling estuarine amphipod (Corophium volutator) following a standard chronic-life cycle bioassay (Miljødirektoratet, 2015). However, as only two chronic toxicity studies were considered in the derivation of the sediment EQS for teflubenzuron an AF of 500 was applied. The availability of additional chronic toxicity data for a wide range of marine species is needed to facilitate the derivation of more robust diflubenzuron and teflubenzuron sediment EQS’s, for example, based on species sensitivity distribution (SSD) modelling.
The current diflubenzuron and teflubenzuron biota EQS’s address the protection goal of protecting human health against risk from the consumption of fish (EQSbiota, hh), however, there is no such value established for the consumption of crustaceans. The diflubenzuron and teflubenzuron levels measured here in two commercially important species, P. montagui (<LOQ-0.7 and <LOQ-3.4 μg/kg ww) and N. norvegicus (<LOQ-0.6 and <LOQ-1.6 μg/kg ww), were, however, substantially lower than the EQSbiota, hh of 730 and 610 μg/kg ww, respectively (Miljødirektoratet, 2018) and the maximum residue levels (MRL) permitted in the muscle tissue of salmonids (10 and 500 μg/kg ww, respectively) (European Medicines Evaluation Agency, 1999b; European Medicines Agency, 2020). While these findings suggest these compounds may not pose a risk to human health, it is important to note that a limited number of individuals were sampled in the present study and from a limited number of locations. Additionally, the biota in this study were collected 8–22 months after the last treatments had taken place on these farms and higher levels may occur in edible wild biota in the weeks immediately after treatments. Indeed, higher diflubenzuron and teflubenzuron concentrations were measured previously in shrimp (<0.5–10 and <0.2–11.3 μg/kg ww), blue mussels (<5–22.0 and <3–36.0 μg/kg ww), and brown crab (<1–537.9 and <1–185.7 μg/kg ww) from Norwegian fish farms 2–3 weeks post-treatment (Langford et al., 2014). A similar study also reported high concentrations of teflubenzuron in a number of species caught in the vicinity of a fish farm immediately after the medication was terminated. These included shrimp (<5–200 μg/kg ww), Norway lobster (<5–219 μg/kg ww), king crab (Lithodes maja) (854 μg/kg ww), and polychaetes (827–1248 μg/kg ww) (Samuelsen et al., 2015).
Our findings highlight that diflubenzuron and teflubenzuron are ubiquitous and highly persistent in the marine environment around Norwegian fish farms and are detected in sediments and biota sampled at far-field locations away from farms. While the insecticide levels detected in economically important species caught for human consumption are relatively low and may not pose a risk to human health, ecologically important species may be vulnerable. Our results demonstrate the need for further studies to assess the lethal and sub-lethal effects of diflubenzuron and teflubenzuron following environmentally relevant chronic exposures.
Data Availability Statement
The original contributions presented in the study are included in the article/Supplementary Material, further inquiries can be directed to the corresponding author.
Author Contributions
OS, VH, and AP contributed to the conception and design of the study. OS and VH collected the field samples. TT and RH performed the chemistry analysis of sediments and biota samples. IJ performed the ocean modelling. OS, AP, and IJ organised and plotted the data. OS and AP wrote the first draft of the manuscript. All authors contributed to manuscript revision, read, and approved the submitted version.
Funding
This study was financially supported by the Institute of Marine Research, Project 14907.
Conflict of Interest
The authors declare that the research was conducted in the absence of any commercial or financial relationships that could be construed as a potential conflict of interest.
Supplementary Material
The Supplementary Material for this article can be found online at: https://www.frontiersin.org/articles/10.3389/fmars.2021.694577/full#supplementary-material
References
Albretsen, J., Sperrevik, A. K., Staalstrøm, A., Sandvik, A. D., Vikebø, F., and Asplin, L. (2011). Norkyst-800 Rapport nr. 1: Brukermanual og tekniske beskrivelser. Fisken Og Havet. Bergen: Havforskningsinstituttet.
Bannister, R. J., Johnsen, I. A., Hansen, P. K., Kutti, T., and Asplin, L. (2016). Near- and far-field dispersal modelling of organic waste from Atlantic salmon aquaculture in fjord systems. ICES J. Mar. Sci. 73, 2408–2419. doi: 10.1093/icesjms/fsw027
Bechmann, R. K., Lyng, E., Westerlund, S., Bamber, S., Berry, M., Arnberg, M., et al. (2018). Early life stages of Northern Shrimp (Pandalus borealis) are sensitive to fish feed containing the anti-parasitic drug diflubenzuron. Aquat. Toxicol. 198, 82–91. doi: 10.1016/j.aquatox.2018.02.021
Bloodworth, J. W., Baptie, M. C., Preedy, K. F., and Best, J. (2019). Negative Effects of the sea lice therapeutant emamectin benzoate at low concentrations on benthic communities around scottish fish farms. Sci. Total Environ. 669, 91–102. doi: 10.1016/j.scitotenv.2019.02.430
Burka, J. F., Fast, M. D., and Revie, C. W. (2012). “Lepeophtheirus salmonis and caligus rogercresseyi,” in Fish Parasites – Pathobiology and Protection, eds P. T. K. Woo and K. Buchmann (Wallingford: Cabi).
European Medicines Agency (2020). European Public MRL Assessment Report (EPMAR)-Diflubenzuron (Salmonidae). Amsterdam: European Medicines Agency.
European Medicines Evaluation Agency (1999a). Diflubenzuron. Summary Report (2). Canary Wharf: European Medicines Evaluation Agency.
European Medicines Evaluation Agency (1999b). Teflubenzuron. Summary Report (2). Canary Wharf: European Medicines Evaluation Agency.
Fang, J. K. H., Schönberg, C. H. L., Kline, D. I., Hoegh-Guldberg, O., and Dove, S. (2013). Methods to quantify components of the excavating sponge Cliona orientalis Thiele, 1900. Mar. Ecol. 34, 193–206. doi: 10.1111/maec.12005
Felleskatalogen (2012). Releeze Vet. Available online at: https://www.felleskatalogen.no/medisin-vet/dyreeier/pil-releeze-vet-ewos-As-593855 (Accessed December 18, 2020).
Felleskatalogen (2018). Ektobann Vet. Available online at: https://www.felleskatalogen.no/medisin-vet/ektobann-vet-skretting-567611 (Accessed December 18, 2020).
Folkehelseinstituttet (2020). Legemidler I Fiskeoppdrett. Available online at: https://www.fhi.no/hn/legemiddelbruk/fisk/2020-bruk-av-legemidler-i-fiskeoppdrett/ (Accessed May 18, 2021).
Food and Agriculture Organization [FAO] (2020). The State of World Fisheries and Aquaculture 2020. Sustainability in Action. Rome: FAO.
Giles, H., Broekhuizen, N., Bryan, K. R., and Pilditch, C. A. (2009). Modelling The dispersal of biodeposits from mussel farms: the importance of simulating biodeposit erosion and decay. Aquaculture 291, 168–178. doi: 10.1016/j.aquaculture.2009.03.010
Grefsrud, E. S., Karlsen, Ø, Kvamme, B. O., Glover, K., Husa, V., Hansen, P. K., et al. (2021). Risikorapport Norsk Fiskeoppdrett 2021 - Kunnskapsstatus. Kunnskapsstatus Effekter Av Norsk Fiskeoppdrett. Rapport Fra Havforskningen. Norway: Havforskningsinstitittet.
Heiri, O., Lotter, A. F., and Lemcke, G. (2001). Loss on ignition as a method for estimating organic and carbonate content in sediments: reproducibility and comparability of results. J. Paleolimnol. 25, 101–110.
Iversen, A., Asche, F., Hermansen, Ø, and Nystøyl, R. (2020). Production cost and competitiveness in major salmon farming countries 2003–2018. Aquaculture 522:735089. doi: 10.1016/j.aquaculture.2020.735089
Keeley, N. B., Forrest, B. M., and Macleod, C. K. (2013). Novel observations of benthic enrichment in contrasting flow regimes with implications for marine farm monitoring and management. Mar. Pollut. Bull. 66, 105–116. doi: 10.1016/j.marpolbul.2012.10.024
Kutti, T., Ervik, A., and Hansen, P. K. (2007). Effects of organic effluents from a salmon farm on a fjord system. I. vertical export and dispersal processes. Aquaculture 262, 367–381. doi: 10.1016/j.aquaculture.2006.10.010
Langford, K. H., Øxnevad, S., Schøyen, M., and Thomas, K. V. (2014). Do antiparasitic medicines used in aquaculture pose a risk to the norwegian aquatic environment? Environ. Sci. Technol. 48, 7774–7780. doi: 10.1021/es5005329
Law, B. A., Hill, P. S., Maier, I., Milligan, T. G., and Page, F. (2014). Size, settling velocity and density of small suspended particles at an active salmon aquaculture site. Aquac. Environ. Interac. 6, 29–42. doi: 10.3354/aei00116
Liu, X., Steele, J. C., and Meng, X.-Z. (2017). Usage, residue, and human health risk of antibiotics in Chinese aquaculture: a review. Environ. Pollut. 223, 161–169. doi: 10.1016/j.envpol.2017.01.003
Marsella, A. M., Jaskolka, M., and Mabury, S. A. (2000). Aqueous solubilities, photolysis rates and partition coefficients of benzoylphenylurea insecticides. Pest Manag. Sci. 56, 789–794. doi: 10.1002/1526-4998(200009)56:9<789::aid-ps209>3.0.co;2-l
Merzendorfer, H. (2013). Chitin synthesis inhibitors: old molecules and new developments. Insect Sci. 20, 121–138. doi: 10.1111/j.1744-7917.2012.01535.x
Miljødirektoratet (2018). Klassifisering av miljøtilstand i vann. Økologisk Og kjemisk klassifiseringssystem for kystvann, grunnvann, innsjøer og elver. Norway: Miljødirektoratet.
Miljødirektoratet (2020). Grenseverdier for klassifisering av vann, sediment og biota-revidert 30.10.2020. Norway: Miljødirektoratet.
Nærings og fiskeridepartementet (2012). Forskrift om bekjempelse av lakselus i akvakulturanlegg. for-2012-12-05-1140. Norge: Nærings Og Fiskeridepartementet.
Nærings og fiskeridepartementet (2016). Strammer inn reglene for lusemiddelbruk. Norge: Nærings Og Fiskeridepartementet.
Olsvik, P. A., Samuelsen, O. B., Agnalt, A.-L., and Lunestad, B. T. (2015). Transcriptional responses to teflubenzuron exposure in European lobster (Homarus gammarus). Aquat. Toxicol. 167, 143–156. doi: 10.1016/j.aquatox.2015.07.008
Páez-Osuna, F. (2001). The environmental impact of shrimp aquaculture: a global perspective. Environ. Pollut. 112, 229–231. doi: 10.1016/s0269-7491(00)00111-1
Samuelsen, O. B. (2016). Persistence and stability of teflubenzuron and diflubenzuron when associated to organic particles in marine sediment. Bull. Environ. Contam. Toxicol. 96, 224–228. doi: 10.1007/s00128-015-1707-1
Samuelsen, O. B., Lunestad, B. T., Farestveit, E., Grefsrud, E. S., Hannisdal, R., Holmelid, B., et al. (2014). Mortality and deformities in European lobster (Homarus gammarus) juveniles exposed to the anti-parasitic drug teflubenzuron. Aquat. Toxicol. 149, 8–15. doi: 10.1016/j.aquatox.2014.01.019
Samuelsen, O. B., Lunestad, B. T., Hannisdal, R., Bannister, R., Olsen, S., Tjensvoll, T., et al. (2015). Distribution and persistence of the anti sea-lice drug teflubenzuron in wild fauna and sediments around a salmon farm, following a standard treatment. Sci. Total Environ. 508, 115–121. doi: 10.1016/j.scitotenv.2014.11.082
Samuelsen, O. B., Parsons, A. E., Agnalt, A. L., Tjensvoll, T., Lunestad, B. T., and Hannisdal, R. (2020). Mortality in the rockpool shrimp Palaemon elegans following long-term exposure to low doses of the anti-parasitic drug teflubenzuron. Aquac. Environ. Interact. 12, 23–29. doi: 10.3354/aei00343
Scottish Environmental Protection Agency [SEPA] (1999). Calicide (Teflubenzuron) - Authorisation for use as an Inffed Sea Lice Treatment in Marine Cage Salmon Farms. Risk Assessment, Eqs And Recommendations Policy No 29 Stirling: Scottish Environmental Protection Agency.
Scottish Environmental Protection Agency [SEPA] (2011). The Occurrence of Chemical Residues in Sediments in Loch Linnhe, Loch Ewe and Loch Nevis: Results of Surveillance Surveys 2009. Stirling: Scottish Environmental Protection Agency.
Scottish Environmental Protection Agency [SEPA] (2018). Fish Farm Survey Report-Evaluation of a New Seabed Monitoring Approach to Investigate the Impacts of Marine Cage Fish Farms. Available online at: https://consultation.sepa.org.uk/sector-plan/finfishaquaculture/supporting_documents/Fish%20Farm%20Survey%20Report.pdf
Selvik, A., Hansen, P. K., Ervik, A., and Samuelsen, O. B. (2002). The stability and persistence of diflubenzuron in marine sediments studied under laboratory conditions and the dispersion to the sediment under a fish farm following medication. Sci. Total Environ. 285, 237–245. doi: 10.1016/s0048-9697(01)00936-6
Tucca, F., Moya, H., Pozo, K., Borghini, F., Focardi, S., and Barra, R. (2017). Occurrence Of antiparasitic pesticides in sediments near salmon farms in the Northern Chilean Patagonia. Mar. Pollut. Bull. 115, 465–468. doi: 10.1016/j.marpolbul.2016.11.041
Keywords: teflubenzuron, aquaculture, salmonid, sustainable, biota, sea lice (Caligidae), diflubenzuron, sediment
Citation: Parsons AE, Samuelsen OB, Johnsen IA, Hannisdal R, Tjensvoll T and Husa V (2021) Distribution and Persistence of Diflubenzuron and Teflubenzuron in the Marine Environment Around Salmonid Aquaculture Facilities. Front. Mar. Sci. 8:694577. doi: 10.3389/fmars.2021.694577
Received: 13 April 2021; Accepted: 31 May 2021;
Published: 30 June 2021.
Edited by:
Jian Zhao, Ocean University of China, ChinaCopyright © 2021 Parsons, Samuelsen, Johnsen, Hannisdal, Tjensvoll and Husa. This is an open-access article distributed under the terms of the Creative Commons Attribution License (CC BY). The use, distribution or reproduction in other forums is permitted, provided the original author(s) and the copyright owner(s) are credited and that the original publication in this journal is cited, in accordance with accepted academic practice. No use, distribution or reproduction is permitted which does not comply with these terms.
*Correspondence: Ole B. Samuelsen, b2xlc0BoaS5ubw==