 Regina A. Guazzo1*
 Ian N. Durbach2
 Tyler A. Helble1
 Gabriela C. Alongi3
 Cameron R. Martin1
 Stephen W. Martin3
 E. Elizabeth Henderson1
- 1Naval Information Warfare Center Pacific, San Diego, CA, United States
- 2Centre for Research into Ecological and Environmental Modelling, School of Mathematics and Statistics, University of St Andrews, St Andrews, United Kingdom
- 3National Marine Mammal Foundation, San Diego, CA, United States
Male fin whales sing using 20 Hz pulses produced in regular patterns of inter-note intervals, but little is known about fin whale swimming behavior while they are singing. Even less is known about fin whales in Hawaiian waters because they have rarely been sighted during surveys and passive acoustic monitoring has been limited to sparse hydrophone systems that do not have localization capabilities. We hypothesized that fin whale kinematics may be related to their singing behavior, or external variables such as time and sea state. To investigate this hypothesis, we analyzed 115 tracks containing 50,034 unique notes generated from passive acoustic recordings on an array of 14 hydrophones from 2011 to 2017 at the U.S. Navy Pacific Missile Range Facility off Kauai, Hawaii. Fin whales swam at an average speed of 1.1 m/s over relatively direct paths. We incorporated the whales' speed and turning angle into hidden Markov models to identify different behavioral states based on the whales' movements. We found that fin whale kinematic behavioral state was related to the vocalization rate (also known as cue rate) and time of day. When cue rate was higher, fin whales were more likely to swim slower and turn more than when cue rate was lower. During the night, fin whales were also more likely to swim slower and turn more than during the day. In addition, we examined whether the presence of singing fin whales was related to time and sea state using generalized additive models. Fin whale track presence was affected by day of the year and song season, and possibly also wind speed and wave height. Although the track kinematics from the fin whale tracks presented here are limited to a subset of whales that are acoustically active, they provide some of the only detailed movements of fin whales in the region and can be compared against fin whale swim speeds in other regions. Understanding how fin whale swimming behavior varies based on their vocalization patterns, time, and environmental factors will help us to contextualize potential changes in whale behavior during Navy training and testing on the range.
1. Introduction
Fin whale (Balaenoptera physalus) song has been recorded in every ocean basin, but little is known about fin whale swimming behavior while they are singing. This song is made up of two different note types (referred to here as A and B notes) that are repeated in regular inter-note intervals (INIs) (e.g., Watkins, 1981; Thompson et al., 1992; Delarue et al., 2013; Širović et al., 2017; Helble et al., 2020). The notes, which are sometimes called 20 Hz pulses, are downswept with frequencies ranging from ~42 to 15 Hz and a duration of 1 s (Watkins et al., 1987; Thompson et al., 1992; Nieukirk et al., 2004). The B notes are more broadband than the A notes and have a higher peak frequency (Helble et al., 2020). Only male fin whales have been observed to sing and this song primarily occurs during winter months (Croll et al., 2002; Širović et al., 2013). Singing fin whale kinematics can contextualize the behavioral significance of different song patterns and can illuminate habitat use, possibly giving clues about seasonal migration patterns.
Fin whales have a streamlined body shape which allows them to be one of the fastest baleen whales (Whitehead and Carlson, 1988). Whaling records reported that fin whales had a maximum sustained speed of ~7.7 m/s (Kermack, 1948). Feeding (and possibly-feeding) fin whales have been observed swimming at average horizontal speeds of 1.4–3.3 m/s (Watkins et al., 1984; Whitehead and Carlson, 1988; Lafortuna et al., 2003). Singing (or at least, actively vocalizing) fin whales have been acoustically tracked in the Northeast Pacific and North Atlantic swimming at average speeds of 1.2–3.9 m/s (McDonald et al., 1995; Soule and Wilcock, 2013; Varga et al., 2018; Clark et al., 2019).
Fin whale swimming characteristics can vary with behavioral state. Fin whales in the Mediterranean Sea have been observed to have a bimodal swimming pattern. Either whales swam along approximately linear paths and moved faster, took fewer breaths, and spent less time at the surface or whales swam along non-linear, more convoluted paths (also described as area-restricted search behavior or ARS) (Lafortuna et al., 2003; Panigada et al., 2017). Whales swimming along linear tracks were hypothesized to be traveling, while those swimming along non-linear tracks were hypothesized to be foraging (Lafortuna et al., 2003; Panigada et al., 2017). In the Gulf of California, most fin whales tracked with satellite tags were described as displaying ARS behavior, swimming at slow speeds and turning often (Jiménez López et al., 2019). This behavior was observed year-round and was hypothesized to be a sign of feeding or socializing (Jiménez López et al., 2019). ARS behavior has also been observed in other baleen whale species [e.g., blue whales (Balaenoptera musculus) and humpback whales (Megaptera novaeangliae)]. ARS behavior has been interpretted as feeding behavior when these species are in known feeding areas, but may also be indicative of mating or social behavior in lower-latitude breeding areas (e.g., Bailey et al., 2009; Weinstein et al., 2017).
Fin whale swimming characteristics may also be related to vocalization behavior. Soule and Wilcock (2013) tracked whales acoustically in the Northeast Pacific and noticed that fin whale swimming speed varied according to their INIs. Whales singing with 25-s singlet INIs swam the slowest with average speeds of 0.8 m/s, while fin whales producing 20 Hz calls with no clear pattern (irregular INI) swam the fastest with average speeds of 1.6 m/s. The authors also observed that these fin whales swam along a straighter track when they were vocalizing at irregular INIs than when they were vocalizing at regular INIs. Clark et al. (2019) observed that as fin whales swam faster, they spent less time singing and their song durations decreased, leading the authors to hypothesize that swimming quickly while singing is energetically expensive and might be used as an honest signal of quality to potential mates.
Fin whales may vary their swimming behavior with time of day, although much previous research on diel patterns has focused on feeding fin whales. Fin whales seem to have longer dive durations during the day than at night, which may be due to the diel vertical migration of prey (Watkins et al., 1981, 1984; Keen et al., 2019). Fin whales spent the most time near the surface during spring and winter nights (Keen et al., 2019) and dove deeper and longer on foraging dives than non-foraging dives from spring to fall (Croll et al., 2001). Fin whales may sing and feed at different times of the day. Fin whales off western Greenland sang more at night when they were less likely to be able to feed efficiently because their prey would be more dispersed (Simon et al., 2010). More information is needed about how these previously documented behaviors, which were mostly measured during the summer months, compare to winter behavior for fin whales.
The acoustic cue rate (i.e., vocalization rate) produced by fin whales is an important metric needed for acoustic density estimation. The fin whales in Hawaiian waters are managed as their own stock under the Marine Mammal Protection Act and little is known about their population size and structure or their life history (Carretta et al., 2018). Since these whales are rarely visually observed (Barlow, 2006) but produce regular vocalizations (Helble et al., 2020), abundance estimation using passive acoustic monitoring methods would be advantageous. Harris et al. (2018) demonstrated that the density or abundance of fin whales can be calculated if the cue rate is known. Since cue rate may change with animal behavior (e.g., Watkins, 1981; Simon et al., 2010; Soule and Wilcock, 2013; Clark et al., 2019), gaining additional understanding of the relationship between whale swimming behavior and the cue rate is necessary for assessing the feasibility of using acoustic cues for fin whale density estimation.
The Pacific Missile Range Facility (PMRF) is a U.S. Navy training and testing area off the northwest coast of Kauai, Hawaii. Many different marine mammal species spend time around this range and swimming behavior has been quantified for some of these species using passive acoustic localization and tracking techniques. Minke whales (Balaenoptera acutorostrata) significantly changed their swimming behavior before, during, and after Navy mid-frequency active (MFA) sonar exposure (Durbach et al., 2021). Bryde's whales (Balaenoptera edeni) traveled along straight tracks parallel to conspecifics (Helble et al., 2016). Singing humpback whales are recorded and tracked during the winter months and displayed several distinct behavioral states with repeated stationary dives being the most common (Henderson et al., 2018). Comparing behavior between species of whales on PMRF will help us to understand habitat use at this important Navy training and testing area.
Helble et al. (2020) examined 115 acoustic fin whale tracks on PMRF from 2011 to 2017, containing 50,034 unique notes that were analyzed for song patterns. Here, we expand upon this work. We quantified the track kinematics for these same tracked whales and analyzed these kinematics across different song patterns. We examined this swimming behavior over daily and seasonal cycles and over the full 6.5 year study period to determine if fin whale behavior changed with time. We compared singing fin whale swimming behavior with fin whales observed in other ocean regions as well as with other species tracked on PMRF. This paper summarizes the swimming behavior of 115 singing fin whale encounters, classifies fin whale kinematic behavioral state, and compares behavior across different song patterns at PMRF.
2. Methods
2.1. Fin Whale Tracks and Song Patterns
A total of 115 unique fin whale tracks were recorded over 675 recording days at PMRF from January 2011 to July 2017 (recording effort shown in Figure 2 of Helble et al., 2020). Fourteen offshore hydrophones at PMRF (Figure 1) were grouped into four subarrays which consisted of a center hydrophone and four corner hydrophones. These hydrophones recorded continuously at either 96 or 6 kHz but all recordings were decimated to 6 kHz for consistency. Each track contained at least 100 fin whale 20 Hz notes, at least 50 of which were localized within the 20×60 km area of the array. A notes had an approximate median peak frequency of 16 Hz and a 3 dB bandwidth of 6 Hz and B notes had an approximate median peak frequency of 23 Hz with a 3 dB bandwidth of 13 Hz (Helble et al., 2020). The tracks analyzed for this study were the same as those described by Helble et al. (2020), so the tracking methods will not be detailed again here. Briefly, fin whale notes were detected on each hydrophone using the generalized power-law (GPL) detector (Helble et al., 2012). Templates of the detected notes were generated using 4,096-point fast Fourier transforms (FFTs) with a Hamming window and an overlap of 512 points. These templates were cross-correlated across hydrophones and time differences of arrivals (TDOAs) were calculated from the peaks of these cross-correlations. Fin whale notes were localized if they were detected on all five hydrophones in a subarray by comparing the measured TDOAs with theoretical TDOAs across the study area (Helble et al., 2015). A semi-automatic tracker (Klay et al., 2015) grouped localized fin whale notes into tracks based on realistic swimming and singing patterns for fin whales. Based on previous reports of time gaps between song bouts (e.g., Watkins et al., 1987), we did not allow distance or time gaps > 3 km and 40 min, respectively. These settings kept localizations grouped as a single track that were likely from an individual whale, while avoiding grouping localizations that were from separate whales. Each track was manually validated to ensure that it consisted of fin whale song notes and that the track positions appeared continuous. Notes were classified automatically as either A or B notes and manually verified. Song patterns were determined by measuring the INI between the starts of subsequent notes and classifying the note pairing as A-A, B-B, or A-B depending on the note types (Helble et al., 2020). Singlet song patterns had a single INI while doublet song patterns alternated between two INIs. The five song patterns observed were A-A singlet, A-A doublet, B-B singlet, B-B doublet, and A-B doublet (Helble et al., 2020).
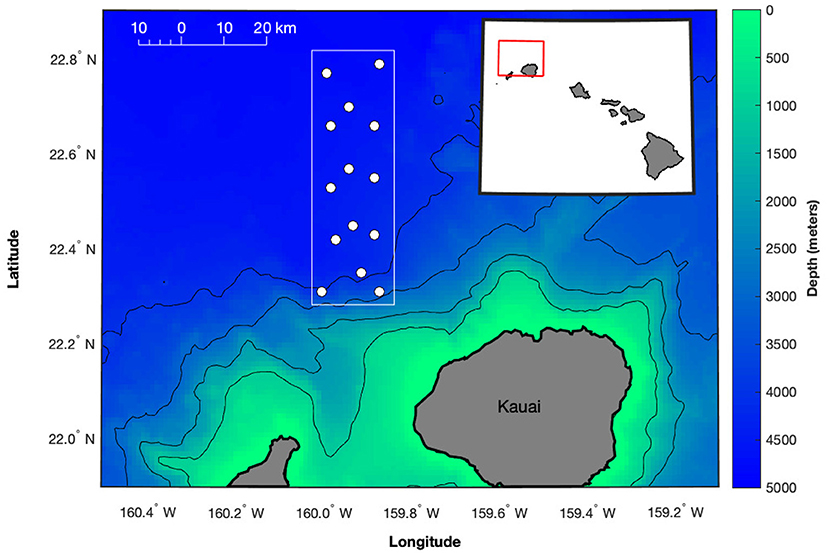
Figure 1. Map of the approximate locations of the 14 hydrophones (white circles) used in this study from the U.S. Navy Pacific Missile Range Facility (PMRF) off Kauai, Hawaii, as shown by the red box in the inset map. The hydrophone array covers an area ~20 km to the east-west and 60 km to the north-south (boundaries shown by white box). Depth contours are every 1,000 m (1 km spatial resolution, Hawaii Mapping Research Group, The School of Ocean and Earth Science and Technology, The University of Hawaii at Manoa, http://www.soest.hawaii.edu/hmrg/multibeam/bathymetry.php) with hydrophones at depths between 3,000 and 4,700 m. Aside from the southernmost 3 hydrophones, the rest of the array is in gently sloping deep water.
2.2. Track Smoothing and Metrics
To ensure that any spurious localizations did not skew the results, we first filtered localizations that would require the whale to swim faster than 8 m/s unless this localization was within 100 m of an adjacent localization. The 8 m/s cutoff was chosen based on the fastest measured sustained speed of fin whales of 7.7 m/s (Kermack, 1948). This filter was applied recursively 10 times and was an adaptation of the argosfilter R package (Freitas et al., 2008; Freitas, 2012). Because tracks were formed from passive acoustic localizations, whale locations were only calculated at the time of each vocalization. As a result, tracks were not sampled at a constant rate, which is required for hidden Markov model (HMM) analysis. We accounted for potential measurement error and generated tracks that were sampled every 5 min using the crawlWrap function of the R package momentuHMM (McClintock and Michelot, 2018), a wrapper for the continuous-time random walk model of Johnson et al. (2008). We assumed measurement errors with a standard deviation of 60 m in the x and y directions, which is the estimated localization accuracy at PMRF (Helble et al., 2015, 2020). We fit a single best-fitting track to these uncertain localizations, which can be thought of as averaging the localizations of multiple plausible realizations of each track (i.e., trajectories consistent with the observed localizations and known measurement errors). From these 115 smoothed tracks, we extracted speed and turning angle for each 5 min interval. These methods were similar to those used for minke whales by Durbach et al. (2021). The primary purpose of the crawl fitting was to have tracks that were evenly sampled in time, which is required for HMMs. Because the original localizations were both accurate and precise with few spurious points and sample rates were high (i.e., high cue rates), the tracks were of high quality with little ambiguity in the movement patterns.
Each 5 min interval was categorized into a behavioral state based on the whale's turning angle and speed in that interval. The number of states and the sampling interval were chosen based on prior knowledge of the fin whales in Hawaiian waters. We tested models with both 2 and 3 states. The 3-state model created two states out of the faster, more directed state. Ultimately the 2-state model was selected because it was more biologically informative and easier to interpret, which is the criteria given by DeRuiter et al. (2017) for selecting models to help understand past animal behavior as opposed to predict future trends. We also tested sampling intervals of 10 and 15 min. A sampling interval of 5 min was selected because the whales were producing an average of 131 notes/hour or ~11 notes in a 5 min interval (Helble et al., 2020). Smoothing those 11 localizations into a single localization helped reduce effects of measurement error, but larger sampling intervals overly smoothed the fine-scale detail of the swimming patterns. Smaller sampling intervals were not used for the HMM analysis to avoid auto-correlation between intervals.
Using these smoothed tracks, we calculated some track metrics to understand the general kinematic behavior of the singing fin whales. We calculated the mean speed for each track by averaging the speeds from each of the 5 min intervals. We also calculated the overall heading of each track by measuring the heading between the first and last points on each track. Finally, we measured the directivity index of each tracked whale by dividing the straight-line distance between the first and last points by the total distance summed over all the 5 min intervals. To calculate the straight-line distance and the heading, we approximated the shape of Earth with the WGS-84 reference ellipsoid (Decker, 1986). We also calculated track metrics on 1 min intervals to ensure that 5 min was not overly smoothing finer-scale movement, however, these shorter intervals were not carried forward in any of the modeling.
2.3. Relationships Between Swimming Behavior and Independent Variables
To assess factors that might influence fin whale swimming behavior, we used the Viterbi algorithm to group each 5 min interval into one of two behavioral states (Langrock et al., 2012; McClintock and Michelot, 2018). One state was defined by faster and more directed movement and the other state was defined by slower movement with more turns. We modeled the fin whale step length (distance covered in each 5 min interval) and turning angle as HMMs that were functions of variables that we hypothesized might influence fin whale swimming behavior (see Supplementary Material for R code). The step length was modeled as a gamma distribution with initial values of 60 m for State 1 and 350 m for State 2 with standard deviations of 30 and 75 m, respectively. The turning angle was modeled as a wrapped Cauchy distribution with initial values centered around 0° with a concentration parameter of 0.2 for State 1 and 0.7 for State 2 (where a concentration parameter of 0 would indicate random turning and 1 would indicate traveling in a straight line; Bacheler et al., 2019). The results presented were not sensitive to initial value selection. Values were selected based on the observed distribution of the step length and turning angle but we tested initial values ±25% and the best models did not change.
We hypothesized that fin whales might change their swimming behavior when they were singing different song patterns, at different times, and during different sea states (Table 1). To test the effect of song pattern, we modeled transitions between kinematic behavioral state as a function of the number of A notes and B notes in the last 5 min, the total number of notes in the last 5 min (cue rate), the dominant song pattern in the last 15 min, and the dominant note pairing in the last 15 min. The INI pattern within a song can be bimodal and whales also include longer gaps in their song pattern, which are not incorporated into INI (Helble et al., 2020). For these reasons, we did not include INI explicitly in our kinematic models, but INI is related to the number of notes as well as the song pattern. The dominant song pattern and the dominant note pairing were both determined over longer windows than the step size in order to have a larger sample size of notes required to accurately assign that 5 min time interval to the appropriate note pairing and song pattern. With these longer windows, we expect that our ability to detect a change in song pattern would be delayed and song pattern changes that were not sustained would not be captured, and so the longer windows will result in more conservative relationships between swimming behavior and song pattern. Window lengths of more than 15 min included previous song patterns that were no longer relevant to the swimming behavior in the current time interval.
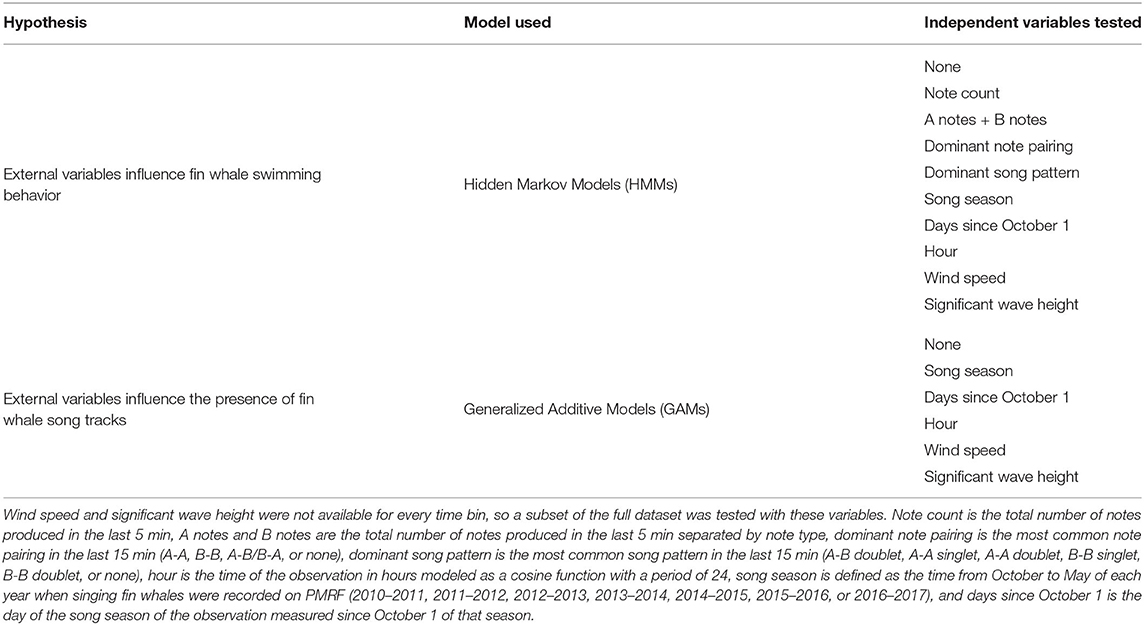
Table 1. Summary of the hypotheses tested, the models used for each type of test, and the independent variables tested.
To test the effect of time, we modeled transition probabilities between kinematic behavioral states as a function of hour of the day (circular function employing sine and cosine terms), day measured since October 1 of that song season and resetting each song season, and song season which is defined as the time from October to May of each year when singing fin whales are recorded on PMRF.
To test the effect of sea state, we modeled transitions between kinematic behavioral states as a function of wind speed or significant wave height. Since wind speed and wave height are not independent, they were tested separately to determine if one was better than the other at modeling whale swimming behavior. Wind speed was modeled with a 6 km spatial grid over the range area every hour from October to May 2012–2017 as in Li et al. (2016) and was averaged over the range area for use in the model. Significant wave height data were furnished by the Coastal Data Information Program (CDIP), Integrative Oceanography Division, operated by the Scripps Institution of Oceanography (https://doi.org/10.18437/C7WC72). These wave height measurements were collected every 30 min starting in October 2013 at CDIP station 202 (22° 17.078' N, 159° 34.438' W), which is about 30 km east of the southeast corner of the PMRF hydrophone array. The significant wave heights were calculated for waves with periods less than or equal to 10 s (to estimate “seas” originating from local storms in contrast to “swell” originating from distant storms) and were estimated as 4 times the square-root of the total energy. The wind and wave data were not collected on the same 5 min intervals used for the fin whale tracks, so the closest wind speed and wave height were assigned to each time step. If no environmental measurement was available within 24 h of the interval time, then that time step was not used for the environmental models. Wind speed only had data gaps greater than 24 h in between song seasons and significant wave height had data gaps >24 h between July and October 2014 (no tracks), October 2014 and March 2015 (48 tracks), and March 2016 and October 2016 (no tracks). Only the wave data gap between October 2014 and March 2015 was during the peak of a song season. Using this 24-h cut-off might not capture changes along an individual track with the environment, but this choice was a trade-off between having sufficient data and capturing changes that might be due to the environment.
The Akaike information criterion (AIC) (Akaike, 1974) was used to rank the models and the variables from the best models were also tested as combinations of each other within the same models.
2.4. Variables That Influence the Presence of Tracks
We also hypothesized that time and environmental variables influenced whether a fin whale song track was present (i.e., whether a fin whale was singing; Table 1). Times with recordings but no fin whale tracks could be due to fin whales being present and not singing or fin whales being absent from the area. To test this hypothesis, we used generalized additive models (GAMs; Hastie and Tibshirani, 1990) and modeled the track presence in a given 3-h time bin as the response variable, a sum of non-linear functions of the time and environmental predictor variables. We used the R GAM package “mgcv” with gamma = 1.4 to avoid over-fitting (Wood, 2017). The presence of fin whale acoustic tracks was modeled with a binomial distribution and logit-link function [ln(μ/(1−μ)] where μ is the probability that a track was present). The predictor variables included hour of the day and days since October 1 which were modeled with cyclic basis functions, song season which was modeled as a categorical fixed effect, and wind speed and significant wave height which were modeled with cubic regression functions. Wind speed and wave height were each also modeled as interacting with days since October 1 using tensor product smooths to test if presence of whale tracks was affected by these environmental variables in combination with days since October 1 instead of just a simple additive relationship between the variables (see Supplementary Material for R code). We hypothesized that the time of the year might be more appropriately modeled as an interaction with waves and wind because large storms tend to pass through Hawaii in the winter. We chose a time bin of 3 h to model the presence or absence of fin whale tracks, which is the approximate average length of the tracks, but we also tested bins of 1 and 6 h and results were similar. The time bins for modeling the presence of fin whales had to be long enough that observations were not autocorrelated across time bins.
HMM and GAM analyses for this study were conducted in R (v 4.0.3, R Core Team, 2020).
3. Results
The 115 fin whale tracks identified by Helble et al. (2020) occurring between January 2011 and March 2017 were analyzed to quantify the swimming behavior of singing fin whales and determine whether this behavior was related to external variables. The smoothed tracks fit the original tracks well and correctly eliminated false localizations (Figure 2). Each 5 min bin was categorized into one of two states. When whales were in State 1, they traveled at a slower speed and turned more often and when whales were in State 2, they traveled along a faster and more direct path.
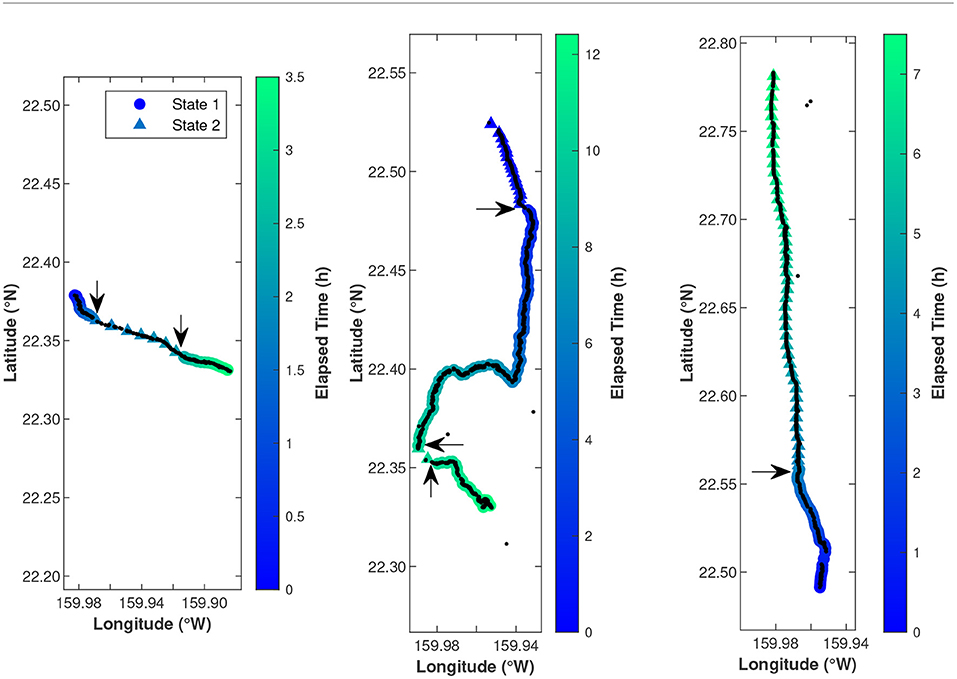
Figure 2. These three example fin whale tracks show one black dot at the location of every localized note. Colored circles and triangles show the estimated whale locations on 5-min intervals with circles representing the slower, less directed State 1 and triangles representing the faster, more directed State 2. The states were determined by hidden Markov models. Arrows indicate the locations of state changes. A few spurious localizations can be seen in black, but were eliminated from tracks during the CRAWL track smoothing process. Color indicates time since the start of the track. Note that the elapsed time is different for each track. The latitude ticks are every 0.05° and the longitude ticks are every 0.02°. From left to right, these tracks started at 13 January 2012 07:11 UTC and transited 11.5 km, 24 January 2015 06:09 UTC and transited 27.6 km, and 20 March 2015 12:15 UTC and transited 32.5 km. These are the same tracks plotted in Figures 5 and 8 of Helble et al. (2020).
Overall, singing fin whales on PMRF traveled along a fairly direct path with little turning (Figure 3). The whales favored traveling toward the west while they were singing (the majority of tracks had headings between 180° and 360°). The mean of the mean track speeds was 1.1 m/s with a standard deviation of 0.48 m/s. The median directivity index was 0.8 and the mode was between 0.9 and 1 (data bin width of 0.1 units, see histogram in Figure 3). In addition to the 5 min crawlWrap function interval reported here, we also calculated these values for 1 min intervals and the values were not sensitive to the interval selected. Speed, heading, and directivity index showed no apparent trends over days since October 1, but the relationship between whale swimming behavior and time was analyzed further with the HMMs.
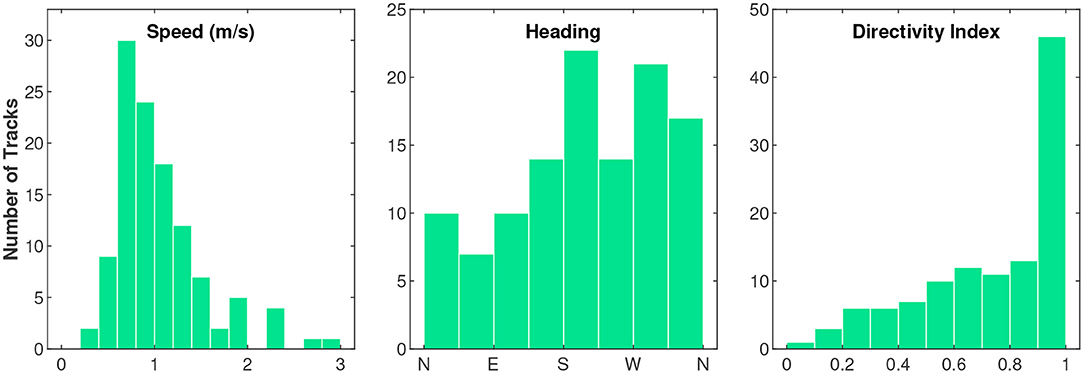
Figure 3. Histograms of the average speed (m/s), overall heading, and directivity index (straight-line distance traveled divided by the total distance traveled) for each fin whale track.
Ten different independent variables were tested that we hypothesized might influence fin whale swimming behavior while singing (Figure 4, Table 1). Of all the independent variables tested, the best model for fin whale kinematic behavioral state included the number of notes produced in the last 5 min and the hour of the day (Table 2). In the subsets of observations tested with environmental variables (wind speed and significant wave height), the models that included these environmental variables were not in the top models (ranked 7th and 9th for wind and waves, respectively). Each of the 5-min intervals were categorized into kinematic behavioral state using the Viterbi algorithm with 61% of the intervals categorized as State 1 and 39% of the intervals categorized as State 2. The average speed for whales in State 1 was 0.6 m/s and the average speed for whales in State 2 was 1.5 m/s (Table 3 and Figure 5).
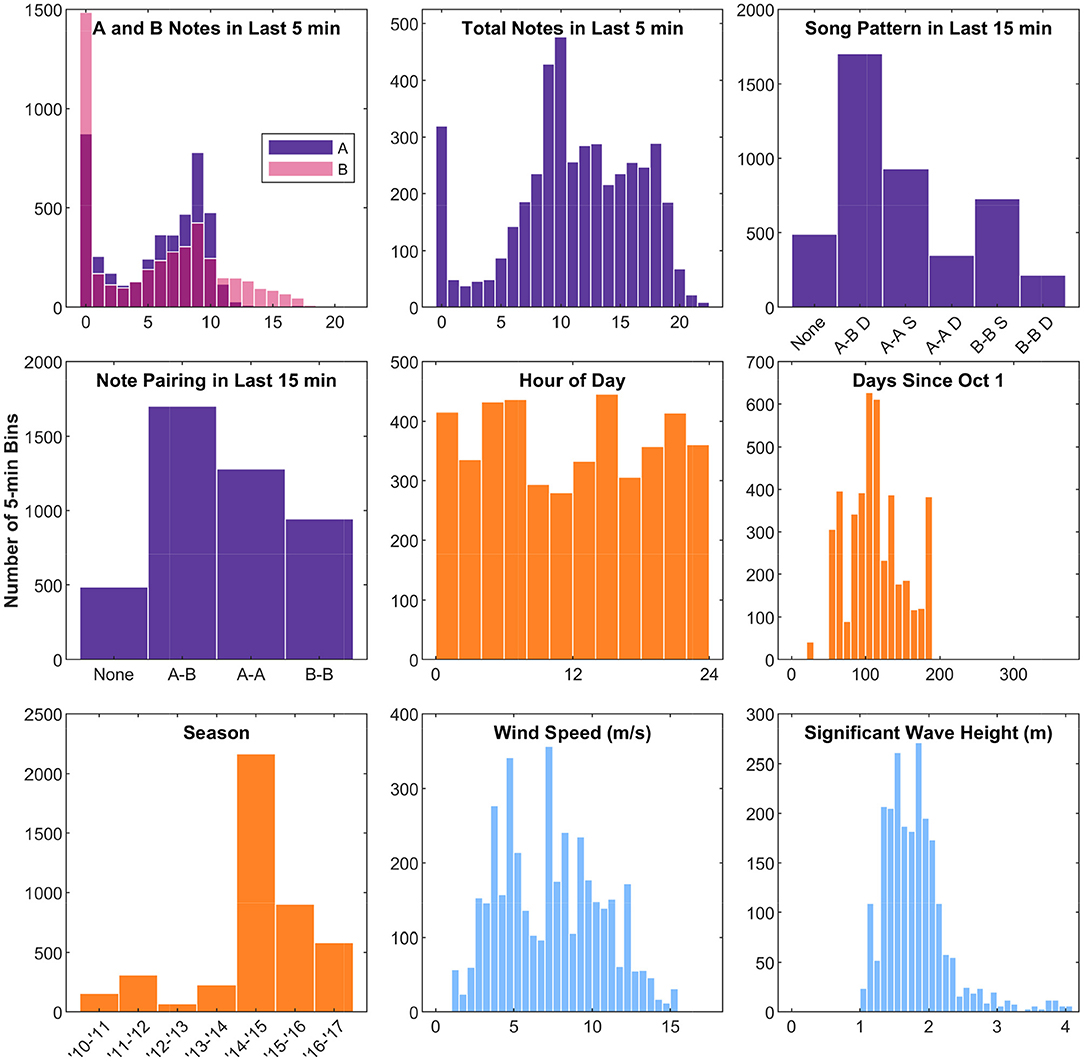
Figure 4. Histograms of the independent variables observed during fin whale song tracks. The y-axis counts are the number of 5-min bins. Song pattern variables are shown in purple/pink, time variables are shown in orange, and environmental variables are shown in blue. For the plot of song pattern in the last 15 min, D stands for doublet and S stands for singlet. Hour of Day is in local Hawaii Standard Time. The x-axes limits for the plots of time and environmental variables match the corresponding plots in Figure 7.
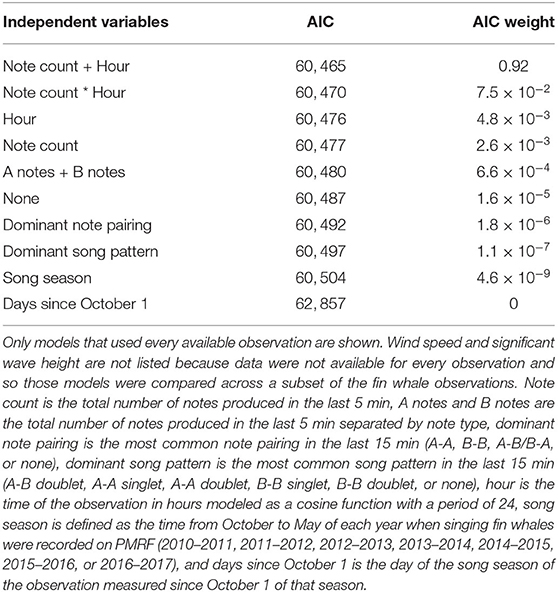
Table 2. Models used to explain singing fin whale swimming behavior, ranked by the Akaike information criterion (AIC) and AIC weights (Akaike, 1974; Burnham and Anderson, 2002).
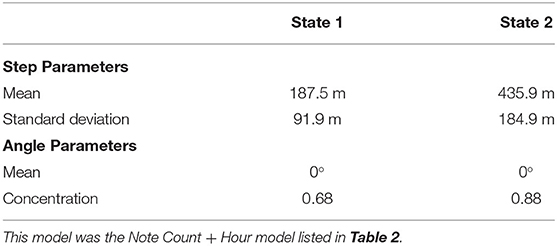
Table 3. Model parameters for the best 2-state model with 5 min steps according to AIC.
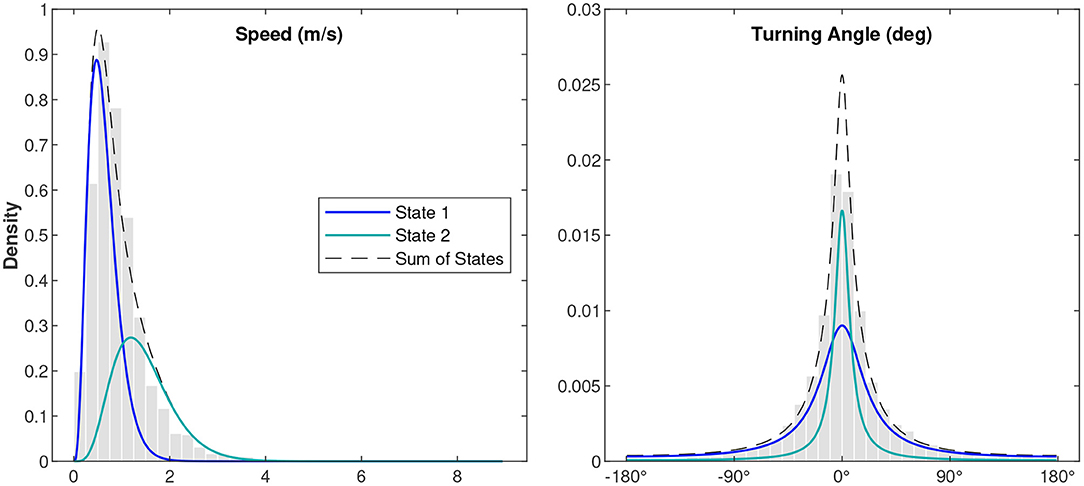
Figure 5. Distributions of the observed variables for the fin whale song tracks normalized by the probability density function. The gray histograms show the observed values normalized by the area of each bar, the blue curves show the probability density function of State 1, the teal curves show the probability density function of State 2, and the black dashed line shows the sum of State 1 and State 2. The kinematic states were estimated using a hidden Markov model.
As the number of notes produced in the last 5 min increased (i.e., as cue rate increased), the likelihood of being in State 1 (slower and more turns) increased and the likelihood of being in State 2 (faster and more direct) decreased (Figure 6). Whales were also most likely to be in State 2 around 10 am local time, and were most likely to be in State 1 at nighttime.
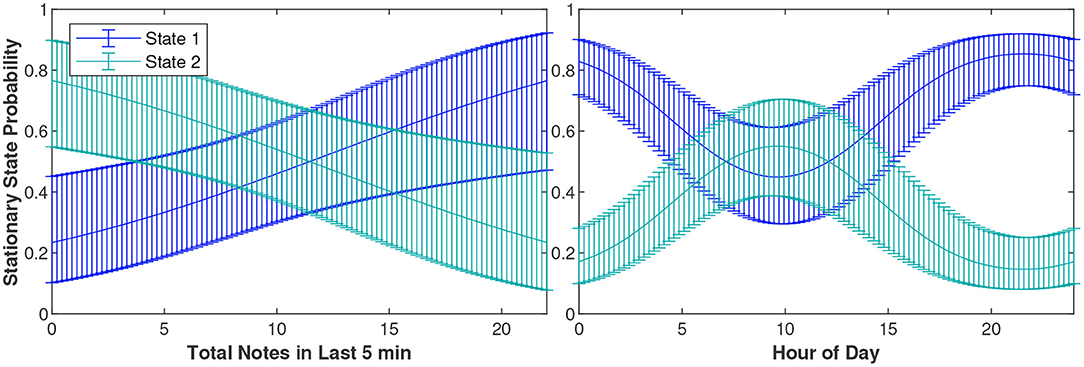
Figure 6. The probability of a fin whale being in State 1 or 2 based on the total notes it produced in the last 5 min and the hour of the day. The blue and teal curves show the Stationary State probabilities of State 1 and State 2, respectively. The error bounds show the 95% confidence intervals. For the left plot, the hour was held constant at its mean value of 11.87 and for the right plot, the total notes produced in the last 5 min was held constant at its mean value of 11.13.
The fin whale song tracks are seasonal at PMRF. We used GAMs to determine which of the time and environmental variables (Table 1 and Figure 7 were related to the acoustic presence of fin whales. Including days since October 1 and song season (2010–2011 to 2016–2017) resulted in a significantly better model (lower AIC) for modeling the presence of fin whale tracks. As expected from Figure 4, the probability of fin whale acoustic presence reached its peak just after ~100 days since October 1 or in the first half of January. Not every time bin had wave height or wind speed available, so models were fit separately to a subset of the data that contained those environmental variables. For the subset with wind speed estimates, we tried delaying wind speed from 0 to 24 h in 3 h increments because we hypothesized that strong winds would take some time to have an effect on the waves and therefore whale swimming behavior. Wind speed delayed 15 h was the most significant for modeling presence of fin whale tracks (p = 0.001) and also aligned well with our observation of the lag between plotted wind speed and wave height vs. time. The best model to predict presence of fin whale tracks during times with wind speed contained song season, days since October 1, and wind speed as statistically significant variables (p < 0.05). For the subset of data that contained wave height measurements, song season, days since October 1, and wave height were significant variables. The best model contained the tensor product interactions of wave height and day in addition to their lower order interactions and song season as a categorical fixed effect (see Supplementary Material for R code). The predicted mean probability of fin whale acoustic track presence for every combination of day and wave height during the 2015–2016 song season is shown in Figure 8. Especially since wave data were absent during most of the 2014–2015 song season during the time when there were 48 fin whale tracks, the shape of these results in relation to wave height should not be over-interpreted.
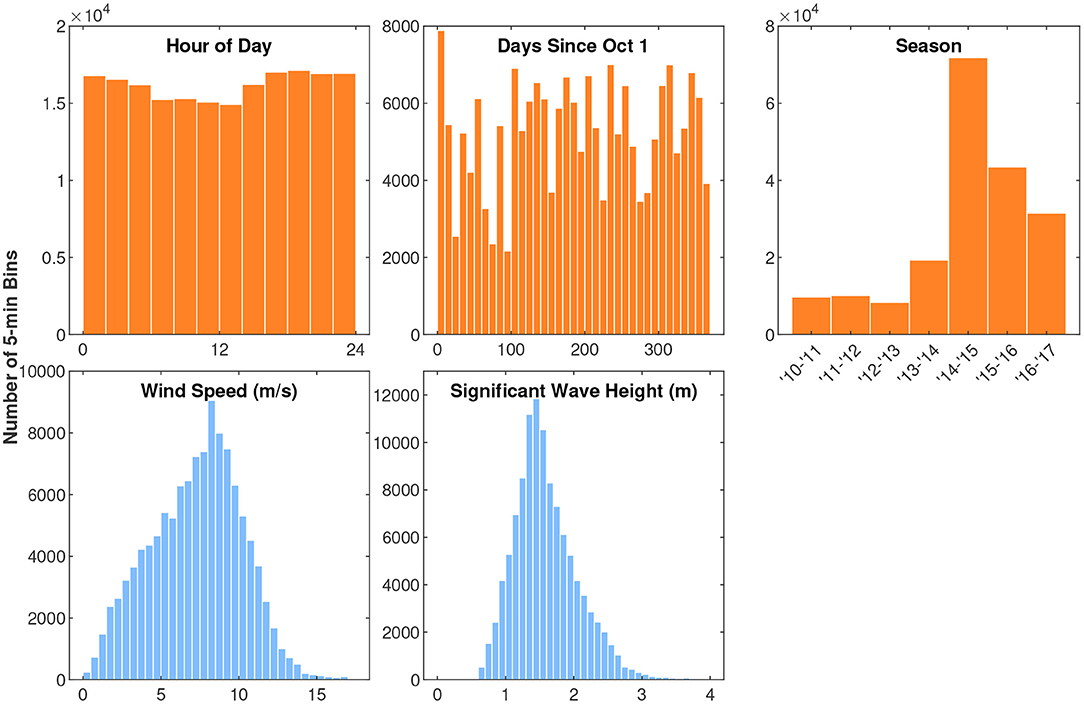
Figure 7. Histograms of the independent variables observed at all times when there was recording effort. The y-axis counts are the number of 5-min bins. As in Figure 4, time variables are shown in orange and environmental variables are shown in blue. Hour of Day is in local Hawaii Standard Time. The x-axes limits for these plots match the corresponding plots in Figure 4.
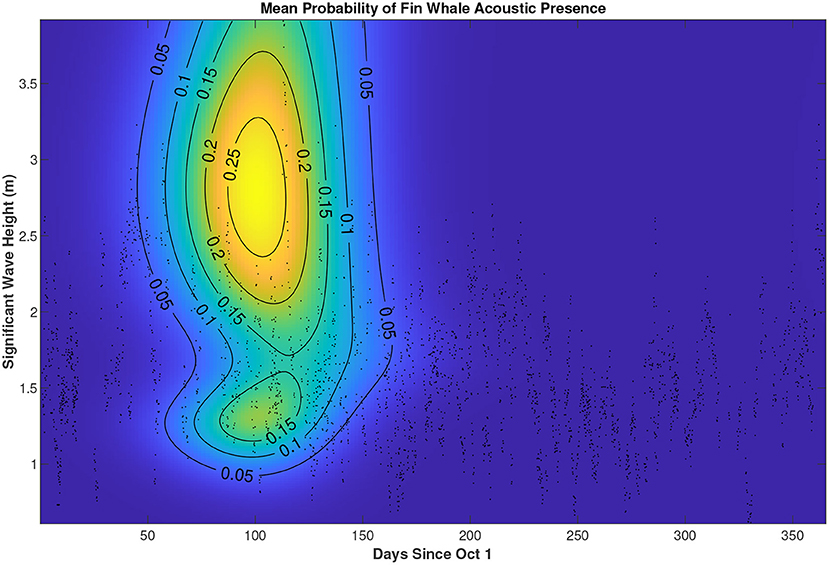
Figure 8. Predicted mean probability of fin whale acoustic track presence as a function of significant wave height and days since October 1 of each song season. Predictions are obtained from our best model, which models acoustic presence as a function of song season, and both the marginal and interaction effects of wave height and days since October 1. This plot holds song season constant at 2015–2016; other song seasons show the same pattern but different absolute probability values. Data from all years are shown in the background scatter plot (i.e., 3 h time bins with acoustic recordings and wave height measurements). The shape of these results in relation to wave height should not be over-interpreted as there is low data density over much of the plot.
4. Discussion
Very little information currently exists about fin whale swimming behavior while singing, so the results presented here for the 115 fin whale tracks combined with the singing behavior described by Helble et al. (2020) build a foundation about fin whale behavior in the winter months for the Hawaii region. Statistical tools such as hidden Markov models and generalized additive models are useful for assessing the relationships between fin whale swimming behavior or presence and external variables. As an illustration, the times that the tracks shown in Figure 2 switched to new kinematic behavioral states aligned remarkably well with the times that the whales changed their song patterns (Figures 5 and 8 of Helble et al., 2020). For example, the whale that produced the track on 20 March 2015 switched from State 1 to State 2 about 3.7 h in, which is around the same time that the whale switched from an A-A doublet song pattern to an A-B doublet and B-B doublet song pattern (Figure 8 of Helble et al., 2020). These kinematic behavioral states were determined solely by speed and turning of the whale. Although we qualitatively observed that swimming behavior seemed to be related to singing behavior, the statistical framework used in this study allowed us to quantify and generalize the relationships between whale kinematics, acoustic presence, singing behavior, and external variables for all 115 tracks.
While the methods used to calculate whale kinematics can affect the results, the 115 fin whale song tracks reported here seem to be on the slower end of the range reported by other studies and more directional. The average swim speed of singing fin whales at PMRF (1.1 m/s) was slightly lower than those observed for other singing whales in the Northeast Pacific and Atlantic (1.2–3.9 m/s from McDonald et al., 1995; Soule and Wilcock, 2013; Varga et al., 2018; Clark et al., 2019) but was most similar to the speeds measured along the Juan de Fuca Ridge in the Northeast Pacific by Soule and Wilcock (2013). Fin whales more than doubled their average speed between State 1 and State 2 (0.6 and 1.5 m/s) but only 6 of the 115 tracks exceeded average speeds of 2 m/s. Less information is available on the directionality of other singing fin whale tracks, but Soule and Wilcock (2013) reported an average directivity index of 0.6, while the tracks reported at PMRF were slightly more directional with an median value of 0.8. Perhaps the differences in the swim speeds and directionality observed in these previous studies have to do with how the fin whales are using the study areas. Other species have been observed to swim faster and more directional when migrating and switch to ARS behavior (slower with more turning) when in feeding or breeding areas (e.g., Bailey et al., 2009). Besides 20 Hz pulses, fin whales also produce 40 Hz downswept calls. These calls have been primarily recorded in the summer months and at similar times to when fin whales have been observed foraging (Širović et al., 2013). In addition, 40 Hz calls were positively associated with prey biomass while 20 Hz notes were not (Romagosa et al., 2021). Based on available evidence, it is therefore unlikely that these singing fin whales are foraging at PMRF. Much is still unknown about fin whale migration patterns, but singing fin whales traveling at the slower speeds observed at PMRF compared to other regions are consistent with the hypothesis that Hawaii is a breeding area for fin whales.
The kinematic results from this study indicate that singing fin whales at PMRF favored traveling toward the west and there was no trend associated with the direction of travel over time of day, day of the year, or song season. If PMRF was a migratory corridor for fin whales traveling between two destinations seasonally (suggested by Thompson and Friedl, 1982), we would expect them to shift their primary swimming direction between seasons (similar to gray whales off the U.S. west coast, Guazzo et al., 2017). Other whale species in Hawaiian waters including humpback whales, Bryde's whales, and minke whales have also been observed to preferentially travel west (Baker and Herman, 1981; Helble et al., 2016; Palacios et al., 2019; Durbach et al., 2021). The average surface current direction in Hawaiian waters is westward (Bondur et al., 2008), so perhaps singing fin whales and these other species are drifting west with the current. However, we do not know how non-vocalizing fin whales are behaving in this area.
The seasonality of the fin whale tracks generally agrees with other acoustic observations that suggest fin whale presence in the region peaks in January (Thompson and Friedl, 1982; McDonald and Fox, 1999). But unlike these earlier studies, we did not detect fin whale song in the summer. Fin whales have rarely been visually observed around the Hawaiian Islands, but a few fin whales have been sighted during line-transect surveys in the early fall (Barlow, 2006). Because of these limited observations, it is unknown if fin whales are absent from the region and migrate in the summer to feeding areas in higher latitudes like humpback whales, or if fin whales remain present in the region but produce fewer 20 Hz notes (similar to fin whales in the eastern North Pacific, Širović et al., 2013).
Swimming behavior at PMRF varies according to species tracked. Bryde's whales, which were tracked from August to October 2014, exhibited the most uniform movement on PMRF, and swam along the fastest and most directed paths of all the baleen whales measured (mean speed = 1.6 m/s, directivity index >0.95 for 16/17 tracks, Helble et al., 2016). During times before MFA sonar exposure (i.e., during periods of baseline behavior), minke whales tended to travel slower than these fin whales and turned almost randomly (mean speed of 0.8 m/s and angular concentrations of 0.18, Durbach et al., 2021). Singing humpback whales on the range behaved the most similarly to these singing fin whales in that they also traveled along relatively straight tracks (mean directivity index = 0.8–1) with mean speeds of ~1.0 m/s (Henderson et al., 2018). These baseline data are especially important at a Navy training and testing area like PMRF to understand how anthropogenic activities affect whale behavior.
Fin whale kinematic behavioral state was related to their cue rate and the time of day. These results verify and expand upon previous observations from other locations. Changes in fin whale swimming behavior with cue rate were also observed in the Northeast Pacific and the North Atlantic (Soule and Wilcock, 2013; Clark et al., 2019). Soule and Wilcock (2013) reported that fin whales producing different vocalization patterns swam at significantly different speeds. Clark et al. (2019) reported that fin whales that swam faster tended to have a lower cue rate, which is a similar relationship to what we observed (see Supplementary Material for a more detailed comparison). Clark et al. (2019) suggested that singing is energetically expensive for fin whales and that is why they decrease their cue rate when they are traveling fast. Perhaps also when fin whales are swimming quickly, singing is less important than their primary motive of transiting between locations. Clark et al. (2019) hypothesized that singing could be used as a metric for mate quality since only the fittest individuals would be able to sing while swimming fast, but without knowing the behavior of non-singing female fin whales in the area, it is not currently possible to test this hypothesis. The transition between the two kinematic behavioral states may also be a response to other whales (both singing and non-singing) in the area. If they are responding to other singing whales, it may be possible to test this hypothesis using future passive acoustic studies.
If song notes are used as a cue for animal density estimation, the estimated average cue rate may need to be adjusted based on the expected speed of animals in the region being studied. However, other factors will likely influence the number of notes detected that are unrelated to swimming kinematics, such as song pattern and the proportion of animals that are singing at any given time. The song pattern was shown to change over time at PMRF and affect the cue rate (Helble et al., 2020), and the proportion of animals in a vocal state is currently unknown.
Song pattern and note pairing were less important for determining kinematic behavioral state than cue rate. Whales may therefore be more likely to change the number of longer gaps in their song than to have a preferential song pattern for different kinematic behavioral states. As shown in Figure 2, sometimes the transitions to new kinematic behavioral states coincided with transitions to new song patterns, but there was not a dominant song pattern that was more likely in each kinematic behavioral state.
Few other studies have reported fin whale swimming behavior with hour of day during the winter. Keen et al. (2019) reported that fin whales spent more time near the surface during winter nights compared to other times. We observed that fin whales at PMRF were more likely to be in State 1 at night and so tended to move slower and turn more, which is consistent with spending more time near the surface and may be indicative of resting behavior.
Acoustic presence of fin whales was related to day of the year and song season. These timing variables were expected to be important for modeling acoustic presence as fin whale song was only detected seasonally from fall to spring. Fin whale acoustic presence in this study was also related to delayed wind speed and wave height. However, due to sparser environmental data, more passive acoustic recordings that are aligned with environmental measurements are needed to confirm these relationships. Modeled wind speed was more variable than wave height measurements and had a delayed impact on the sea state and whale swimming behavior, so we did not expect modeled wind speed to have as strong of a relationship with whale swimming behavior. Wave height measurements were not available in all song seasons and there were some data gaps, most importantly the gap in wave height measurements during the 2014–2015 song season when there were the greatest number of tracks, so the shape of the relationship between wave height and acoustic presence should not be over-interpreted. Little is known about the effect of local storms on whale behavior outside of anecdotal observations (e.g., Martin et al., 2020). Future work should aim to collect these environmental variables concurrently with acoustic monitoring over longer durations to study the relationship between the environment and whale behavior. Understanding the effects of natural changes in the whales' environment can help us contextualize changes due to anthropogenic activity.
In conclusion, fin whales in Hawaiian waters changed their swimming behavior with their song cue rate and time of the day. Fin whale acoustic presence was related to the day of the year and the song season, in addition to local wind speed and wave height. Habitat use for fin whales in the Hawaii region is poorly understood, as few fin whales have been visually sighted in the region (Barlow, 2006; Bradford et al., 2017) and other passive acoustic monitoring has been limited and tracking has not been available (Thompson and Friedl, 1982; McDonald and Fox, 1999; Oleson et al., 2014; Archer et al., 2019). Although the track kinematics from the 115 fin whale encounters presented here are limited to a subset of whales that are acoustically active, they provide some of the only detailed movements of fin whales in the region. Additional visual, acoustic, and genetic sampling in combination with long-term environmental monitoring is required in order to understand the behavior, life history, and abundance of fin whales in Hawaiian waters.
Data Availability Statement
The datasets presented in this study can be found in online repositories. The names of the repository/repositories and accession number(s) can be found at: http://seamap.env.duke.edu/dataset/2122.
Ethics Statement
Ethical review and approval was not required for the animal study because research was conducted through passive listening of whales in their natural environment.
Author Contributions
CM, SM, and EH collected the data. GA processed the data. SM developed the initial tracking algorithm. CM tuned the tracking algorithm for fin whale song. ID wrote the R-code necessary for the HMM statistical analysis. RG and TH analyzed the data and wrote the draft manuscript. RG, ID, TH, GA, CM, SM, and EH discussed the results and contributed to the final manuscript. All authors contributed to the article and approved the submitted version.
Funding
This research was supported by Commander, U.S. Pacific Fleet (Code N465JR, Award Number N0007020WR0EP8F), the Office of Naval Research (Code 322, Award Number N0001421WX00156), and tool development necessary for this analysis was supported by the U.S. Navy's Living Marine Resources Program (Award Number N0002520WR0141R).
Conflict of Interest
The authors declare that the research was conducted in the absence of any commercial or financial relationships that could be construed as a potential conflict of interest.
Publisher's Note
All claims expressed in this article are solely those of the authors and do not necessarily represent those of their affiliated organizations, or those of the publisher, the editors and the reviewers. Any product that may be evaluated in this article, or claim that may be made by its manufacturer, is not guaranteed or endorsed by the publisher.
Acknowledgments
The authors would like to thank Yi-Leng Chen and Feng Hsiao who provided the modeled wind speeds. We also thank Chris Clark and Adam Frankel for their feedback and input regarding the comparison to their fin whale tracking study.
Supplementary Material
The Supplementary Material for this article can be found online at: https://www.frontiersin.org/articles/10.3389/fmars.2021.696002/full#supplementary-material
References
Akaike, H. (1974). A new look at the statistical model identification. IEEE Trans. Autom. Control 19, 716–723. doi: 10.1109/TAC.1974.1100705
Archer, F. I., Rankin, S., Stafford, K. M., Castellote, M., and Delarue, J. (2019). Quantifying spatial and temporal variation of North Pacific fin whale (Balaenoptera physalus) acoustic behavior. Mar. Mamm. Sci. 36, 224–245. doi: 10.1111/mms.12640
Bacheler, N. M., Michelot, T., Cheshire, R. T., and Shertzer, K. W. (2019). Fine-scale movement patterns and behavioral states of gray triggerfish Balistes capriscus determined from acoustic telemetry and hidden Markov models. Fish. Res. 215, 76–89. doi: 10.1016/j.fishres.2019.02.014
Bailey, H., Mate, B., Palacios, D., Irvine, L., Bograd, S., and Costa, D. (2009). Behavioural estimation of blue whale movements in the Northeast Pacific from state-space model analysis of satellite tracks. Endang. Species Res. 10, 93–106. doi: 10.3354/esr00239
Baker, C. S., and Herman, L. M. (1981). Migration and local movement of humpback whales (Megaptera novaeangliae) through Hawaiian waters. Can. J. Zool. 59, 460–469. doi: 10.1139/z81-067
Barlow, J. (2006). Cetacean abundance in Hawaiian waters estimated from a summer/fall survey in 2002. Mar. Mamm. Sci. 22, 446–464. doi: 10.1111/j.1748-7692.2006.00032.x
Bondur, V. G., Ibrayev, R. A., Grebenyuk, Y. V., and Sarkisyan, G. A. (2008). Modeling the sea currents in open basins: the case study for the Hawaiian Island region. Izvest. Atmos. Ocean. Phys. 44, 225–235. doi: 10.1134/S0001433808020102
Bradford, A. L., Forney, K. A., Oleson, E. M., and Barlow, J. (2017). Abundance estimates of cetaceans from a line-transect survey within the U.S. Hawaiian Islands Exclusive Economic Zone. Fish. Bull. 115, 129–142. doi: 10.7755/FB.115.2.1
Burnham, K. P., and Anderson, D. R. (2002). Model Selection and Multimodal Inference, 2nd Edn. New York, NY: Springer-Verlag.
Carretta, J. V., Forney, K. A., Oleson, E. M., Weller, D. W., Lang, A. R., Baker, J., et al. (2018). U.S. Pacific Marine Mammal Stock Assessments: 2017. NOAA Technical Memorandum NMFS-SWFSC-602, U.S. Department of Commerce.
Clark, C. W., Gagnon, G. J., and Frankel, A. S. (2019). Fin whale singing decreases with increased swimming speed. R. Soc. Open Sci. 6:180525. doi: 10.1098/rsos.180525
Croll, D. A., Acevedo-Gutiérrez, A., Tershy, B. R., and Urbán-Ramírez, J. (2001). The diving behavior of blue and fin whales: is dive duration shorter than expected based on oxygen stores? Comp. Biochem. Physiol. A 129, 797–809. doi: 10.1016/S1095-6433(01)00348-8
Croll, D. A., Clark, C. W., Acevedo, A., Tershy, B., Flores, S., Gedamke, J., et al. (2002). Only male fin whales sing loud songs. Nature 417:809. doi: 10.1038/417809a
Decker, B. L. (1986). “World geodetic system 1984,” in Presented at Fourth International Geodetic Symposium on Satellite Positioning (Austin, TX).
Delarue, J., Martin, B., Hannay, D., and Berchok, C. L. (2013). Acoustic occurrence and affiliation of fin whales detected in the northeastern Chukchi Sea, July to October 2007-10. Arctic 66, 159–172. doi: 10.14430/arctic4287
DeRuiter, S. L., Langrock, R., Skirbutas, T., Goldbogen, J. A., Calambokidis, J., Friedlaender, A. S., et al. (2017). A multivariate mixed hidden Markov model for blue whale behaviour and responses to sound exposure. Ann. Appl. Stat. 11, 362–392. doi: 10.1214/16-AOAS1008
Durbach, I. N., Harris, C. M., Martin, C., Helble, T. A., Henderson, E. E., Ierley, G., et al. (2021). Changes in the movement and calling behaviour of minke whales (Balaenoptera acutorostrata) in response to navy training. Front. Mar. Sci. 8:880. doi: 10.3389/fmars.2021.660122
Freitas, C. (2012). argosfilter: Argos Locations Filter. R Package Version 0.63. Available online at: https://cran.r-project.org/package=argosfilter
Freitas, C., Lydersen, C., Fedak, M. A., and Kovacs, K. M. (2008). A simple new algorithm to filter marine mammal Argos locations. Mar. Mamm. Sci. 24, 315–325. doi: 10.1111/j.1748-7692.2007.00180.x
Guazzo, R. A., Helble, T. A., D'Spain, G. L., Weller, D. W., Wiggins, S. M., and Hildebrand, J. A. (2017). Migratory behavior of eastern North Pacific gray whales tracked using a hydrophone array. PLoS ONE 12:e0185585. doi: 10.1371/journal.pone.0185585
Harris, D. V., Miksis-Olds, J. L., Vernon, J. A., and Thomas, L. (2018). Fin whale density and distribution estimation using acoustic bearings derived from sparse arrays. J. Acoust. Soc. Am. 143, 2980–2993. doi: 10.1121/1.5031111
Hastie, T. J., and Tibshirani, R. J. (1990). Generalized Additive Models, Vol. 43 of Monographs on Statistics and Applied Probability. London: Chapman & Hall.
Helble, T. A., Guazzo, R. A., Alongi, G. C., Martin, C. R., Martin, S. W., and Henderson, E. E. (2020). Fin whale song patterns shift over time in the central North Pacific. Front. Mar. Sci. 7:587110. doi: 10.3389/fmars.2020.587110
Helble, T. A., Henderson, E. E., Ierley, G. R., and Martin, S. W. (2016). Swim track kinematics and calling behavior attributed to Bryde's whales on the Navy's Pacific Missile Range Facility. J. Acoust. Soc. Am. 140, 4170–4177. doi: 10.1121/1.4967754
Helble, T. A., Ierley, G. R., D'Spain, G. L., and Martin, S. W. (2015). Automated acoustic localization and call association for vocalizing humpback whales on the Navy's Pacific Missile Range Facility. J. Acoust. Soc. Am. 137, 11–21. doi: 10.1121/1.4904505
Helble, T. A., Ierley, G. R., D'Spain, G. L., Roch, M. A., and Hildebrand, J. A. (2012). A generalized power-law detection algorithm for humpback whale vocalizations. J. Acoust. Soc. Am. 131, 2682–2699. doi: 10.1121/1.3685790
Henderson, E. E., Helble, T. A., Ierley, G., and Martin, S. (2018). Identifying behavioral states and habitat use of acoustically tracked humpback whales in Hawaii. Mar. Mamm. Sci. 34, 701–717. doi: 10.1111/mms.12475
Jiménez López, M. E., Palacios, D. M., Jaramillo Legorreta, A., Urbán, R J, and Mate, B. R. (2019). Fin whale movements in the Gulf of California, Mexico, from satellite telemetry. PLoS ONE 14:e0209324. doi: 10.1371/journal.pone.0209324
Johnson, D. S., London, J. M., Lea, M.-A., and Durban, J. W. (2008). Continuous-time correlated random walk model for animal telemetry data. Ecology 89, 1208–1215. doi: 10.1890/07-1032.1
Keen, E. M., Falcone, E. A., Andrews, R. D., and Schorr, G. S. (2019). Diel dive behavior of fin whales (Balaenoptera physalus) in the Southern California Bight. Aquat. Mamm. 45, 233–243. doi: 10.1578/AM.45.2.2019.233
Klay, J., Mellinger, D. K., Moretti, D. J., Martin, S. W., and Roch, M. A. (2015). Advanced Methods for Passive Acoustic Detection, Classification, and Localization of Marine Mammals. Technical report, Office of Naval Research, Arlington, VA (accessed January 22, 2020).
Lafortuna, C. L., Jahoda, M., Azzellino, A., Saibene, F., and Colombini, A. (2003). Locomotor behaviours and respiratory pattern of the Mediterranean fin whale (Balaenoptera physalus). Eur. J. Appl. Physiol. 90, 387–395. doi: 10.1007/s00421-003-0887-2
Langrock, R., King, R., Matthiopoulos, J., Thomas, L., Fortin, D., and Morales, J. M. (2012). Flexible and practical modeling of animal telemetry data: hidden Markov models and extensions. Ecology 93, 2336–2342. doi: 10.1890/11-2241.1
Li, N., Cheung, K. F., Stopa, J. E., Hsiao, F., Chen, Y.-L., Vega, L., et al. (2016). Thirty-four years of Hawaii wave hindcast from downscaling of climate forecast system reanalysis. Ocean Modell. 100, 78–95. doi: 10.1016/j.ocemod.2016.02.001
Martin, C. R., Henderson, E. E., Martin, S. W., Helble, T. A., Manzano-Roth, R. A., Matsuyama, B. M., et al. (2020). FY18 Annual Report on Pacific Missilie Range Facility Marine Mammal Monitoring. Technical Report 3202, Naval Information Warfare Center Pacific, San Diego, CA. Available online at: https://apps.dtic.mil/sti/citations/AD1091141
McClintock, B. T., and Michelot, T. (2018). momentuHMM: R package for generalized hidden Markov models of animal movement. Methods Ecol. Evol. 9, 1518–1530. doi: 10.1111/2041-210X.12995
McDonald, M. A., and Fox, C. G. (1999). Passive acoustic methods applied to fin whale population density estimation. J. Acoust. Soc. Am. 105, 2643–2651. doi: 10.1121/1.426880
McDonald, M. A., Hildebrand, J. A., and Webb, S. C. (1995). Blue and fin whales observed on a seafloor array in the Northeast Pacific. J. Acoust. Soc. Am. 98, 712–721. doi: 10.1121/1.413565
Nieukirk, S. L., Stafford, K. M., Mellinger, D. K., Dziak, R. P., and Fox, C. G. (2004). Low-frequency whale and seismic airgun sounds recorded in the mid-atlantic ocean. J. Acoust. Soc. Am. 115, 1832–1843. doi: 10.1121/1.1675816
Oleson, E. M., Širović, A., Bayless, A. R., and Hildebrand, J. A. (2014). Synchronous seasonal change in fin whale song in the North Pacific. PLoS ONE 9:e115678. doi: 10.1371/journal.pone.0115678
Palacios, D. M., Mate, B. R., Baker, C. S., Hayslip, C. E., Follett, T. M., Steel, D., et al. (2019). Tracking North Pacific Humpback Whales to Unravel Their Basin-Wide Movements. Technical Report, Marine Mammal Institute, Oregon State University. doi: 10.5399/osu/1117
Panigada, S., Donovan, G. P., Druon, J.-N., Lauriano, G., Pierantonio, N., Pirotta, E., et al. (2017). Satellite tagging of Mediterranean fin whales: working towards the identification of critical habitats and the focussing of mitigation measures. Sci. Rep. 7:3365. doi: 10.1038/s41598-017-03560-9
R Core Team (2020). R: A Language and Environment for Statistical Computing. Vienna: R Foundation for Statistical Computing. Available online at: https://www.R-project.org/
Romagosa, M., Pérez-Jorge, S., Casc ao, I., Mouri no, H., Lehodey, P., Pereira, A., et al. (2021). Food talk: 40-Hz fin whale calls are associated with prey biomass. Proc. R. Soc. B Biol. Sc. 288:20211156. doi: 10.1098/rspb.2021.1156
Simon, M., Stafford, K. M., Beedholm, K., Lee, C. M., and Madsen, P. T. (2010). Singing behavior of fin whales in the Davis Strait with implications for mating, migration and foraging. J. Acoust. Soc. Am. 128, 3200–3210. doi: 10.1121/1.3495946
Širović, A., Oleson, E. M., Buccowich, J., Rice, A., and Bayless, A. R. (2017). Fin whale song variability in southern California and the Gulf of California. Sci. Rep. 7:10126. doi: 10.1038/s41598-017-09979-4
Širović, A., Williams, L. N., Kerosky, S. M., Wiggins, S. M., and Hildebrand, J. A. (2013). Temporal separation of two fin whale call types across the eastern North Pacific. Mar. Biol. 160, 47–57. doi: 10.1007/s00227-012-2061-z
Soule, D. C., and Wilcock, W. S. D. (2013). Fin whale tracks recorded by a seismic network on the Juan de Fuca Ridge, Northeast Pacific Ocean. J. Acoust. Soc. Am. 133, 1751–1761. doi: 10.1121/1.4774275
Thompson, P. O., Findley, L. T., and Vidal, O. (1992). 20-Hz pulses and other vocalizations of fin whales, Balaenoptera physalus, in the Gulf of California, Mexico. J. Acoust. Soc. Am. 92, 3051–3057. doi: 10.1121/1.404201
Thompson, P. O., and Friedl, W. A. (1982). A long term study of low frequency sounds from several species of whales off Oahu, Hawaii. Cetology 45, 1–19.
Varga, L. M., Wiggins, S. M., and Hildebrand, J. A. (2018). Behavior of singing fin whales Balaenoptera physalus tracked acoustically offshore of Southern California. Endanger. Species Res. 35, 113–124. doi: 10.3354/esr00881
Watkins, W. A. (1981). Activities and underwater sounds of fin whales. Sci. Rep. Whales Res. Inst. 33, 83–117.
Watkins, W. A., Moore, K. E., Sigurjónsson, J., Wartzok, D., and Notarbartolo di Sciara, G. (1984). Fin Whale (Balaenoptera physalus) Tracked by Radio in the Irminger Sea. Hafrannsoknastofnunin.
Watkins, W. A., Moore, K. E., Wartzok, D., and Johnson, J. H. (1981). Radio tracking of finback (Balaenoptera physalus) and humpback (Megaptera novaeangliae) whales in Prince William Sound, Alaska. Deep Sea Res. Part A Oceanogr. Res. Pap. 28, 577–588. doi: 10.1016/0198-0149(81)90118-7
Watkins, W. A., Tyack, P., Moore, K. E., and Bird, J. E. (1987). The 20-Hz signals of finback whales (Balaenoptera physalus). J. Acoust. Soc. Am. 82, 1901–1912. doi: 10.1121/1.395685
Weinstein, B. G., Double, M., Gales, N., Johnston, D. W., and Friedlaender, A. S. (2017). Identifying overlap between humpback whale foraging grounds and the Antarctic krill fishery. Biol. Conserv. 210, 184–191. doi: 10.1016/j.biocon.2017.04.014
Whitehead, H., and Carlson, C. (1988). Social behaviour of feeding finback whales off Newfoundland: comparisons with the sympatric humpback whale. Can. J. Zool. 66, 217–221. doi: 10.1139/z88-031
Keywords: fin whale (Balaenoptera physalus), kinematics, swimming speed, inter-note interval, passive acoustic monitoring, song (or singing), behavior, marine ecology
Citation: Guazzo RA, Durbach IN, Helble TA, Alongi GC, Martin CR, Martin SW and Henderson EE (2021) Singing Fin Whale Swimming Behavior in the Central North Pacific. Front. Mar. Sci. 8:696002. doi: 10.3389/fmars.2021.696002
Received: 15 April 2021; Accepted: 13 August 2021;
Published: 03 September 2021.
Edited by:
David M. P. Jacoby, Lancaster University, United KingdomReviewed by:
Marisa Vedor, Centro de Investigacao em Biodiversidade e Recursos Geneticos (CIBIO-InBIO), PortugalChristopher W. Clark, Cornell University, United States
Sean Wiggins, University of California, San Diego, United States
Copyright © 2021 Guazzo, Durbach, Helble, Alongi, Martin, Martin and Henderson. This is an open-access article distributed under the terms of the Creative Commons Attribution License (CC BY). The use, distribution or reproduction in other forums is permitted, provided the original author(s) and the copyright owner(s) are credited and that the original publication in this journal is cited, in accordance with accepted academic practice. No use, distribution or reproduction is permitted which does not comply with these terms.
*Correspondence: Regina A. Guazzo, cmVnaW5hLmEuZ3VhenpvLmNpdkB1cy5uYXZ5Lm1pbA==