 Shu-Kuan Wong
 Shotaro Suzuki
 Yingshun Cui
 Ryo Kaneko2
 Koji Hamasaki
- 1Department of Marine Ecosystem Dynamics, Atmosphere and Ocean Research Institute, University of Tokyo, Chiba, Japan
- 2National Institute of Polar Research, Tachikawa, Japan
- 3Fisheries and Marine Science Research Centre, Fukushima Prefectural Government, Iwaki-shi, Japan
- 4Cell Factory Research Center, Korea Research Institute of Bioscience and Biotechnology (KRIBB), Daejeon, South Korea
- 5University of the Ryukyus, Okinawa, Japan
The sea surface microlayer (SML) is a thin surface film located at the interface between oceans and the atmosphere. In this study, three SML samplers—polycarbonate membrane (PC), glass plate (GP), and drum sampler (DS)—were used to collect microbiological DNA samples for molecular analysis. Among the three samplers, DS only took half the time to sample the SML compared to GP while PC were able to sample the thinnest SML depth. Biological matter and distinct bacterial communities in the SML were apparent during low wind conditions in samples collected by three samplers. Signs of biological matter [transparent exopolymer particles (TEP) and chlorophyll-a concentrations] depletion, and an increased similarity in the biological communities of the SML and underlying water (UW), were more pronounced during high wind speed conditions in samples collected by GP and DS. GP samples had lower biological matter enrichment than DS samples compared with UW. The depletion of biological matter in GP samples were more apparent during periods of high chl-a concentrations in the SML. In contrast, PC was able to consistently sample an SML community distinct from that of the UW, regardless of wind conditions. Bacterial community DNA samples obtained by the three SML samplers showed relatively consistent patterns of community structure, despite large fluctuations between seasons (summer vs. winter) and layers (SML vs. UW) being observed. Although no SML-specific taxon was detected in this study, a comparison of the representation of taxonomic groups in each sample suggested that certain taxa (15 orders) were specifically enriched or depleted in the SML, especially taxa belonging to Actinobacteria, Cyanobacteria, Deferribacteria, and Proteobacteria. This trend was consistent regardless of sampling method, implying that these bacterial groups are key taxa in the biogeochemical processes occurring at the air-sea interface.
Introduction
The sea surface microlayer (SML) is a unique ecosystem, which is defined as the interfacial film at the uppermost 1,000 μm of the interface between the atmosphere and oceans. Due to its proximity to the air interface, the SML is key to understanding the physical, chemical and biological exchange processes that occur between the atmosphere and oceans. The SML is affected by wet/dry deposition, air-sea gas exchange and aerosol transport, while bursting bubbles—which form marine aerosols—act as a source of SML output to the atmosphere (Bigg and Leck, 2008). The aggregation and concentration of materials in the SML is promoted by positively buoyant particles ascending through the water column, such as transparent exopolymer particles (TEP) (Simon et al., 2002). Bubbles produced by breaking waves are also important for SML formation. As they rise through the water column, such bubbles trap organic particles and microorganisms, which accumulate in the SML and may then be released to the atmosphere through the formation of aerosol droplets (Norkrans, 1980). Marine aerosols are mainly exported to the atmosphere from the SML, and are often rich in organic compounds, viruses and microorganisms. Changes in the chemical and biological composition of aerosols modulate their cloud condensation nuclei activity and thus influence cloud formation processes in the atmosphere above oceans (Aller et al., 2005). Covering almost three quarters of the Earth’s surface, the SML at the air-sea interface is dynamic and unique; it can also be an extreme environment that experiences high solar and UV radiation (Liss and Duce, 1997) and an accumulation of pollutants (Wurl and Obbard, 2004; Zhang et al., 2018).
The bacterial community found in the SML is termed the bacterioneuston, while their counterparts in the underlying water (UW) are known as bacterioplankton. Bacterioneustons are often unique communities, which are dependent on the dynamics of SML formation, and may influence various biogeochemical processes at the air-sea interface. The formation and identification of bacterial communities specific to the SML is complex and is influenced by several factors—especially weather conditions and sampling thickness, in addition to biological and chemical conditions (Cunliffe et al., 2009b; Stolle et al., 2010). While some studies have characterized bacterial (Cunliffe et al., 2008; Sun et al., 2020), archaeal (Cunliffe et al., 2008), and eukaryal (Cunliffe and Murrell, 2010; Taylor and Cunliffe, 2014; Zäncker et al., 2021) communities in the SML that were distinct to those in UW just a few centimeters below; others have reported no differences between SML and UW microbial communities (Agogué et al., 2005a; Obernosterer et al., 2008). Similar contrasting results have been reported regarding bacterial abundance (Cunliffe et al., 2009a; Santos et al., 2011) and bacterial activity (Carlucci et al., 1991; Aller et al., 2005). Only a single SML-specific neuston bacterium, Nevskia ramosa, has been identified thus far (in freshwater lakes) (Glockner et al., 1998); however, SML isolates often show high similarity to species isolated from variable environments elsewhere (Agogué et al., 2005b; Stolle et al., 2011). Bacteria in the SML tend to be bacterioplankton that colonize the SML via flotation processes, i.e., by attaching to particles and/or bubbles rising from the UW (Joux et al., 2006). Various factors may influence environmental selection on the bacterial communities that assemble in the SML. For example, TEP, a gel-like substance derived mostly from phytoplankton (Azetsu-Scott and Passow, 2004) are known to be enriched in the SML (Wurl and Holmes, 2008). TEP are thought to be a main driver in the shaping of bacterial communities, especially in coastal waters (Taylor et al., 2014).
Sampling the marine habitat can be challenging. This is particularly so for the “true” SML, a layer where physical and chemical properties change drastically, which is suggested to be merely 50 ± 10 μm thick (Zhang et al., 1998, 2003). A variety of samplers have been used to sample SML-associated materials and organisms. It is crucial that such samplers are easy-to-handle and can rapidly sample an appropriate water volume from the “true” SML layer with the little UW contamination and minimal sampler bias (Stolle et al., 2009). Commonly used sampler types are glass plate (GP), drum sampler (DS), mesh screen (MS) and polycarbonate membrane (PC). Due to differences in the structure and properties of each sampler, the thickness of SML sampled also differs greatly among these sampler types. Therefore, in practice, choice of sampler type defines the thickness of SML analyzed. To date, only one study has compared the efficiency of three different sampler types in sampling bacterial community structure (Cunliffe et al., 2009a). In this study, it was found that SML samples collected with GPs and MSs were more similar to the UW compared with SML samples collected with PCs. Although GP and DS samplers capture almost the same SML thickness, no direct comparison of their capability to sample SML microbial communities has been done. GPs were found to sample a thinner and more distinct SML layer compared with MSs, but showed underrepresentation of bacterial communities sampled when compared with PCs (Cunliffe et al., 2009a)—such comparisons have not been carried out using a DS. In principle, sampling the SML using PCs and DSs reduces the chance of a “dilution effect,” which happens when a GP is dipped into the UW during the sampling process. This is significant, as samples diluted with UW are less likely to reflect a true representation of the SML (Agogué et al., 2005a).
This study aims to compare and characterize SML bacterial community structure using three different samplers that sample different thicknesses of the surface layer in relation to wind speed and organic matter enrichments. Our results provide fundamental information on SML sampling constraints, and will inform choices of appropriate samplers for future analyses of SML microbial communities.
Materials and Methods
Study Site and Sampling Methods
Sampling was carried out at Aburatsubo Inlet in Sagami Bay, Japan. Water samples were collected from the pier of the Misaki Marine Biological Station of the University of Tokyo (35°09.5′N, 139°36.5′E) in September and December 2012. Due to the hydrography of the bay, sampling was carried out at high tide. Wind speed was recorded using a hand-held anemometer; salinity and temperature were recorded using a handheld TS meter (YSI 85, YSI Incorporated, Yellow Springs, Ohio). SML samples were collected facing the windward direction using three different samplers (GP, DS, and PC). Two GPs (Harvey and Burzell, 1972), each measuring 30 × 30 × 0.2 cm, were inserted vertically into the water column and then drawn up at a rate of 10 cm s–1, drained for 10 s, and then water remaining on the surface was scraped into a sterile collection bottle using a Teflon wiper. Water samples collected from both GPs were pooled prior to filtration. The cylindrical DS was made of polymethyl methacrylate and was 100 cm in length and 25 cm in diameter (Harvey, 1966). It was rotated at 6 rotations per minute to sample the SML, then seawater adhering to the drum surface was scraped into a sterile collection bottle using a Teflon wiper. Duplicate water samples were collected with the DS and pooled prior to filtration. The PC samples were collected by placing ten 47 mm, 0.22 μm pore size Isopore (Millipore, MA, United States) polycarbonate membranes onto the water surface for 10 s. These were then retrieved using sterile forceps and pooled into a sterile centrifuge tube (Kjelleberg et al., 1976). Control bulk water from the UW was obtained by submerging a sterile narrow-mouthed bottle to a depth of 20 cm. The thickness of SML sampled by each sampler type (PC, GP, and DS) was determined from the volume of water sampled and the surface area of sampler (Cunliffe and Wurl, 2014). Samples were labeled according to the season (Summer, S; Winter, W), sampling number (1, 2, 3) followed by sampler (PC, GP, DS, UW).
Environmental Parameters
For chlorophyll-a (chl-a) analysis, 50 ml of each water sample was filtered, in duplicate, onto 25 mm Whatman GF/F filters (GE Healthcare, Buckinghamshire, United Kingdom), and extracted using N,N-dimethylformamide (Suzuki and Ishimaru, 1990). Chl-a concentrations were measured fluorometrically using a 10-AUTM Field and Laboratory Fluorometer (Turner Designs, Sunnyvale, CA). The concentration of TEP was quantified in triplicate as previously described (Passow and Alldredge, 1995). Total bacterial abundance was enumerated using the DAPI (4′, 6-diamidino-2-phenylindole) direct-counting method (Porter and Feig, 1980). Briefly, 1 ml of each water sample was fixed with paraformaldehyde (2% final concentration) and filtered, in duplicate, onto 25 mm, 0.22 μm pore size Isopore membranes (Millipore) using 0.45 μm pore size MF membranes (Millipore) as base filters. The filters were then stained with DAPI (final concentration 2 μg ml–1) and were examined under UV excitation with an Olympus BX-51 epifluorescence microscope (Olympus Opticals, Tokyo, Japan).
Enrichment Factors
Chl-a and TEP concentrations from the SML were compared with those from the UW using an enrichment factor (EF), which is defined by the equation: EF = [X]SML/[X]UW, where [X] is the concentration of a given parameter in the SML or UW. In this study, biological matter enrichment in the SML was only considered when the enrichment factors for both chl-a and TEP exceeded 1.0 for GP and/or DS samplers.
DNA Extraction, PCR Amplification, and Pyrosequencing
One liter of each water sample collected using GP and DS samplers, and from the UW, was filtered onto 0.22 μm Sterivex GS filter units (Millipore). For samples collected using PCs, 10 membranes were pooled for extraction. DNA extractions were carried out using the ChargeSwitch Forensic DNA Purification Kit (Invitrogen, Carlsbad, United States). A zirconia bead-beating step (FastGene, Tokyo, Japan) was added prior to extraction, using the MicroSmash MS-100 (Tomy, Tokyo, Japan) at 5,000 rpm for 30 s.
The V1-V3 hypervariable regions of the bacterial 16S rRNA gene were amplified using the forward primer 27F: 5′-CCATCTCATCCCTGCGTGTCTCCGACT CAGXXXXXXXXXX AGAGTTTGATCMTGGCTCAG-3′ and the reverse primer 519R: 5′-GWATTACCGCGGCKGCTG-3′; where X’s represent a sample-specific multiplex identifier, adapter sequence is italicized and sequence complementary to the bacterial 16S rRNA gene is underlined (Kim et al., 2011). PCR reactions were carried out in triplicate. The 20 μl PCR reaction mixture consisted of 3 μl DNA template, 11.9 μl molecular grade double distilled water, 0.2 μM each primer, 0.2 μM each dNTP, 1 × TaKaRa Ex Taq Buffer and 1.25 U TaKaRa Ex Taq HS Polymerase (TaKaRa, Otsu, Japan). Thermal cycling was carried out for 30 cycles as per these conditions: initial denaturation at 94°C for 3 min, denaturation at 98°C for 3 s, annealing at 55°C for 30 s, elongation at 72°C for 1 min and final elongation at 72°C for 10 min. DNA products were purified and normalized using the AxyPrep Mag PCR Normalizer Kit (Axygen, MA, United States) as per manufacturer’s instructions, and quantified using the Quant-iT Picogreen dsDNA Kit (Invitrogen). Bacterial 16S rRNA gene amplicons were sequenced using the Roche 454 GS-FLX + System (Roche, NJ, United States) according to the manufacturer’s protocol.
Sequence and Statistical Analysis
After sequencing, the open-source Mothur software v1.33.3 (Schloss et al., 2009) was used for sequence analysis following the 454 Standard Operating Procedure1. Briefly, the PyroNoise algorithm was implemented to remove sequences arising from pyrosequencing errors (Quince et al., 2009). Tags and primers were then removed from the obtained reads and similar sequences were grouped and aligned against the SILVA SEED v102 bacterial database. Screening noise was further reduced using the pre-cluster method (Huse et al., 2010) and chimeras were identified and removed using chimera.uchime. Sequences were subsequently classified against the ribosomal database project (RDP) database to remove those not classified as bacteria. A distance matrix was generated from the remaining high-quality reads, and clustered and representative sequences were assigned to operational taxonomic units (OTUs) using the furthest-neighbor clustering algorithm based on 97% similarity (Schloss and Westcott, 2011). In the recent years, the 454 pyrosequencing has been widely replaced by other next generation sequencers such as the Illumina MiSeq, that could produce greater sequencing depths per sample. That said, the results from 454 pyrosequencing are still valid to date and previous studies have shown that the 454 pyrosequencing and MiSeq platforms produced comparable results (Tremblay et al., 2015; Allali et al., 2017; Castelino et al., 2017) that leads to similar biological conclusions. All downstream analyses in this study were performed using abundant taxa only to reduce sequencing bias. Additionally, to reduce bias caused by differences in sequencing depth between samples, random subsampling of 2268 sequences was carried out—2268 represents the lowest number of reads obtained across all samples.
Principal coordinate analysis (PCoA) was carried out using the Fast UniFrac program test, based on weighted and normalized UniFrac distances (Hamady et al., 2010). An analysis of molecular variance (AMOVA) test based on 1,000 permutations was subsequently carried out to test for population differentiation using the distance file created from weighted UniFrac. Wilcoxon signed rank tests, with a significance value of p < 0.05, were used to test significant differences between enrichments in the SML and UW, and between SML samplers, using the wilcox.test() function from the “dplyr” package in R software (Version 3.5.0).
Results
Environmental Parameters and Enrichments
Sampling conditions were relatively calm with low wind speed, except during the collection of S2 and W1 samples, when wind speed was well above 5 m s–1 (Supplementary Table 1). The thinnest sampling thickness was obtained using PCs (33 ± 5 μm), followed by GPs (42 ± 4 μm) and the DS (36 ± 4 μm). During high wind conditions, the thickness of SML sampled increased to 61 ± 22 μm for GPs and to 39 ± 3 μm for the DS (S2 and W1 samples).
The formation or existence of an SML can be deduced from the enrichment of various biological and chemical parameters when compared with the UW, for example, of TEP microgels (Wurl and Holmes, 2008). S1, S3, W2, and W3 samples were found to be enriched in biological matter (chl-a and TEP) in the SML, while S2 and W1 samples were not (Figure 1). The enrichment magnitude in the SML differed between summer and winter samples, with higher SML enrichments (up to 8–fold) observed during winter. S2 and W1 samples were collected during high wind speed events, which may account for their lack of SML enrichment. We used t-tests to compare the concentrations of the biological parameters collected from GP and DS samplers to each other, and to samples from the UW. The concentration of TEP in the SML collected by DS was significantly different to that of the UW (p = 0.005), by an average enrichment factor of 2.6× (Figure 1). Although the average enrichment factor of TEP collected by GPs was 2.4 × that of the UW, this difference was not significant (p = 0.08). The concentration of chl-a in the SML showed approximately 11.1 × (GP samples) and 17.4 × (DS samples) enrichment, compared with the UW. These differences in chl-a concentrations were significant: GP vs. UW (p = 0.04); DS vs. UW (p = 0.01). The total bacterial abundance in the SML was on average 1.3 × (GP samples) and 1.1 × (DS samples) higher than in the UW, but these differences were also not significant (p = 0.09). Overall, samples collected by GP and DS samplers were similar in total bacterial count. Finally, chl-a and TEP concentrations had higher enrichment factors, approximately 2.6 × and 1.4 ×, respectively, in samples collected by DS compared with GPs; however, these differences were not statistically significant (Chl-a: p = 0.06; TEP: p = 0.08).
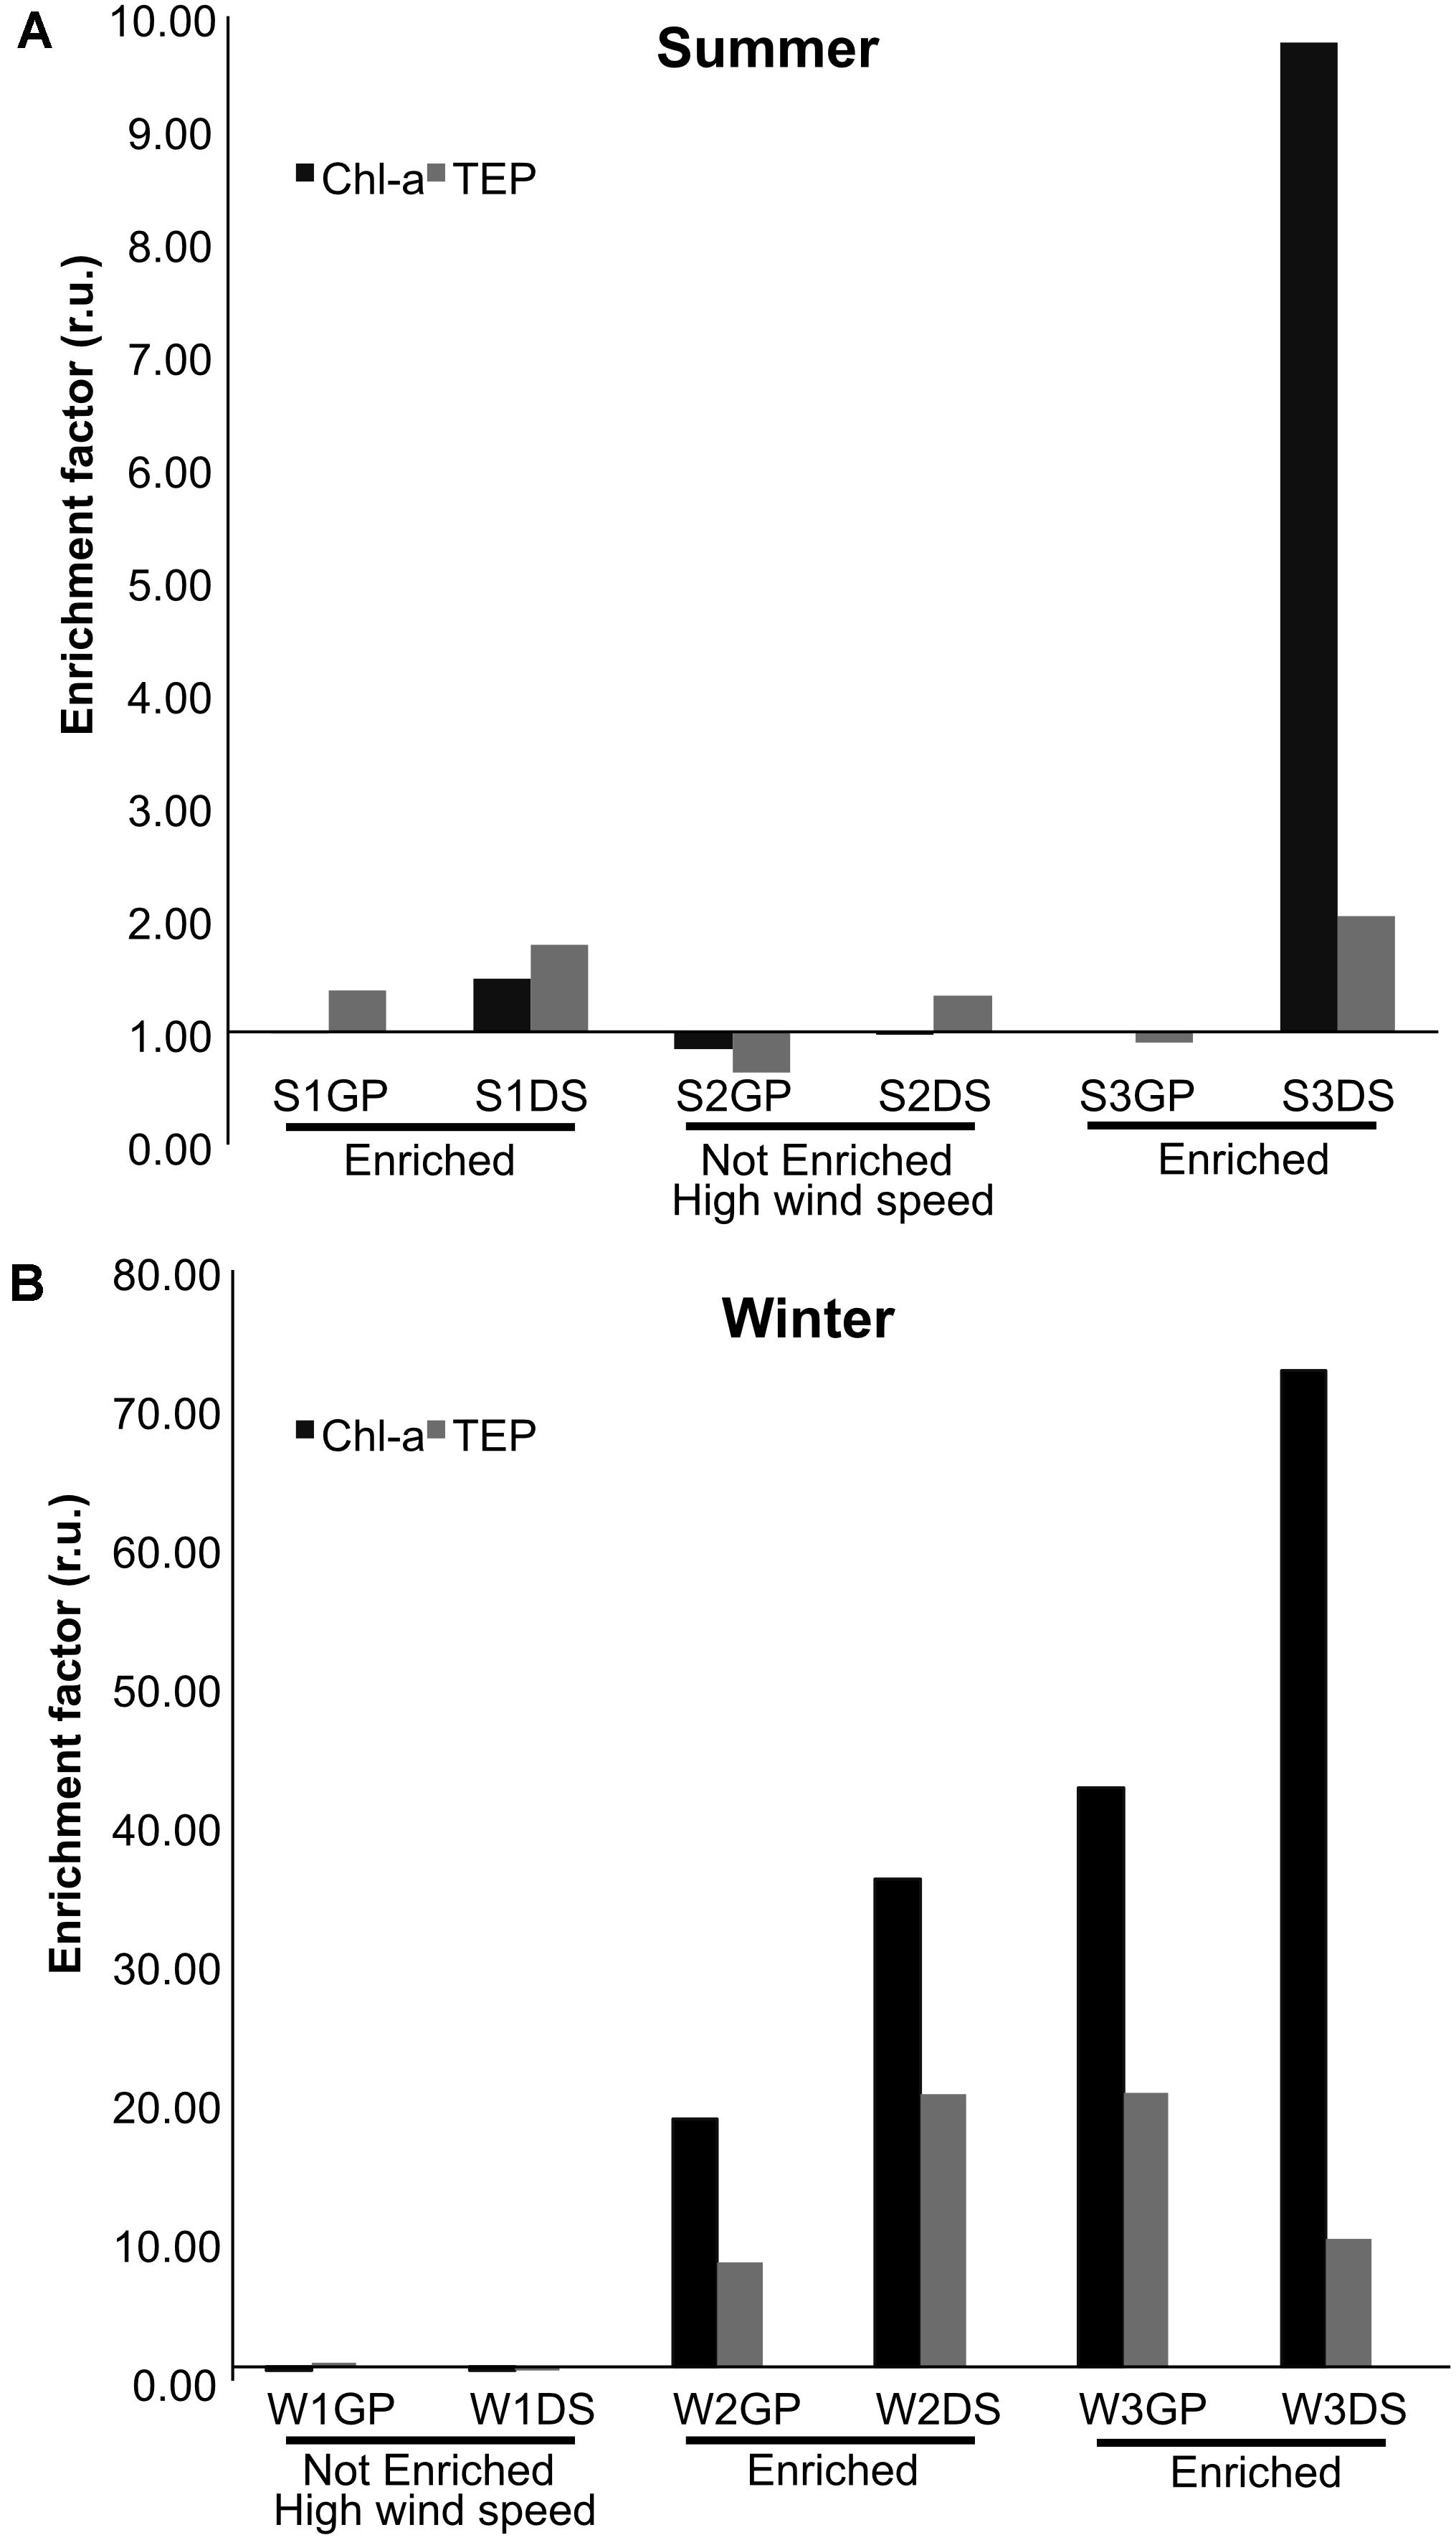
Figure 1. Enrichment factors in relative units (r.u.) of chlorophyll-a (chl-a) and transparent exopolymer particles (TEP) in the SML compared with UW in samples collected using either glass plate (GP) or drum sampler (DS) samplers. (A) Summer sampling (S) and (B) winter sampling (W). A sampling period (e.g., S1, W2) was considered enriched when both TEP and chl-a, collected using either GP or DS, exceeded 1.0. Note that the y-axis scales of (A,B) are different.
Bacterial Communities in the SML and UW
Principal component analysis (PCoA) was performed to determine the relationship between samples collected from the SML and UW (Figure 2). The first principal coordinate (PC1) explained 41.75% of sample variation, separating the samples into two groups. SML samples collected on days of SML enrichment mostly plotted to the left, while samples from the UW and from the SML collected at times of no SML enrichment plotted to the right. The second principal coordinate (PC2) explained 20.07% of the sample variation, and mostly separated the samples collected in the winter from those collected in the summer. AMOVA analysis performed using weighted UniFrac distances showed that pairwise distances were significant among samples that were collected when the SML was enriched with biological matter (F = 3.87, p < 0.01) and in different seasons (F = 6.00, p < 0.001). PCoA plots of the SML samples only (Supplementary Figure 1A), also showed a clear separation between the summer and winter microbial communities.
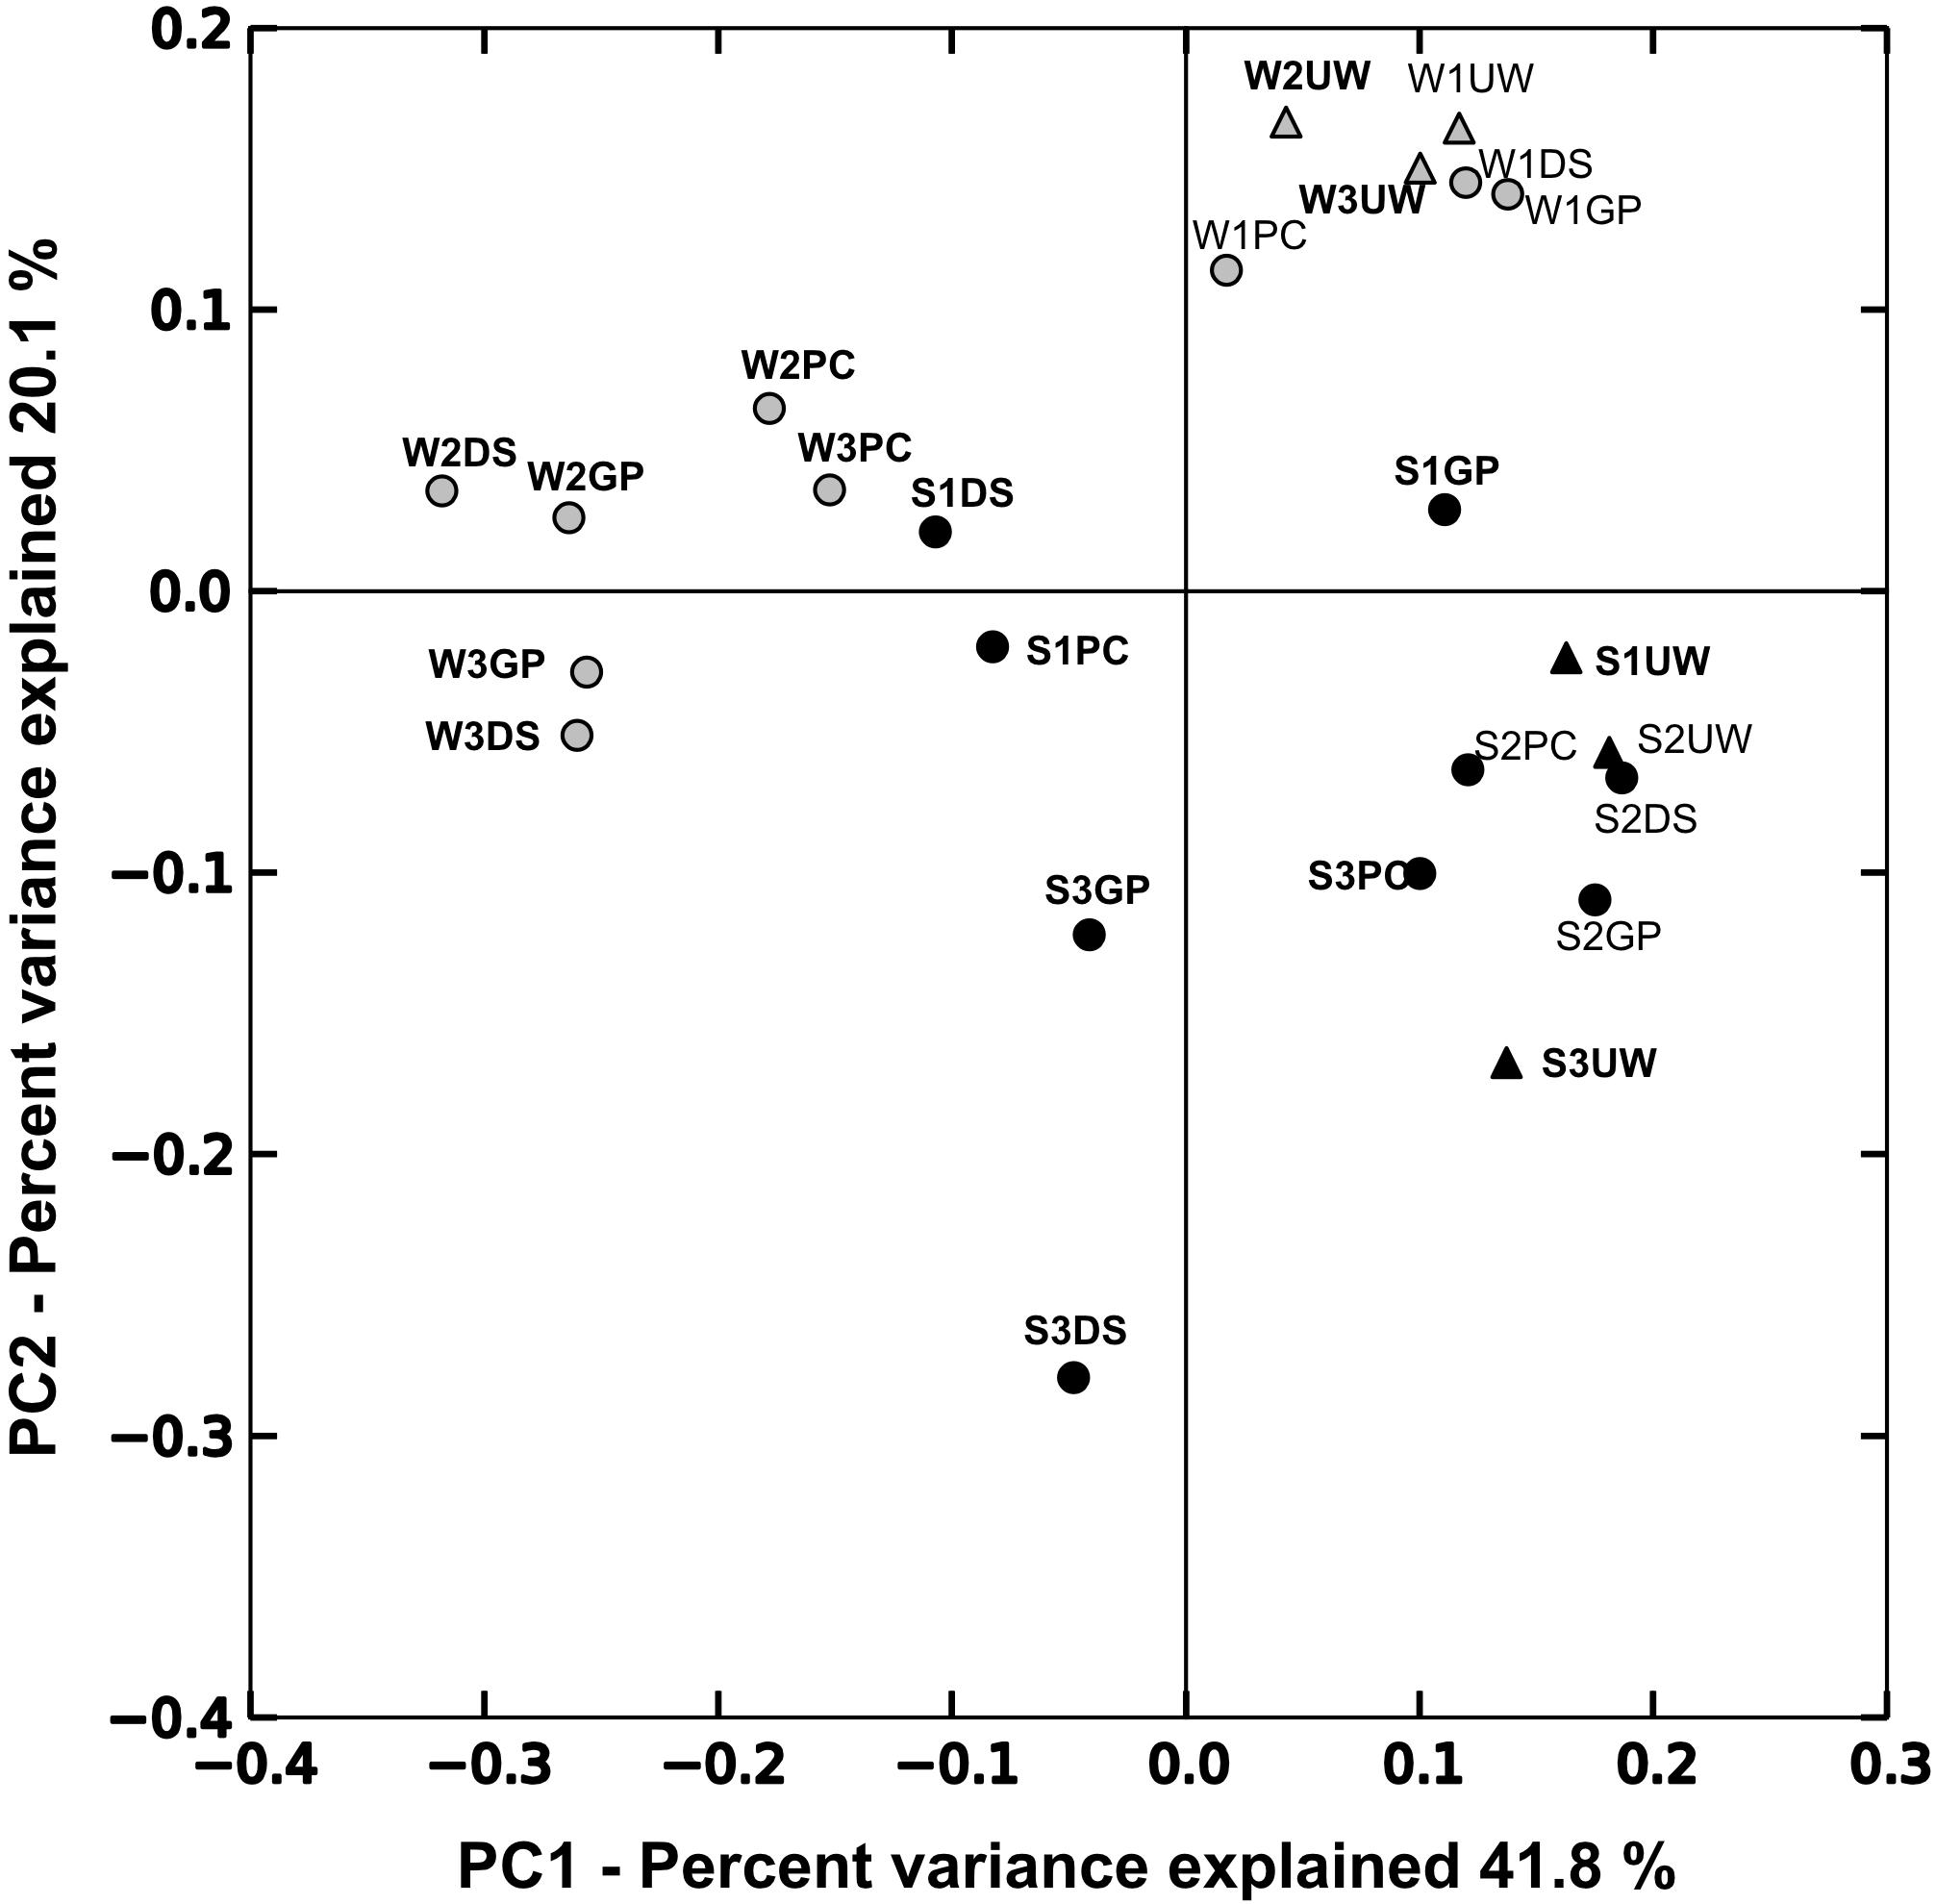
Figure 2. Fast UniFrac weighted principal coordinate analysis (PCoA) plots based on the relative bacterial abundances in each sample. Circles indicate samples collected from the SML while UW samples are represented by triangles. Samples collected during summer (S) are indicated in black and winter samples (W) are indicated in gray. Sample names highlighted in bold indicate chl-a and TEP enrichment in the SML.
Comparative sequence analysis between the SML and UW samples (Figure 3) showed that the major bacterial groups in each sample (relative abundance > 10%) were relatively similar. However, while the bacterial community in the SML changed according to sampling and enrichment events, the community in the UW remained relatively stable. Additionally, PCoA plots showing the ordination of each sampler type and the corresponding UW samples, revealed that bacterial communities collected using PC (Supplementary Figure 1B), GP (Supplementary Figure 1C) or DS (Supplementary Figure 1D) samplers were different from the UW when the SML was enriched (S1, S3, W2 and W3 samples). Although the community structure of the SML collected using GPs or the DS tended to remain similar to that of the UW when the SML was not enriched (S2 and W1 samples), samples collected using PCs were unique and differed from the UW, regardless of SML enrichment. No OTUs were found to be specific to either the SML or UW.
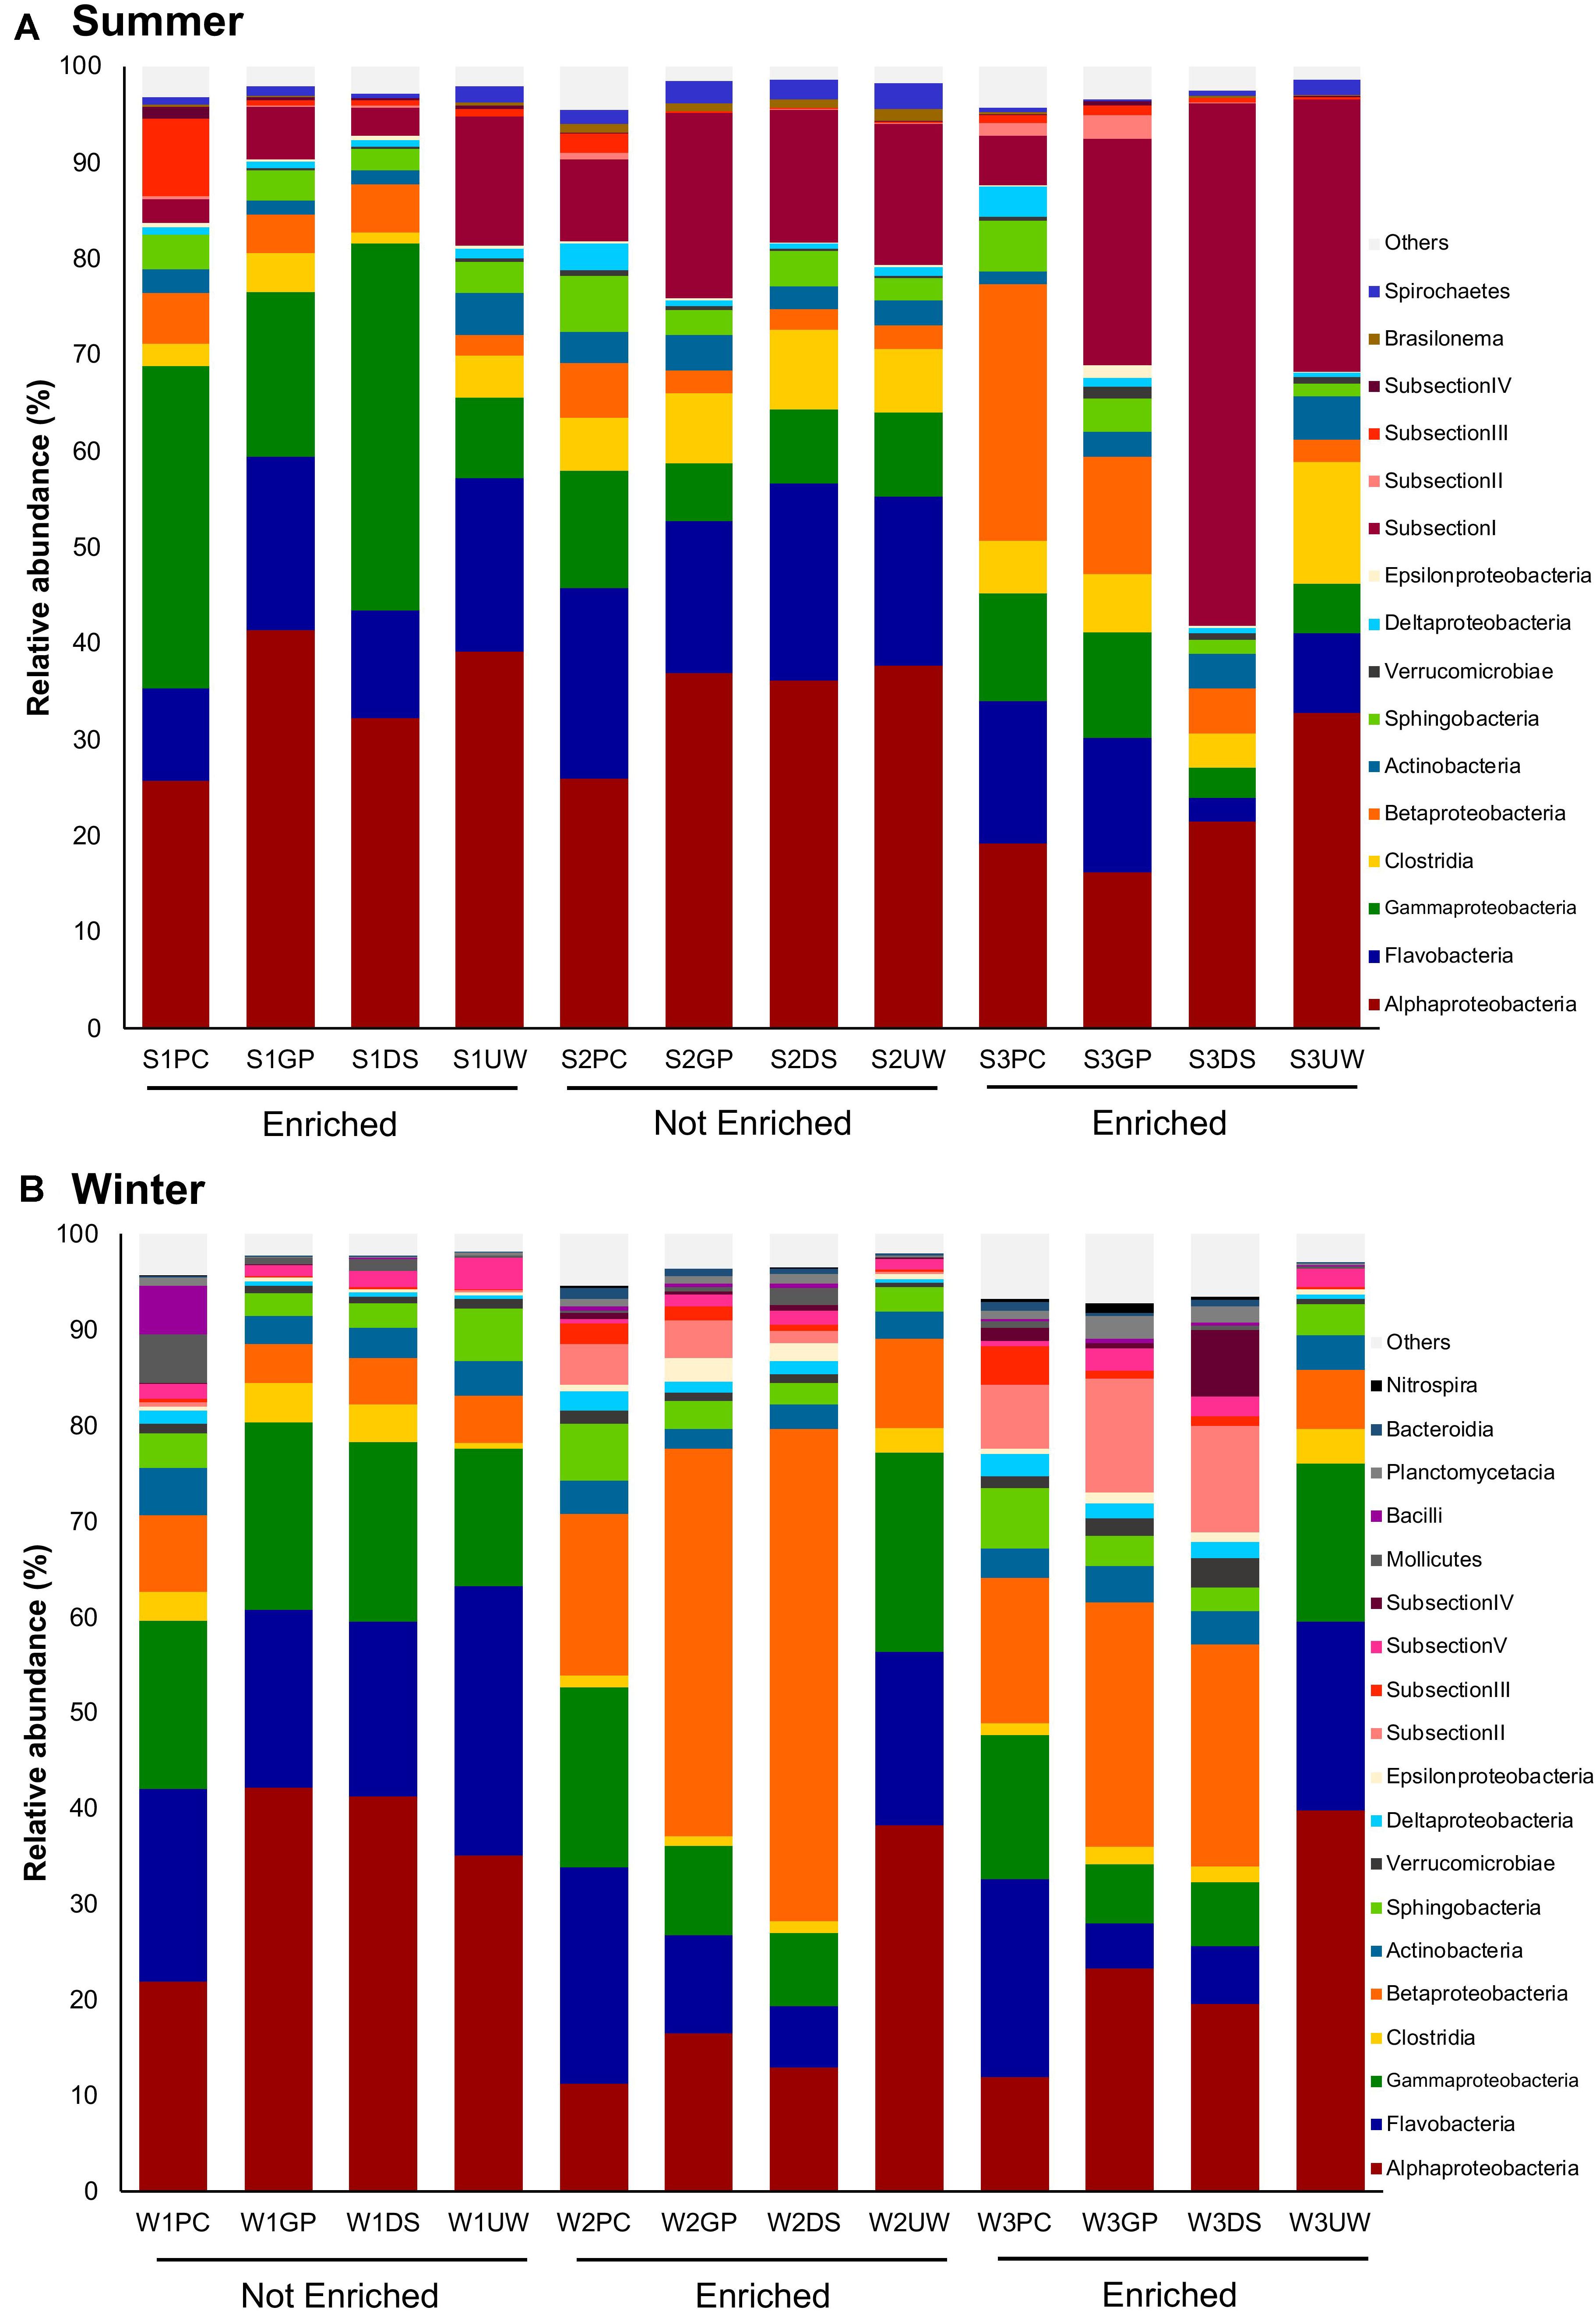
Figure 3. Relative abundances of bacterial groups in the SML (PC, GP, DS) and UW at class level. Only groups with relative abundances greater than 0.5% for any of the samples in (A) summer (S) and (B) winter (W) are shown. “Others” comprises groups with relative abundances < 0.5% for all samples.
Summer and winter samples of SML and UW, from collection periods showing high biological enrichment of the SML, were pooled to determine the enrichment and depletion of specific bacterial taxa according to sampler type (Figure 4). Fifteen taxonomic orders were found to show significantly higher or lower representation in SML samples than in UW samples. Members from the Cyanobacteria Subgroup II (PC, p = 0.01; GP, p = 0.02; DS, p = 0.01), Pseudomonadales (PC, p = 0.01; GP, p = 0.01; DS, p = 0.01), Rhizobiales (PC, p = 0.01; GP, p = 0.04; DS, p = 0.01) and Sphingomonadales (PC, p = 0.01; GP, p = 0.01; DS, p = 0.01) were significantly enriched in all SML samples compared with UW samples. Order Acidobacteriales had significantly higher proportions in PC (p = 0.04) and GP (p = 0.04) samples compared with the UW. Members from the orders Burkholderiales (PC, p = 0.02; DS, p = 0.03) and Chromatiales (PC, p = 0.02; DS, p = 0.03) were significantly enriched in samples collected by PC and DS samplers compared with UW samples. Caulobacterales (GP, p = 0.04; DS, p = 0.04) and Nesseriales (GP, p = 0.02; DS, p = 0.04) were significantly higher in PC and GP samples compared with the UW. However, Acidimicrobiales (PC, p = 0.01; GP, p = 0.01; DS, p = 0.02) and SAR11 clade (PC, p = 0.01; GP, p = 0.01; DS, p = 0.01) were significantly depleted in all SML samples compared with UW samples. Rickettsiales (PC, p = 0.02; DS, p = 0.01), SAR324 clade (PC, p = 0.03; DS, p = 0.03) and SAR 406 clade (PC, p = 0.01; DS, p = 0.01) were significantly depleted in samples collected by PC and DS samplers compared with UW samples. Almost all taxa (14 out of 15) showed consistent trends of enrichment or depletion in the SML compared with the UW. Vibrionales was the only group to be present in significantly different proportions among samplers, showing an enrichment in PC samples but not in GP and DS samples. All other groups showed no significant difference in proportion among the different sampler types.
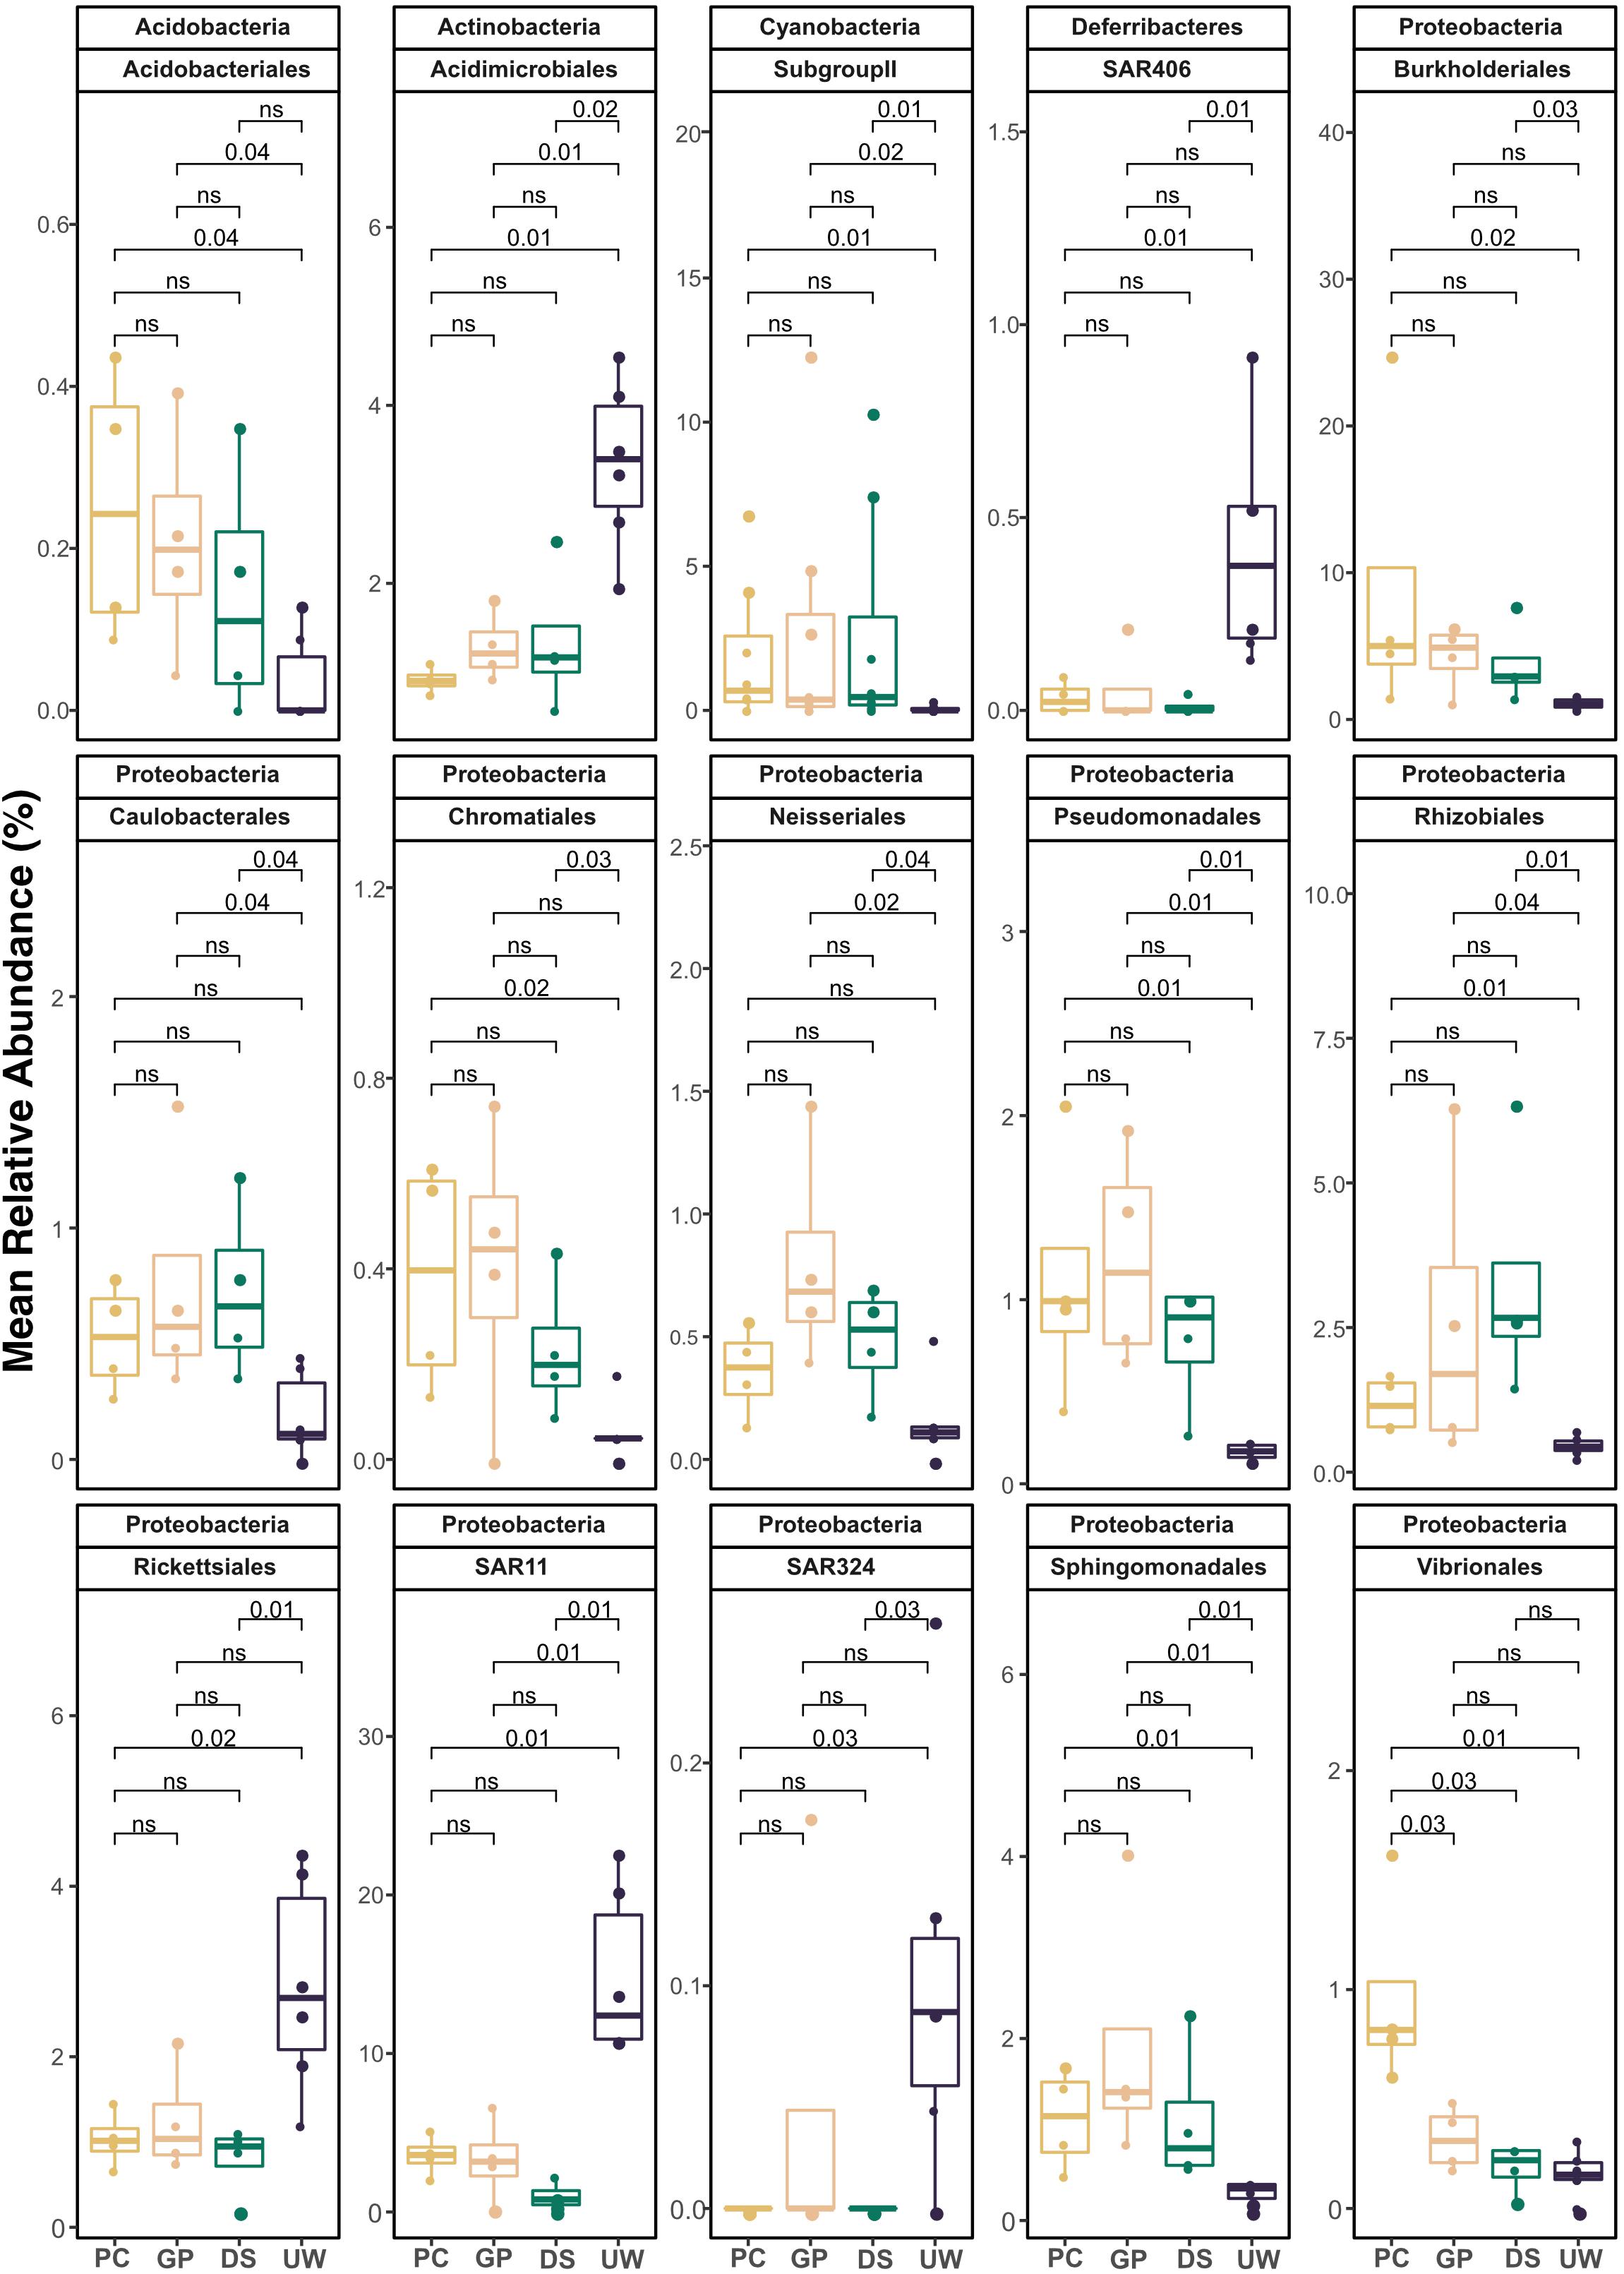
Figure 4. Mean percentage relative abundance of pooled data from summer, winter, SML and UW samples, collected by either PC, DS, GP, and UW during high biological enrichment in the SML. Taxonomic assignments are listed as phylum followed by order. Only orders with p < 0.05, calculated using Wilcoxon signed rank test, are shown. ns = not significant.
Discussion
We compared three SML sampler types in this study—GP, PC, and DS. The GP sampler is a simple device that is easy to use; however, it is time consuming to collect the volumes of water needed for downstream microbiological and biological analysis. Moreover, as the glass plate is dipped directly into the UW and then slowly withdrawn, this may cause samples to be diluted with UW. GP samplers have also been shown to be less efficient in sampling phytoplankton-related biological parameters; this bias may be caused by the retention of larger phytoplankton on the surface of the sampler (Agogué et al., 2004). In terms of biological enrichment, the levels of chl-a and TEP collected by GPs showed lower enrichment compared with UW than samples that were collected by a DS. The concentrations of chl-a in all UW samples in this study were similar to typical surface water chl-a concentrations for the inlet. In contrast, chl-a concentrations in the SML samples were generally higher (at times exceeding 10-fold normal chl-a concentrations), and were similar to concentrations reported during bloom conditions (Supplementary Table 2). During sampling periods found to have higher chl-a concentrations (S3 samples and all SML samples from winter sampling), the observed depletion of chl-a in the GP samples was more pronounced. In comparison to GPs, the DS can sample twice as much water in half the time, while PC samplers can sample the thinnest depth among the three sampler types. Sampling time, filtration and storage are important factors in ensuring the quality of environmental DNA sampled for bacterial diversity analysis (Rochelle et al., 1994). Unlike GP samplers, the drum of the DS is not dipped entirely into the UW, thus the risk of contamination with UW is reduced. Notably, PC samplers were able to sample the thinnest depth with consistently different bacterial communities compared with the UW. The sampling method and the calculations of SML thickness sampled by different samplers have been outlined and standardized in the “Guide to best practices to study the ocean’s surface” by Cunliffe and Wurl (2014). Theoretically, the SML thickness sampled are calculated based on the volume of the thin SML layer retained on the samplers as a result of surface tension and viscosity (Liss and Duce, 1997; Cunliffe and Wurl, 2014). However, due to the heterogeneity of the SML, the thickness of the SML sampled may change depending on different physical, chemical and biological factors such as temperature, wind and wave conditions (Falkowska, 1999) as well as the presence of biological particles (Galgani and Engel, 2013) and surface-active substances (Shinki et al., 2012). These variabilities should also be noted when selecting an appropriate SML sampler for the study.
We found that wind speed played an important role in controlling the dynamics of the SML, with enrichment being lowest during high wind conditions and highest during calm conditions. Biological matter depletion and a similarity in the SML and UW bacterial communities were also obvious in samples collected during high wind speed conditions. These data agree with findings that wind speeds of ≤5.6 m s–1 were required to form a distinct bacterioneuston in an annular wind wave tunnel experiment (Rahlff et al., 2017). Similarly, it has been reported that depletion of TEP in the SML is more pronounced when wind speeds exceed 5 m s–1 (Engel and Galgani, 2016). In this study, we observed that during high wind conditions, the increase in the thickness of SML sampled was greater for the GP sampler than the DS. We therefore conclude that samples collected by GP and DS samplers are dependent on wind speed, with increasing thickness being obtained (more SML specific) at times of high wind speeds. Notably, even at high wind speeds, we found that the PC sampler was able to sample a distinct SML bacterial community—this has also been reported by Cunliffe et al. (2009a). PC sampler bias has been argued by Agogué et al. (2004) and subsequently rebutted by Cunliffe et al. (2009a). Our comparison of the proportions of each bacterial taxon collected by different sampler types also suggests possible biases in the distribution of some taxa. Namely, the proportion of Vibrionales in PC samples was significantly different from that in GP and DS samples showing enrichment in the SML over the UW (Figure 4). It is unknown why Vibrionales bacteria were enriched only in the PC samples—this should be further investigated.
In this study, most of the major bacterial groups were present in both the SML and UW communities, with no SML-specific OTUs being detected despite our deep sequencing approach. This pattern supports previous reports showing that bacterial assemblages in the SML are actively recruited from the UW (Zäncker et al., 2018), and that the formation of distinct bacterioneustons in natural environments requires more than 6 h of calm conditions (Stolle et al., 2010, 2011). Based on our PCoA analysis, seasonality (summer and winter) played the most important role in determining bacterial community structure at our sampling site (Figure 2). In addition to seasonal differences in community structure, the bacterial community in the SML showed structure distinct to that in the UW, except in high wind conditions. Bacterial community data obtained by the three different samplers on the same sampling date clustered relatively closely, suggesting that any effect of sampler bias was less than the influences of seasonality and sampling layer. Some taxa were specifically enriched or depleted in the SML compared with the UW (Figure 4). Irrespective of sampler type, almost all taxa showed consistent trends of enrichment or depletion between the SML and UW. Enriched taxa included Pseudomonadales, Chromatiales and Vibrionales of Gammaproteobacteria; Sphingomonadales, Caulobacterales and Rhizobiales of Alphaproteobacteria; Cyanobacteria SubgroupII; and Burkholderiales and Nesseriales of Betaproteobacteria. These results concur with previous reports of bacterial taxa in the SML. For example, Gammaproteobacteria is one of the most abundant and dominant bacterial groups in the SML (Franklin et al., 2005; Stolle et al., 2011; Rahlff et al., 2021), and two of the major SML-associated bacterial groups identified from the Baltic Sea were from phylum Cyanobacteria and Gammaproteobacteria (Stolle et al., 2011). Gammaproteobacteria are often associated with phytoplankton blooming, can respond quickly to nutrient pulses (Tada et al., 2011; Buchan et al., 2014) and have high resistance toward solar radiation (Agogué et al., 2005b). Other studies on the SML have also reported the presence of Pseudomonas in bacterioneustons in marine (Agogué et al., 2005a; Martinez-Varela et al., 2020) and lake (Hugoni et al., 2017) environments. Pseudomonas spp. which are known to produce and degrade a variety of surfactants, have been found in slick-associated samples in near-surface water (Kurata et al., 2016). Regarding Vibrio sp. Franklin et al. (2005) reported a high proportion of Vibrio sp. in bacterioneuston samples collected using PCs, similar to our findings. Order Sphingomonadales is associated with the enrichment of anthropogenic dissolved organic carbon in the SML (Martinez-Varela et al., 2020), and Sphingomonas sp. isolated from the SML show resistance to solar radiation (Santos et al., 2012). Conversely, members from Betaproteobacteria are known to utilize a wide range of organic matter including algal exudates (Tada et al., 2011; Salcher et al., 2013) and are efficient colonizers in the SML (Hoertnagl et al., 2010; Hugoni et al., 2017). Finally, certain cyanobacterial groups possess gas vacuoles to support buoyancy and vertical migration that could give them a selective advantage (Walsby et al., 1995).
In this study, we have shown that variability in the bacterial community structures recorded by different SML samplers (DS, GP, and PC) was less than that observed across seasons and between the SML and UW. Furthermore, we identified that PCs were able to sample the SML at the thinnest depth (showing consistently different bacterial communities to the UW) independent of wind conditions. GPs are easy to use; however, caution should be observed regarding their lower sampling efficiency compared with other samplers. Notably, the DS was able to sample twice as much water as a GP, in half the time, and easily met the sampling volume requirements of microbial community DNA or genome analyses. Our findings also suggest that specific taxa belonging to Actinobacteria, Cyanobacteria, Deferribacteria and Proteobacteria were enriched or depleted in the SML compared with the UW. These taxa are possibly key groups for future investigations of bacterial involvement in biogeochemical processes at the air-sea interface.
Data Availability Statement
Nucleotide sequences found in this study were deposited at the DDBJ sequence read archive (DRA) under the study accession number DRA002835.
Author Contributions
KH, KK, and S-KW conceived the ideas and designed the study. KH, S-KW, SS, YC, and RK collected the samples and data from field studies and laboratory experiments. All authors contributed critically to the drafts and gave final approval for publication.
Funding
This work was supported by the Japan Society for the Promotion of Science (KAKENHI Grant Nos. 16H02562 to KH and 18K14787 to S-KW). The funders had no role in study design, data collection and analysis, decision to publish, or preparation of the manuscript.
Conflict of Interest
The authors declare that the research was conducted in the absence of any commercial or financial relationships that could be construed as a potential conflict of interest.
Acknowledgments
We would like to thank the staff of the University of Tokyo’s Misaki Marine Biological Station for their assistance during sampling and Yamada Yosuke (Okinawa Institute of Science and Technology) for his assistance in TEP analyses. We also thank Gemma Richards, Ph.D., from Edanz Group (https://en-author-services.edanz.com/ac) for editing a draft of this manuscript.
Supplementary Material
The Supplementary Material for this article can be found online at: https://www.frontiersin.org/articles/10.3389/fmars.2021.696389/full#supplementary-material
Footnotes
References
Agogué, H., Casamayor, E. O., Bourrain, M., Obernosterer, I., Joux, F., Herndl, G. J., et al. (2005a). A survey on bacteria inhabiting the sea surface microlayer of coastal ecosystems. FEMS Microbiol. Ecol. 54, 269–280. doi: 10.1016/j.femsec.2005.04.002
Agogué, H., Joux, F., Obernosterer, I., and Lebaron, P. (2005b). Resistance of marine bacterioneuston to solar radiation. Appl. Environ. Microbiol. 71, 5282–5289. doi: 10.1128/aem.71.9.5282-5289.2005
Agogué, H., Casamayor, E. O., Joux, F., Obernosterer, I., Dupuy, C., Lantoine, F., et al. (2004). Comparison of samplers for the biological characterization of the sea surface microlayer. Limnol. Oceanogr. Methods 2, 213–225. doi: 10.4319/lom.2004.2.213
Allali, I., Arnold, J. W., Roach, J., Cadenas, M. P., Butsz, N., Hassan, H. N., et al. (2017). A comparison of sequencing plarforms and bioinformatics pipelines fopr compositional analysis of gut microbiome. BMC Microbiol. 17:194. doi: 10.1186/s12866-017-1101-8
Aller, J. Y., Kuznetsova, M. R., Jahns, C. J., and Kemp, P. F. (2005). The sea surface microlayer as a source of viral and bacterial enrichment in marine aerosols. J. Aerosol. Sci. 36, 801–812. doi: 10.1016/j.jaerosci.2004.10.012
Azetsu-Scott, K., and Passow, U. (2004). Ascending marine particles: Significance of transparent exopolymer particles (TEP) in the upper ocean. Limnol. Oceanogr. 49, 741–748. doi: 10.4319/lo.2004.49.3.0741
Bigg, K., and Leck, C. (2008). The composition of fragments of bubbles bursting at the ocean surface. J. Geophys. Res. 113:7. doi: 10.1029/2007jd009078
Buchan, A., LeCleir, G. R., Gulvik, C. A., and Gonzalez, J. (2014). Master recyclers: features and functions of bacteria associated with phytoplankton blooms. Nat. Rev. Microbiol. 12, 686–698. doi: 10.1038/nrmicro3326
Carlucci, A. F., Craven, D. B., and Wolgast, D. M. (1991). Microbial-populations in surface-films and subsurface waters - Amino-acid-metabolism and growth. Mar. Biol. 108, 329–339. doi: 10.1007/BF01344348
Castelino, M., Eyre, S., Moat, J., Fox, G., Martin, P., Ho, P., et al. (2017). Optimisation of methods for bacterial skin microbiome investigation: primer selection and comparison of the 454 versus MiSeq platform. BMC Microbiol. 17:23. doi: 10.1186/s12866-017-0927-4
Cunliffe, M., Harrison, E., Salter, M., Schafer, H., Upstill-Goddard, R. C., and Murrell, J. C. (2009a). Comparison and validation of sampling strategies for the molecular microbial analysis of surface microlayers. Aquat. Microb. Ecol. 57, 69–77. doi: 10.3354/ame01330
Cunliffe, M., and Murrell, J. C. (2010). Eukarya 18S rRNA gene diversity in the sea surface microlayer: implications for the structure of the neustonic microbial loop. ISME J. 4, 455–458. doi: 10.1038/ismej.2009.133
Cunliffe, M., Schafer, H., Harrison, E., Cleave, S., Upstill-Goddard, R., and Murrell, J. C. (2008). Phylogenetic and functional gene analysis of the bacterial and archaeal communities associated with the surface microlayer of an estuary. ISME J. 2, 776–789. doi: 10.1038/ismej.2008.28
Cunliffe, M., Whiteley, A. S., Newbold, L., Oliver, A., Schafer, H., and Murrell, J. C. (2009b). Comparison of bacterioneuston and bacterioplankton dynamics during a phytoplankton bloom in a fjord mesocosm. Appl. Environ. Microbiol. 75, 7173–7181. doi: 10.1128/AEM.01374-09
Cunliffe, M., and Wurl, O. (2014). Guide to best practices to study the ocean’s surface. Plymouth, UK: Occasional Publications of the Marine Biological Association of the United Kingdom, 118.
Engel, A., and Galgani, L. (2016). The organic sea-surface microlayer in the upwelling region off the coast of Peru and potential implications for air–sea exchange processes. Biogeosciences 13, 989–1007. doi: 10.5194/bg-13-989-2016
Falkowska, L. (1999). Sea surface microlayer: a field evaluation of Teflon plate, glass plate and screen sampling techniques. Part 1. Thickness of microlayer samples and relation to wind speed. Oceanol. Acta 41, 211–221.
Franklin, M. P., McDonald, I. R., Bourne, D. G., Owens, N. J. P., Upstill-Goddard, R. C., and Murrell, J. C. (2005). Bacterial diversity in the bacterioneuston (sea surface microlayer): the bacterioneuston through the looking glass. Environ. Microbiol. 7, 723–736. doi: 10.1111/j.1462-2920.2004.00736.x
Galgani, L., and Engel, A. (2013). Accumulation of gel particles in the sea-surface microlayer during an experimental study with the diatom Thalassiosira weissflogii. Int. Geol. Rev. 4, 129–145. doi: 10.4236/ijg.2013.41013
Glockner, F. O., Babenzien, H. D., and Amann, R. (1998). Phylogeny and identification in situ of Nevskia ramosa. Appl. Environ. Microbiol. 64, 1895–1901. doi: 10.1128/AEM.64.5.1895-1901.1998
Hamady, M., Lozupone, C., and Knight, R. (2010). Fast UniFrac: facilitating high-throughput phylogenetic analyses of microbial communities including analysis of pyrosequencing and PhyloChip data. ISME J. 4, 17–27. doi: 10.1038/ismej.2009.97
Harvey, G. W. (1966). Microlayer collection from the sea surface: A new method and initial results. Limonol. Oceanogr. 11, 608–613. doi: 10.4319/lo.1966.11.4.0608
Harvey, G. W., and Burzell, L. A. (1972). A simple microlayer method for small samples. Limonol. Oceanogr. 17, 156–157. doi: 10.4319/lo.1972.17.1.0156
Hoertnagl, P., Perez, M. T., Zeder, M., and Sommaruga, R. (2010). The bacterial community composition of the surface microlayer in a high mountain lake. FEMS Microbiol. Ecol. 73, 458–467. doi: 10.1111/j.1574-6941.2010.00904.x
Hugoni, M., Vellet, A., and Debroas, D. (2017). Unique and higly variable bacterial communities inhabiting the surface micro-layer of an oligotrophic lake. Aquat. Microbiol. Ecol. 79, 115–125. doi: 10.3354/ame01825
Huse, S. M., Welch, D. M., Morrison, H. G., and Sogin, M. L. (2010). Ironing out the wrinkles in the rare biosphere through improved OTU clustering. Environ. Microbiol. 12, 1889–1898. doi: 10.1111/j.1462-2920.2010.02193.x
Joux, F., Agogue, H., Obernosterer, I., Dupuy, C., Reinthaler, T., Herndl, G. J., et al. (2006). Microbial community structure in the sea surface microlayer at two contrasting coastal sites in the northwestern Mediterranean Sea. Aquat. Microb. Ecol. 42, 91–104. doi: 10.3354/ame042091
Kim, M., Morrison, M., and Yu, Z. (2011). Evaluation of different partial 16S rRNA gene sequence regions for phylogenetic analysis of microbiomes. J. Microbiol. Methods 84, 81–87. doi: 10.1016/j.mimet.2010.10.02
Kjelleberg, S., Norkrans, B., Lofgren, H., and Larsson, K. (1976). Surface balance study of interaction between microorganisms and lipid monolayer at the air-water interface. Appl. Environ. Microbiol. 31, 609–611. doi: 10.1128/AEM.31.4.609-611.1976
Kurata, N., Vella, K., Hamilton, B., Shivji, M., Soloviev, A., Matt, S., et al. (2016). Surfactant-associated bacteria in the near-surface layer of the ocean. Sci. Rep. 6:19123. doi: 10.1038/srep19123
Liss, P. S., and Duce, R. A. (1997). The sea surface and global change. Cambridge: Cambridge University Press, 517.
Martinez-Varela, A., Casas, G., Piña, B., Dachs, J., and Vila-Costa, M. (2020). Large enrichment of anthropogenic organic matter degrading bacteria in the sea-surface microlayer at coastal Livingston Island (Antarctica). Front. Microbiol. 11:571983. doi: 10.3389/fmicb.2020.571983
Norkrans, B. (1980). “Surface microlayers in aquatic environments,” in Advances in Microbial Ecology, ed. M. Alexander (New York and London: Plenum Press), 51–83. doi: 10.1007/978-1-4615-8291-5_2
Obernosterer, I., Catala, P., Lami, R., Caparros, J., Ras, J., Bricaud, A., et al. (2008). Biochemical characteristics and bacterial community structure of the sea surface microlayer in the South Pacific Ocean. Biogeosciences 5, 693–705. doi: 10.5194/bg-5-693-2008
Passow, U., and Alldredge, A. L. (1995). A dye-binding assay for the spectrophotometric measurement of transparent exopolymer particles (TEP). Limnol. Oceanogr. 40, 1326–1335. doi: 10.4319/lo.1995.40.7.1326
Porter, K. G., and Feig, Y. S. (1980). The use of DAPI for identifying and counting aquatic microflora. Limnol. Oceanogr. 25, 943–948. doi: 10.4319/lo.1980.25.5.0943
Quince, C., Lanzen, A., Curtis, T. P., Davenport, R. J., Hall, N., Head, I. M., et al. (2009). Accurate determination of microbial diversity from 454 pyrosequencing data. Nat. Methods 6, 639–641. doi: 10.1038/nmeth.1361
Rahlff, J., Stolle, C., Giebel, H.-A., Brinkhoff, T., Ribas-Ribas, M., Hodapp, D., et al. (2017). High wind speeds prevent formation of a distinct bacterioneuston community in the sea-surface microlayer. FEMS Microbiol. Ecol. 93:fix014. doi: 10.1093/femsec/fix041
Rahlff, J., Stolle, C., Giebel, H.-A., Mustafa, N. I. H., Wurl, O., and Herlemann, D. P. R. (2021). Sea foams are ephemeral hotspots distinctive bacteria communities contrasting sea-surface microlayer and underlying surface water. FEMS Microbiol. Ecol. 97:fiab035. doi: 10.1093/femsec/fiab035
Rochelle, P. A., Cragg, B. A., Fry, J. C., Parkes, R. J., and Weightman, A. J. (1994). Effect of sample handling on estimation of bacterial diversity in marine sediments by 16S rRNA gene sequence analysis. FEMS Microbiol. Ecol. 15, 215–225. doi: 10.1111/j.1574-6941.1994.tb00245.x
Salcher, M. M., Posch, T., and Pernthaler, J. (2013). In situ substrate preferences of abundant bacterioplankton populations in a prealpine freshwater lake. ISME J. 7, 896–907. doi: 10.1038/ismej.2012.162
Santos, A. L., Baptista, I., Lopes, S., Henriques, I., Gomes, N. C., Almeida, A., et al. (2012). The UV responses of bacterioneuston and bacterioplankton isolates depend on the physiological condition and involve a metabolic shift. FEMS Microbiol. Ecol. 80, 646–658. doi: 10.1111/j.1574-6941.2012.01336.x
Santos, L., Santos, A. L., Coelho, F. J. R. C., Marcial Gomes, N. C., Dias, J. M., Cunha, A., et al. (2011). Relation between bacterial activity in the surface microlayer and estuarine hydrodynamics. FEMS Microbiol. Ecol. 77, 636–646. doi: 10.1111/j.1574-6941.2011.01147.x
Schloss, P. D., and Westcott, S. L. (2011). Assessing and improving methods used in operational taxonomic unit-based approaches for 16S rRNA gene sequence analysis. Appl. Environ. Microbiol. 77, 3219–3226. doi: 10.1128/AEM.02810-10
Schloss, P. D., Westcott, S. L., Ryabin, T., Hall, J. R., Hartmann, M., Hollister, E. B., et al. (2009). Introducing mothur: Open-source, platform-independent, community-supported software for describing and comparing microbial communities. Appl. Environ. Microbiol. 75, 7537–7541. doi: 10.1128/AEM.01541-09
Shinki, M., Wendeberg, M., Vagle, S., Cullen, J. T., and Hore, D. K. (2012). Characterization of adsorbed microlayer thickness on an oceanic glass plate sampler. Limnol. Oceanogr-Meth. 10, 728–735. doi: 10.4319/lom.2012.10.728
Simon, M., Grossart, H. P., Schweitzer, B., and Ploug, H. (2002). Microbial ecology of organic aggregates in aquatic ecosystems. Aquat. Microb. Ecol. 28, 175–211. doi: 10.3354/ame028175
Stolle, C., Labrenz, M., Meeske, C., and Juergens, K. (2011). Bacterioneuston community structure in the southern Baltic Sea and its dependence on meteorological conditions. Appl. Environ. Microbiol. 77, 3726–3733. doi: 10.1128/AEM.00042-11
Stolle, C., Nagel, K., Labrenz, M., and Jurgens, K. (2009). Bacterial activity in the sea-surface microlayer: in situ investigations in the Baltic Sea and the influence of sampling devices. Aquat. Microb. Ecol. 58, 67–78. doi: 10.3354/ame01351
Stolle, C., Nagel, K., Labrenz, M., and Jurgens, K. (2010). Succession of the sea-surface microlayer in the coastal Baltic Sea under natural and experimentally induced low-wind conditions. Biogeosciences 7, 2975–2988. doi: 10.5194/bg-7-2975-2010
Sun, H., Zhang, Y., Tan, S., Zheng, Y., Zhou, S., Ma, Q.-Y., et al. (2020). DMSP-producing bacteria are more abundant in the surface microlayer than subsurface seawater of the East China Sea. Microb. Ecol. 80, 350–365. doi: 10.1007/s00248-020-01507-8
Suzuki, R., and Ishimaru, T. (1990). An improved method for the determination of phytoplankton chlorophyll using N,N-Dimethylformamide. J. Oceanogr. Soc. Japan 46, 190–194. doi: 10.1007/BF02125580
Tada, Y., Taniguchi, A., Nagao, I., Miki, T., Uematsu, M., Tsuda, A., et al. (2011). Differing growth responses of major phylogenetic groups of marine bacteria to natural phytoplankton blooms in the western North Pacific Ocean. Appl. Environ. Microbiol. 77, 4055–4065. doi: 10.1128/AEM.02952-10
Taylor, J. D., Cottingham, S. D., Billinge, J., and Cunliffe, M. (2014). Seasonal microbial community dynamics correlate with phytoplankton-derived polysaccharides in surface coastal waters. ISME J. 8, 245–248. doi: 10.1038/ismej.2013.178
Taylor, J. D., and Cunliffe, M. (2014). High-throughput sequencing reveals neustonic and planktonic microbial eukaryote diversity in coastal waters. J. Phycol. 50, 960–965. doi: 10.1111/jpy.12228
Tremblay, J., Singh, K., Fern, A., Kirton, E. S., He, S., Woyke, T., et al. (2015). Primer and platform effects on 16S rRNA tag sequencing. Front. Microbiol. 6:771. doi: 10.3389/fmicb.2015.00771
Walsby, A. E., Hayes, P. K., and Boje, R. (1995). The gas vesicles, buoyancy and vertical distribution of cyanobacteria in the Baltic Sea. Eur. J. Phycol. 30, 87–94. doi: 10.1080/09670269500650851
Wurl, O., and Holmes, M. (2008). The gelatinous nature of the sea-surface microlayer. Mar. Chem. 110, 89–97. doi: 10.1016/j.marchem.2008.02.009
Wurl, O., and Obbard, J. P. (2004). A review of pollutants in the sea-surface microlayer (SML): unique habitat for marine organisms. Mar. Pollut. Bull. 48, 1016–1030. doi: 10.1016/j.marpolbul.2004.03.016
Zäncker, B., Cunliffe, M., and Engel, A. (2018). Bacterial community composition in the sea surface microlayer off the Peruvian coast. Front. Microbiol. 9:2699. doi: 10.3389/fmicb.2018.02699
Zäncker, B., Cunliffe, M., and Engel, A. (2021). Eukaryotic community composition in the sea surface microlayer across an east-west transect in the Mediterranean Sea. Biogeosciences. 18, 2107–2118. doi: 10.5194/bg-18-2107-2021
Zhang, Z., Liu, L., Liu, C., and Cai, W. (2003). Studies on the sea surface microlayer: II. The layer of sudden change of physical and chemical properties. J. Colloid. Interf. Sci. 264, 148–159. doi: 10.1016/s0021-9797(03)00390-4
Zhang, Z., Lui, L., Wu, Z., Li, J., and Ding, H. (1998). Physicochemical studies of the sea surface microlayer: I. Thickness of the sea surface microlayer and its experimental determination. J. Colloid. Interf. Sci. 204, 294–299. doi: 10.1006/jcis.1998.5538
Keywords: air-sea interaction, bacterioneuston, transparent exopolymer particles, sea surface microlayer, bacterial community
Citation: Wong S-K, Suzuki S, Cui Y, Kaneko R, Kogure K and Hamasaki K (2021) Sampling Constraints and Variability in the Analysis of Bacterial Community Structures in the Sea Surface Microlayer. Front. Mar. Sci. 8:696389. doi: 10.3389/fmars.2021.696389
Received: 16 April 2021; Accepted: 09 June 2021;
Published: 28 June 2021.
Edited by:
Tony Gutierrez, Heriot-Watt University, United KingdomReviewed by:
Yuichi Nosaka, Tokai University, JapanMichael Thomas Montgomery, Texas A&M University Corpus Christi, United States
Stephen Summers, Nanyang Technological University, Singapore
Copyright © 2021 Wong, Suzuki, Cui, Kaneko, Kogure and Hamasaki. This is an open-access article distributed under the terms of the Creative Commons Attribution License (CC BY). The use, distribution or reproduction in other forums is permitted, provided the original author(s) and the copyright owner(s) are credited and that the original publication in this journal is cited, in accordance with accepted academic practice. No use, distribution or reproduction is permitted which does not comply with these terms.
*Correspondence: Shu-Kuan Wong, d29uZy5zaHUua3VhbkBuaXByLmFjLmpw; Koji Hamasaki, aGFtYXNha2lAZy5lY2MudS10b2t5by5hYy5qcA==