 Patricia Grasse1,2*
 Kristin Haynert3
 Kristin Doering2
 Sonja Geilert2
 Janice L. Jones4
 Mark A. Brzezinski4
 Martin Frank2
- 1German Centre for Integrative Biodiversity Research (iDiv) Halle-Jena-Leipzig, Leipzig, Germany
- 2GEOMAR Helmholtz Centre for Ocean Research, Kiel, Kiel, Germany
- 3Senckenberg am Meer, Marine Research Department, Wilhemshaven, Germany
- 4Marine Science Institute and the Department of Ecology, Evolution, and Marine Biology, University of California, Santa Barbara, Santa Barbara, CA, United States
The upwelling area off Peru is characterized by exceptionally high rates of primary productivity, mainly dominated by diatoms, which require dissolved silicic acid (dSi) to construct their frustules. The silicon isotope compositions of dissolved silicic acid (δ30SidSi) and biogenic silica (δ30SibSi) in the ocean carry information about dSi utilization, dissolution, and water mass mixing. Diatoms are preserved in the underlying sediments and can serve as archives for past nutrient conditions. However, the factors influencing the Si isotope fractionation between diatoms and seawater are not fully understood. More δ30SibSi data in today’s ocean are required to validate and improve the understanding of paleo records. Here, we present the first δ30SibSi data (together with δ30SidSi) from the water column in the Peruvian Upwelling region. Samples were taken under strong upwelling conditions and the bSi collected from seawater consisted of more than 98% diatoms. The δ30SidSi signatures in the surface waters were higher (+1.7‰ to +3.0‰) than δ30SibSi (+1.0‰ to +2‰) with offsets between diatoms and seawater (Δ30Si) ranging from −0.4‰ to −1.0‰. In contrast, δ30SidSi and δ30SibSi signatures were similar in the subsurface waters of the oxygen minimum zone (OMZ) as a consequence of a decrease in δ30SidSi. A strong relationship between δ30SibSi and [dSi] in surface water samples supports that dSi utilization of the available pool (70 and 98%) is the main driver controlling δ30SibSi. A comparison of δ30SibSi samples from the water column and from underlying core-top sediments (δ30SibSi_sed.) in the central upwelling region off Peru (10°S and 15°S) showed good agreement (δ30SibSi_sed. = +0.9‰ to +1.7‰), although we observed small differences in δ30SibSi depending on the diatom size fraction and diatom assemblage. A detailed analysis of the diatom assemblages highlights apparent variability in fractionation among taxa that has to be taken into account when using δ30SibSi data as a paleo proxy for the reconstruction of dSi utilization in the region.
Introduction
Exceptionally high rates of primary productivity characterize the upwelling area off Peru, as upwelling of silicic acid (Si(OH)4), hereafter referred to as dSi, orthophosphate (PO43–), nitrate (NO3–) and total dissolved iron (dFe) stimulate phytoplankton growth (Bruland et al., 2005). During austral summer, the Peruvian upwelling zone is dominated by diatoms, which require dSi that they deposit in their cell walls forming opaline shells called frustules (e.g., Paasche, 1973). The contribution of diatoms to global primary productivity links the marine silicon (Si) cycle to the carbon (C) cycle and exerts a strong control on C export from the atmosphere thereby directly impacting present and past climate (e.g., Tréguer et al., 2018). Off Peru, the export of plankton and its decomposition at depth produces one of the largest subsurface oxygen minimum zones (OMZs) in the global ocean (Pennington et al., 2006; Karstensen et al., 2008).
Dissolved silicon (Si) isotopes (δ30SidSi) are a powerful tool for understanding biogeochemical processes such as the utilization of dSi as well as intermediate and deep-water mass mixing in today’s ocean (e.g., de Souza et al., 2012; Grasse et al., 2013). During utilization of dSi, diatoms preferentially incorporate the lighter 28Si isotope leaving the seawater enriched in heavier isotopes of Si, 30Si and 29Si (e.g., De La Rocha et al., 1997). The isotopic signal preserved in diatom frustules (δ30SibSi_sed.) in the underlying sediments can therefore serve as a proxy to reconstruct the utilization of dSi in surface waters in the past (e.g., De La Rocha et al., 1998; Ehlert et al., 2013, 2015; Doering et al., 2019).
Despite the potential of the diatom δ30SibSi_sed. paleo proxy, only a few data sets for δ30SibSi in the world’s ocean are available and most are from the Southern Ocean. Overall, the δ30SibSi in the upper 50 m of the world’s ocean shows a broad range of signatures between −0.2‰ and +3.42‰ (Varela et al., 2004, 2016; Cardinal et al., 2007; Cavagna et al., 2011; Fripiat et al., 2011, 2012; Cao et al., 2012; Closset et al., 2016). The δ30SibSi values are typically inversely related to the dSi concentration ([dSi]), reflecting fractionation during nutrient utilization. While the lowest δ30SibSi values have been observed in the East China Sea (Cao et al., 2012) as a consequence of the influence of riverine and lithogenic inputs, the highest values so far have been reported from the Canada Basin of the Arctic Ocean, possibly reflecting the contribution of isotopically heavy sea ice diatoms (Varela et al., 2016).
The range of δ30SibSi in surface waters can depend both on the isotopic value of the dSi source and on any taxon-specific variation in the fractionation factor between seawater and diatoms (30ε). Culture studies have revealed variations in 30ε between diatom species (Sutton et al., 2013). In addition, environmental and physiological factors can play a role. While two Southern Ocean diatom species (Eucampia antarctica and Proboscia inermis) exhibited significant variation of 30ε under Fe-replete and Fe-limiting conditions, this effect was not observed in Thalassiosira pseudonana (Meyerink et al., 2017). In contrast, the fractionation factor seems to be independent of temperature (3–22°C; De La Rocha et al., 1997; Sun et al., 2014), pCO2 concentration (Milligan et al., 2004) and growth rate (Sun et al., 2014).
The actual mechanism of Si isotope fractionation by diatoms is not well understood. Most biological fractionation processes (e.g., C, N) are enzymatically driven (e.g., Fry, 1996; Needoba et al., 2004) but enzymes are not known to be involved in the biological polymerization of Si. However, studies of Si uptake by various diatom species revealed that silicon transport proteins (SITs) mediate the transport of dSi into the cell, especially at low [dSi] (<30 μmol L–1; Thamatrakoln and Hildebrand, 2008). In contrast, Si uptake can be diffusion-controlled at high [dSi] (Hildebrand et al., 1997; Thamatrakoln and Hildebrand, 2008). Efflux of dSi from diatom cells also occurs and may be mediated by efflux proteins (Shrestha et al., 2012) although this process does not seem to contribute to fractionation (Milligan et al., 2004). So far, it is unclear whether the discriminatory step causing isotopic fractionation is the transport of dSi across the membrane or the polymerization process within the cell that converts dSi into amorphous SiO2 within the silicon deposition vesicle (SDV; Milligan et al., 2004; Hildebrand, 2008; Brunner et al., 2009). The latter mechanism would require that the heavier isotopes that are discriminated against during polymerization leave the cell. Laboratory studies on abiotic Si polymerization found that the fractionation between amorphous and dissolved Si (Δ30Siamorphous–dissolved) phases are strongly dependent on pH, temperature and salinity (Stamm et al., 2019; Zheng et al., 2019). These experiments revealed a positive offset of the amorphous Si isotope composition from the dissolved phase (+0.5‰) at seawater pH (pH 8, 23–25°C) assuming equilibrium fractionation. However, it is unclear whether these results can be applied to polymerization within the diatom cell.
In seawater, the evolution of δ30SidSi and δ30SibSi and the corresponding fractionation factors (30ε) during diatom growth are commonly estimated using two conceptual models: a steady-state model (open system) and a Rayleigh-type model (closed system). Previous studies in the Pacific have shown a broad range in 30ε (−0.6‰ and −2.7‰) depending on the applied model (Reynolds et al., 2006; Ehlert et al., 2012; Grasse et al., 2016; Varela et al., 2016). The applicability of each model depends on the nature of the dSi supply. In eutrophic offshore regions of the Pacific outside the zone of active upwelling, the Rayleigh-type model is more applicable, whereas, in the zone of active upwelling, the open system model is appropriate. Both models can describe the evolution of δ30SidSi in the upwelling area off Peru, depending on the timing of the upwelling (Ehlert et al., 2012).
In this study, we present δ30SidSi and δ30SibSi data from the upper 350 m of the water column in the upwelling area off Peru together with the taxonomic composition of the diatom assemblages obtained from surface water samples to investigate the main controls on δ30SidSi and δ30SibSi. Previous studies in the Eastern Tropical South Pacific (ETSP) have only investigated δ30SidSi in the water column (Ehlert et al., 2012; Grasse et al., 2013, 2016, 2020) and δ30SibSi in the sediments (δ30SibSi_sed.; Doering et al., 2016a; Doering et al., 2016b; Ehlert et al., 2012) and until recently no δ30SibSi from diatoms in seawater in this region have been available. Our study provides the first δ30SibSi data from the Peruvian water column, which are compared to previously published δ30SibSi_sed. signatures from surface sediments to evaluate the applicability of δ30SibSi_sed. as a paleo proxy in the complex environment of the Peruvian coastal upwelling system.
Materials and Methods
Samples were taken at nine stations, between 12.87°S and 13.99°S, with a maximum distance of approximately 38 nautical miles (70 km) from the Peruvian coast in February 2013 (RV Meteor, Cruise M93; Figure 1). Seawater samples for diatom assemblages, as well as [dSi], [bSi], δ30SidSi, δ30SibSi, salinity, temperature, and oxygen were collected using a Seabird conductivity-temperature-depth (CTD) Rosette System equipped with Niskin water samplers and oxygen sensors. Oxygen concentrations measured by the O2-sensor on the CTD were calibrated against water samples for O2 determination by Winkler titration (Winkler, 1988). Nutrient concentrations were directly measured on board with an autoanalyzer (TRAACS 800, Bran & Lubbe, Hamburg, Germany) according to Grasshoff et al. (1999). In total, 3–5 L of seawater were collected per depth to ensure that sufficient sample material was available for all parameters.
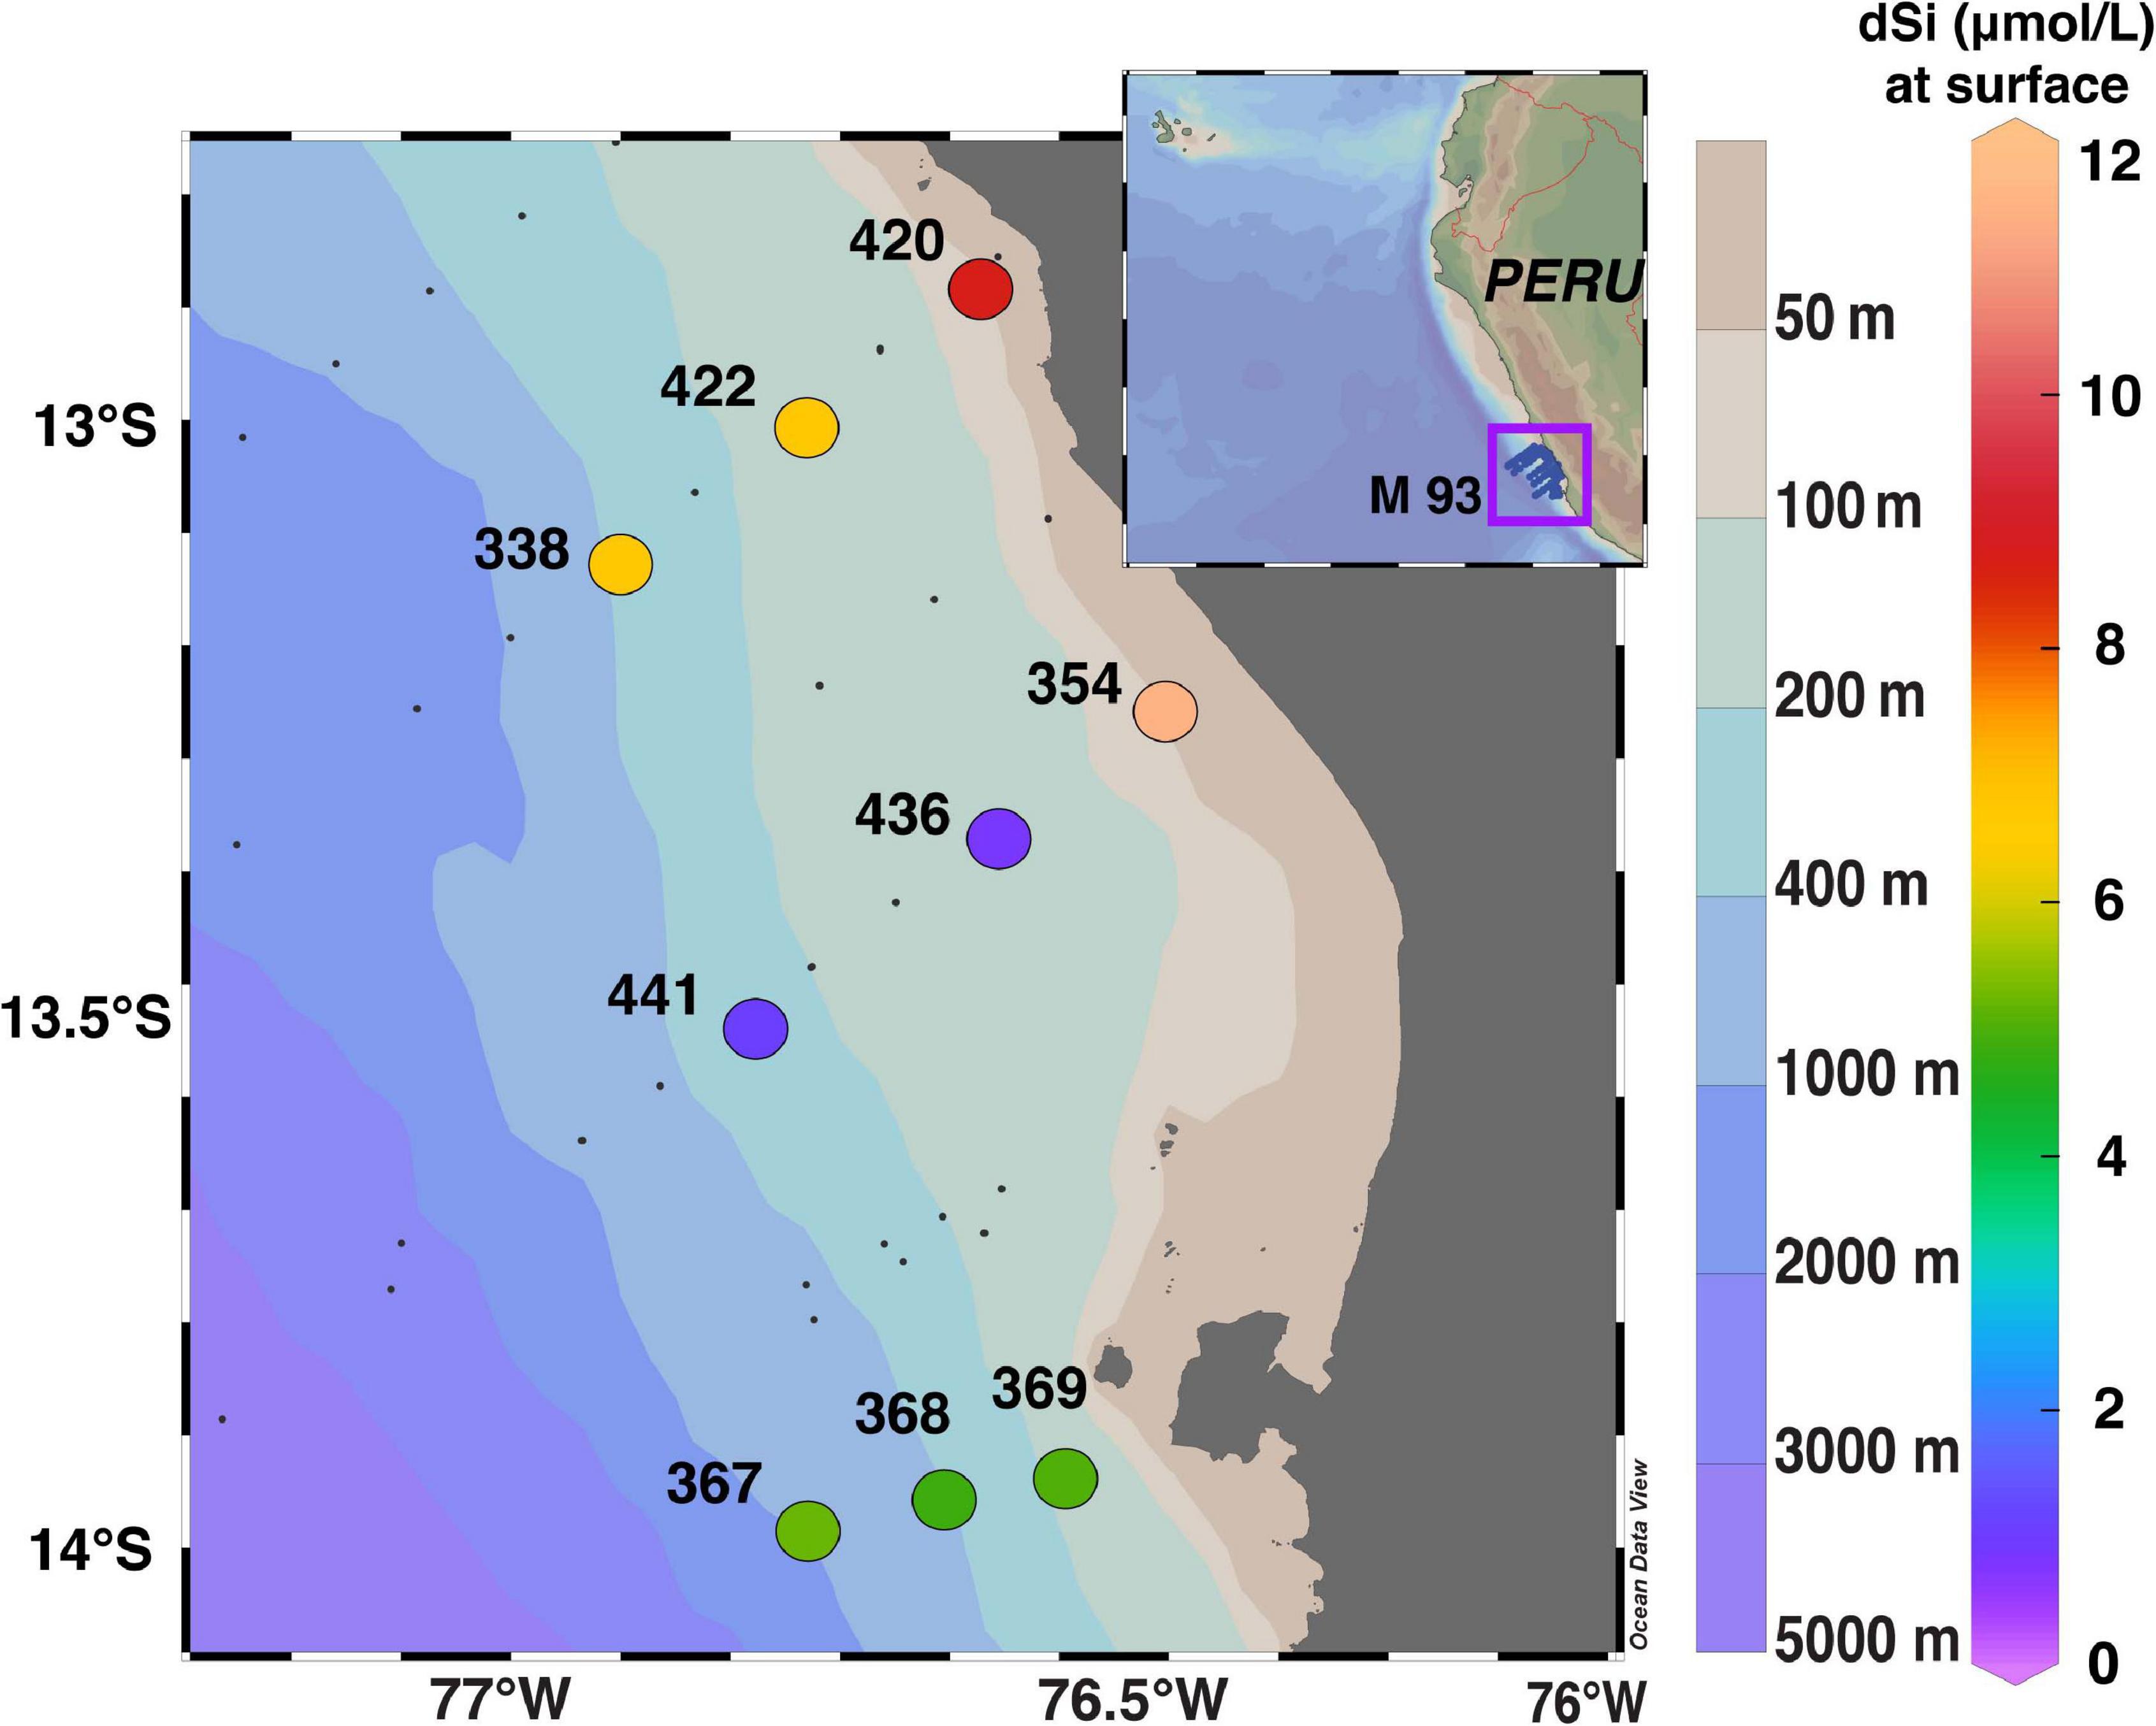
Figure 1. Sampling locations with station numbers off Peru (R/V Meteor cruise M93, February 2013). Color shading indicates [dSi] (in μmol L–1) in surface waters. Bottom depth at sampling locations ranges between 60 and 760 m. The maximum distance of stations from the coast is approximately 70 km. Data were plotted using ODV 4.6.2 (Schlitzer, 2020).
Diatom Cell Counts
Diatom cell counts were determined in 50 mL subsamples from surface waters. The samples were acidified with 5 μL HCL (30%) to stop grazing processes and further utilization of dSi. This procedure was chosen as no conventional chemicals (e.g., Lugol’s solution) used for cell preservation were available onboard. The low pH (∼ 2) dissolved calcareous organisms and only silicon or chitin-bearing skeletons remained. For identification, individuals were analyzed to species or genus level and counted under an inverse light microscope (Zeiss with a 250-fold magnification, 25x = 5μm; Ocular: 10×) according to Utermöhl (1958). Relative abundances were obtained as the ratio of total cell counts of (i) siliceous organisms (diatoms, diatom resting spores (RS), radiolaria, silicoflagellates, and sponges) and (ii) all diatoms versus the respective group (i) or taxa (ii).
dSi and bSi Sampling and Chemical Preparation
For analysis of δ30SidSi, 500 mL seawater was filtered through nitrocellulose acetate filters (MERCK, 0.45 μm pore size, 142 mm) and stored without a preservative in acid clean polypropylene bottles in the dark. At GEOMAR, the pH of samples was raised with NaOH to precipitate Mg(OH)2 together with dSi from seawater (MAGIC; Reynolds et al., 2006) after Karl and Tien (1992). Only samples with [dSi] yields > 97% were accepted for isotopic measurements, given that incomplete precipitation can lead to isotopic fractionation of the samples.
For δ30SibSi collection up to 5 L of seawater was filtered through polycarbonate filters (Whatman®, 0.65 μm pore size, 47 mm), and the filter containing the collected particles dried overnight at 40°C. The bSi concentrations were measured using a 1 step sodium hydroxide digestion method described in Brzezinski and Nelson (1989) and Varela et al. (2016). Preparations of filters and concentration measurements were conducted at the University of California, Santa Barbara (UCSB). The optimal leaching time was assessed via test filters from the Peruvian Upwelling. Tests were conducted for a maximum of 140 min. During the first 35 min a steep increase in [bSi] was observed given that bSi dissolves faster than lithogenic material. No significant increase in [bSi] was detectable thereafter (3%). The bSi samples were accordingly leached for 35 min with 4 mL 0.2 N NaOH in a 95°C water bath (for details, see Varela et al. (2016). Although Ragueneau and Tréguer (1994) pointed out that up to 15% of lithogenic silicate (lSi) can dissolve during sodium hydroxide digestion, our own measurements provide evidence that lSi dissolution in our samples is much lower (3%). Assuming that the samples contained up to 15% of lSi, the reported δ30SibSi values may be underestimated by 0.2‰ assuming a mean of −1.07‰ for clay minerals (lithogenic primary minerals are heavier −0.2‰ and thus result in an offset of 0.03‰; Sutton et al., 2018), which is within analytical error. The digested bSi samples were analyzed for their Al content using an Agilent 7500 series quadrupole ICPMS at GEOMAR to gain additional information about potential lithogenic contamination of the separated bSi fraction (Shemesh et al., 1988).
Samples for δ30SidSi and δ30SibSi measurements were chromatographically purified using AG 50W-X8 cation resin following the method of Georg et al. (2006) as modified by de Souza et al. (2012).
δ30SidSi and δ30SibSi Measurements
The δ30SidSi and δ30SibSi were measured on a NuPlasma MC-ICPMS (Nu InstrumentsTM, Wrexham, United Kingdom) at GEOMAR. For a detailed description of the method, see Ehlert et al. (2012). Si isotope compositions are reported in the δ-notation representing the deviations of the isotope ratios of the samples from that of the reference standard NBS28 in parts per thousand (δ30Si = ([Rsample/RNBS28] −1) × 1000). R represents the heavy-to-light isotope ratio (30Si/28Si) of the samples and the NBS28 standard, respectively.
The analysis of individual samples was repeated two to six times in different analytical sessions (n = analytical replicate) with a few exceptions that were only measured once (Supplementary Table 1). More than 50% of the samples were full replicates, including the MAGIC co-precipitation step for dSi samples and column chemistry for both dSi and bSi samples. Sample reproducibility (2 s.d.) generally ranged between 0.01 to 0.2‰, except for six samples for which only 0.3‰ (2 s.d.) were achieved.
The accuracy of the measurements was checked daily using solid reference standards (BB, Diatomite, IRMM18) and resulted in a mean δ30Si of −10.71 ± 0.20‰ (2 s.d., n = 28), +1.22 ± 0.14‰ (2 s.d., n = 14) and −1.50 ± 0.22‰ (2 s.d., n = 14), which are in good agreement to consensus values reported by Reynolds et al. (2007). The inter-calibration standards ALOHA1000 and ALOHA300 resulted in +1.26 ± 0.22‰ (Mean, 2 s.d.; Median: +1.26, n = 8) and +1.69 ± 0.16‰ (Mean, 2 s.d.; Median: 1.69, n = 5), which is in very good agreement to the mean value obtained by the GEOTRACES inter-calibration study from Grasse et al. (2017; +1.24 ± 0.20‰; +1.68 ± 0.35‰, Mean, 2 s.d.).
The isotope fractionation of Si is mass-dependent resulting in a linear relationship between δ30Si and δ29Si that depends on the fractionation process (equilibrium vs. kinetic fractionation; Supplementary Figure 1). The slope of the resulting correlation is thus an indicator for the quality of δ30Si measurements, as any polyatomic interferences during MC-ICP-MS measurements would lead to an offset from the predicted fractionation line. As shown in Supplementary Figure 1, the least-squares linear regression between δ30Si and δ29Si is in excellent agreement. It produces a slope of 0.509 ± 0.02 (r2 = 0.99), which is indistinguishable from the theoretical values of equilibrium and kinetic fractionations (0.518 and 0.505, respectively; Young et al., 2002).
Calculation of the Apparent and Modeled Fractionation Factors
The offset between seawater and diatoms is often expressed as an apparent fractionation factor (Δ30Si)
For Δ30Si the propagated error is provided, which is defined by the square root of the sum of the squares of the 2 s.d. (2σ) error (). However, this value only represents sampling and analytical uncertainties and does not take into water mass mixing into account, the effect of water mass age, the utilization of [dSi] and other factors in the environment that can alter the effect of biological fractionation alone.
The temporal evolution of δ30SidSi and δ30SibSi can be described using two conceptual models: a Rayleigh-type model (closed) or a steady-state model (open) system which includes the utilized fraction (f = dSiobs./dSiinit.) of the available dSi pool. To obtain dSiobs, we used the average [dSi] between 50 to 150 m from each station.
Rayleigh-type model (Closed):
Steady-state model (Open):
where δ30SidSi_init. represents δ30SidSi defined as the source of dSi, δ30SidSi_obs is the Si isotope composition measured in surface waters, ε30Si is the fractionation factor between the [dSi] and the diatoms produced, δ30SibSi_inst. is the Si isotope composition of the instantaneously produced diatoms at each point in time and δ30SibSi_acc. is the silicon isotope composition of the accumulated diatoms integrated over time. Both models assume a constant 30ε, which is given by the slope of the linear regression between δ30SidSi_obs and ln f for the Rayleigh-type system model and δ30SidSi_obs and f for the steady-state model. Both models were applied for the mixed layer (ML, defined as oxygenated euphotic zone, upper 40 m, see also Figure 4 and Supplementary Table 1) and included data from Ehlert et al. (2012) and Grasse et al. (2016).
Results
Diatom Assemblages in Surface Waters
Microscopic analysis of the nine surface water samples showed that diatoms (dominating species: Cerataulina pelagica, Thalassiosira spp., Chaetoceros spp.) numerically dominated the siliceous plankton in most samples (98–100%, Figure 2). The observed diatom valves were mainly vegetative cells, but at stations 338, 368, and 436 diatom resting spores (RS) were present with relative abundances ranging from 1 to 6%. Other siliceous plankton were only observed at stations 354, 368, 420 and 436 (1% radiolaria) and St. 368 (2% silicoflagellates). St. 368 contained 2% sponge spicules (Figure 2A and Supplementary Table 2). This information is crucial given that organisms such as radiolaria, silicoflagellates, choanoflagellates, or sponge spicules would have been dissolved along with diatoms in the NaOH leach potentially impacting the δ30SibSi signatures because their fractionation factors are either unknown or larger than those of diatoms (up to −5‰ and −7‰ in sponges and choanoflagellates, respectively, compared to −1.1‰ in diatoms (Hendry et al., 2012; Sutton et al., 2018; Marron et al., 2019).
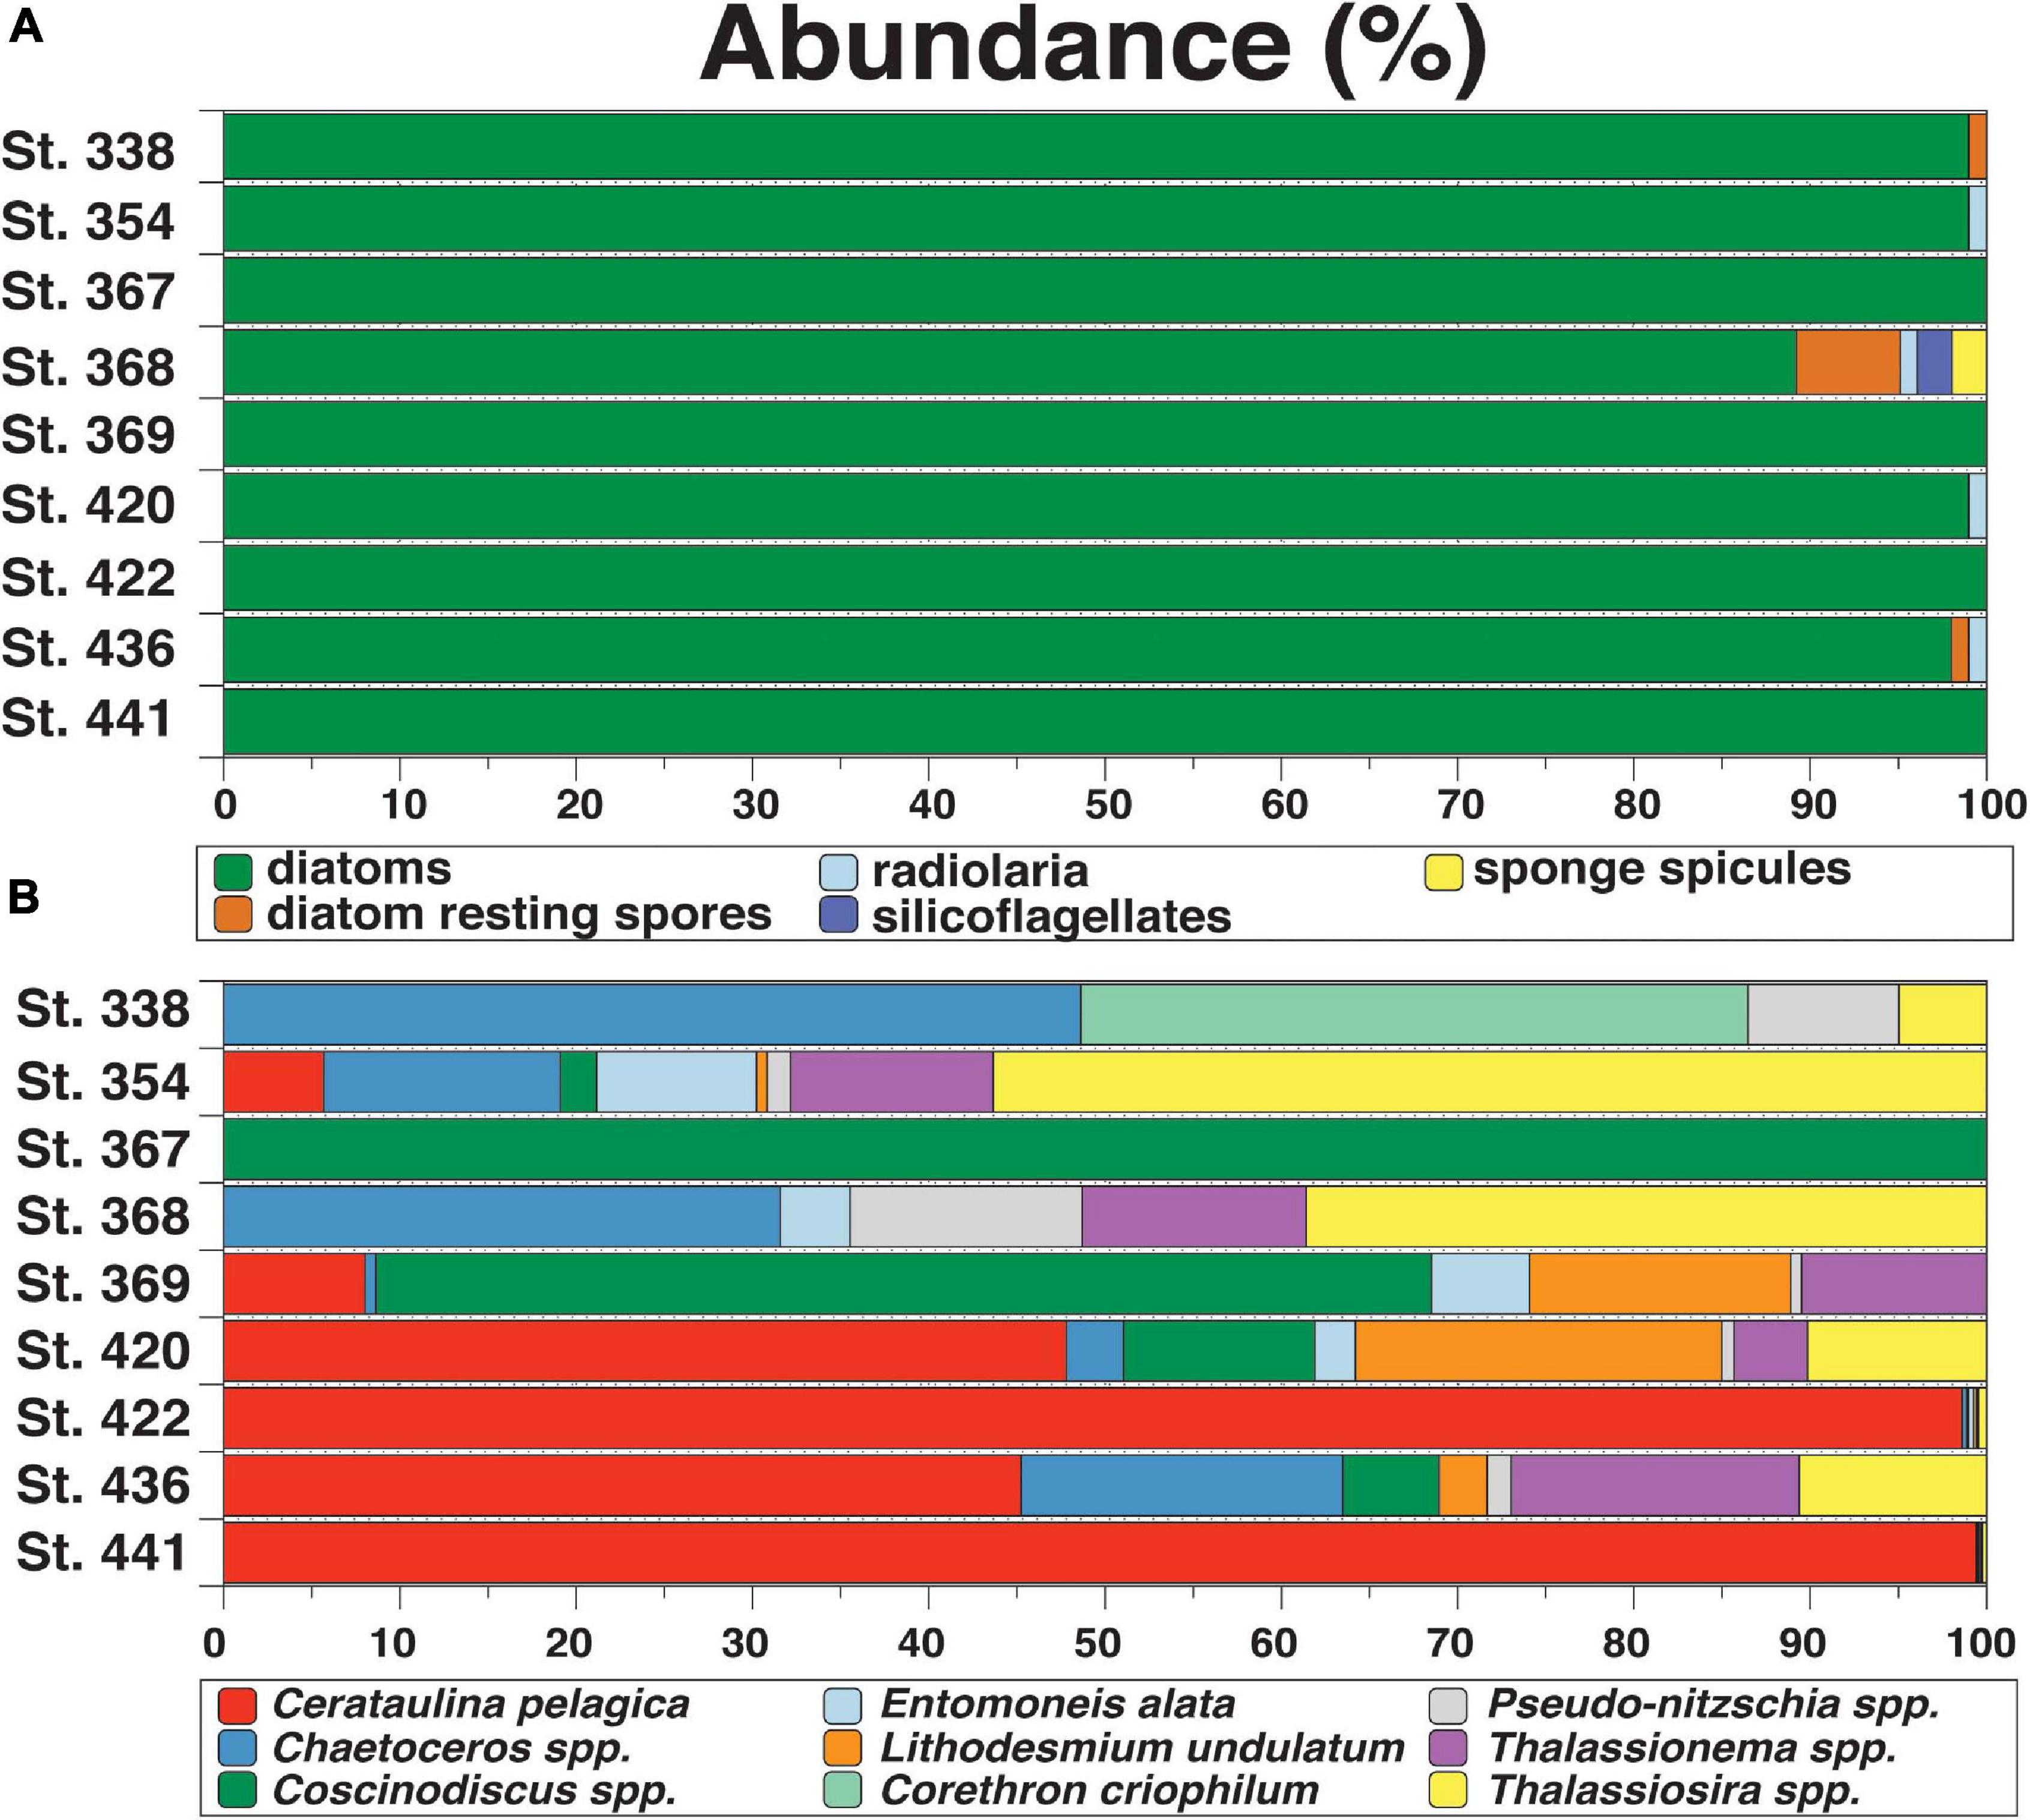
Figure 2. Relative abundances of (A) siliceous organisms including diatoms, resting spores, radiolaria, silicoflagellates, and sponges in surface waters and of (B) diatom taxa (in %) reaching abundances >5%. For a list of all diatom taxa, see Supplementary Table 3. Please note that the diatoms of St. 367 only consisted of one specimen of Coscinodiscus spp. and primarily filamentous cyanobacteria were observed.
The diatom community comprised 22 taxa (see Supplementary Table 3 for a complete list). Total diatom abundances ranged between 0.02 and 6333 × 103 cells L–1 between sampling stations. St. 367 had the lowest diatom cell count only containing a single specimen (Coscinodiscus spp.) and mainly consisted of filamentous cyanobacteria (species unknown). The highest counts were found at stations 422 and 441, dominated by the centric diatom C. pelagica with relative abundances of 99 to 100%. At stations 436 and 420 C. pelagica dominated the diatom assemblage with approximately 50%. The genus Chaetoceros spp. and the species Corethron criophilum were most abundant at stations 338 with 44 and 34%. The centric diatom Thalassiosira spp. revealed highest abundances reaching 51% at station 354 (Figure 2B).
Al/Si Ratios in Particulate Silica
The limited amount of sample material did not allow Al/Si measurements of all samples (Supplementary Table 1). Surface samples generally had low Al/Si ratios between 2 and 25 mM M–1 (Median: 21 mM M–1), with one exception of Station 367 (20 m), for which the highest Al/Si ratios of 188 mM M–1 were determined (Figure 3A and Supplementary Table 1). Samples within the OMZ and the oxycline ranged between 0 and 147 mM M–1 (Median: 25.1 mM M–1).
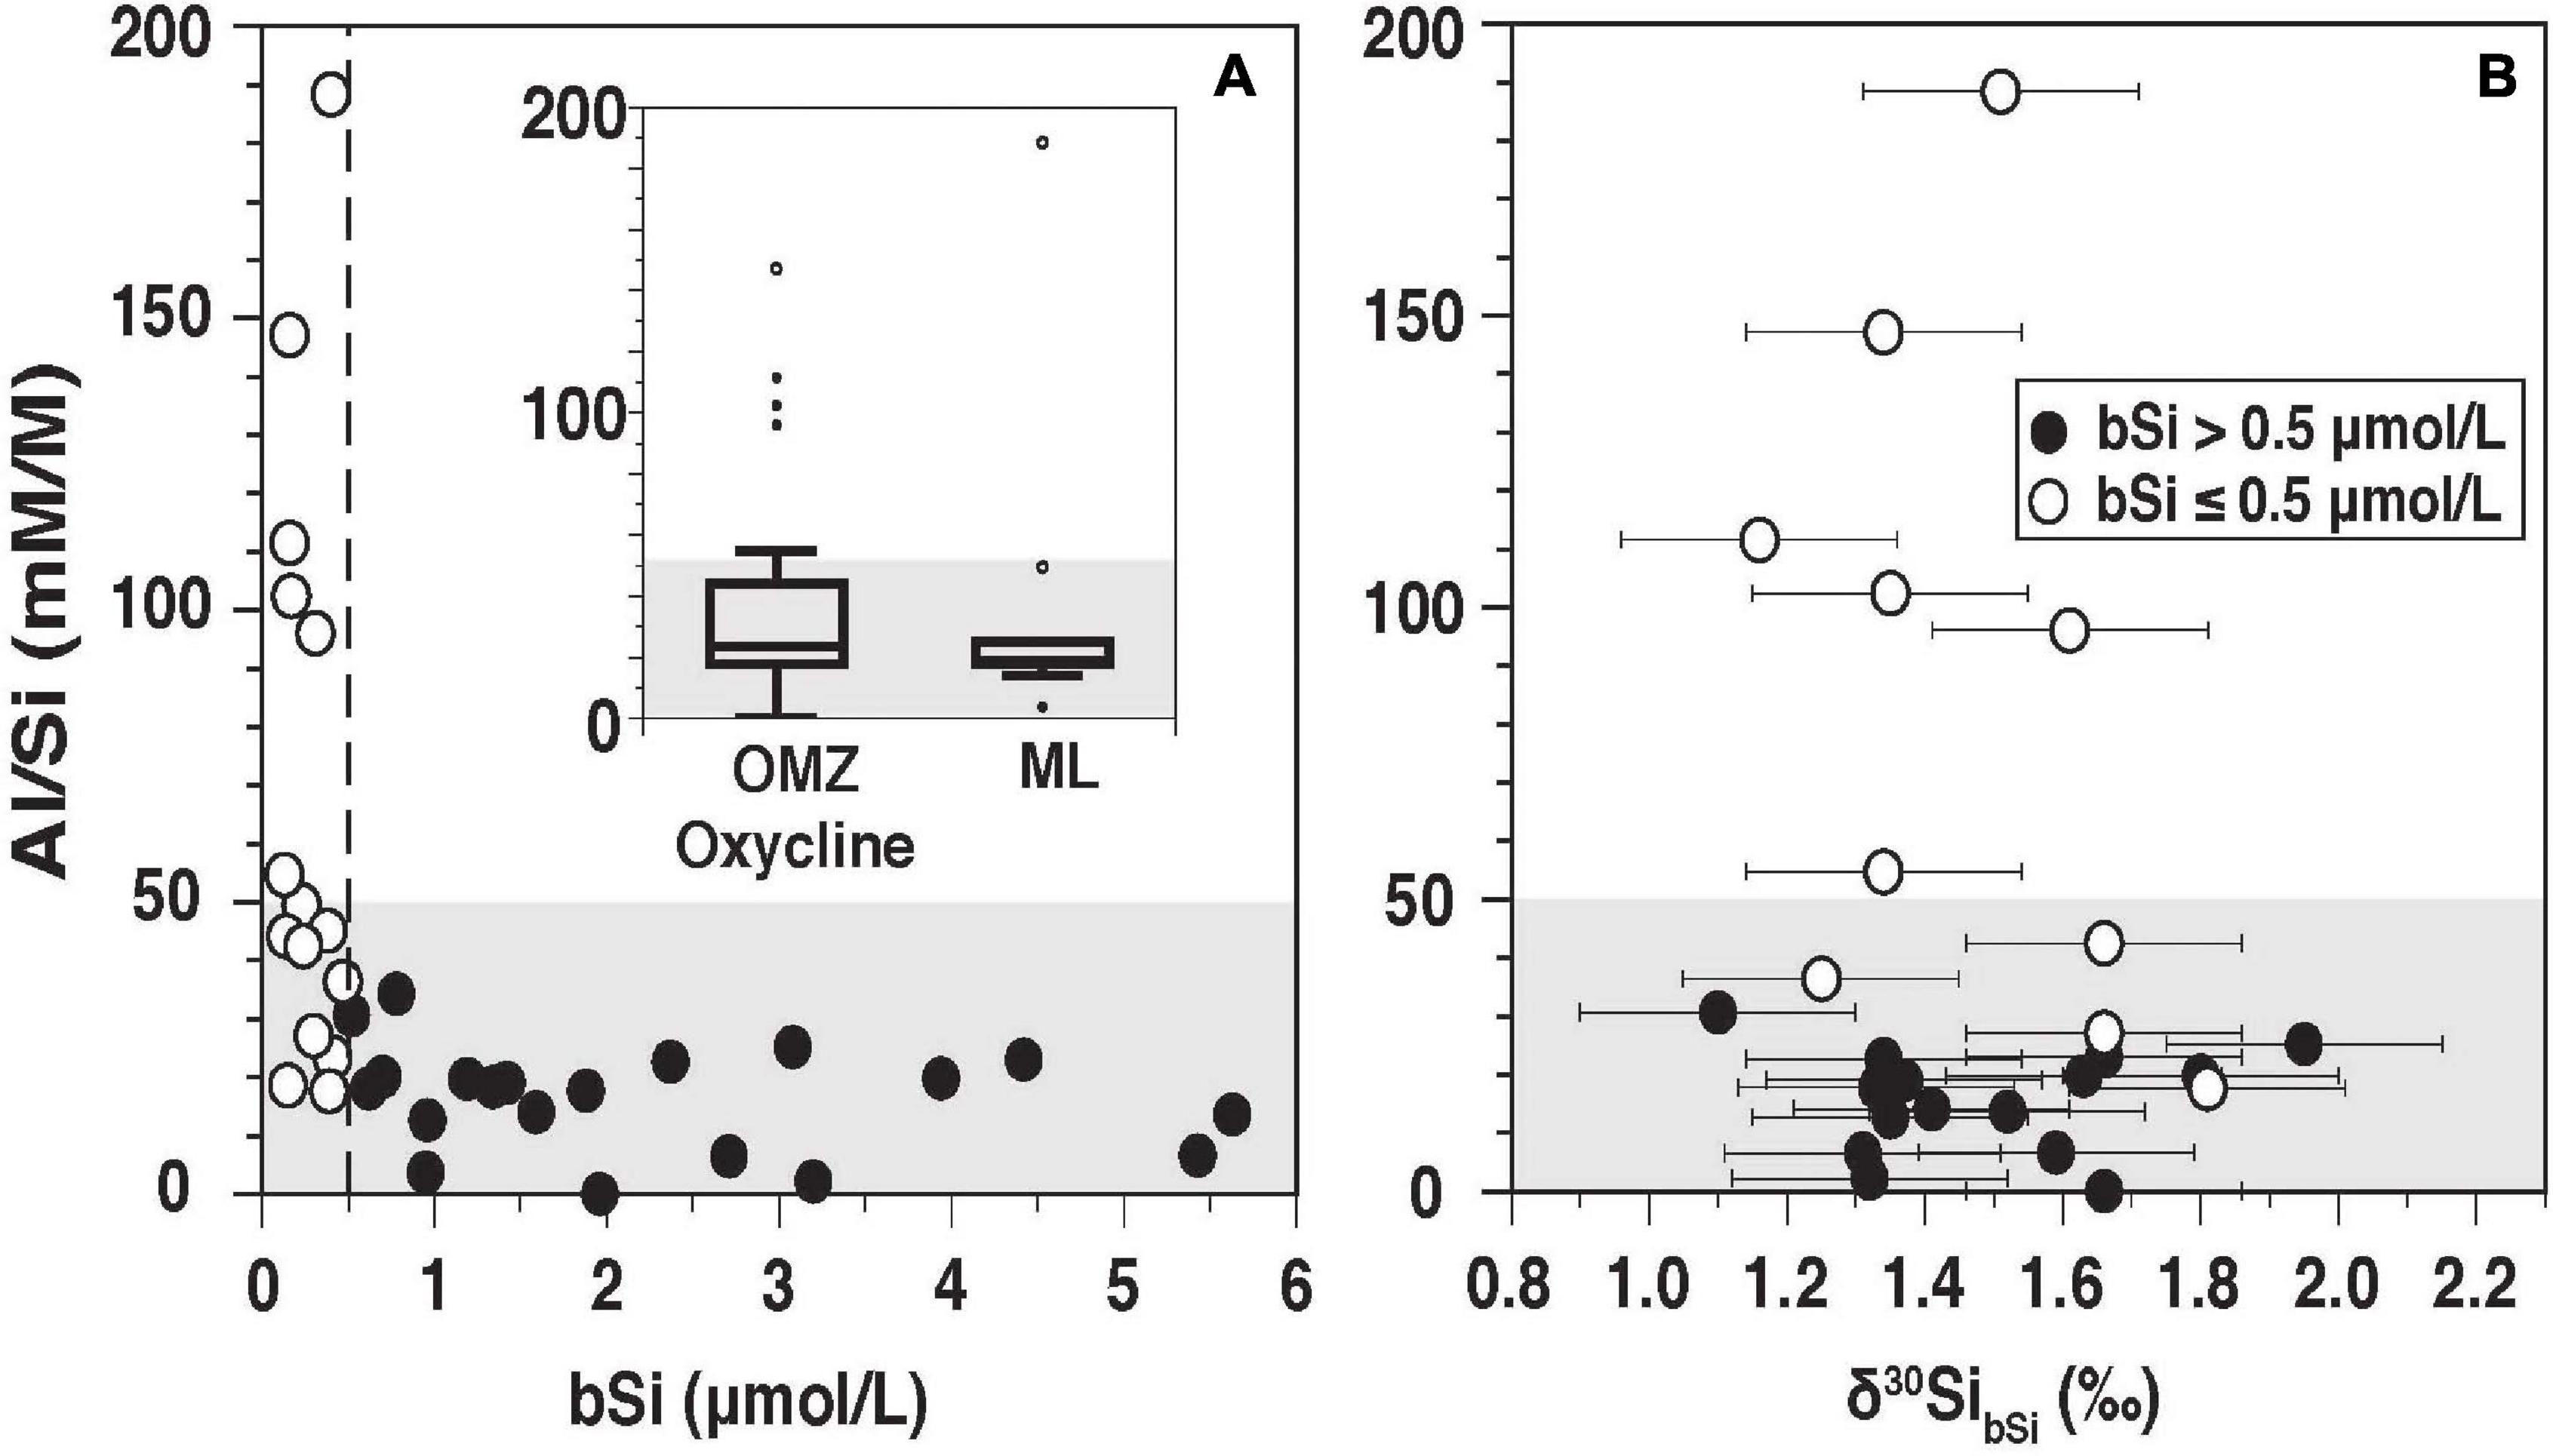
Figure 3. Al/Si (mM M–1) versus [bSi] (A) and δ30SibSi (B) The Inlet figure in (A) shows Al/Si ratios for samples in the OMZ/and the oxycline and the ML. Open symbols indicate samples with [bSi] ≤ 0.5 μmol L–1. Closed black symbols indicate samples with [bSi] > 0.5 μmol L–1. The gray shaded area indicates negligible Al (Al/Si < 50 mM M–1) contamination, according to Ehlert et al. (2012).
Living diatoms can have Al/Si ratios as low as 2 mM M–1 and generally do not exceed 8 mM M–1 (Koning et al., 2007; Köhler et al., 2017), which is comparable to, or lower than, observations in the ML of the Peruvian Upwelling. However, this ratio can change depending on the Al concentration of the surrounding water (up to 70 mM M–1; Köhler et al., 2017; Machill et al., 2013). Unfortunately, the Al concentrations in seawater were not measured during the cruise and there are hardly any published data from the Peruvian margin (Barraqueta et al., 2020). A study by Ho et al. (2019) along the GEOTRACES transect (GP16) from Peru to Tahiti found overall low Al concentration between 1 and 2 nmol kg–1 further away the Peruvian coast (for comparison Atlantic surface water Al is close to 20 nmol kg–1; Barraqueta et al., 2020). However, the Ho et al. (2019) open ocean data are most likely not representative for Al concentrations on the shelf. It is more likely that high Al/Si ratios in the OMZ/oxycline and in one surface sample (St. 367), during the sampling of which a cyanobacteria bloom occurred, are the result of post-mortem adsorption of Al to the diatom frustules as previously observed by Koning et al. (2007).
The Al/Si ratios in biogenic samples thus strongly depend on external factors and the conditions of the diatom cells (living vs. dead) and do not necessarily exclusively indicate contamination with lithogenic material. This complicates the reliable application of the Al/Si correction proposed by Ragueneau et al. (2005).
Given that no clear difference in δ30SibSi was observed for samples with high and low Al/Si ratios and due to the reasons mentioned above (Figure 3B), we included all δ30SibSi in our analyses. Still, we highlight samples with Al/Si ratios above 50 mM M–1 and bSi < 0.5 μmol L–1 without Al/Si ratios in Figures 4, 5, which had been adopted as a threshold for lithogenic contamination in a previous study in the region by Ehlert et al. (2012).
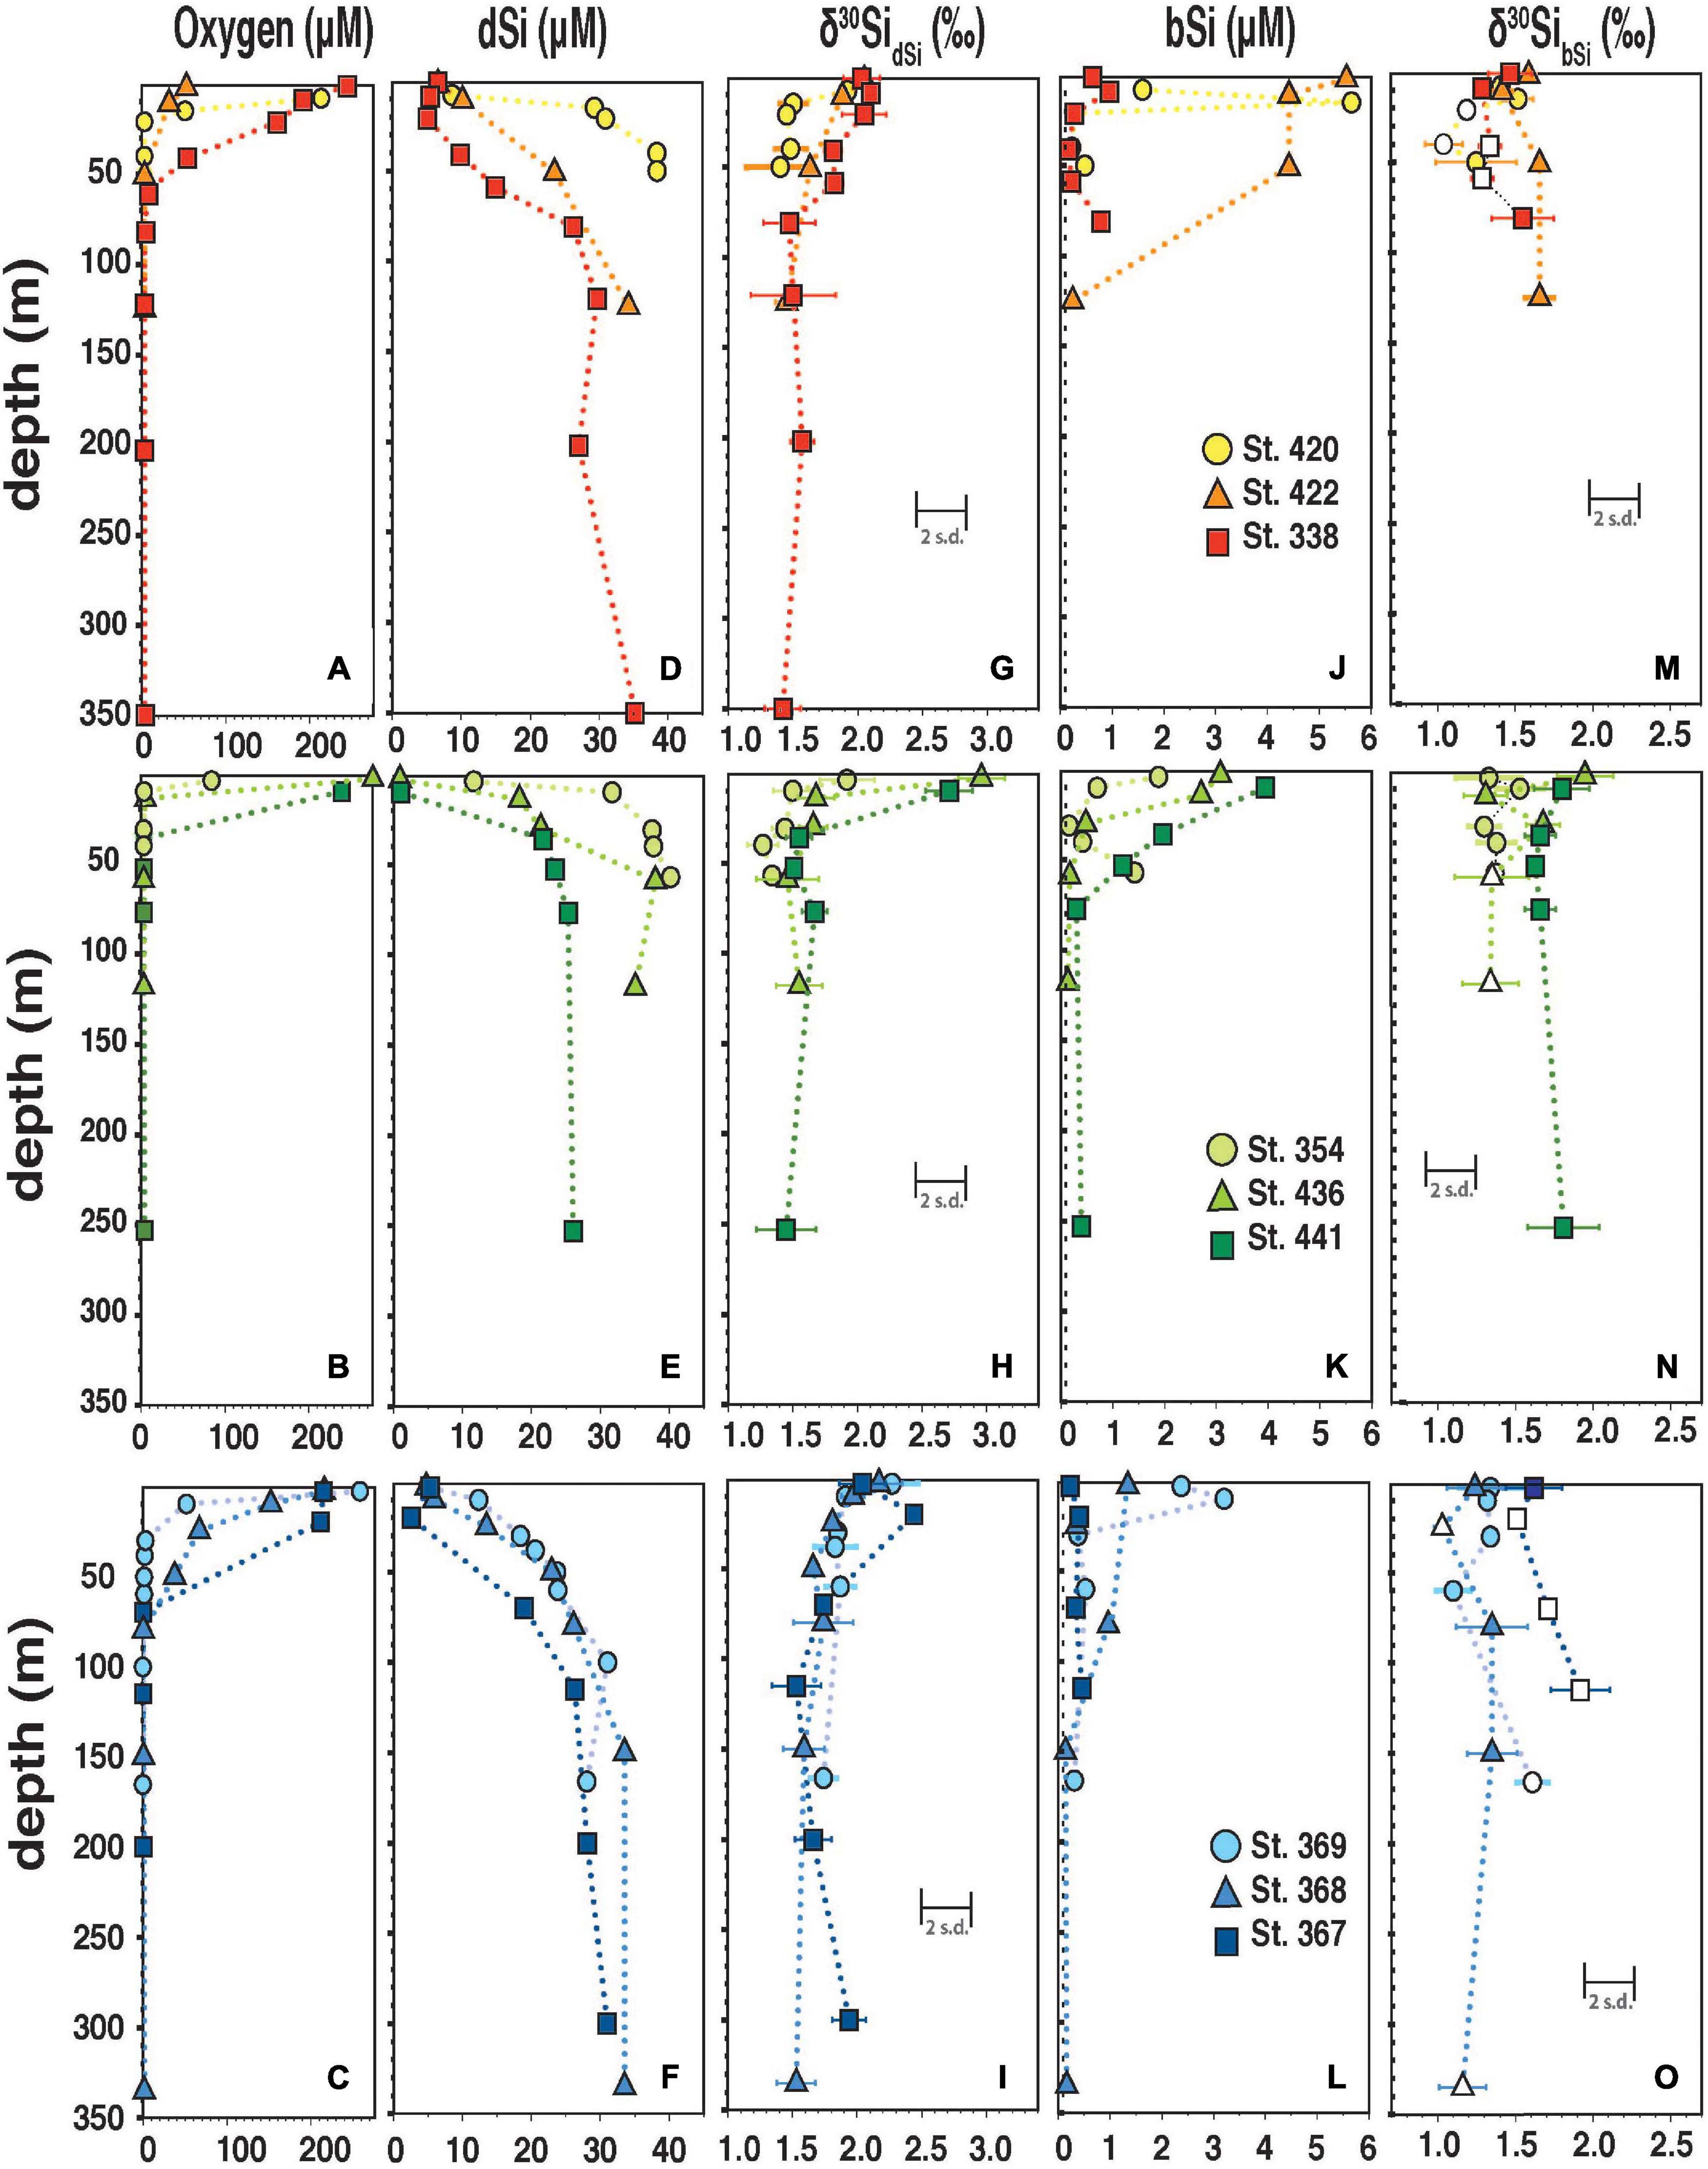
Figure 4. (A–C) Oxygen concentration (in μmol L–1) versus depth (m). (D–I) δ30SidSi and corresponding [dSi] versus depth (m). (G–L) δ30SibSi and [bSi] versus depth (M). Individual error bars indicate the reproducibility of analytical replicates (2 s.d.). (F,G,M–O) The error bars give the long-term reproducibility of the inter-calibration standard ALOHA1000 (0.2‰; 2 s.d.). Open symbols indicate samples with high Al/Si ratios (>50 mM M–1) or low [bSi] (<0.5 μmol L–1) without Al/Si measurements (M–O).
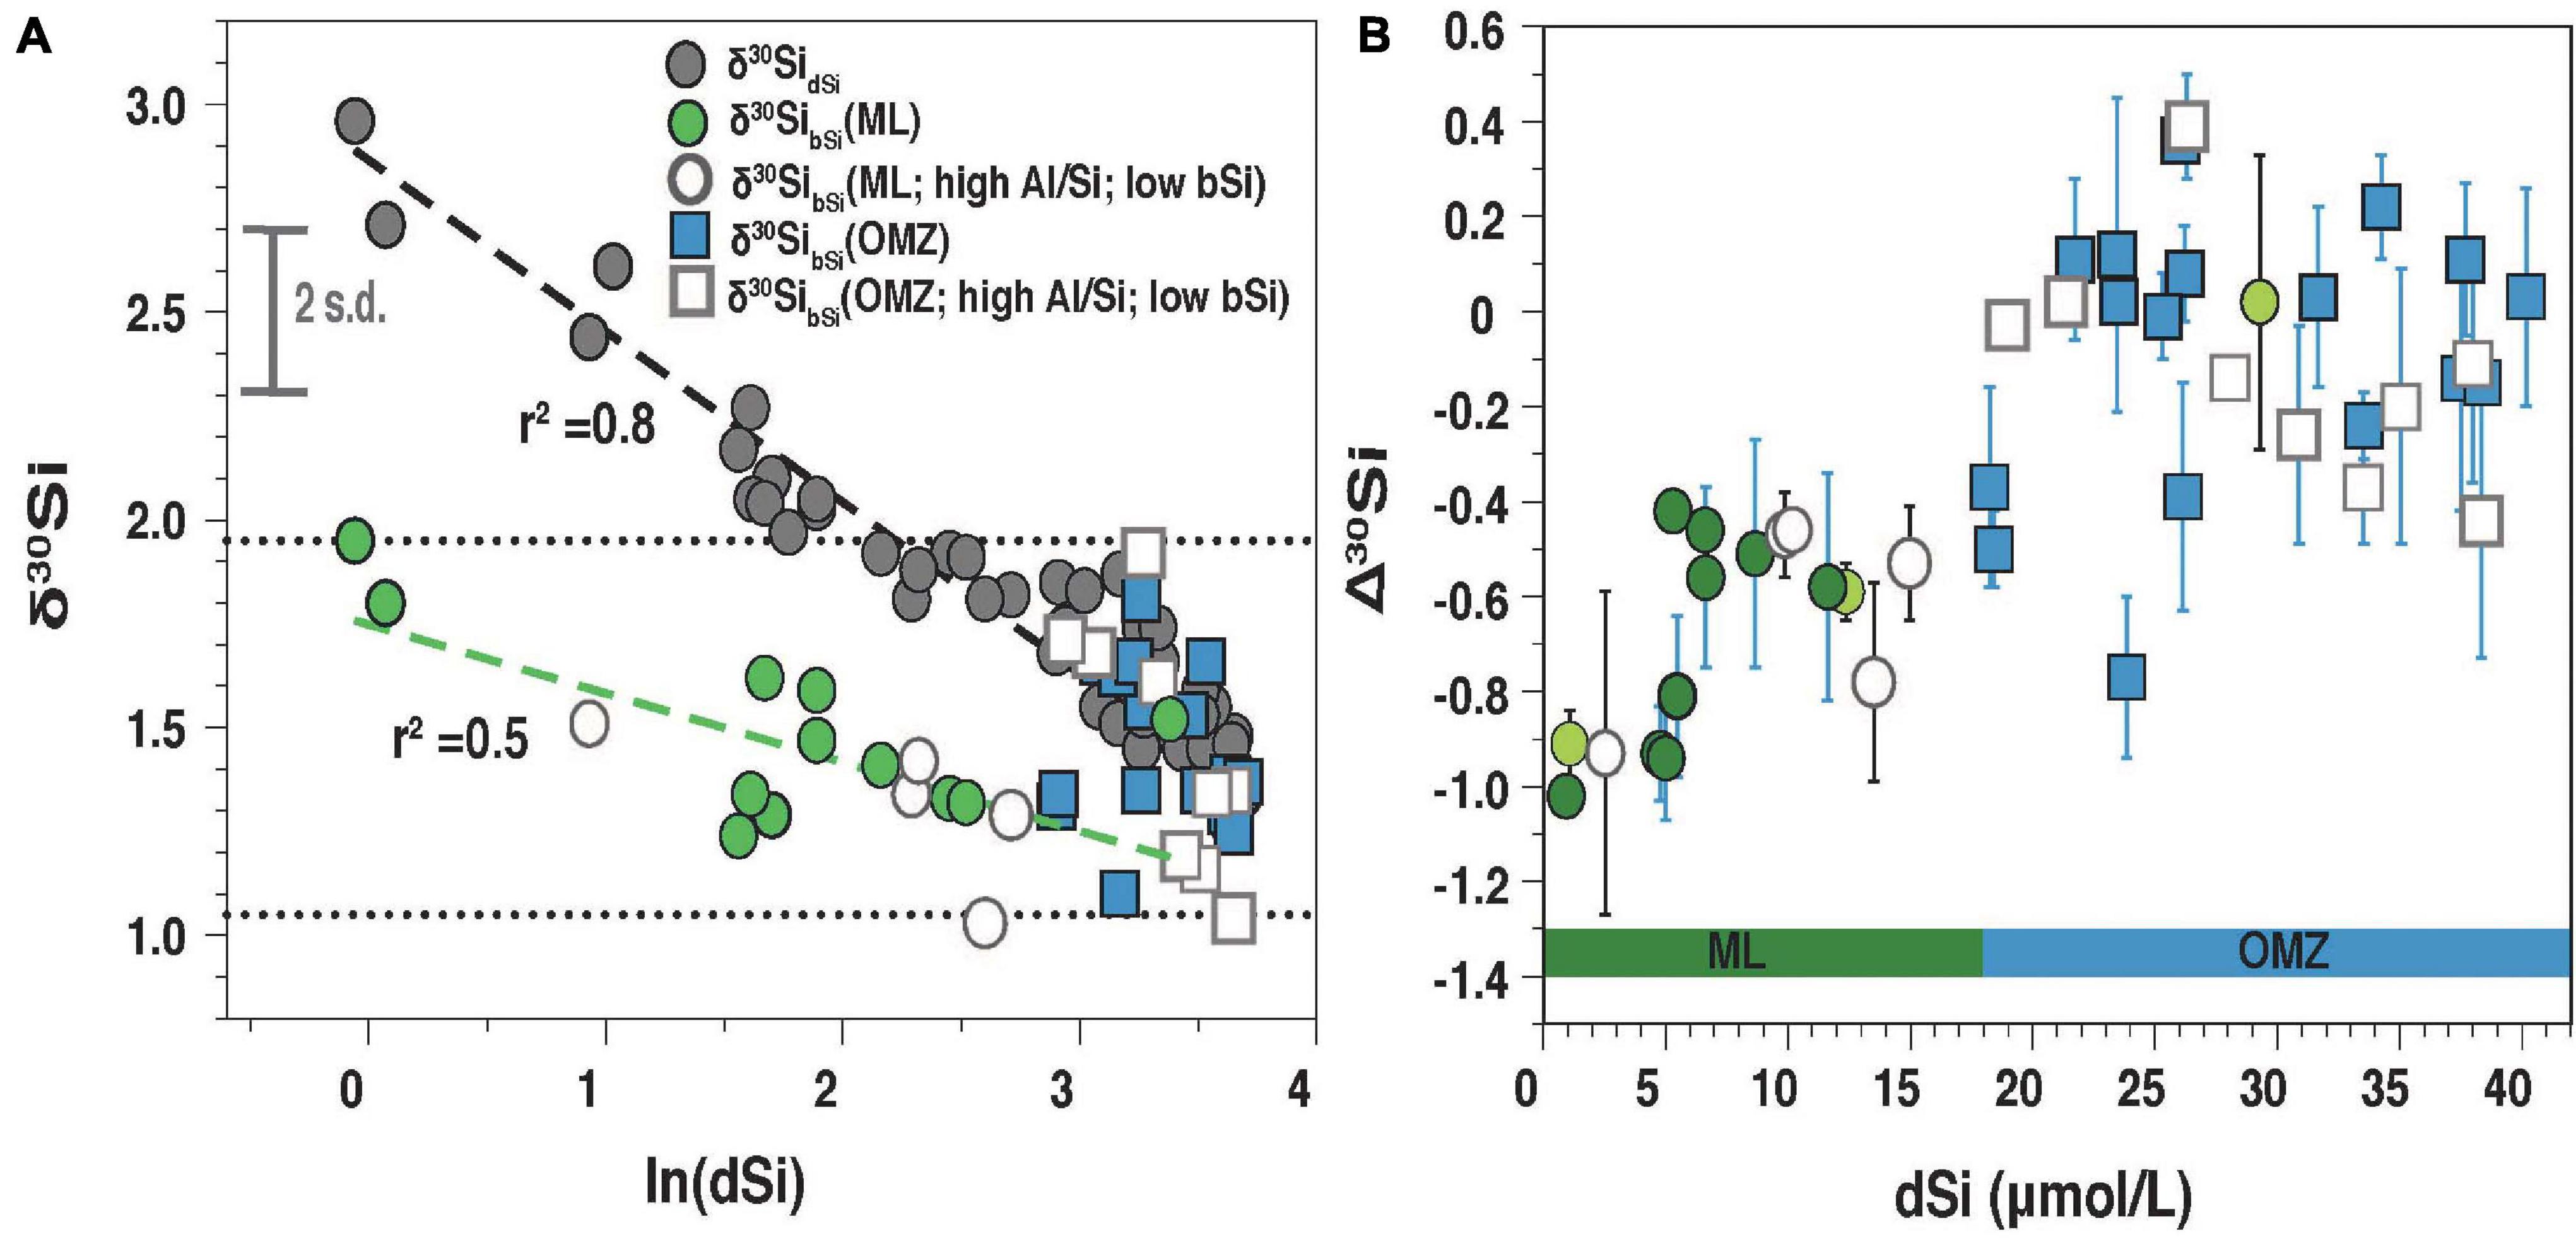
Figure 5. (A) δ30SidSi (closed gray circles) and δ30SibSi from the mixed layer (ML; green circles) as well as the OMZ (blue squares; <5 μmol O2 L–1) versus the natural logarithms of dSi (ln [dSi]). The dotted lines represent the minimum and maximum range of δ30SibSi. The dashed line was fitted for δ30SidSi (black; r2 = 0.8) and δ30SibSi (green; r2 = 0.5) for samples from the mixed layer. Samples with Al/Si ≥ 50 mM M–1or bSi < 0.5 μmol L–1 are indicated with open circles (ML) and open squares (OMZ). For clarity, the 2 s.d. error (0.2‰) is given in figure (A). (B) Offset between δ30SibSi and δ30SidSi (Δ30Si) against [dSi]. In panel (B) samples from the ML aredivided into uppermost surface samples (dark green) and surface samples below (light green circles). For Δ30Si the propagated error is given (see Section “Calculation of the Apparent and Modeled Fractionation Factors”).
Dissolved and Particulate Silicon Isotope Signatures and the Apparent Fractionation Factor
Mixed Layer and Oxyline
In surface waters, a large range in [dSi] (0.9 to 12 μmol L–1) and δ30SidSi (+1.7‰ +3.0‰) was observed (Figures 4, 5) with the highest [dSi] occurring close to the coast (Sts. 354; 420) accompanied by low δ30SidSi (+1.7‰ and +2.5‰; Figures 1, 3A). In contrast, the lowest surface [DSi] at stations 436 and 441 (1 μmol L–1) correspond to high δ30SidSi values (+2.7‰; +3.0‰). δ30SidSi samples from the ML as well as the OMZ have a strong linear relationship with the natural logarithm of [dSi] (r2 = 0.8; Figure 5A).
[bSi] in surface waters was between 0.13 to 5.8 μmol L–1 with the highest [bSi] occurring in the ML and decreasing values with depth (Figures 4G,H,I). δ30SibSi (+1.0‰ to +2.0‰) did not change with depth. δ30SibSi in the ML was always lower than δ30SidSi with an offset of Δ30Si (see Section “Calculation of the Apparent and Modeled Fractionation Factors” for definition) between −1.0‰ to −0.4‰ (Figure 5B).
OMZ
Below the upper oxycline (10 to 70 m; Figures 4A–C), subsurface [dSi] increased but varied between stations (24 to 40 μmol L–1). Shallow stations (Sts. 354, 420, 436; 50 m to 135 m) showed approximately 40% higher [dSi] (mean: 38 μmol L–1; mean δ30SidSi: +1.4 ± 0.1‰, 1 s.d.) compared to all other stations (mean: 24 μmol L–1; mean δ30SidSi: +1.6‰ ± 0.1‰, 1 s.d.; Figure 4 and Supplementary Table 1). At the shallow locations, the Equatorial Subsurface Water (ESSW; Supplementary Figure 2) dominated, a southward flowing water mass, which is transported via the Peru Chile Undercurrent (PCUC; e.g., Montes et al., 2010). Subsurface waters at Sts. 367, 368, and 369 showed influence of the Eastern South Pacific Intermediate Water (ESPIW, Supplementary Figure 2), a northward flowing water mass, that originates off Southern Chile (Schneider et al., 2003; Thomsen et al., 2016). Most δ30SibSi samples within the OMZ (oxygen concentration < 5 μmol L–1), below the euphotic zone are not distinguishable from δ30SidSi, which is reflected in mean Δ30Si close to +0.1‰ considering an external error of 0.2‰ (2 s.d.; Figures 5A,B).
Discussion
Mechanisms Controlling δ30SidSi in Surface Waters: Upwelling and Utilization of dSi
The Peruvian upwelling is one of the most productive marine ecosystems (e.g., Chavez and Messié, 2009). Phytoplankton production is fueled by upwelling of nutrient-rich subsurface waters and high incident light at the sea surface and is generally highest in austral summer (Jan.-March; our study was conducted in February 2013; e.g., Echevin et al., 2008). Upwelling of dSi-rich subsurface waters (up to 40 μmol L–1) drives diatom blooms in coastal surface waters, which leads to bSi concentration of up to 6 μmol L–1 (this study; Franz et al., 2012; Bach et al., 2020). The Si isotope signature of the dSi in upwelled waters, mainly the PCUC, is well characterized and relatively constant along with the Peruvian Shelf (+1.5 ± 0.2‰, mean ± 1 s.d.). However, depending on bottom depth, production in surface waters, subsequent dissolution of sinking biogenic silica, and high Si fluxes from the sediments (up to 3,300 mmol m–2 y–1; Dale et al., 2021), δ30SidSi between +1.1‰ and +1.9‰ has been observed (this study; Ehlert et al., 2012; Grasse et al., 2016, for a compilation of δ30SidSi data off Peru see Doering et al., 2021). Shallow stations showed approximately 40% higher [dSi] than deeper stations corresponding to lighter δ30SidSi, due to both dissolution of bSi in the water column and supply from the reactive upper sediment layer. Simple mixing calculation as well as modeling results (Ehlert et al., 2016; Grasse et al., 2016) demonstrated that Si fluxes from the sediment have a light isotopic signature (+0.8‰). Using the dSi source signature of subsurface waters from different stations (mean: 30 μmol L–1), we were able to make two estimates of the biologically-driven fractionation factor (30ε) in the ML using different conceptual models: 1) a Rayleigh-type model (Closed Model; Figure 6A), in which after a single input no additional nutrients are supplied to the system and 2) a steady-state model (Open Model; Figure 6B), where a continuous supply and partial consumption of nutrients causes a dynamic equilibrium of the dSi and the produced bSi (for details see method; Mariotti et al., 1981).
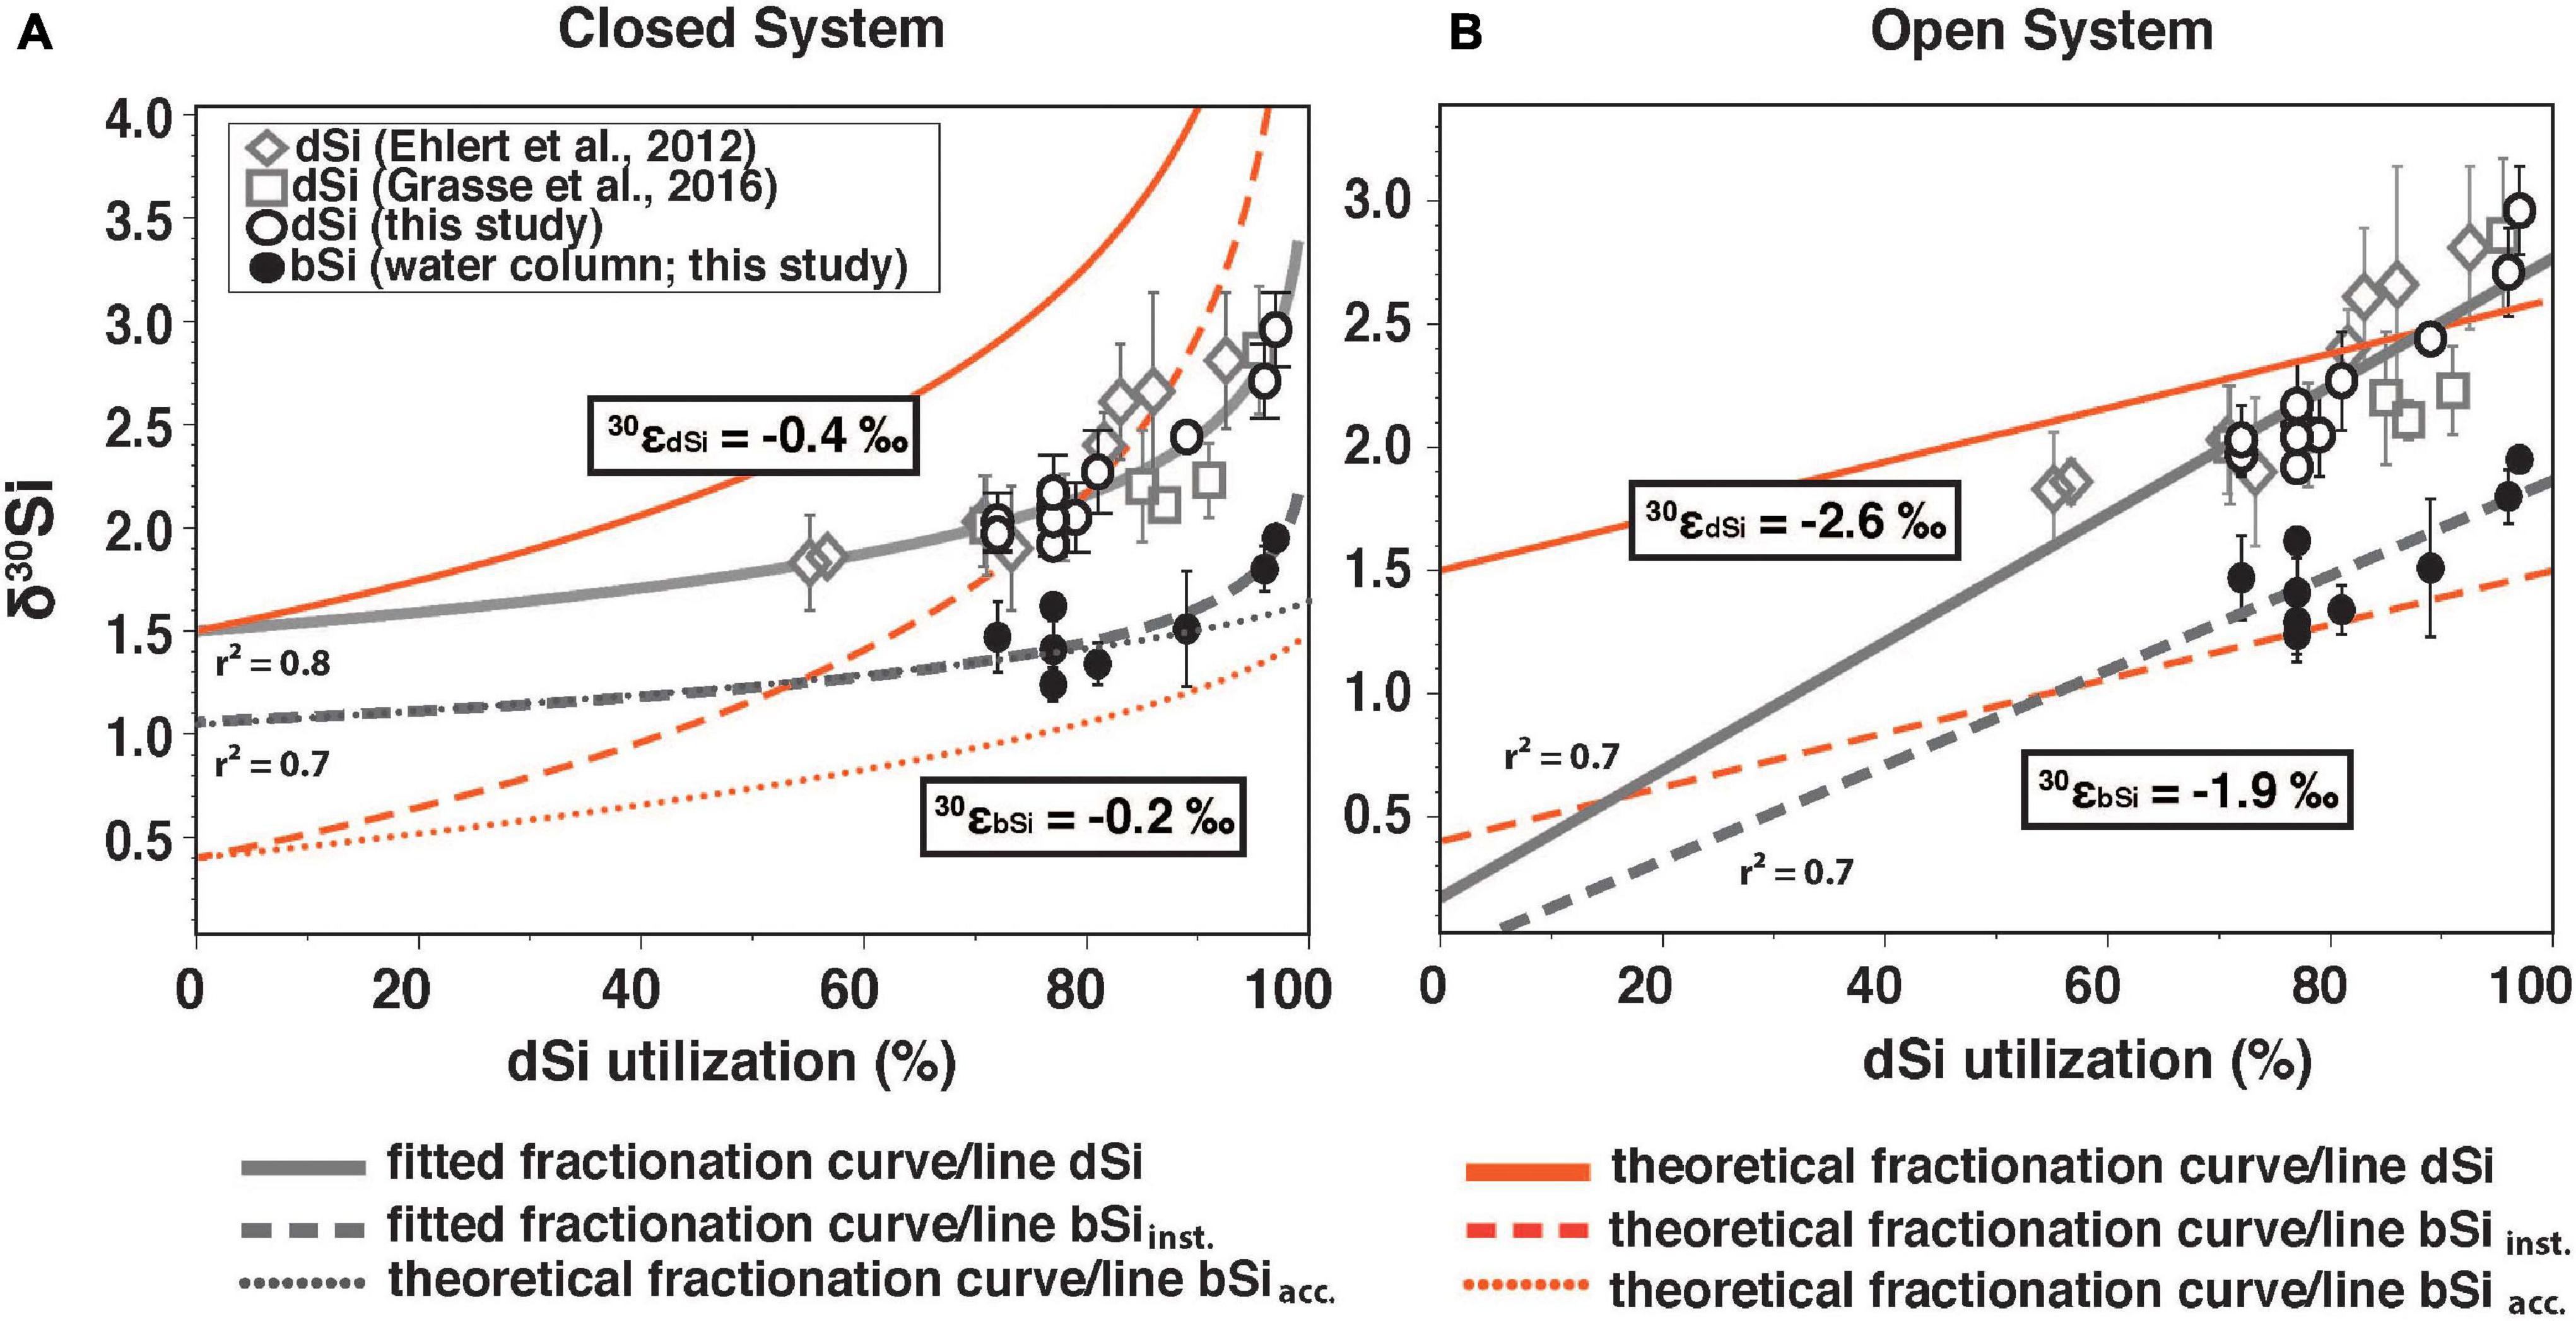
Figure 6. (A) Closed system (Rayleigh-type) and (B) open system (steady state) showing δ30SidSi (δ30SidSi_obs.) in the ML from Ehlert et al. (2012; open diamonds), Grasse et al. (2016; open squares) and this study (open black circles) as well as δ30SibSi (black circles, this study) against the dSi utilization in % of the available dSi pool (derived from the utilized fraction). Only data from the Peruvian shelf are displayed. Theoretical fractionation curve/line for δ30SidSi (solid red line), the instantaneous δ30SibSi (δ30SibSi_inst.; dashed red line), and the accumulated product (δ30SibSi_acc; dotted red line). Fractionation curve/line fitted for δ30SidSi and δ30SibSi are indicated in gray. Estimated fractionation, derived from the equations for both models is given for the dSi (30εdSi) and the bSi data (30εbSi). For model and equation details see method description “Calculation of the Apparent and Modeled Fractionation Factors.”
In this study, we observed utilization rates of up to 70% of the available dSi pool in the surface waters (Figure 6). Significantly lower utilization rates (55%) were observed shortly after a recent upwelling event in February 2009 (Ehlert et al., 2012; Figure 6). High dSi utilization of up to 96% and 97% in surface waters can be observed at stations 436 and 441, resulting in high δ30SidSi values (+2.7‰ and +3.0‰, respectively). The data can be best fitted to a Rayleigh-type model (r2 = 0.79; Figure 6A) and a predicted δ30SidSi of the source dSi of +1.5‰. The source is significantly underestimated (+0.2‰) by the steady-state model, which has a lower goodness of fit (r2 = 0.70).
The modeled fractionation factors are given by the slope of the best fit equations (see Section “Calculation of the Apparent and Modeled Fractionation Factors,” first line of each equation) between δ30SidSi and δ30SibSi versus the utilization rate. They differ significantly between models with 30ε for δ30SidSi (30εdSi) estimated at −0.4‰ in the (closed) Rayleigh Model and −2.6‰ for the (open) steady-state model (Figure 6). Both values differ strongly from the experimentally determined 30ε of −1.1‰ (De La Rocha et al., 1997; Milligan et al., 2004; Sutton et al., 2013; Sun et al., 2014). The challenges of using these simple models to estimate the fractionation factor from field data have been discussed in previous studies (e.g., Grasse et al., 2013, 2016; Closset et al., 2016; Cassarino et al., 2017). Two main problems have been identified 1) the silicate fractionation in seawater is not represented correctly by such idealized, simplified models and 2) identification and characterization of source waters can be difficult. Both issues are valid for the Peruvian Upwelling. Although it can be argued that the Peruvian Upwelling region is better represented by an open system with constant nutrient supply, a decrease in wind stress can lead to increased stratification and continuous nutrients depletion in the ML thereby following a closed system behavior. A factor further complicating a simple one- or two-dimensional analysis is the lateral supply of dSi. The main lateral contribution to surface and subsurface waters is via currents or (anti-)cyclonic eddies (e.g., Montes et al., 2014; Grasse et al., 2016; Thomsen et al., 2016). Further sources from land like submarine groundwater discharge or riverine input are either unknown or neglectable, as the study area is bordered by the Atacama Desert (e.g., Hutchins et al., 2002; Santos et al., 2021).
The deviation from the assumed fractionation factor of −1.1‰ can be additionally affected by the dissolution of bSi in the euphotic zone, possibly driving δ30SidSi to lower values (30εDiss ranging from 0‰ to +0.9‰; Demarest et al., 2009; Sun et al., 2014; Wetzel et al., 2014). In productive coastal zones approximately 15% of the produced silica is dissolved within the euphotic zone (Nelson et al., 1995; Nelson and Brzezinski, 1997; Brzezinski et al., 2003). However, low 30ε derived from the closed model, might even indicate higher dissolution in the euphotic zone. Overall, we find that the commonly used fractionation models (Rayleigh-type vs. steady state) for the temporal evolution of δ30SidSi are oversimplified and need to include other processes such as admixture with additional sources (vertical and horizontal nutrient supply, as well as multiple intrusion of nutrients) and should integrate dissolution processes in order to properly reconstruct dSi utilization in the present. This is especially important, when these models are used to reconstruct dSi utilization in the past (e.g., Doering et al., 2019). The deviation from the assumed fractionation factor of −1.1‰ in highly productive areas might have to be taken into account in regard to Si modeling studies. Global models generally assume fractionation during production of −1.1‰ and a temperature dependent dissolution of exported opal (with or without fractionation). These models reproduce δ30SidSi in offshore regions extremely well, but do poorly in coastal areas, if they are included (Wischmeyer et al., 2003; Holzer and Brzezinski, 2015; Gao et al., 2016).
Besides the reasons mentioned above, it must be questioned whether we can really assume a constant fractionation factor or if it changes with nutrient availability or phytoplankton community. In the following, we will elaborate on the different aspects that can influence δ30SibSi and the fractionation factor on a regional as well as global scale.
What Controls δ30SibSi in Surface Waters
δ30SibSi in the ML is consistently lower than δ30SidSi (Figure 5), as expected due to preferential uptake of 28Si, leaving the seawater enriched in heavy 29Si and 30Si (e.g., De La Rocha et al., 1997; Sutton et al., 2013). δ30SibSi values in the upper water column increase with decreasing [dSi] due to the net depletion of the available pool. Overall, we observe a systematic pattern, where high δ30SibSi shows a close relationship with [dSi]. This pattern is observed in the Peruvian Upwelling and the Southern Ocean (Figure 7A, δ30SibSi influenced by heavy sea-ice diatoms is excluded, see S4). However, the magnitude and range in δ30SibSi values appears highly dependent on the regional setting and the source signal, as documented by δ30SibSi values off Peru that are partly 0.5‰ lower compared to samples from the Southern Ocean (Fripiat et al., 2011, 2012; Closset et al., 2016) at similarly low [dSi] (<10 μmol L–1). These differences can either be explained by the δ30SidSi source signal and the degree of dSi utilization or a combination of these factors (Fripiat et al., 2012; Closset et al., 2016). Still, it is intriguing that global δ30SibSi shows such a close relationship with [dSi] in that high δ30SibSi corresponds to low [dSi] and vice versa.
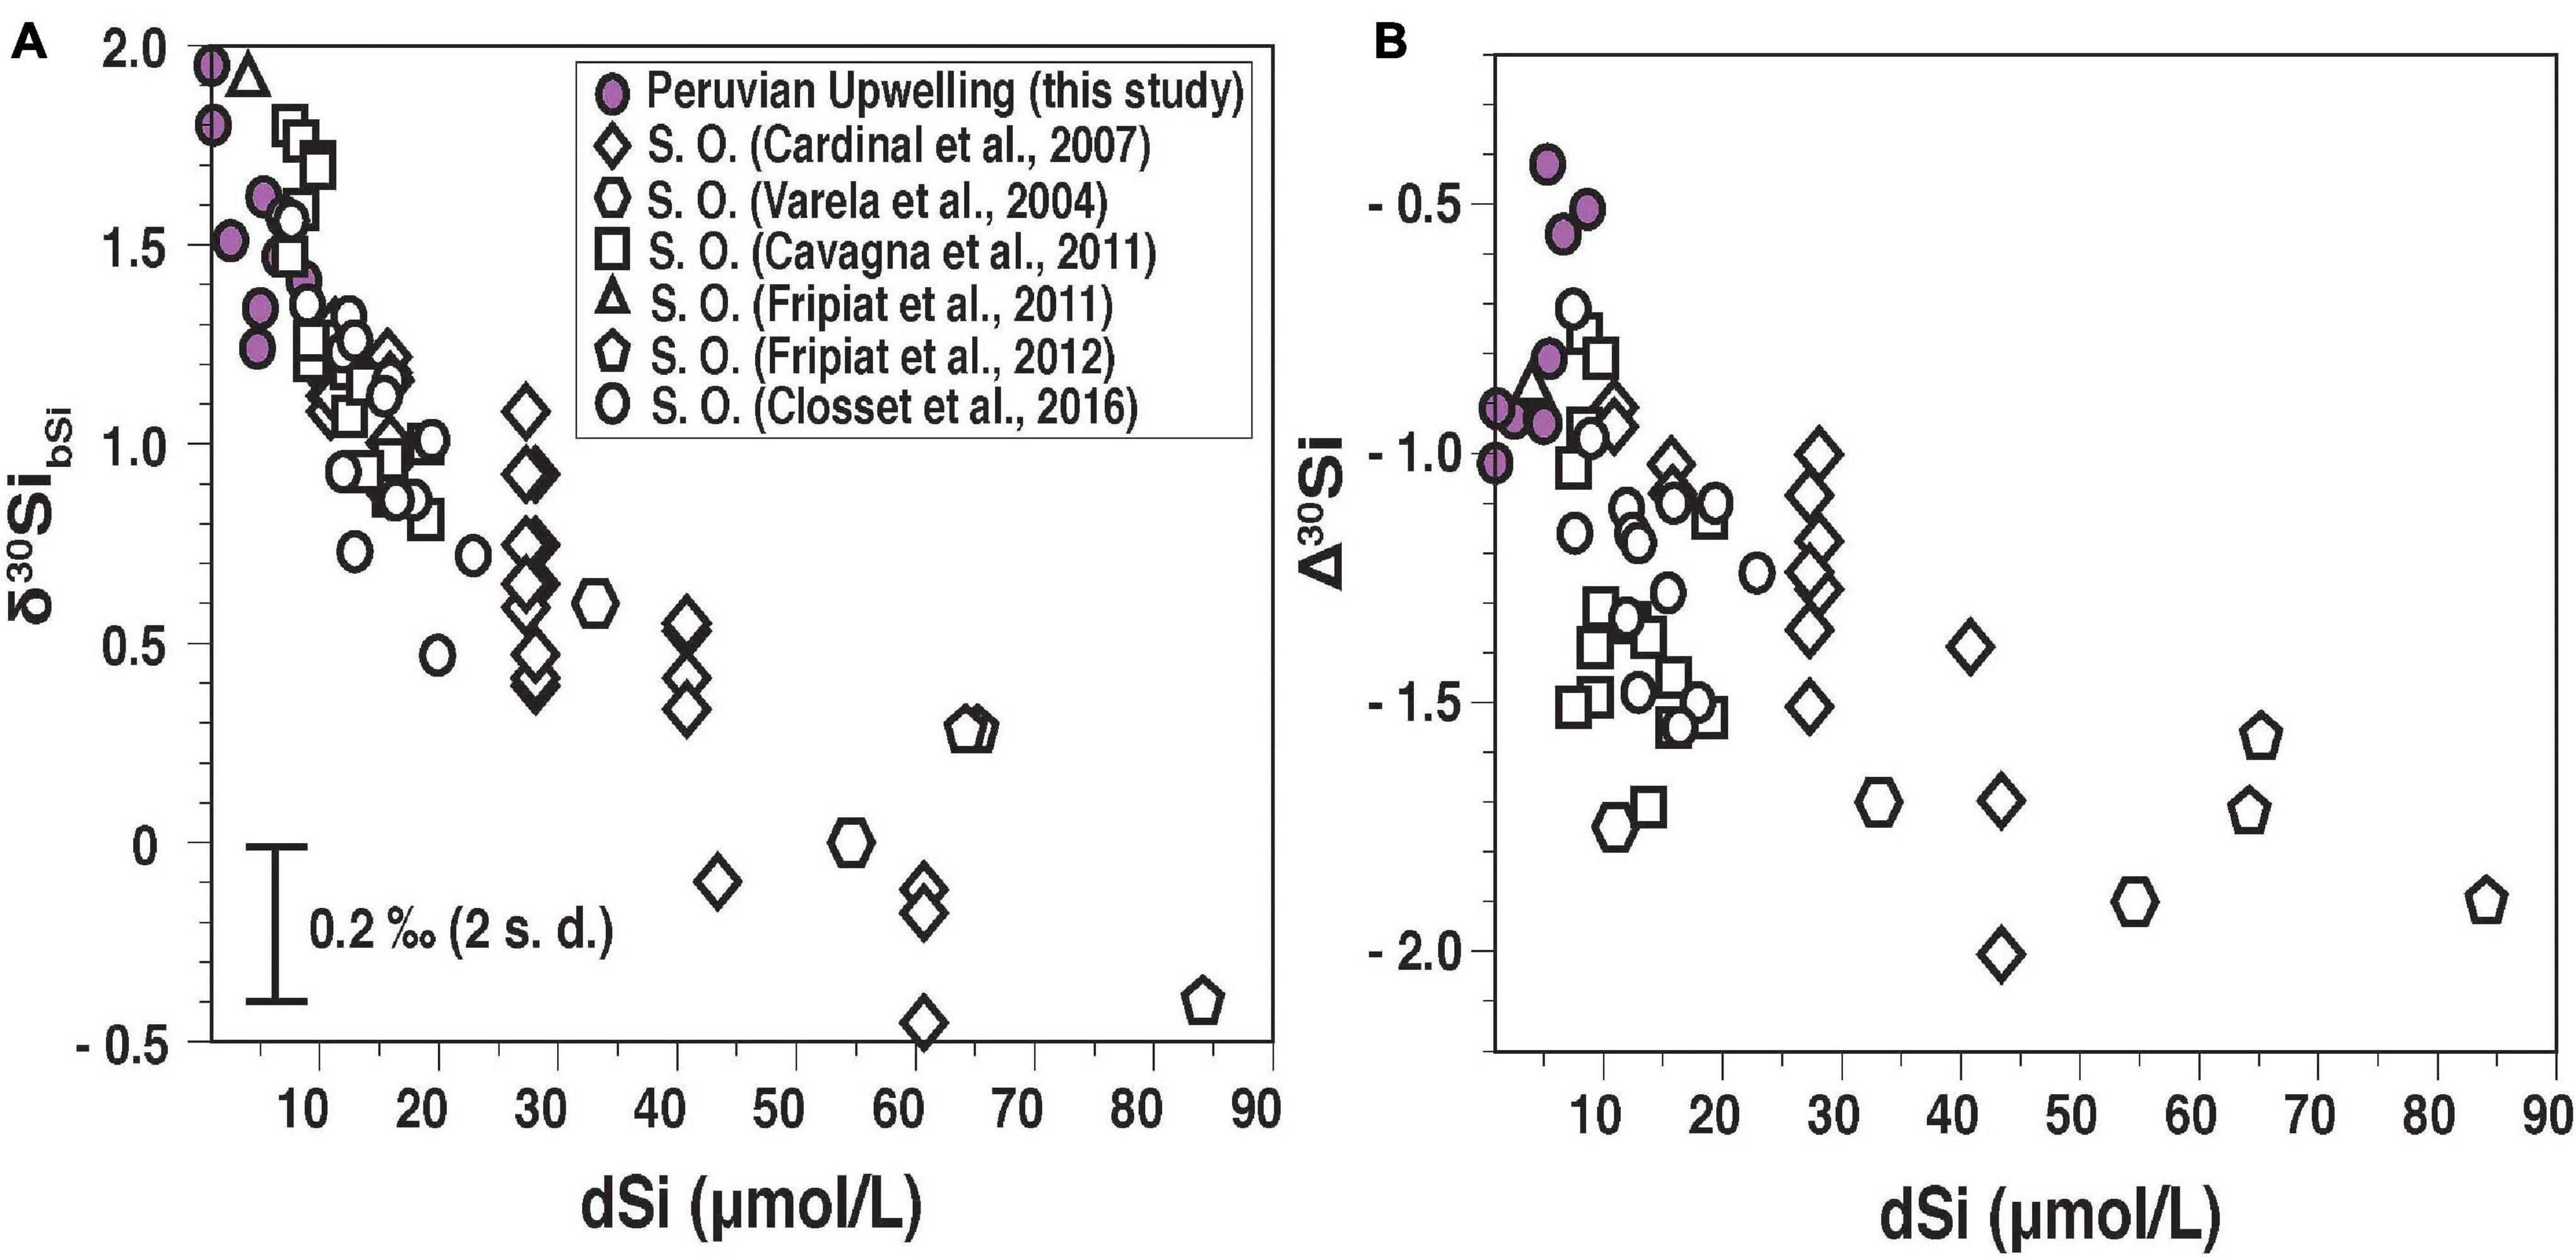
Figure 7. (A) Overview of published δ30SibSi versus [dSi] from the Southern Ocean [(S. O.; open symbols from Varela et al. (2004), Cardinal et al. (2007), Fripiat et al. (2011), Fripiat et al. (2012), Cavagna et al. (2011), Closset et al. (2016) and from this study (violet circles)]. Only δ30SibSi data from the ML is plotted. Available δ30SibSi influenced by riverine or lithogenic material and the presence of isotopically heavier sea ice diatoms are excluded (Fripiat et al., 2007; Cao et al., 2012; Varela et al., 2016). (B) Apparent fractionation factor (Δ30Si) versus [dSi]. For a detailed description, see supplement text and Supplementary Table 5.
A global comparison of Δ30Si indicates a large range from −0.4‰ to −2.0‰, where high [dSi] (>30 μmol L–1) are generally associated with a large negative signal (Δ30Si > −1.5‰). Overall, the relationship between δ30SibSi and Δ30Si with [dSi] shows a less confined non-linear (hyperbolic) relationship than observed for sponge spicules (Hendry et al., 2012). Remarkably, the Peruvian data show the opposite trend and a large fractionation (Δ30Si = −1‰) is associated with the lowest [dSi] values (Figure 7B, violet circles). Whereas the Si isotope signature in bSi can integrate over a longer time period and even reflect different succession stages of a bloom, newly supplied dSi would decrease the Δ30Si. Such an effect may have been observed at stations 422 and 441. Both stations show a monospecific diatom assemblage dominated by C. pelagica, a species that is often found during relaxation of the upwelling (Delgado and Chang, 2010), but the Δ30Si differed by 0.5‰ between stations with −0.4‰ (St. 422) and −0.9‰ (St. 441). At station 422 a recent upwelling event of anoxic subsurface waters has occurred prior to sampling as indicated by low oxygen concentrations of the surface waters (50 μmol L–1; Supplementary Table 1 and Supplementary Figure 3). A similar dependence between Δ30Si and oxygen concentration (ranging from 50 to 280 μmol L–1) has been observed at most stations, and recent upwelling events most likely can explain low Δ30Si values.
Missing information on fractionation factors of the majority of diatom species investigated here and the fact that most of the diatoms in this study could not be identified down to the species level (due to microscopic limitations) render identification of species-dependent fractionation effects difficult. In addition, recent upwelling events have the effect of lowering Δ30Si values, as discussed above.
Furthermore, it remains unclear what the exact controlling mechanisms for the fractionation factors are. Several processes influencing 30ε have been discussed: uptake kinetics, growth rate, polymerization, the influx to efflux ratio, as well as potential phylogenetic and morphological effects (Milligan et al., 2004; Sutton et al., 2013; Hendry et al., 2018; Marron et al., 2019). Milligan et al. (2004) suggested that Si isotopic discrimination occurs during dSi uptake and that polymerization and efflux are negligible. In addition, ambient nutrient concentrations may influence 30ε. First results on the effects of iron (Fe) availability on the fractionation factor were somewhat inconclusive (Meyerink et al., 2017) given that insignificantly lower 30ε values were observed in two out of three species under Fe-limiting conditions. However, so far, no study has tested the influence of dSi availability and if the fractionation factor may change under high and low ambient [dSi] levels. At low ambient [dSi], uptake is mainly an “active” process (≤10 μmol L–1) and is facilitated by dSi transporters (SITs) that are localized in the cell membrane (Shrestha and Hildebrand, 2014). In contrast, diffusional uptake dominates Si acquisition under high dSi conditions, with SITs playing more of a regulatory role (Thamatrakoln and Hildebrand, 2008; Shrestha and Hildebrand, 2014).
Overall, our data indicate that specific diatoms taxa only have a minor effect on δ30SibSi signatures and the apparent fractionation factor in seawater. Instead, variations in the fractionation factor appear to be strongly driven by upwelling and the ambient [dSi]. However, further investigations may be necessary to investigate the influence of these factors on δ30SibSi in the water column in this and other areas including a careful examination of the species composition and macro- and micronutrient availability.
Comparison Between δ30SibSi From the Water Column and From Core-Top Sediments: Implications for the Application of δ30SibSi as a Paleo Proxy
Several studies in the ETSP have reported δ30SibSi data from sediment cores in the Peruvian upwelling zone and the equatorial Pacific (Pichevin et al., 2009; Ehlert et al., 2015; Doering et al., 2016a,b) but no corresponding data on the δ30SibSi of diatoms from the water column have so far been available.
Here, we compare δ30SibSi data from the water column (ML and OMZ) with δ30SibSi from core-top sediments along the Peruvian shelf (Figure 8), separated into bSimixed (various diatoms from an 11–32 μm fraction) and handpicked diatoms (mainly Coscinodiscus spp.; δ30SibSi_Coscino; Ehlert et al., 2012; Doering et al., 2016a). The similarity of δ30SibSi values in the ML and δ30SibSi from the subsurface/OMZ (Figure 5) supports that bSi dissolution does not measurably affect δ30SibSi. Therefore, dissolution is not expected to complicate the interpretation of δ30SibSi from sediment cores. This is in agreement with the conclusions from a sediment trap study and box model results from Varela et al. (2004) and Closset et al. (2015, 2019) in the Southern Ocean.
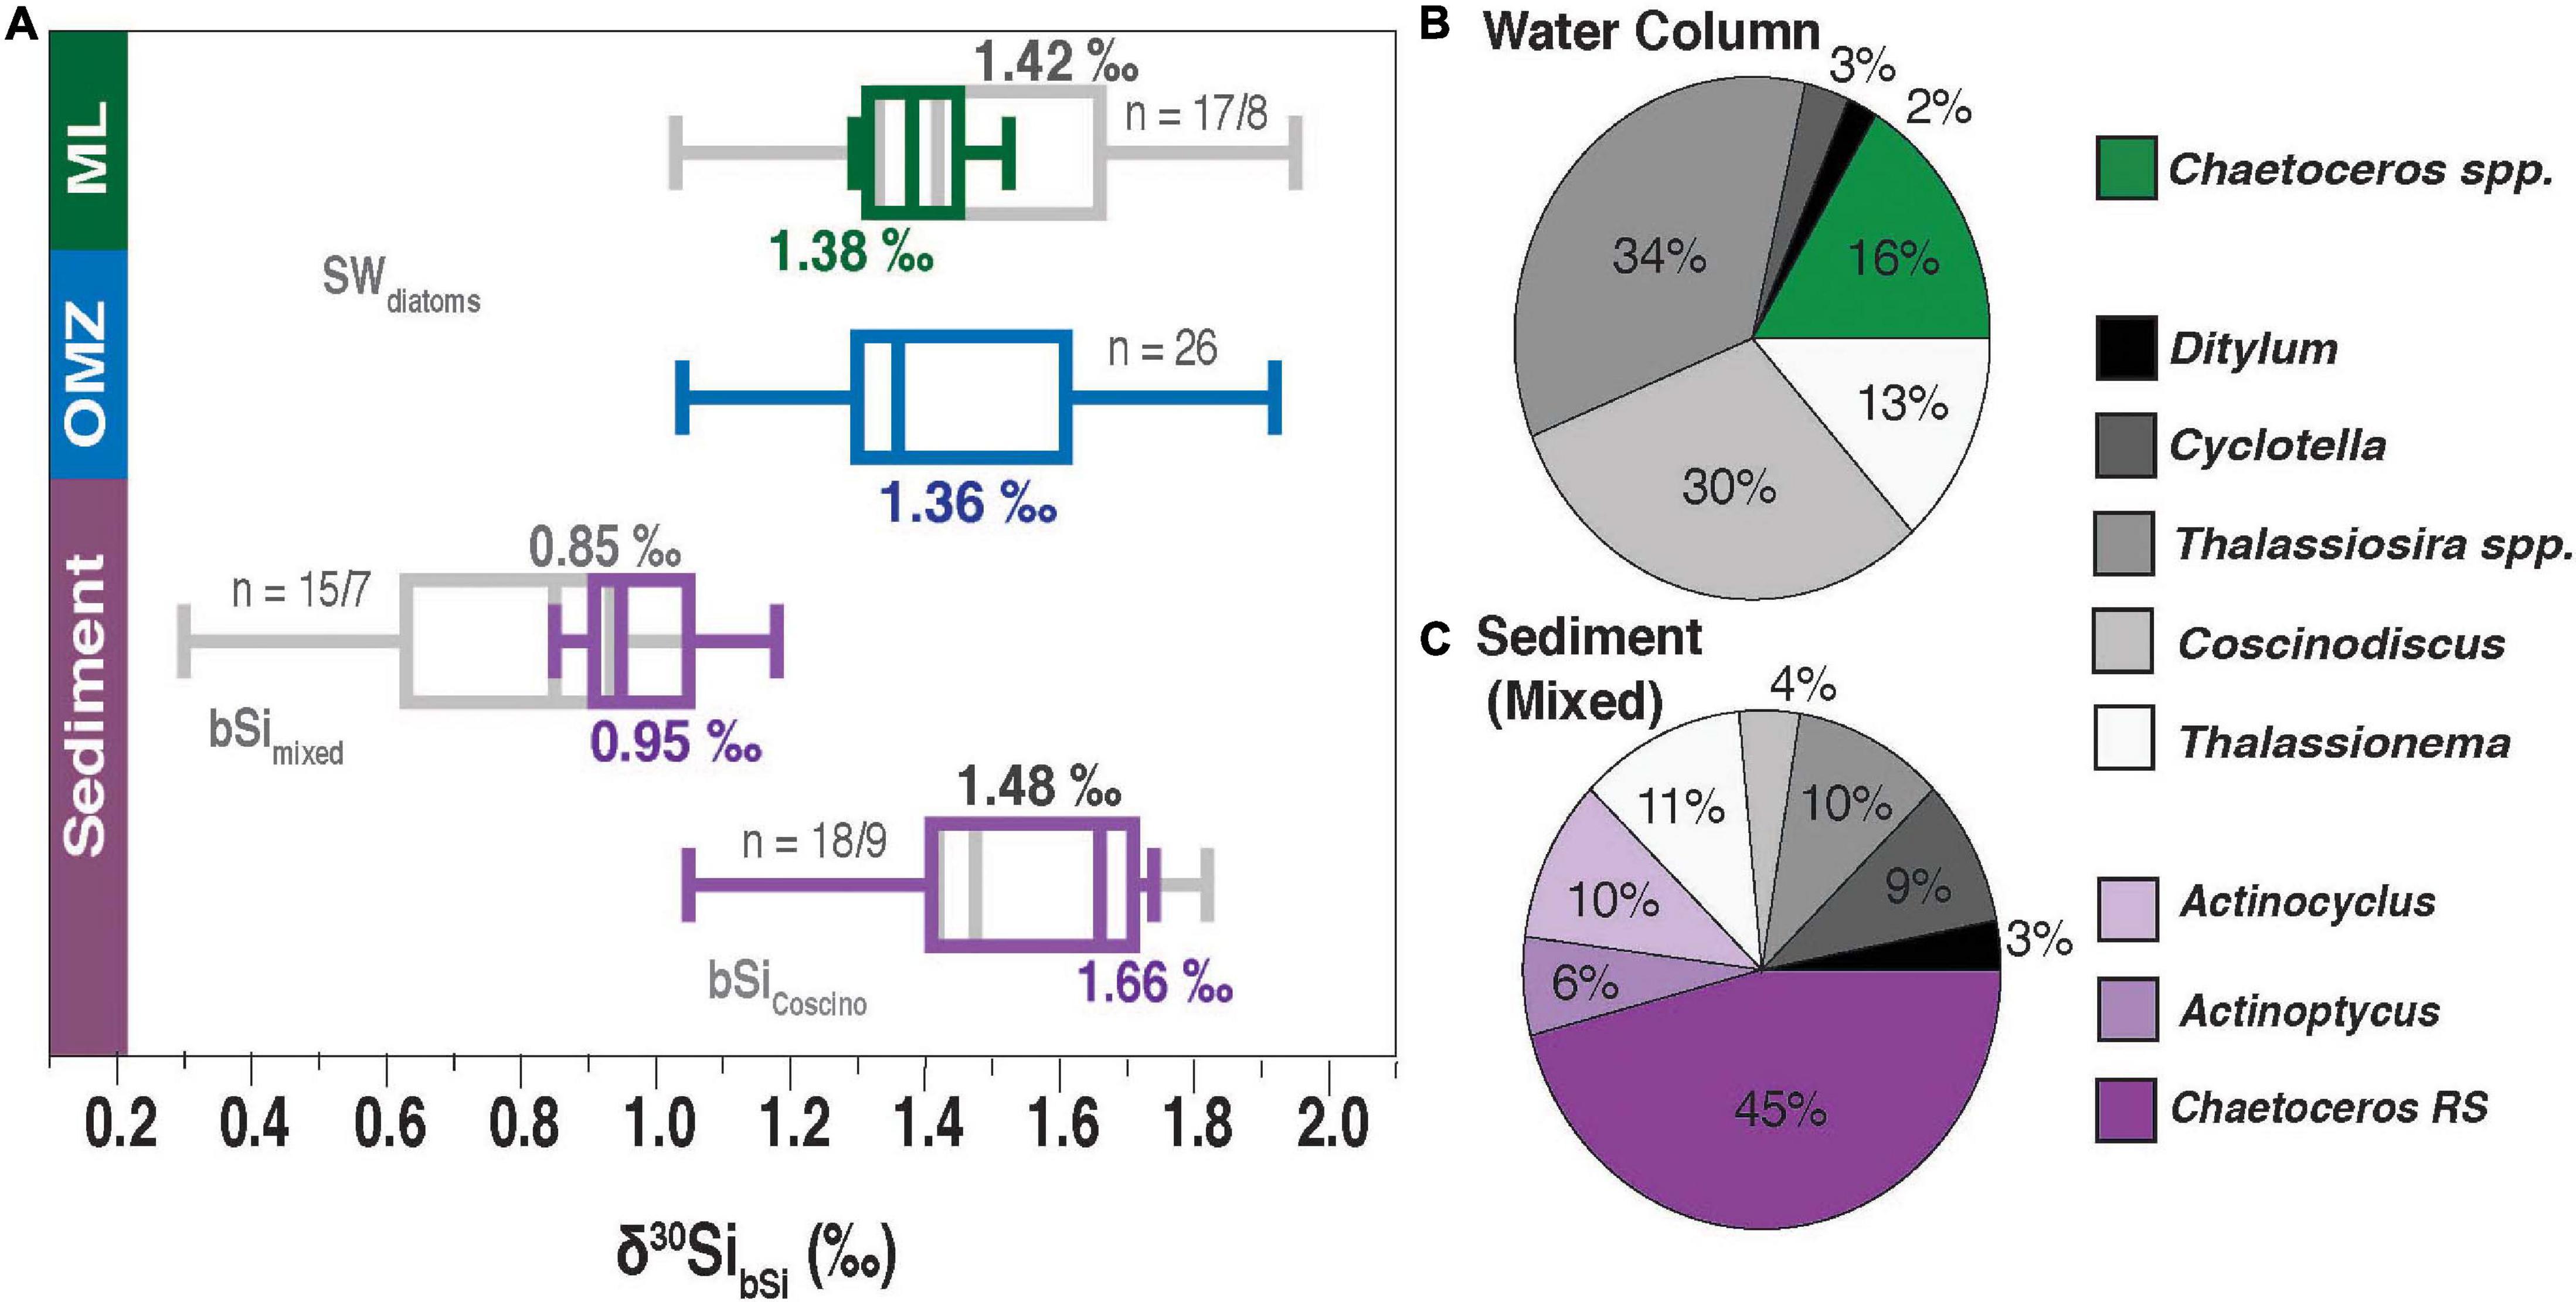
Figure 8. (A) Boxplots of a comparison between seawater (SW) diatoms (δ30SibSi) from the ML and oxycline (green: strong upwelling, indicated by low SST and [dSi]; gray: all samples) and the OMZ (blue) versus sediment data from core-top sediments. δ30SibSi_mixed (11 to 32 μm fraction) and δ30SibSi_Coscino. for handpicked diatoms (mainly Coscinodiscus spp.). Core top sediment data were obtained by Ehlert et al. (2012) and Doering et al. (2016a). The sediment data are divided into samples collected in the central upwelling region (10°S and 15°S, violet) and in areas at higher or lower latitudes or from greater depth (gray). The relative abundance of diatom species from the water column (B) and core- top sediments δ30SibSi_mixed (C) along the Peruvian coast between 10 to 15°S. Only diatom taxa with abundances >5% are displayed. Taxa only present in seawater are indicated in green, diatoms present in seawater and sediments in gray, and diatoms only observed in sediments in violet. Note that C. pelagica is excluded for clarity, as it would dominate the relative distribution in seawater diatoms up to with 98%. This taxon was not found in the sediment.
Sedimentary δ30SibSi shows a large range between +0.3‰ and +1.8‰ (Figure 8A), including samples collected at locations outside of the main upwelling or at greater distance from the coast (Ehlert et al., 2012; Doering et al., 2016a). In the main upwelling area off Peru (10°S to 15°S), δ30SibSi_mixed signatures range between +0.9‰ and +1.2‰ and are lower than δ30SibSi values (+1.1‰ to +2.0‰) from the water column (Figure 6), whereas δ30SibSi_Coscino is within a similar range (+1.1‰ to +1.8‰). A possible explanation for the relatively large offset between δ30SibSi_mixed and δ30SibSi_Coscino suggested by Doering et al. (2016a) is that δ30SibSi_mixed reflects the early succession stages of the upwelling bloom (low utilization). In contrast, Coscinodiscus spp. represents later succession stages in the evolution of blooms and thus more stratified waters with higher dSi utilization rates (Tarazona et al., 2003).
Different assemblages may explain the difference between δ30SibSi_mixed and δ30SibSi in the water column. A variety of species are observed in the water column as well as in the sediment, including typical upwelling (e.g., Thalassionema) and non-upwelling species (Coscinodiscus spp.) (Figures 6A,B; Schuette, 1980; Doering et al., 2016a). However, small, lightly silicified, fast-growing and chain-forming diatoms (for example, Chaetoceros vegetative cells, Pseudo-nitzschia, C. pelagica) are either not preserved or to a much smaller extent (e.g., Tréguer et al., 2018). In contrast, many Chaetoceros resting spores (on average 45%) are observed in the sediment and not a single specimen has been found in surface waters (Figures 8B,C and Supplementary Table 4). A similar observation has been made during a bloom experiment in the sub-polar North Atlantic, where no resting spores were detected in surface waters, even though they largely contributed to the particulate organic matter flux and had the highest relative abundance in sediment traps (Rynearson et al., 2013). Interestingly, Rynearson et al. (2013) observed a steady increase of resting spores with depth and speculated that the spore formation may have occurred below the ML. This could explain lower δ30SibSi_mixed values, as dSi with a lower δ30SidSi signal (∼ +1.5‰) is incorporated into the resting spores. So far, the δ30Si signal in resting spores has not been investigated in detail. There are many uncertainties, including the 1) exact formation mechanism of resting spore, which can form under nutrient depletion or viral attack (Oku and Kamatani, 1997; Pelusi et al., 2020) and 2) the question if the fractionation factor is comparable to vegetative cell formation.
In addition, the isotopic signal in seawater diatoms obtained from sediments integrates over different time scales than those present in the water column. While sedimentary diatoms (upper cm) show a [dSi] surface signal reflecting different seasons over a time period of 7 to 300 years (Schuette, 1980), bSi in the water column only integrates over a few days or weeks. Overall, very positive δ30SibSi surface values represent very little biomass as dSi is almost diminished when frustules with high δ30SibSi are formed. In contrast, lower δ30SibSi_sed. could be explained, as these frustules integrated the δ30SidSi across over the entire dSi depletion cycle and represent a high biomass standing stock, compared to frustules formed late during a bloom.
Despite the mentioned differences between samples collected in seawater and from core-top sediments, the δ30SibSi data are within similar range. However, we recommend a careful examination of the diatom size fractions and taxonomy in paleo records, not only to exclude contamination with other siliceous organisms (Egan et al., 2012), but also to detect potential biases in δ30SibSi from diatom assemblage shifts.
A better understanding of processes and dynamics in the modern water column together with detailed information on sediment cores including the identification of diatoms on a species or genus level (Snelling et al., 2012), the size fraction (Egan et al., 2012; Studer et al., 2013), possible shape separation (pennate and centric; Studer et al., 2015) could significantly improve the interpretation of past records. In addition, more information is needed on the formation of diatom resting spores, which can dominate the diatom assemblage retrieved from sediment cores.
Conclusion
Our study provides the first δ30SibSi data from the water column off Peru. We directly compared δ30SibSi (>98% diatoms) to δ30SidSi and the diatom assemblage. δ30SidSi in surface waters strongly depend on dSi utilization, whereby the highest δ30SidSi values are associated with almost complete uptake of dSi. δ30SibSi signatures are consistently lower than δ30SidSi, as expected from the preferential uptake of light 28Si and show a strong dependence on ambient [dSi]. Upwelling strength has a pronounced effect on the apparent fractionation factor between seawater and diatoms (Δ30Si), and recent upwelling events can lower Δ30Si. Comparison with the diatom assemblage data does not indicate taxon-specific fractionation in the water column.
The δ30SibSi obtained from seawater samples agrees well with δ30SibSi_sed. from core-top sediments from the main upwelling region, especially if considering that δ30SibSi from the water column and δ30SibSi_sed. integrate the dSi signal over different time scales. However, small offsets between the water column and sediment δ30SibSi_sed. signatures can be explained by differences in the diatom assemblages, representing different succession stages. Our study demonstrates the importance of the inclusion of taxonomic information when interpreting stable silicon isotope compositions of sedimentary diatoms.
Data Availability Statement
Stable silicon isotope data as well as hydrographic data is available under https://doi.pangaea.de/10.1594/PANGAEA.905552.
Author Contributions
PG designed the study, drafted the manuscript, and sampled and analyzed the samples. KD assisted with sampling during RV cruise M93. KH performed the taxonomic evaluation of the diatom assemblages. JJ and MB advised the biogenic sample preparation at the UCSB. All authors listed contributed to the writing and intellectual contribution of the manuscript and approved it for publication.
Conflict of Interest
The authors declare that the research was conducted in the absence of any commercial or financial relationships that could be construed as a potential conflict of interest.
Publisher’s Note
All claims expressed in this article are solely those of the authors and do not necessarily represent those of their affiliated organizations, or those of the publisher, the editors and the reviewers. Any product that may be evaluated in this article, or claim that may be made by its manufacturer, is not guaranteed or endorsed by the publisher.
Funding
The project was funded by the Sonderforschungsbereich 754 “Climate – Biogeochemistry Interactions in the Tropical Ocean” (www.sfb754.de), which was supported by the Deutsche Forschungsgemeinschaft (DFG). MB and JJ were supported by the US National Science Foundation (OCE1233028).
Acknowledgments
We would like to thank the captain, crew, participants, and the Chief Scientist Gaute Lavik of the RV Meteor cruise for their support during cruise M93. We thank Ulrich Sommer for the verification of some diatom taxa. We particularly thank Jutta Heinze (GEOMAR) for her help preparing cruises and in the clean laboratory.
Supplementary Material
The Supplementary Material for this article can be found online at: https://www.frontiersin.org/articles/10.3389/fmars.2021.697400/full#supplementary-material
References
Bach, L. T., Paul, A. J., Boxhammer, T., von der Esch, E., Graco, M., Schulz, K. G., et al. (2020). Factors controlling plankton community production, export flux, and particulate matter stoichiometry in the coastal upwelling system off Peru. Biogeosciences 17, 4831–4852. doi: 10.5194/bg-17-4831-2020
Barraqueta, J.-L. M., Samanta, S., Achterberg, E. P., Bowie, A. R., Croot, P., Cloete, R., et al. (2020). A first global oceanic compilation of observational dissolved aluminum data with regional statistical data treatment. Front. Mar. Sci. 7:468. doi: 10.3389/fmars.2020.00468
Bruland, K. W., Rue, E. L., Smith, G. J., and DiTullio, G. R. (2005). Iron, macronutrients and diatom blooms in the Peru upwelling regime: brown and blue waters of Peru. Mar. Chem. 93, 81–103. doi: 10.1016/j.marchem.2004.06.011
Brunner, E., Gröger, C., Lutz, K., Richthammer, P., Spinde, K., and Sumper, M. (2009). Analytical studies of silica biomineralization: towards an understanding of silica processing by diatoms. Appl. Microbiol. Biotechnol. 84, 607–616. doi: 10.1007/s00253-009-2140-3
Brzezinski, M. A., Jones, J. L., Bidle, K. D., and Azam, F. (2003). The balance between silica production and silica dissolution in the sea: insights from Monterey Bay, California, applied to the global data set. Limnol. Oceanogr. 48, 1846–1854. doi: 10.4319/lo.2003.48.5.1846
Brzezinski, M. A., and Nelson, D. M. (1989). Seasonal changes in the silicon cycle within a Gulf Stream warm-core ring. Deep Sea Res. 36, 1009–1030. doi: 10.1016/0198-0149(89)90075-7
Cao, Z., Frank, M., Dai, M., Grasse, P., and Ehlert, C. (2012). Silicon isotope constraints on sources and utilization of silicic acid in the northern South China Sea. Geochim. Cosmochim. Acta 97, 88–104. doi: 10.1016/j.gca.2012.08.039
Cardinal, D., Savoye, N., Trull, T. W., Dehairs, F., Kopczynska, E. E., Fripiat, F., et al. (2007). Silicon isotopes in spring Southern Ocean diatoms: large zonal changes despite homogeneity among size fractions. Mar. Chem. 106, 46–62. doi: 10.1016/j.marchem.2006.04.006
Cassarino, L., Hendry, K. R., Meredith, M. P., Venables, H. J., and Rocha, C. L. D. L. (2017). Silicon isotope and silicic acid uptake in surface waters of Marguerite Bay, West Antarctic Peninsula. Deep Sea Res. 139, 143–150. doi: 10.1016/j.dsr2.2016.11.002
Cavagna, A.-J., Fripiat, F., Dehairs, F., Wolf-Gladrow, D., Cisewski, B., Savoye, N., et al. (2011). Silicon uptake and supply during a Southern Ocean iron fertilization experiment (EIFEX) tracked by Si isotopes. Limnol. Oceanogr. 56, 147–160. doi: 10.4319/lo.2011.56.1.0147
Chavez, F. P., and Messié, M. (2009). A comparison of eastern boundary upwelling ecosystems. Prog. Oceanogr. 83, 80–96. doi: 10.1016/j.pocean.2009.07.032
Closset, I., Cardinal, D., Bray, S. G., Thil, F., Djouraev, I., Rigual-Hernández, A. S., et al. (2015). Seasonal variations, origin, and fate of settling diatoms in the Southern Ocean tracked by silicon isotope records in deep sediment traps. Global Biogeochem. Cycles 29, 1495–1510. doi: 10.1002/2015gb005180
Closset, I., Cardinal, D., Rembauville, M., Thil, F., and Blain, S. (2016). Unveiling the Si cycle using isotopes in an iron-fertilized zone of the Southern Ocean: from mixed-layer supply to export. Biogeosciences 13, 6049–6066. doi: 10.5194/bg-13-6049-2016
Closset, I., Cardinal, D., Trull, T. W., and Fripiat, F. (2019). New insights into processes controlling the δ30Si of sinking diatoms: a seasonally resolved box model approach. Global Biogeochem. Cycles 33, 957–970. doi: 10.1029/2018gb006115
Dale, A., Paul, K. M., Clemens, D., Scholz, F., Schroller-Lomnitz, U., Wallman, K., et al. (2021). Recycling and burial of biogenic silica in an open margin oxygen minimum zone. Global Biogeochem. Cycles 35:e2020GB006583.
De La Rocha, C. L., Brzezinski, M. A., and DeNiro, M. J. (1997). Fractionation of silicon isotopes by marine diatoms during biogenic silica formation. Geochim. Cosmochim. Acta 61, 5051–5056. doi: 10.1111/gbi.12449
De La Rocha, C., Brzezinski, M. A., DeNiro, M. J., and Shemesh, A. (1998). Silicon-isotope composition of diatoms as an indicator of past oceanic change. Nature 395, 680–683. doi: 10.1038/27174
Demarest, M. S., Brzezinski, M. A., and Beucher, C. P. (2009). Fractionation of silicon isotopes during biogenic silica dissolution. Geochim. Cosmochim. Acta 73, 5572–5583.
Delgado, E., and Chang, F. (2010). Fitoplancton del Mar Peruano, Verano, Vol. 42. Callao District: Instituto del Mar Péru.
de Souza, G. F., Reynolds, B. C., Johnson, G. C., Bullister, J. L., and Bourdon, B. (2012). Silicon stable isotope distribution traces Southern Ocean export of Si to the eastern South Pacific thermocline. Biogeosciences 9, 4199–4213. doi: 10.5194/bg-9-4199-2012
Doering, K., Ehlert, C., Grasse, P., Crosta, X., Fleury, S., Frank, M., et al. (2016a). Differences between mono-generic and mixed diatom silicon isotope compositions trace present and past nutrient utilisation off Peru. Geochim. Cosmochim. Acta 177, 30–47. doi: 10.1016/j.gca.2015.12.029
Doering, K., Ehlert, C., Martinez, P., Frank, M., and Schneider, R. (2019). Latitudinal variations in δ30Si and δ15N signatures along the Peruvian shelf: quantifying the effects of nutrient utilization versus denitrification over the past 600 years. Biogeosciences 16, 2163–2180. doi: 10.5194/bg-16-2163-2019
Doering, K., Ehlert, C., Pahnke, K., Frank, M., Schneider, R., and Grasse, P. (2021). Silicon isotope signatures of radiolaria reveal taxon-specific differences in isotope fractionation. Front. Mar. Sci. 8:666896. doi: 10.3389/fmars.2021.666896
Doering, K., Erdem, Z., Ehlert, C., Fleury, S., Frank, M., and Schneider, R. (2016b). Changes in diatom productivity and upwelling intensity off Peru since the last glacial maximum: response to basin-scale atmospheric and oceanic forcing. Paleoceanography 31, 1453–1473. doi: 10.1002/2016pa002936
Echevin, V., Aumont, O., Ledesma, J., and Flores, G. (2008). The seasonal cycle of surface chlorophyll in the Peruvian upwelling system: a modelling study. Prog. Oceanogr. 79, 167–176. doi: 10.1016/j.pocean.2008.10.026
Egan, K. E., Rickaby, R. E. M., Leng, M. J., Hendry, K. R., Hermoso, M., Sloane, H. J., et al. (2012). Diatom silicon isotopes as a proxy for silicic acid utilisation: a Southern Ocean core top calibration. Geochim. Cosmochim. Acta 96, 174–192. doi: 10.1016/j.gca.2012.08.002
Ehlert, C., Grasse, P., and Frank, M. (2013). Changes in silicate utilisation and upwelling intensity off Peru since the Last Glacial Maximum – insights from silicon and neodymium isotopes. Quat. Sci. Rev. 72, 18–35. doi: 10.1016/j.quascirev.2013.04.013
Ehlert, C., Grasse, P., Guitiérrez, D., Salvatecci, R., and Frank, M. (2015). Nutrient utilisation and weathering inputs in the Peruvian upwelling region since the Little Ice Age. Clim. Past 11, 187–202. doi: 10.5194/cp-11-187-2015
Ehlert, C., Grasse, P., Mollier-Vogel, E., Böschen, T., Franz, J., de Souza, G. F., et al. (2012). Factors controlling the silicon isotope distribution in waters and surface sediments of the Peruvian coastal upwelling. Geochim. Cosmochim. Acta 99, 128–145. doi: 10.1016/j.gca.2012.09.038
Franz, J., Krahmann, G., Lavik, G., Grasse, P., Dittmar, T., and Riebesell, U. (2012). Dynamics and stoichiometry of nutrients and phytoplankton in waters influenced by the oxygen minimum zone in the eastern tropical Pacific. Deep Sea Res. 62, 20–31. doi: 10.1016/j.dsr.2011.12.004
Fripiat, F., Cardinal, D., Tison, J., Worby, A., and André, L. (2007). Diatom−induced silicon isotopic fractionation in Antarctic sea ice. J. Geophys. Res. Biogeosci. 112.
Fripiat, F., Cavagna, A.-J., Dehairs, F., de Brauwere, A., André, L., and Cardinal, D. (2012). Processes controlling the Si-isotopic composition in the Southern Ocean and application for paleoceanography. Biogeosciences 9, 2443–2457. doi: 10.5194/bg-9-2443-2012
Fripiat, F., Cavagna, A.-J., Savoye, N., Dehairs, F., André, L., and Cardinal, D. (2011). Isotopic constraints on the Si-biogeochemical cycle of the Antarctic Zone in the Kerguelen area (KEOPS). Mar. Chem. 123, 11–22. doi: 10.1016/j.marchem.2010.08.005
Fry, B. (1996). 13C/12C fractionation by marine diatoms. Mar. Ecol. Prog. Ser. 134, 283–294. doi: 10.3354/meps134283
Gao, S., Wolf-Gladrow, D. A., and Völker, C. (2016).. Simulating the modern δ30Si distribution in the oceans and in marine sediments. Global Biogeochem Cycle 30, 120–133. doi: 10.1002/2015gb005189
Georg, R. B., Reynolds, B. C., Frank, M., and Halliday, A. N. (2006). New sample preparation techniques for the determination of Si isotopic compositions using MC-ICPMS. Chem. Geol. 235, 95–104. doi: 10.1016/j.chemgeo.2006.06.006
Grasse, P., Brzezinski, M. A., Cardinal, D., de Souza, G. F., Andersson, P., Closset, I., et al. (2017). GEOTRACES inter-calibration of the stable silicon isotope composition of dissolved silicic acid in seawater. J. Anal. At. Spectrom. 32, 562–578. doi: 10.1039/c6ja00302h
Grasse, P., Closset, I., Jones, J. L., Geilert, S., and Brzezinski, M. A. (2020). Controls on dissolved silicon isotopes along the U.S. GEOTRACES Eastern Pacific Zonal Transect (GP16). Global Biogeochem. Cycles 34:e2020GB006538.
Grasse, P., Ehlert, C., and Frank, M. (2013). The influence of water mass mixing on the dissolved Si isotope composition in the Eastern Equatorial Pacific. Earth Planet. Sci. Lett. 380, 60–71. doi: 10.1016/j.epsl.2013.07.033
Grasse, P., Ryabenko, E., Ehlert, C., Altabet, M. A., and Frank, M. (2016). Silicon and nitrogen cycling in the upwelling area off Peru: a dual isotope approach. Limnol. Oceanogr. 61, 1661–1676. doi: 10.1002/lno.10324
Grasshoff, K., Kremling, K., and Ehrhardt, M. (1999). Methods of Seawater Analysis, 3rd Edn. New York, NY: Wiley-VCH.
Hendry, K. R., Marron, A. O., Vincent, F., Conley, D. J., Gehlen, M., Ibarbalz, F. M., et al. (2018). Competition between silicifiers and non-silicifiers in the past and present ocean and its evolutionary impacts. Front. Mar. Sci. 5:22. doi: 10.3389/fmars.2018.00022
Hendry, K. R., Robinson, L. F., Meredith, M. P., Mulitza, S., Chiessi, C. M., and Arz, H. (2012). Abrupt changes in high-latitude nutrient supply to the Atlantic during the last glacial cycle. Geology 40, 123–126. doi: 10.1130/g32779.1
Hildebrand, M. (2008). Diatoms, biomineralization processes, and genomics. Chem. Rev. 108, 4855–4874. doi: 10.1021/cr078253z
Hildebrand, M., Volcani, B. E., Gassmann, W., and Schroeder, J. I. (1997). A gene family of silicon transporters. Nature 385, 688–689. doi: 10.1038/385688b0
Ho, P., Resing, J. A., and Shiller, A. M. (2019). Processes controlling the distribution of dissolved Al and Ga along the U.S. GEOTRACES East Pacific Zonal Transect (GP16). Deep Sea Res. 147, 128–145. doi: 10.1016/j.dsr.2019.04.009
Holzer, M., and Brzezinski, M. A. (2015). Controls on the silicon isotope distribution in the ocean: new diagnostics from a data-constrained model. Global Biogeochem. Cycle 29, 267–287. doi: 10.1002/2014gb004967
Hutchins, D. A., Hare, C. E., Weaver, R. S., Zhang, Y., Firme, G. F., DiTullio, G. R., et al. (2002). Phytoplankton iron limitation in the humboldt current and peru upwelling. Limnol. Oceanogr. 47, 997–1011. doi: 10.4319/lo.2002.47.4.0997
Karl, D. M., and Tien, G. (1992). MAGIC: a sensitive and precise method for measuring dissolved phosphorus in aquatic environments. Limnol. Oceanogr. 37, 105–116. doi: 10.4319/lo.1992.37.1.0105
Karstensen, J., Stramma, L., and Visbeck, M. (2008). Oxygen minimum zones in the eastern tropical Atlantic and Pacific oceans. Prog. Oceanogr. 77, 331–350. doi: 10.1016/j.pocean.2007.05.009
Köhler, L., Machill, S., Werner, A., Selzer, C., Kaskel, S., and Brunner, E. (2017). Are diatoms “green” aluminosilicate synthesis microreactors for future catalyst production? Molecules 22:2232. doi: 10.3390/molecules22122232
Koning, E., Gehlen, M., Flank, A.-M., Calas, G., and Epping, E. (2007). Rapid post-mortem incorporation of aluminum in diatom frustules: evidence from chemical and structural analyses. Mar. Chem. 106, 208–222. doi: 10.1016/j.marchem.2006.06.009
Machill, S., Köhler, L., Ueberlein, S., Hedrich, R., Kunaschk, M., Paasch, S., et al. (2013). Analytical studies on the incorporation of aluminium in the cell walls of the marine diatom Stephanopyxis turris. Biometals 26, 141–150. doi: 10.1007/s10534-012-9601-3
Mariotti, A., Germon, J. C., Hubert, P., Kaiser, P., Letolle, R., Tardieux, A., et al. (1981). Experimental determination of nitrogen kinetic isotope fractionation: some principles; illustration for the denitrification and nitrification processes. Plant Soil 62, 413–430. doi: 10.1007/bf02374138
Marron, A., Cassarino, L., Hatton, J., Curnow, P., and Hendry, K. R. (2019). Technical note: the silicon isotopic composition of choanoflagellates: implications for a mechanistic understanding of isotopic fractionation during biosilicification. Biogeosciences 16, 4805–4813. doi: 10.5194/bg-16-4805-2019
Meyerink, S. W., Ellwood, M., Maher, W., and Strzepek, R. (2017). Iron availability influences silicon isotope fractionation in two southern ocean diatoms (Proboscia inermis and Eucampia antarctica) and a coastal diatom (Thalassiosira pseudonana). Front. Mar. Sci. 4:217. doi: 10.3389/fmars.2017.00217
Milligan, A. J., Varela, D. E., Brzezinski, M. A., and Morel, F. M. M. (2004). Dynamics of silicon metabolism and silicon isotopic discrimination in a marine diatomas a function of pCO 2. Limnol. Oceanogr. 49, 322–329. doi: 10.4319/lo.2004.49.2.0322
Montes, I., Colas, F., Capet, X., and Schneider, W. (2010). On the pathways of the equatorial subsurface currents in the eastern equatorial Pacific and their contributions to the Peru−Chile Undercurrent. J. Geophys. Res. 115:C09003. doi: 10.1029/2009JC005710
Montes, I., Dewitte, B., Gutknecht, E., Paulmier, A., Dadou, I., Oschlies, A., et al. (2014). High−resolution modeling of the eastern tropical pacific oxygen minimum zone: sensitivity to the tropical oceanic circulation. J. Geophys. Res. Oceans 119, 5515–5532.
Needoba, J. A., Sigman, D. M., and Harrison, P. J. (2004). The mechanism of isotope fractionation during nitrate assimilation as illuminated by the 15N/14N intracellular nitrate. J. Phycol. 40, 517–522. doi: 10.1111/j.1529-8817.2004.03172.x
Nelson, D. M., Tréguer, P., Brzezinski, M. A., Leynaert, A., and Quéguiner, B. (1995). Production and dissolution of biogenic silica in the ocean: revised global estimates, comparison with regional data and relationship to biogenic sedimentation. Global Biogeochem. Cycle 9, 359–372. doi: 10.1029/95gb01070
Nelson, D. M., and Brzezinski, M. A. (1997). Diatom growth and productivity in an oligo−trophic midocean gyre: a 3−yr record from the Sargasso Sea near Bermuda. Limnol. Oceanogr. 42, 473–486.
Oku, O., and Kamatani, A. (1997). Resting spore formation of the marine planktonic diatom Chaetoceros anastomosans induced by high salinity and nitrogen depletion. Mar. Biol. 127, 515–520. doi: 10.1007/s002270050040
Paasche, E. (1973). Silicon and the ecology of marine plankton diatoms. I. Thalassiosira pseudonana (Cyclotella nana) grown in a chemostat with silicate as limiting nutrient. Mar. Biol. 19, 117–126. doi: 10.1007/bf00353582
Pelusi, A., Luca, P. D., Manfellotto, F., Thamatrakoln, K., Bidle, K. D., and Montresor, M. (2020). Virus-induced spore formation as a defense mechanism in marine diatoms. New Phytol. 229, 2251–2259. doi: 10.1111/nph.16951
Pennington, J. T., Mahoney, K. L., Kuwahara, V. S., Kolber, D. D., Calienes, R., and Chavez, F. P. (2006). Primary production in the eastern tropical Pacific: a review. Prog. Oceanogr. 69, 285–317.
Pichevin, L. E., Reynolds, B. C., Ganeshram, R. S., Cacho, I., Pena, L., Keefe, K., et al. (2009). Enhanced carbon pump inferred from relaxation of nutrient limitation in the glacial ocean. Nature 459, 1114–1117. doi: 10.1038/nature08101
Ragueneau, O., and Tréguer, P. (1994). Determination of biogenic silica in coastal waters: applicability and limits of the alkaline digestion method. Mar. Chem. 45, 43–51.
Ragueneau, O., Savoye, N., Amo, Y. D., Cotten, J., Tardiveau, B., and Leynaert, A. (2005). A new method for the measurement of biogenic silica in suspended matter of coastal waters: using Si:Al ratios to correct for the mineral interference. Cont. Shelf Res. 25, 697–710. doi: 10.1016/j.csr.2004.09.017
Reynolds, B. C., Frank, M., and Halliday, A. N. (2006). Silicon isotope fractionation during nutrient utilization in the North Pacific. Earth Planet. Sci. Lett. 244, 431–443. doi: 10.1016/j.epsl.2006.02.002
Reynolds, B. C., Aggarwal, J., André, L., Baxter, D., Beucher, C., Brzezinski, M. A., et al. (2007). An inter-laboratory comparison of Si isotope reference materials. J. Anal. Atom. Spectrom 22, 561–568. doi: 10.1007/s11356-016-7262-4
Rynearson, T. A., Richardson, K., Lampitt, R. S., Sieracki, M. E., Poulton, A. J., Lyngsgaard, M. M., et al. (2013). Major contribution of diatom resting spores to vertical flux in the sub-polar North Atlantic. Deep Sea Res. 82, 60–71. doi: 10.1016/j.dsr.2013.07.013
Santos, I. R., Chen, X., Lecher, A. L., Sawyer, A. H., and Moosdorf, N. (2021). Submarine groundwater discharge impacts on coastal nutrient biogeochemistry. Nat. Rev. Earth Environ. 2, 307–323. doi: 10.1038/s43017-021-00152-0
Schneider, W., Fuenzalida, R., Rodríguez−Rubio, E., Garcés−Vargas, J., and Bravo, L. (2003). Characteristics and formation of eastern South Pacific intermediate water. Geophys. Res. Lett. 30:1581. doi: 10.1029/2003GL017086
Schuette, G. (1980). Recent Marine Diatom Taphocoenoses off Peru and off Southwest Africa: Reflection of Coastal Upwelling. Corvallis, OR: Oregon Stat University.
Shemesh, A., Mortlock, R. A., Smith, R. J., and Froelich, P. N. (1988). Determination of Ge/Si in marine siliceous microfossils: separation, cleaning and dissolution of diatoms and radiolaria. Mar. Chem. 25, 305–323. doi: 10.1016/0304-4203(88)90113-2
Shrestha, R., Allen, A. E., Tesson, B., Norden-Krichmar, T., Federowicz, S., and Hildebrand, M. (2012). Whole transcriptome analysis of the silicon response of the diatom Thalassiosira pseudonana. BMC Genomics 13:499. doi: 10.1186/1471-2164-13-499
Shrestha, R. P., and Hildebrand, M. (2014). Evidence for a Regulatory role of diatom silicon transporters in cellular silicon responses. Eukaryot. Cell 14, 29–40. doi: 10.1128/ec.00209-14
Snelling, A. M., Swann, G. E. A., Leng, M. J., and Pike, J. (2012). A Micro-manipulation technique for the purification of diatoms for isotope and geochemical analysis. Silicon 5, 13–17. doi: 10.1007/s12633-012-9115-1
Stamm, F. M., Zambardi, T., Chmeleff, J., Schott, J., von Blanckenburg, F., and Oelkers, E. H. (2019). The experimental determination of equilibrium Si isotope fractionation factors among H4SiO4°, H3SiO4 - and amorphous Silica (SiO2⋅0.32 H2O) at 25 and 75 oC using the three-isotope method. Geochim. Cosmochim. Acta 255, 49–68.
Studer, A. S., Ellis, K. K., Oleynik, S., Sigman, D. M., and Haug, G. H. (2013). Size-specific opal-bound nitrogen isotope measurements in North Pacific sediments. Geochim. Cosmochim. Acta 120, 179–194. doi: 10.1016/j.gca.2013.06.041
Studer, A. S., Sigman, D. M., Martínez-Garcia, A., Benz, V., Winckler, G., Kuhn, G., et al. (2015). Antarctic zone nutrient conditions during the last two glacial cycles. Paleoceanography 30, 845–862. doi: 10.1002/2014pa002745
Sun, X., Olofsson, M., Andersson, P. S., Fry, B., Legrand, C., Humborg, C., et al. (2014). Effects of growth and dissolution on the fractionation of silicon isotopes by estuarine diatoms. Geochim. Cosmochim. Acta 130, 156–166. doi: 10.1016/j.gca.2014.01.024
Sutton, J. N., André, L., Cardinal, D., Conley, D. J., de Souza, G. F., Dean, J., et al. (2018). A review of the stable isotope bio-geochemistry of the global silicon cycle and its associated trace elements. Front. Earth Sci. 5:112. doi: 10.3389/feart.2017.00112
Sutton, J. N., Varela, D. E., Brzezinski, M. A., and Beucher, C. P. (2013). Species-dependent silicon isotope fractionation by marine diatoms. Geochim. Cosmochim. Acta 104, 300–309. doi: 10.1016/j.gca.2012.10.057
Tarazona, J., Gutiérrez, D., Paredes, C., and Indacochea, A. (2003). Overview and challenges of marine biodiversity research in Peru. Gayana 67, 206–231.
Thamatrakoln, K., and Hildebrand, M. (2008). Silicon Uptake in diatoms revisited: a model for saturable and nonsaturable uptake kinetics and the role of silicon transporters. Plant Physiol. 146, 1397–1407. doi: 10.1104/pp.107.107094
Thomsen, S., Kanzow, T., Krahmann, G., Greatbatch, R. J., Dengler, M., and Lavik, G. (2016). The formation of a subsurface anticyclonic eddy in the Peru-Chile Undercurrent and its impact on the near-coastal salinity, oxygen, and nutrient distributions. J. Geophys. Res. Oceans 121, 476–501. doi: 10.1002/2015jc010878
Tréguer, P., Bowler, C., Moriceau, B., Dutkiewicz, S., Gehlen, M., Aumont, O., et al. (2018). Influence of diatom diversity on the ocean biological carbon pump. Nat. Geosci. 11, 27–37. doi: 10.1038/s41561-017-0028-x
Utermöhl, H. (1958). Zur vervollkommnung der quantitativen phytoplankton-methodik. Int. Ver. Theor. Angew. Limnol. Mitt. 9, 1–38. doi: 10.1080/05384680.1958.11904091
Varela, D., Brzezinski, M. A., Beucher, C., Jones, J., Giesbrecht, K., Lansard, B., et al. (2016). Heavy silicon isotopic composition of silicic acid and biogenic silica in Arctic waters over the Beaufort shelf and the Canada Basin. Global Biogeochem. Cycles 30, 804–824. doi: 10.1002/2015gb005277
Varela, D. E., Pride, C. J., and Brzezinski, M. A. (2004). Biological fractionation of silicon isotopes in Southern Ocean surface waters. Glob. Biogeochem. Cycles 18:GB1047. doi: 10.1029/2003GB002140
Winkler, L. W. (1988). Die Bestimmung des im Wasser gelösten Sauerstoffes. Ber. Deutsch. Chem. Ges. 21, 2843–2854. doi: 10.1002/cber.188802102122
Wischmeyer, A. G., De La Rocha, C. L., Maier−Reimer, E., and Wolf−Gladrow, D. A. (2003). Control mechanisms for the oceanic distribution of silicon isotopes. Glob. Biogeochem. Cycles 17:1083. doi: 10.1029/2002GB002022
Wetzel, F., Souza, G. F., and de Reynolds, B. C. (2014). What controls silicon isotope fractionation during dissolution of diatom opal? Geochim. Cosmochim. Acta 131, 128–137.
Young, E. D., Galy, A., and Nagahara, H. (2002). Kinetic and equilibrium mass-dependent isotope fractionation laws in nature and their geochemical and cosmochemical significance. Geochim. Cosmochim. Acta 66, 1095–1104. doi: 10.1016/s0016-7037(01)00832-8
Keywords: biogenic silica, plankton – taxonomic group/assemblage, silicon cycle, upwelling region, oxygen minimum zone, core-top calibration, paleo proxies
Citation: Grasse P, Haynert K, Doering K, Geilert S, Jones JL, Brzezinski MA and Frank M (2021) Controls on the Silicon Isotope Composition of Diatoms in the Peruvian Upwelling. Front. Mar. Sci. 8:697400. doi: 10.3389/fmars.2021.697400
Received: 19 April 2021; Accepted: 21 June 2021;
Published: 23 July 2021.
Edited by:
Sunil Kumar Singh, Physical Research Laboratory, IndiaReviewed by:
Anne-Julie Cavagna, Vrije University Brussel, BelgiumXiaole Sun, Stockholm University, Sweden
Copyright © 2021 Grasse, Haynert, Doering, Geilert, Jones, Brzezinski and Frank. This is an open-access article distributed under the terms of the Creative Commons Attribution License (CC BY). The use, distribution or reproduction in other forums is permitted, provided the original author(s) and the copyright owner(s) are credited and that the original publication in this journal is cited, in accordance with accepted academic practice. No use, distribution or reproduction is permitted which does not comply with these terms.
*Correspondence: Patricia Grasse, cGF0cmljaWEuZ3Jhc3NlQGlkaXYuZGU=