 Marta Konik
 Mirosław Darecki
 Alexey K. Pavlov
 Sławomir Sagan
 Piotr Kowalczuk
- 1Remote Sensing Laboratory, Institute of Oceanology, Polish Academy of Sciences, Sopot, Poland
- 2Department of Geography, University of Victoria, Victoria, BC, Canada
Global warming is not often discussed in the context of light availability within the water column. However, the light regimes in the Arctic Ocean are controlled by three factors that are influenced by climate changes which are the sea ice albedo feedback, glacial meltwater runoff and marine primary production. Based on a satellite data series acquired during time period 1997 – 2019, we inspected long-term changes of the three commonly used optical characteristics Chla, atot(443), and Kd(490) within the Svalbard fjords and on the West Spitsbergen Shelf. We revealed evident positive trends in summer (July – September) in the Isfjorden, the Kongsfjorden, the Hornsund fjord, and the Bellsund. Moreover, between 1997 and 2019 at the majority of locations we observed a regime shift toward darker waters. We showed that light availability has changed in the Svalbard fjords since 1997, which may be a symptom of transformations in the environment that should be further investigated and monitored.
Introduction
In the mid-1970s a significant change in the Arctic Ocean system began. Since then, systematic satellite observations have proved that the Arctic Ocean ice cover is shrinking, and in the following decades the trend has continued with a rate of −13.3% dec–1 (Serreze and Stroeve, 2015). The main driving force for the decline of the Arctic Sea ice area and its thickness was an increase in global mean temperature, which in the Arctic is two times stronger than elsewhere (Weller, 2005; Cohen et al., 2014). Sea ice forms a boundary layer in polar and sub-polar marine basins, that reduces the heat, mass, and momentum exchange between the ocean and atmosphere (McPhee, 2017), alters the surface albedo and reduces radiative energy transfer to the underlying water, which affects the heating rate and primary production (Arrigo, 2017). Sea ice, especially in the Arctic, regulates global climatic processes-, because its albedo is drastically higher than the open water surface or ice-free land areas. Therefore, enhanced melting and ice cover retreat results in higher doses of radiation reaching sea waters which when absorbed, additionally enhances water temperatures accelerating the heating rate that is the so-called sea ice albedo feedback (Curry et al., 1995; Kashiwase et al., 2017). The consequences of global warming have impacted the whole Arctic Ocean and its terrestrial watershed leading to a cascade of changes in the physical environment, biogeochemical process, and its ecosystems and their functions (Smedsrud et al., 2016). The sea-ice decline in the Arctic Ocean has been accompanied by an increase of its productivity (Ardyna and Arrigo, 2020) that has been observed in eutrophic shelf area, oligotrophic Central Arctic Basin and exchange gateways in Bering and Fram Straits (Kohler et al., 2007) and Canadian Archipelago (Hill et al., 2018). Terrestrial systems in the vast watersheds surrounding the Arctic Ocean are subject to changes too (Parmentier et al., 2017). Increased precipitation and accelerating permafrost thawing affected coastal erosion and water runoff from land (Kipp et al., 2018). Terrestrial fluxes of heat, dissolved, and particulate material through melt-water discharge and riverine inflow contributed to an increase of productivity in continental shelf margins. Through the exchange gateways, particularly, the Fram Strait, the Arctic Ocean received steadily increased advection of heat and salt from mid-latitudes with inflowing Atlantic Water (Walczowski, 2014; Polyakov et al., 2017). Together with the inflow of warm and salty Atlantic Water a significant northward advance of temperate phytoplankton and changes of the planktonic organism size distribution toward smaller organisms, i.e., pico- and nanoplankton have been observed (Oziel et al., 2017; Neukermans et al., 2018).
Changes in the light availability in the ocean are not often discussed as one of the consequences of global climatic changes. The light regimes in the surface waters of the Arctic Ocean are controlled mainly by the sea ice albedo feedback, terrestrial fluxes, and marine primary production. As those three processes are strongly affected by global warming, the light availability in the Arctic Ocean has been significantly altered across the whole ocean basin. The amount of light at various wavelengths reaching the ocean surface through the atmosphere is regulated by the Sun’s activity, the Earth’s orbit geometry, and transmission through the atmosphere, which depends on cloud cover, the concentration of water vapor and other gasses, and concentration of scattering and absorbing aerosols (Dera, 1992). In the water column, the transmission of solar energy into deeper layers depends mainly on the spectral optical properties of water and optically significant water constituents. In the simplified model, the optical properties of seawater are a superposition of spectral scattering and absorption coefficients of water molecules themselves, suspended organic and inorganic particles, colored dissolved organic matter (CDOM), dissolved inorganic salts, and dissolved inorganic gasses (Woźniak and Dera, 2007). Spectral absorption properties of each of them are additive and combined constitute inherent optical properties of the water (IOPs). In the Nordic Seas, the IOPs variability is driven by sea ice and glacier ice-melt processes (Noël et al., 2020; Schuler et al., 2020), phytoplankton dynamics in spring and summer (Winter et al., 2014; Pavlov et al., 2015; Kowalczuk et al., 2019), and mixing of multiple water masses that contain different CDOM concentrations (Granskog et al., 2015; Pavlov et al., 2015; Makarewicz et al., 2018). Melting ice provides input of fresh water, but also inorganic suspended matter (Bélanger et al., 2013) which sub-glacial melt is particularly rich in (Holinde and Zielinski, 2016). Plankton communities are a primary source of organic particles and are tightly related to particulate carbon stocks in Fram Strait (Engel et al., 2019). Phytoplankton also contributes to the autochthonous production of dissolved organic matter in the West Spitsbergen Current (Makarewicz et al., 2018). Therefore, this is a region of particular environmental significance, but the remoteness, ice cover, and harsh meteorological conditions drastically limit the amount of in situ data on inherent (IOPs) and apparent optical properties (AOPs). Most of the papers have been published in recent years (see citations above) and only few in the first decade of 21st century (Stramska et al., 2003, 2006). Long-term changes and evolution of IOPs and AOPs is largely unknown in the Arctic Ocean, especially in the European sector. The scarcity of the long-term records could be partially addressed using available ocean color data time-series for this region.
In general, a typical Svalbard fjord would consist of three water layers: Surface Waters at the top (local), Intermediate Waters at intermediate depths (advected), and Winter Water at the bottom of the water column (Cottier et al., 2010). The near-surface, relatively fresh layer is formed mostly by sea ice and glacial-melt, and freshwater runoff discharged in the spring and early summer months. A gradual formation of the density gradient reduces vertical mixing and particle sedimentation. Particulate suspended and dissolved matter trapped in the surface layer accelerate water heating in the months when insolation is the most intense. A warmer surface layer may provide optimal temperature conditions for various organisms over a season that would support primary production. Although photosynthetically available radiation, “PAR,” intensity values reach a maximum in June, the highest air temperatures are lagged by about a month, and water temperatures are usually the highest in late July and early August (Calleja et al., 2017; Payne and Roesler, 2019). The vertical stratification stabilizes in summer, which is accompanied by shallowing of the mixed layer and accumulation of the Chla near the sea surface, which was clearly demonstrated in the results of Calleja et al. (2017). Calleja et al. (2017) compared vertical profiles of T, S, Chla measured at locations in the inner, middle and outer part of the Kongsfjorden in May, August, and October. They found that in the central part of the fjord in August, the thermo- and pycnocline were only several meters deep. Variability of the depth of the top mixed layer is a key-aspect regarding remote sensing.
Spectral IOPs and AOPs, and the relationships between them served as theoretical foundations of the ocean color remote sensing (OCRS). The first so-called “blue-green ratio” algorithms were developed for retrieval of chlorophyll a concentration (Morel and Prieur, 1977; Gordon et al., 1980; Gordon and Morel, 1983) during the “proof of concept” of the Coastal Zone Color Scanner (CZCS) mission launched in 1979. Since then, OCRS has evolved and has been used successfully for studying spatial and temporal dynamics of phytoplankton abundance, IOPs and AOPs, and oceanic primary production across a range of spatial and temporal scales (Blondeau-Patissier et al., 2014). After the outstanding scientific and operational success of the CZCS mission, a number of the next generation of ocean color sensors have been launched into the Earth’s orbit: Sea-viewing Wide Field-of-View Sensor (SeaWiFS), placed in orbit in 1997, was followed by the Moderate-Resolution Imaging Spectroradiometer (MODIS) deployed on the AQUA satellite, launched in 2002 and operated by United States NASA (Emberton et al., 2016). In 2002, the European Space Agency (ESA) also launched an Earth observation satellite. The Medium-Resolution Imaging Spectrometer (MERIS), in operation until 2012, was highly successful. The successor of MERIS is the Ocean and Land Color Instrument (OLCI). In 2010, the Climate Change Initiative (CCI) with the special Ocean Color section (OC-CCI) was launched to create data series of climate-quality by combining all available satellite measurements (Sathyendranath et al., 2012, 2019). A set of common spectral bands derived from the ocean color sensors with overlapping operation periods provided after merging a time series of coherent satellite observations spanned more than two decades (Mélin et al., 2016). We have used available data sets to analyze temporal changes in chlorophyll a and selected IOP and AOP values in West Spitsbergen fjords and adjacent oceanic shelf waters.
Fjords have been defined as aquatic critical zones (ACZs) (Bianchi et al., 2020) as these environments have been recognized as important carbon burial hot-spots sequestering the largest amount of organic carbon per unit of area (Smith et al., 2015). In those specific environments, especially in boreal and polar zones, integrated and accumulated effects of interactions between atmosphere, ocean, cryosphere, and surrounding landmass could be observed, which make those geomorphological units very sensitive to climatic changes (Bianchi et al., 2020). Effects of environmental changes could be observed visually as a progressive decline of water transparency in fjords, as the increase in terrestrial flux and autochthonous production of optically significant water constituents decreases water transparency and limits the amount of light in the water column, which is commonly called ‘darkening.’ This term was introduced about a decade ago when this effect was described for the first time along the Norwegian coast and has come to be used too, especially beyond the marine optics community (Aksnes et al., 2009). It was associated with enhanced riverine input of the CDOM and suspended particles due to increasing precipitation over terrestrial watersheds. The impact of climatic changes on water transparency in specific fjords in Norway and Greenland has been the subject of recent studies by Mascarenhas et al. (2017) and Mascarenhas and Zielinski (2018, 2019). To this day, very few papers have been published on seawater optical properties in Svalbard fjords and adjacent waters. Sagan and Darecki (2017) reported differences in IOPs distribution between the Hornsund and the Kongsfjorden and Pavlova et al. (2019) reviewed impacts of climatic changes on the light field in Kongsfjorden based on the existing data record. The local bio-optical and remote sensing algorithms for retrieval of chlorophyll a and suspended matter concentrations were developed for Kongsfjorden by Son and Kim (2018) and in adjacent coastal waters by Konik et al. (2020). The only long-term remote sensing study was published on the changes of IOPs in the Kongsfjorden (Payne and Roesler, 2019) in the context of modeling light availability for phytoplankton distribution in this fjord. No other studies of long-term changes in seawater optical properties have been conducted in the other fjords of the Svalbard Archipelago or the Nordic Seas. Despite the lack of direct observations, there are multiple lines of indirect evidence of ongoing long-term darkening of fjords. Among those is an already observed increased occurrence of the jellyfish Periphylla periphylla in Svalbard waters (Geoffroy et al., 2018), and shifts of kelp forest to shallower depths in Kongsfjorden likely associated with light limitation (Bartsch et al., 2016). Besides, the following manifestations of climate change are expected to contribute to the further darkening of coastal waters on Svalbard: accelerated melting of glaciers (Kohler et al., 2007), the anticipated increase in precipitations (Førland et al., 2011) in combination with accelerated thawing of permafrost (Isaksen et al., 2007) and greening of terrestrial vegetation (Vickers et al., 2016) will likely further elevate inputs of suspended particles and CDOM into fjords, thus making surface waters less transparent.
In this work, we aimed to fill the knowledge gap on the long-term changes of the water transparency in West Spitsbergen fjords and adjacent oceanic shelf, using ocean color data archive and developed locally optimized algorithms for retrieval of IOPs, AOPs, and chlorophyll a concentration. The long term assessment in fjord waters in Spitsbergen is important due to the high value of ecosystem services provided by the coastal areas, and presumable adverse effects of darkening and importance of this effect for the environmental management in Norwegian coastal waters (Tiller et al., 2017) and from the ecological and scientific standpoint for the global community.
Data and Methods
Study Area
We have conducted our analyses in the coastal waters of West Spitsbergen, the biggest island of the Svalbard Archipelago. We have focused on the fjords directly connected with the Greenland Sea: the Hornsund Fjord, the Van Mijenfjord with the Bellsund, the Isfjorden, and the Kongsfjorden (Figure 1). Water temperature and salinity within these fjords are controlled by the interaction of several water masses, typically dominated by the Atlantic Waters (AW) with modification of terrestrial and meltwater input as well as the contribution of cold and fresh Arctic Water (ArW) carried by the Sørkapp Current (SC). The AW carried by the West Spitsbergen Current (WSC) is the major heat source in the area that accelerates the ice melting and has a significant effect on the biogeochemical cycles and nutrient loads (Hegseth et al., 2019). The composition of water masses in the Hornsund fjord is strongly regulated by the SC that flows around the southern tip of Spitsbergen, bringing cold and fresh ArW from the Barents Sea. It propagates northward along the West Spitsbergen Shelf (WSS) parallel to the coast and the WSC, which results in reduced advection of AW into the fjord (Promińska et al., 2017). The other fjords on the west coast of Spitsbergen are more impacted by the WSC and AW. In particular, the seabed topography of the Isfjorden and the Kongsfjorden allows for easier penetration of AW into these fjords (Cottier et al., 2010; Skogseth et al., 2020; Bloshkina et al., 2021). In contrast, the Van Mijenfjord is a semi-enclosed water basin, separated from the Bellsund that connects it with the Greenland Sea by two elongated islands Akseløya and Mariaholmen positioned across the entrance of the fjord. It is an example of a fjord controlled by semi-diurnal tidal forcing with a strong vertical stratification. Relatively fresh and warm water, formed by runoff from glaciers, resides near the surface, whereas salt and cold water that flow into the fjord, remain in deeper layer (Støylen and Fer, 2014).
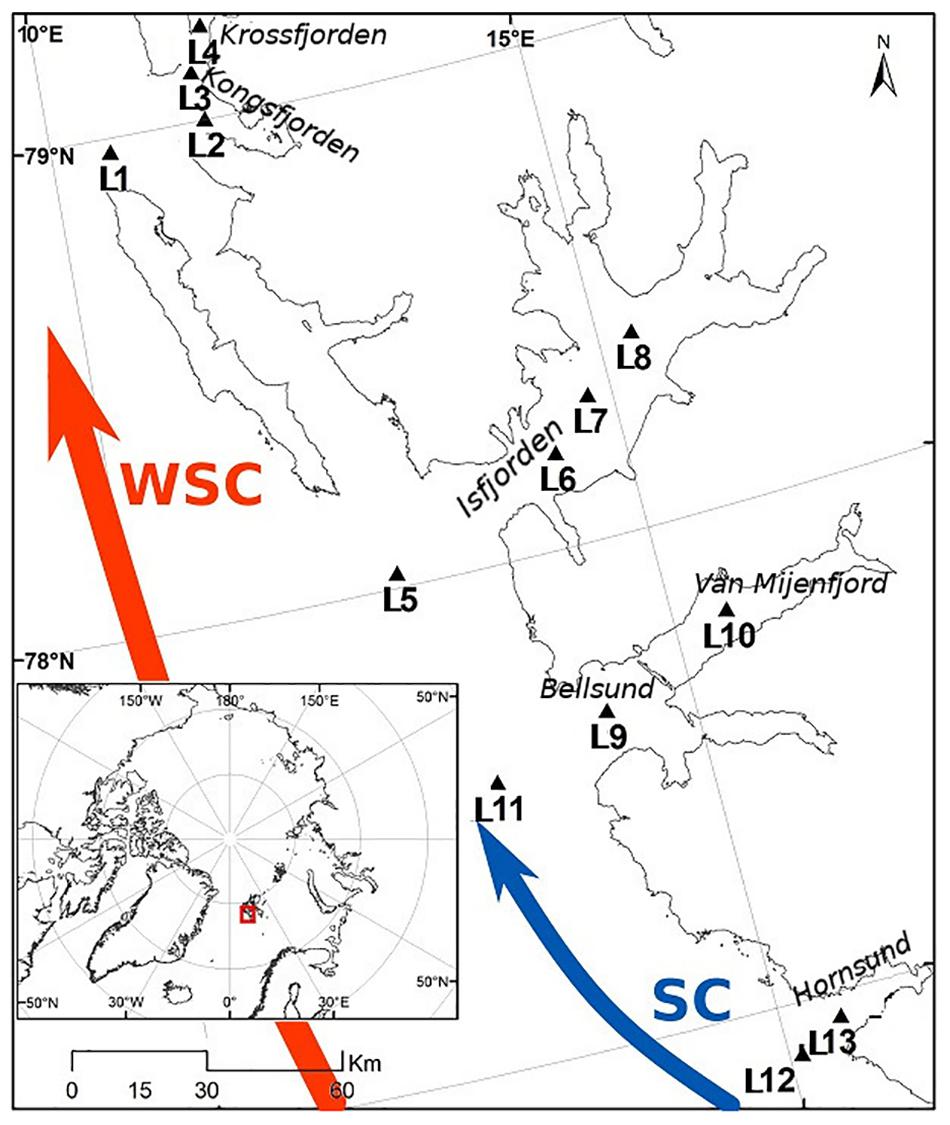
Figure 1. All of the considered study locations (also excluded L4) within Svalbard Fjords with the cold Sørkapp Current (SC) marked in blue and the warm West Spitsbergen Current (WSC) marked in red (shoreline: Wessel and Smith, 1996).
Satellite Data
As the main indicators describing quantitative changes in water transparency, we selected the variables routinely retrieved by OCRS and directly linked with the notion of ‘darkening.’ Of the three analyzed variables, chlorophyll a concentration, Chla, is a proxy for phytoplankton biomass. The total absorption coefficient at 443 nm, atot(443), overlaps with the main maximum of phytoplankton pigments absorption spectra and contains the contribution of other absorbing constituents in natural water: CDOM and suspended particles. The solar downward irradiance diffuse attenuation coefficient at 490 nm, Kd(490), describes the transmission of solar energy through the water column as the rate at which the solar downward irradiance is attenuated with increasing depth. It is one of the standard AOPs of the water column retrieved from satellite data. However, we based our analyses on the local algorithms and we used only remote sensing reflectance products at several wavelengths.
The satellite data used for the analysis were obtained from the EU Copernicus Marine Environment Monitoring Service (CMEMS1). This was a long time series of daily mosaics merged from multiple optical satellite sensors (MODIS, VIIRS, SeaWiFS, MERIS, and OLCI). The merged product had been developed in the framework of the ESA Climate Change Initiative (ESA-CCI/C3S project) (Sathyendranath et al., 2012, 2019). We exploited the remote sensing reflectance, Rrs [sr–1], product at six spectral bands: 412, 443, 490, 510, 555, and 670 nm from the Arctic region in a form of Level-3 OPTICS product of 1-km ground resolution (CMEMS id: OCEANCOLOUR_ARC_OPTICS_L3_REP_OBSERVATIONS_0 09_068) that covered years 1997 – 2019. These data set had been provided to CMEMS by Plymouth Marine Laboratory (McClain et al., 1995; CMEMS, 2020).
Remote Sensing Algorithms for Determination of Chlorophyll a Concentration and Total Absorption Coefficient
Available spectral remote sensing reflectance values were used to derive Chla, Kd(490), and atot(443) values at selected locations, and assess the darkening effects. We have used the empirical band ratio algorithms developed and validated in the Greenland Sea and the West Spitsbergen Shelf based on the in situ radiometric measurements conducted in the study area in summer seasons between 2013 and 2015 (Konik et al., 2020). Details of field work, methodologies of measurements and analytical methods that were used for determination of values of optically significant constituents and radiometric quantities needed for algorithm development and validation have been given in detail in studies by Makarewicz et al. (2018), Kowalczuk et al. (2019), and Konik et al. (2020). In brief, chlorophyll a concentration values were determined in collected water samples using the spectrophotometric method by Lorenzen (1967) and the formula by Strickland and Parsons (1972). The total absorption coefficient atot(λ) is the superposition of the spectral values of light absorption coefficient by CDOM aCDOM(λ) and the light absorption coefficient by suspended particles ap(λ). We omitted the influence of the light absorption coefficient after subtracting the pure water contribution to the light absorption coefficient, because it is almost constant in the natural waters and in typical for natural waters temperature ranges (Pope and Fry, 1997). The absorption coefficients by suspended particles were determined using Perkin-Elmer Lambda 650 double-beam spectrophotometer equipped with an integrating sphere. Details on sample handling, measurements protocol, and data processing have been included in Kowalczuk et al. (2017, 2019). The CDOM sample handling, measurements protocol, and data processing were described by Makarewicz et al. (2018). The OCRS algorithms, mathematical equations for determination of Chla and atot(443) in the Greenland Sea, validation details, and uncertainty assessments have been presented in detail by Konik et al. (2020).
Remote Sensing Algorithm for the Calculation of Solar Downward Irradiance Diffuse Attenuation Coefficient at 490 nm Kd(490)
The often-used spectral band, centered at 490 nm is located in the spectral range of maximum transmission (least attenuation) of solar energy in clear oceanic waters. At 490 nm, impact of phytoplankton is the least pronounced and it is possible to detect there more prominent signals by the other particles. In turbid coastal waters that are typical for the Arctic fjords, the spectral region of maximum transmission of solar energy can often be shifted toward the longer wavelengths, even to 560–580 nm. For this reason, the region-specific algorithm for retrieval of Kd(490) should be developed and applied in the Svalbard fjords.
We developed a locally optimized algorithm for retrieving the Kd(490) values based on four field campaigns conducted in the Svalbard fjords, mainly in the Hornsund fjord and the Kongsfjorden in 2009, 2010, 2016, and 2017 (Figure 2A). More than one hundred profiles of spectral downward irradiance Ed(λ) and upward radiance Lu(λ) have been made with the use of the high-performance free-fall aquatic profiler C-OPS (Compact Optical Profiling Systems, Biospherical Instruments, Inc.). C-OPS radiometer equipped with 19 wavebands (from 305 to 765 nm) was mounted in a free-fall backplane, allowing deployment far from the ship’s shadow. The instrument was equipped with a reference irradiance sensor mounted on the deck to measure incident irradiance and to control the stability of ambient light during deployment. The remote sensing reflectance, Rrs(λ), was calculated as a ratio of the upwelling radiance just above the water surface, Lw(λ), to downwelling irradiance measured above the water, Es(λ). The water-leaving radiance Lw(λ) was obtained from the upwelling radiance estimated just below the water surface, Lu(z = 0–,λ), and propagated through the water-air interface according to standard procedures described in the literature (Mueller et al., 2003). The Kd(490) for the subsurface layer was calculated as the local slope of ln[Ed(z,490)] measured within a depth interval spanning a few meters within the surface layer, depending on the extent to which the surface layer was homogeneous:
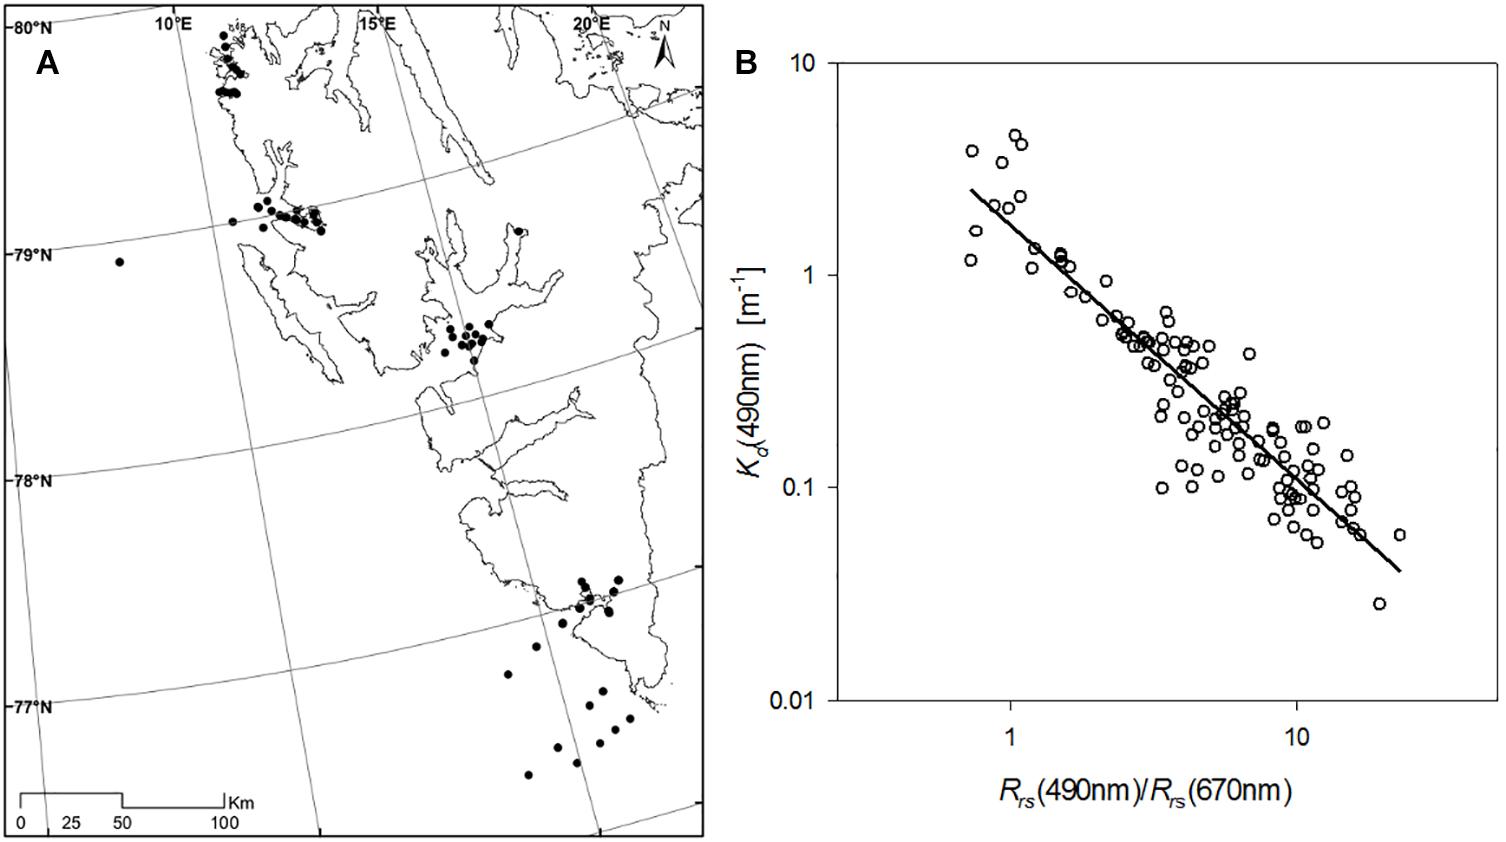
Figure 2. Location of the in situ measurements of Kd(490) used to develop a formula for satellite Kd(490) computation (A) and the relationship between the Kd(490) and the Rrs(490)/Rrs(670) band ratio with the regression applied in this study (line marked in black) (B).
The optimal regression between Kd(490) and Rrs band ratio (R2 = 0.85) has been found for Rrs(490)/Rrs(670) ratio, as presented in Figure 2B and Equation 1. The algorithm has been validated based on in situ radiometric measurements. The calculated mean normalized bias MNB (systematic error) and the normalized root-mean-square RMS error (random error) were 9 and 52%, respectively. We used this algorithm in our study to assess the long-term changes of the Kd(490) in the Svalbard fjords.
Statistical Analyzes
To assess the long-term variability of selected IOPs and AOPs in the fjords, we selected several locations labeled from L1 to L13 (Figure 1). The choice of locations allowed for capturing: open waters, the mouths of the fjords and the central parts of the fjords. There was at least one location placed within the fjord and one location on the West Spitsbergen Shelf near the mouth of a fjord. In order to minimize the noise influence we used median values of remotely sensed Chla, Kd(490), and atot(443) that were extracted from each processed map at 12 selected locations from a window of 3 pixels × 3 pixels (9 km2 area) (Figure 1). We used values where at least 5 out of 9 pixels were valid. Only results from locations with characteristic patterns or trends are presented in the paper. Results from all locations are included in the Supplementary Figures 1–6. The L4 location was excluded. Since this position had no valid data in relatively long periods, we feared that this could potentially bias our trend analysis. The full picture of the amount of valid data may be found in the Supplementary Figure 7.
Regarding the log-normal distribution of Chla, atot(443) and the Kd(490) (Campbell, 1995), all statistical analyses were performed using median metrics for all parameters. Statistical analyses were performed using R-CRAN software [libraries: ggplot2 (Wickham et al., 2020), ggformula (Kaplan and Pruim, 2020)]. Boxplots depict median values with lower and upper hinges corresponding to the first and third quartiles, and whiskers extend to 1.5 ∗ Inter-Quartile Range (IQR). The trend significance was assessed based on the lm fitting function (R Core Team, 2020). The regime shifts in the summer levels of Chla and Kd(490) values were identified using the changepoint library (Killick and Eckley, 2014; Killick et al., 2016). It identifies points within a data set where the statistical properties of a time-series change, and it is used in a variety of fields like finances or genetics, but it has been gaining recognition also in the climatology and oceanography (Giamalaki et al., 2018; Nordli et al., 2020). A time series is partitioned into smaller segments where data distribution remains homogeneous, and the beginnings and ends of these segments are characterized by an abrupt change of the mean value, which are sometimes called “tipping points” (Jackson et al., 2005). The algorithm used here is a combination of an optimal partitioning and pruning algorithm denoted “PELT the Pruned Exact Linear Time” (Killick et al., 2012; Jackson et al., 2005).
Results
Monthly Variability
The dark polar night and almost permanent cloud cover limit the number of available and usable satellite images to the period between March and September. Throughout the whole data series spanning 1997–2019, the broadest range of Chla concentration values were recorded mostly in April when phytoplankton blooms start in this region. It was visible particularly in the open waters at locations L1, L5, and L9 (Figure 3 and Supplementary Figure 1). In the Hornsund fjord at locations L12 and L13, there was also a substantial variability in March (Supplementary Figure 1). The spring bloom peaked in May when the local maxima of Chla were observed at most locations. It was followed by a slight Chla decrease in June and another increase with a stationary phytoplankton growth phase until the end of summer, sometimes sloping down in the last summer month (September). It is worth noting that at the locations outside the fjords, maximum Chla values were observed in May (L1, L5, and L11). On the contrary, in the central parts of the fjords, Chla reached maximum concentrations later in the year, usually around July – August (L2, L3, L6, L7, L8, L12, and L13) (Figure 3 and Supplementary Figure 1). The exception is L10, where both global and local maxima were noted only in July and August.
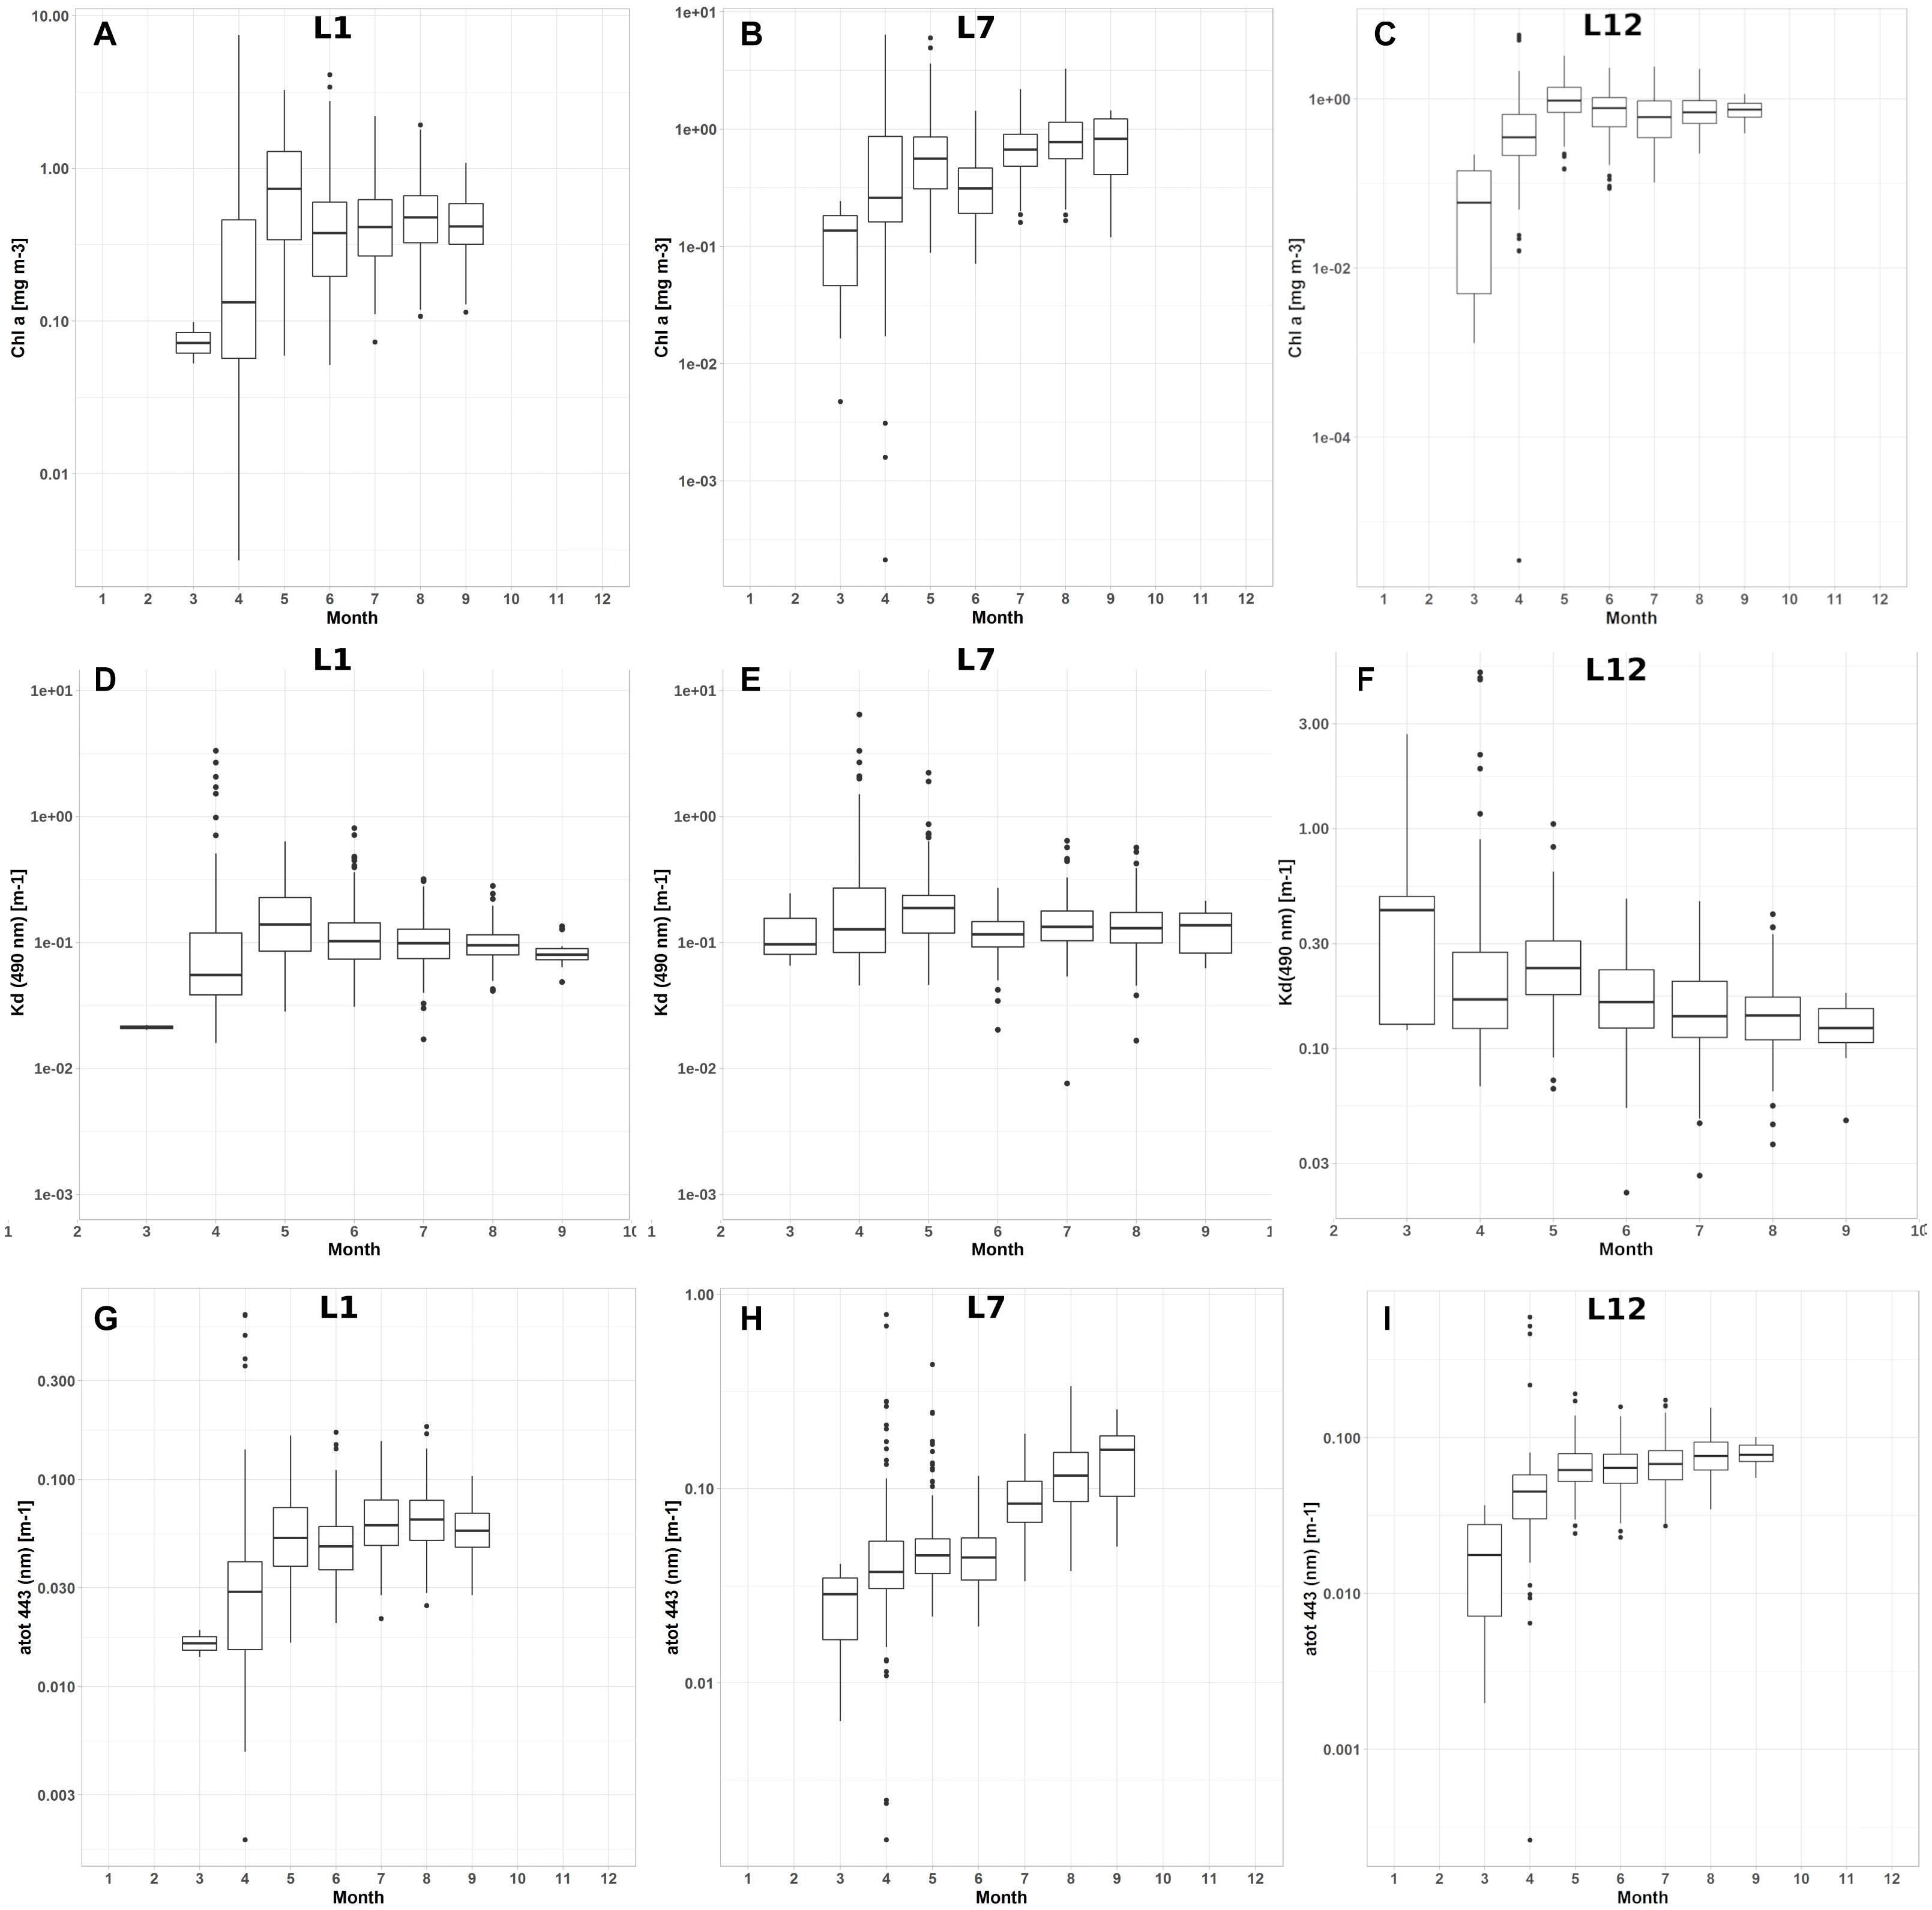
Figure 3. Distribution of the Chla (A–C), Kd(490) (D–F), and atot(443 nm) (G–I) in each month for the whole data series 1997 – 2019 at locations: L1 (on the shelf near the entrance to the Kongsfjorden) (A,D,G) – 1st column, L7 (in the central Isfjorden) (B,E,H) – 2nd column and L12 (in the outer Hornsund fjord) (C,F,I) – 3rd column.
Differences between median values of Kd(490) for a given month were around two orders of magnitude and were the smallest among analyzed parameters. In most cases, the strongest variability was observed in April except L10 in the Van Mijenfjord and L12 and L13 at the Hornsund (Figure 3 and Supplementary Figure 3). At the first location, Kd(490) values increased gradually until July and started sloping downward in August. The latter two locations in the Hornsund fjord are the most interesting due to the fact that the highest variability was observed there in March when there were also observed the highest median values of Kd(490) during analyzed months (March–September). The seasonal changes at other locations in the Isfjorden and the Kongsfjorden depend on whether they are outside or inside the fjords. At the West Spitsbergen Shelf locations (L1, L5, and L11) (Figure 3 and Supplementary Figure 2) or the ones open to enhanced water exchange with the shelf, like L9, the highest medians of Kd(490) were observed in May, whereas at L2, L3, and L10 they were noted in July – August. In the Isfjorden and the Hornsund fjord the July – August local maximum is less visible, but in the inner parts of these two fjords, the higher Kd(490) values were noted later in the year (L6 – L8 and L12 – L13) (Figure 3 and Supplementary Figure 3).
The atot(443) changes partly follow the patterns of Chla with the high variability of values in April, local maxima in May, and a rather unimodal variability with the maximum values in August at L10. However, the local maxima in May could be clearly identified mainly at the open water locations (L1, L5, L9, and L11) or with higher exchange of water with the Greenland Sea (L3). In the inner parts of the Isfjorden, the Kongsfjorden or the Hornsund fjord no maximum in May was observed (L6 – L8 and L12 – L13) (Figure 3 and Supplementary Figure 2). The atot(443) gradually increased there until September (L6, L7, and L12) or slightly sloped downward in September (L2, L8, and L13) (Figure 3 and Supplementary Figure 2).
Due to the presence of the two local maxima in most analyzed cases – the one around May and the other in July – August, we decided to divide trend analyses and conduct them for the two seasons, separately. The low number of data points in March and April and very high variability of values of considered parameters would significantly disturb the multiyear trend analysis. Therefore, we decided to limit long-term trend analysis only to the period from the beginning of May until the end of September. We estimated separately multiyear trends in spring that covered May – June and in the summer that covered the months of July – September.
Long-Term Trends
Results of trend analysis for all selected locations for all considered optical parameters, Chla, Kd(490), and atot(443) are presented in Table 1. We have only included the trend estimates that were statistically significant at p-values < 0.05. The trend analysis revealed a clear seasonal differentiation (Figure 4). It should be noted that for the majority of selected locations, the trends estimates for Chla and atot(443) were statistically insignificant. Negative trends for Chla, Kd(490), and atot(443) in spring were identified at the mouth of the Kongsfjorden (L3) and in the Van Mijen Fjord (L10) (Figures 1, 4). The negative Kd(490) trends were also calculated in the Isfjorden (L6 – L8), at the northernmost location on the shelf (L1) and near the mouth of the Hornsund fjord (L12). The only positive trend in spring was observed for atot(443) in the central Isfjorden at L8 (Table 1 and Figure 4). The opposite pattern was observed in summer. Clearly, the positive trends in the Isfjorden, the Bellsund area and Hornsund fjord were identified. In total, an increase was confirmed at 10 and 9 out of 12 selected locations in the case of Chla and atot(443), respectively (Figure 4). At the locations on the shelf (L1, L5, and L11), significant positive trends for Chla and atot(443) were identified, and a positive trend of Kd(490) was confirmed at L1. In the case of the Kd(490), we identified positive and statistically significant trends at 4 out of 12 locations. Positive summer trends had weaker statistical significance compared to those calculated for Chla and atot(443), and were found at the northern location L1 on the shelf, in the inner part of Isfjorden (L7), in the Bellsund (L9), and the outer part of the Hornsund fjord (L12) with p-values < 0.01 for all of them (Table 1). In the inner part of the Hornsund fjord (L13) and on the shelf (L5), no statistically significant trends for Kd(490) were identified. However, in the recent years at L13, we have observed evidently higher variability of Kd(490) values what might indicate beginning of some regime shifts on the long term. Examples of trends calculated for Chla and atot(443) are characterized by the highest value of determination coefficient, R2, that clearly present positive trend of linearly increasing parameter values within the inner part of the Hornsund (L13) and on the shelf adjacent to the entrance to the Isfjorden (L5) were presented on (Figure 5).
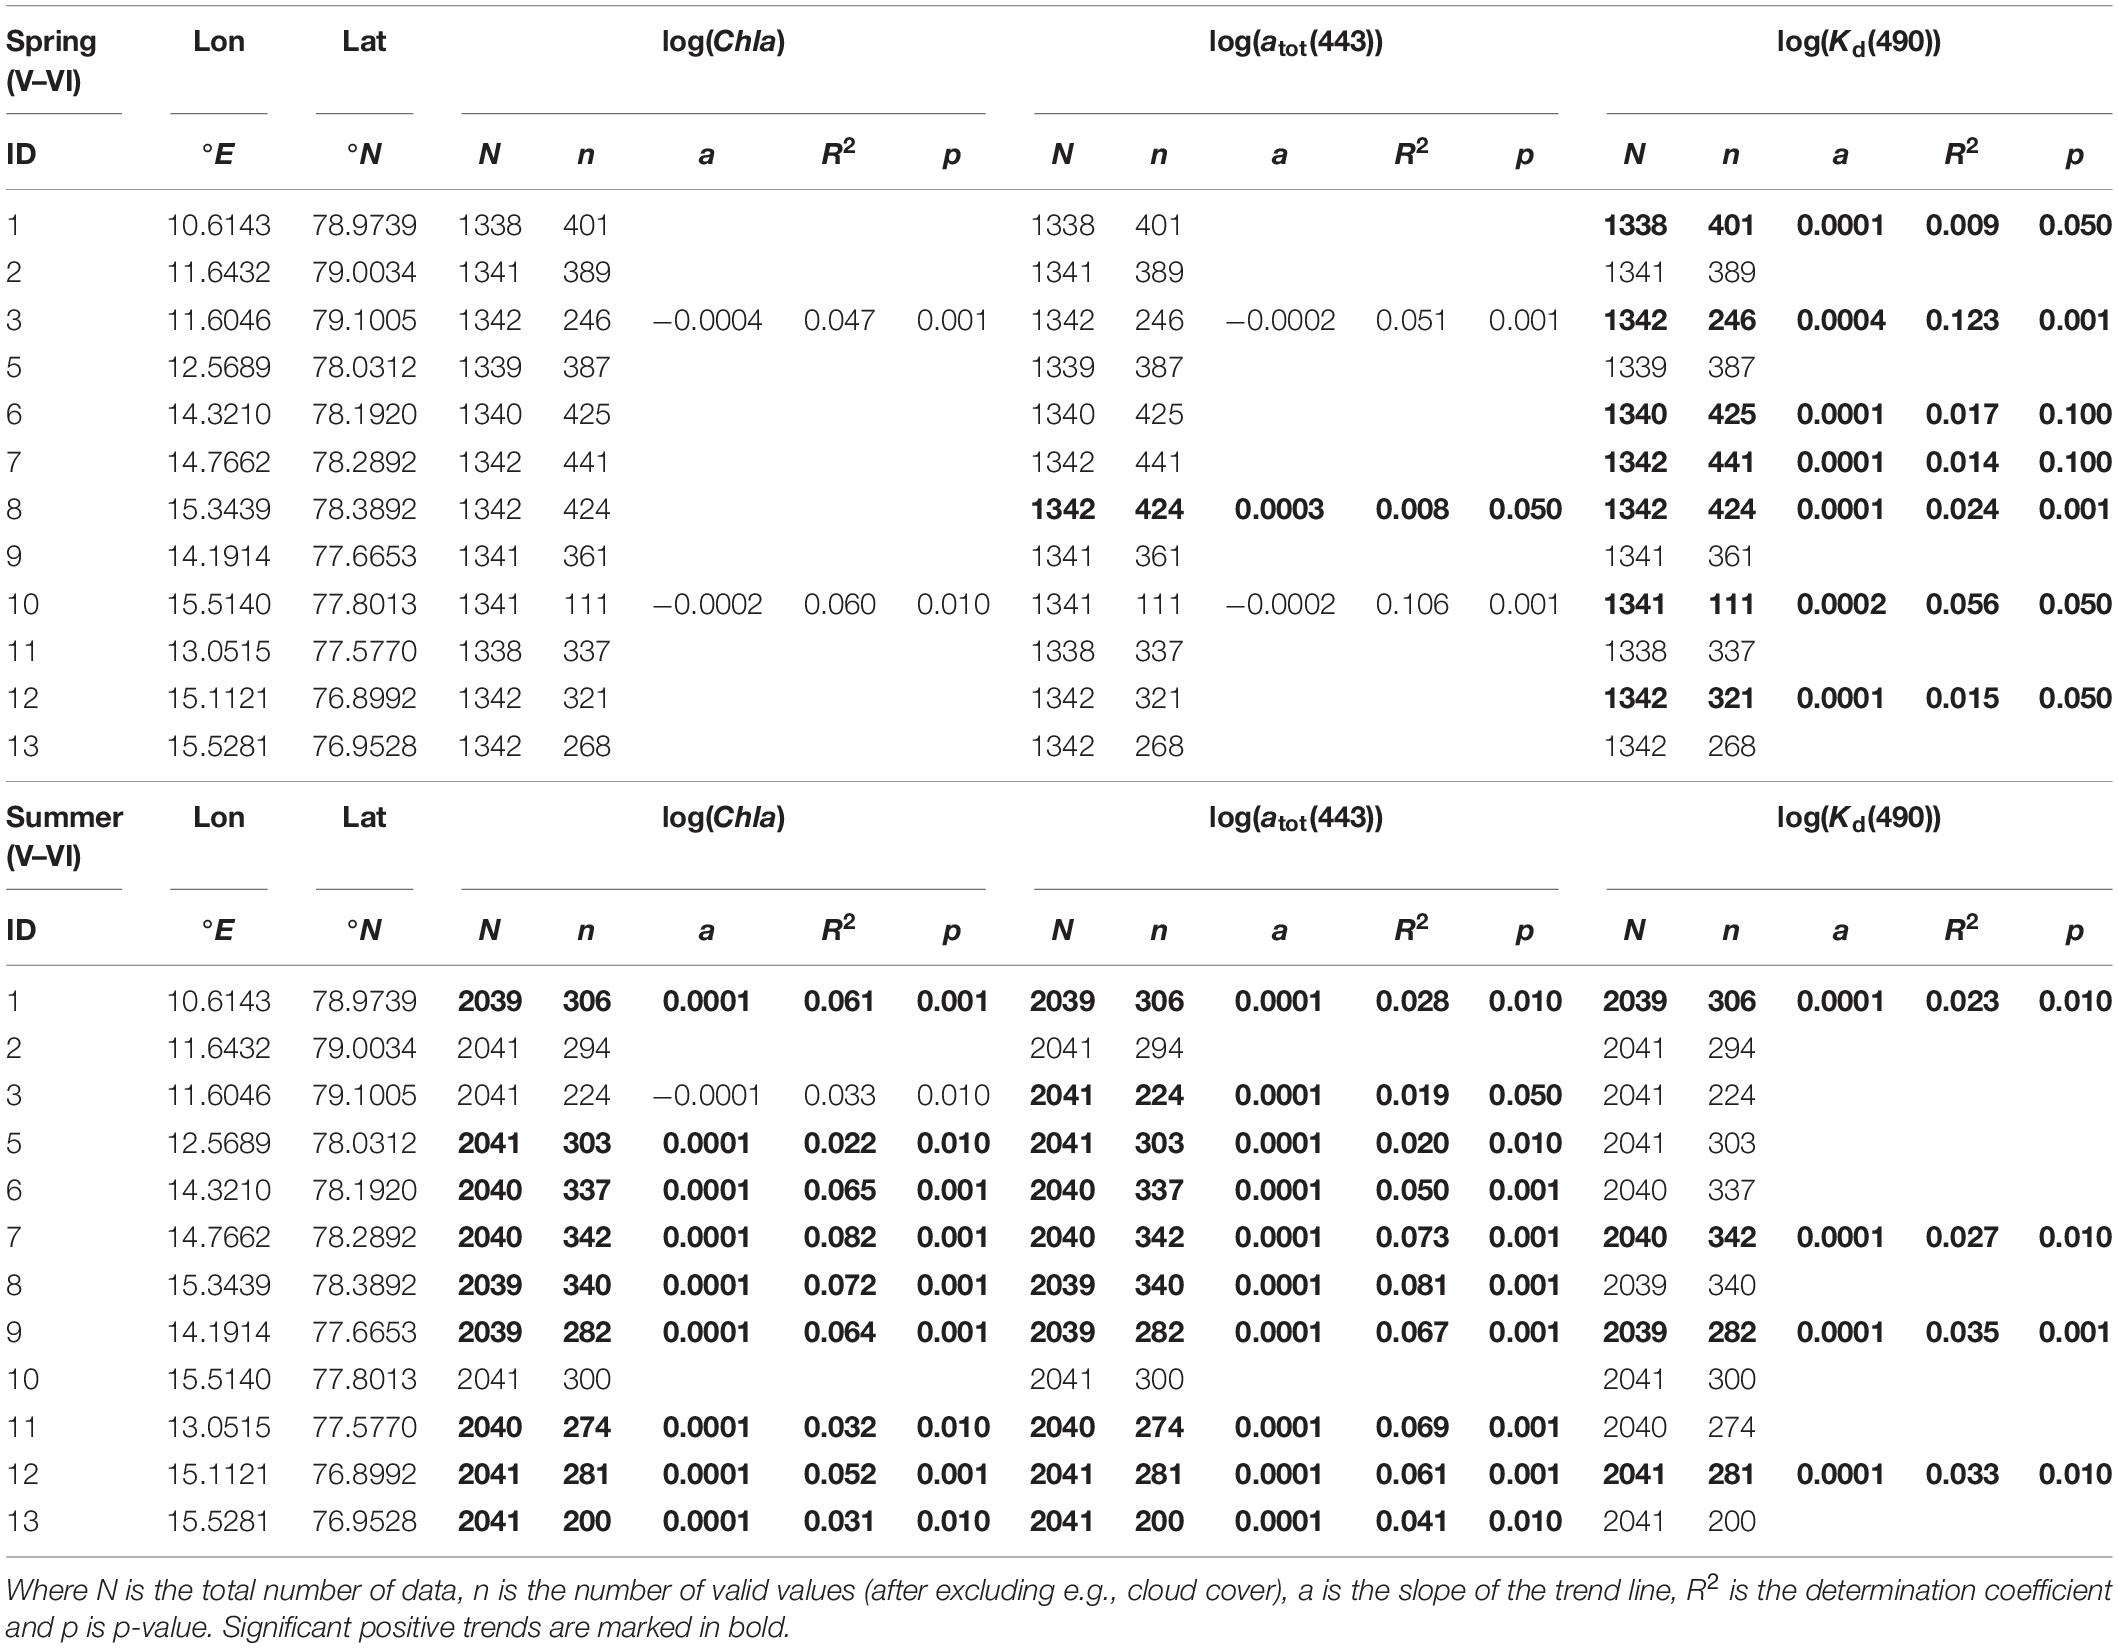
Table 1. Identified trends based on the changes of the Chla [mg m–3], Kd(490) [m–1], and atot(443) [m–1] during spring (V–VI) and summer months (VII – IX) in the years 1997 – 2019.
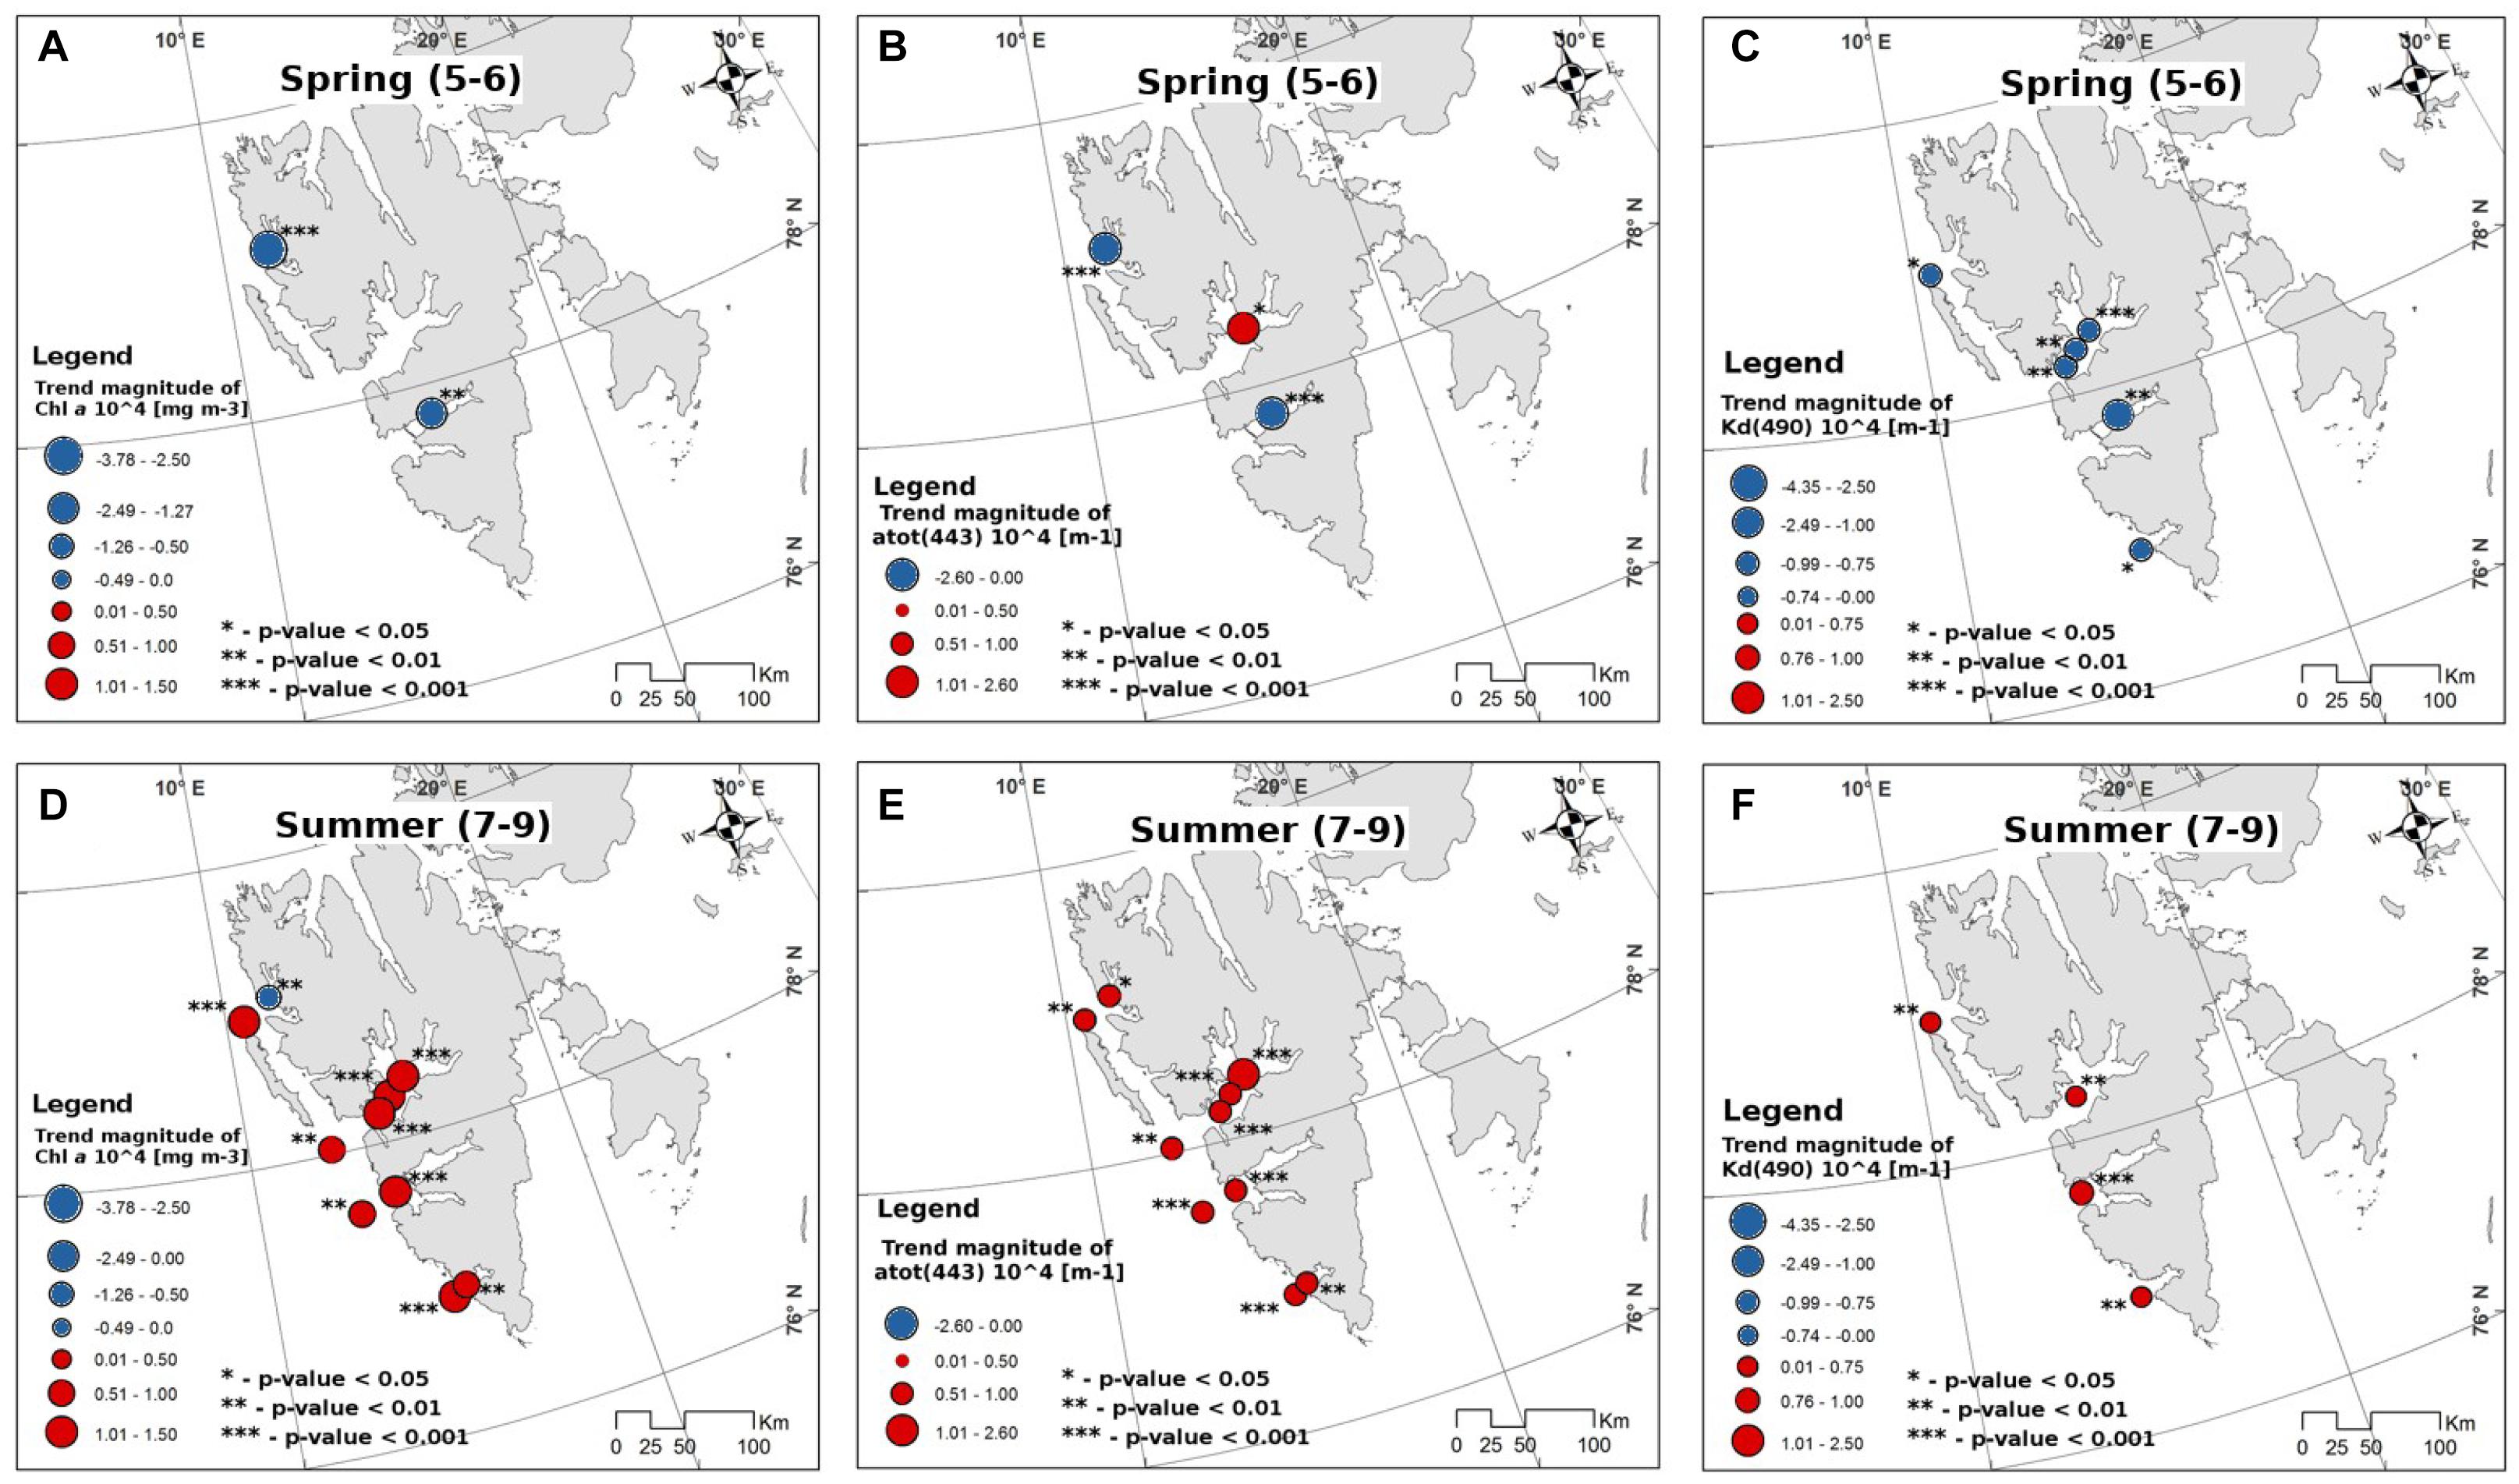
Figure 4. Trends estimates of Chla (A,D), atot(443 nm) (B,E), and Kd(490) (C,F) changes throughout the years 1997 – 2019 divided into spring (May – June) and summer (July – September) seasons. *p-value < 0.05; **p-value < 0.01; ***p-value < 0.001.
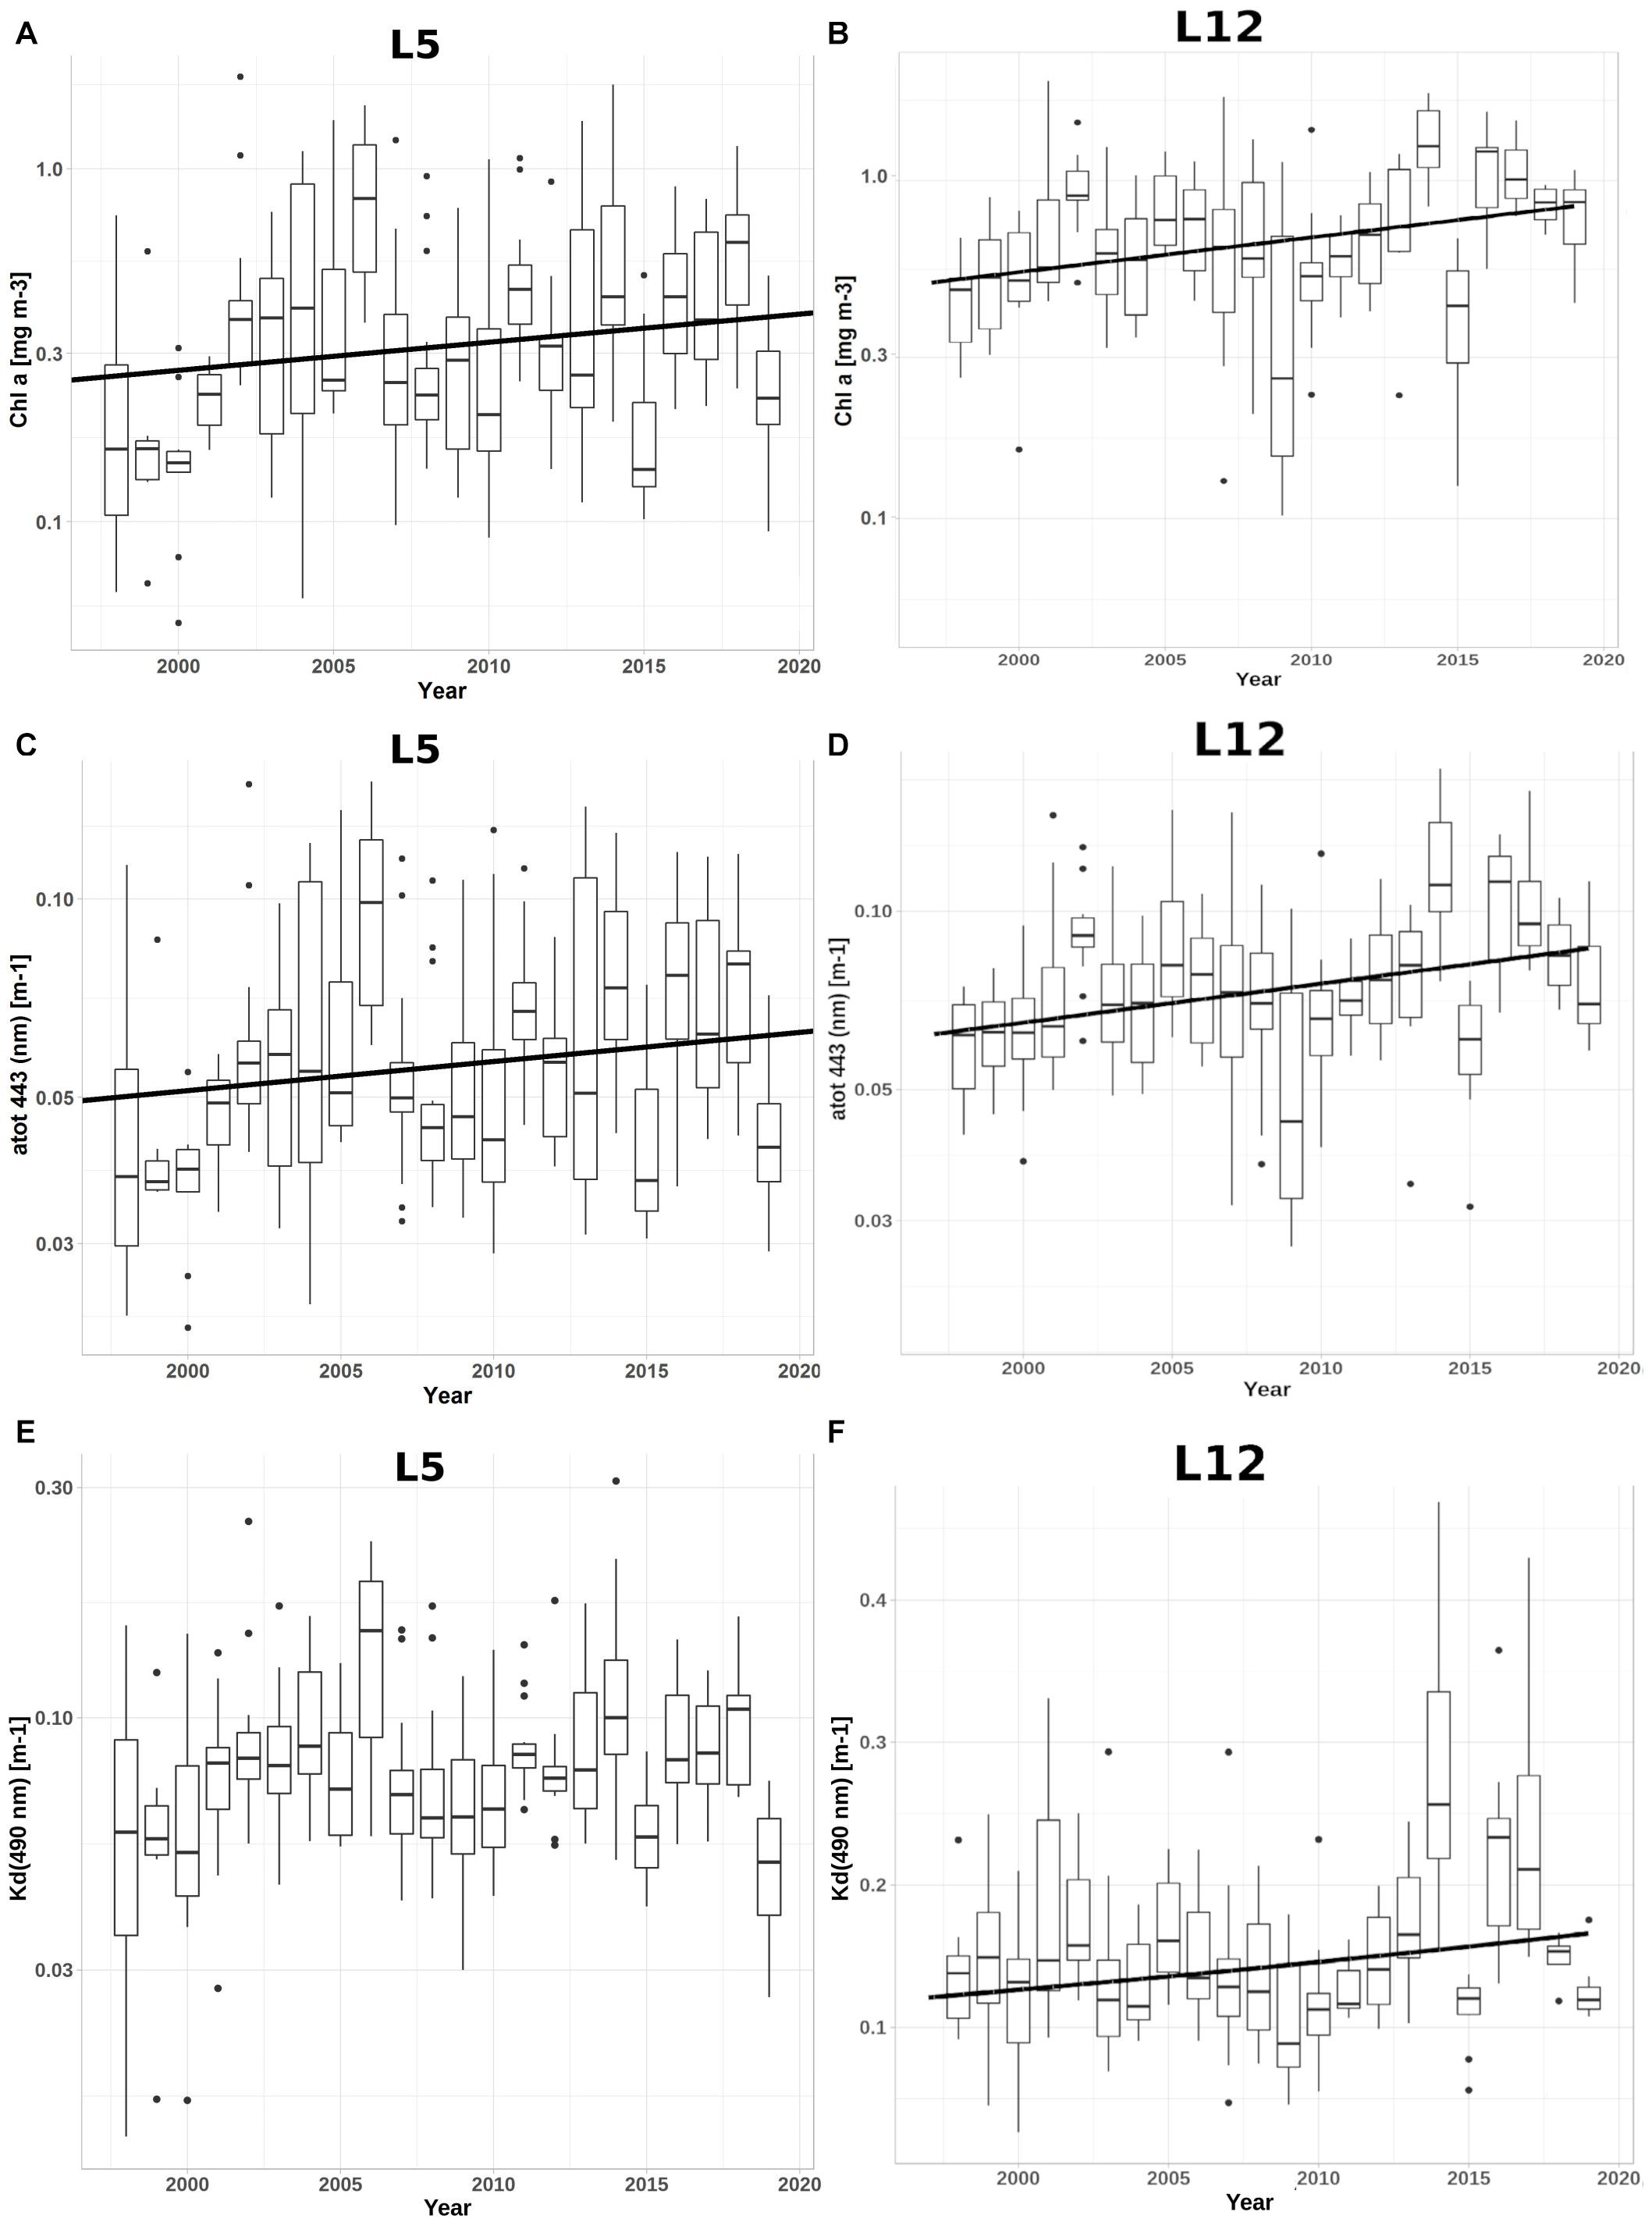
Figure 5. Boxplots of Chla (A,B) – 1st row, atot (443) (C,D) – 2nd row, and Kd(490) (E,F) – 3rd row values during summer season in years 1997 – 2019 with increasing trends (p-value < 0.01) marked with black lines at locations L5 (A,C,E) and L12 (B,D,F) (Figure 1).
To expand information gained with trend analysis, we computed temporal distribution of anomalies of selected optical parameters. The anomalies were calculated as the difference between the median value of each month and the median value of all available data in given spring or summer season in the period between 1997 and 2019. At all locations, the amplitudes of Kd(490) anomalies were the smallest, which is consistent with the smallest variability of Kd(490) in the time series dataset (Figure 3). Positive anomalies were stronger than negative. The exceptionally high values were noted in the Isfjorden in 2013 and the Hornsund fjord in 2014 (Figure 6 and Supplementary Figure 3). Since 2010, we have observed at most of the analyzed locations the predominance of positive anomalies with higher amplitudes at the majority of locations, especially in the Kongsfjorden (L2), in the outer part of Isfjorden (L6 and L7), and in the Hornsund fjord (L12 and L13). A similar pattern was identified at the West Spitsbergen Shelf locations like L1, L5, and L9, except L11, where strong year-to-year changes from positive to negative anomalies occurred (Figure 6).
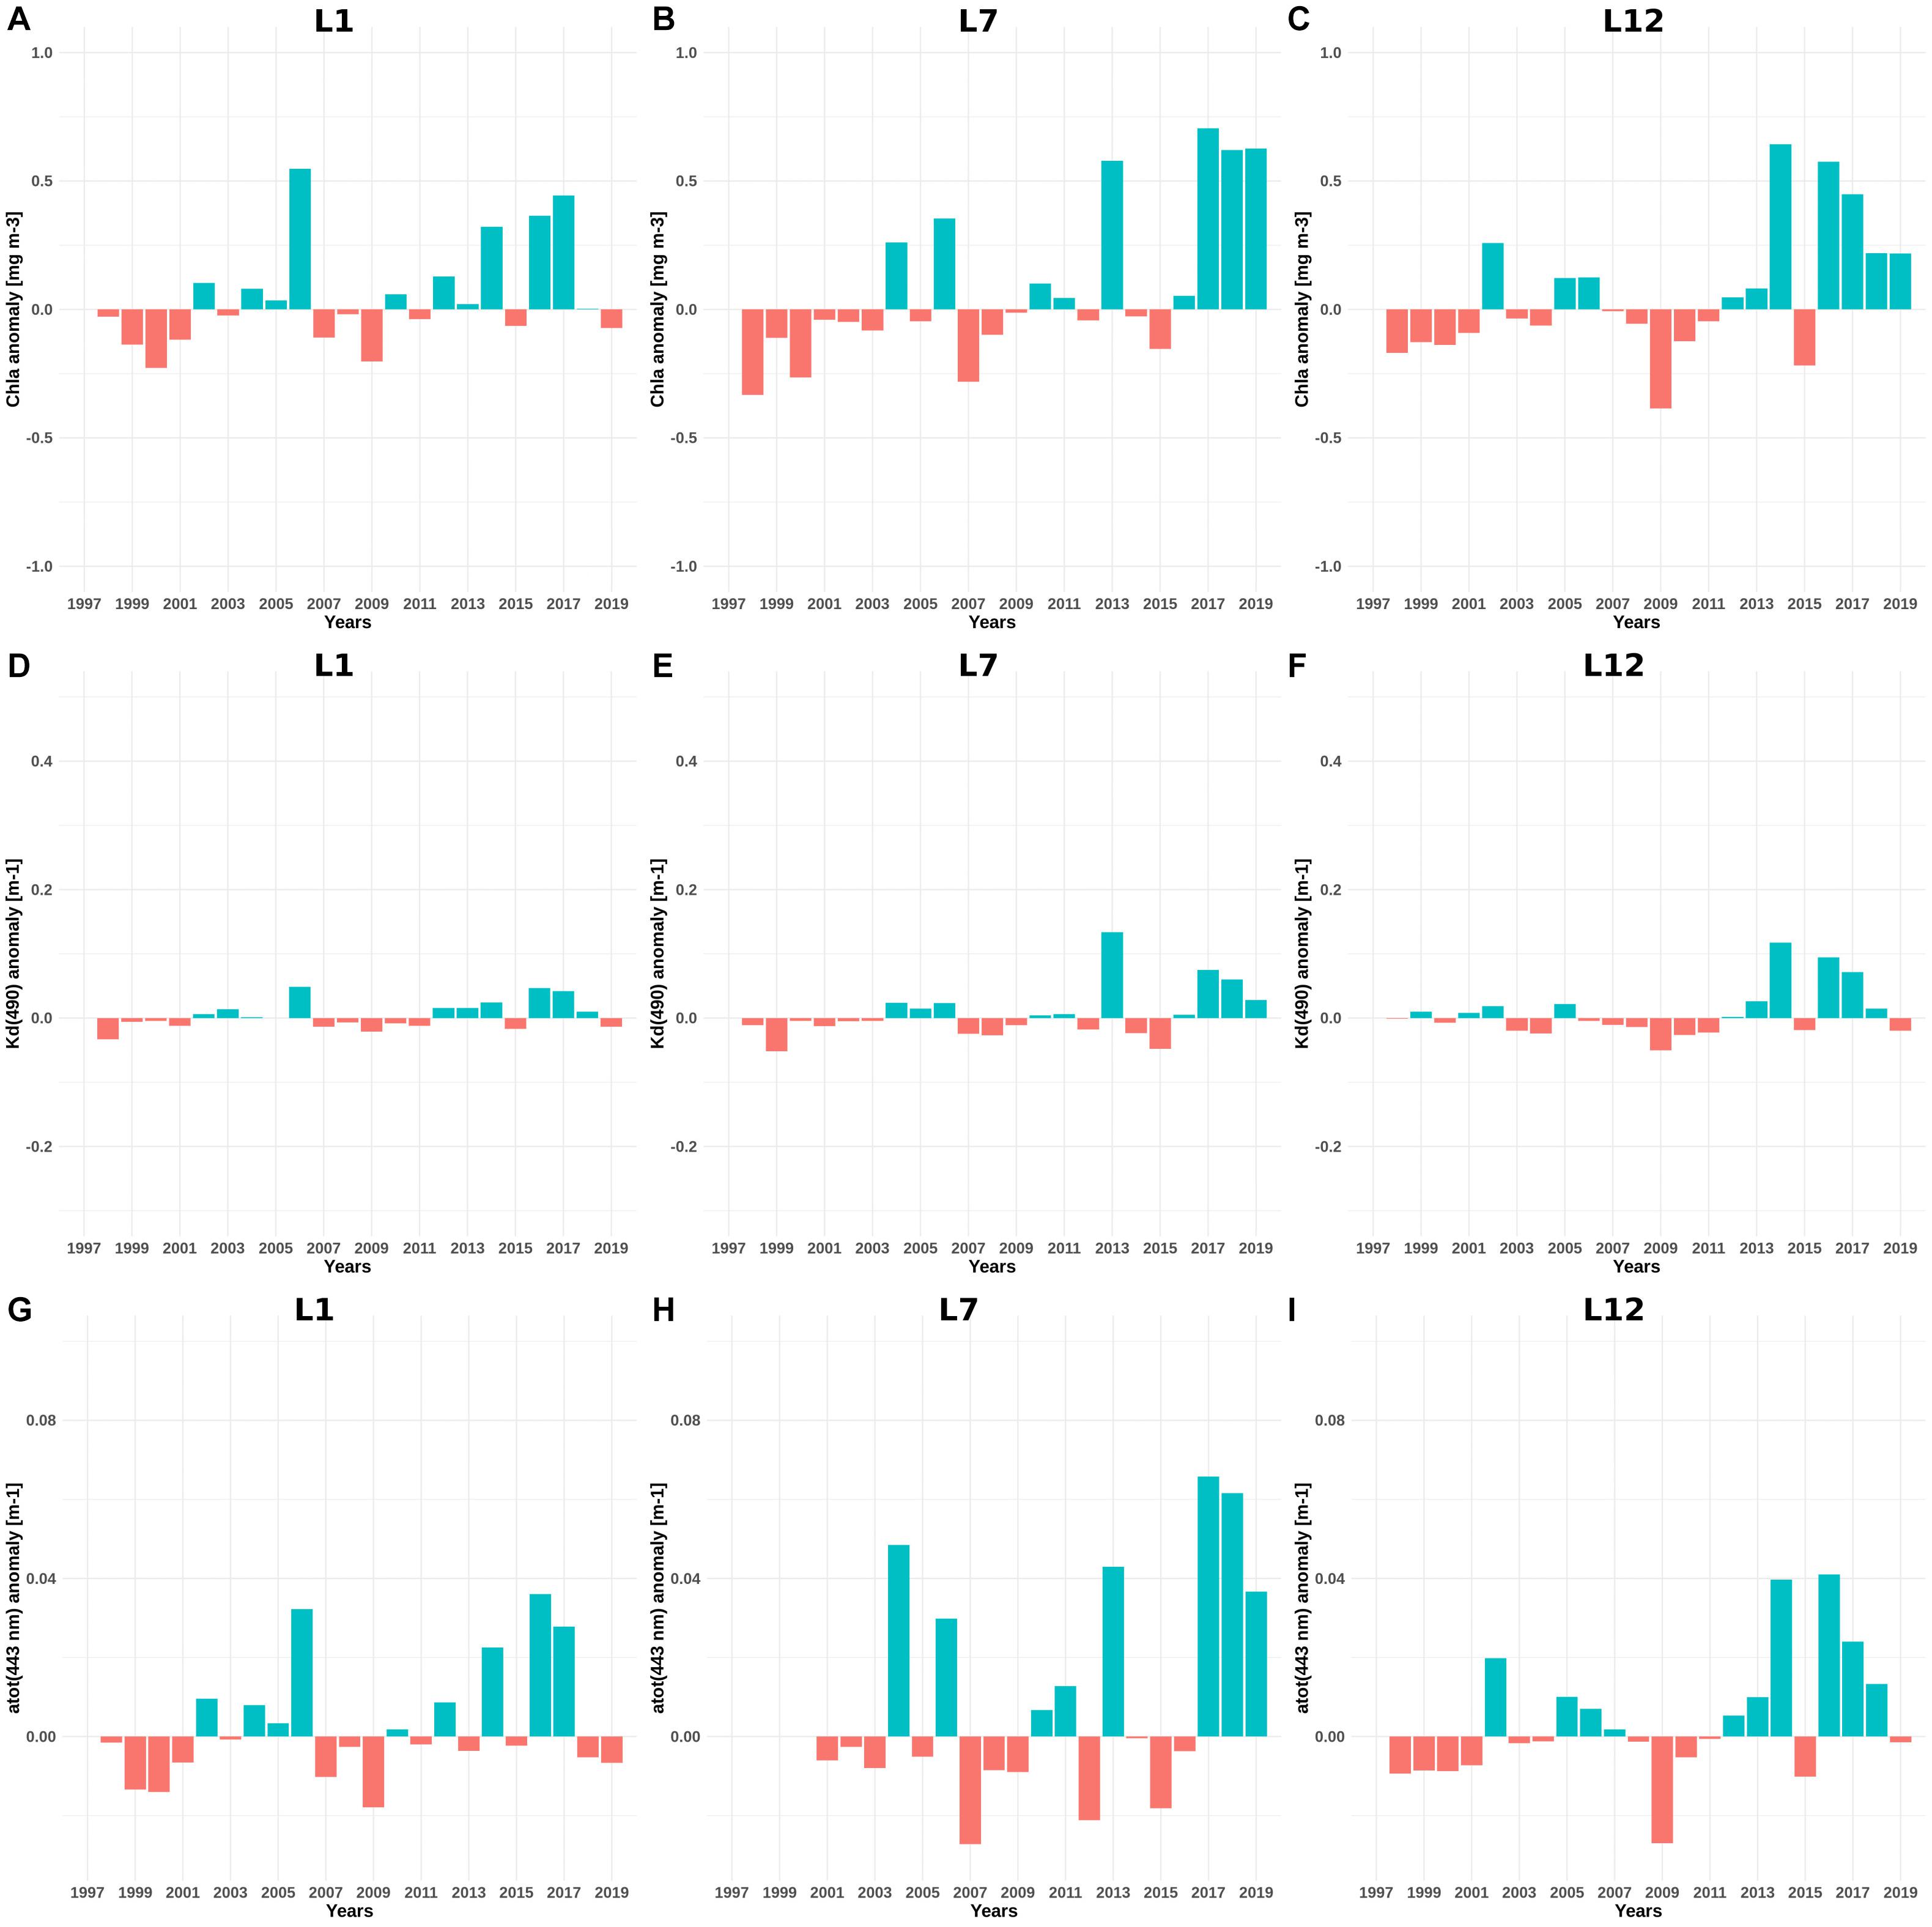
Figure 6. Anomalies of the summer median values of Chla (A–C – 1st row), Kd(490) (D–F – 2nd row), and atot(443) (G–I – 3rd row) each year in reference to the median value for all summer months 1997 – 2019 at locations: L1 (on the shelf at the similar latitude as the Kongsfjorden) (A,D,G – left column), L7 (the central Isfjorden) (B,E,H – middle column), and L12 (the entrance to the Hornsund fjord) (C,F,I – right column).
The trend analysis applied to the whole data series in years 1997 – 2019 gives us an overall view on the long-term changes in the Svalbard area. In order to get a more detailed view on the processes and changes throughout the analyzed time period, we plotted year-to-year anomalies and applied the changepoint detection PELT algorithm. Positive anomalies were predominant for both Chla and atot(443), especially in the Kongsfjorden (L2), the Isfjorden (L6 – L8), the Hornsund fjord (L12 and L13) and even in the Van Mijen fjord (L10). However, within the latter fjord, positive Chla anomalies were present along with negative atot(443) anomalies, all of higher amplitudes. This unusual situation could be explained by greater contributions of other constituents than phytoplankton pigments to the total absorption coefficient. On the shelf (L1, L5, and L11) also positive anomalies persisted after 2010, but at the northernmost shelf locations (L1 and L5), negative anomaly in 2019 was spotted (Figure 6 and Supplementary Figures 4,6).
The change-point method introduces some generalization to the anomalies view by determining some patterns and regimes observed throughout the time of the analyzes (Figure 7). Moreover, identified segments follow the anomalies groups and show broader patterns. In the central Isfjorden (L7) the first shift of the mean Chla values was in 1998, at the beginning of our data series, when the mean Chla increased from about 0.3 to 0.8 mg m–3. It was followed by a long stationary period. Since 2017, there was another abrupt change to mean values reaching 1.4 mg m–3, which is supported by 4 years characterized by clearly positive Chla anomalies (Figure 6). The negative Chla anomalies in the Bellsund (L9) contributed to the first segment of relatively low mean Chla levels around 0.4 mg m–3 until 2001 when an evident increase to the level of 1 mg m–3 was detected and has persisted since then. Larger variability was observed in the Hornsund fjord (L12) and at L1, the northernmost shelf location. At L1, the Chla values were about 0.3 mg m–3, similar to concentrations at L7. In 2002, the mean concentrations increased to about 0.6 mg m–3, but in 2006 Chla concentrations dropped to about 0.4 mg m–3. However, it remained higher than at the beginning of the time series. In 2012, another shift took place and the mean Chla values around 0.7 mg m–3 have persisted since then, despite some negative anomalies in 2015 and 2019 (Figures 6, 7). In the Hornsund fjord (L12), we observed a stepwise increase in Chla values from around 0.5 mg m–3 to over 1 mg m–3 reached in 2012 and persisting since then. However, a particular drop was revealed in the years 2008–2012, notably pronounced in the 2008 – 2009, which are also years of certain negative Chla anomalies (Figure 6).
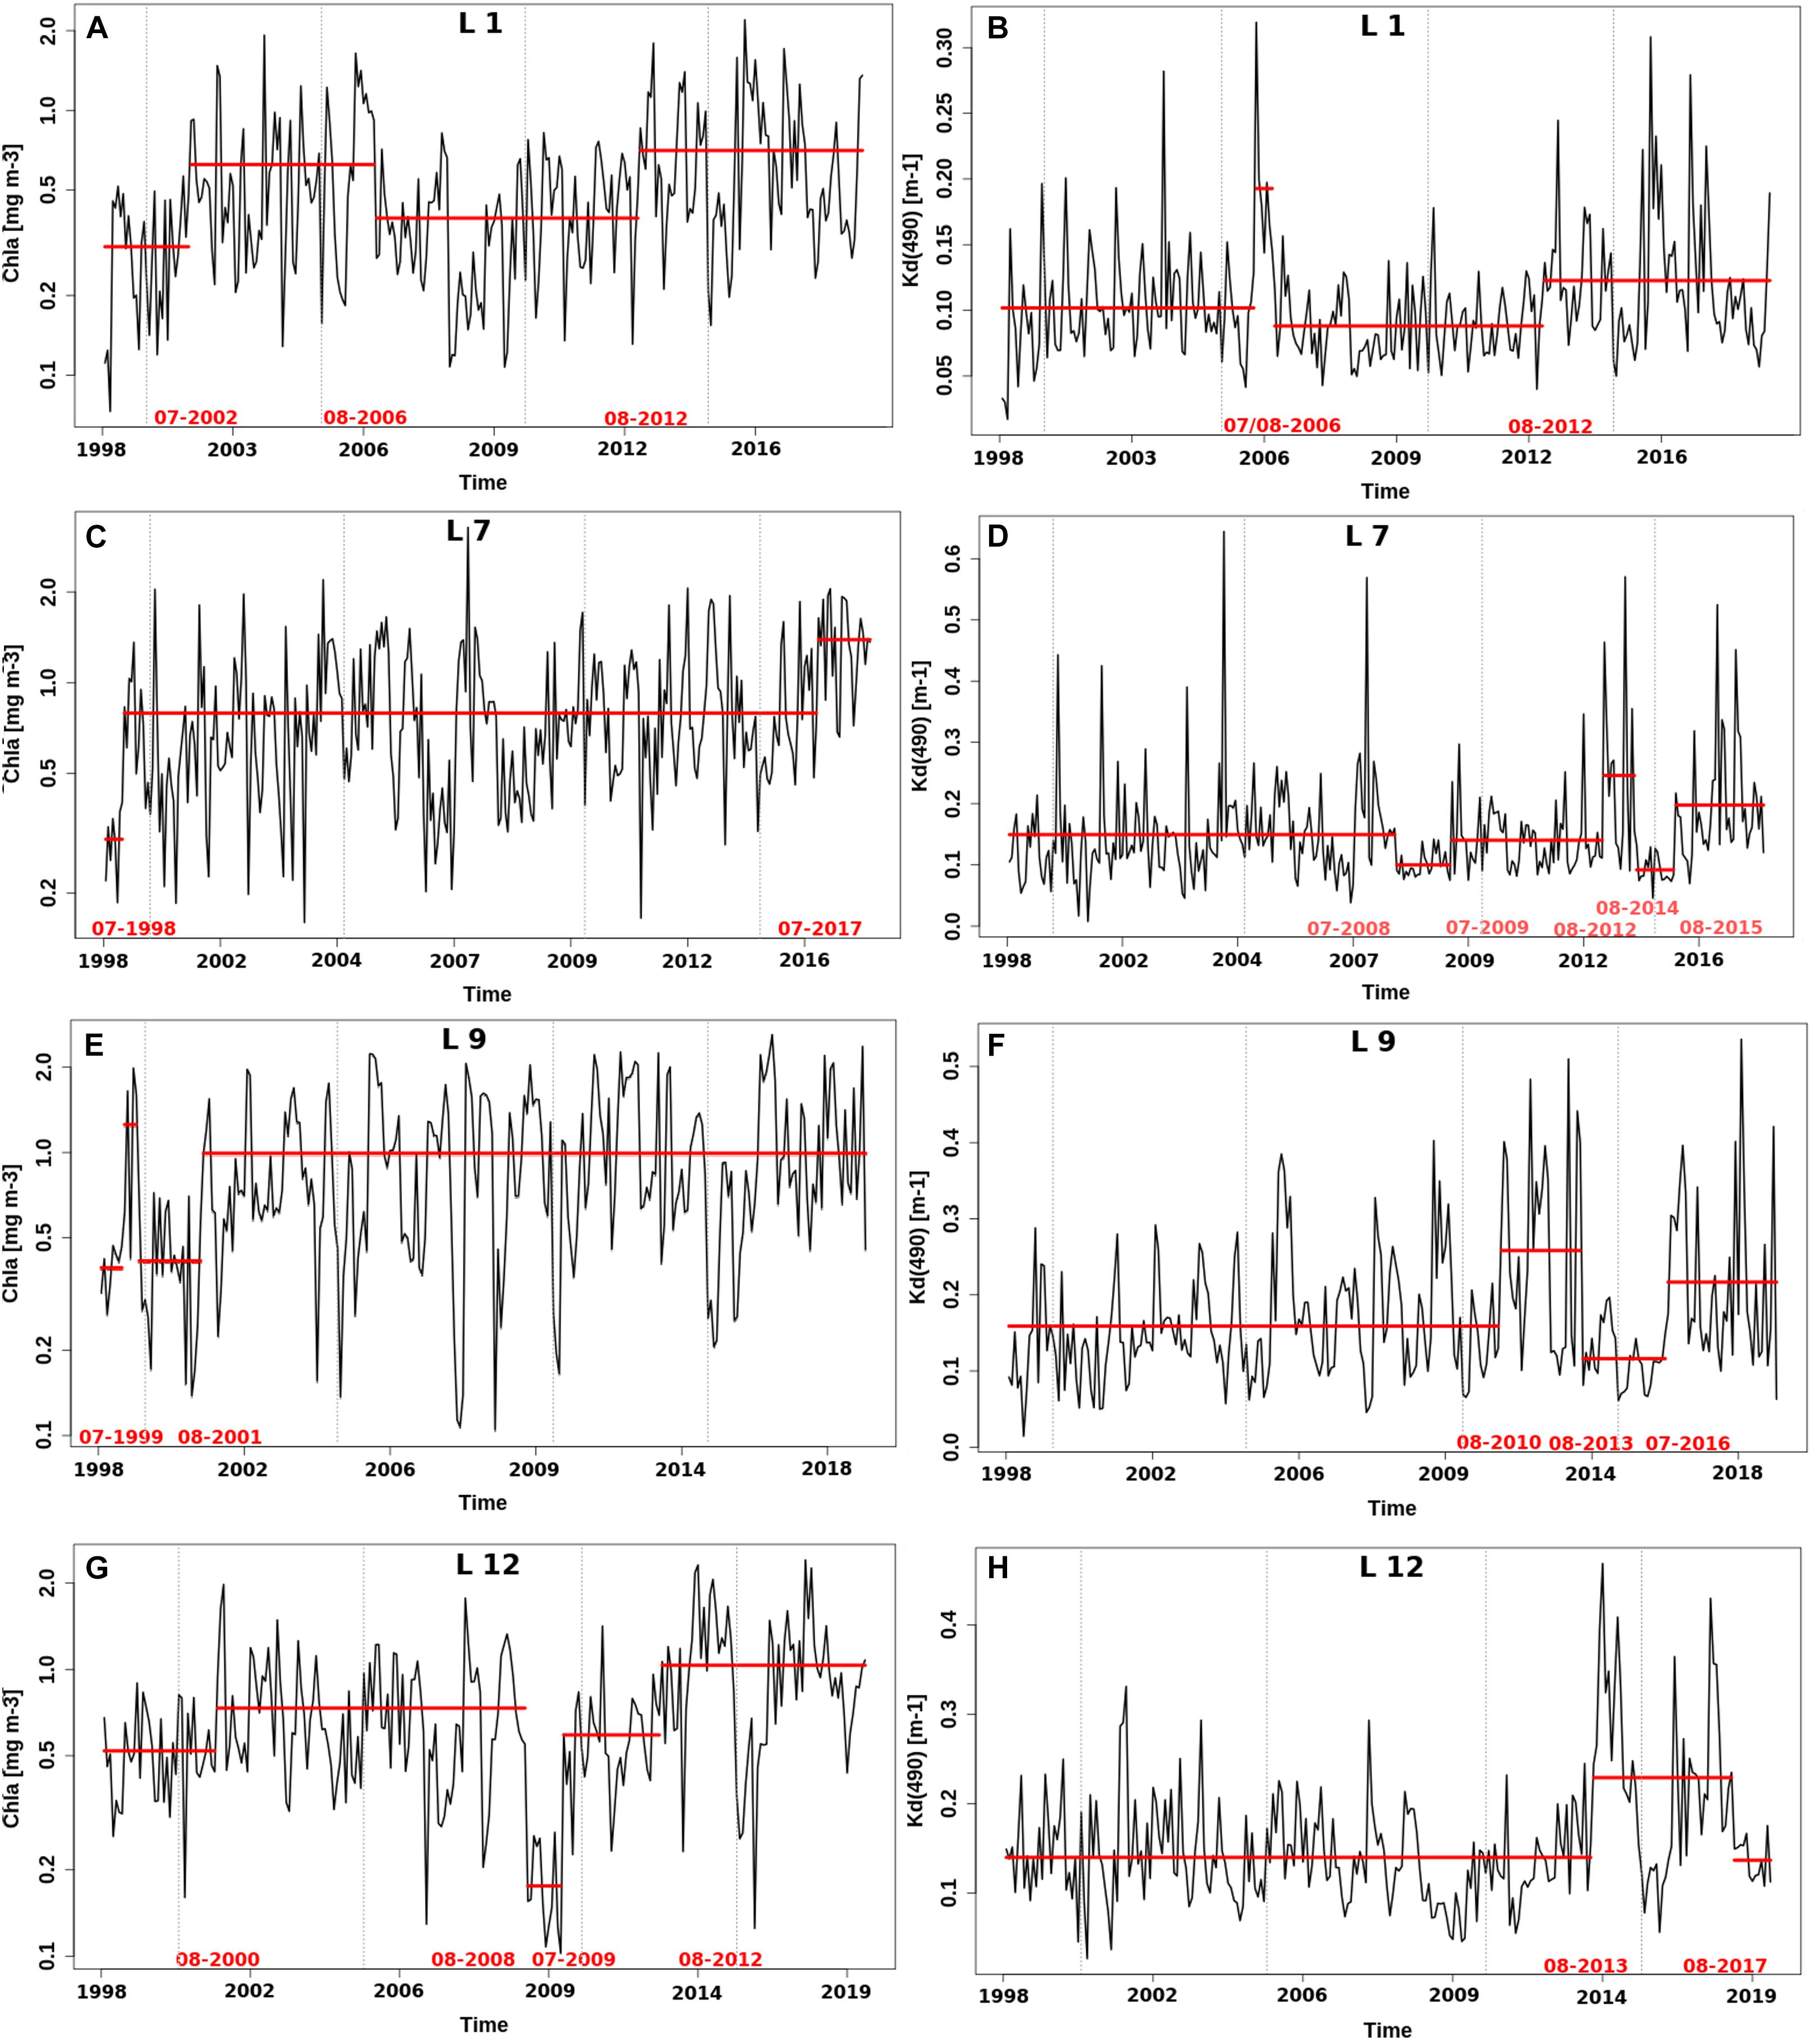
Figure 7. Data series of Chla (A,C,E,G) – left row and Kd(490) (B,D,F,H) – right row – stacked values from the summer months at the locations L1 (the shelf near the Kongsfjorden), L7 (the central Isfjorden), L9 (the Bellsund) and L12 (the entrance to the Hornsund fjord) with the segments of consistent water characteristics split at the shift points marked in red line. The turning points were determined based on the PELT changepoint detection method (Killick et al., 2012). Additional vertical gray lines mark the beginnings of the years 2000, 2005, 2010, and 2015.
The mean values of Kd(490) varied less in time than Chla and mostly in the second half of the analyzed period of time (2012–2019). The one exception was a peak observed in 2006 at L1, which was extreme. The Kd(490) doubled in comparison to the mean value in the years 1997–2012 (Figure 7B). Since 2012 the mean Kd(490) has been about 20% higher than at the beginning of the time series with the mean values around 1.2 m–1, but within that last period, numerous strong positive anomalies were observed (Supplementary Figure 6). In the Hornsund fjord, despite clearly negative anomaly in 2009, situation seemed to be balanced until 2013, followed by a number of positive anomalies which are reflected in the results of change-point analysis since 2013. The last 2 years 2018–2019, especially a decrease of Kd(490) values in 2019 was detected as a downward shift, but depending on the next years it might turn out to be only short-term like the one in 2015 (Figures 6, 7). In the Isfjorden (L7), the average Kd(490) was 0.15 m–1 with evident reduction of Kd(490) values in years 2008–2009 and 2014–2015, and a peak in 2013. Since 2015, the average Kd(490) has remained at the higher level of 0.2 m–1. An upward shift of Kd(490) average by 0.1 m–1 was first observed in the Bellsund (L9) in 2010. Since then, the average has remained above 0.2 m–1, except for the years 2014 and 2015.
Discussion
Monthly variability in most cases showed two local maxima of the analyzed water characteristics during each year. The first maximum was typically observed in May, and it was particularly pronounced at the shelf locations and in the outer parts of the fjords. The other peak, was observed in late July – early August. This peak was particularly distinct in the central parts of the fjords. The increase of Chla and atot(443) in the Svalbard fjords during analyzed years (1997 – 2019), in particular, is associated with the spring phytoplankton bloom that is additionally stimulated by the advection of the warm AW inflow. The only positive trend in the spring (May – June) months was identified in the Isfjorden, where there is the strongest influence of the AW due to favoring seabed topography (Cottier et al., 2010). In previous publications, regarding phytoplankton blooms timing in the open waters of Fram Strait, it was acknowledged that blooms started in this region in May, reached maxima in June, and lasted through July (Cherkasheva et al., 2014). Satellite observations in this paper revealed that phytoplankton blooms within the Svalbard fjords start, in general, a month earlier – in April and peak in May. Although we do not have in situ measurements collected in April – June, the timing of the identified blooms in May is consistent with the findings of other studies conducted in the Svalbard fjords, e.g., the Kongsfjorden (Calleja et al., 2017; Ericson et al., 2019; Hegseth et al., 2019). The late summer maximum is probably of a more complex nature that will be further discussed. Anyway, this clear division combined with the awareness of the seasonal differences in the water column structure was a basis for analyzing available time series in the two separate seasons – spring (May – June) and summer (July – September).
A shallow mixed layer is typically favorable for accumulation of particulate matter within it. Payne and Roesler (2019) reported a systematic increase of the backscattering coefficient bb(440) and absorption coefficient by colored detrital material (particulate and dissolved) adg(440) values from May to August in the Kongsfjorden, which was attributed to an increase in stratification. Higher quantities of optically active sea-water constituents become trapped in a confined mixed layer, i.e., within light penetration depth and satellite sensors detection range. It was estimated back in the 1970s that ocean color satellite sensors measure light that penetrates water column to the depth above which 90% of the diffusely reflected irradiance originates z90 (except specular reflectance) (Gordon and McCluney, 1975). According to Jerlov (1976) in coastal waters light penetration depth z90 usually does not exceed 10 m and in homogeneous water bodies such as the top mixed layer of oceanic waters, e.g., near the mouth of the fjord, the z90 may range up to around 20 m (Gordon and McCluney, 1975; Szeligowska et al., 2020). This means that within the fjords analyzed here, only changes of the IOPs in the maximum top 20 m would be visible in the satellite images. Therefore, the summer season is a time when the probability of obtaining the most complete picture of the primary productivity is the highest. Thus, in order to observe and identify any long-term changes we focused on the summertime when strong stratification ensures accumulation of the optically significant sea water constituents within the z90.
The most interesting result was the consistent increase of all analyzed parameters in July – August in the long-term at numerous locations (Figure 4). On the one hand, a high correlation between Kd(490), Chla, and atot(443) implies that the phytoplankton (with Chla as a proxy) controls the IOPs variability to a large extent in the area of study. Our observations seem to coincide with the positive trends in long-term AW inflow and glacier-melt runoff during the analyzed period (1997 – 2019) which are the two possible reasons, potentially explaining the positive trends in IOPs. The increase of the AW impact on the water masses within the Svalbard fjords, phytoplankton bloom dynamics, and acceleration of the melting processes were reported in some of the recent publications (Pavlov et al., 2013; Promińska et al., 2017; Hegseth et al., 2019; Bloshkina et al., 2021). The presence of the warmer AW may cause faster ice-melting from the bottom and higher heat content at the starting point which means that the temperature optima of the planktonic organisms may be reached or exceeded earlier in the year. It may result in earlier blooms onset or phenology shifts, or both. On the other hand, nutrients are the limiting factor for primary productivity, and nutrient levels remain low during summer, starting from June (Calleja et al., 2017; Ericson et al., 2019). However, particular attention should be given to glacier meltwaters considered an important local nutrient source (Stachnik et al., 2019). Microbial activity at the glacier surfaces and within the cryoconite holes where even nitrogen-fixing cyanobacteria are found, can provide a substantial source of nutrients into fjords (Telling et al., 2011; Anesio et al., 2017). Despite the fact that composition of the glacier and fjord bacterial communities are entirely distinct, a significant relationship between nutrients (NO3– and SiO42–) and glacier melt-water bacterial communities within the fjords was already confirmed (Thomas et al., 2020). This suggests that acceleration of the glacier retreat may bring excess loads of nutrients and photosynthetic microbes that stimulate primary productivity, and may be responsible for the higher values of Chla and atot(443) observed here in July – August. Previous research also revealed that, in the Hornsund fjord, the contribution of the total precipitation over land (excluding winter snowfall), total precipitation over the fjord area, and melting of the snow cover over unglaciated areas are roughly less than 36% of the total freshwater input. In contrast, glacier melt-water runoff and frontal ablation of tidewater glaciers are predominant in the area (Błaszczyk et al., 2013). A coupled energy balance–subsurface model also confirmed this tendency for the whole of Svalbard and predicted a further increase of the glacier-melt runoff in the coming years (van Pelt et al., 2019). This means that the nutrient pool may rise for some time in the Svalbard area, it supports our observations of positive Chla and atot(443) trends and forecasts further possible increases at least as long as the glaciers are still present.
In spring, we mainly observed negative trends in the Svalbard area during 1997 – 2019 (Figure 3). However, Chla and atot(443) seemed to decrease only in the Van Mijen Fjord (L10) and around the mouth of the Kongsfjorden (L3). The negative trends of Kd(490) are visible also within the fjords or the entrance of the fjords. Due to higher year-to-year variability and more possible sources of satellite data contamination, conclusions should be drawn more carefully for this season. Firstly, we should consider the role of adjacency effects. Their impact may be twofold, and in both cases, they are closely related to the albedo. Typically, at locations where albedo is high, particularly due to the presence of snow or ice, photons are scattered into the atmosphere and contaminate registered radiance. It often results in overestimating water-leaving radiance in the neighboring areas (Bélanger et al., 2005). Analogical effects are observed near the clouds, because of their high albedo. It was proved that during the melting season cloud cover above the Arctic intensifies (He et al., 2019). Even though the snow and ice cover have decreased in the Kongsfjorden, a significant increase in humidity and the cloud cover in that area were confirmed with the highest variability in May – July (Maturilli et al., 2019). The impact of land topography may also play a role here. The narrow, elongated shape and steep walls of the fjords enhance scattering and multiply the adjacency effects (Rozwadowska and Górecka, 2017). The other aspect is the high year-to-year variability that in spring may stem from the fact that dynamics of the three factors controlling the environment in this area which are the AW inflow, the snow and ice cover, and glacier melt-water discharge, has been changing recently (Hegseth et al., 2019). In the Kongsfjorden, ice cover has been declining in the last 10 years (Pavlova et al., 2019). The estimated first snow-free day at Svalbard as a whole is around 29th of June, so both the sea ice and land snowmelt may intensify around April – June (Vickers et al., 2020). Except for winter, spring was the season when the fastest increase of air temperatures was identified based on the observations at Ny-Ålesund BSRN site at a rate of 1K ± 1.4K per decade (Maturilli et al., 2019). Processes in the water column cannot be analyzed separately from the atmospheric conditions and land influence. The air temperatures govern the pace of the ice and snowmelt in the whole area, and therefore govern the amount of the meltwater runoff from the land into the fjords. In spring, fresh meltwater forms a thin near-surface layer due to the low salinity. This is a relatively transparent layer (0–10 m) which is optically clear in comparison to the underlying water masses (Granskog et al., 2015), because meltwater effectively dilutes the CDOM (Kowalczuk et al., 2017, 2019). Although the meltwater could contain higher loads of the suspended particulate material (Bélanger et al., 2013), this does not contribute significantly to the decreased transparency, especially at the beginning of the melting time. Approximately half of the ice-free area in Svalbard falls beyond the vegetation season (Vickers et al., 2016). The ice and snow water themselves contains a depleted level of nutrients (Ardyna et al., 2011) which does not allow for intense phytoplankton growth. When it predominates the water column above the first optical depth, it leads to underestimating values of remotely sensed Chla, atot(443) or Kd(490), because subsurface chlorophyll a maxima usually form below ocean color sensor detection depth (Ardyna et al., 2013; Kowalczuk et al., 2019). This may be the main reason why we observe negative trends in spring. Smaller amounts of the sea ice combined with intense melting of it may result in earlier and more pronounced near-surface diluted layer observed from the satellites.
With the start of the vegetative season the water composition may change. Land vegetation is a potential source of CDOM, suspended particulate material or nutrients, especially in summer months when flora thrives. The previous analyses revealed an increasing trend of the vegetation growth in Svalbard during the last decades (Vickers et al., 2016). It is particularly worth noting that the previous studies conducted by Vickers et al. (2020) on the timing of the snow disappearance is consistent with the inter-annual anomalies of all three analyzed water properties. In the years when the first snow-free days were observed earlier, in most cases negative anomalies in spring and positive anomalies in summer were observed, whereas later snow cover retreat resulted in the opposite patterns. This may imply that earlier start of the melting period may cause intensified ice and snow melt resulting in formation of a deeper or more diluted top layer in spring which may be followed by enhanced vegetation growth and glacier melt that provide extra nutrients inputs. It is reflected in negative anomalies in spring, followed by positive anomalies in summer. The long-term increasing trends of the glacier melt and vegetation growth in summer by the other researchers support this explanation, as well as justify the increasing summer trends observed here in the long term (Vickers et al., 2016; van Pelt et al., 2019).
Apart from air temperatures the AW water is also a huge heat store that gives up its heat and stimulates the melting processes of the sea ice as well as near-shore snow and ice cover. An evident manifestation of the AW impact was the extreme inflow to the Kongsfjorden (L2 and L1 on the shelf in the fjord vicinity) in 2006 (Głuchowska et al., 2016). Positive summer anomalies of all analyzed water characteristics were observed in that year at the locations L2 and L1, with a particularly strong anomaly of Kd(490) on the shelf at L1 (Supplementary Figure 6) which was detected using change-point analysis as an exceptional year (Figure 7). In the inner Hornsund fjord the AW was recognized for the first time in summer of 2014 and has been observed there with varied frequency and intensity since then (Promińska et al., 2017). The year 2014 was suggested to be a breakthrough year for the Hornsund fjord (Głuchowska et al., 2016) and it was identified as such here based on the change-point analysis of Kd(490) where we may see a regime shift between 2013 and 2014 (Figure 7). The other years with some AW intrusions that turned both the Hornsund fjord and the Kongsfjorden into the ‘warmer’ mode were 2002, 2006, and 2013 when we observed positive anomalies (Supplementary Figures 4–6) (Promińska et al., 2017). On the other hand, strong influence of the SC current on the Hornsund environment (L12) was reflected in our research. In the years when the SC inflow into the Hornsund was indicated by Promińska et al. (2017) such as 2001, 2004, 2008, and 2011 we observed negative summer anomalies of Chla, atot(443) and Kd(490) values (Supplementary Figures 4–6). A general message of the comparison of anomalies and time patterns at various locations around Svalbard is the clear upward shift of the Chla starting from the open-water locations at the beginning of 2000s, and an even more pronounced increase of all three parameters Chla, atot(443) and Kd(490) around 2012 – 2013 that manifested in strong positive anomalies in summer months and significant changes of the regimes that probably contributed the most to the increasing trends identified on the long term (Figures 6, 7 and Supplementary Figures 4–6).
Conclusion
Based on the analysis of the time series of satellite images in years 1997 – 2019, evident positive trends were revealed in the Kongsfjorden, the Isfjorden, the Hornsund fjord and the Bellsund. Even though there were differences between the trend estimates and their significance, we confirmed positive summer trends (July – September) of atot(443), Chla and Kd(490) at 10, 9, and 4 locations out of 12 consequently. We hypothesize that these changes can be attributed to changes and interplay in other environmental factors, such as hydrography, glacier and river runoff, precipitations, and atmospheric warming. It also should be noted that the enhanced amplitudes of anomalies observed in recent years are in line with observations and models showing that growing variability in the system can precede its regime shift (Spanbauer et al., 2014; Bury et al., 2021). Moreover, between 1997 and 2019 at the majority of locations we observed a regime shift toward darker waters. Our work provides the first documented record of ‘darkening’ in Svalbard fjords and adjacent shelf waters, and call for further investigation of these potentially profound environmental and ecosystem changes in the area. This work sets the baseline for consideration of the coastal darkening in the environmental management plans on Svalbard. It should be also considered in ecological modeling aiming at prediction of environmental changes related to global warming.
Data Availability Statement
The original contributions presented in the study are included in the article/Supplementary Material, further inquiries can be directed to the corresponding author.
Author Contributions
MK, PK, AP, MD, and SS: conceptualization, formal analysis, and writing–review and editing. MK and MD: methodology and data curation. MK: software and visualization. MK, PK, AP, and MD: investigation. PK, MD, and SS: resources. MK, PK, and MD: writing–original draft preparation. PK: project administration. PK, AP, MD, and SS: funding acquisition. All authors contributed to the article and approved the submitted version.
Funding
This study was supported by the Svalbard Environmental Protection Fund (Svalbards miljøvernfond), project nr. 19/21 - Monitoring Darkening of Svalbard Fjords from space.
Conflict of Interest
The authors declare that the research was conducted in the absence of any commercial or financial relationships that could be construed as a potential conflict of interest.
Publisher’s Note
All claims expressed in this article are solely those of the authors and do not necessarily represent those of their affiliated organizations, or those of the publisher, the editors and the reviewers. Any product that may be evaluated in this article, or claim that may be made by its manufacturer, is not guaranteed or endorsed by the publisher.
Acknowledgments
We thank the crews of R/V Lance and R/V Oceania and colleagues for the help on board during collecting the sea-truth data.
Supplementary Material
The Supplementary Material for this article can be found online at: https://www.frontiersin.org/articles/10.3389/fmars.2021.699318/full#supplementary-material
Footnotes
References
Aksnes, D. L., Dupont, N., Staby, A., Fiksen, Ø, Kaartvedt, S., and Aure, J. (2009). Coastal water darkening and implications for mesopelagic regime shifts in Norwegian fjords. Mar. Ecol. Prog. Ser. 387, 39–49. doi: 10.3354/meps08120
Anesio, A. M., Lutz, S., Chrismas, N. A. M., and Benning, L. G. (2017). The microbiome of glaciers and ice sheets. Bio. Microb. 3:10. doi: 10.1038/s41522-017-0019-0
Ardyna, M., and Arrigo, K. R. (2020). Phytoplankton dynamics in a changing Arctic Ocean. Nat. Clim. Change 10, 892–903. doi: 10.1038/s41558-020-0905-y
Ardyna, M., Babin, M., Gosselin, M., Devred, E., Bélanger, S., Matsuoka, A., et al. (2013). Parameterization of vertical chlorophyll a in the Arctic Ocean: impact of the subsurface chlorophyll maximum on regional, seasonal, and annual primary production estimates. Biogeosciences 10, 4383–4404. doi: 10.5194/bg-10-4383-2013
Ardyna, M., Gosselin, M., Michel, C., Poulin, M., and Tremblay, J. E. (2011). Environmental forcing of phytoplankton community structure and function in the Canadian High Arctic: Contrasting oligotrophic and eutrophic regions. Mar. Ecol. Prog. Ser. 442, 37–57. doi: 10.3354/meps09378
Arrigo, K. R. (2017). “Sea ice as a habitat for primary producers,” in Sea Ice, ed. D. N. Thomas (Chichester: John Wiley & Sons, Ltd).
Bartsch, I., Paar, M., Fredriksen, S., Schwanitz, M., Daniel, C., Hop, H., et al. (2016). Changes in kelp forest biomass and depth distribution in kongsfjorden, svalbard, between 1996–1998 and 2012–2014 reflect Arctic warming. Polar Biol. 39, 2021–2036. doi: 10.1007/s00300-015-1870-1
Bélanger, S., Cizmeli, S. A., Ehn, J., Matsuoka, A., Doxaran, D., Hooker, S., et al. (2013). Light absorption and partitioning in Arctic Ocean surface waters: impact of multiyear ice melting. Biogeosciences 10, 6433–6452. doi: 10.5194/bg-10-6433-2013
Bélanger, S., Ehn, J., and Babin, M. (2005). “Impact of sea ice on ocean color remote sensing,” in Proceeding of the SPIE 5885, Remote Sensing of the Coastal Oceanic Environment, 588509 (San Diego, CA).
Bianchi, T. S., Arndt, S., Austin, W. E. N., Benn, D. I., Bertrand, S., Cui, X., et al. (2020). Fjords as aquatic critical zones (ACZs). Earth Sci. Rev. 203:103145. doi: 10.1016/j.earscirev.2020.103145
Błaszczyk, M., Jania, J. A., and Kolondra, L. (2013). Fluctuations of tidewater glaciers in hornsund fjord (Southern Svalbard) since the beginning of the 20th century Pol. Polar Res. 34, 327–352. doi: 10.2478/popore-2013-0024
Blondeau-Patissier, D., Gower, J., Dekker, A., Phinn, S., and Brando, V. (2014). A review of ocean color remote sensing methods and statistical techniques for the detection, mapping and analysis of phytoplankton blooms in coastal and open oceans. Prog. Oceanogr. 123, 123–144. doi: 10.1016/j.pocean.2013.12.008
Bloshkina, E., Pavlov, A. K., and Filchuk, K. (2021). Warming of Atlantic water in three west spitsbergen fjords: recent patterns and century-long trends. Polar Research 40:5392. doi: 10.33265/polar.v40.5392
Bury, T. M., Sujith, R. I., Pavithran, I., Scheffer, M., Lenton, T. M., Anand, M., et al. (2021). Deep learning for early warning signals of regime shifts. bioRxiv [preprint]. doi: 10.1101/2021.03.28.437429
Calleja, M. L., Kerhervé, P., Bourgeois, S., Kȩdra, M., Leynaert, A., Devred, E., et al. (2017). Effects of increase glacier discharge on phytoplanktonbloom dynamics and pelagic geochemistry in a high Arctic fjord. Prog. Oceanogr. 159, 195–210. doi: 10.1016/j.pocean.2017.07.005
Campbell, J. W. (1995). The log-normal distribution as a model for bio-optical variability in the sea. J. Geophys. Res. Atmospheres 100, 13237–13254. doi: 10.1029/95JC00458
Cherkasheva, A., Bracher, A., Melsheimer, C., Köberle, C., Gerdes, R., Nöthig, E. M., et al. (2014). Influence of the physical environment on polar phytoplankton blooms: a case study in the fram strait. J. Mar. Syst. 132, 196–207. doi: 10.1016/j.jmarsys.2013.11.008
CMEMS (2020). Product User Manual for All Ocean Colour Products. Ref: CMEMS-OC-PUM-009-ALL. PUM. Available online at: marine. copernicus.eu/documents/PUM/CMEMS-OC-PUM-009-ALL.pdf, QUID: marine.copernicus.eu/documents/QUID/CMEMS-OC-QUID-009-066-067-0 68-069-088-091.pdf doi: 10.1016/j.jmarsys.2013.11.008 (accessed March 11, 2020).
Cohen, J., Screen, J. A., Furtado, J. C., Barlow, M., Whittleston, D., Coumou, D., et al. (2014). Recent Arctic amplification and extreme mid-latitude weather. Nat. Geosci. 7, 627–637. doi: 10.1038/ngeo2234
Cottier, F. R., Nilsen, F., Skogseth, R., Tverberg, V., Skarhamar, J., and Svendsen, H. (2010). Arctic fjords: a review of the oceanographic environment and dominant physical processes. Geolog. Soc. London Special Publi. 344, 35–50. doi: 10.1144/SP344.4
Curry, J. A., Schramm, J. L., and Ebert, E. E. (1995). Sea ice-albedo climate feedback mechanism. J. Clim. 8, 240–247.
Emberton, S., Chittka, L., Cavallaro, A., and Wang, M. (2016). Sensor capability and atmospheric correction in ocean colour remote sensing. Remote Sens. 8. doi: 10.3390/rs8010001
Engel, A., Bracher, A., Dinter, T., Endres, S., Grosse, J., Metfies, K., et al. (2019). Inter-annual variability of organic carbon concentration in the eastern fram strait during summer (2009–2017). Front. Mar. Sci. 6:187. doi: 10.3389/fmars.2019.00187
Ericson, Y., Chierici, M., Falck, E., Fransson, A., Jones, E., and Kristiansen, S. (2019). Seasonal dynamics of the marine CO2 system in adventfjorden, a west spitsbergen fjord. Polar Res. 38:3345. doi: 10.33265/polar.v38.3345
Førland, E. J., Benestad, R., Hanssen-Bauer, I., Haugen, J. E., and Skaugen, T. E. (2011). Temperature and precipitation development at svalbard 1900–2100. Adv. Meteorol. 2011:893790. doi: 10.1155/2011/893790
Geoffroy, M., Berge, J., Majaneva, S., Johnsen, G., Langbehn, T. J., Cottier, F., et al. (2018). Increased occurrence of the jellyfish periphylla periphylla in the European high Arctic. Polar Biol. 41, 2615–2619.
Giamalaki, K., Beaulieu, C., Faranda, D., Henson, S. A., Josey, S. A., and Martin, A. P. (2018). Signatures of the 1976–1977 regime shift in the North Pacific revealed by statistical analysis. J. Geophys. Res. Oceans 123, 4388–4397. doi: 10.1029/2017JC013718
Głuchowska, M., Kwaśniewski, S., Promińska, A., Olszewska, A., Goszczko, I., Falk-Petersen, S., et al. (2016). Zooplankton in Svalbard fjords on the Atlantic–Arctic boundary. Polar Biol. 39, 1785–1802. doi: 10.1007/s00300-016-1991-1
Gordon, H. R., and McCluney, W. R. (1975). Estimation of the depth of sunlight penetration in the seafor remote sensing. Appl. Optics 14, 413–416.
Gordon, H. R., and Morel, A. Y. (1983). Remote Assessment of Ocean Colour for Interpretation of Satellite Visible Imagery: A Review. New York, NY: Springer.
Gordon, H. R., Clark, D. K., Mueller, J. L., and Hovis, W. A. (1980). Phytoplankton pigments from the Nimbus-7 coastal zone color scanner: comparisons with surface measurements. Science 210, 63–66.
Granskog, M. A., Pavlov, A. K., Sagan, S., Kowalczuk, P., Raczkowska, A., and Stedmon, C. A. (2015). Effect of sea-ice melt on inherent optical properties and vertical distribution of solar radiant heating in Arctic surface waters. J. Geophys. Res. Oceans 120, 7028–7039. doi: 10.1002/2015JC011087
He, M., Hu, Y., Chen, N., Wang, D., Huang, J., and Stamnes, K. (2019). High cloud coverage over melted areas dominates the impact of clouds on the albedo feedback in the Arctic. Sci. Rep. 9:9529. doi: 10.1038/s41598-019-44155-w
Hegseth, E. N., Assmy, P., Wiktor, J. M., JWiktor, J. Jr., Kristiansen, S., Leu, E., et al. (2019). “Phytoplankton seasonal dynamics in kongsfjorden, Svalbard and the adjacent shelf,” in The Ecosystem of Kongsfjorden, Svalbard, Advances in Polar Ecology 2, eds H. Hop and C. Wiencke (Springer).
Hill, V., Ardyna, M., Lee, S. H., and Varela, D. E. (2018). Decadal trends in phytoplankton production in the Pacific Arctic region from 1950 to 2012. Deep Sea Res. Part II Top. Stud. Oceanogr. 152, 82–94. doi: 10.1016/j.dsr2.2016.12.015
Holinde, L., and Zielinski, O. (2016). Bio-optical characterization and light availability parameterization in Uummannaq fjord and vaigat–disko bay (West Greenland). Ocean Sci. 12, 117–128. doi: 10.5194/os-12-117-2016
Isaksen, K., Benestad, R. E., Harris, C., and Sollid, J. L. (2007). Recent extreme near-surface permafrost temperatures on Svalbard in relation to future climate scenarios. Geophys. Res. Lett. 34:L17502. doi: 10.1029/2007GL031002
Jackson, B., Sargle, J. D., Barnes, D., Arabhi, S., Alt, A., Gioumousis, P., et al. (2005). An algorithm for optimal partitioning of data on an interval. IEEE Signal Proc. Lett. 12, 105–108.
Kaplan, D., and Pruim, R. (2020). ggformula: Formula Interface to the Grammar of Graphics. R Package Version 0.9.4.
Kashiwase, H., Ohshima, K. I., Nihashi, S., and Eicken, H. (2017). Evidence for ice-ocean albedo feedback in the Arctic Ocean shifting to a seasonal ice zone. Sci. Rep. 7:8170. doi: 10.1038/s41598-017-08467-z
Killick, R., and Eckley, I. A. (2014). Changepoint: an R package for changepoint analysis. J. Statist. Softw. 58:i03.
Killick, R., Fearnhead, P., and Eckley, I. A. (2012). Optimal detection of changepoints with a linear computational cost. J. Am. Statist. Assoc. 107, 1590–1598.
Killick, R., Haynes, K., Eckley, I., Fearnhead, P., and Lee, J. (2016). Changepoint: Methods for Changepoint Detection. R Package Version 2.2.2.
Kipp, L. E., Charette, M. A., Moore, W. S., Henderson, P. B., and Rigor, I. G. (2018). Increased fluxes of shelf-derived materials to the central Arctic Ocean. Sci. Adv. 4:eaao1302. doi: 10.1126/sciadv.aao1302
Kohler, J., James, T. D., Murray, T., Nuth, C., Brandt, O., Barrand, N. E., et al. (2007). Acceleration in thinning rate on western Svalbard glaciers. Geophys Res. Lett. 34:L18502. doi: 10.1029/2007GL030681
Konik, M., Kowalczuk, P., Zabłocka, M., Makarewicz, A., Meler, J., Zdun, A., et al. (2020). Empirical relationships between remote-sensing reflectance and selected inherent optical properties in nordic sea surfacewaters for the MODIS and OLCI Ocean colour sensors. Remote Sens. 12:2774. doi: 10.3390/rs12172774
Kowalczuk, P., Meler, J., Kauko, H. M., Pavlov, A. K., Zabłocka, M., Peeken, I., et al. (2017). Bio-optical properties of Arctic drift ice and surface waters north of Svalbard from winter to spring. J. Geophys. Res. Oceans, 122, 4634–4660. doi: 10.1002/2016JC012589
Kowalczuk, P., Sagan, S., Makarewicz, A., Meler, J., Borzycka, K., Zabłocka, M., et al. (2019). Bio-optical properties of surface waters in the Atlanticwater inflow region off Spitsbergen (Arctic Ocean). J. Geophys. Res. Oceans 124, 1964–1987. doi: 10.1029/2018JC014529
Lorenzen, C. L. (1967). Determination of chlorophyll and pheo-pigments: spectrophotometric equations. Limnol. Oceanogr. 12, 343–346.
Makarewicz, A., Kowalczuk, P., Sagan, S., Granskog, M., Pavlov, A., Zdun, A., et al. (2018). Characteristics of chromophoric and fluorescent dissolved organic matter in the Nordic Seas. Ocean Sci. 14, 543–562. doi: 10.5194/os-14-543-2018
Mascarenhas, V. J., and Zielinski, O. (2018). Parameterization of spectral particulate and phytoplankton absorption coefficients in sognefjord and trondheimsfjord, two contrasting norwegian fjord ecosystems. Remote Sens. 10:977. doi: 10.3390/rs10060977
Mascarenhas, V. J., and Zielinski, O. (2019). Hydrography-driven optical domains in the vaigat-disko bay and godthabsfjord: effects of glacial meltwater discharge. Front. Mar. Sci. 6:335. doi: 10.3389/fmars.2019.00335
Mascarenhas, V. J., Voß, D., Wollschlaeger, J., and Zielinski, O. (2017). Fjord light regime: bio-optical variability, absorption budget, and hyperspectral light availability in sognefjord and trondheimsfjord, norway. J. Geophys. Res. Oceans 122, 3828–3847. doi: 10.1002/2016JC012610
Maturilli, M., Hanssen-Bauer, I., Neuber, R., Rex, M., and Edvardsen, K. (2019). “The atmosphere above ny-ålesund: climate and global warming, ozone and surface UV radiation,” in The Ecosystem of Kongsfjorden, Svalbard, Advances in Polar Ecology 2, eds H. Hop and C. Wiencke (Springer).
McClain, C. R., Arrigo, K. R., Esaias, W., Darzi, M., Patt, F. S., Evans, R. H., et al. (1995). “SeaWiFS algorithms, part 1,” in SeaWiFS Technical Report Series, eds S. B. Hooker, E. R. Firestone, and J. G. Acker (Maryland: NASA Goddard Space Flight Center, Greenbelt).
McPhee, M. G. (2017). “The sea ice–ocean boundary layer,” in. Sea Ice, Vol. 5, ed. D. N. Thomas (John Wiley & Sons), 138–159. doi: 10.1002/9781118778371.ch5
Mélin, F., Vantrepotte, V., Chuprin, A., Grant, M., Jackson, T., and Sathyendranath, S. (2016). “Global trends in chlorophyll concentration observed with the satellite ocean colour data record,” in Proceeding of the European Space Agency, Special Publication, ed. L. Ouwehand (ESA), 740.
Morel, A., and Prieur, L. (1977). Analysis of variations in ocean color. Limnol. Oceanogr. 22, 709–722.
Mueller, J. L., Austin, R. W., Morel, A., Fargion, G. S., and McClain, C. R. (2003). Ocean Optics Protocols For Satellite Ocean Color Sensor Validation, Revision 4.
Neukermans, G., Oziel, L., and Babin, M. (2018). Increased intrusion of warming Atlantic water leads to rapidexpansion of temperate phytoplankton in the Arctic. Global Change Biol. 24:14075. doi: 10.1111/gcb.14075
Noël, B., Jakobs, C. L., van Pelt, W. J. J., Lhermitte, S., Wouters, B., Kohler, J., et al. (2020). Low elevation of Svalbard glaciers drives high mass loss variability. Nat. Commun. 11:4597. doi: 10.1038/s41467-020-18356-1
Nordli, Ø, Wyszyński, P., Gjelten, H. M., Isaksen, K., Łupikasza, E., Niedźwiedź, T., et al. (2020). Revisiting the extended Svalbard airport monthly temperature series, and the compiled corresponding daily series 1898–2018. Polar Res. 39:3614. doi: 10.33265/polar.v39.3614
Oziel, L., Neukermans, G., Ardyna, M., Lancelot, C., Tison, J.-L., Wassman, P., et al. (2017). Role for Atlantic inflows and sea ice loss on shifting phytoplankton blooms in the barents sea. J. Geophys. Res. Oceans Wiley Blackwell 122, 5121–5139. doi: 10.1002/2016JC012582
Parmentier, F.-J. W., Christensen, T. R., Rysgaard, S., Bendtsen, J., Glud, R. N., Else, B., et al. (2017). A synthesis of the arctic terrestrial and marine carbon cycles under pressure from a dwindling cryosphere. Ambio 46, S53–S69.
Pavlov, A. K., Granskog, M. A., Stedmon, C. A., Ivanov, B. V., Hudson, S. R., and Falk-Petersen, S. (2015). Contrasting optical properties of surface waters across the fram strait and its potential biological implications. J. Mar. Syst. 143, 62–72. doi: 10.1016/j.jmarsys.2014.11.001
Pavlov, A. K., Tverberg, V., Ivanov, B. V., Nilsen, F., Falk-Petersen, S., and Granskog, M. A. (2013). Warming of Atlantic water in two west Spitsbergen fjords over the last century (1912 – 2009). Polar Res. 32:11206. doi: 10.3402/polar.v32i0.11206
Pavlova, O., Gerland, S., and Hop, H. (2019). “Changes in sea-ice extent and thickness in Kongsfjorden, Svalbard (2003–2016),” in The Ecosystem of Kongsfjorden, Svalbard, Advances in Polar Ecology 2, eds H. Hop and C. Wiencke (Springer).
Payne, C. M., and Roesler, C. S. (2019). Characterizing the influence of Atlantic water intrusion on water mass formation and phytoplankton distribution in Kongsfjorden, Svalbard. Continental Shelf Res. 191:104005. doi: 10.1016/j.csr.2019.104005
Polyakov, I. V., Pnyushkov, A. V., Alkire, M. B., Ashik, I. M., Baumann, T. M., Carmack, E. C., et al. (2017). Greater role for Atlantic inflows on sea ice loss in the Eurasian Basin of the Arctic Ocean. Science 356, 285–291. doi: 10.1126/science.aai8204
Pope, R., and Fry, E. (1997). Absorption spectrum (380-700 nm) of pure water. II. integrating cavity measurements. Appl. Optics 36, 8710–8723. doi: 10.1364/AO.36.008710
Promińska, A., Cisek, M., and Walczowski, W. (2017). Kongsfjorden and hornsund hydrographycomparative study based on a multiyear survey in fjords of west Spitsbergen. Oceanologia 59, 397–412. doi: 10.1016/j.oceano.2017.07.003
R Core Team (2020). R: A Language and Environment for Statistical Computing. Vienna: R Foundation for Statistical Computing.
Rozwadowska, A., and Górecka, I. (2017). Impact of reflecting land surface on radiation environment over Hornsund, Spitsbergen – a model study for cloudless skies. Polish Polar Res. 38, 149–174. doi: 10.1515/popore-2017-0008
Sagan, S., and Darecki, M. (2017). Inherent optical properties and particulate matter distribution in summer season in waters of Hornsund and Kongsfjordenen, Spitsbergen. Oceanologia 60, 65–75. doi: 10.1016/j.oceano.2017.07.006
Sathyendranath, S., Brewin, R. J. W., Brockmann, C., Brotas, V., Calton, B., Chuprin, A., et al. (2019). An ocean-colour time series for use in climate studies: the experience of the ocean-colour climate change initiative (OC-CCI). Sensors 19:4285. doi: 10.3390/s19194285
Sathyendranath, S., Brewin, R. J. W., Müeller, D., Brockmann, C., Deschamps, P.-Y., Doerffer, R., et al. (2012). “Ocean colour climate change initiative: approach and initial results,” in Proceeding of the Geoscience and Remote Sensing Symposium (IGARSS), 2012 IEEE International, doi: 10.1109/IGARSS.2012.6350979
Schuler, T. V., Kohler, J., Elagina, N., Hagen, J. O. M., Hodson, A. J., Jania, J. A., et al. (2020). Reconciling Svalbard glacier mass balance. Front. Earth Sci. 8:156. doi: 10.3389/feart.2020.00156
Serreze, M. C., and Stroeve, J. (2015). Arctic sea ice trends, variability and implications for seasonal ice forecasting. Philos. Trans. A Math Phys. Eng. Sci. 373:20140159. doi: 10.1098/rsta.2014.0159
Skogseth, R., Olivier, L. L., Nilsen, F., Falck, E., Fraser, N., Tverberg, V., et al. (2020). Variability and decadal trends in the Isfjorden (Svalbard) ocean climate and circulation–an indicator for climate change in the European Arctic. Prog. Oceanogr. 187:102394. doi: 10.1016/j.pocean.2020.102394
Smedsrud, L. H., Halvorsen, M. H., Stroeve, J. C., Zhang, R., and Kloster, K. (2016). Fram strait sea ice export variability and september Arctic sea ice extent over the last 80 years. Cryosphere 11, 65–79. doi: 10.5194/tc-11-65-2017
Smith, R. W., Bianchi, T., Allison, M. A., Savage, C., and Galy, V. (2015). High rates of organic carbon burial in fjord sediments globally. Nat. Geosci. 8:2421. doi: 10.1038/ngeo2421
Son, Y.-S., and Kim, H.-C. (2018). Empirical ocean color algorithms and bio-optical properties of the western coastal waters of Svalbard, Arctic. ISPRS J. Photogr. Remote Sen. 139, 272–283. doi: 10.1016/j.isprsjprs.2018.03.024
Spanbauer, T. L., Allen, C. R., Angeler, D. G., Eason, T., Fritz, S. C., Garmestani, A. S., et al. (2014). Prolonged instability prior to a regime shift. PLoS One 9:e108936. doi: 10.1371/journal.pone.0108936
Stachnik, Ł, Yde, J. C., Nawrot, A., Uzarowicz, Ł, Łepkowska, E., and Kozak, K. (2019). Aluminium in glacial meltwater demonstrates an association with nutrient export (Werenskiöldbreen, Svalbard). Hydrol. Process. 33, 1638–1657. doi: 10.1002/hyp.1342
Støylen, E., and Fer, I. (2014). Tidally induced internal motion in an Arctic fjord. Nonlin. Processes Geophys. 21, 87–100. doi: 10.5194/npg-21-87-2014
Stramska, M., Stramski, D., Hapter, R., Kaczmarek, S., and Stoń, J. (2003). Bio-optical relationships and ocean color algorithms for the northpolar region of the Atlantic. J. Geophys. Res. 108:3143. doi: 10.1029/2001JC001195
Stramska, M., Stramski, D., Kaczmarek, S., Allison, D. B., and Schwarz, J. (2006). Seasonal and regional differentiation of bio-optical properties within the north polar Atlantic. J. Geophys. Res. 111:3293. doi: 10.1029/2005JC003293
Strickland, J. D. H., and Parsons, T. R. (1972). A Practical Handbook of Seawater Analyses. Ottawa, ON: Fisheries Research Board of Canada.
Szeligowska, M., Trudnowska, E., Boehnke, R., Dąbrowska, A. M., Wiktor, J. M., Sagan, S., et al. (2020). Spatial patterns of particles and plankton in the warming Arctic fjord (Isfjorden, west Spitsbergen) in seven consecutive mid-summers (2013–2019). Front. Mar. Sci. 7:584. doi: 10.3389/fmars.2020.00584
Telling, J., Anesio, A. M., Tranter, M., Fynn, T. I., Hodson, A., Butler, C., et al. (2011). Nitrogen fixation on Arctic glaciers, Svalbard. J. Geophys. Res. 116:G03039. doi: 10.1029/2010JG001632
Thomas, F. A., Sinha, R. K., and Krishnan, K. P. (2020). Bacterial community structure of a glacio-marine system in the Arctic (Ny-Ålesund, Svalbard). Sci. Total Environ. 718:135264. doi: 10.1016/j.scitotenv.2019.135264
Tiller, R. G., De Kok, J.-L., Vermeiren, K., and Thorvaldsen, T. (2017). Accountability as a governance paradox in the norwegian salmon aquaculture. industry. Front. Mar. Sci. 4:71. doi: 10.3389/fmars.2017.00071
van Pelt, W., Pohjola, V., Pettersson, R., Marchenko, S., Kohler, J., Luks, B., et al. (2019). A long-term dataset of climatic mass balance, snow conditions, and runoff in Svalbard (1957–2018). Cryosphere 13, 2259–2280. doi: 10.5194/tc-13-2259-2019
Vickers, H., Høgda, K. A., Solbø, S., Karlsen, S. R., Tømmervik, H., Aanes, R., et al. (2016). Changes in greening in the high Arctic: insights from a 30 year AVHRR max NDVI dataset for Svalbard. Environ. Res. Lett. 11:105004. doi: 10.1088/1748-9326/11/10/105004
Vickers, H., Karlsen, S. R., and Malnes, E. (2020). A 20-year MODIS-based snow cover dataset forsvalbard and its link to phenological timing and seaice variability. Remote Sens. 12:1123. doi: 10.3390/rs12071123
Weller, G. (2005). “Summary and synthesis of the Arctic Climate Impact Assessment (ACIA),” in Arctic Climate Impact AssessmentScientific Report, eds C. Symon, L. Arris, and B. Heal (Cambridge: Cambridge University Press).
Wessel, P., and Smith, W. H. F. (1996). A global self-consistent, hierarchical, high-resolution shoreline database. J. Geophys. Res. 101, 8741–8743.
Wickham, H., Chang, W., Henry, L., Pedersen, T. L., Takahashi, K., Wilke, C., et al. (2020). ggplot2: Create Elegant Data Visualisations Using the Grammar of Graphics. R package version 3.3.0.
Winter, A., Henderiks, J., Beaufort, L., Rickaby, R. E. M., and Brown, C. W. (2014). Poleward expansion of the coccolithophore Emiliania huxleyi. J. Plankton Res. 36, 316–325. doi: 10.5194/os-2016-13
Keywords: Svalbard fjords, IOPs, remote sensing, coastal darkening, phytoplankton
Citation: Konik M, Darecki M, Pavlov AK, Sagan S and Kowalczuk P (2021) Darkening of the Svalbard Fjords Waters Observed With Satellite Ocean Color Imagery in 1997–2019. Front. Mar. Sci. 8:699318. doi: 10.3389/fmars.2021.699318
Received: 23 April 2021; Accepted: 04 October 2021;
Published: 27 October 2021.
Edited by:
Hjálmar Hátún, Faroe Marine Research Institute (FAMRI), Faroe IslandsReviewed by:
Solva Karadottir Eliasen, Faroe Marine Research Institute (FAMRI), Faroe IslandsMichelle Jillian Devlin, Centre for Environment, Fisheries and Aquaculture Science (CEFAS), United Kingdom
Copyright © 2021 Konik, Darecki, Pavlov, Sagan and Kowalczuk. This is an open-access article distributed under the terms of the Creative Commons Attribution License (CC BY). The use, distribution or reproduction in other forums is permitted, provided the original author(s) and the copyright owner(s) are credited and that the original publication in this journal is cited, in accordance with accepted academic practice. No use, distribution or reproduction is permitted which does not comply with these terms.
*Correspondence: Marta Konik, bWtAaW9wYW4uZ2RhLnBs
†ORCID: Marta Konik, orcid.org/0000-0003-1145-9127; Mirosław Darecki, orcid.org/0000-0003-4326-5212; Alexey K. Pavlov, orcid.org/0000-0002-1978-5368; Sławomir Sagan, orcid.org/0000-0003-4183-0337; Piotr Kowalczuk, orcid.org/0000-0001-6016-0610