 Kerry-Ann van der Walt1,2*
 Warren M. Potts2
 Francesca Porri1,3
 Alexander C. Winkler2,4
 Murray I. Duncan2,5,6
 Michael R. Skeeles2,7
 Nicola C. James1,2
- 1South African Institute for Aquatic Biodiversity, Makhanda, South Africa
- 2Department of Ichthyology and Fisheries Science, Rhodes University, Makhanda, South Africa
- 3Department of Zoology and Entomology, Rhodes University, Makhanda, South Africa
- 4Centro de Ciências do Mar (CCMAR), Universidade do Algarve, Faro, Portugal
- 5Department of Geological Sciences, Stanford University, Stanford, CA, United States
- 6Hopkins Marine Station, Stanford University, Pacific Grove, CA, United States
- 7School of Life and Environmental Sciences, Deakin University, Geelong, VIC, Australia
Climate change not only drives increases in global mean ocean temperatures, but also in the intensity and duration of marine heatwaves (MHWs), with potentially deleterious effects on local fishes. A first step to assess the vulnerability of fishes to MHWs is to quantify their upper thermal thresholds and contrast these limits against current and future ocean temperatures during such heating events. Heart failure is considered a primary mechanism governing the upper thermal limits of fishes and begins to occur at temperatures where heart rate fails to keep pace with thermal dependency of reaction rates. This point is identified by estimating the Arrhenius breakpoint temperature (TAB), which is the temperature where maximum heart rate (fHmax) first deviates from its exponential increase with temperature and the incremental Q10 breakpoint temperature (TQB), which is where the Q10 temperature coefficient (relative change in heart rate for a 10°C increase in temperature) for fHmax abruptly decreases during acute warming. Here we determined TAB, TQB and the temperature that causes cardiac arrhythmia (TARR) in adults of the marine sparid, Diplodus capensis, using an established technique. Using these thermal indices results, we further estimated adult D. capensis vulnerability to contemporary MHWs and increases in ocean temperatures along the warm-temperate south-east coast of South Africa. For the established technique, we stimulated fHmax with atropine and isoproterenol and used internal heart rate loggers to measure fHmax under conditions of acute warming in the laboratory. We estimated average TAB, TQB, and TARR values of 20.8°C, 21.0°C, and 28.3°C. These findings indicate that the physiology of D. capensis will be progressively compromised when temperatures exceed 21.0°C up to a thermal end-point of 28.3°C. Recent MHWs along the warm-temperate south-east coast, furthermore, are already occurring within the TARR threshold (26.6–30.0°C) for cardiac function in adult D. capensis, suggesting that this species may already be physiologically compromised by MHWs. Predicted increases in mean ocean temperatures of a conservative 2.0°C, may further result in adult D. capensis experiencing more frequent MHWs as well as a contraction of the northern range limit of this species as mean summer temperatures exceed the average TARR of 28.3°C.
Introduction
Rising ocean temperatures and the concurrent increase in anomalous thermal events (e.g., marine heatwaves—MHWs) (IPCC, 2014) can exceed physiological thresholds of marine organisms, compromising energetic processes (e.g., growth, reproduction, and behavior) and ultimately influencing their fitness and survival (Doney et al., 2012; Huey et al., 2012; Lefevre, 2016; Abram et al., 2017). These individual-level effects can scale-up to deleterious levels for populations and communities, with knock-on effects on the functioning of ecosystems (Pörtner and Peck, 2010). Predictions of marine species responses to temperature variability in future climate change scenarios requires an understanding of their physiological processes and limits (Sinclair et al., 2016).
One approach to estimate thermal tolerance and optima of fishes is through quantifying heart rate (fH) responses to thermal variability because increasing heart rate is a primary mechanism to fuel increased oxygen demand as temperature rises (e.g., Cooke et al., 2010; Casselman et al., 2012; Anttila et al., 2014; Drost et al., 2014; Ferreira et al., 2014; Sidhu et al., 2014; Hansen et al., 2017; Muller et al., 2020; Skeeles et al., 2020). When the maximum heart rate (fHmax) of fish fails to increase in proportion to the increased oxygen demand as temperatures rise, mismatches between oxygen supply and demand can arise and potentially impair energetic processes (Steinhausen et al., 2008; Farrell, 2009; Eliason et al., 2011, 2013) and may be compromised at critical maximum temperatures (Sandblom et al., 2016; Eliason and Anttila, 2017; Ekström et al., 2019; Skeeles et al., 2020). The point where fHmax stops keeping pace with the thermodynamic effects of temperature can be estimated as the Arrhenius breakpoint temperature (TAB) or the temperature where Q10 temperature coefficients decrease abruptly (TQB) and both metrics can be used as estimates of the upper thermal limits for energy homeostasis (Anttila et al., 2014; Ferreira et al., 2014; Sidhu et al., 2014; Skeeles et al., 2020). Further increases in temperature can eventually lead to an arrhythmic heartbeat (TARR) and potentially cardiac arrest, which normally occurs just below the upper critical temperature (TCRIT/CTmax) (Casselman et al., 2012; Anttila et al., 2013, 2014; Ekström et al., 2019; Skeeles et al., 2020). Measurements of fishes heart rate function at a range of temperatures may therefore provide important insights into how ocean warming and increases in extreme warming events, such as MHWs, can affect their energetic functioning (Fey et al., 2015; Ekström et al., 2019; Stillman, 2019).
The Diplodus sargus species group (comprising five species; Fricke et al., 2016) is distributed in the warm-temperate, shallow waters (<20 m depth) of the Mediterranean, North-east Atlantic, South-east Atlantic and Western Indian Oceans and is thought to be vulnerable to ocean warming due to a narrow (15–20°C) reproductive scope (Potts et al., 2014). Although this may be attributed to the stenothermy of the earliest life stages (eggs and larvae), no information exists on the upper thermal tolerance and performance of the larval or adult stages of this species complex (see Kemp, 2009; Madeira et al., 2012, 2013; van der Walt et al., 2021, for upper thermal tolerance of the juvenile stage).
Blacktail seabream Diplodus capensis (Smith, 1844) is endemic to southern Africa, comprising of two disjunct populations, one distributed along the south-eastern coast of southern Africa from Cape Point to southern Mozambique (Mann, 1992; Smith and Heemstra, 2012) and the other distributed from Namibia to southern Angola (Richardson, 2010). Throughout the distribution of D. capensis along South Africa’s coastal zone, changes in ocean temperature patterns are already occurring as a result of global climate change (Potts et al., 2015). The subtropical east coast is warming as a consequence of the strengthening of the Agulhas Current (Rouault et al., 2010). In contrast, temperatures in the warm-temperate south coast are predicted to become increasingly variable due to the strengthening and warming of the Agulhas Current’s water on the Agulhas Bank and an increase in upwelling favorable easterly winds (Maree et al., 2000; Roberts, 2005; Lutjeharms, 2007; Schlegel et al., 2017; Duncan et al., 2019). Discrete prolonged anomalous MHWs are expected to be more intense and longer in duration in this region and are predicted to increase in intensity and frequency over time (Schlegel et al., 2017). Consequently, coastal fishes of this warm-temperate region, including D. capensis will likely experience the greatest thermally mediated physiological impacts in South Africa (Duncan et al., 2019).
The aim of this study was to use an established technique to estimate cardiac indices of thermal tolerance (TAB, TQB, and TARR) for adult D. capensis and to relate these to the contemporary and predicted extreme thermal events. To achieve this, we used micro heart rate loggers to estimate fHmax under conditions of acute warming in a laboratory and used recent in situ coastal water temperatures to examine the likely physiological impact of changing temperatures on the species.
Materials and Methods
Study Species and Sampling Method
For this study, 16 adult D. capensis individuals (mean ± SD: 0.49 ± 0.16 kg, range: 0.23–0.81 kg) were collected in summer (December 2017–January 2018) from the Port Alfred surf zone (33° 36′ 3.71″ S; 26° 54′ 38.49″ E; Figure 1A) along the warm-temperate south-east coast of South Africa using hook and line. After collection, all individuals were transported in a sealed 5,000 L aerated saltwater tank to the NRF-SAIAB Aquatic Ecophysiology Research Platform (AERP) laboratory at the Department of Ichthyology and Fisheries Science, Rhodes University, Makhanda. Individuals were next transferred to an aerated 5,900 L indoor cylindrical saltwater recirculating holding aquaculture system set at 20.0°C, the mean water temperature at which they were collected, and acclimated for a minimum of 36 h prior to the first experiment.
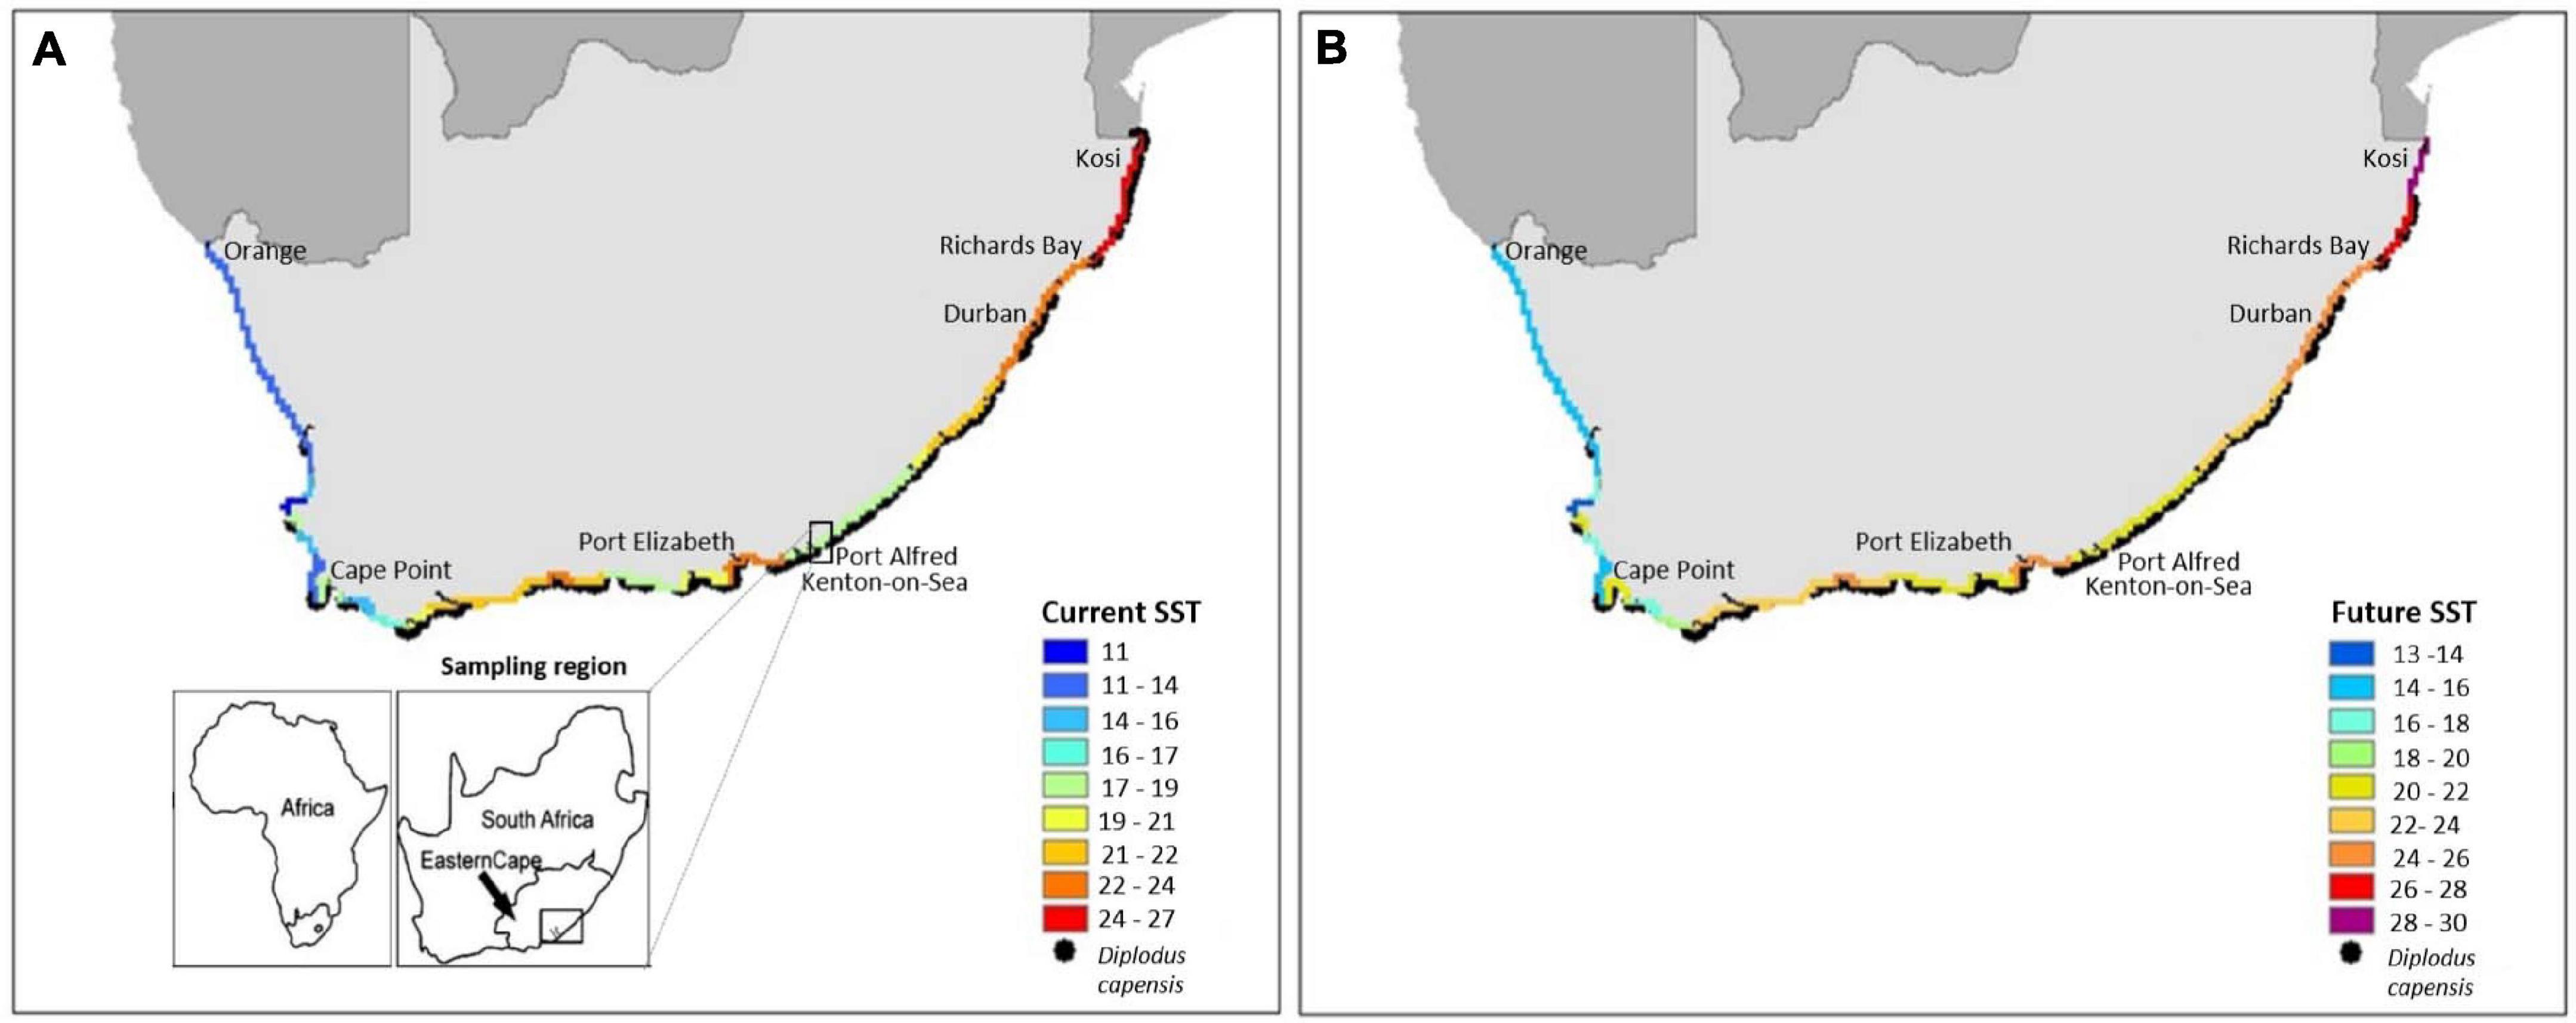
Figure 1. (A) Recent mean February in situ coastal water temperatures for South Africa (from Smit et al., 2013) and the present known distribution of Diplodus capensis (https://portal.obis.org/taxon/273970); and (B) predicted mean February 2100 decadal coastal temperatures [0.2°C × 10 decades (from 2013) = 2°C in 2109; IPCC, 2014] and the predicted distribution of D. capensis based on an average TARR thermal index of 28.3°C. Study region (Port Alfred surf zone and Kenton-on-Sea) in the Eastern Cape indicated by black outlined rectangle.
Individuals remained in this system for the experimental period, which lasted 2 weeks with a photoperiod of 12 h L: 12 h D. Individuals were fed a mixed diet of squid (Loligo reynaudii) and sardine (Sardinops sagax) every other day and starved 36 h prior to the experiments. Salinity was kept constant at 35 ppt, dissolved oxygen was kept at 100% saturation, and pH remained in the range of 7.9–8.4 in accordance with the water quality parameters taken during fish collection. Ammonia, nitrate and nitrite was maintained at <0.25 mg. L–1, < 2 mg L–1; and < 0.1 mg L–1 (Salifert Test Kits). Water quality was monitored every second day. If water salinity, pH, ammonia, nitrate and nitrite were found to be high, a partial water change was conducted, whereby a quarter of the seawater was removed from the holding aquaculture system and replaced with either filtered rainwater (to lower high salinity and pH levels) or fresh seawater (to lower high ammonia, nitrate and nitrite levels).
Estimation of fHmax Indicators
The experimental trials to determine fHmax in adult D. capensis individuals using micro heart rate loggers followed the methodology outlined by Casselman et al. (2012) and Skeeles et al. (2020). Prior to experimental trials, D. capensis were individually placed into an aerated rectangular 250 L tank whereby the water temperature was lowered from 20.0°C to 14.0°C over a 3-h period (2.0°C h–1 decrease) using a Hailea, HS-90A chiller to meet the minimum summer water temperatures recorded for the study area over December 2017 and January 2018 when fish were collected. Each individual was then placed into a 250 L tank connected to an overall 800 L aerated recirculating system that had been dosed with 2-phenoxyethanol (C8H10O2; 0.2 ml. L–1). Once anaesthesia was induced (Summerfelt and Smith, 1990; Mylonas et al., 2005), the individual was immediately weighed to the nearest gram using a AEADAM PGL 3,000 g scale and moved to an operating trough for surgery, where anaesthetic seawater solution from the system was applied continuously over the gills to maintain respiration and anaesthesia.
The surgery entailed implanting leadless heart rate loggers into individuals (DST micro HRT, 8.3 mm × 25.4 mm, 3.3 g, Star-Oddi©, Iceland,1). The loggers were pre-programmed to measure heart rate and internal body temperature every 15 s for a minute (four readings) followed by 1 minute of recording ECG data at 200 Hz. This programmable setting was continuous for a 3-h period. The heart rate logger was attached with two sutures (Clinisut® silk suture; 3--0, South Africa2), one tied to the designated anterior hole and the other to the posterior end via a suture wrap (see Skeeles et al., 2020). A single incision of approximately 2.5 cm was made directly below the origin of the left pectoral fin (Figure 2a). This location allowed the heart rate logger to be situated immediately posterior to the pericardium membrane (Figure 2b). The heart rate logger was inserted into the cavity, with the two circular electrodes orientated sideways (positioned at a 45° angle ventrally and in direct contact with the musculature once sealed; Figure 2b). This orientation has been shown to be optimal for Sparids (Muller et al., 2020). The incision was stitched using the two sutures attached to the heart rate logger and coagulating antiseptic gel was applied externally to the wound.
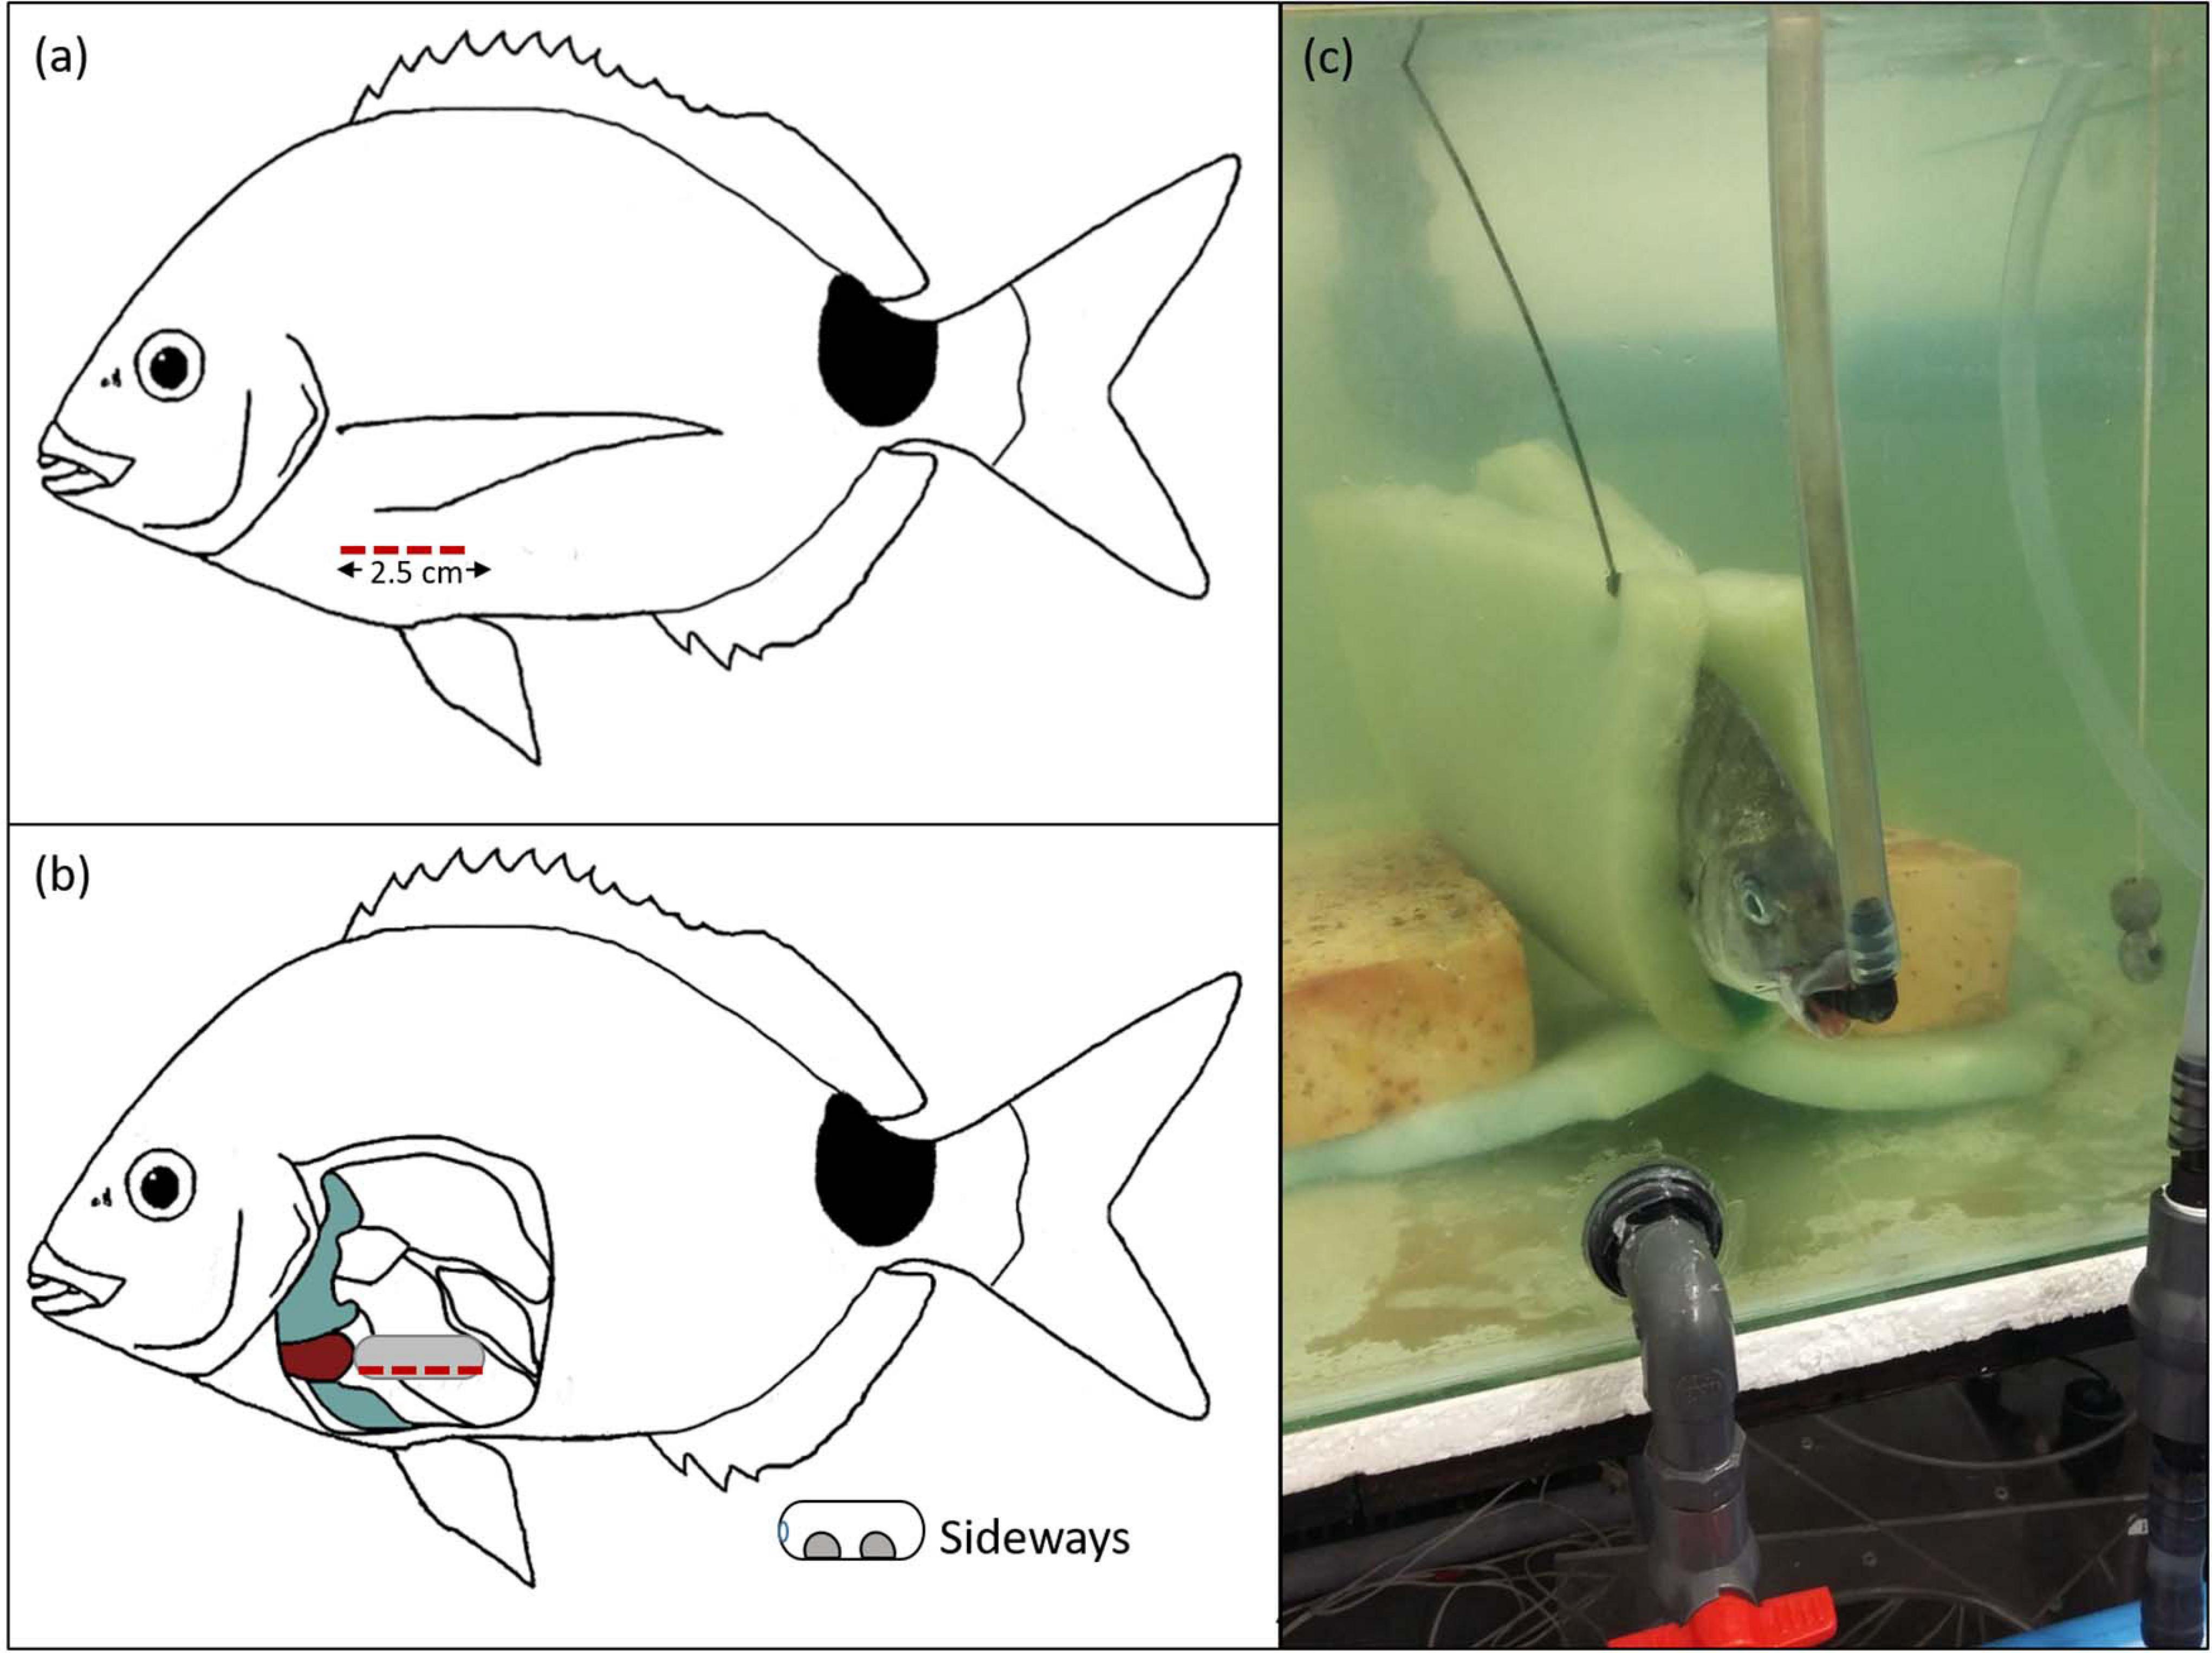
Figure 2. The position of the incision made on the individual adult sparid Diplodus capensis for the insertion of the Star-Oddi© micro HRT heart rate logger as well as the position of an individual adult D. capensis maintained throughout experiments. The position of the incision (red dashed line) was made directly below the origin of the left pectoral fin (a) relative to the pericardium (red), pelvic and pectoral girdles (gray) within the abdominal cavity for the insertion of the Star-Oddi© micro HRT heart rate logger orientated sideways (b). Sideways orientation was positioned at a 45° angle ventrally and in direct contact with the musculature. The position maintained throughout experiments for individual D. capensis was in an upright position in a weighted sling with a respiratory inflow valve (c).
After surgery, the fish was immediately returned to the rectangular 250 L tank, linked to the aerated 800 L recirculating system with 2-phenoxyethanol and placed in a weighted foam sling that kept the fish suspended in an upright position (Figure 2c). The tank had two inflows, the first of which was a respirator pipe nozzle positioned in the mouth of the fish so that respiration could be maintained and the second, an inflow to regulate water circulation and temperature (Figure 2c). The flow rate of the respirator was kept constant at 1 L min–1. After 1-h, the fish was removed from the sling and intraperitoneally injected with a solution of atropine sulfate (Sigma-Aldrich; 1.2 mg⋅kg−1) to inhibit vagal tonus to the heart, as well as a saline solution of isoproterenol (Sigma-Aldrich; 1.2 μg⋅kg−1) to stimulate cardiac adrenergic β-receptors (Casselman et al., 2012; Chen et al., 2015; Skeeles et al., 2020). A pilot study, to validate the action and efficacy of the drugs atropine sulfate and isoproterenol to induce fHmax and to assess any post-surgery effects on fHmax, was done prior to the experiment by monitoring the heart rate of two anaesthetized individuals (0.62 kg male and 0.47 kg female) at 20.0°C for a further ± 4 h after surgery (Appendix A Supplementary Material).
Five minutes after the intraperitoneal injection, the heart rate logger was set to start recording and the water temperature was raised using an AquaHeat 9.2 kW pump at 6.0°Ch−1 from 14.0 to 30.0°C. Water temperature was raised to 30.0°C as this value was indicative of the maximum summer water temperature in the study area between 2013–2018 (van der Walt et al., 2021) and at a rate of 6.0°Ch−1 to accommodate the maximum time for fHmax drug efficacy (±4 h; Appendix A Supplementary Figure A.1). At the end of the three-hour experiment, the individual fish was removed from the sling, euthanized using a lethal dose of 2-phenoxyethanol (0.5 ml L–1), and the logger retrieved, rinsed, dried and placed in the communication box to retrieve the heart rate data. This experimental protocol was repeated for 14 adult (330–340 mm TL) D. capensis.
Data Processing and Statistical Analysis of fHmax Indicators
Star-Oddi© heart rate loggers return heart rates (beats per minute–BPM) validated using a four-level quality index (QI 0 = great; QI 1 = good; QI 2 = fair; QI 3 = poor) (Muller et al., 2020; Skeeles et al., 2020). The QI of zero was validated with the loggers ECG output to ensure that the algorithm was working successfully and the QI’s were a true representation of the quality of recordings (Skeeles et al., 2020). For the pilot study, data from the heart rate loggers were filtered to accept only values with a QI of zero and the average heart rate was calculated before and after the addition of the intraperitoneal injection (Appendix A Supplementary Figure A.1). For the experimental protocol, data were filtered to accept only values with a QI of zero and binned into 0.25°C increments. A heart rate trial was considered successful if readings with a QI of zero spanned across at least 80% of the 0.25°C temperature increments. Also, if heart rate loggers yielded highly erratic fHmax recordings for an individual, they were excluded from the analysis.
The TAB was calculated using piecewise linear regression models (Quasi-Newton estimation) fitted to the Arrhenius plot [natural logarithm of the heart rate (ln (fHmax)] against the inverse of temperature in Kelvin (1,000 K–1)] (STATISTICA, v. 12, Statsoft). Heart rate data for temperature bins from 14°C to the temperature corresponding to maximum fHmax were used for the TAB analysis (Ferreira et al., 2014). The incremental Q10 of fHmax for individual fish was determined for every 1.0°C increase using the equation outlined by Ferreira et al. (2014):
where fH1 and fH2 are heart rates at first T1 and second T2 temperatures, respectively. The incremental Q10 breakpoint (TQB) was estimated by finding the linear equation of the two consecutive points above and below 2.0 and calculating the temperature at which the two lines intersect (Quasi-Newton estimation, STATISTICA, v. 12, Statsoft). The value of 2.0 was selected as it is regarded as a regular rate of change of routine metabolism with temperature for fish (Drost et al., 2014). The Tmax indicator was observed as the temperature at which fHmax reached its absolute maximum value. The TARR indicator was observed as the temperature at which fHmax first began to decrease rapidly after fHmax plateaued, resulting in assumed cardiac arrhythmia. T-tests were performed to compare TAB and TQB; TAB and TARR; TQB and TARR in RStudio (version 4.0.0). Normality of distributions were tested using a Shapiro-Wilk test for each indice and homoscedasticity was tested using the Levene’s test for each comparison. When normality and homogeneity assumptions were not satisfied, Wilcoxon tests were performed in place of the parametric tests.
Marine Heatwaves and the Thermal Tolerance of Diplodus capensis
Hourly in situ water temperature data (2013–2018) was provided by the South African Environmental Observation Network (SAEON, Elwandle Node, Port Elizabeth, Eastern Cape) for Kenton-on-Sea (mooring Kariega_CTlog_Lower, measuring depth < 2 m), which is situated approximately 30 km from Port Alfred (Figure 1A). Hourly temperatures were averaged to give daily water temperatures upon which MHWs were identified using the heatwave R package 0.4.5 (Schlegel and Smit, 2018) in RStudio (version 4.0.0) to characterize their frequency, intensity, and duration (Appendix B Supplementary Material).
Following Hobday et al. (2016), a MHW was defined as a “discrete prolonged anomalously warm water event.” In this case, “discrete” means an identifiable event with recognizable start and end dates, “prolonged” implies a duration of at least 5 days, and “anomalously warm” temperatures relative to a baseline climatology and threshold (Oliver et al., 2019). The climatological mean and seasonally varying 90th percentile threshold was calculated for each calendar day of the year by pooling all data within an 11-day window across all years (Hobday et al., 2016; Schlegel et al., 2017; Oliver et al., 2019). Marine heatwaves were identified as periods of time when temperatures exceeded the seasonally varying 90th percentile threshold for at least 5 days (Schlegel et al., 2017; Oliver et al., 2019). Furthermore, discrete events with well-defined start and end dates but with “breaks” between events lasting ≤ 2 days followed by subsequent ≥ 5 day events were considered to be continuous events (Hobday et al., 2016; Schlegel et al., 2017).
After the events were defined, a set of metrics were calculated including the duration (time from start to end dates, in days), mean and maximum intensity (measured as anomalies relative to the climatological mean, in °C), and cumulative intensity (the integrated intensity over the duration of the event, analogous to degree-heating-days; °C -days) (Schlegel et al., 2017).
Predicted Marine Heatwaves and Links to the Thermal Tolerance of Diplodus capensis
Predicted future daily water temperatures for the beginning of the next century, in the same study area, were approximated by adding 2.0°C to the recent five-year daily in situ water temperatures. A conservative temperature increase of 2.0°C was used as, globally, SST is predicted to increase by 0.2°C per decade (IPCC, 2014). Marine heatwaves were then identified using the process described above (Appendix C Supplementary Material). This was done in order to estimate how future temperature increases of 2.0°C may shift/increase MHW events into adult D. capensis physiologically preferred threshold (TAB/TQB), above their physiologically preferred threshold, and within and above their physiologically tolerable TARR threshold.
Predicted Impact of Increasing Mean Sea Temperatures on the Distribution of Adult Diplodus capensis
In order to assess the relationship between mean coastal temperatures and the distribution of D. capensis, the current distribution of D. capensis3 was plotted against mean summer (February) in situ temperatures recorded along the South African coastline between 1972 and 2012 (Smit et al., 2013). A uniform rate of temperature increase of 0.2°C per decade for the whole coastline was then used, in line with the global average (IPCC, 2014), and added to the mean summer in situ temperatures to estimate future (2100) SST values. Thermal habitat lost in the future was estimated by removing habitat with mean summer temperatures above the physiologically tolerable TARR of the species.
Results
Twelve of the 14 individuals tested (mean ± SD: 0.51 ± 0.17 kg, range: 0.23–0.81 kg) yielded interpretable results for fHmax and a high heart rate logger efficiency, whereby the desired QI of zero was attained, i.e., ∼ 95% across the 0.25°C temperature increments for each trial (Appendix D Supplementary Figure D.1). For the remaining two individuals (mean ± SD: 0.35 ± 0.05 kg, range: 0.31–0.39 kg), the Star-Oddi© heart rate loggers stopped recording after an hour.
The fHmax of all 12 individuals increased with temperature, peaking at an average of 152 beats min–1 ±17 SD at 28.0 ± 1.7°C (Figure 3A and Table 1). The highest fHmax was generally followed by a plateau and decline in heart rate, which signified the beginning of cardiac arrhythmia (TARR) (Figure 3A). The average TARR was 28.3°C ± 1.7°C SD (Table 1). Piecewise linear regression models for the 12 individuals yielded detectable Arrhenius breakpoint temperatures (TAB) ranging from 19.8 to 23.4°C with an average of 20.8°C ± 1.0°C SD (Figure 3C and Table 1). The incremental Q10 breakpoint (TQB) was similar to the TAB [Wilcoxon W-test; W (22) = 58.5, p = >0.452], ranging from 19.0 to 22.5°C with an average of 21.0°C ± 1.0°C SD (Figure 3B and Table 1). The TARR, however, was significantly different to the TAB [Wilcoxon W-test, W (22) = 0.00, p = <0.01] and TQB [T-test, T (22) = 12.89, p = <0.01].
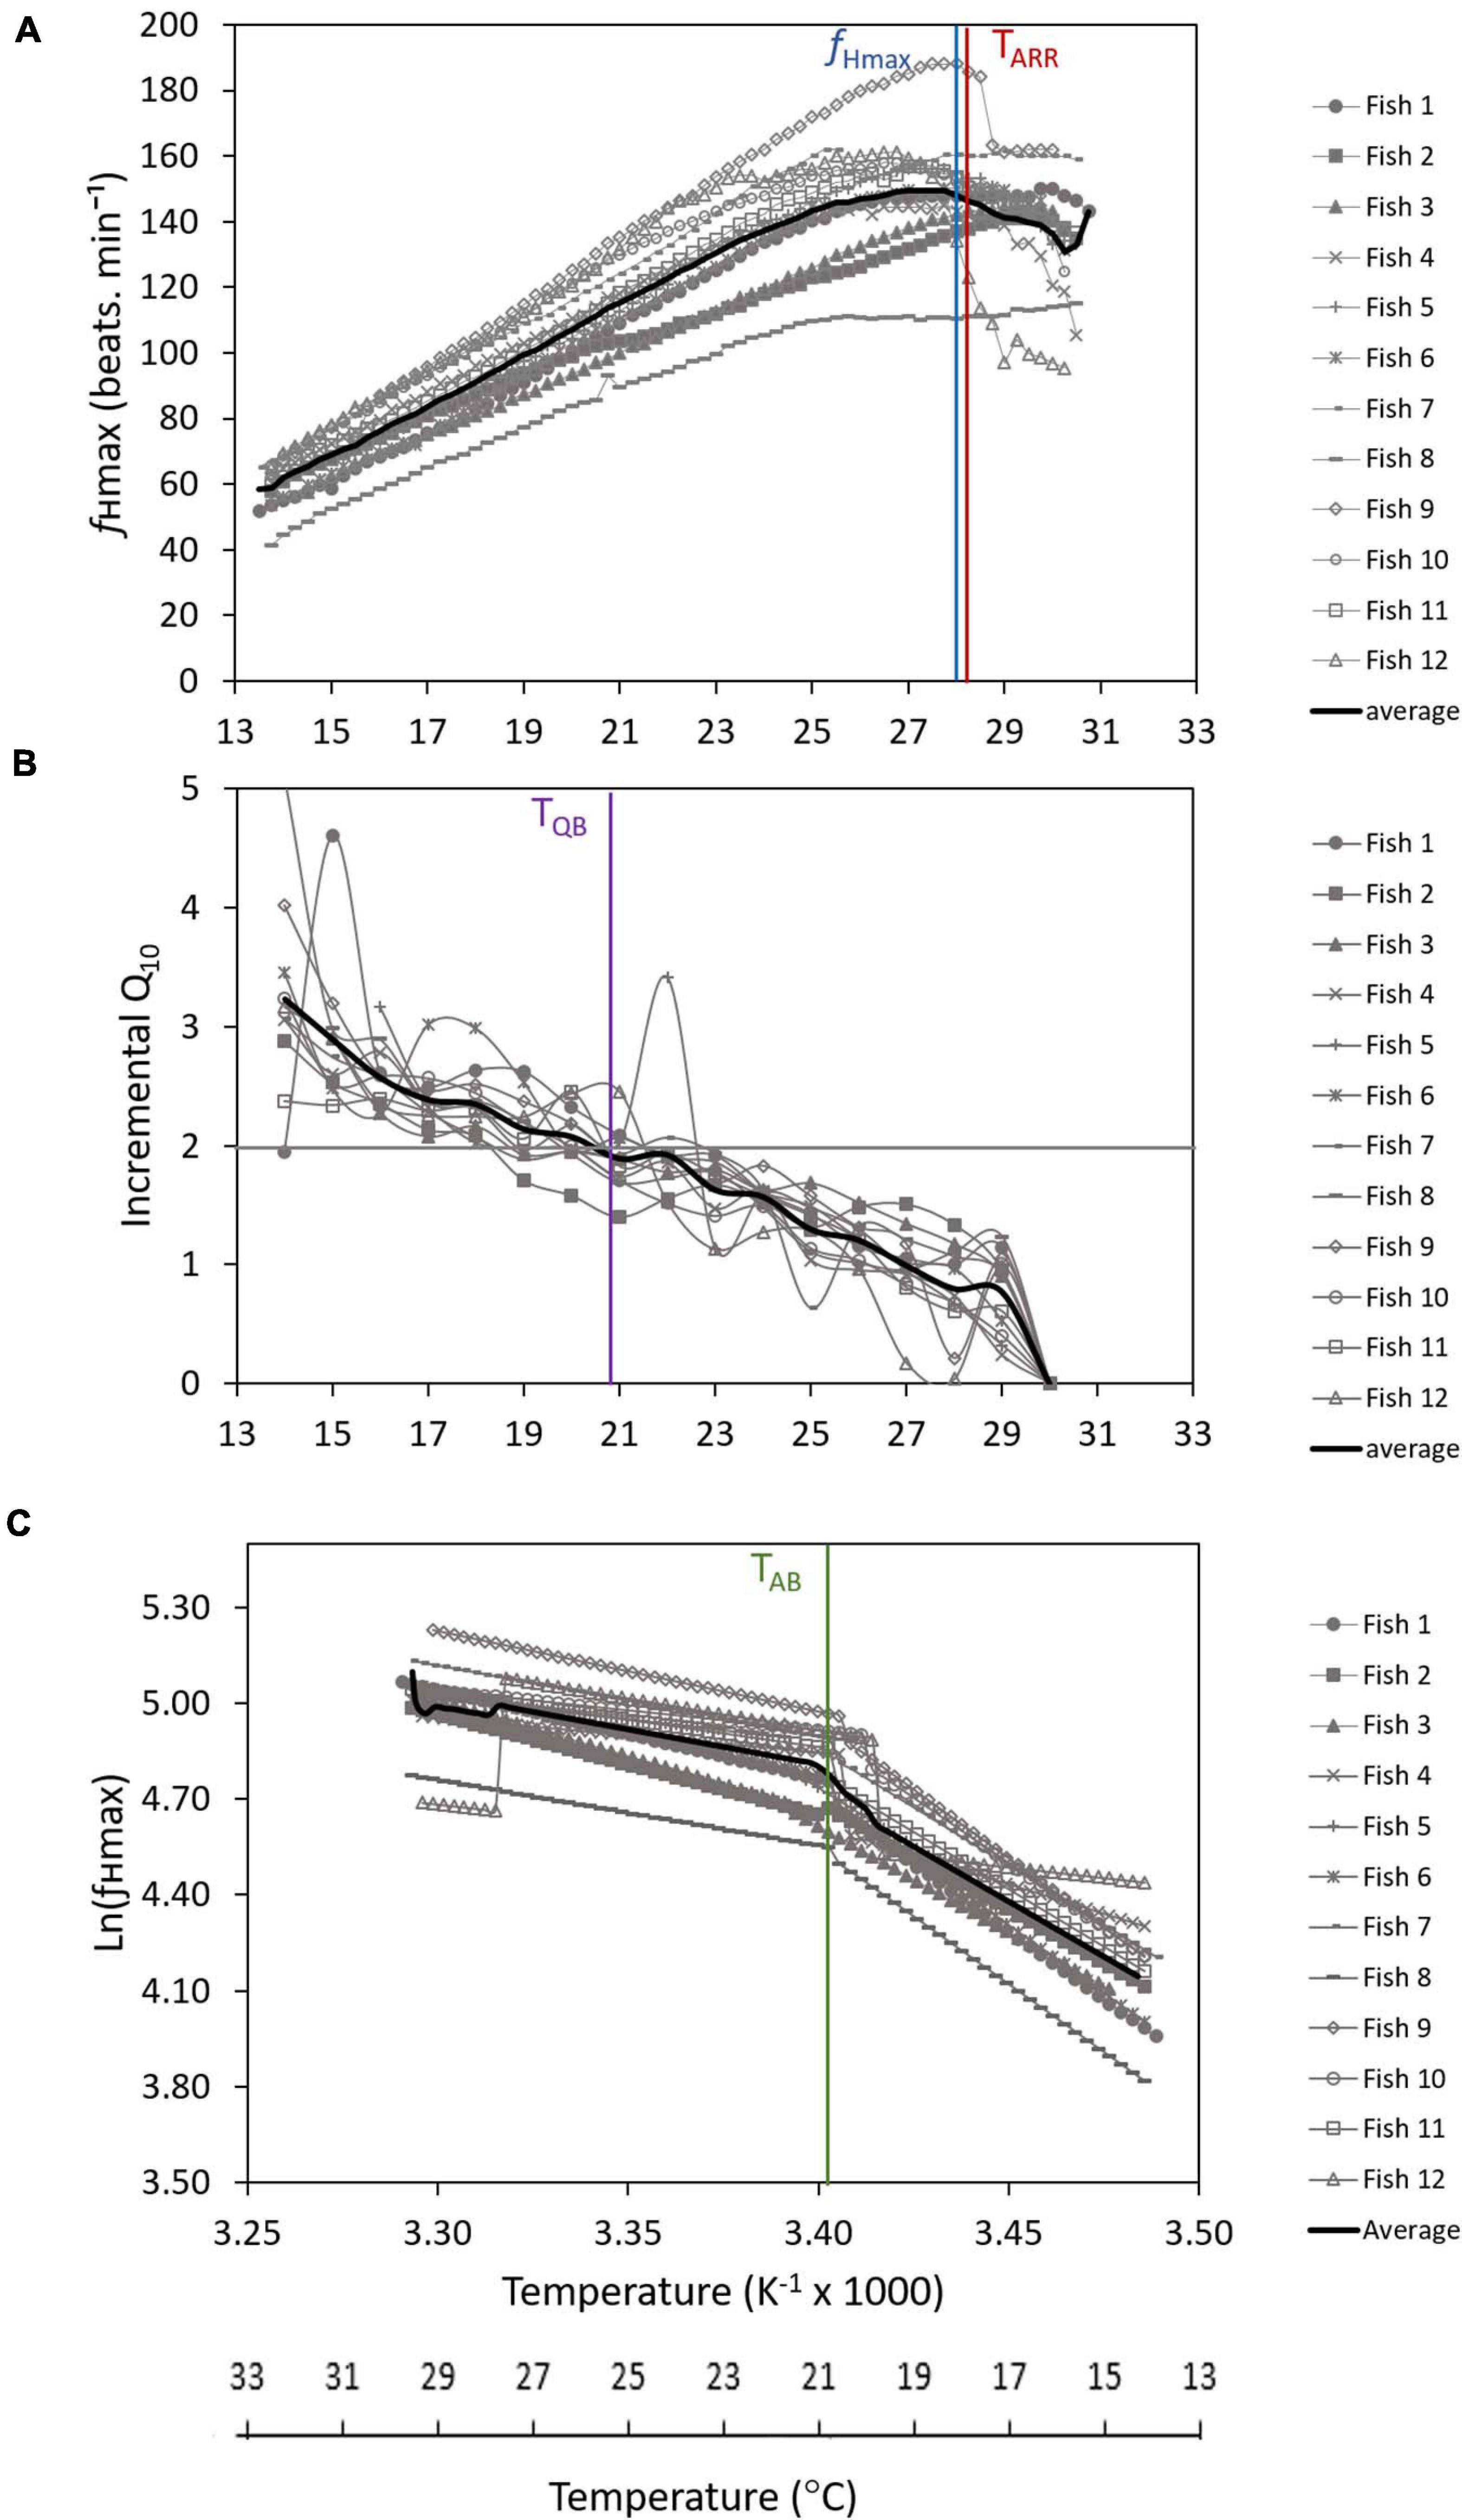
Figure 3. Maximum heart rate (fHmax) (A), incremental Q10 analysis of fHmax for 1.0°C increments (B), and Arrhenius plots of natural log of maximum heart rate [ln (fHmax)] against the inverse temperature in Kelvin (1,000 K−1) (C) of twelve adult Diplodus capensis in response to increasing water temperature from 14.0°C. The blue vertical line represents the average maximum heart rate (fHmax = 152 beats min–1 at 28.0°C). The red vertical line represents the average arrhythmic temperature (TARR = 28.3°C). The gray horizontal solid line represents the average Q10 breakpoint (Q10 < 2.0). The purple vertical line represents the incremental Q10 breakpoint temperature (TQB = 21.0°C). The green vertical line represents the average Arrhenius breakpoint temperature (TAB = 20.8°C).
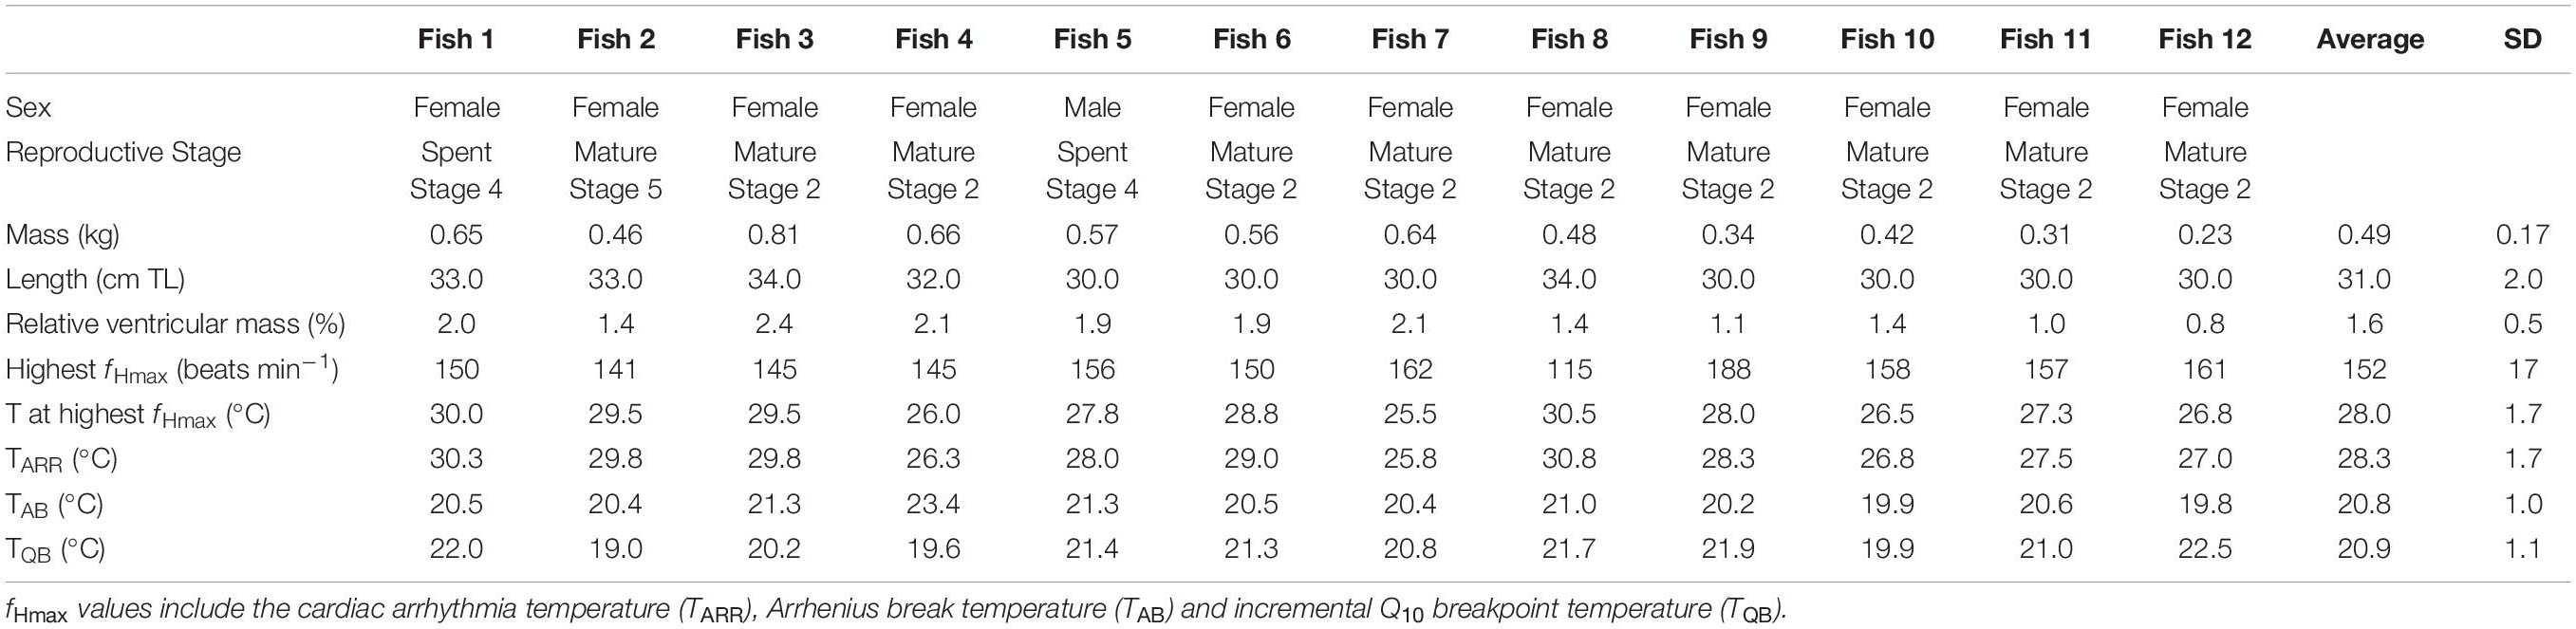
Table 1. Biological information, fHmax index values for individual blacktail, Diplodus capensis in response to acute warming.
Analysis of daily water temperatures between 2013 and 2018, showed 16 MHWs (Figure 4A and Table 2). Two MHW events (event 5 and 14) resulted in temperatures above 26.6°C, which is one standard deviation (−1.7°C SD) below adult D. capensis average TARR (28.3°C) thermal index (Figure 3A). Event 14, which occurred between 27 December 2015 and 6 January 2016 (mean intensity = 3.1°C; maximum intensity = 4.0°C above climatological mean) was the most intense summer MHW within this five-year period, when maximum temperatures reached 29.5°C exceeding adult D. capensis average TARR (28.3°C) (Figure 4A and Table 2). Five other MHW events were identified (Figure 4A and Table 2) that may also have physiologically compromised adult D. capensis, with temperatures above the TAB/TQB (22.0–26.6°C) threshold. Within the 20% of the days where daily in situ water temperatures were physiologically preferred for adult D. capensis (average TAB/TQB), three MHW events were identified (Figure 4A and Table 2). Within the 47% of the days where daily in situ water temperatures were low and below adult D. capensis physiologically preferred average TAB/TQB, six MHWs were identified, of which one occurring between 2 August and 19 August 2014 lasted 18 days, reaching maximum temperatures of 23.8°C (Figure 4A and Table 2).
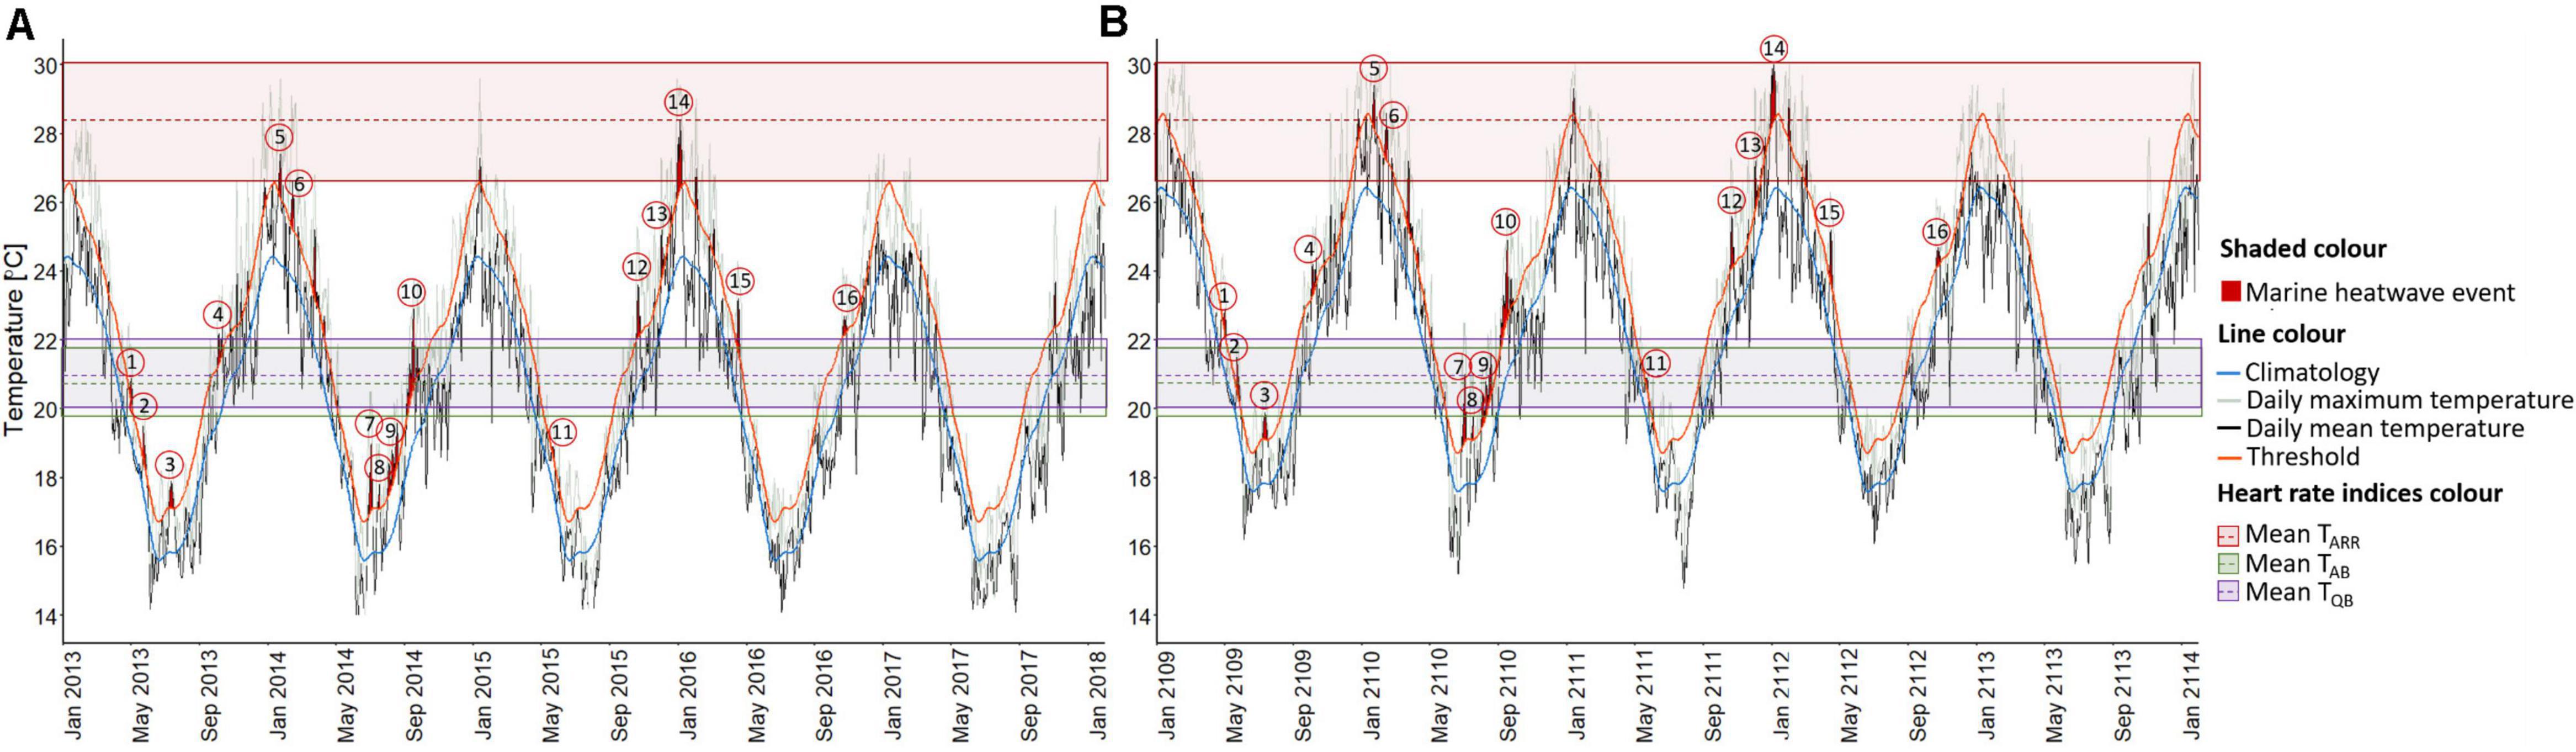
Figure 4. (A) Recent (2013–2018) and (B) predicted next century (2109–2114) daily mean (black line) and maximum (gray line) in situ water temperatures for the warm-temperate south-east coast study area indicating the identification of marine heatwave (MHW) events (red shaded areas) above the seasonally varying 90th percentile threshold (orange line) in relation to adult Diplodus capensis thermal indices (TARR, TAB, and TQB). Blue line represents the climatological mean. Red dashed horizontal line and shaded red rectangle represents the mean arrhythmic temperature and standard deviation (mean TARR ± SD = 28.3°C ± 1.7°C). Green dashed horizontal line and shaded green rectangle represents the mean Arrhenius breakpoint temperature and standard deviation (mean TAB ± SD = 20.8°C ± 1.0°C). Purple dashed horizontal line shaded purple rectangle represents the mean incremental Q10 breakpoint temperature and standard deviation (mean TQB ± SD = 21.0°C ± 1.0°C). Red circled numbers represent the event numbers of the identified MHWs. Predicted daily and maximum in situ water temperatures were calculated from recent daily and maximum in situ water temperatures by adding 2.0°C [0.2°C × 10 decades (from 2013) = 2°C in 2109; IPCC, 2014] resulting in the same MHW events being determined as the current MHW events based on the climatological mean and seasonally varying 90th percentile threshold.
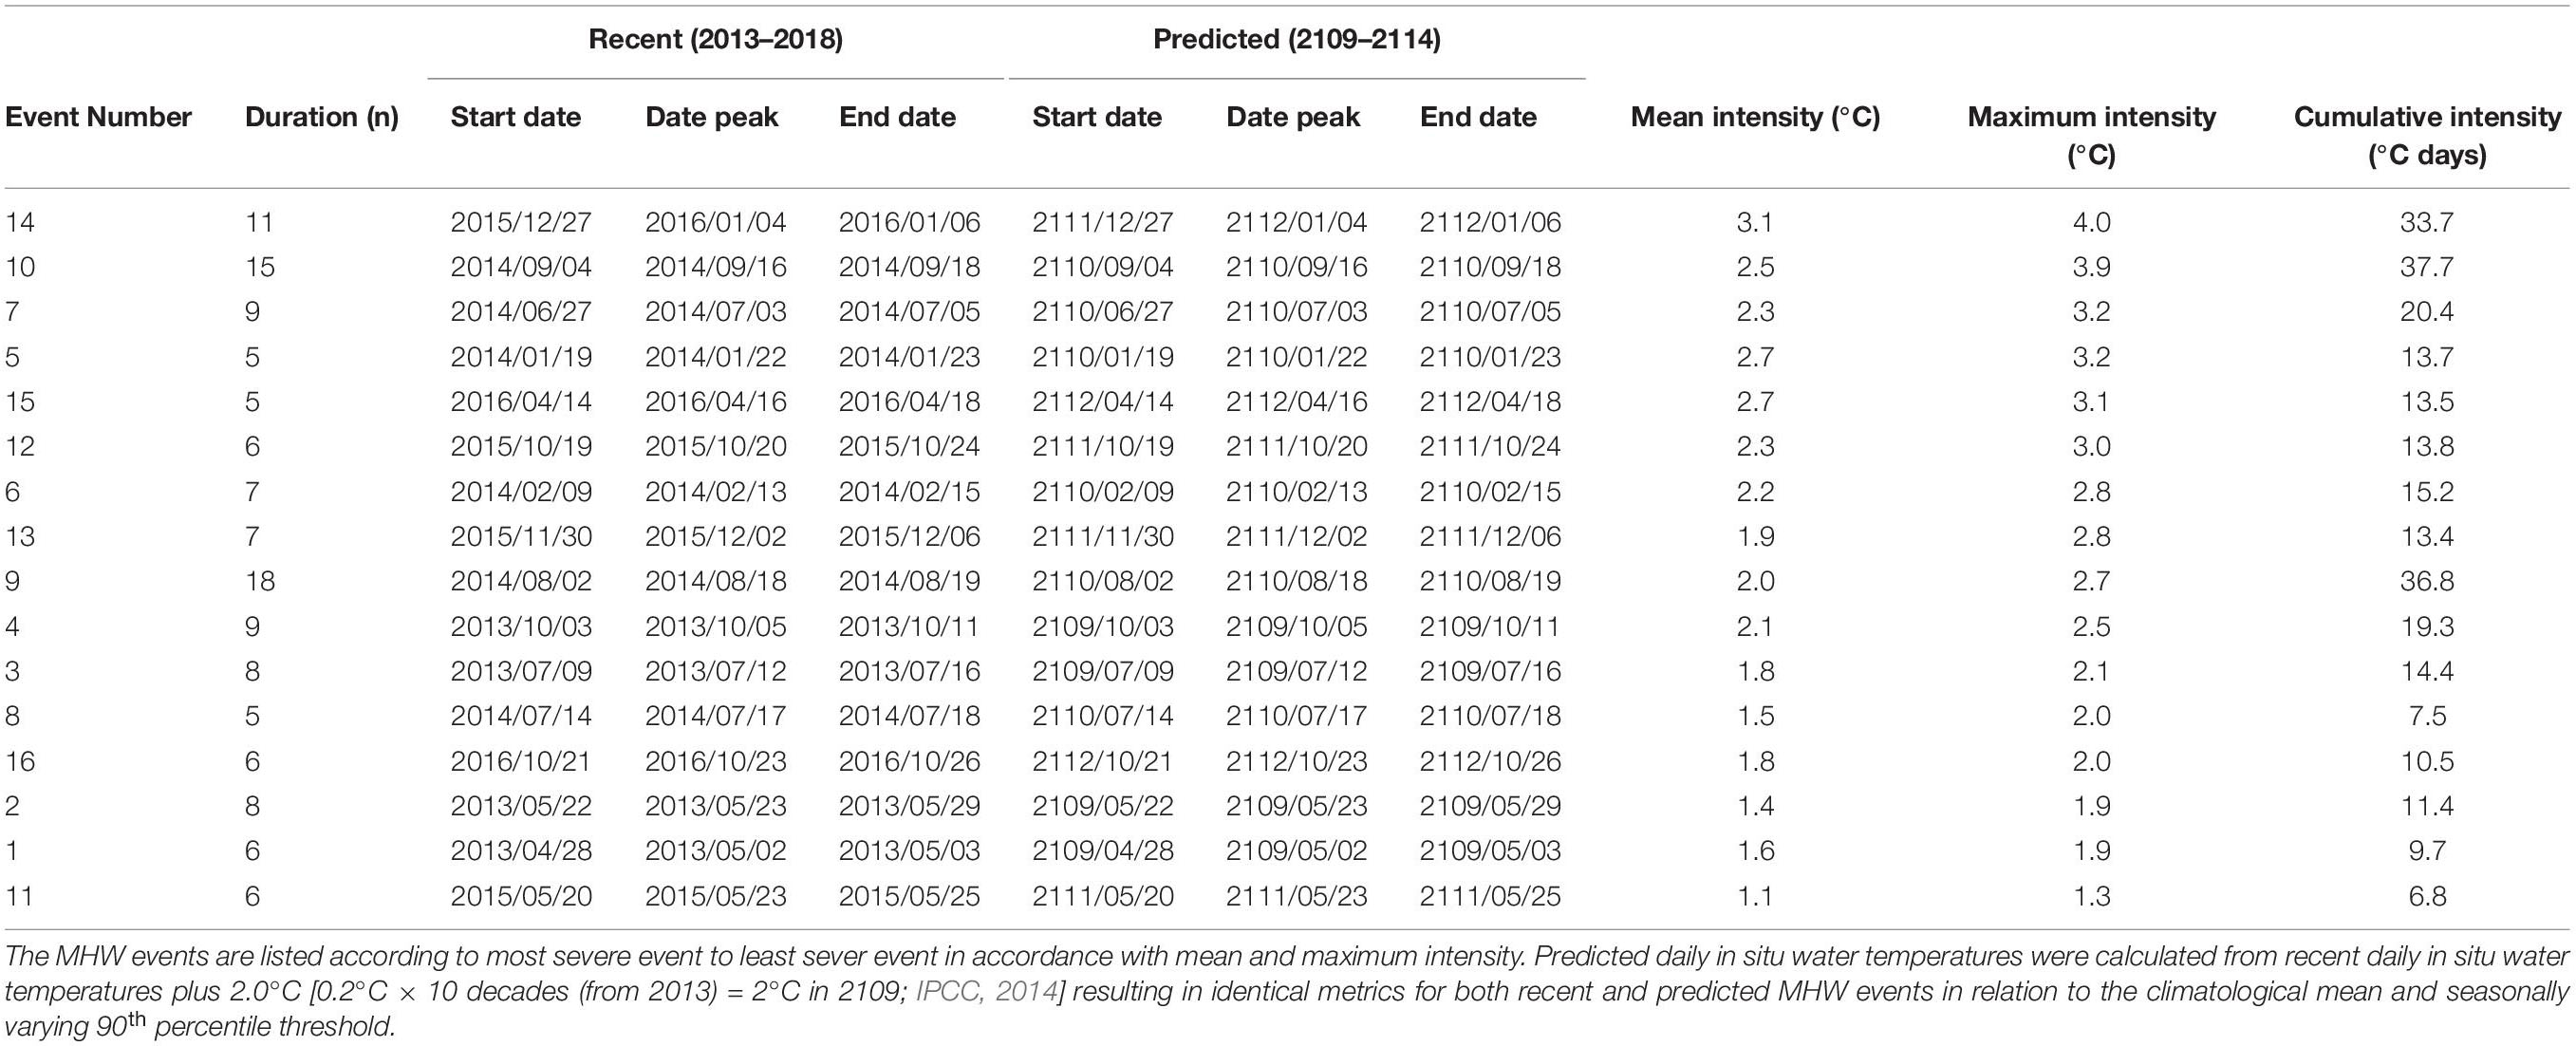
Table 2. The number, duration (time from start to end dates of MHW event, in days), peak (day within duration of MHW event with highest temperature), mean intensity (mean temperature anomaly value relative to the climatological mean during the MHW event, in °C), maximum intensity (highest temperature anomaly value relative to the climatological mean during the MHW event, in °C), and cumulative intensity (sum of daily intensity anomalies over the duration of the MHW event, in °C days) metrics for marine heatwave (MHW) events calculated from recent (2013–2108) and predicted (2109–2114) daily in situ water temperatures for the warm-temperate south-east coast study area.
Likely Climate Change Scenario
A 2.0°C increase in water temperature by the beginning of the next century shifts the number of MHWs into different thermal thresholds (TAB, TQB, and TARR). Four of the MHW events occur within adult D. capensis TARR threshold (26.6–30.0°C), with maximum temperatures reaching 30.1°C, exceeding its average TARR (28.3°C). Six MHW events are above the TAB/TQB threshold (22.0–26.6°C), and four within the physiologically preferred TAB/TQB threshold (19.8–22.0°C) for adult D. capensis (Figure 4B). Only two MHW events are below the physiologically preferred TAB/TQB threshold for adult D. capensis (Figure 4B).
Mean summer in situ water temperatures recorded between 1972 and 2012 throughout the current distribution of D. capensis increase from 11.0°C at Cape Point to 27.0°C in northern KwaZulu-Natal (Figure 1A). Mean summer temperatures currently do not exceed the estimated average TARR thermal index (28.3°C) for adult D. capensis. If mean summer temperatures increase by 2.0°C by the beginning of the next century (2100), they will be above the estimated average TARR thermal index in northern KwaZulu-Natal, possibly resulting in a contraction of the distribution range of the species (Figure 1B).
Discussion
We found that the occasional, recent summer MHWs already exceeds the thermal limits for cardiac function in adult D. capensis along the south-east coast of South Africa. As the frequency and intensity of these events is predicted to intensify in the future, summer MHWs may be increasingly detrimental to the physiological functioning, performance and overall survival of adult D. capensis. Increases in mean summer water temperatures may also result in a contraction in the overall distribution of this species as mean summer temperatures may exceed the average TARR thermal index in tropical northern KwaZulu-Natal (Figure 1).
The fHmax thermal indices for adult D. capensis were consistent among individuals, with the estimated TARR being 6.0–7.4°C higher than TAB (p = <0.05) and 6.8–8.3°C higher than TQB (p = <0.05), with a 0.8–0.9°C difference between TAB and TQB (p = >0.05). The difference between the TARR and TAB (5.1°C) and between the TAB and TQB (0.84°C) for another South African adult endemic sparid, the red roman Chrysoblephus laticeps (TAB = 18.7–20.1°C, TARR = 23.8–25.2°C; TQB = 17.1–20.7°C) (Skeeles et al., 2020), were smaller than D. capensis and may explain their different distribution patterns. Chrysoblephus laticeps is primarily distributed in the warm-temperate and cool-temperate biogeographical regions of South Africa (Skeeles et al., 2020), whereas D. capensis is primarily distributed in the warm-temperate and subtropical regions. Adult C. laticeps is also found in deeper waters (0–100 m; Götz et al., 2008) than D. capensis (0–40 m; Mann, 1992), where temperatures are likely to be less variable and cooler.
The large difference between TAB and TQB with TARR, suggests that adult D. capensis can withstand relatively short-term water temperature increases which are characteristic of eurythermic species (Sidhu et al., 2014). Even though this window is relatively wide, the impacts of long-term increases in water temperature beyond TAB is uncertain. Since the metabolic Q10 effect of warming on tissue oxygen demand is > 2.0 (i.e., no significant difference between TAB and TQB) however, it is likely that cardiac failure may begin at a temperature well below the temperature that triggers TARR, making the margins functionally narrower than observed (Sidhu et al., 2014). This narrow functional thermal margin may explain why adult D. capensis do not spawn at temperatures higher than 20.0°C (Potts et al., 2014), which further coincides with the mean TAB value of 20.8°C for this study.
We acknowledge that our fHmax thermal indices results and methodology is entirely based on anaesthetized fish (also see Skeeles et al., 2020). Anaesthetics can influence heart rate and, therefore, the accuracy of the TAB thermal index (see Casselman et al., 2012). Anaesthetizing fish, however, can endogenously stimulate fHmax for a given temperature under standardized conditions which is quite difficult when a fish is actively swimming (Skeeles et al., 2020). Nevertheless, future studies should include free-swimming individuals with surgically implanted heart rate loggers not under the influence of anaesthetics within a swim-tunnel exposed to various acute increases in temperature (different heating rates) as a comparison. Swimming activity will induce fHmax and a further cardiac comparison can be made with D. capensis at resting heart rate. This will provide a better understanding of D. capensis real-world cardiac physiological response to contemporary and predicted MHWs and temperature variability. The TARR thermal index, furthermore, in this study was also an estimate and may not be a true representation of the actual TARR (see Gilbert, 2020). This is owing to the difficulties in keeping ECG trace on for the entire duration of the experimental trials as the heart rate loggers battery life will become depleted.
A recent analysis of inshore (in situ) and offshore (optimally interpolated SST—OISST; Reynolds et al., 2007) temperature data spanning a 21-year time series (in situ—40 years, OIST—33 years) indicated that MHWs along the warm-temperate region are more intense and longer in duration than those along the cool-temperate and subtropical regions of South Africa (Schlegel et al., 2017). In this study, within a recent five-year period (2013–2018), 16 MHWs were identified using in situ daily mean water temperatures in the study area, with the hottest MHW attaining 28.4°C, occurring at the same time as the strong El Niño event of 2015/2016 in the northern and tropical Indian Oceans (Gupta et al., 2020), and the longest MHW lasting 18 days (Table 2). These events exceed the maximum mean water temperature, duration and count (25.0°C for 10 days; mean event count of 1.5 ± 1.8 SD) of events recorded within the same region (Schlegel et al., 2017). This, however, could be an artefact of using a longer time series of temperature data over 30 years compared to 5 years for the climatological mean. The average TARR thermal index of 28.3°C was also exceeded during this study. This indicates that adult D. capensis in the study area may already be vulnerable and physiologically impaired as a result of an increase in the intensity and frequency of MHWs in this study area.
In order to mitigate physiological impairments or avoid thermal stress, adult D. capensis may also seek spatial thermal refuge by moving to more favorable conditions (cooler or deeper waters), in their highly heterogeneous thermal environment. Signs of this behavioral thermoregulatory strategy have been demonstrated in other species using acoustic telemetry, where fish move into nearshore shallow tidal creeks on an incoming tide and to deeper cooler waters on the outgoing tide, potentially using these deeper areas as a thermal refuge to avoid extreme warm temperatures (Murchie et al., 2013). Acoustic telemetry studies on adult D. capensis with coded sensor tags and a thermal sensor array would be a useful way to understand if fish actively avoid high temperatures by seeking cooler or deeper waters.
Although the addition of 2.0°C to the five-year daily temperature series provides a rough prediction of future ocean temperatures, it does offer a sense of expected physiological stress across the distribution of adult D. capensis. Based on this prediction, it appears that extreme summer water temperatures (26.8–30.0 °C) may occur 6% more of the days, shifting further into the physiological “danger zone” (mean TARR = 28.3°C), with daily maximum temperatures of up to 30.0°C occurring. These findings suggest that if adult D. capensis average TARR is fixed (hard-upper cardiac limit to thermal tolerance; Morgan et al., 2021), they may not survive this scenario, as water temperatures extend beyond the average TARR. Furthermore, they may not be able to adapt in pace with climate warming, suggesting low potential for evolutionary rescue (Doyle et al., 2011; Klerks et al., 2019; Leeuwis et al., 2021). Adult D. capensis may therefore be living at the edge of their upper thermal cardiac limits, with temperature peaks that exceed physiological limits and could cause hypoxia (Leeuwis et al., 2021) resulting in high mortality (Deutsch et al., 2008; Huey et al., 2012; Genin et al., 2020).
When compared with adults, juvenile D. capensis from the same study region had a wider thermal window and higher mean CTmax end-point of 35.0°C in summer (van der Walt et al., 2021). This suggests that juvenile D. capensis may be more eurythermic and less vulnerable to predicted increases in MHW events compared to their adult counterparts. This may be attributed to the general patterns of increasing thermal sensitivity with body size—larger (older) fish being more thermally sensitive than smaller (younger) fish (Pörtner et al., 2008; Pörtner and Peck, 2010; Dahlke et al., 2020), and may explain why juveniles are able to inhabit highly thermally variable environments such as intertidal pools and estuaries.
In the case of the warm-temperate south-east coast of South Africa, temperature variability is likely to increase (Duncan et al., 2019; van der Walt et al., 2021). An increase in the intensity and frequency of upwelling events, which has contributed to the intensification of temperature variability, has already been recorded along the South African south coast (Duncan et al., 2019). Extreme variability in temperatures is often lethal to fish. A recent regionally extensive MHW event, with high temperatures of 24.0–26.0°C occurring for a number of days, followed by an upwelling event, with temperatures rapidly decreasing to as low as 10°C was recorded along the South African east coast at the end of summer 2021. The South African “ibhloko” (isiXhosa term for “blob”) resulted in extensive fish and invertebrate kills, with numerous species including D. capensis affected (Dayimani, 2021; Department of Environment, Forestry and Fisheries, 2021). Similar events have resulted in fish mortality along the warm-temperate south-east coast, with Hanekom et al. (1989) documenting fish kills, including D. capensis, between 10 January 1984 and March 1989. With predicted increased climate warming and temperature variability in this region, these events could occur more frequently and result in greater numbers of fish kills.
The findings of this study indicate that the suitable thermal habitat for adult D. capensis along the tropical edge of their distribution (in the northern KwaZulu Natal) may be lost if mean summer temperatures increase by 2°C at the beginning of 2100 (Figure 1B). Range contractions such as this may effectively reduce population sizes and even cause population declines (Neuheimer et al., 2011; Wernberg et al., 2011; Smale and Wernberg, 2013; Deutsch et al., 2015). Poleward expansions of Diplodus populations in response to ocean warming have already been observed for D. bellotti from its endemic origin (Senegal to Cape Blanco in Mauritania) in the West African upwelling region to the Atlantic coast of the Iberian Peninsula (Robalo et al., 2020). A poleward range expansion and an equatorward range contraction was also predicted for D. capensis in the Angola Benguela Frontal Zone (Potts et al., 2014). The mechanism for the D. capensis range contraction along the west coast of southern Africa, however, was thought to be driven by changes in reproductive scope, which in turn may have been influenced by adult thermal physiology. When considered together with the findings of this study, it appears that species belonging to the genus Diplodus are susceptible to ocean warming, particularly at their warm water limit and are likely to shift their distributions in future ocean conditions. This may have major implications for the coastal fisheries that rely on these species as demonstrated by Smale et al. (2019) investigating the predicted global effects MHWs have on ecological goods and services.
Conclusion
Collectively, the fHmax thermal indices recorded during this study suggest that when summer in situ daily water temperatures exceed 21.0°C (mean TAB/TQB), adult D. capensis may be physiologically compromised up to an estimated cardiac collapse at 28.3°C (average TARR index). The number of contemporary MHW events were surprisingly high, with maximum temperatures experienced during the hottest MHW event equal to adult D. capensis average TARR thermal index, suggesting that they may already be physiologically vulnerable. Predicted increases in the frequency and intensity of MHWs in this region may ultimately further compromise adult D. capensis by lowering its survival as temperatures exceed the fixed TARR threshold, narrowing their thermal window for acclimation as well as adaptation. Finally, predicted increases in mean summer temperatures beyond 28.3°C at the northern edge of this species range may result in range contraction.
Data Availability Statement
The datasets presented in this study can be found in an online repository. The name of the repository can be found at: Figshare, https://figshare.com/s/bf6aed8173be98286f98.
Ethics Statement
The animal study was reviewed and approved by Rhodes University Ethics Committee (DIFS van der Walt 2017) and the South African Institute for Aquatic Biodiversity Ethics Committee (SAIAB REF#2016/02).
Author Contributions
K-AVDW: investigation, methodology, project administration, formal analysis, data curation, writing—original draft, and visualization. WP: supervision, resources, writing—review and editing, and funding acquisition. FP: supervision and writing—review and editing. AW: investigation, methodology, visualization, and writing—review and editing. MD: formal analysis and writing—review and editing. MS: investigation, methodology, formal analysis, and writing—review and editing. NJ: supervision, resources, writing—review and editing, funding acquisition, and conceptualization. All authors contributed to the article and approved the submitted version.
Funding
Research funding for this work was supported by the National Research Foundation (NRF) Research Development Grants for y-rated researchers (UID: 93382). K-AVDW was funded by a NRF Innovation Doctoral Scholarship (UID: 95092) and a NRF Extension Doctoral Scholarship (UID: 111071).
Conflict of Interest
The authors declare that the research was conducted in the absence of any commercial or financial relationships that could be construed as a potential conflict of interest.
The reviewer SD declared a past co-authorship with one of the authors NJ to the handling Editor.
Acknowledgments
We thank Amber Childs, Matt van Zyl, Nick Schmidt, Seshnee Reddy, Brett Pringle, Ryan Foster, and Martinus Scheepers for assistance in animal collection and experimentation. We also thank the Rock and Surf Super Pro League (RASSPL) for assisting in animal collection. We hereby acknowledge the support provided by the South African Institute for Aquatic Biodiversity-National Research Foundation (SAIAB-NRF) of South Africa’s Institutional support system and Rhodes University through the use of infrastructure and equipment provided by the Aquatic Ecophysiology Research Platform (AERP) laboratory. We also acknowledge the use of temperature data provided by the Algoa Bay Sentinel Site for LTER of the NRF-SAEON, supported by the Shallow Marine and Coastal Research Infrastructure (SMCRI) initiative of the Department of Science and Innovation (DSI) of South Africa.
Supplementary Material
The Supplementary Material for this article can be found online at: https://www.frontiersin.org/articles/10.3389/fmars.2021.702463/full#supplementary-material
Footnotes
References
Abram, P. K., Boivin, G., Moiroux, J., and Brodeur, J. (2017). Behavioural effects of temperature on ectothermic animals: unifying thermal physiology and behavioural plasticity. Biol. Rev. 92, 1859–1876. doi: 10.1111/brv.12312
Anttila, K., Casselman, M. T., Schulte, P. M., and Farrell, A. P. (2013). Optimum temperature in juvenile salmonids: connecting subcellular indicators to tissue function and whole-organism thermal optimum. Physiol. Biochem. Zool. 86, 245–256. doi: 10.1086/669265
Anttila, K., Couturier, C. S., Øverli, Ø, Johnsen, A., Marthinsen, G., Nilsson, G. E., et al. (2014). Atlantic salmon show capability for cardiac acclimation to warm temperatures. Nat. Commun. 5:4252. doi: 10.1038/ncomms5252
Casselman, M. T., Anttila, K., and Farrell, A. P. (2012). Using maximum heart rate as a rapid screening tool to determine optimum temperature for aerobic scope in Pacific salmon Oncorhynchus spp. J. Fish. Biol. 80, 358–377. doi: 10.1111/j.1095-8649.2011.03182.x
Chen, Z., Snow, M., Lawrence, C. S., Church, A. R., Narum, S. R., Devlin, R. H., et al. (2015). Selection for upper thermal tolerance in rainbow trout (Oncorhynchus mykiss Walbaum). J. Exp. Biol. 218, 803–812. doi: 10.1242/jeb.113993
Cooke, S. J., Schreer, J. F., Wahl, D. H., and Philipp, D. P. (2010). Cardiovascular performance of six species of field-acclimatized centrarchid sunfish during the parental care period. J. Exp. Biol. 213, 2332–2342. doi: 10.1242/jeb.030601
Dahlke, F. T., Wohlrab, S., Butzin, M., and Pörtner, H.-O. (2020). Thermal bottlenecks in the life cycle define climate vulnerability of fish. Science 369, 65–70. doi: 10.1126/science.aaz3658
Dayimani, M. (2021). Rare Fish Wash Up Along Eastern Cape Beaches After Sea Temperatures Plummet. News24, South Africa, March. Available online at: https://www.news24.com/news24/southafrica/news/see-rare-fish-wash-up-along-eastern-cape-beaches-after-sea-temperatures-plummet-20210309 (accessed March 16, 2021).
Department of Environment, Forestry and Fisheries (2021). East Coast Marine Heatwave and Large Fish and Shellfish Washout. Available online at: https://www.environment.gov.za/mediarelease/heatwaveandfishwalkout_eastcoastmarine (accessed March 16, 2021).
Deutsch, C., Ferrel, A., Seibel, B., Ho, P., and Huey, R. B. (2015). Climate change tightens a metabolic constraint on marine habitats. Science 348, 1132–1135. doi: 10.1126/science.aaa1605
Deutsch, C. A., Tewksbury, J. J., Huey, R. B., Sheldon, K. S., Ghalambor, C. K., Haak, D. C., et al. (2008). Impacts of climate warming on terrestrial ectotherms across latitude. Proc. Natl. Acad. Sci. U.S.A. 105, 6668–6672. doi: 10.1073/pnas.0709472105
Doney, S. C., Ruckelshaus, M., Emmett Duffy, J., Barry, J. P., Chan, F., English, C. A., et al. (2012). Climate change impacts on marine ecosystems. Ann. Rev. Mar Sci. 4, 11–37. doi: 10.1146/annurev-marine-041911-111611
Doyle, C. M., Leberg, P. L., and Klerks, P. L. (2011). Heritability of heat tolerance in a small livebearing fish, Heterandria formosa. Ecotoxicology 20, 535–542. doi: 10.1007/s10646-011-0624-2
Drost, H. E., Carmack, E. C., and Farrell, A. P. (2014). Upper thermal limits of cardiac function for Arctic cod Boreogadus saida, a key food web fish species in the Arctic Ocean. J. Fish Biol. 84, 1781–1792. doi: 10.1111/jfb.12397
Duncan, M. I., Bates, A. E., James, N. C., and Potts, W. M. (2019). Exploitation may influence the climate resilience of fish populations through removing high performance metabolic phenotypes. Sci. Rep. 9:11437. doi: 10.1038/s41598-019-47395-y
Ekström, A., Gräns, A., and Sandblom, E. (2019). Can’t beat the heat? Importance of cardiac control and coronary perfusion for heat tolerance in rainbow trout. J. Comp. Physiol. B 189, 757–769. doi: 10.1007/s00360-019-01243-7
Eliason, E. J., and Anttila, K. (2017). “Temperature and the cardiovascular system,” in Fish Physiology, eds A. K. Gamperl, T. E. Gills, A. P. Farrell, and C. J. Brauner (London: Academic Press), 235–297. doi: 10.1016/bs.fp.2017.09.003
Eliason, E. J., Clark, T. D., Hague, M. J., Hanson, L. M., Gallagher, Z. S., Jeffries, K. M., et al. (2011). Differences in thermal tolerance among sockeye salmon populations. Science 332, 109–112. doi: 10.1126/science.1199158
Eliason, E. J., Clark, T. D., Hinch, S. G., and Farrell, A. P. (2013). Cardiorespiratory performance and blood chemistry during swimming and recovery in three populations of elite swimmers: adult sockeye salmon. Comp. Biochem. Physiol. A Mol. Integr. Physiol. 166, 385–397. doi: 10.1016/j.cbpa.2013.07.020
Farrell, A. P. (2009). Environment, antecedents and climate change: lessons from the study of temperature physiology and river migration of salmonids. J. Exp. Biol. 212, 3771–3780. doi: 10.1242/jeb.023671
Ferreira, E. O., Anttila, K., and Farrell, A. P. (2014). Thermal optima and tolerance in the eurythermic goldfish (Carassius auratus): relationships between whole-animal aerobic capacity and maximum heart rate. Physiol. Biochem. Zool. 87, 599–611. doi: 10.1086/677317
Fey, S. B., Siepielski, A. M., Nussle, S., Cervantes-Yoshida, K., Hwan, J. L., Huber, E. R., et al. (2015). Recent shifts in the occurrence, cause, and magnitude of animal mass mortality events. Proc. Natl. Acad. Sci. U.S.A. 112, 1083–1088. doi: 10.1073/pnas.1414894112
Fricke, R., Golani, D., and Appelbaum-golani, B. (2016). Diplodus levantinus (Teleostei: Sparidae), a new species of sea bream from the southeastern Mediterranean Sea of Israel, with a checklist and a key to the species of the Diplodus sargus species group. Sci. Mar. 80, 305–320. doi: 10.3989/scimar.04414.22B
Genin, A., Levy, L., Sharon, G., Raitsos, D. E., and Diamant, A. (2020). Rapid onsets of warming events trigger mass mortality of coral reef fish. Proc. Natl. Acad. Sci. U.S.A. 117, 25378–25385. doi: 10.1073/pnas.2009748117
Gilbert, M. J. H. (2020). Thermal Limits to the Cardiorespiratory Performance of Arctic Char (Salvelinus alpinus) in a Rapidly Warming North. Ph.D. thesis. Vancouver, VBC: University of British Columbia.
Götz, A., Kerwath, S. E., Attwood, C. G., and Sauer, W. H. H. (2008). Effects of fishing on population structure and life history of roman Chrysoblephus laticeps (Sparidae). Mar. Ecol. Prog. Ser. 362, 245–259. doi: 10.3354/meps07410
Gupta, A. S., Thomsen, M., Benthuysen, J. A., Hobday, A. J., Oliver, E., Alexander, L. V., et al. (2020). Drivers and impacts of the most extreme marine heatwave events. Sci. Rep. 10:19359. doi: 10.1038/s41598-020-75445-3
Hanekom, N., Hutchings, L., Joubert, P. A., and Van Der Byl, P. C. N. (1989). Sea temperature variations in the Tsitsikamma coastal National Park, South Africa, with notes on the effect of cold conditions on some fish populations. South Afr. J. Mar. Sci. 8, 145–153. doi: 10.2989/02577618909504557
Hansen, A. K., Byriel, D. B., Jensen, M. R., Steffensen, J. F., and Svendsen, M. B. S. (2017). Optimum temperature of a northern population of Arctic charr (Salvelinus alpinus) using heart rate Arrhenius breakpoint analysis. Polar Biol. 40, 1063–1070. doi: 10.1007/s00300-016-2033-8
Hobday, A. J., Alexander, L. V., Perkins, S. E., Smale, D. A., Straub, S. C., Oliver, E. C. J., et al. (2016). A hierarchical approach to defining marine heatwaves. Prog. Oceanogr. 141, 227–238. doi: 10.1016/j.pocean.2015.12.014
Huey, R. B., Kearney, M. R., Krockenberger, A., Holtum, J. A. M., Jess, M., and Williams, S. E. (2012). Predicting organismal vulnerability to climate warming: roles of behaviour, physiology and adaptation. Philos. Trans. R. Soc. Lond. B Biol. Sci. 367, 1665–1679. doi: 10.1098/rstb.2012.0005
IPCC (2014). Summary for Policymakers. Cambridge: Cambridge University Press doi: 10.1017/CBO9781107415324
Kemp, J. O. G. (2009). Effects of temperature and salinity on resting metabolism in two South African rock pool fish: the resident gobiid Caffrogobius caffer and the transient sparid Diplodus sargus capensis. Afr. Zool. 44, 151–158. doi: 10.1080/15627020.2009.11407449
Klerks, P. L., Athrey, G. N., and Leberg, P. L. (2019). Response to selection for increased heat tolerance in a small fish species, with the response decreased by a population bottleneck. Front. Ecol. Evol. 7:270. doi: 10.3389/fevo.2019.00270
Leeuwis, R. H. J., Zanuzzo, F. S., Peroni, E. F. C., and Gamperl, A. K. (2021). Research on sablefish (Anoplopoma fimbria) suggests that limited capacity to increase heart function leaves hypoxic fish susceptible to heatwaves. Proc. Biol. Sci. 288:20202340. doi: 10.1098/rspb.2020.2340
Lefevre, S. (2016). Are global warming and ocean acidification conspiring against marine ectotherms? A meta-analysis of the respiratory effects of elevated temperature, high CO2 and their interaction. Conserv. Physiol. 4:cow009. doi: 10.1093/conphys/cow009
Lutjeharms, J. R. E. (2007). Three decades of research on the greater Agulhas Current. Ocean Sci. 3, 129–147. doi: 10.5194/os-3-129-2007
Madeira, D., Narciso, L., Cabral, H. N., and Vinagre, C. (2012). Thermal tolerance and potential impacts of climate change on coastal and estuarine organisms. J. Sea Res. 70, 32–41. doi: 10.1016/j.seares.2012.03.002
Madeira, D., Narciso, L., Cabral, H. N., Vinagre, C., and Diniz, M. S. (2013). Influence of temperature in thermal and oxidative stress responses in estuarine fish. Comp. Biochem. Physiol. A Mol. Integr. Physiol. 166, 237–243. doi: 10.1016/j.cbpa.2013.06.008
Mann, B. Q. (1992). Aspects of the Biology of Two Inshore Sparid Fishes (Diplodus Sargus Capensis and Diplodus Cervinus Hottentotus) Off The South-East Coast of South Africa. Ph.D. thesis. Grahamstown: Rhodes University.
Maree, R. C., Whitfield, A. K., and Booth, A. J. (2000). Effect of water temperature on the biogeography of South African estuarine fishes associated with the subtropical/warm temperate subtraction zone. South Afr. J. Sci. 96, 184–188.
Morgan, R., Finnøen, M. H., Jensen, H., Pélabon, C., and Jutfelt, F. (2021). Low potential for evolutionary rescue from climate change in a tropical fish. Proc. Natl. Acad. Sci. U.S.A. 117, 33365–33372. doi: 10.1073/PNAS.2011419117
Muller, C., Childs, A., Duncan, M. I., Skeeles, M. R., James, N. C., van der Walt, K., et al. (2020). Implantation, orientation and validation of a commercially produced heart-rate logger for use in a perciform teleost fish. Conserv. Physiol. 8:coaa035. doi: 10.1093/conphys/coaa035
Murchie, K. J., Cooke, S. J., Danylchuk, A. J., Danylchuk, S. E., Goldberg, T. L., Suski, C. D., et al. (2013). Movement patterns of bonefish (Albula vulpes) in tidal creeks and coastal waters of Eleuthera, The Bahamas. Fish. Res. 147, 404–412. doi: 10.1016/j.fishres.2013.03.019
Mylonas, C. C., Cardinaletti, G., Sigelaki, I., and Polzonetti-Magni, A. (2005). Comparative efficacy of clove oil and 2-phenoxyethanol as anesthetics in the aquaculture of European sea bass (Dicentrarchus labrax) and gilthead sea bream (Sparus aurata) at different temperatures. Aquaculture 246, 467–481. doi: 10.1016/j.aquaculture.2005.02.046
Neuheimer, A. B., Thresher, R. E., Lyle, J. M., and Semmens, J. M. (2011). Tolerance limit for fish growth exceeded by warming waters. Nat. Clim. Chang. 1, 110–113. doi: 10.1038/nclimate1084
Oliver, E. C. J., Burrows, M. T., Donat, M. G., SenGupta, A., Alexander, L. V., Perkins-kirkpatrick, S. E., et al. (2019). Projected marine heatwaves in the 21st century and the potential for ecological impact. Front. Mar. Sci. 6:734. doi: 10.3389/fmars.2019.00734
Pörtner, H. O., Bock, C., Knust, R., Lannig, G., Lucassen, M., Mark, F. C., et al. (2008). Cod and climate in a latitudinal cline: physiological analyses of climate effects in marine fishes. Clim. Res. 37, 253–270. doi: 10.3354/cr00766
Pörtner, H. O., and Peck, M. A. (2010). Climate change effects on fishes and fisheries: towards a cause-and-effect understanding. J. Fish Biol. 77, 1745–1779. doi: 10.1111/j.1095-8649.2010.02783.x
Potts, W. A., Gotz, A., and James, N. C. (2015). Review of the projected impacts of climate change on coastal fishes in southern Africa. Rev. Fish Biol. Fish. 25, 603–630. doi: 10.1007/s11160-015-9399-5
Potts, W. M., Booth, A. J., Richardson, T. J., and Sauer, W. H. H. (2014). Ocean warming affects the distribution and abundance of resident fishes by changing their reproductive scope. Rev. Fish Biol. Fish. 24, 493–504. doi: 10.1007/s11160-013-9329-3
Reynolds, R. W., Smith, T. M., Liu, C., Chelton, D. B., Casey, K. S., and Schlax, M. G. (2007). Daily high-resolution-blended analyses for sea surface temperature. J. Clim. 20, 5473–5496. doi: 10.1175/2007JCLI1824.1
Richardson, T. (2010). The Taxonomy, Life-History and Population Dynamics Of Blacktail, Diplodus Capensis (Perciformes: Sparidae), in Southern Angola. Ph.D. thesis. Grahamstown: Rhodes University.
Robalo, J. I., Francisco, S. M., Vendrell, C., Lima, C. S., Pereira, A., Brunner, B. P., et al. (2020). Against all odds: a tale of marine range expansion with maintenance of extremely high genetic diversity. Sci. Rep. 10:12707. doi: 10.1038/s41598-020-69374-4
Roberts, M. J. (2005). Chokka squid (Loligo vulgaris reynaudii) abundance linked to changes in South Africa’s Agulhas Bank ecosystem during spawning and the early life cycle. ICES J. Mar. Sci. 62, 33–55. doi: 10.1016/j.icesjms.2004.10.002
Rouault, M., Pohl, B., and Penven, P. (2010). Coastal oceanic climate change and variability from 1982 to 2009 around South Africa. Afr. J. Mar. Sci. 32, 237–246. doi: 10.2989/1814232X.2010.501563
Sandblom, E., Clark, T. D., Grans, A., Ekström, A., Brijs, J., Sundstrom, L. F., et al. (2016). Physiological constraints to climate warming in fish follow principles of plastic floors and concrete ceilings. Nat. Commun. 7:11447. doi: 10.1038/ncomms11447
Schlegel, R., Oliver, E. J., Wernberg, T., and Smit, A. (2017). Coastal and offshore co-occurrences of marine heatwaves and cold-spells. Prog. Oceanogr. 151, 189–205. doi: 10.1016/j.pocean.2017.01.004
Schlegel, R., and Smit, A. J. (2018). heatwaveR: a central algorithm for the detection of heatwaves and cold-spells. J. Open Source Softw. 3:821. doi: 10.21105/joss.00821
Sidhu, R., Anttila, K., and Farrell, A. P. (2014). Upper thermal tolerance of closely related Danio species. J. Fish Biol. 84, 982–995. doi: 10.1111/jfb.12339
Sinclair, B. J., Marshall, K. E., Sewell, M. A., Levesque, D. L., Willett, C. S., Slotsbo, S., et al. (2016). Can we predict ectotherm responses to climate change using thermal performance curves and body temperatures? Ecol. Lett. 19, 1372–1385. doi: 10.1111/ele.12686
Skeeles, M. R., Winkler, A. C., Duncan, M. I., James, N. C., van der Walt, K., and Potts, W. M. (2020). The use of internal heart rate loggers in determining cardiac breakpoints of fish. J. Therm. Biol. 89:102524. doi: 10.1016/j.jtherbio.2020.102524
Smale, D. A., and Wernberg, T. (2013). Extreme climatic event drives range contraction of a habitat forming species. Proc. R. Soc. Lond. 280:20122829. doi: 10.1098/rspb.2012.2829
Smale, D. A., Wernberg, T., Oliver, E. C. J., Thomsen, M., Harvey, B. P., Straub, S. C., et al. (2019). Marine heatwaves threaten global biodiversity and the provision of ecosystem services. Nat. Clim. Chang. 9, 306–312. doi: 10.1038/s41558-019-0412-1
Smit, A. J., Roberts, M., Anderson, R. J., Dufois, F., and Dudley, S. F. J. (2013). A coastal seawater temperature dataset for biogeographical studies: large biases between in situ and remotely-sensed data sets around the coast of South Africa. PLoS One 8:e81944. doi: 10.1371/journal.pone.0081944
Smith, M. M., and Heemstra, P. C. (2012). Smith’s Sea Fishes, eds M. M. Smith and P. C. Heemstra (Berlin: Phillip Springer Science and Business Media).
Steinhausen, M. F., Sandblom, E., Eliason, E. J., Verhille, C., and Farrell, A. P. (2008). The effect of acute temperature increases on the cardiorespiratory performance of resting and swimming sockeye salmon (Oncorhynchus nerka). J. Exp. Biol. 211, 3915–3926. doi: 10.1242/jeb.019281
Stillman, J. H. (2019). Heatwaves, the new normal: summertime temperature extremes will impact animals, ecosystems, and human communities. Physiology 34, 86–100. doi: 10.1152/physiol.00040.2018
Summerfelt, R., and Smith, L. (1990). “Anesthesia, surgery, and related techniques,” in Methods for Fish Biology, eds C. Schreck and P. Moyle (Bethesda, MD: American Fisheries Society), 213–272.
van der Walt, K., Porri, F., Potts, W., Duncan, M., and James, N. (2021). Thermal tolerance, safety margins and vulnerability of coastal species: projected impact of climate change induced cold water variability in a temperate African region. Mar. Environ. Res. 169:105346. doi: 10.1016/j/marenvres.2021.105346
Keywords: ocean warming, marine heatwaves, maximum heart rate, acute warming event, Sparidae, thermal physiology
Citation: van der Walt K-A, Potts WM, Porri F, Winkler AC, Duncan MI, Skeeles MR and James NC (2021) Marine Heatwaves Exceed Cardiac Thermal Limits of Adult Sparid Fish (Diplodus capensis, Smith 1884). Front. Mar. Sci. 8:702463. doi: 10.3389/fmars.2021.702463
Received: 29 April 2021; Accepted: 03 June 2021;
Published: 29 June 2021.
Edited by:
Mansour Torfi Mozanzadeh, South Iran Aquaculture Research Center, IranReviewed by:
Sajjad Pourmozaffar, Iranian Fisheries Research Organization, IranSimon Morley, British Antarctic Survey (BAS), United Kingdom
Shaun H. P. Deyzel, Elwandle Coastal Node, South African Environmental Observation Network, South Africa
Copyright © 2021 van der Walt, Potts, Porri, Winkler, Duncan, Skeeles and James. This is an open-access article distributed under the terms of the Creative Commons Attribution License (CC BY). The use, distribution or reproduction in other forums is permitted, provided the original author(s) and the copyright owner(s) are credited and that the original publication in this journal is cited, in accordance with accepted academic practice. No use, distribution or reproduction is permitted which does not comply with these terms.
*Correspondence: Kerry-Ann van der Walt, Sy52YW5kZXJXYWx0QHNhaWFiLmFjLnph