 Dewang Li1,2,3
 Xiaobo Ni2,3,4
 Kui Wang5
 Dingyong Zeng2,3,4
 Bin Wang1,2,3
 Haiyan Jin1,2,6
 Hongliang Li1,2,3
 Feng Zhou2,3,4
 Daji Huang6
 Jianfang Chen1,2,4*
- 1Key Laboratory of Marine Ecosystem Dynamics, Ministry of Natural Resources, Hangzhou, China
- 2Second Institute of Oceanography, Ministry of Natural Resources, Hangzhou, China
- 3Observation and Research Station of Yangtze River Delta Marine Ecosystems, Ministry of Natural Resources, Zhoushan, China
- 4State Key Laboratory of Satellite Ocean Environment Dynamics, Second Institute of Oceanography, Ministry of Natural Resources, Hangzhou, China
- 5Ocean College, Zhejiang University, Zhoushan, China
- 6Key Laboratory of Tropical Marine Ecosystem and Bioresources, Fourth Institute of Oceanography, Ministry of Natural Resources, Beihai, China
The partial pressure of CO2 (pCO2) in the sea and the air-sea CO2 flux in plume waters are subject to interactions among biological production, horizontal advection, and upwelling under wind events. In this study, time series of pCO2 and other biogeochemical parameters in the dynamic Changjiang plume were presented to illuminate the controlling factors of pCO2 and the air-sea CO2 flux after a strong south wind event (July 23–24, maximum of 11.2 ms–1). The surface pCO2 decreased by 310 μatm (to 184 μatm) from July 24 to 26. Low-pCO2 waters (<200 μatm) were observed in the following 2 days. Corresponding chlorophyll a and dissolved oxygen (DO) increase, and a significant relationship between DO and npCO2 indicated that biological uptake drove the pCO2 decrease. The salinity of undersaturated-CO2 waters decreased by 3.57 (from 25.03 to 21.46) within 2 days (July 27–28), suggesting the offshore advection of plume waters in which CO2 had been biologically reduced. Four days after the wind event, the upwelling of high-CO2 waters was observed, which increased the pCO2 by 428 μatm (up to 584 μatm) within 6 days. Eight days after the onset of upwelling, the surface pCO2 started to decrease (from 661 to 346 μatm within 3 days), which was probably associated with biological production. Regarding the air-sea CO2 flux, the carbon sink of the plume was enhanced as the low-pCO2 plume waters were pushed offshore under the south winds. In its initial stage, the subsequent upwelling made the surface waters act as a carbon source to the atmosphere. However, the surface waters became a carbon sink again after a week of upwelling. Such short-term air-sea carbon fluxes driven by wind have likely occurred in other dynamic coastal waters and have probably induced significant uncertainties in flux estimations.
Introduction
The carbon cycles in shelf seas are important components of global carbon cycles. With 7% of the global ocean surface area, shelf seas take up to 0.05–0.4 Pg C a–1 (Borges et al., 2005; Cai et al., 2006; Chen et al., 2013; Dai et al., 2013; Laruelle et al., 2014), accounting for more than 10% of the global ocean carbon sink. The carbon sink is typically strong in river-dominated margins where large river plumes, such as the Changjiang plume (Zhai and Dai, 2009; Tseng et al., 2014; Guo et al., 2015), Pearl River plume (Zhai et al., 2005; Guo et al., 2009), and Amazon River plume (Ternon et al., 2000), induce significant biological uptake of carbon (Dai et al., 2013; Cao et al., 2020). Biological CO2 uptake and the air-sea CO2 flux in large river plumes have large spatial and temporal variations (Chen C.-T. A. et al., 2008; Guo et al., 2015) due to the influences of plume dynamics (Huang et al., 2013; Tseng et al., 2014), physical mixing, and the advection of water masses (Li et al., 2019), nutrient supply, temperature, etc. Wind forcing is one of the main factors impacting plume dynamics and biogeochemical cycles, as it has been revealed in field observations (Yin et al., 1997; Huang et al., 2013) and model studies (Fong and Geyer, 2001; Xuan et al., 2012; Lachkar and Gruber, 2013). However, the responses of CO2 in plume waters to wind are largely unknown.
Alongshore wind drives offshore transport via Ekman transport of surface waters, leading to the upwelling of subsurface waters. Such well-known physical processes transport carbon and nutrients horizontally and vertically. The wind-driven upwelling of acidified and hypoxic bottom waters in the Chesapeake Bay contributes to large spatial variations in the surface partial pressure of carbon dioxide (pCO2), pH, and aragonite saturation state (Li et al., 2020). In the eastern boundary of the Pacific Ocean, equatorward winds drive surface Ekman transport and the upwelling of nutrient-laden subsurface waters into the euphotic zone (Lachkar and Gruber, 2013). Such a nutrient supply stimulates phytoplankton blooms, which partially reduce CO2 in upwelling waters. In the Mississippi River plume, upwelling-favorable winds transport the low-pCO2 surface water offshore, enhancing the carbon sink (Huang et al., 2013).
Similar to the Mississippi River plume, the Changjiang plume is a strong carbon sink in summer due to intense biological production. The biological uptake of CO2 and the air-sea CO2 flux in the Changjiang plume have large temporal variations associated with episodic wind events (Li et al., 2018, 2019; Wu et al., 2020). Typhoon winds cause Changjiang plume waters to become a strong carbon source through the upward transport of high-CO2 bottom waters (Li et al., 2019) or cause the waters to become carbon sinks by in situ biological production or the advection of undersaturated-CO2 waters (Zhang et al., 2018; Wu et al., 2020). Unlike typhoons, southerly or southwesterly winds prevail in summer in the East China Sea and are associated with offshore advection and even the detachment of Changjiang plume waters (Lie et al., 2003; Xuan et al., 2012). Such plume dynamics affect the surface biological activity (Wei et al., 2017; Zhang et al., 2018) and likely also impact the air-sea carbon flux.
The offshore transport of buoyant plumes typically favors upwelling. In the outer Changjiang Estuary, upwelling is also modulated by the bottom topography and tidal mixing (Zhao, 1993; Lü et al., 2006; Hu and Wang, 2016). Cold surface waters with high surface pCO2 have been identified along the Zhejiang coast (Chou et al., 2009a) due to the upwelling of high-CO2 bottom waters. In contrast, the nutrients supplied by upwelling lead to a complex response of phytoplankton growth, which takes up CO2. To our knowledge, few studies have reported how upwelling-favorable winds influence the pCO2 of the Changjiang plume due to their transient nature.
In this study, we presented time-series buoy data in the Changjiang plume. High-temporal-resolution variations in temperature, salinity, pCO2, dissolved oxygen (DO), and chlorophyll a (Chl a) after a wind event were analyzed to illuminate the response of pCO2 to upwelling-favorable winds. The transient responses of the air-sea CO2 flux to winds during the advection period, upwelling period, and post-upwelling period of the plume were also discussed.
Materials and Methods
Buoy Deployment and Sample Measurements
The variations of sea surface temperature (SST), salinity, pCO2, DO, Chl a, and 2-m winds were obtained using a moored buoy (July 20–August 11, 2015). The buoy was deployed at a Changjiang plume site (water depth ∼45 m, 122.8°E, 30.6°N, Figure 1), which is located at the track of typhoon “Chan-Hom” (July 11, 2015). The details of the buoy observations were explained by Li et al. (2018). In brief, a mounted SAMI-CO2 sensor (Sunburst Sensors, LLC) was used to measure sea surface pCO2. This sensor has been previously used to measure pCO2 at many locations worldwide (DeGrandpre et al., 1998; Körtzinger et al., 2008; Moore et al., 2011; Moralespineda et al., 2014; Li et al., 2019). The performances of the instrument were evaluated in a laboratory before deployment. Salinity, temperature, DO, and Chl a were measured with Water Quality Monitor meters (WET Labs, currently belonging to Sea-Bird Scientific). In addition, the bottom water temperature was also measured using an RBR Maestro data logger (RBR Ltd.) mounted on a trawl-resistant bottom mount (Ni et al., 2016). The wind speeds were recorded with a Young sensor attached to the top of the buoy (∼2 m above the sea surface). We also collected wind direction data from the NCEP/NCAR reanalysis 10-m wind dataset (124°E, 31.3°N). All sensors collected data every 15 min, except for the pCO2 sensor, which collected data at 30-min intervals.
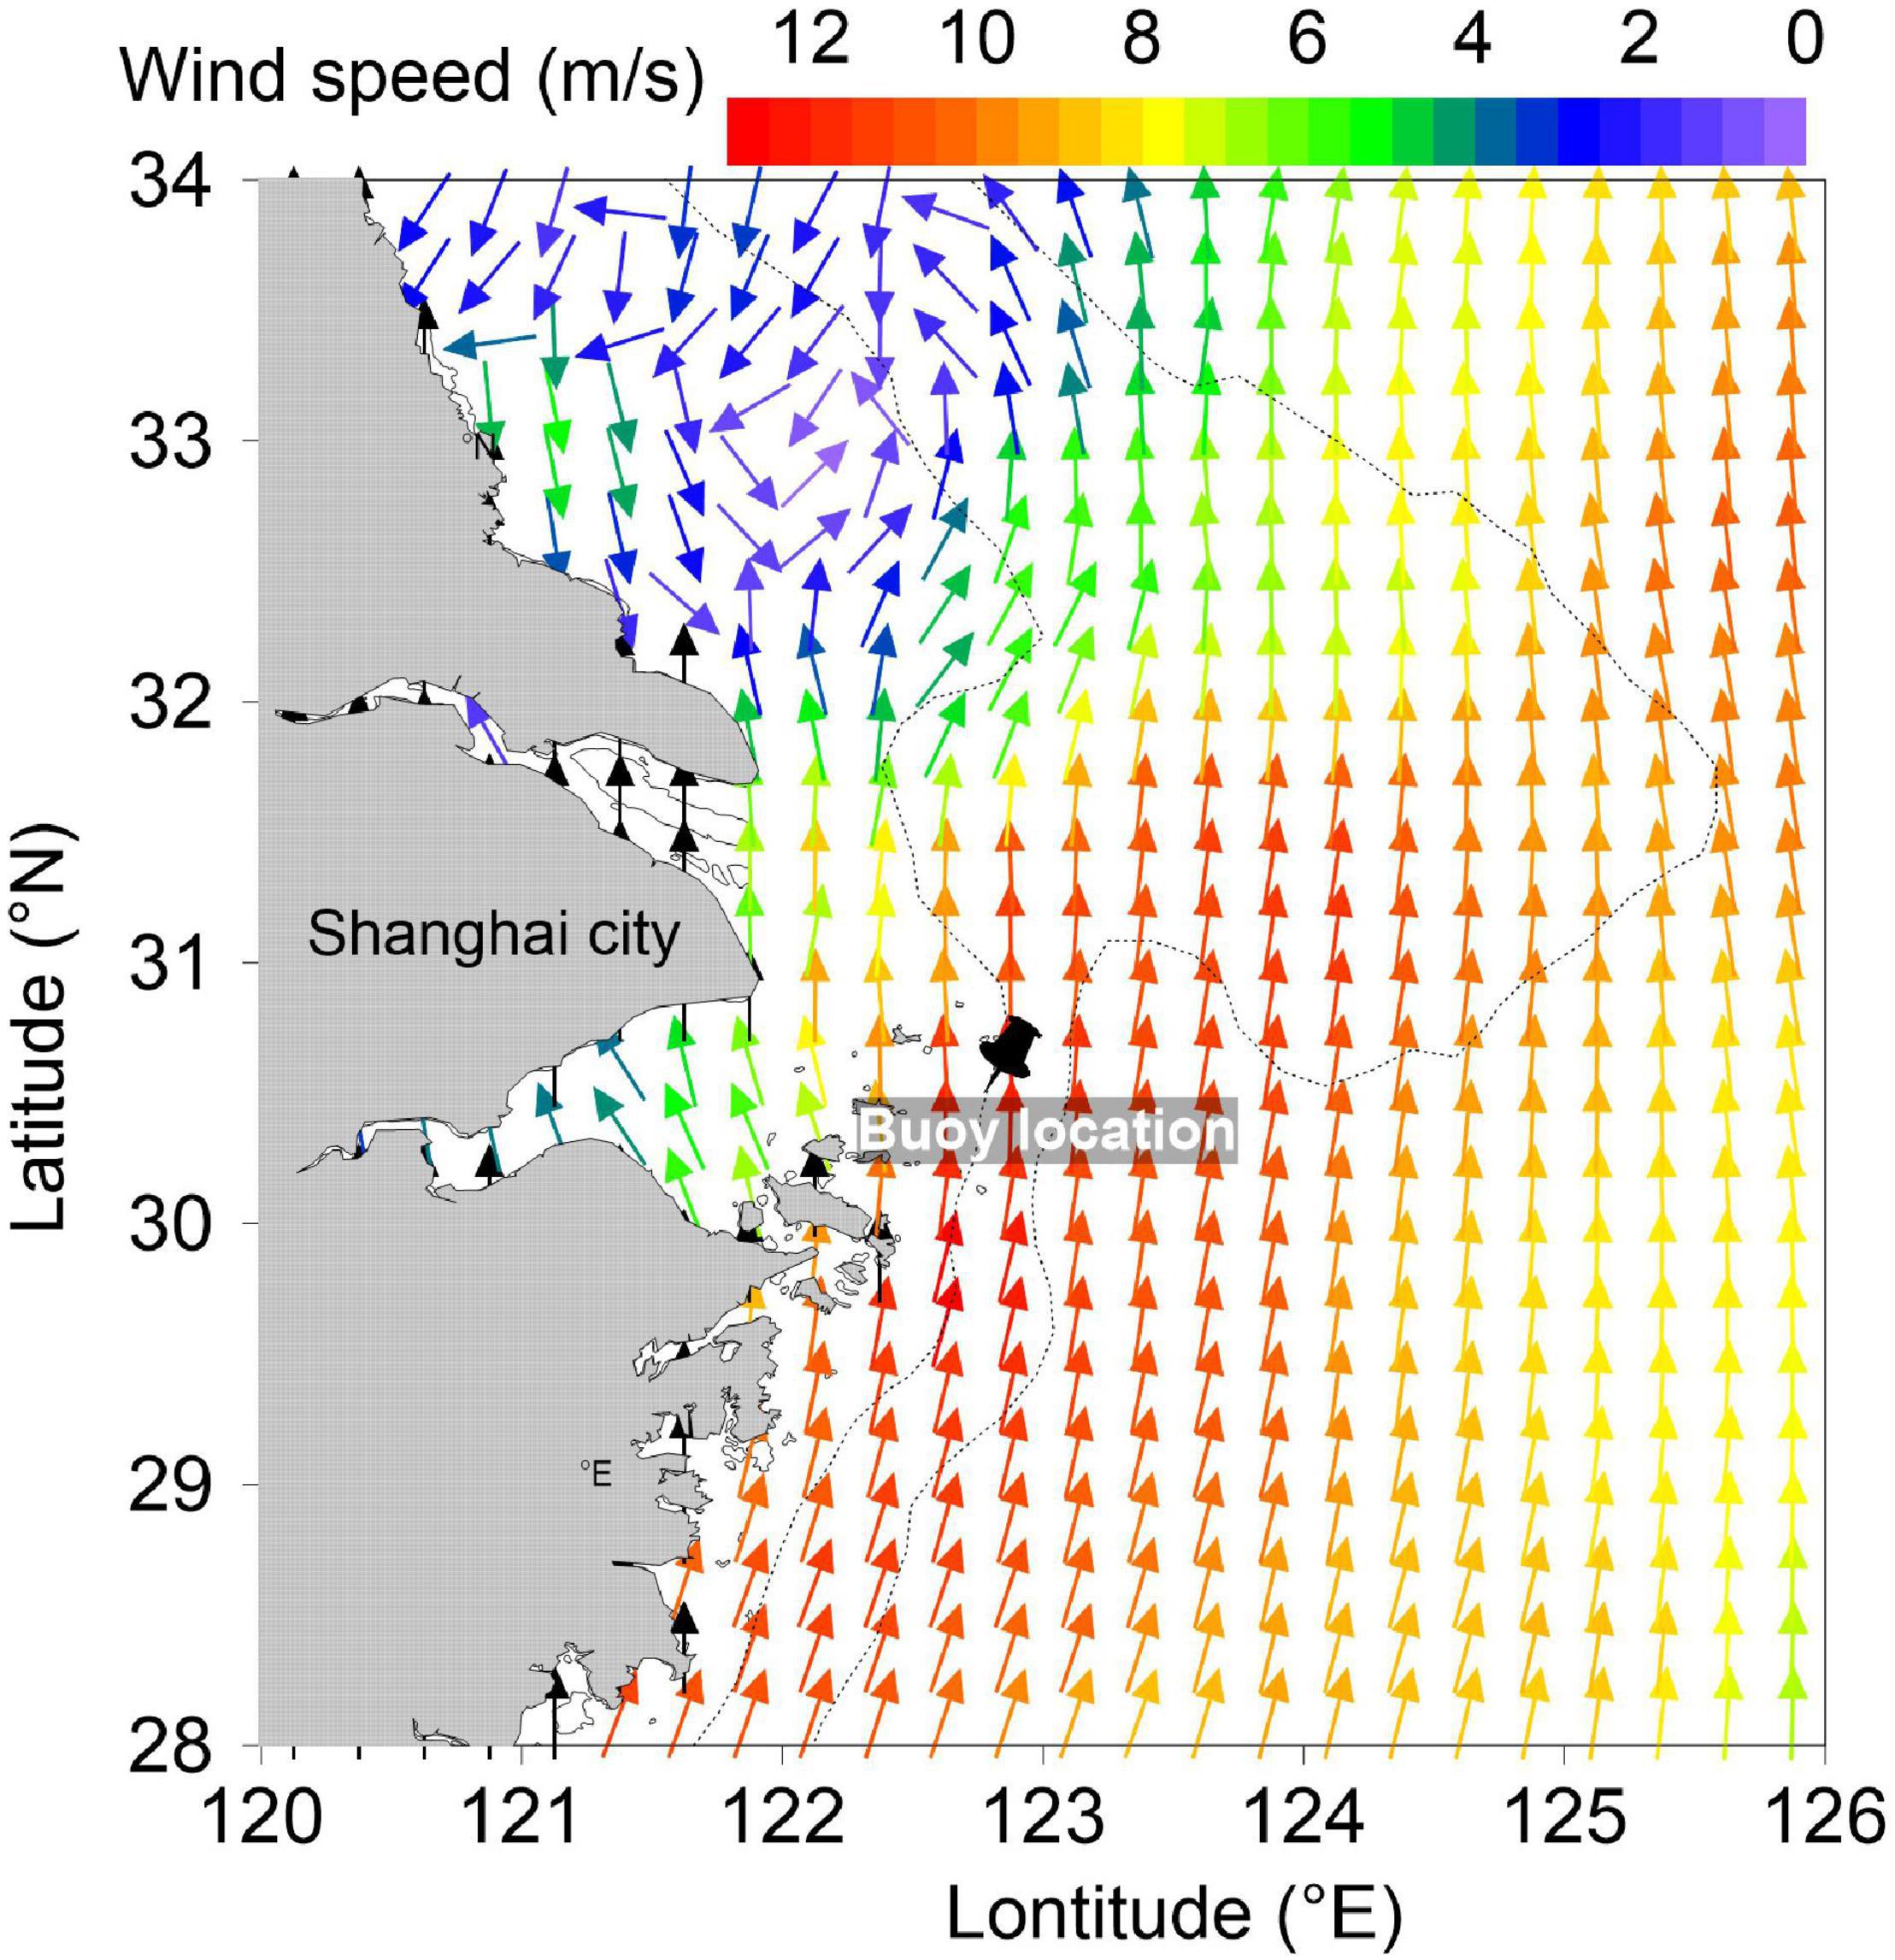
Figure 1. Advanced Scatterometer winds over the East China Sea on July 24. The black pin denotes the buoy location. The colors represent the wind speed.
A Multi-Water Sampler (Hydro-Bios) was used to collect discrete water samples and measure salinity, temperature profiles on July 15, July 17, August 30, and September 1–2, 2015. The DO concentrations in the samples were determined using the Winkler titration method, and the discrete DO data were used to calibrate our buoy DO data. The Chl a concentrations in the samples were measured with a 10-AU Field Fluorometer (Turner Designs) after extraction with 90% of acetone.
Satellite-Retrieved SSTs and Winds
We collected remotely sensed SST data in the Changjiang Estuary from the Remote Sensing Systems1. This system comprises microwave optimally interpolated daily SST data products that combine the through-cloud capability of microwave data with the high spatial resolution and near-coastal capability of infrared SST data.
The wind data (Figure 1) were obtained from the Advanced Scatterometer wind products, which are processed by National Oceanic and Atmospheric Administration and National Environmental Satellite, Data, and Information Service2. The scatterometer instrument aboard the European Organization for the Exploitation of Meteorological Satellites Metop satellites uses radar to measure backscatter to determine the speed and direction of winds over the surface of the oceans.
Data Processing
The dissolved inorganic carbon (DIC) data at the buoy were calculated from the total alkalinity values, in situ temperature, salinity, and pCO2 using the program CO2SYS (Pierrot et al., 2006) with the equilibrium constants of Mehrbach et al. (1973) as refined by Dickson and Millero (1987). The total alkalinity values were calculated using the buoy-recorded salinity data and the regression results of the total alkalinity and salinity data recorded during a cruise conducted from July 9 to 20, 2015 in the Changjiang estuary (Xiong et al., 2019).
The thermodynamic effect on pCO2 was eliminated by normalizing it to a constant temperature, namely normalized pCO2 (npCO2) (Takahashi et al., 1993): npCO2 = pCO2 × exp [0.0423 × (25.04 − SST)]. In the expression, 25.04 is the average SST during our record. The air-sea CO2 fluxes were estimated using Fgas = k × s × ΔpCO2, where k is the gas transfer velocity, s is the carbon dioxide solubility (Weiss, 1974), and ΔpCO2 is the difference between the sea surface pCO2 and air pCO2, which is assumed to be a constant of 396 μatm (calculated from the monthly air pCO2 in July 2015 at Korea’s Tae-ahn Peninsula site3. The gas transfer velocity (cm h–1) was calculated according to Wanninkhof [2014].
Results
Surface Salinity, Temperature, pCO2, DO, and Chl a Variations
The wind speeds were generally less than 8 m s–1 in our record, except on July 23 and 24, when strong south winds prevailed with a maximum wind speed of 11.2 m s–1 (Figures 1, 2E). Nine days before the presented buoy data (July 11), typhoon “Chan-Hom” passed the buoy, likely setting the baseline water property values. The SST and salinity fluctuated sharply within 23 days (July 20–August 11, Figures 2A,B). In this study, we divided the record into three periods according to the variations in salinity and temperature.
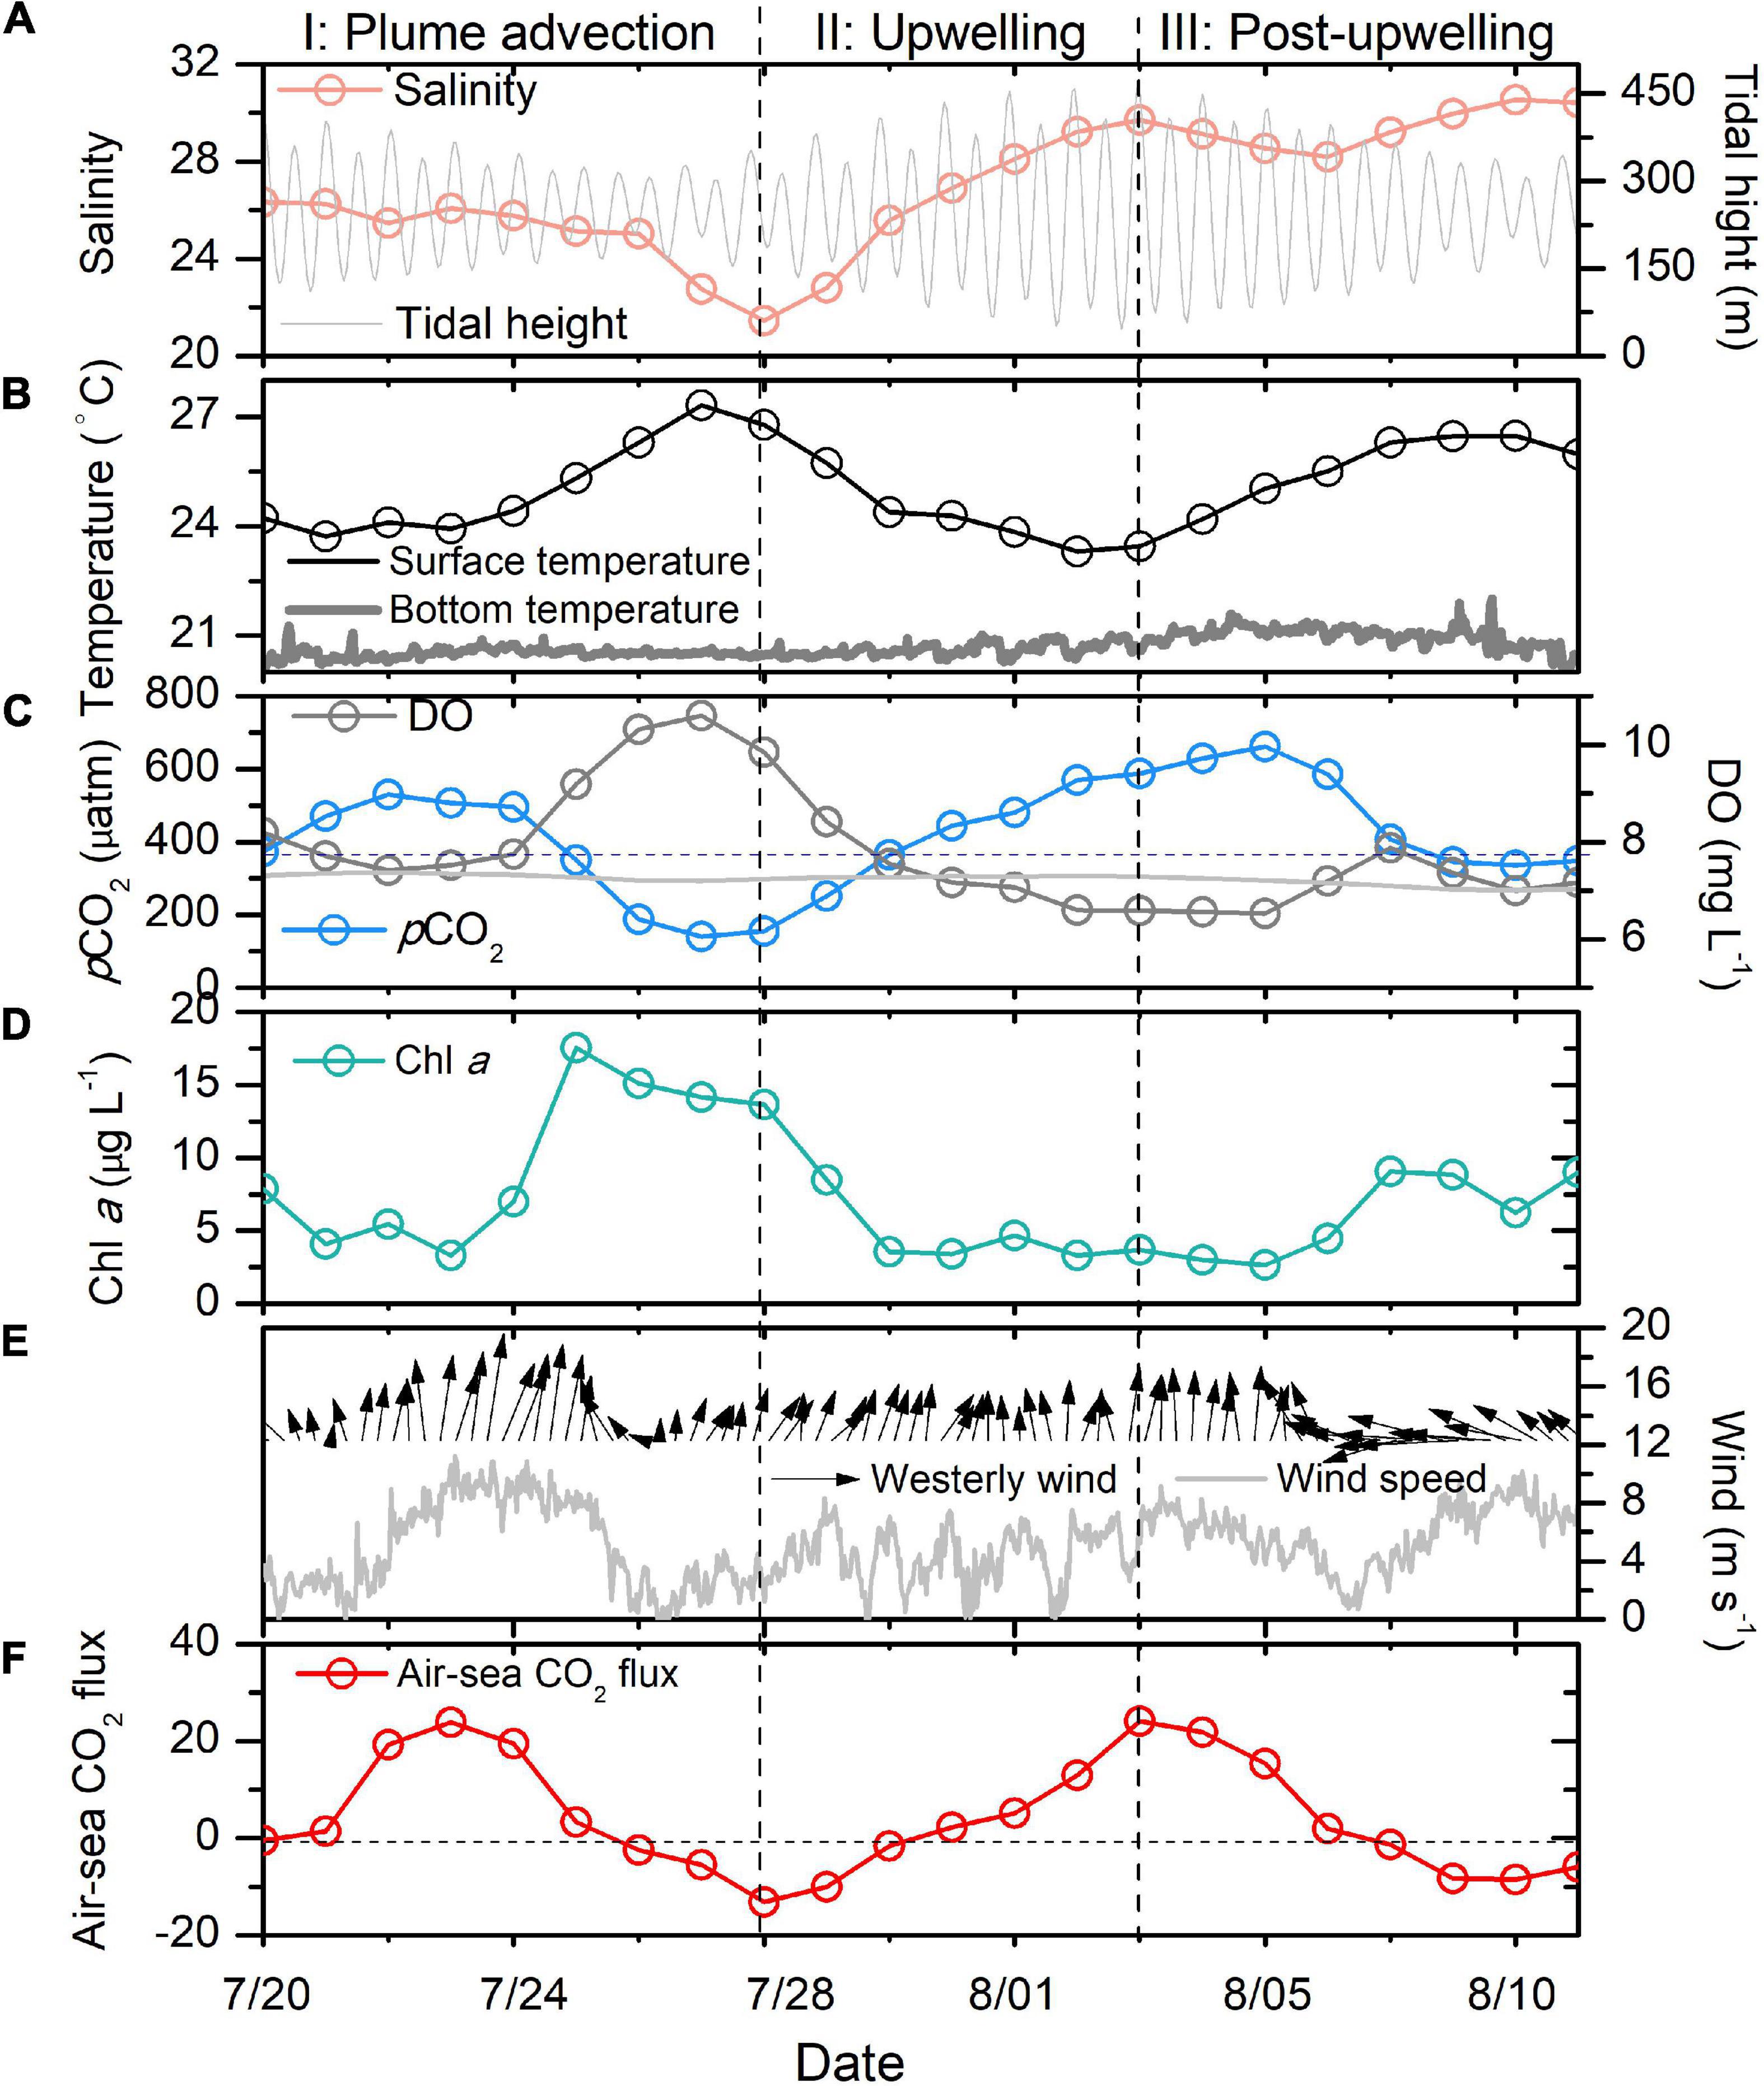
Figure 2. Salinity (A), temperature (B), pCO2 and DO (C), Chl a (D), wind (E) and air-sea CO2 flux (F) variations during 20 July–11 August in the Changjiang plume waters. The gray dashed line in (C) is the atmospheric CO2, while the gray line is the saturated oxygen in surface waters. In (F), the gray dashed line shows the position where the air-sea CO2 flux is zero. The two vertical dashed lines indicate the dates used to divide our time series data into three periods.
From July 20 to 26, the daily surface salinity values were relatively stable (25.03–26.32), while a steady surface Chl a increase and a pCO2 decrease (494–184 μatm) were observed from July 24 to 26. During these 3 days, the surface oxygen was also supersaturated with respect to the atmosphere (7.75–10.32 mg L–1). A sharp salinity decrease was observed from July 26 to 28, during which the daily salinity decreased by 3.57 (from 25.03 to 21.46). The surface CO2 was undersaturated with respect to the atmosphere. The DO in the waters was supersaturated during the period of decreasing salinity. We assigned July 20–28 as period I, which witness strong south wind (Figure 2E).
Period II (July 28–August 3) was characterized by a continuous increase in salinity (21.46–29.72) and a decrease in temperature (26.91–23.46). Meanwhile, DO decreased from 9.85 to 6.59 mg L–1. In addition, pCO2 increased sharply from below 156 to 584 μatm. The surface Chl a decreased sharply during period II.
During period III (August 3–11), the temperature increased from 23.46 to 26.68 (August 9) and then decreased to 25.39 on August 11. The salinity decreased and then increased within 9 days. By comparison, the change in salinity in period III was much smaller than those during periods I and II. The surface pCO2 continuously increased at the start of period III (from 156 to 584 μatm). However, it decreased sharply from August 5 to 9 (from 661 to 346 μatm). We also observed increases in Chl a and DO during this period.
Air-Sea CO2 Flux
The air-sea CO2 fluxes in the surface waters around our buoy showed significant short-term variations (Figure 2F). The surface waters served as weak CO2 sources to the atmosphere at the beginning of period I. The CO2 source was enhanced from July 22 to 24 (maximum of +23.9 mmol m–2 day–1), accompanied by a strong south wind. Starting on July 26, the surface waters became a strong CO2 sink (−13.09 mmol m–2 day–1).
During period II, the surface waters around our buoy gradually turned from a CO2 sink to a CO2 source (+24.1 mmol m–2 day–1). However, the waters changed from a CO2 source to a CO2 sink again during period III (−8.45 mmol m–2 day–1).
Discussion
Advection of Plume Waters Influenced by the Biological Uptake of CO2
A sharp increase in oxygen and a significant decrease in pCO2 occurred on July 24–26 (from 494 to 184 μatm), at which time the maximum surface Chl a concentration was three times than that measured on July 23 (Figure 2D). The salinity varied by only 0.75, which was relatively minor in the dynamic coastal environment. Thus, it seemed that the advection of plume waters was not the driver of such significant biogeochemical responses around the buoy. The increasing Chl a concentration suggested that biological activity probably caused the coupled variations in pCO2 and DO. Surface heating and low tides favor stratification, which is suitable for phytoplankton blooms. It is hard to know if the high biological production was directly associated with the strong south wind event (July 23) that may have made the plume thinner (Fong and Geyer, 2001). The high pCO2 measured at the beginning of period I was probably related to the influence of the typhoon that occurred 9 days before period I (July 11) (Li et al., 2019).
The surface pCO2 did not decrease gradually, as shown in the high temporal-resolution record: it decreased by 360 μatm within 16 h (Figure 3B). Such a sharp decrease did not necessarily indicate that CO2 uptake occurred within such a short period, as it is an Euler observation. Generally, the biological uptake of DIC should be the sum of biological production uptake within the transit time of plume, which is approximately 1 week for the Changjiang plume (Zhang et al., 2020). However, a considerable portion of CO2 should have recently been consumed for the following reasons: first, the salinity was relatively constant within the 16 h (25.11–25.73, Figure 3A). Horizontal mixing should homogenize Chl a and pCO2, as observed for salinity if the biological production occurred a week earlier. Second, the supersaturated oxygen indicated that the biological signals, or at least part of the signals, were probably created more recently, as the air-sea oxygen exchange equilibrates the surface water oxygen within approximately 1 week (Zeebe and Wolf-Gladrow, 2001). If biological production occurred a week earlier, the air-sea exchange should have largely modified the npCO2–DO relationship (Zhai and Dai, 2009), which was not supported by our results (Figure 4B).
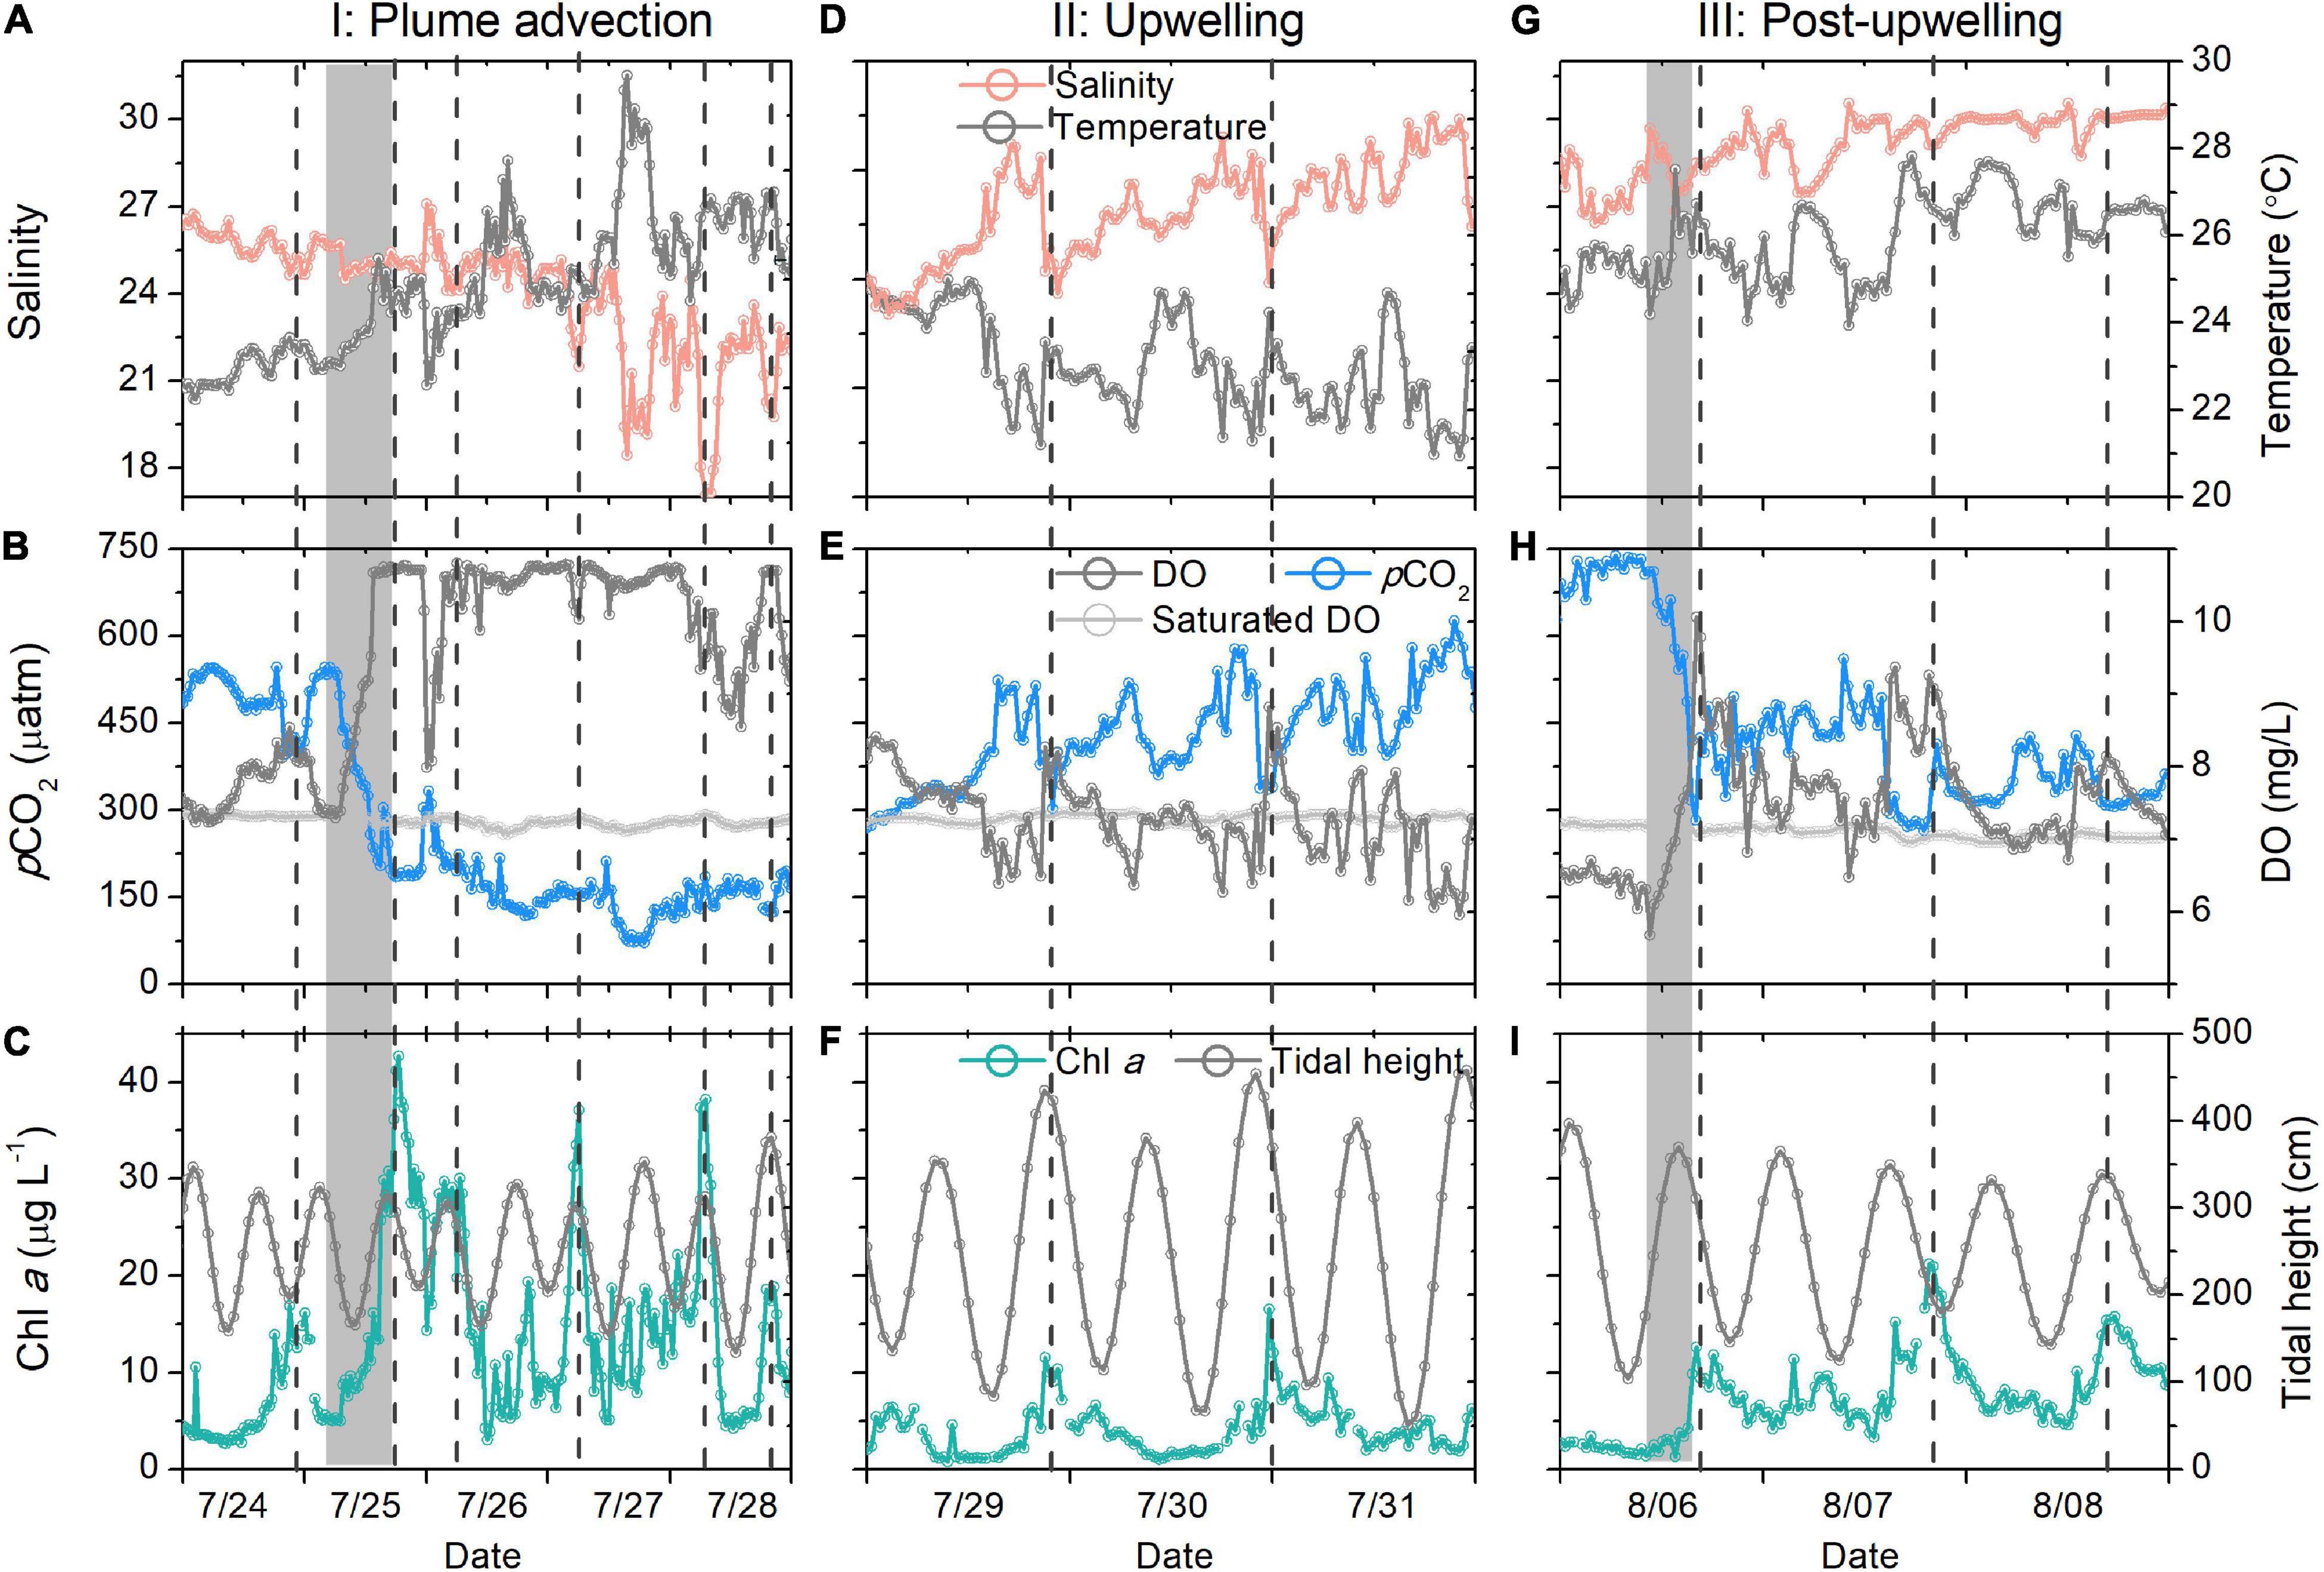
Figure 3. High-temporal-resolution salinity and temperature (A,D,G), pCO2 and DO (B,E,H), Chl a and tidal height (C,F,I) data during the three studied periods. The gray bars in (C,I) denote the sharp pCO2 decrease. All vertical dashed lines denote the Chl a peaks.
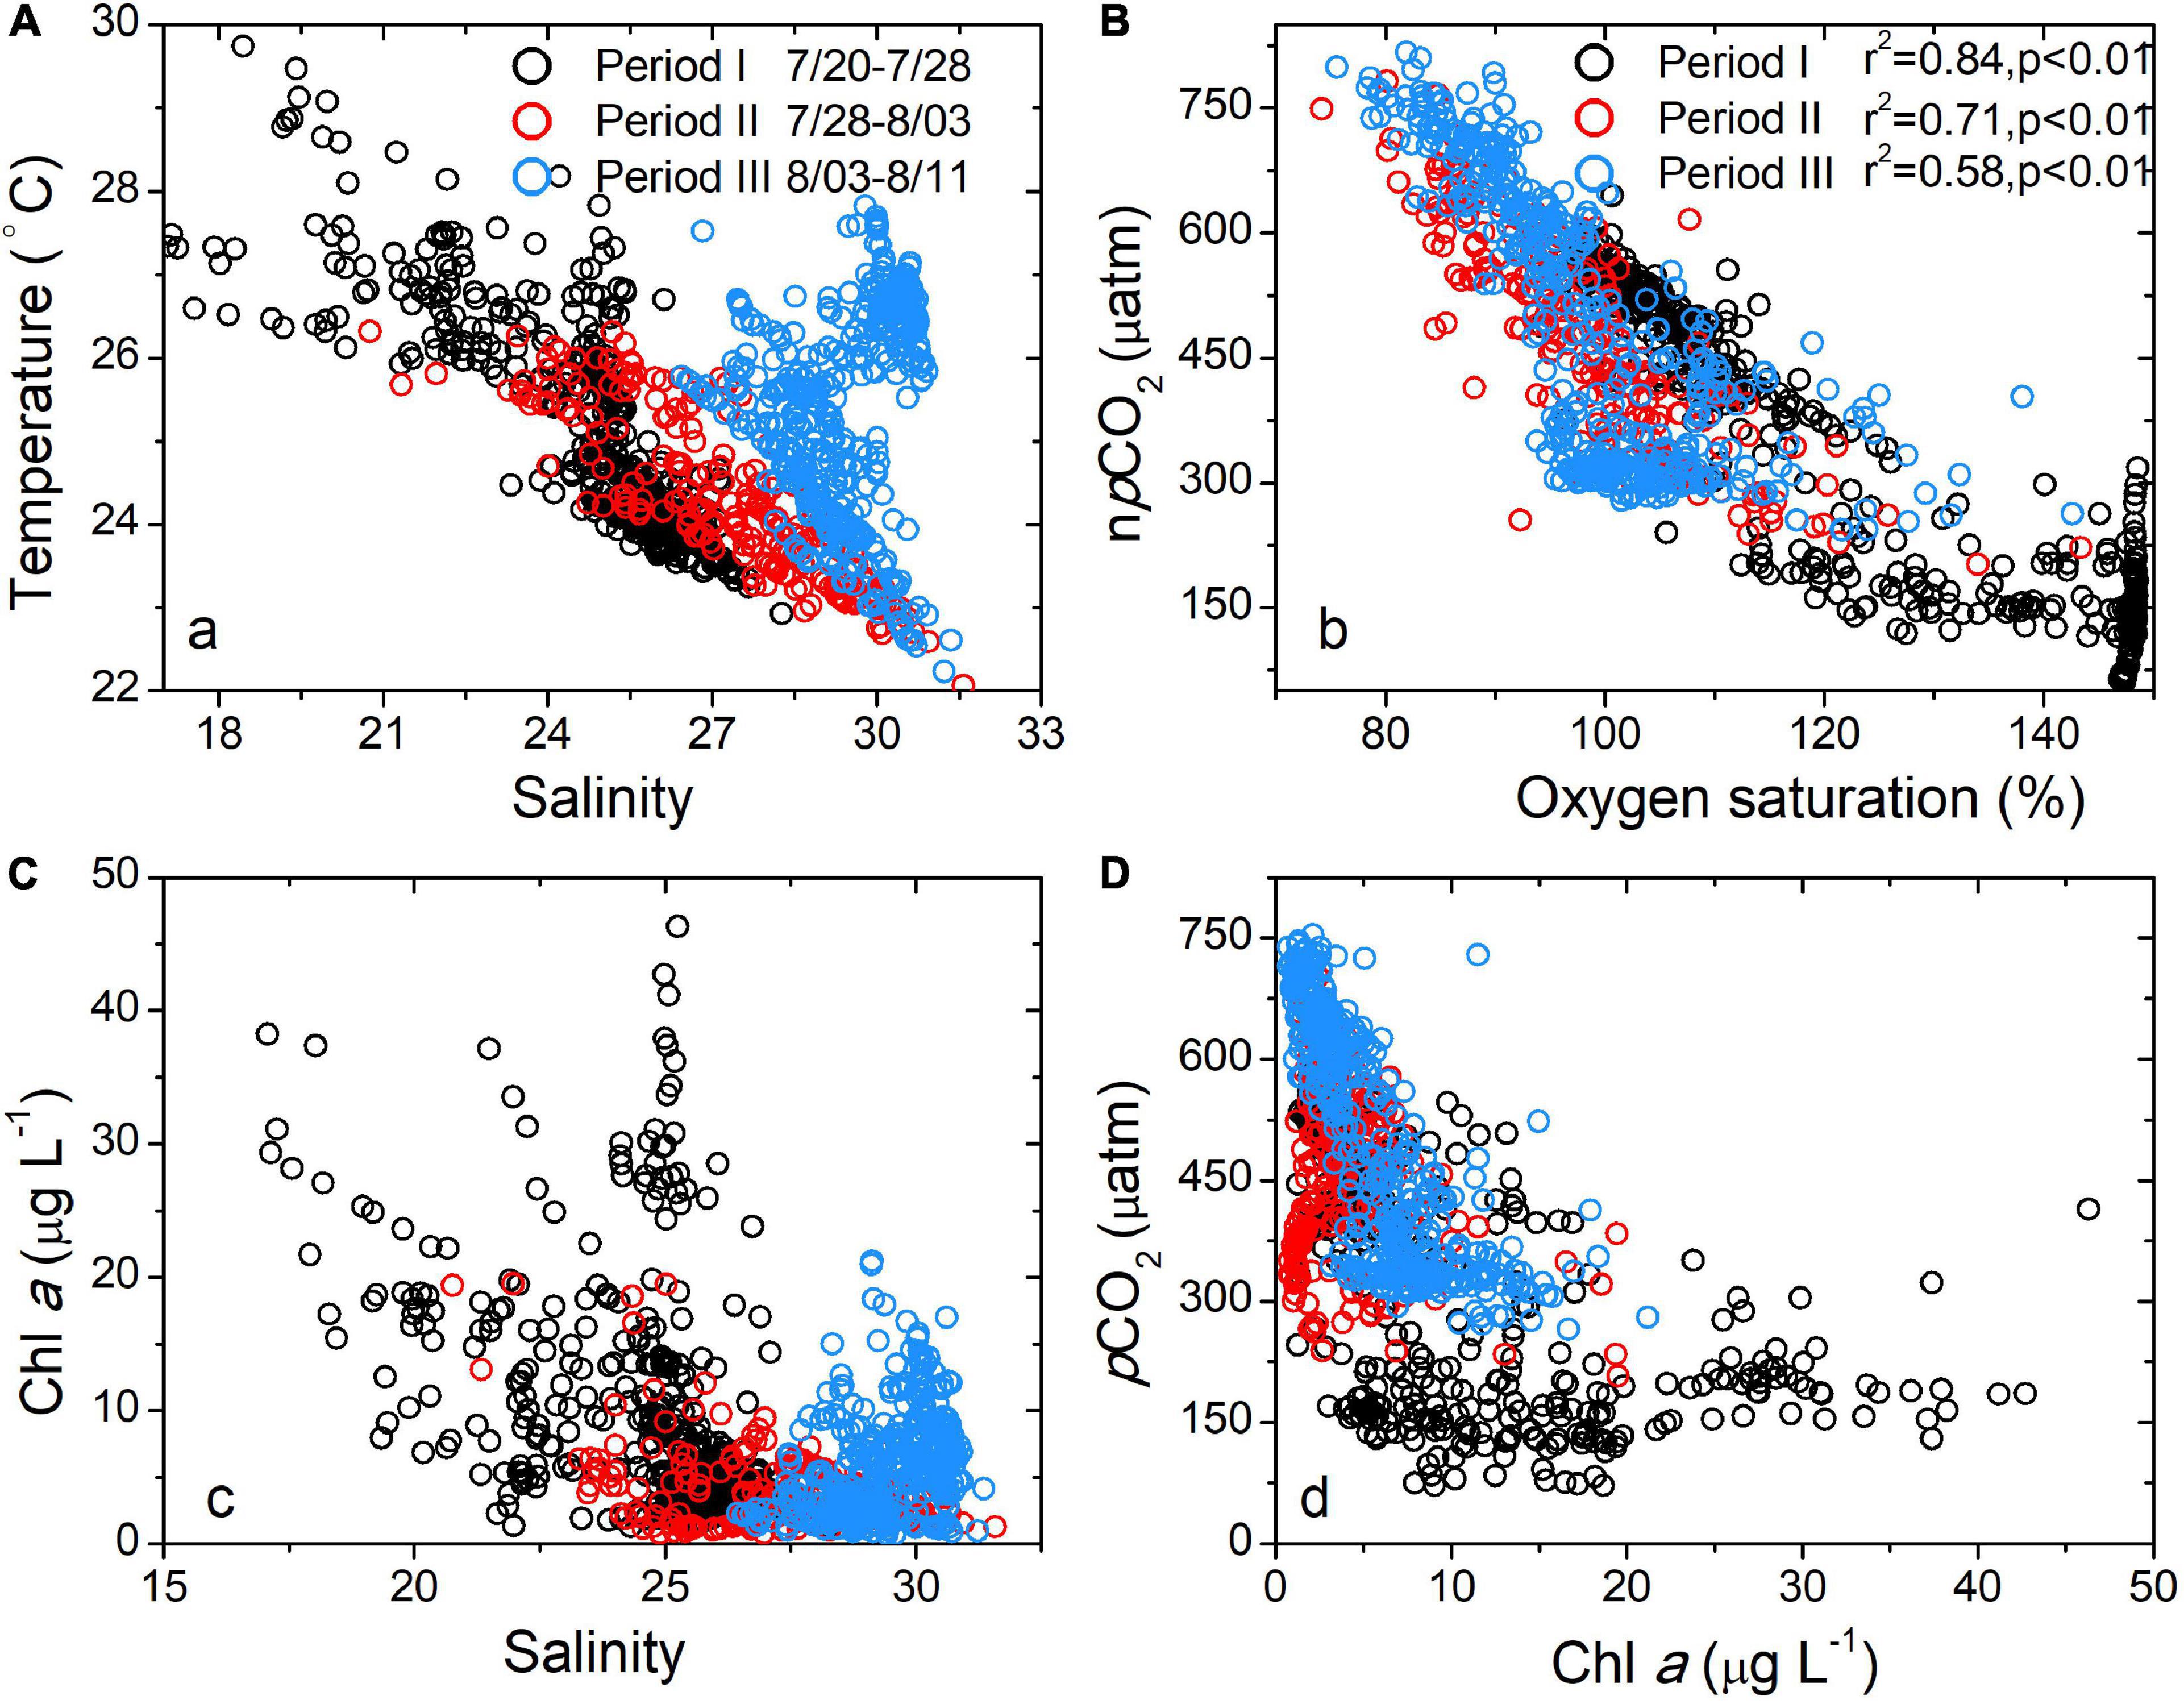
Figure 4. Relationships among buoy-measured salinity and temperature (A), oxygen saturation and npCO2 (B), Chl a and pCO2 (C), salinity and Chl a (D).
If the total alkalinity (calculated from the total alkalinity–salinity relationship) and pCO2 were used to calculate the buoy DIC (details are shown in the “Materials and Methods” section) (Pierrot et al., 2006; Xiong et al., 2019), the DIC decrease from July 25 to 27 was 207 μmol kg–1. Similar magnitudes of DIC drawdown have been reported in the Changjiang plume and Mississippi River plume (Guo et al., 2012; Wang et al., 2017). If we use 7 days as the plume residence time (Wang et al., 2014; Zhang et al., 2020), the net community production would be 346 mg m–3 day–1. It is difficult to compare our results with previously reported results, as we did not measure DIC uptake data within the whole euphotic zone. In this study, we simply assumed no DIC uptake at the bottom of the euphotic zone. If a euphotic zone of 5 m was adopted (Ning, 1988), the net community production would be estimated as (346 mg m–3 day–1+0)/2∗5 m = 865 mg m–2 day–1, which is well within the reported net community production and exported particulate organic carbon flux in the Changjiang plume waters (0.4–1.8 g m–2 day–1) (Gong et al., 2003; Hung et al., 2013b; Wang et al., 2014, 2017). Such intense phytoplankton blooms could have a significant influence on bottom hypoxia, which is frequently observed outer of the Changjiang Estuary (Zhu et al., 2011; Wang et al., 2017). Moreover, we likely underestimated the biological production rate, as CO2 uptake could happen within fewer days than the residence time. Such an underestimation was possible, as the hypoxic water volume in the Changjiang Estuary is larger than that in the Gulf of Mexico (Rabalais et al., 2003; Wang et al., 2017; Zhou et al., 2017), and in the Mississippi River plume, the net community production rate can be even larger than 7 g m–2 day–1 (Guo et al., 2012).
On July 27 and 28, we observed low-salinity waters (daily salinity = 21.46, Figure 3A) that were probably driven by the eastward expansion of the low-salinity Changjiang plume waters. The mixing of the low-salinity Changjiang plume waters and cold subsurface waters was verified by the salinity–temperature relationship (Figure 4A). Such an extension was also verified by remotely sensed SST images, in which the plume water temperature was found to be higher than that of the ambient water (Figure 5). The extension of plume waters and even the detachment of the Changjiang plume from the main body have been frequently observed (Chen C. et al., 2008; Moon et al., 2010) and are probably driven by strong winds and tide mixing (Moon et al., 2010; Wu et al., 2011; Xuan et al., 2012). During period I, we observed strong south winds (>11 m s–1, Figure 2E), which agreed with previous observations (Xuan et al., 2012).
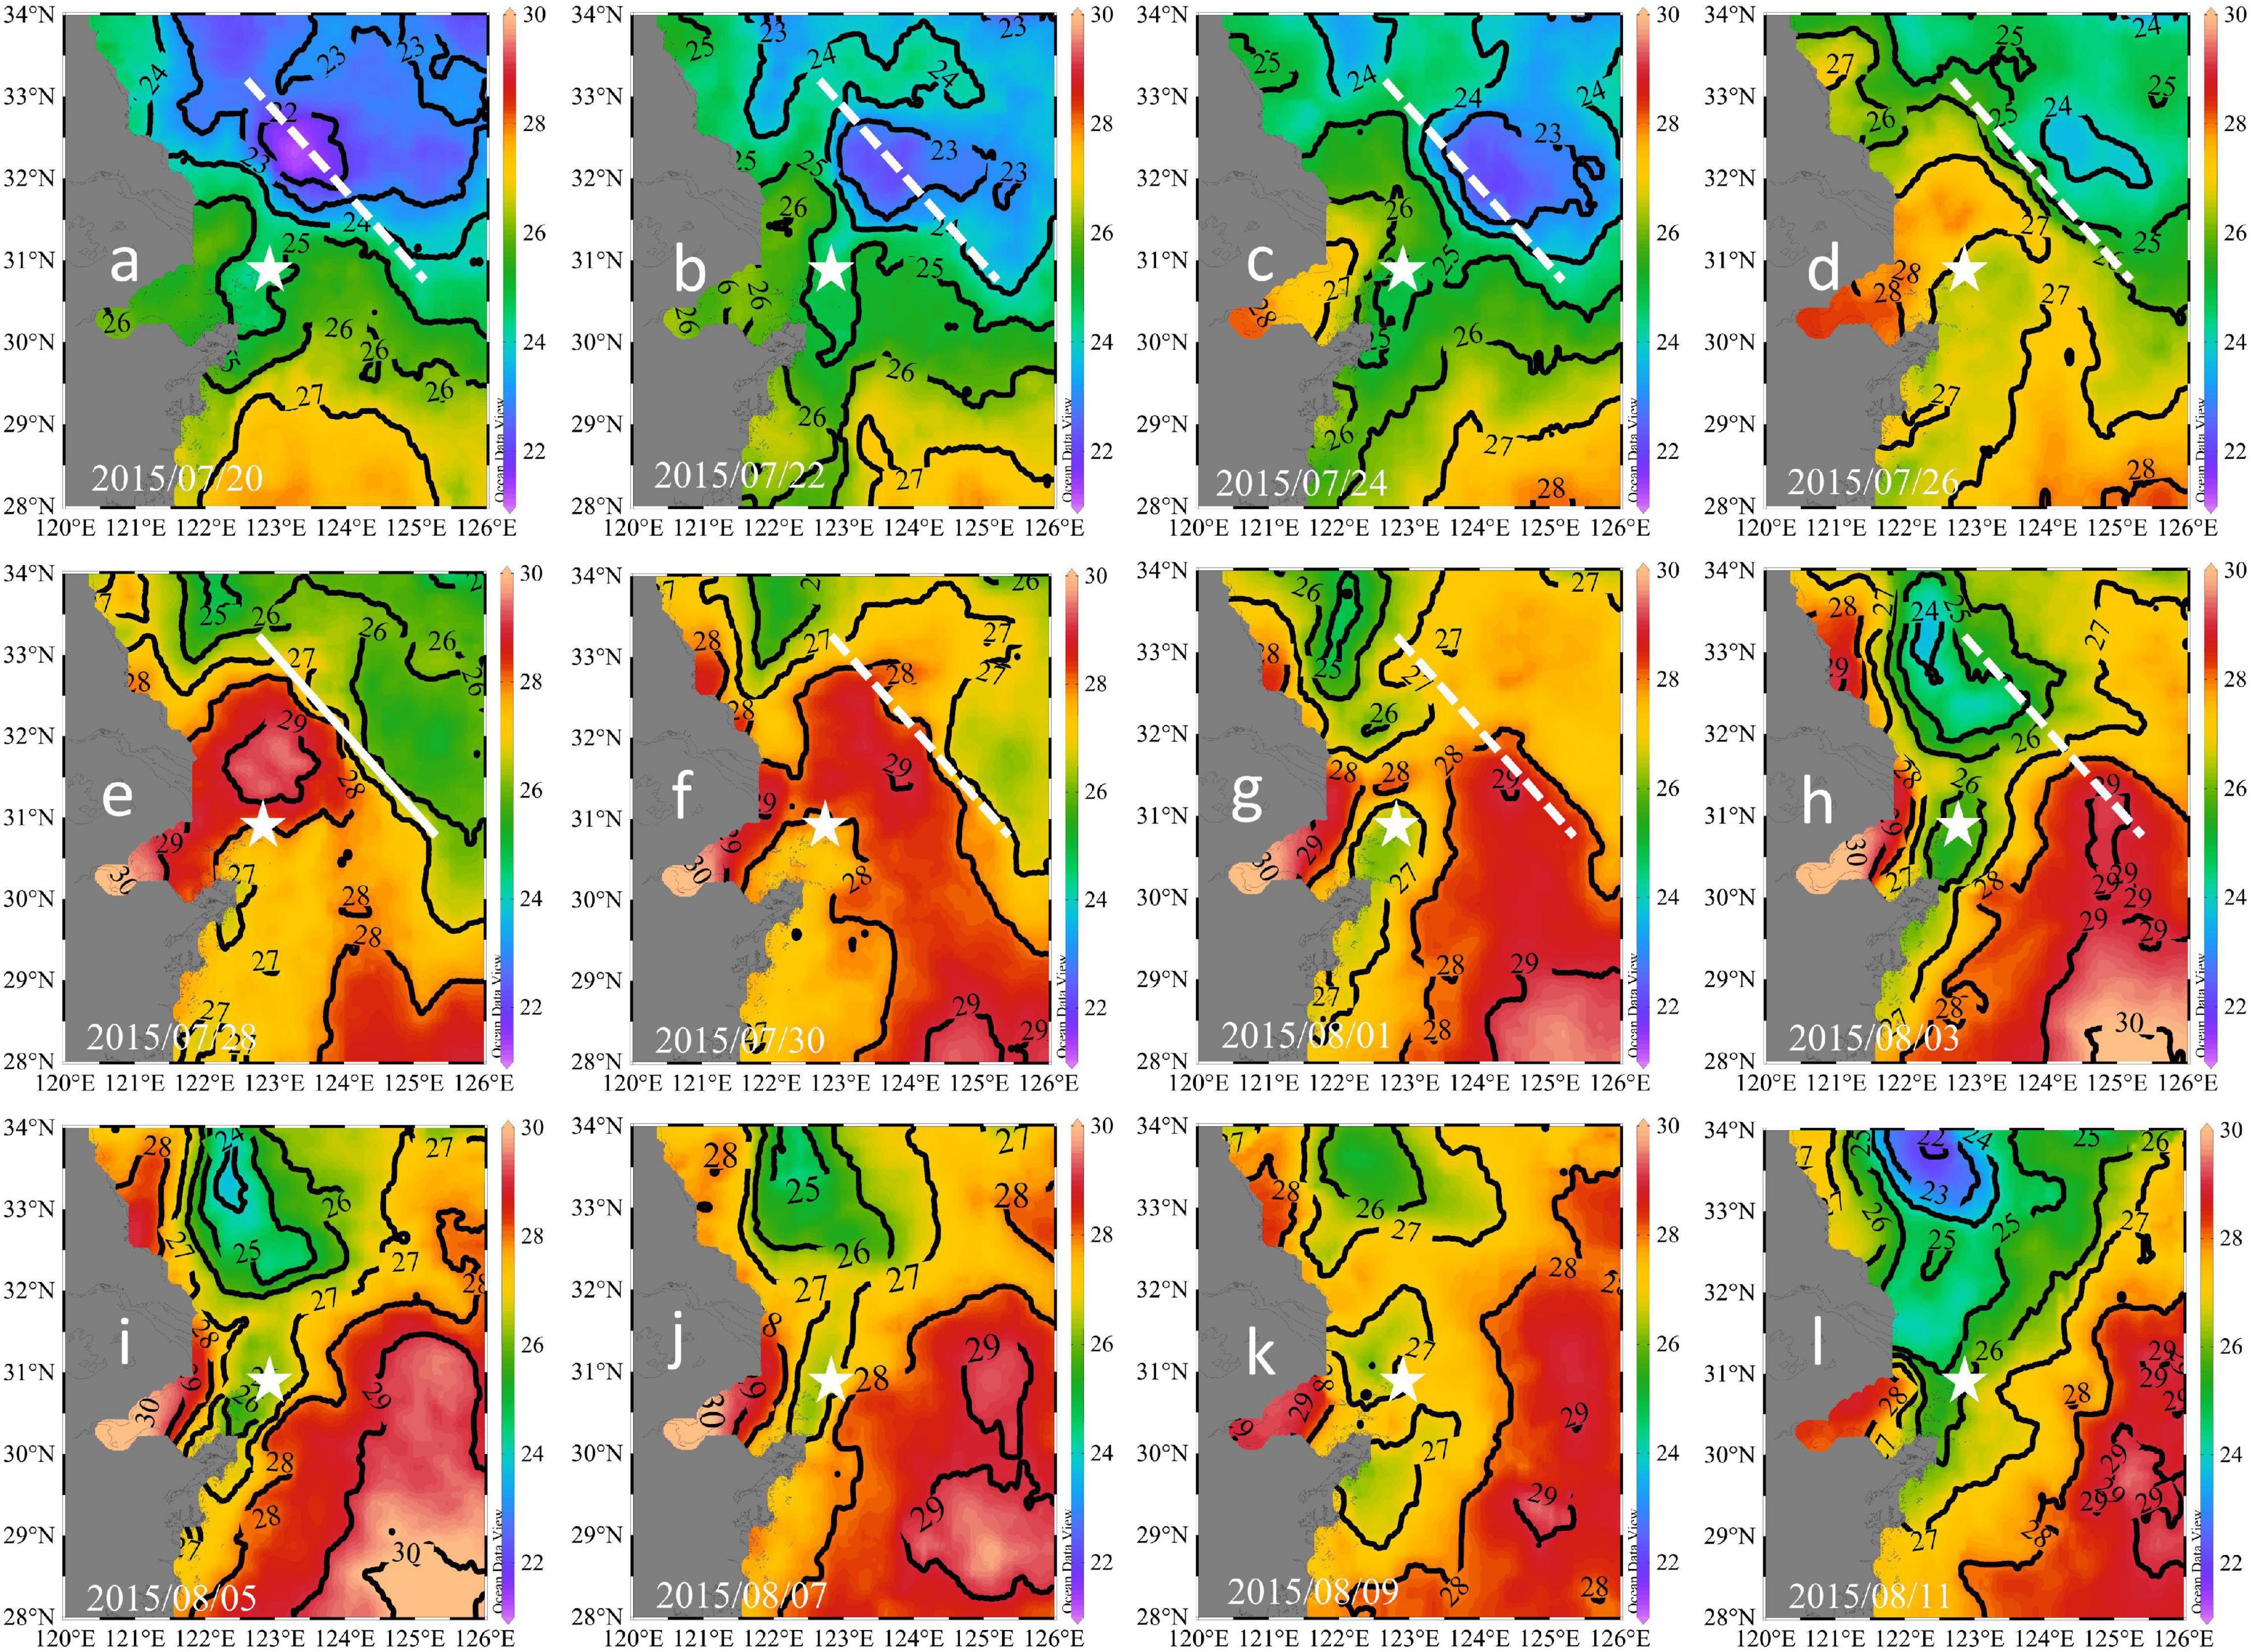
Figure 5. Remotely-sensed sea surface temperatures during July 20 to August 11, 2015: 07/20 (a), 07/22 (b), 07/24 (c), 07/26 (d), 07/28 (e), 07/30 (f), 08/01 (g), 08/03 (h), 08/05 (i), 08/07 (j), 08/09 (k), and 08/11 (l). The white lines denote the location of the thermal front on July 28. The buoy location is shown by stars.
The advection signal appeared 2 days after the end of the strong south winds (strong winds prevailed from July 23 to 24), while the plume extension seemed to start on July 24, as inferred from the satellite-derived results (Figures 5a–e). This delay was likely due to the plume largely extending northeast (Figures 5c–e), while our buoy was located east of the warm plume waters. On July 27 and 28, the salinity decreased by ∼5 within 12 h and increased by ∼3 within the next 12 h (Figure 3A), indicating that the plume core with a strong horizontal salinity gradient was probably located close to our buoy. That is, our buoy was located at the periphery of the plume. Our time-series and remote sensing results suggested strong temporal and spatial variations in the wind-induced plume dynamics. Wind-driven plume advection was also observed in the Mississippi River plume (Huang et al., 2013) and was found to enhance the carbon sink.
During the advection of plume waters, we observed a pulse of maximum Chl a (Figure 3C) that corresponded to extremely low salinity (salinity minimum of 17.07, Figure 3A). In addition, pCO2 was lower than 200 μatm during this period. Low-salinity waters in inner estuaries typically have supersaturated pCO2 (>600 μatm) (Zhai et al., 2007). In addition, the temperature increase observed during period I should accompany elevated pCO2. The significant relationship between npCO2 and DO observed during period I (Figure 4B) demonstrated that the pCO2 decrease was probably dominated by biological production (Li et al., 2018).
In the Changjiang estuary, blooms are typically found in waters within a salinity range of 25–30 due to their high nutrient concentrations and suitable light conditions (Ning, 1988; Tseng et al., 2013; Wang et al., 2014). High Chl a concentrations at salinities of 17–22 are not frequently reported due to the high turbidity of these waters (Figures 3C, 4C) (suspended matter typically >200 mg L–1), as turbidity limits phytoplankton growth (Cloern, 1999). It is likely that the advection of the plume carried the low-salinity waters (minimum of 17.07) out of the maximum-turbidity zone (Shen et al., 2008). Thus, the biological production of the plume water was less limited by light.
An extreme Chl a peak occurred from July 25 to 28 (Figures 2D, 3C). Undersaturated CO2 conditions lasted for 4 days, revealing the influence of an intense phytoplankton bloom. As high-Chl a plume waters were transported eastward under south winds, the low-pCO2 signals could occupy a larger area. The cross-shelf transport of high-Chl a waters by frontal processes has been identified in the East China Sea (Yuan et al., 2005). In the Gulf of Mexico, the cross-shelf transport of low-salinity and low-pCO2 waters under the influence of winds has also been reported previously (Huang et al., 2013). In this study, we showed that the advection of biological signals occurred within a few days, which makes it hard to capture these signals by traditional ship-based observations.
Although Chl a fluctuated considerably, pCO2 remained low (Figure 3B). It is reasonable that the biological CO2 signal lasted for a month due to the slow air-sea CO2 exchange (Zeebe and Wolf-Gladrow, 2001), while Chl a has diel variations. Moreover, the surface pCO2 and Chl a have a non-linear relationship (Figure 4D), which results from the non-linear pCO2–DIC relationship and from Chl a–carbon ratio variations (Chang et al., 2003). The results also demonstrated that we should be cautious when using Chl a concentrations to retrieve biological-induced CO2 uptake (Bai et al., 2015; Le et al., 2019).
Contrasting CO2 During and After Upwelling
Four days after the wind event (July 29), the surface temperature decreased continuously (Figure 2B), verifying the upwelling of bottom waters. Upwelling was also revealed in the satellite results (Figure 5g). The upwelling signal overtook the horizontal advection signal, as inferred from the variations in salinity and temperature. It is reasonable to infer that the subsurface water upwelled to compensate for the offshore transport of surface waters. In addition, tidal mixing could also contribute to the observed upwelling, as discussed by Lü et al. (2006). Wu et al. (2011) also showed through simulations that subsurface waters under plumes upwell to the surface during spring tides. The daily salinity and temperature increased and decreased by 7.76°C (21.46–29.22°C) and 3.42°C (26.91–23.49°C) within 5 days, respectively (Figure 3D). The salinity profile of the water column around the buoy on July 17 showed waters with a salinity of 29.22 located at a depth of 22.5 m (Figure 6), which was adopted as the depth of the upwelled water. Thus, the upwelling speed was calculated as 22.5 m per 5 days = 4.5 m day–1, which is comparable with that reported in the upwelling area of northeast Taiwan (5.4 m day–1) (Liu et al., 1992). The cold water patches (defined as areas with SSTs < 26°C) had double cores with a spatial scale of approximately 45,000 km2 (Figure 5i), which is of similar magnitude to that measured in the southern East China Sea (32,000 km2) (Hung et al., 2013a). As the subsurface waters upwelled, the high-temperature plume waters seemed to separate into two parts (Figures 5f–h), similar to the reported plume-detachment process (Xuan et al., 2012). The decreasing temperature in our buoy record ended on August 3. The cold core outside the Changjiang estuary lasted for at least a week after August 3, as revealed in the satellite results (Figures 5g–k).
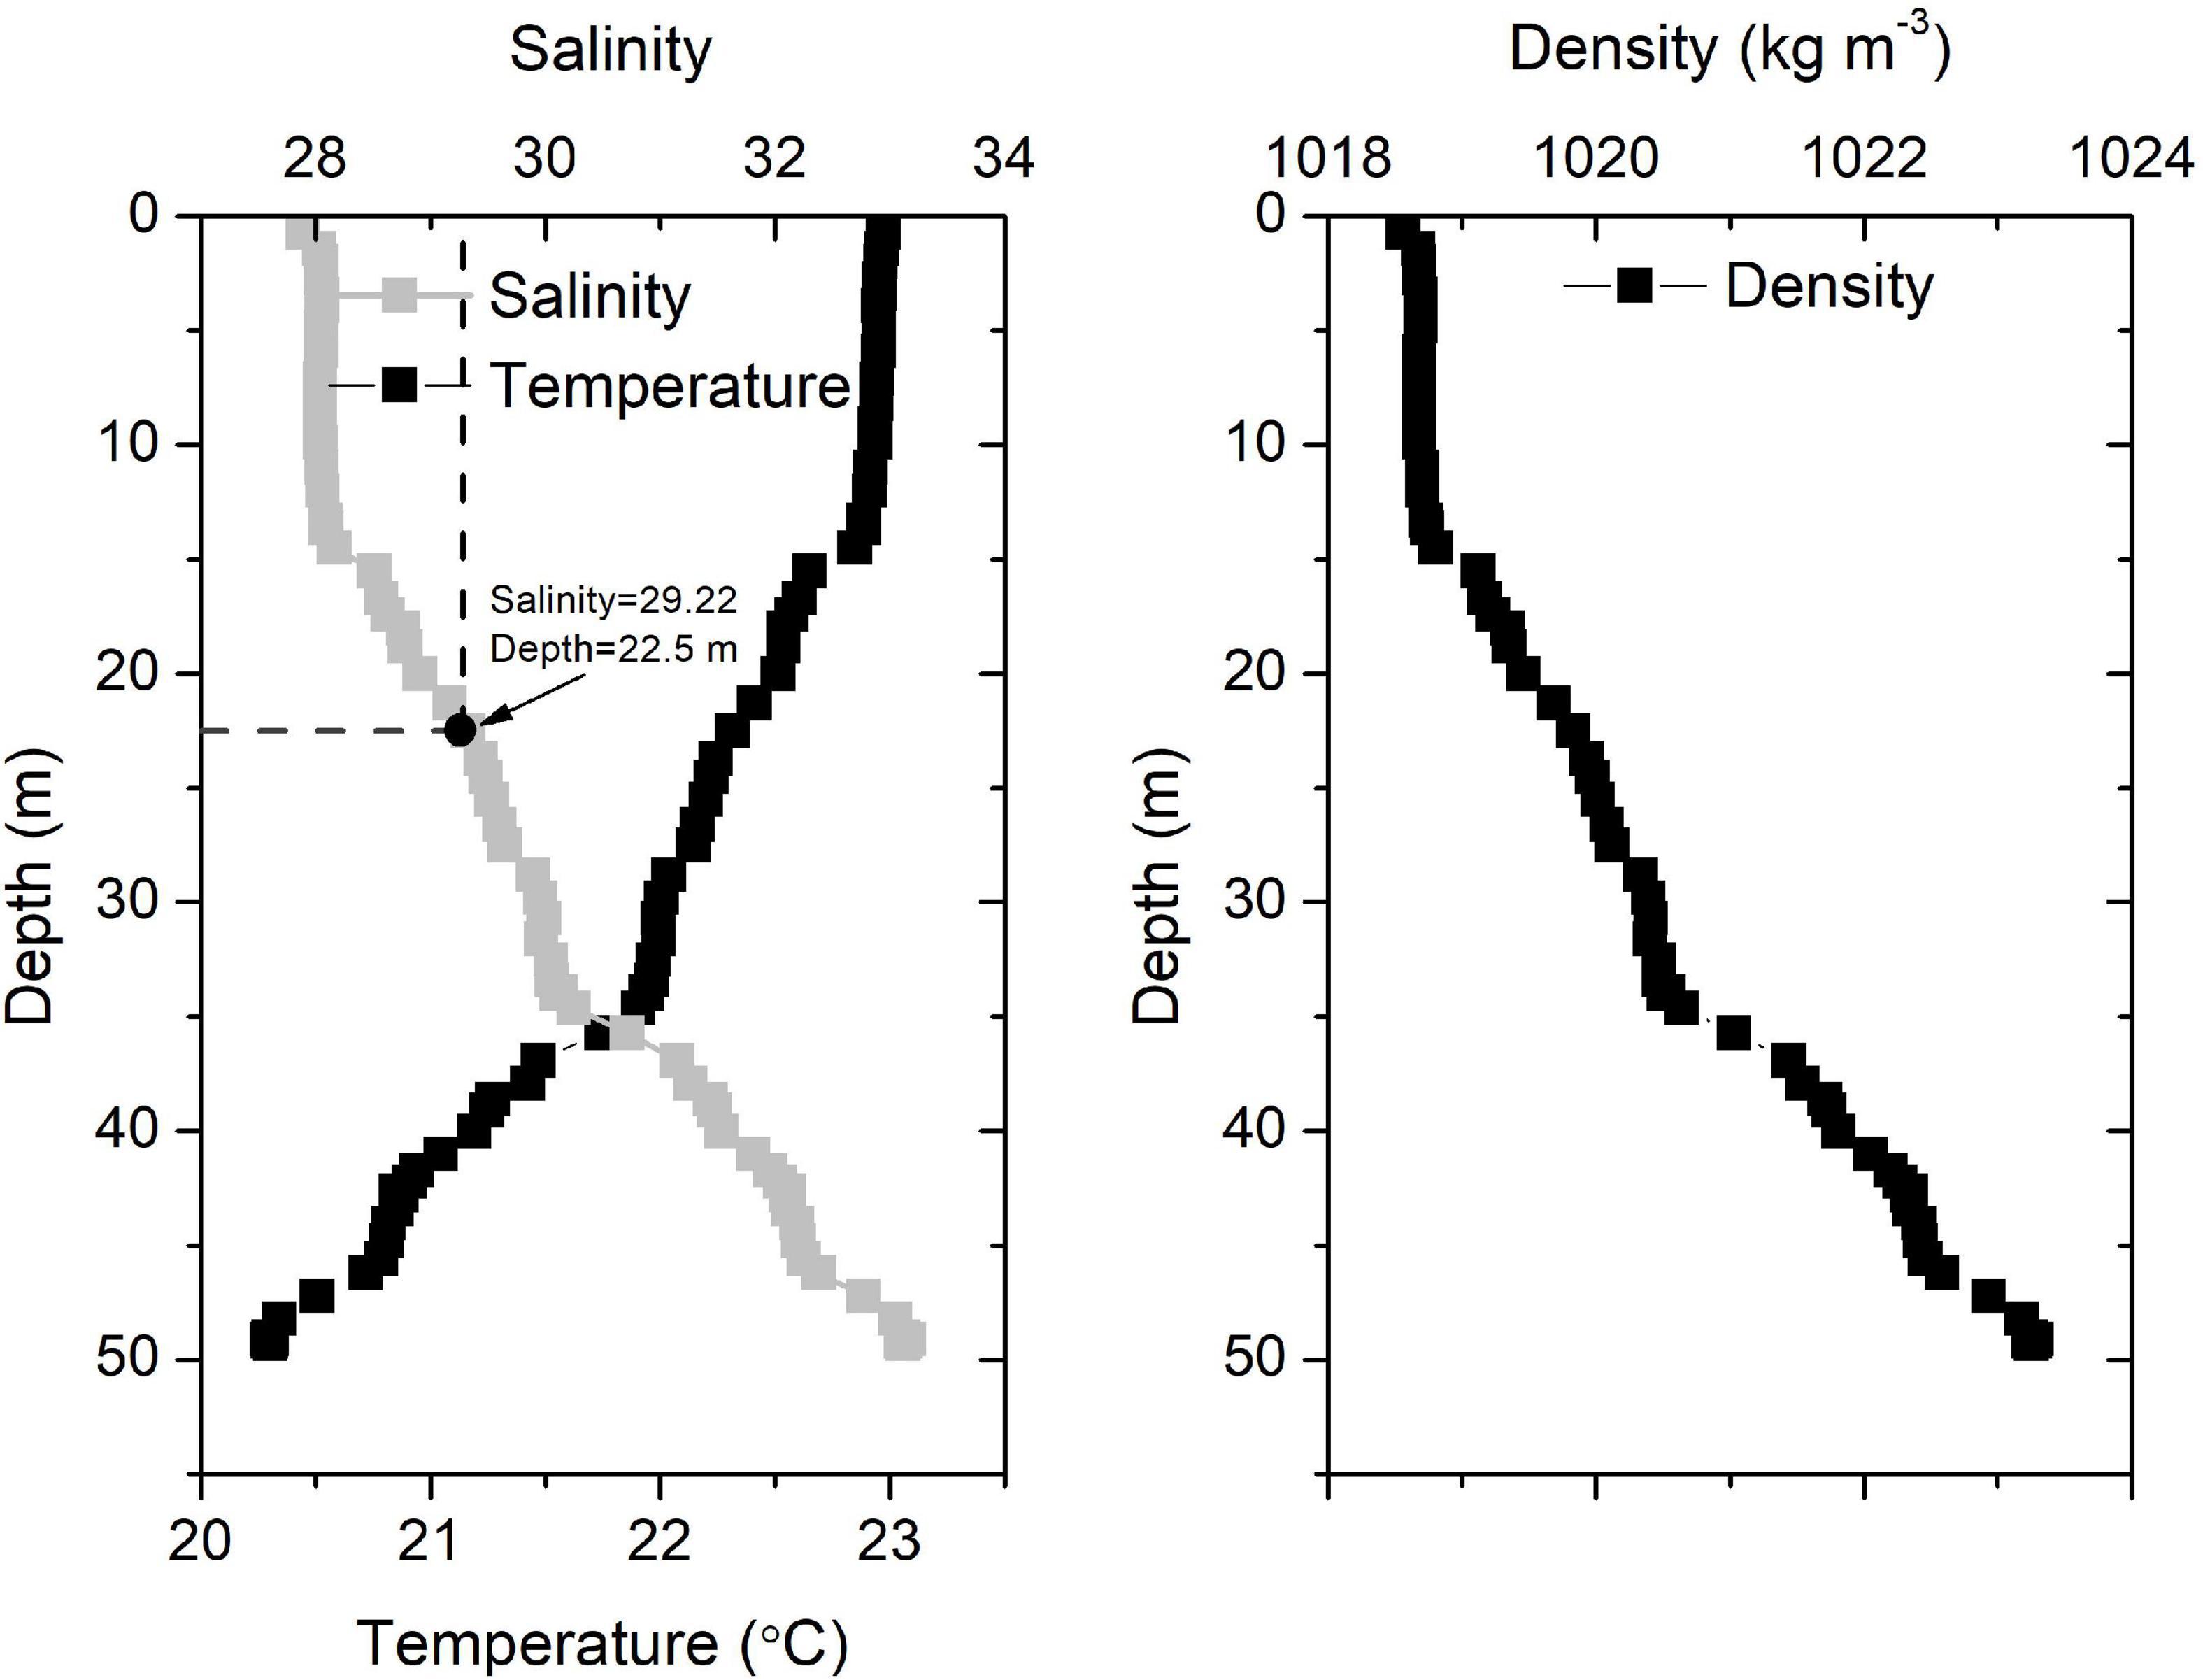
Figure 6. Vertical salinity, temperature, and water density profiles around the buoy on July 17, 2015.
We observed a continuous increase in pCO2 during upwelling (increased by 428 μatm, Figure 2C). Supersaturated and undersaturated CO2 have both been reported in other upwelling areas (Borges et al., 2005; Cai et al., 2006). It is typically accepted that the upwelling of nutrient-rich subsurface waters favors biological production, increasing Chl a and lowering pCO2 (Fassbender et al., 2011). However, the Chl a concentration decreased rapidly at the onset of upwelling in this study (Figure 3E), probably because the upward transport of bottom waters diluted the surface Chl a. During 4 days of upwelling, an episodic Chl a peak was observed; this peak was always associated with a low-salinity spike (Figure 3F). The cold waters, however, did not have high Chl a signals. This result is reasonable, as the spring tides in period II did not favor the accumulation of Chl a. Additionally, phytoplankton growth requires time (their growth rates range from 0.3 to 3 day–1) (Laws, 2013). The waters below the thermocline in the Changjiang Estuary are hypoxic and rich in CO2 in summer (Chou et al., 2009b). The upwelling of hypoxic and high-CO2 waters overtook the biological utilization of CO2 (Li et al., 2019), inducing extremely high pCO2 in surface waters during the initial period of upwelling. The extremely high pCO2 (∼600 μatm) observed in spring tides indicates that tidal mixing could be an important factor involved in carrying the high-CO2 waters below the thermocline to the surface (August 2–3, Figure 2C).
Eight days after the onset of upwelling, a pCO2 decrease of 353 μatm (from 635 to 282 μatm, Figure 3H) was observed within 8 h, accompanied by high Chl a. However, the salinity only changed by 1.59 within 8 h (Figures 3G,I). Additionally, the observed Chl a peaks were not necessarily related to low-salinity spikes, suggesting that they were probably not caused by the advection of the water mass. In situ CO2 uptake by phytoplankton could be the reason for such a sharp pCO2 decrease. Phytoplankton blooms occurred approximately 1 week after the onset of upwelling. Time delays have also been reported for blooms after typhoon events (Li et al., 2019). Phosphate supplies induced by upwelling are crucial for biological production in the Changjiang plume waters (Tseng et al., 2013), as these waters typically lack phosphate after strong biological production (Harrison et al., 1990; Wang et al., 2014). While the major nutrient supplying occurs during upwelling, the delay of blooms could possibly be attributed to hydrological factors, as the relaxation of upwelling and the neap tide favor the accumulation of Chl a.
Dynamic Air-Sea CO2 Flux of Plume Waters Under South Winds
The turbid waters in the inner shelf served as a carbon source to the atmosphere (Zhai et al., 2007; Figure 7), while the role of the mid-salinity plume waters as either a carbon sink or source was temporally variable under the south winds (Figures 2F, 6). The surface waters turned from a carbon source to a carbon sink during the advection period (Figure 7a), accompanied by extremely high Chl a and supersaturated oxygen (Figures 2C,D). Previous study has validated the role of Changjiang plume waters as a significant carbon sink in summer (Zhai and Dai, 2009; Tseng et al., 2014). In this study, the carbon sink was estimated to be approximately −12 mmol m–2 day–1 (Figure 2F), which agreed with the values reported in previous study (Guo et al., 2015). As plume waters were transported offshore during upwelling-favorable wind, the carbon sink area likely expanded (Figure 7a), enhancing the carbon sink of the coastal waters. A similar mechanism has been revealed in the Mississippi River plume (Huang et al., 2013). In the Changjiang plume waters, the carbon sink area was probably larger than that reported for the Mississippi River plume.
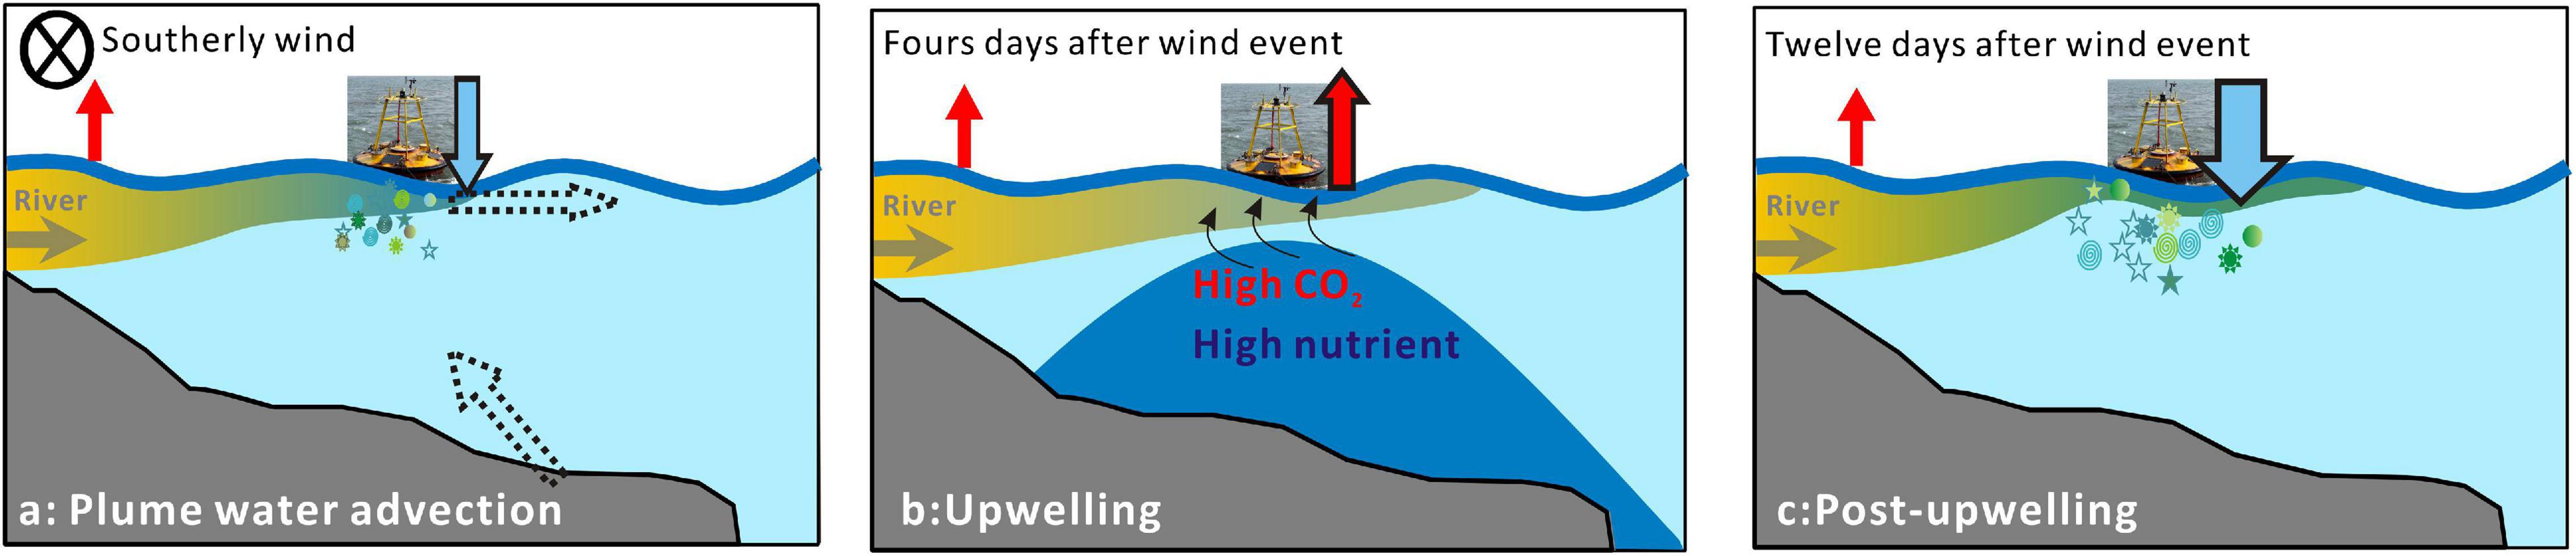
Figure 7. Schematic of carbon flux variations in the Changjiang plume under south winds at plume water advection (a), upwelling (b), and post-upwelling (c) stages. The arrows on the right side of the buoy show the air-sea CO2 fluxes in our results (blue arrow denotes carbon sink, while red arrow denotes carbon source). The horizontal and tilt dash arrows in panel (a) denote horizontal extension of plume waters and upwelling after the wind event, respectively. Upwelling of subsurface waters in panel (b) is marked by dark blue.
Upwelling is frequently observed in the coastal waters of Zhejiang and the outer Changjiang Estuary (Lü et al., 2006; Hu and Wang, 2016). In our study, upwelling occurred 4 days after the wind event. Our observations showed that wind-driven upwelling first made the area a carbon source (Figures 2F, 7b), which lasted for 5 days in our record. A previous study also suggested that the upwelling center along the Zhejiang coast had high surface DIC and supersaturated CO2 (Chou et al., 2009a). Twelve days after the wind event, the waters around the buoy turned into a strong carbon sink with high Chl a (Figure 7c). There are intense debates about whether upwelling areas should be carbon sources or carbon sinks. As inferred from our results, it could be strongly dependent on the timing of observations (Figures 7a–c). The overall effects of upwelling on the air-sea CO2 flux rely on nutrients and the CO2 concentrations of source waters during upwelling and should be evaluated on larger spatial and temporal scales.
The offshore advection of water parcels and cold upwelling water have been frequently observed in the outer Changjiang estuary and along the Zhejiang coast in summer (Zhao, 1993; Yuan et al., 2005; Lü et al., 2006; Chen C. et al., 2008; Moon et al., 2010). The interactions of biogeochemical and physical processes occur on multiple time scales of days to a week under the influence of winds. Thus, the surface carbon systems and the air-sea CO2 flux of coastal waters could be extremely dynamic, as inferred from our time-series study. A combination of mooring observations, transect surveys, numerical simulations, and satellite observations is needed to fully understand the response of carbon dynamics to wind events.
Data Availability Statement
The raw data supporting the conclusions of this article will be made available by the authors, without undue reservation, to any qualified researcher.
Author Contributions
JC and DL conceived the idea. DL collected the data and wrote the manuscript. XN, KW, and DZ collected and processed the data. BW, HJ, HL, FZ, and DH discussed and revised the manuscript. All authors reviewed the manuscript.
Funding
This study was jointly supported by the National Natural Science Foundation of China (U1709201, 41806095, 41706120, and 41976154), Long-Term Observation and Research Plan in the Changjiang Estuary and the Adjacent East China Sea Project I and II (LORCE I&II), Hypoxia and Acidification Monitoring and Warning Project in the Changjiang Estuary, and Scientific Research Fund of the Second Institute of Oceanography, MNR (JG1715).
Conflict of Interest
The authors declare that the research was conducted in the absence of any commercial or financial relationships that could be construed as a potential conflict of interest.
Publisher’s Note
All claims expressed in this article are solely those of the authors and do not necessarily represent those of their affiliated organizations, or those of the publisher, the editors and the reviewers. Any product that may be evaluated in this article, or claim that may be made by its manufacturer, is not guaranteed or endorsed by the publisher.
Acknowledgments
We would like to thank the crew of Zheshengyu 06145 for their support in collecting water samples and deploying the buoy. We would also like to thank Minhui Zheng for his help in the calibration of the SAMI-pCO2 sensor before and after the field deployment. Data are available by contacting the corresponding author. The remotely sensed SST data were obtained from the Remote Sensing Systems (www.remss.com), which is sponsored by NASA.
Footnotes
References
Bai, Y., Cai, W. J., He, X. Q., Zhai, W. D., Pan, D. L., Dai, M. H., et al. (2015). A mechanistic semi-analytical method for remotely sensing sea surface pCO2 in river-dominated coastal oceans: a case study from the East China Sea. J. Geophys. Res. 120, 2331–2349. doi: 10.1002/2014JC010632
Borges, A., Delille, B., and Frankignoulle, M. (2005). Budgeting sinks and sources of CO2 in the coastal ocean: diversity of ecosystems counts. Geophys. Res. Lett. 32:L14601.
Cai, W.-J., Dai, M. H., and Wang, Y. C. (2006). Air-sea exchange of carbon dioxide in ocean margins: a province-based synthesis. Geophys. Res. Lett. 33:L12603.
Cao, Z., Yang, W., Zhao, Y., Guo, X., Yin, Z., Du, C., et al. (2020). Diagnosis of CO2 dynamics and fluxes in global coastal oceans. Nat. Sci. Rev. 7, 786–797. doi: 10.1093/NSR/NWZ105
Chang, J., Shiah, F.-K., Gong, G.-C., and Chiang, K. P. (2003). Cross-shelf variation in carbon to chlorophyll a ratios in the East China Sea, summer 1998. Deep Sea Res. Part II 50, 1237–1247.
Chen, C., Xue, P., Ding, P., Beardsley, R. C., Xu, Q., Mao, X., et al. (2008). Physical mechanisms for the offshore detachment of the Changjiang diluted water in the East China Sea. J. Geophys. Res. 113:C02002.
Chen, C. T. A., Huang, T., Chen, Y. C., Bai, Y., He, X., and Kang, Y. (2013). Air-sea exchanges of CO2 in the world’s coastal seas. Biogeosciences 10, 6509–6544. doi: 10.5194/bg-10-6509-2013
Chen, C.-T. A., Zhai, W. D., and Dai, M. H. (2008). Riverine input and air–sea CO2 exchanges near the Changjiang (Yangtze River) Estuary: status quo and implication on possible future changes in metabolic status. Cont. Shelf Res. 28, 1476–1482. doi: 10.1016/j.csr.2007.10.013
Chou, W. C., Gong, G. C., Sheu, D. D., Hung, C., and Tseng, T. (2009a). Surface distributions of carbon chemistry parameters in the East China Sea in summer 2007. J. Geophys. Res. 114:C07026. doi: 10.1029/2008JC005128
Chou, W. C., Gong, G. C., Sheu, D. D., Jan, S., Hung, C. C., and Chen, C. C. (2009b). Reconciling the paradox that the heterotrophic waters of the East China Sea shelf act as a significant CO2 sink during the summertime: evidence and implications. Geophys. Res. Lett. 36:L15607. doi: 10.1029/2009GL038475
Cloern, J. E. (1999). The relative importance of light and nutrient limitation of phytoplankton growth: a simple index of coastal ecosystem sensitivity to nutrient enrichment. Aquat. Ecol. 33, 3–15. doi: 10.1023/A:1009952125558
Dai, M. H., Cao, Z. M., Guo, X. H., Zhai, W. D., Liu, Z., Yin, Z., et al. (2013). Why are some marginal seas sources of atmospheric CO2? Geophys. Res. Lett. 40, 2154–2158. doi: 10.1002/grl.50390
DeGrandpre, M. D., Hammar, T. R., and Wirick, C. D. (1998). Short-term pCO2 and O2 dynamics in California coastal waters. Deep Sea Res. Part II 45, 1557–1575. doi: 10.1016/s0967-0645(98)80006-4
Dickson, A. G., and Millero, F. J. (1987). A comparison of the equilibrium constants for the dissociation of carbonic acid in seawater media. Deep Sea Res. A Oceanogr. Res. Pap. 34, 1733–1743. doi: 10.1016/0198-0149(87)90021-5
Fassbender, A. J., Sabine, C. L., Feely, R. A., Langdon, C., and Mordy, C. W. (2011). Inorganic carbon dynamics during northern California coastal upwelling. Cont. Shelf Res. 31, 1180–1192. doi: 10.1016/j.csr.2011.04.006
Fong, D. A., and Geyer, W. R. (2001). Response of a river plume during an upwelling favorable wind event. J. Geophys. Res. 106, 1067–1084. doi: 10.1029/2000JC900134
Gong, G.-C., Wen, Y.-H., Wang, B.-W., and Liu, G.-J. (2003). Seasonal variation of chlorophyll a concentration, primary production and environmental conditions in the subtropical East China Sea. Deep Sea Res. Part II 50, 1219–1236. doi: 10.1016/s0967-0645(03)00019-5
Guo, X., Dai, M., Zhai, W., Cai, W.-J., and Chen, B. (2009). CO2 flux and seasonal variability in a large subtropical estuarine system, the Pearl River Estuary, China. J. Geophys. Res. 114:G03013. doi: 10.1029/2008JG000905
Guo, X. H., Cai, W.-J., Huang, W.-J., Wang, Y., Chen, F., Murrell, M. C., et al. (2012). Carbon dynamics and community production in the Mississippi River plume. Limnol. Oceanogr. 57, 1–17. doi: 10.4319/lo.2012.57.1.0001
Guo, X.-H., Zhai, W.-D., Dai, M.-H., Zhang, C., Bai, Y., Xu, Y., et al. (2015). Air–sea CO2 fluxes in the East China Sea based on multiple-year underway observations. Biogeosciences 12, 5495–5514. doi: 10.5194/bg-12-5495-2015
Harrison, P., Hu, M., Yang, Y., and Lu, X. (1990). Phosphate limitation in estuarine and coastal waters of China. J. Exp. Mar. Biol. Ecol. 140, 79–87. doi: 10.1016/0022-0981(90)90083-o
Hu, J., and Wang, X. H. (2016). Progress on upwelling studies in the China seas. Rev. Geophys. 54, 653–673. doi: 10.1002/2015RG000505
Huang, W., Cai, W. J., Castelao, R. M., Wang, Y., and Lohrenz, S. E. (2013). Effects of a wind-driven cross-shelf large river plume on biological production and CO2 uptake on the Gulf of Mexico during spring. Limnol. Oceanogr. 58, 1727–1735. doi: 10.4319/lo.2013.58.5.1727
Hung, C. C., Chung, C., Gong, G., Jan, S., Tsai, Y., Chen, K., et al. (2013a). Nutrient supply in the Southern East China Sea after Typhoon Morakot. J. Mar. Res. 71, 133–149. doi: 10.1357/002224013807343425
Hung, C. C., Tseng, C. W., Gong, G. C., Chen, K. S., Chen, M. H., and Hsu, S. C. (2013b). Fluxes of particulate organic carbon in the East China Sea in summer. Biogeosciences 10, 6469–6484. doi: 10.5194/bg-10-6469-2013
Körtzinger, A., Send, U., Lampitt, R., Hartman, S., Wallace, D. W., Karstensen, J., et al. (2008). The seasonal pCO2 cycle at 49 N/16.5 W in the northeastern Atlantic Ocean and what it tells us about biological productivity. J. Geophys. Res. Oceans 113:C04020.
Lachkar, Z., and Gruber, N. (2013). Response of biological production and air–sea CO2 fluxes to upwelling intensification in the California and Canary Current Systems. J. Mar. Res. 109, 149–160. doi: 10.1016/J.JMARSYS.2012.04.003
Laruelle, G. G., Lauerwald, R., Pfeil, B., and Regnier, P. (2014). Regionalized global budget of the CO2 exchange at the air-water interface in continental shelf seas. Glob. Biogeochem. Cycle 28, 1199–1214. doi: 10.1002/2014gb004832
Laws, E. A. (2013). Evaluation of In Situ Phytoplankton Growth Rates: a Synthesis of Data from Varied Approaches. Annu. Rev. Mar. Sci. 5, 247–268. doi: 10.1146/annurev-marine-121211-172258
Le, C. F., Gao, Y., Cai, W.-J., Lehrter, J. C., Bai, Y., and Jiang, Z.-P. (2019). Estimating summer sea surface pCO2 on a river-dominated continental shelf using a satellite-based semi-mechanistic model. Remote Sens. Environ. 225, 115–126. doi: 10.1016/J.RSE.2019.02.023
Li, D. W., Chen, J. F., Ni, X. B., Wang, K., Zeng, D. Y., Wang, B., et al. (2018). Effects of biological production and vertical mixing on sea surface pCO2 variations in the Changjiang River plume during early autumn: a buoy-based time series study. J. Geophys. Res. Oceans 123, 6156–6173. doi: 10.1029/2017JC013740
Li, D. W., Chen, J. F., Ni, X. B., Wang, K., Zeng, D. Y., Wang, B., et al. (2019). Hypoxic bottom waters as a carbon source to atmosphere during a typhoon passage over the East China Sea. Geophys. Res. Lett. 46, 11329–11337. doi: 10.1029/2019gl083933
Li, M., Li, R., Cai, W.-J., Testa, J. M., and Shen, C. (2020). Effects of wind-criven lateral upwelling on estuarine carbonate chemistry. Front. Mar. Sci. 7:588465. doi: 10.3389/FMARS.2020.588465
Lie, H. J., Cho, C. H., Lee, J. H., and Lee, S. (2003). Structure and eastward extension of the Changjiang River plume in the East China Sea. J. Geophys. Res. 108:3077.
Liu, K.-K., Gong, G.-C., Lin, S., Yang, C.-Y., Wei, C.-L., Pai, S.-C., et al. (1992). The year-round upwelling at the shelf break near the northern tip of Taiwan as evidenced by chemical hydrography. Terr. Atmos. Ocean. Sci. 3, 243–275. doi: 10.3319/tao.1992.3.3.243(keep)
Lü, X., Qiao, F., Xia, C., Zhu, J., and Yuan, Y. (2006). Upwelling off Yangtze River estuary in summer. J. Geophys. Res. Oceans 111:C11S08.
Mehrbach, C., Culberson, C. H., Hawley, J. E., and Pytkowicx, R. M. (1973). Measurement of the apparent dissociation constants of carbonic acid in seawater at atmospheric pressure. Limnol. Oceanogr. 18, 897–907. doi: 10.4319/lo.1973.18.6.0897
Moon, J.-H., Hirose, N., Yoon, J.-H., and Pang, I.-C. (2010). Offshore detachment process of the low-salinity water around Changjiang bank in the East China Sea. J. Phys. Oceanogr. 40, 1035–1051. doi: 10.1175/2010jpo4167.1
Moore, T. S., Degrandpre, M. D., Sabine, C. L., Hamme, R. C., Zappa, C. J., Mcgillis, W. R., et al. (2011). Sea surface pCO2 and O2 in the Southern Ocean during the austral fall, 2008. J. Geophys. Res. 116:C00F11. doi: 10.1029/2010JC006560
Moralespineda, M., Cozar, A., Laiz, I., Ubeda, B., and Galvez, J. A. (2014). Daily, biweekly, and seasonal temporal scales of pCO2 variability in two stratified Mediterranean reservoirs. J. Geophys. Res. 119, 509–520. doi: 10.1002/2013JG002317
Ni, X. B., Huang, D. H., Zeng, D. Y., Zhang, T., Li, H. L., and Chen, J. F. (2016). The impact of wind mixing on the variation of bottom dissolved oxygen off the Changjiang Estuary during summer. J. Mar. Res. 154, 122–130. doi: 10.1016/j.jmarsys.2014.11.010
Ning, X. R. (1988). Standing stock and production of phytoplankton in the estuary of the Changjiang (Yangtze River) and the adjacent East China Sea. Mar. Ecol. Prog. Ser. 49, 141–150. doi: 10.3354/meps049141
Pierrot, D., Lewis, E., and Wallace, D. (2006). MS Excel program developed for CO2 system calculations ORNL/CDIAC-105a. Oak Ridge, Tennessee: Carbon Dioxide Information Analysis Center, Oak Ridge National Laboratory, US Department of Energy.
Rabalais, N. N., Turner, R. E., and Wiseman, J. W. (2003). Gulf of Mexico hypoxia, A.K.A. “The dead zone”. Annu. Rev. Ecol. Syst. 33, 235–263. doi: 10.1146/annurev.ecolsys.33.010802.150513
Shen, Z., Zhou, S., and Pei, S. (2008). Transfer and transport of phosphorus and silica in the turbidity maximum zone of the Changjiang estuary. Estuar. Coast. Shelf Sci. 78, 481–492. doi: 10.1016/j.ecss.2008.01.010
Takahashi, T., Olafsson, J., Goddard, J. G., Chipman, D. W., and Sutherland, S. (1993). Seasonal variation of CO2 and nutrients in the high-latitude surface oceans: a comparative study. Glob. Biogeochem. Cycle 7, 843–878. doi: 10.1029/93GB02263
Ternon, J.-F., Oudot, C., Dessier, A., and Diverrès, D. (2000). A seasonal tropical sink for atmospheric CO2 in the Atlantic ocean : the role of the Amazon river discharge. Mar. Chem. 68, 183–201. doi: 10.1016/S0304-4203(99)00077-8
Tseng, C. M., Shen, P. Y., and Liu, K. K. (2014). Synthesis of observed air-sea CO2 exchange fluxes in the river-dominated East China Sea and improved estimates of annual and seasonal net mean fluxes. Biogeosciences 11, 3855–3870. doi: 10.5194/bg-11-3855-2014
Tseng, Y.-F., Lin, J., Dai, M., and Kao, S.-J. (2013). Joint effect of freshwater plume and coastal upwelling on phytoplankton growth off the Changjiang River. Biogeosciences 10, 10363–10397.
Wang, B., Chen, J. F., Jin, H. Y., Li, H. L., Huang, D. J., and Cai, W.-J. (2017). Diatom bloom-derived bottom water hypoxia off the Changjiang estuary, with and without typhoon influence. Limnol. Oceanogr. 62, 1552–1569. doi: 10.1002/lno.10517
Wang, K., Chen, J. F., Jin, H. Y., Li, H. L., Gao, S. Q., Xu, J., et al. (2014). Summer nutrient dynamics and biological carbon uptake rate in the Changjiang River plume inferred using a three end-member mixing model. Cont. Shelf Res. 91, 192–200. doi: 10.1016/j.csr.2014.09.013
Wei, Q. S., Yu, Z., Wang, B., Wu, H., Sun, J., Zhang, X., et al. (2017). Offshore detachment of the Changjiang River plume and its ecological impacts in summer. J. Oceanogr. 73, 277–294. doi: 10.1007/s10872-016-0402-0
Weiss, R. F. (1974). Carbon dioxide in water and seawater: the solubility of a non-ideal gas. Mar. Chem. 2, 203–215. doi: 10.1016/0304-4203(74)90015-2
Wu, H., Zhu, J., Shen, J., and Wang, H. V. (2011). Tidal modulation on the Changjiang River plume in summer. J. Geophys. Res. 116:C08017. doi: 10.1029/2011JC007209
Wu, Y. X., Dai, M. H., Guo, X. H., Chen, J., Xu, Y., Dong, X., et al. (2020). High-frequency time-series autonomous observations of sea surface pCO2 and pH. Limnol. Oceanogr. 66, 588–606. doi: 10.1002/LNO.11625
Xiong, T. Q., Liu, P. F., Zhai, W. D., Bai, Y., Liu, D., Qi, D., et al. (2019). Export Flux, biogeochemical effects, and the fate of a terrestrial carbonate system: from Changjiang (Yangtze River) estuary to the East China Sea. Earth Space Sci. 6, 2115–2141. doi: 10.1029/2019EA000679
Xuan, J. L., Huang, D. J., Zhou, F., Zhu, X., and Fan, X. (2012). The role of wind on the detachment of low salinity water in the Changjiang Estuary in summer. J. Geophys. Res. 117:C10004. doi: 10.1029/2012JC008121
Yin, K. D., Goldblatt, R. H., Harrison, P. J., John, M. S., Clifford, P. J., and Beamish, R. J. (1997). Importance of wind and river discharge in influencing nutrient dynamics and phytoplankton production in summer in the central Strait of Georgia. Mar. Ecol. Prog. Ser. 161, 173–183. doi: 10.3354/meps161173
Yuan, D. L., Qiao, F. L., and Su, J. (2005). Cross-shelf penetrating fronts off the southeast coast of China observed by MODIS. Geophys. Res. Lett. 32:L19603.
Zeebe, R. E., and Wolf-Gladrow, D. (2001). CO2 in Seawater: Equilibrium, Kinetics, Isotopes. Amsterdam: Elsevier Oceanography Book Series.
Zhai, W. D., and Dai, M. H. (2009). On the seasonal variation of air–sea CO2 fluxes in the outer Changjiang (Yangtze River) Estuary, East China Sea. Mar. Chem. 117, 2–10. doi: 10.1016/j.marchem.2009.02.008
Zhai, W. D., Dai, M. H., Cai, W.-J., Wang, Y., and Hong, H. (2005). The partial pressure of carbon dioxide and air–sea fluxes in the northern South China Sea in spring, summer and autumn. Mar. Chem. 96, 87–97. doi: 10.1016/j.marchem.2004.12.002
Zhai, W. D., Dai, M. H., and Guo, X. H. (2007). Carbonate system and CO2 degassing fluxes in the inner estuary of Changjiang (Yangtze) River, China. Mar. Chem. 107, 342–356. doi: 10.1016/j.marchem.2007.02.011
Zhang, Z. R., Zhou, M., Zhong, Y. S., Zhang, G. S., Jiang, S., Gao, Y. H., et al. (2020). Spatial variations of phytoplankton biomass controlled by river plume dynamics over the lower Changjiang Estuary and adjacent shelf based on high-resolution observations. Front. Mar. Sci. 7:587539. doi: 10.3389/FMARS.2020.587539
Zhang, Z. W., Wu, H., Yin, X. Q., and Qiao, F. L. (2018). Dynamical response of Changjiang River plume to a severe typhoon with the surface wave-induced mixing. J. Geophys. Res. 123, 9369–9388. doi: 10.1029/2018jc014266
Zhou, F., Chai, F., Huang, D. J., Xue, H. J., Chen, J. F., Xiu, P., et al. (2017). Investigation of hypoxia off the Changjiang Estuary using a coupled model of ROMS-CoSiNE. Prog. Oceanogr. 159, 237–254. doi: 10.1016/J.POCEAN.2017.10.008
Keywords: CO2, Changjiang plume, biological uptake, wind, upwelling, plume advection, air-sea CO2 flux
Citation: Li D, Ni X, Wang K, Zeng D, Wang B, Jin H, Li H, Zhou F, Huang D and Chen J (2021) Biological CO2 Uptake and Upwelling Regulate the Air-Sea CO2 Flux in the Changjiang Plume Under South Winds in Summer. Front. Mar. Sci. 8:709783. doi: 10.3389/fmars.2021.709783
Received: 14 May 2021; Accepted: 04 August 2021;
Published: 16 September 2021.
Edited by:
Bangqin Huang, Xiamen University, ChinaReviewed by:
Chen-Tung Chen, National Sun Yat-sen University, TaiwanXuegang Li, Institute of Oceanology, Chinese Academy of Sciences, China
Copyright © 2021 Li, Ni, Wang, Zeng, Wang, Jin, Li, Zhou, Huang and Chen. This is an open-access article distributed under the terms of the Creative Commons Attribution License (CC BY). The use, distribution or reproduction in other forums is permitted, provided the original author(s) and the copyright owner(s) are credited and that the original publication in this journal is cited, in accordance with accepted academic practice. No use, distribution or reproduction is permitted which does not comply with these terms.
*Correspondence: Jianfang Chen, amZjaGVuQHNpby5vcmcuY24=