Abstract
The erosion threshold of sand-mud mixtures is investigated by analyzing the momentum balance of a sand particle or a mud parcel in the mixture bed surface, and a formula for the critical shear stress of sand-mud mixtures is developed, which also applies for pure sand and mud. The developed formula suggests that the variation of the critical shear stress of sand-mud mixtures over mud content is mainly caused by the varying dry bulk density of the mud component in the mixture. The developed formula reproduces well the variation of the critical shear stress of sand-mud mixtures over mud content and can predict the critical shear stress of both sand-mud mixtures and pure mud in the process of consolidation. The developed formula promises to be convenient for application by relating the critical shear stress to mud content and the dry bulk density of sediment.
Introduction
The erosion of sediment is one of the controlling processes of sediment dynamics in aquatic systems. It concerns various domains, including geomorphology, pollutant transport, dredging activities, scour around structures, landward retreat of shorelines, bank failure, etc. (Sanford and Maa, 2001; Mostafa et al., 2008; Chen et al., 2017; Kurdistani et al., 2019; Zheng et al., 2020; Li et al., 2021). Assessment of the erodibility of sediment has therefore been of interest to numerous scientists and engineers. The particle size is one of the most critical factors affecting the erodibility of sediment. According to the particle size, sediments can be classified into gravel, sand, silt, and clay. Coarse-grained sediments, such as coarse silt, sand and gravel, are usually non-cohesive. Sediments comprised primarily of fine silt and clay exhibit cohesion, and therefore are often referred to as cohesive sediments or mud (Mehta and Partheniades, 1982; Van Rijn, 1993). The physicochemical properties of non-cohesive sediment and cohesive sediment are strikingly different. As a result, the erodibilities of non-cohesive and cohesive sediments have been separately studied in the past several decades (Van Ledden et al., 2004; Le Hir et al., 2011).
Non-cohesive sediment is eroded as individual particles. The erosion resistance of non-cohesive sediment is mainly provided by the submerged weight of the sediment, which leads to express the erosion threshold as a function of the size, shape and density of the particles (Miller et al., 1977; Chiew and Parker, 1994). For cohesive sediment, the interparticle attractive force coming from electrochemical effects is much more significant than the gravitational force and plays a dominant role in the erosional behavior and property (Righetti and Lucarelli, 2007). Experimental studies have shown that cohesive sediment is eroded as aggregates (i.e., surface erosion) at low bed shear stresses and as lumps or chunks of bed material (i.e., mass/bulk erosion) at high bed shear stresses (Partheniades, 1965; Mehta, 1989; Sanford and Maa, 2001; Winterwerp et al., 2012). The erosion threshold of cohesive sediment has been found to increase with increasing degree of compactness of sediment when other physicochemical properties of the sediment are controlled. Some empirical relationships were also developed between the critical shear stress and physical properties of cohesive sediments, including wet or dry bulk density (Tang, 1963; Owen, 1970; Dou, 2000; Amos et al., 2004; Xu et al., 2015; Zuo et al., 2017), water content (Jacobs et al., 2011), solid volume fraction (Kusuda et al., 1984; Mehta and Parchure, 2000), solid/void volume ratio (Wu et al., 2017) and yield stress (Zhang and Yu, 2017; Zhang et al., 2017). As the erodibility of cohesive sediment is also affected by factors like mineralogy, pore water chemistry, temperature, organic content, biological actions, etc., those relationships between the erosion threshold and the physical properties are often modified by these influences. Summaries on the theories and models for predicting the erosion threshold and rate of non-cohesive and cohesive sediments could be found in the studies of Zhu et al. (2008); Le Hir et al. (2011), and Chen et al. (2018, 2021).
In many natural environments, e.g., estuary, delta, mangrove forests, muddy and silty coasts, non-cohesive sediment and cohesive sediment are not completely separated and often occur as sand-mud mixtures (Carniello et al., 2012; Mehta and Letter, 2013). Compared with pure sand and pure mud, the erodibility of sand-mud mixtures has not been well-understood. A few experiments have been conducted to investigate the erodibility of sand-mud mixtures in the past decades (Torfs, 1995; Panagiotopoulos et al., 1997; Sharif, 2003; Le Hir et al., 2008; Jacobs et al., 2011; Ye et al., 2011; Smith et al., 2015; Van Rijn, 2020). These experiments have shown that sand-mud mixtures behave like cohesive sediments if they contain enough cohesive particles, otherwise like non-cohesive sediments (Torfs, 1995; Panagiotopoulos et al., 1997). The critical shear stress of sand-mud mixtures has been found significantly correlated to mud content. For non-cohesive mixtures, the critical shear stress generally increases with increasing mud content (Torfs, 1995; Le Hir et al., 2008; Smith et al., 2015). In some cases, a slight decrease in the sand threshold was sometimes observed for very low mud fractions (Torfs et al., 2000; Barry et al., 2006). Barry et al. (2006) attributed this decrease to viscous lubrication induced by clay-sized particles in the bed pore fluid. For cohesive mixtures, the critical shear stress increases monotonously with increasing mud content or firstly increases with mud content up to an optimum mud content then decreases slowly with further increasing mud content until 100% mud (Nalluri and Alvarez, 1992; Sharif, 2003; Ye et al., 2011; Smith et al., 2015; Van Rijn, 2020).
Those experiments of sand-mud mixtures have shown that the mixtures behave differently from pure sand and pure mud. Applying the formulae developed for pure sand and pure mud to sand-mud mixtures would induce massive errors. Van Ledden (2003) developed an empirical formula for the critical shear stress of sand-mud mixtures, which is expressed as a function of the mud content, the critical mud content, the critical shear stresses of pure sand and pure mud:
where τcr is the critical shear stress of sand-mud mixtures; pm is mud content; pmcr is the critical mud content (about 10–15%), below which the mixture is cohesionless and above which the mixture exhibits cohesion; τcrs and τcrm are the critical shear stresses of pure sand and pure mud, respectively; βv is an empirical coefficient between 0.75 and 1.25. Ahmad et al. (2011) developed a similar formula for the critical shear stress of sand-mud mixtures. Compared with the formula of Van Ledden (2003), their formula is simpler:
where ps is sand content (i.e., the fraction of sand in the mixture); and ζ is an empirical coefficient between 0.1 and 0.2. The formulae of Van Ledden (2003) and Ahmad et al. (2011) involve the critical shear stress of pure mud. However, both Van Ledden (2003) and Ahmad et al. (2011) did not give a solution to determine the critical shear stress of pure mud for a given sand-mud mixture, which limits the application of their formulae in practice. Recently, Wu et al. (2017) developed a formula for the critical shear stress of sand-mud mixtures by analyzing the force balance on a sediment parcel beginning to erode from the bed surface:
where τcrL is the critical shear stress for mixtures with low mud contents, τcrL = τcrs + 1.25(τcrmc−τcrs)min(pm,0.05); τcrmc is the critical shear stress for erosion of mud corresponding to the porosity of the mud component in a sediment mixture; α and βw are two coefficients. The value of α is related to the sand median diameter ds : α = 0.42exp (−3380ds). The value of βw is set as constant 1.2. Wu et al. (2017) assumed τcrmc could be calculated by the formula for the critical shear stress of pure mud. Based on their collected data of pure mud, they developed an empirical formula for the critical shear stress of pure mud:
where r is the solid/void volume ratio, r = (1−ϕm)/ϕm, with ϕm being the mud porosity. As the coefficient 10.29 in Eq. (4) may vary for different muds, Wu et al. (2017) suggested τcrmc could be calculated by:
where τcrc is a known critical shear stress for reference, which can be the critical shear stress in the case of 100% mud or another high mud content if the pure mud is not tested; rc is the solid/void volume ratio of the mixture/mud corresponding to the reference critical shear stress. Chen et al. (2018) also developed a formula for the critical shear stress of sand-mud mixtures based on the analysis of the balance of forces on a single particle of the mixture:
where d and ρs are the representative size and density of primary particles of the mixture, respectively; θcr0 is the critical Shields parameter of non-cohesive sediment which is of a diameter d and particle density ρs; ρ is density of water; dm and ρpm are the diameter and density of primary particles of the mud component of the mixture, respectively; ρd is the dry bulk density of the mixture; ρps is the density of sand particles; ρsdm is the stable dry bulk density of the mud component (which is the dry bulk density of the mud component when it gets fully consolidated); θcr1 and m are coefficients, θcr1 = 6.20×10⁻⁸ m3 s–2 and m = 1.55. The formula of Chen et al. (2018) applies not only to sand-mud mixtures but also to pure sand and mud. However, the stable dry bulk density of the mud component involved in the formulation is difficult to determine for a given sand-mud mixture, limiting the application of their formula.
The present study aims to develop a formula for the critical shear stress of sand-mud mixtures. The developed formula promises to be simple and easily applied in practice. It also should cover the full range of the mud content, i.e., it applies for pure sand, pure mud and sand-mud mixtures. The formula development, testing and discussion are described in the following sections.
Theoretical Framework for Incipient Motion Condition of Sand-Mud Mixtures
Particle Cohesion
The cohesion between the fine-grained particles arises from electrochemical effects and is often modulated by biochemical factors (e.g., mucopolysaccharide binding) (Mehta and Lee, 1994). The biochemical effect is not considered in this study, leaving a focus on the particle cohesion from electrochemical actions. The fine-grained particles usually carry net negative charges which attract cations in water to form a double-layer water film coating the particles. The coating water film cannot transfer hydrostatic pressure. Therefore, the water pressure would induce an additional force acting on the overlapping area when the water films coating the neighboring particles overlap. This additional force induced by water pressure has been verified by the experiment with cross-quartz fibers (Deriagin and Malkin, 1950). Some researchers have considered the additional force induced by water pressure as one of the origins of the cohesive force between fine-grained particles (e.g., Dou, 1962, 2000; Han, 1982; Zhang, 2012). Since there is a fundamental difference between the force induced by water pressure and the cohesive force arising from electrochemical actions, we prefer to consider them two different forces. The additional force induced by water pressure is not taken into account in this study because most of the existing erosion tests of sand–mud mixtures and pure mud were conducted in small-depth water flumes.
The van der Waals attraction has been generally believed to be responsible for particle cohesion from electrochemical effects in cohesive sediments (Han, 1982; Lick et al., 2004; Righetti and Lucarelli, 2007; Ternat et al., 2008). For two spherical particles of equal diameter, the van der Waals force fc between them is given by (Hamaker, 1937):
where dm is the diameter of the cohesive particles; lΔ is the separation distance between two particles (i.e., the smallest distance between the surfaces of the particles); Ah is the Hamaker constant which reflects the strength of the van der Waals force, with its value typically between 10–19 and 10–21 J. The Hamaker constant Ah is a function of the interacting particles and the intervening medium (Mehta, 2014). Therefore, its value is site-specific as the mineral compositions and pore water environments of cohesive sediments from different sites are usually different.
The van der Waals force is a short-range force with its effective acting range typically within ∼0.1 μm (Hoath, 2016). As the fine cohesive particles usually form loosely structures called aggregates or flocs, the separation distance between neighboring particles could be far larger than the effective acting range of the van der Waals force, i.e., the van der Waals force is not always effective between neighboring particles. Studies have shown that the van der Waals force is significant between two contacted cohesive particles and negligible between two particles not contacted directly (Han, 1982). Figure 1 shows the distinction between a separation distance between two contacted particles (lΔ) and a separation distance between two neighboring particles that are not contacted with each other (i.e., s−dm in which s is the distance between two neighboring particles). The separation distance between two contacted particles is generally on the same order of magnitude as the thickness of the water films coating the fine particles. The average separation distance s−dm between neighboring particles is usually on the same order of magnitude as the particle diameter. During the consolidation of cohesive sediment, the particle packing becomes dense and the cohesive force gets enhanced. Therefore, the average separation distance between two contacted particles is positively correlated to the average separation distance between two neighboring particles. And the two average separation distances decrease with increasing the compactness degree of the sediment. As a first approximation, it is assumed that the dimensionless average separation distance lΔ/δ (where δ is the thickness of the water film coating the cohesive particles) between two contacted particles is proportional to the dimensionless average separation distance (s−dm)/dm between neighboring particles, i.e.,
FIGURE 1
The distinction between a separation distance between two contacted particles (lΔ) and a separation distance between two neighboring particles not contacted with each other (s−dm).
where η is a coefficient.
The average (center-to-center) distance between neighboring particles s could be estimated from the dry bulk density of the mud component (Ternat et al., 2008):
Substituting Eqs. (8, 9) into Eq. (7), the van der Waals force between two contacted cohesive particles could be estimated by:
Incipient Motion Analysis of Sand-Mud Mixtures
The erosion behavior of sand-mud mixtures has been found related to the network structure of mixtures (Van Ledden et al., 2004; Jacobs et al., 2011; Wu et al., 2017). There are two typical network structures of sand-mud mixtures. When the mud content is low, the sand particles contact each other and form a skeleton, with the mud particles filling the voids formed between the sand grains (Figure 2A). This kind of mixture (referring to as sand-dominated mixtures hereafter) behaves as non-cohesive or less cohesive (Torfs, 1995; Van Ledden et al., 2004; Wu et al., 2017). The erosion process of these mixtures is governed by the sand component and occurs in the form of the detachment of particles of sand and flocs of mud. When the mud content is high, there are sufficient mud particles to prevent grain-to-grain contact of the sand particles, and consequently, the sand particles lose contact with each other and “float” in the mud matrix (Figure 2B). This kind of mixture (called mud-dominated mixtures hereafter) behaves as cohesive and the typical two erosion modes of cohesive sediment can occur (Torfs, 1995; Smith et al., 2015; Wu et al., 2017).
FIGURE 2
Network structures of (A) sand-dominated mixtures and (B) mud-dominated mixtures.
Consider a flat horizontal sand-dominated mixture bed and a flat horizontal mud-dominated mixture bed exposed to unidirectional flow. The erosion processes of the sand-dominated mixtures and the mud-dominated mixtures are, respectively, governed by the sand component and the mud component (Torfs, 1995; Van Ledden et al., 2004; Wu et al., 2017). Here we take the detachment of a sand particle in the bed surface as the incipient motion criterion of the sand-dominated mixtures and the entrainment of a cohesive sediment parcel (which may be a cohesive sediment floc or aggregate) in the bed surface as the incipient motion criterion of the mud-dominated mixtures.
The sand particles in sand-dominated mixtures have been found usually coated by a thin layer of the mud particles (Revil et al., 2002; Duteil et al., 2020; Van Rijn, 2020; Worden et al., 2020). The phenomenon is often documented as grain coating and ascribed to the adhesive force (the attraction/bonding between two particles of different media), diagenesis, biological actions, etc. (Duteil et al., 2020; Worden et al., 2020). Here, we assume that the sand particles in the sand-dominated mixtures are coated by a thin layer of the mud particles, and when a sand particle is disrupted from the bed surface, the coating layer is entrained together with the sand particle (Figure 3). This assumption has an advantage that in the analysis of the incipient motion of the sand particle, the adhesive forces between the sand particle and mud particles could be left out of consideration, which makes it easier to study the incipient motions of the sand-dominated mixtures and the mud-dominated mixtures in the same theoretical framework.
FIGURE 3
Forces acting on a sand particle (or a mud parcel) in the surface of a sand-dominated mixture (a mud-dominated mixture). For the sand-dominated mixture, regard the blue circle as a sand particle and the red circle as the coating layer; for the mud-dominated mixture, regard the red circle as a mud parcel.
Figure 3 shows the incipient motion condition of a sand particle (or a cohesive sediment parcel) belonging to a sand-dominated mixture (or a mud-dominated mixture). The forces acting on the sand particle or the mud parcel include the drag force Fd, the lift force Fl, the effective gravitational force G and the additional force Fc which is the resultant force of the interparticle attractive forces (the van der Waals forces) between the mud particles in the surface of the parcel or the coating layer of the sand particle and those surrounding mud particles. Considering the entrainments of the sand particle and the mud parcel are usually completed within a very short period, both the sand particle and mud parcel are assumed rigid bodies. The momentum balance equation for the critical condition of the incipient motions of the sand particle and the mud parcel is given by:
where dr is a representative diameter, which refers to the diameter of sand particles for sand-dominated mixtures or the average diameter of mud parcels for mud-dominated mixtures, i.e., dr = ds for pm≤pmcr and dr = da for pm > pmcr, with ds being the diameter of the sand particle and da being the diameter of the mud parcel; k1dr, k2dr, k3dr, and k4dr are the moment arms of the drag force Fd, lift force Fl, submerged weight G and resultant cohesive force Fc, respectively, with k1, k2, k3, and k4 set as the proportionality coefficients.
The drag and lift forces are given by and , respectively (Dou, 2000; Righetti and Lucarelli, 2007; Vollmer and Kleinhans, 2007; Wu et al., 2017), where Cd and Cl are drag and lift coefficients, respectively; ρ is the density of water; ub is the flow velocity near the bed surface and α1 is the area shape factor of the sand particle or the mud parcel.
The effective gravitational force G is given by , where α2 is a volumetric shape coefficient; g is the gravitational acceleration and ρpr is the density of the sand particle or the mud parcel, i.e., ρpr = ρps for pm≤pmcr and ρpr = ρpa for pm > pmcr with ρpa being the density of the mud parcel. For the sand-dominated mixtures, the effective weights of the mud particles in the thin coating layer are negligible due to the thin layer and the small size of the mud particles.
The resultant force Fc could be obtained by integrating those cohesive forces coming from the mud particles surrounding the motion-initiating sand particle or mud parcel: Fc = k5ncnfc, where fc is the cohesive force (the van der Waals force) between two contacted mud particles; n is the number of mud particles coating the motion-initiating sand particle or the number of mud particles in the buried surface of the motion-initiating mud parcel; cn is the coordination number, i.e., the average number of the contacted particles of a mud particle; k5 is a coefficient. According to Meissner et al. (1964), cn is a function of the volume fraction of solids:
where ρdm/ρpm denotes the volume fraction of solids of the mud component. n could be calculated by: , where denotes the buried surface area of the sand particle or the mud parcel in which ηΔ is the relative protruding height of the sand particle or mud parcel into the flow from the bed surface; and N is the number of mud particles per unit area of the buried surface of the sand particle or the mud parcel. Assuming the sizes of the sand particle and the mud parcel are far larger than the size of the mud particles, N could be estimated by:
where dm and ρpm are the diameter and density of the mud particles, respectively; s is the average distance between neighboring particles and ρdm is the dry bulk density of the mud component of the mixture. Considering Eqs. (9, 13), n is given by:
Considering Eqs. (10, 12, 14), the resultant force Fc is given by:
Substituting the expressions for Fd, Fl, G, and Fc into Eq. (11), the near-bed flow velocity for the incipient motion of sediment, ub,cr, is given by:
Assuming the log law of velocity is valid near the bed, the near-bed flow velocity could be calculated by (Wu et al., 2017; Zhang and Zou, 2019; Li et al., 2020):
where zb is the elevation where the drag force acts on the sediment particle or parcel; χ is the correction factor of Einstein (Einstein, 1950) and ks is the equivalent roughness height. Both zb and ks are related to the size of the sediment particle or parcel.
Substituting Eq. (17) into Eq. (16) and considering in which τb is the bed shear stress, the critical shear stress of sand-mud mixtures τcr could be obtained:
According to Eq. (18), the critical shear stress of sand-mud mixtures consists of two parts which are, respectively, contributed by the effective weight of the sand particle or the mud parcel (corresponding to the first term on the right side of the equation) and the cohesive strength from the mud component (corresponding to the second term). By ignoring the cohesion between particles [i.e., ignoring the second term in the right side of Eq. (18)], Eq. (18) is reduced to:
The left hand side of Eq. (19) is the critical Shields parameter. This yields
where is the critical Shields parameter of non-cohesive sediment of a particle diameter dr and is the dimensionless diameter, defined as . could be calculated from the Shields diagram or by the formula of Soulsby and Whitehouse (1997):
Substituting Eq. (20) into Eq. (18), the critical shear stress of sand-mud mixtures is given by:
where A = 0.5Ahk4k5(1-ηΔ)α1−1η−2δ−2(k1Cd + k2Cl)−1[5.75 log(30.2zbχ/ks)]−2.
The erosion threshold of the mud-dominated mixtures mainly depends from the cohesive strength of the mud component. Therefore, the first term on the right side of Eq. (22) could be negligible for mud-dominated mixtures. As a result, Eq. (22) can be further written as
where pm is mud content and pmcr is the critical mud content beyond which the mixture is a mud-dominated mixture or pure mud and below which the mixture is a sand-dominated mixture or pure sand.
Equation (23) is the formula we develop for predicting the critical shear stress of sand-mud mixtures. It covers the full range of mud content from 0 to 100%, i.e., it also applies for pure sand and pure mud. When the mud content is 0%, Eq. (23) is reduced into the widely used formula for non-cohesive sediment: . When the mud content is higher than 0 but lower than the critical mud content, i.e., 0 < pm≤pmcr, the mixture occurs in a sand-dominated structure and its critical shear stress is a function of the diameter of the sand particles, the diameter of the mud particles and the dry bulk density of the mud component. When the mud content is beyond the critical mud content, i.e., pm > pmcr, the mixture occurs in a mud-dominated structure or as pure mud. For this case, the critical shear stress is a function of the diameter of the mud particles and the dry bulk density of the mud component (or of the pure mud).
When applying Eq. (23) to a specific mixture, the dry bulk density of the mud component in the mixture needs to be determined first. As the mud particles fill in the space between the sand particles, the dry bulk density of the mud component in a mixture could be estimated by ρdm = ρdpm/(1−φs), where φs is the volume fraction of sand particles. Considering φs = ρdps/ρps, the dry bulk density of the mud component in a mixture is then calculated by:
Equation (24) shows the dry bulk density of the mud component is 0 for pure sand and equal to the dry bulk density of the mud when the mud content is 100%.
There are two coefficients in Eq. (23): pmcr and A. According to the existing experiments of sand-mud mixtures, the erosion mode of mixtures changes from non-cohesive to cohesive at a mud content of approximately 5–15%. As some sand-dominated mixtures could also exhibit weak cohesive behavior, the upper value, 15%, is used for the critical mud content in this study, i.e., pmcr = 15%. The value of A not only reflects the cohesion strength of the mud component, but also is related to the roughness of the mixture bed surface. Currently, it is difficult to determine the value of A as some coefficients in the expression for A are usually unknown, e.g., Ah, ηΔ, k4, and k5. Therefore, A is treated as an empirical coefficient that will be determined by the measured data of erosion thresholds.
Validity of the Developed Formula in Sand-Mud Mixtures
Data of eight groups of sand-mud mixtures collected from four experiments conducted by Torfs (1995); Sharif (2003), Jacobs et al. (2011), and Smith et al. (2015) are used to test the validity of Eq. (23) in sand-mud mixtures. The synopses of the collected data are listed in Table 1. Eq. (23) is applied to each group of data in this section. A best-fit value of A is adopted for each dataset, which was obtained by the regression analysis of the data. We also test the formulae of Van Ledden (2003); Ahmad et al. (2011), Wu et al. (2017), and Chen et al. (2018) using the same datasets. Each dataset and the corresponding testing results are described below.
TABLE 1
| Mixture name | Sand size (mm) | Mud size (mm) | Mud/clay content (%) | Critical shear stress (Pa) | Data source |
| Sand-kaolinite mixtures | 0.23 | 0.0008 | 0–14.9 | 0.35–3.048 | Torfs, 1995 |
| Sand-bentonite mixtures | 0.23 | 0.008 | 0–28 | 0.35–1.837 | |
| Sand-kaolinite mixtures | 0.20 | 0.006 | 0–100 | 0.21–1.67 | Sharif, 2003 |
| Sand-silt-kaolinite mixtures | 0.18 | 0.004 | 0–17 | 0.12–1.6 | Jacobs et al., 2011 |
| Sand-silt-bentonite mixtures | 0.18 | 0.002 | 0–16 | 0.17–0.99 | |
| Sand-kaolinite mixtures | 0.353 | 0.0038 | 0–100 | 0.154–0.881 | Smith et al., 2015 |
| Sand-kaolinite-bentonite mixtures | 0.353 | 0.005 | 0–100 | 0.168–1.802 | |
| Sand-mud mixtures | 0.353 | 0.0127 | 0–100 | 0.168–2.018 |
Summary of collected experimental data of sand-mud mixtures and data sources.
Experimental Data of Torfs (1995)
Torfs (1995) conducted a series of erosion experiments of artificial mixtures of sand and clay mineral in a straight flume with a rectangular cross-section. The mixtures were prepared by mixing clay mineral with fine sand and were kept at a constant bulk density around 1,850 kg m–3. Two kinds of clay mineral: kaolinite and montmorillonite, were used in the experiments. The sand is a uniform fine white quartz of a mean diameter around 0.23 mm and does not contain particles smaller than 63 μm. The mud (clay mineral) content varied from 0 to 14.9% for sand-kaolinite mixtures and from 0 to 28% for sand-montmorillonite mixtures. The bed shear stress was estimated by the slope of the energy line which was calculated from the water surface profile. The critical shear stress was defined as the average of the bed shear stresses before and after the onset of erosion. The onset of erosion was reached when sediment is falling into the sediment trap and/or the water samples contain suspended sediment.
As the formulae of Van Ledden (2003) and Ahmad et al. (2011) involve the critical shear stress for erosion of pure mud which is unknown in the two datasets, therefore, only the formulae of Wu et al. (2017); Chen et al. (2018) and Eq. (23) are applied to the two datasets. Figure 4 compares the calculated and measured critical shear stresses for the sand-kaolinite mixtures and sand-montmorillonite mixtures. For Eq. (23), the best-fit value of A equals 5.75 × 10⁻⁶ J m–2. As shown in Figure 4, Eq. (17) gives the best estimate of the measurements. The formulae of Wu et al. (2017) and Chen et al. (2018) could only capture the varying trend of the critical shear stress with mud content and both of them tend to underestimate the measured critical shear stresses.
FIGURE 4
The calculated vs. measured critical shear stresses in the case of Torfs (1995): (A) sand-kaolinite mixtures and (B) sand-montmorillonite mixtures.
Experimental Data of Sharif (2003)
Sharif (2003) conducted a series of erosion tests of sand-kaolinite mixtures using a straight-through recirculating flume with a rectangular cross-section. The sand used in the experiments has a narrow particle size range from 180 to 212 μm. The median diameter of the sand is about 200 μm. The kaolinite used in the experiments is the industrial-grade pure kaolinite mineral. The mixtures were prepared by mixing the well-sorted fine sand, kaolinite and water with an electrical blender. The mud content varied from 0 to 100%. The mixtures were allowed to consolidate for 48 h before the experiments. For each mixture (or pure mud) bed, the critical shear stresses of the sediment at different depths from the bed surface were measured. Particles from all over the bed starting to erode from the bed was defined as the threshold condition for critical shear stress. The bed shear stress was estimated from the log-law for the vertical velocity distribution and a measured velocity at the center of the bed.
Figure 5 shows the measured and predicted critical shear stress of sand-mud mixtures vary with mud content. Each subfigure represents the results of sediments of different mud contents for the same soil depth. For the formula of Van Ledden (2003), i.e., Eq. (1), pmcr is set as 15% and βv is set as 1.0. For the formula of Ahmad et al. (2011), i.e., Eq. (2), ζ is set as 0.15. These coefficients are given following the recommendations of Van Ledden (2003) and Ahmad et al. (2011) and are also used in other cases in this study. The best-fit value of A for Eq. (23) is 3.62 × 10⁻⁶ J m–2 in this case. As shown in Figure 5, the calculated critical shear stress by the formulae of Van Ledden (2003) and Ahmad et al. (2011) increases monotonically with increasing mud content, which is not consistent with the measurements. Eq. (23) and the formulae of Wu et al. (2017) and Chen et al. (2018) reproduce well the variation trend of critical shear stress with mud content.
FIGURE 5
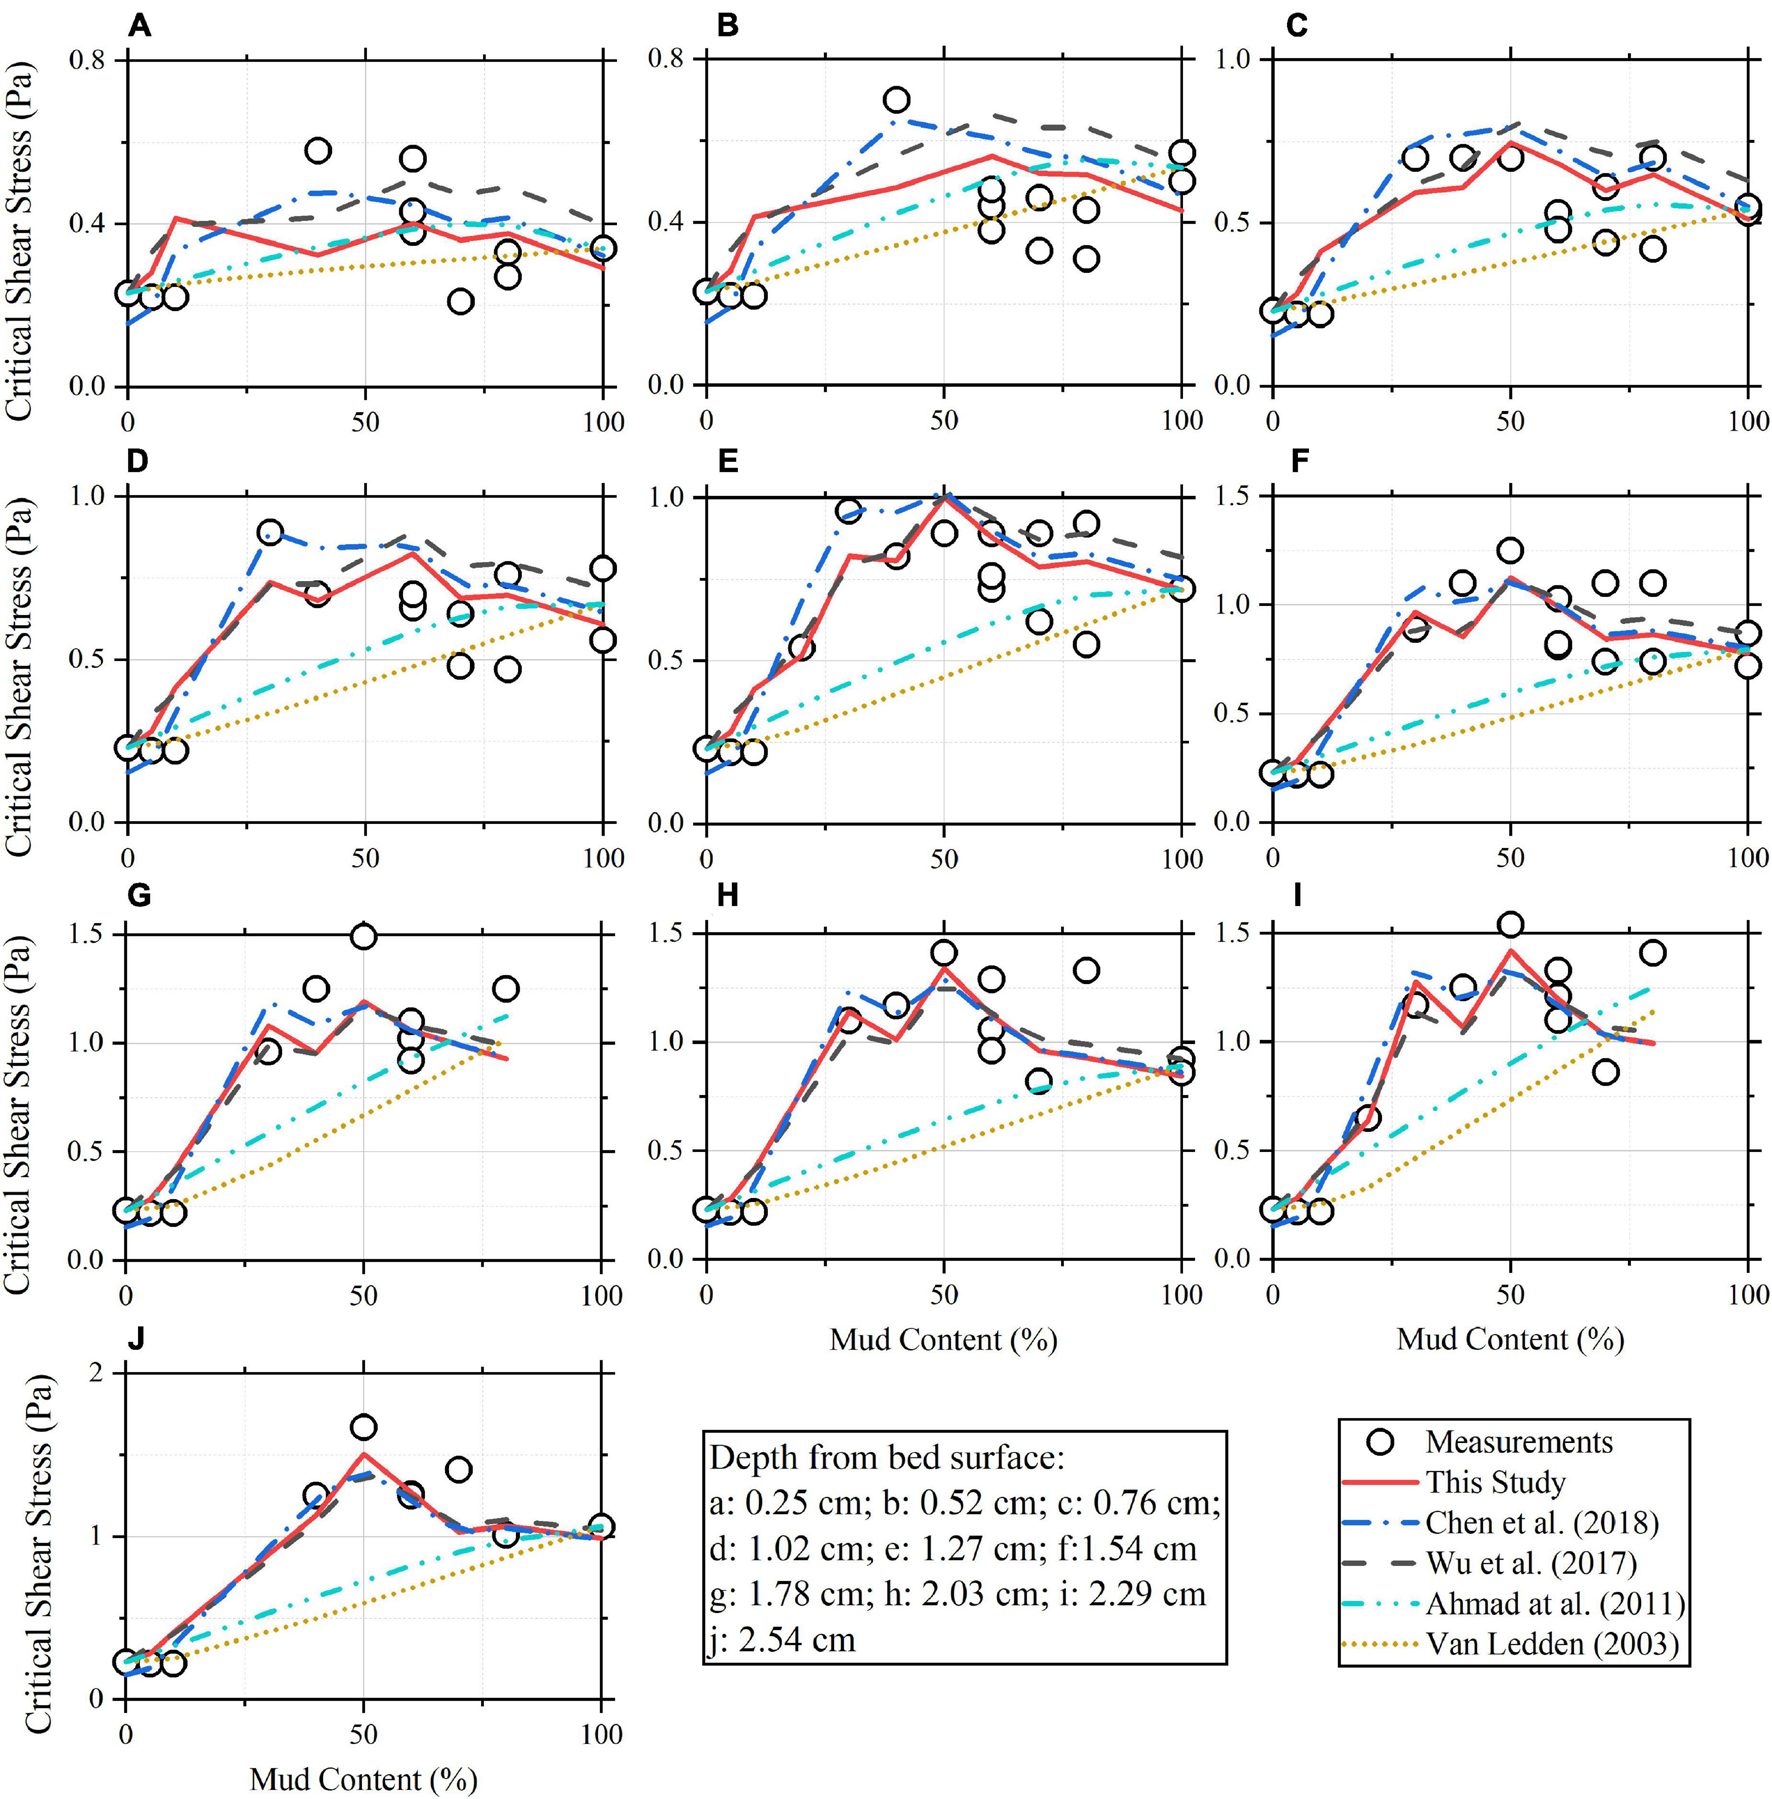
The calculated and measured critical shear stresses vary with mud content for sediment at different soil depths in the case of Sharif (2003): (A) 0.25 cm; (B) 0.52 cm; (C) 0.76 cm; (D) 1.02 cm; (E) 1.27 cm; (F) 1.54 cm; (G) 1.78 cm; (H) 2.03 cm; (I) 2.29 cm; and (J) 2.54 cm.
Experimental Data of Jacobs et al. (2011)
Jacobs et al. (2011) conducted a number of erosion tests on artificial sand-mud mixtures using a straight transparent enclosed flume, namely the Erodimetre. The flume is mainly constituted of a small-scale (1.20 m long, 8 cm wide, and 2 cm high) duct where a unidirectional flow can be generated by a recirculating pump. There is a circular cut-off at the bottom of the duct so that a sediment container could be installed where a sediment core can be placed and pushed upwards. During the erosion testing, the surface of the sediment sample was horizontally and vertically leveled with the bottom of the duct. The bottom of the duct was covered with sandpaper of a roughness comparable to the applied sand fraction to decrease differences in roughness with the sample.
The sand-mud mixtures were prepared by mixing fine sand, silt and clay in different proportions. The median particle diameters of the sand and silt used in the experiments are 180 and 30 μm, respectively. Two different clay minerals were applied: kaolinite and bentonite. A specific procedure was followed to generate reproducible and homogeneously mixed mixtures. First, sand, silt and clay fractions were oven-dried to disaggregate the material. Next, they were manually mixed for 10 min and placed in a cylindrical container with a removable bottom-lid. Small holes in the bottom and top-lid allow the passage of water and gas. In order to ensure the mixtures being 100% saturated, the containers with dry mixtures were placed in an exsiccator to remove air by lowering the pressure. Then the exsiccator was filled with CO2, after which the pressure was lowered again to replace enclosed air with CO2. Subsequently, the mixtures were left for 24 h in the exsiccator, in which a layer of water was present. The combination of the low pressure (reduced surface tension), 100% humidity and the attractive forces of the negatively charged clay particles enables water molecules to activate the clay particles. A layer of 10 cm de-aired and demineralized water was placed on top of the samples. Due to the difference between the atmospheric and the reduced pressure within the exsiccator, water percolated through the mixture thereby completing the saturation procedure.
To prevent consolidation, erosion tests were executed as soon as possible after the generation of the sample. A unidirectional flow generated by a recirculating pump was accelerated step by step (average duration of a step approximately 150–200 s) until the sample was eroded by a few mm. The volume of eroded sand was monitored at a sand trap downstream of the sediment sample, from which the erosion rate of the sand fraction could be derived. The erosion rate of the fine fraction is determined by dividing the time derivative of the continuously recorded turbidity by the surface area of the sample. The erosion threshold of a mixture was selected as the average abscissa of the extrapolated erosion rates assuming a linear relationship between the erosion rate and bed shear stress for both coarse and fine fractions. The bed shear stress was assumed proportional to the square of discharge in the flume, and the drag coefficient has been fitted so that the initiation of movement of the sand used in the experiments is consistent with the critical mobility parameter given by the Shields diagram.
As the mixtures were composed of sand, silt and clay and the clay contents are under 20% for all the mixtures, only Eq. (23) and the formula of Chen et al. (2018) are applied in this case. Figure 6 shows the measured and calculated critical shear stresses of mixtures varying with clay content. The best-fit value of A for Eq. (23) equals 1.16 × 10⁻⁵ J m–2 for sand-silt-kaolinite mixtures and 5.93 × 10⁻⁶ J m–2 for sand-silt-bentonite mixtures. As shown in Figure 6, the critical shear stresses calculated by Eq. (23) agree well with the measured values (Figures 6A,B), and the formula of Chen et al. (2018) tends to overestimate the critical shear stress at high clay contents (Figures 6C,D).
FIGURE 6
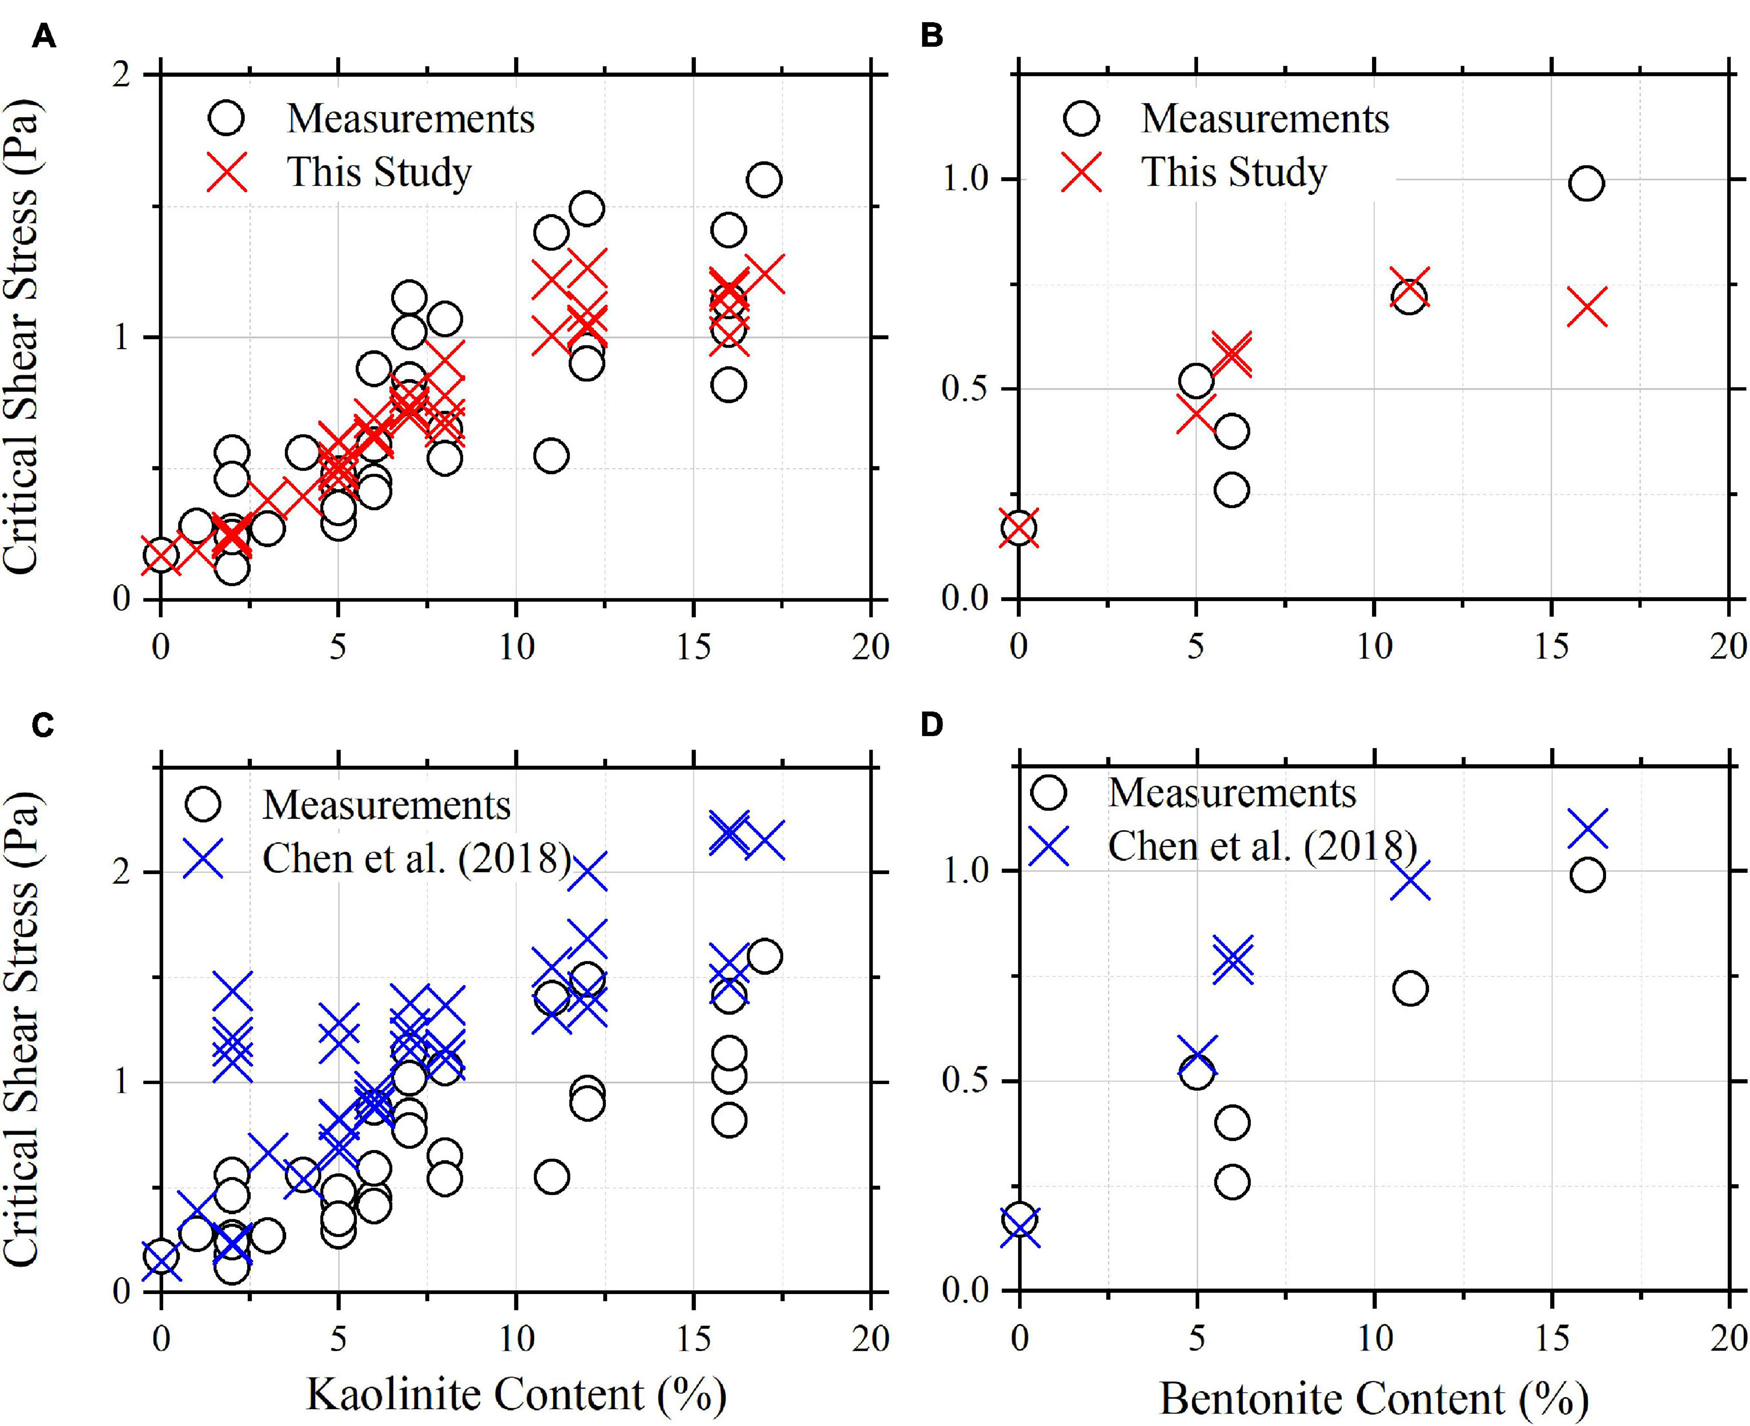
The calculated vs. measured critical shear stresses in the case of Jacobs et al. (2011): (A,C) sand-silt-kaolinite mixtures, (B,D) sand-silt-bentonite mixtures; (A,B) Eq. (23) and (C,D) the formula of Chen et al. (2018).
Experimental Data of Smith et al. (2015)
Smith et al. (2015) conducted erosion tests of sand-mud mixtures using the Sedflume, which is a small-scale enclosed duct-type flume (similar to the Erodimetre introduced above). The sand-mud mixtures were prepared by mixing varying fractions of mud with well-sorted quartz sand. The diameter of the sand ranges from 0.25 to 0.50 mm with the median diameter being 0.353 mm. Three different muds were used: kaolinite, mixed 80% kaolinite and 20% bentonite and a natural mud from the lower Mississippi River. The median diameters of the kaolinite, the kaolinite/bentonite mixture clay and the natural mud are 0.0038, 0.005, and 0.0127 mm, respectively. The natural mud has 3.5% organic content according to the test of loss-on-ignition.
Prior to mixing with sand, each mud was slurried with freshwater, and the slurry density was maintained at a density of about 1,400 kg m–3. Then an appropriate mass of mud slurry was added to sand to achieve the targeted mud mass fraction. The mixture was then hand-mixed for 3–10 min until mud and sand were evenly distributed throughout the sample. The mixture samples were formed into 10-cm diameters cores by two methods. For fluid mixtures, samples were extruded from a bag into the bottom of a core to minimize gas entrapment. For plastic and granular mixtures, water was added to the mixture to achieve saturation, and the samples were lightly tamped into the core tube in approximately 0.5–1 cm lifts. The prepared sediment cores were allowed to consolidate for 30 days in a 4°C cooler prior to the erosion test.
For each mixture sample, the erosion tests were conducted at five different shear stresses. The critical shear stress was defined as the bed shear stress corresponding to an erosion rate of 10–4 cm s–1 and obtained by fitting a power law for the erosion rate. The bed shear stress in the Sedflume was determined by the average flow velocity in the flume according to the Darcy equation in which the friction factor was estimated by the Prandtl equation (i.e., both the bed of the flume and the surface of the sediment sample were assumed hydraulically smooth).
Figure 7 shows the measured and calculated critical shear stresses varying with mud content. The formula of Chen et al. (2018) is not applied in this case since the stable dry bulk density of mud cannot be obtained based on the known data. The best-fit value of A for Eq. (23) equals 1.59 × 10⁻⁶ J m–2 for sand-kaolinite mixtures, 6.42 × 10⁻⁶ J m–2 for sand-kaolinite-bentonite mixtures and 1.04 × 10⁻⁵ J m–2 for sand-natural-mud mixtures. As shown in Figure 7, the formulae of Van Ledden (2003) and Ahmad et al. (2011) cannot capture well the varying behavior of the critical shear stress with mud content. Eq. (23) and the formula of Wu et al. (2017) reproduce well the critical shear stress of sand-kaolinite-bentonite mixtures (Figure 7B) and sand-natural-mud mixtures (Figure 7C). However, the latter two formulae can only reproduce the critical shear stress of sand-kaolinite mixtures of mud content lower than 15% and fail to capture well the varying trend of the critical shear stress of sand-kaolinite mixtures of high mud contents (Figure 7A). The reason for the latter two formulae failing in capturing the varying trend of the critical shear stress of sand-kaolinite mixtures of high mud contents is probably because the nominal mud contents would be lower than the actual mud contents. For sand-kaolinite mixtures of high mud contents (i.e., fluid mixture samples in the preparing process), the uneven settling of the sand fraction and the mud fraction would occur during the preparing process of the samples. This would lead to that more mud is present in the upper layer of the sample. A modification is made here by assuming the nominal mud contents being 6% lower than the actual mud contents for the sand-kaolinite mixtures of mud content higher than 15%. The calculated critical shear stresses by Eq. (23) and the formula of Wu et al. (2017) after modification are also plotted in Figure 7A, which shows better agreements with measurements than before. The uneven settling of the sand fraction and the mud fraction is not significant in sand-kaolinite-bentonite mixtures and sand-natural-mud mixtures. This could be attributed to the mud fractions has much stronger cohesion for sand-kaolinite-bentonite mixtures and sand-natural-mud mixtures, which could also be seen from the higher values of A.
FIGURE 7
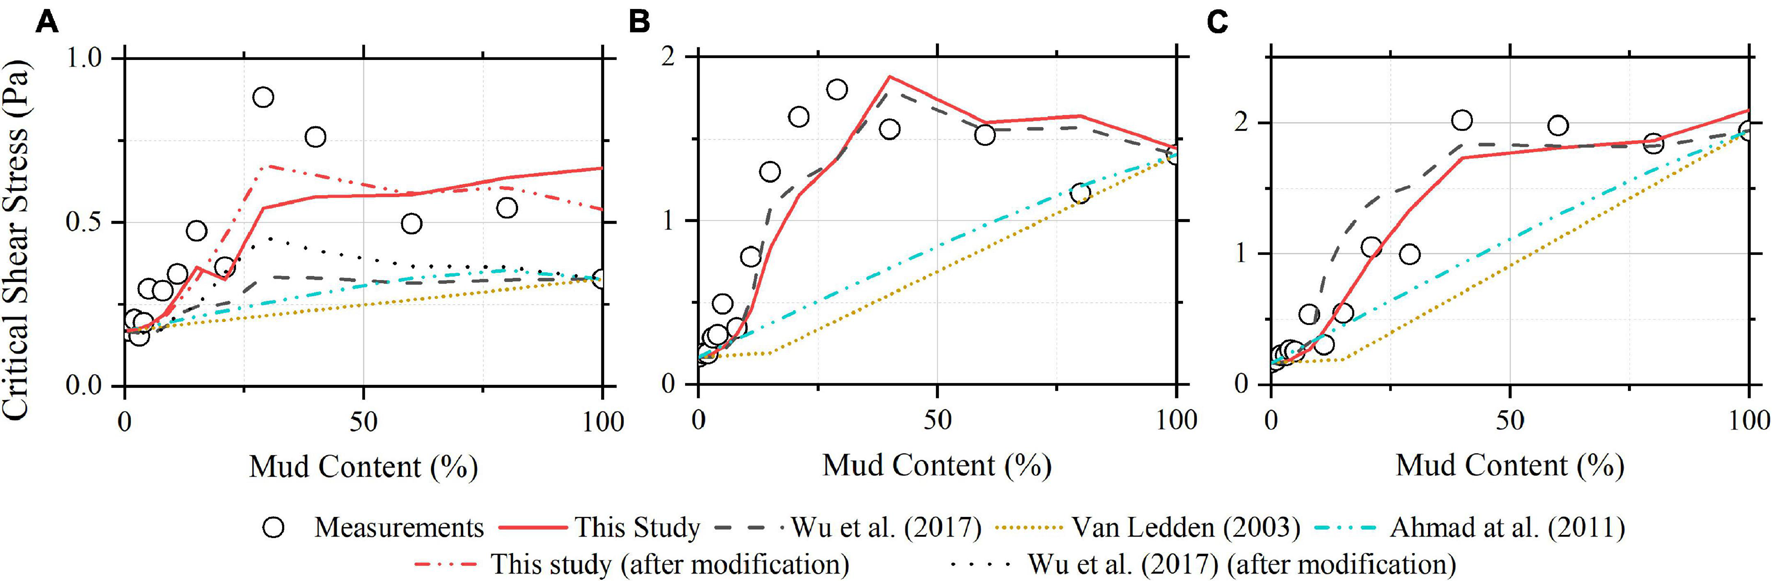
The calculated vs. measured critical shear stresses in the case of Smith et al. (2015): (A) the mixtures of sand and kaolinite; (B) the mixtures of sand and mixed clay; and (C) the mixtures of sand and natural mud.
Validity of the Developed Formula in Pure Mud
Nine sets of experimental data of pure mud were collected from literature to test the validity of the developed formula in pure mud. These muds include one group of pure clay mineral, two groups of estuarine mud and six groups of coastal mud. In each experiment, the critical shear stresses of the muds of different bulk densities were measured. The synopsis of the collected data and the data sources are listed in Table 2.
TABLE 2
| Mud name | Median diameter (mm) | Dry bulk density (kg m–3) | Critical shear stress (Pa) | Data source |
| Pure kaolinite | 0.006 | 385–610 | 0.34–1.06 | Sharif, 2003 |
| Chikugo estuary mud | 0.0073 | 83–277 | 0.02–0.18 | Kusuda et al., 1984 |
| Lianyungang port mud | 0.004 | 173–610 | 0.12–2.39 | Huang, 1989 |
| Lianyungang waterway mud | 0.0051 | 246–634 | 0.08–1.34 | Yang et al., 2018 |
| Hangzhou bay mud | 0.0104 | 415–655 | 0.19–0.55 | Yang and Wang, 1995 |
| Zhejiang coastal mud (location 1/L1) | 0.0041 | 384–520 | 0.29–0.76 | Li et al., 1995 |
| Zhejiang coastal mud (location 2/L2) | 0.0054 | 429–558 | 0.31–0.73 | |
| Tianjin new port mud | 0.0053 | 121–964 | 0.02–3.40 | Hong and Xu, 1991 |
| Huangmaohai estuary mud | 0.007 | 161–883 | 0.03–4.19 | Xu et al., 2015 |
Summary of collected experimental data of pure mud and data sources.
Equation (23) is then applied to the nine datasets. For each dataset, the best-fit value of A is used, which was obtained by the regression analysis of the data. The formula of Chen et al. (2018) and Eq. (4) (which was developed by Wu et al. (2017) for calculating the critical shear stress of pure mud) are also applied to each dataset if they are applicable. Figure 8 shows the application results of those formulae. As shown in Figure 8, the formula of Chen et al. (2018) and Eq. (4) only reproduce well the critical shear stress of pure mud in a few cases. Eq. (23) gives reasonable estimates of the critical shear stress in all the cases, demonstrating the capacity of the developed formula in pure mud.
FIGURE 8
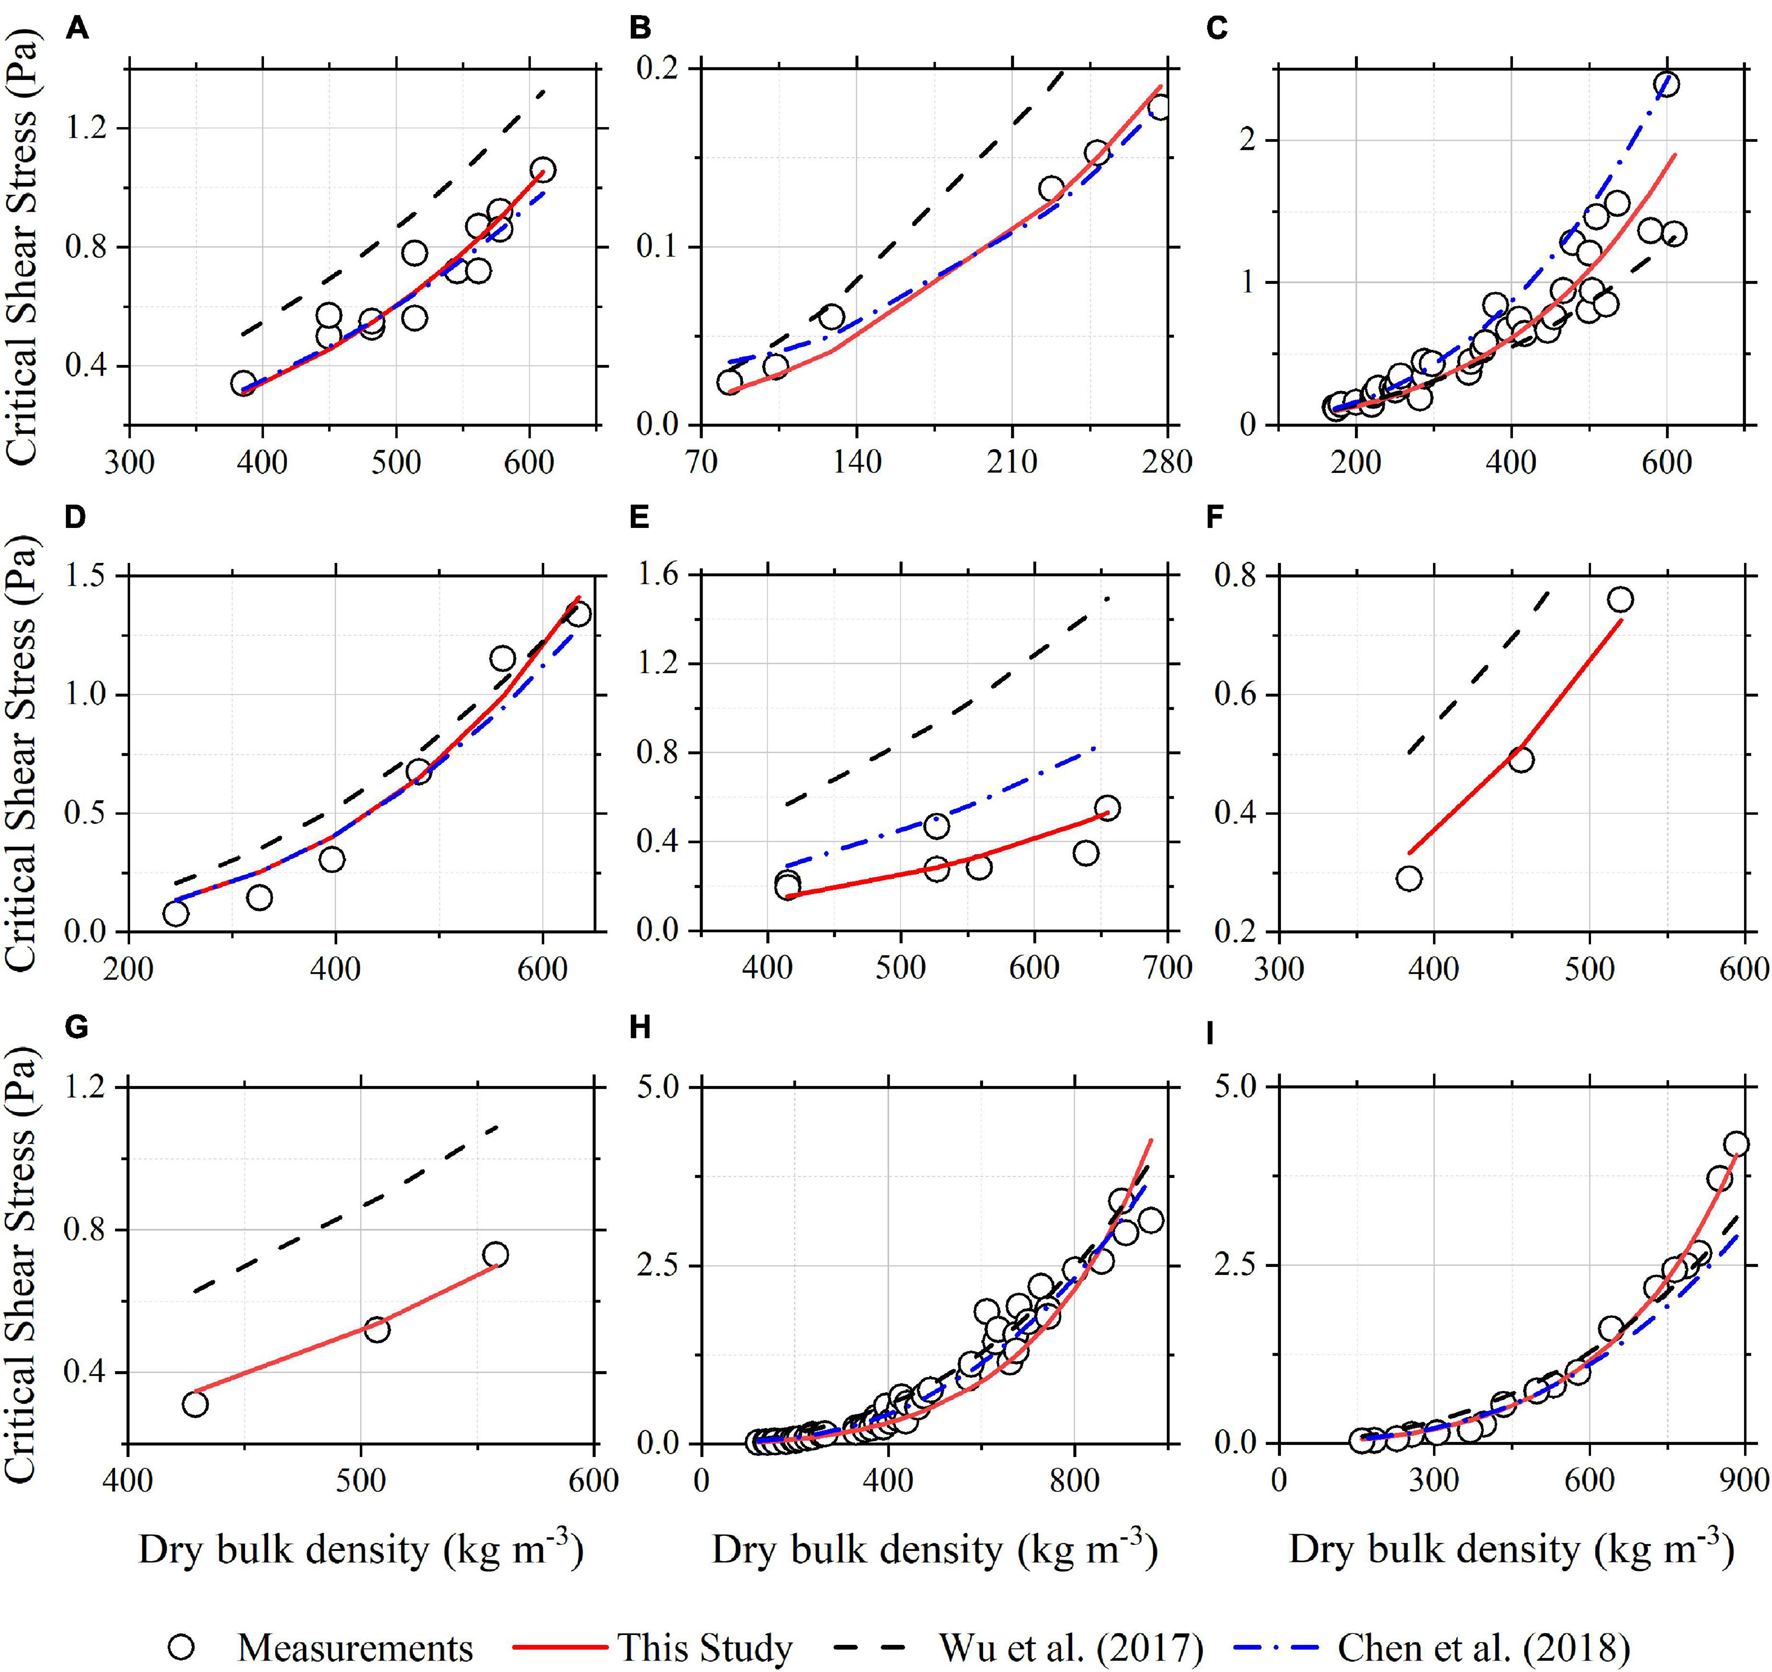
The comparisons of Eq. (23) and the formulae of Wu et al. (2017) and Chen et al. (2018) with the measured critical shear stresses: (A) pure kaolinite; (B) Chikugo estuary mud; (C) Lianyungang port mud; (D) Lianyungang waterway mud; (E) Hangzhou Bay mud; (F) Zhejiang coastal mud (Location 1); (G) Zhejiang coastal mud (Location 2); (H) Tianjin New Port mud; and (I) Huangmaohai Estuary Mud.
Discussion
The Coefficient A
The value of A is related to both the cohesion strength of the cohesive component in the sediment and the roughness of the bed surface. The cohesion strength is denoted by the Hamaker constant, which is a function of the particle itself including the mineral composition, the particle shape and the surface roughness, and the pore water environment including the pH value, the sort and concentration of ions. As the mineral composition and the pore water environment of sediment usually vary from site to site, the value of Hamaker constant and the value of A are supposed to be site-specific. The surface roughness of sand-mud mixtures depends on the network structure of mixtures, the aggregation of mud and the occurrence of erosion events (Mitchener and Torfs, 1996; Le Hir et al., 2008; Perkey et al., 2020). Different experimental results of surface roughness of sand-mud mixtures were often reported (Baas et al., 2013; Das et al., 2019). A widely accepted quantitative understanding of the roughness parameter of sand-mud mixtures and its effect on the drag and lift coefficients have not been available. Therefore, A is treated as an empirical coefficient in this study with its value being determined by the measured erosion thresholds.
The threshold of erosion in most existing tests of sand-mud mixtures and pure mud was usually determined by visual observation which is subjective and highly empirical. A universal criterion for the erosion threshold of sediment, especially of cohesive sediments, is not available currently. Therefore, the different criteria for determining the threshold of erosion would also have an effect on the value of A. This makes it more challenging to develop an expression for A.
The best-fit values of A for each dataset of sand-mud mixtures and pure mud are presented in Table 3. As shown in Table 3, the value of A is generally on the order of magnitude of 10–6 or 10–5 J m–2. Specifically, the value of A is the range of 1.59 × 10⁻⁶−1.16 × 10⁻⁵ J m–2 for kaolinite and sand-kaolinite mixtures; 5.93 × 10⁻⁶–9.58 × 10⁻⁶ J m–2 for sand-bentonite mixtures; 4.89 × 10⁻⁶ J m–2 for mixtures of sand and kaolinite and bentonite mixed clay; 2.86 × 10⁻⁶–1.04 × 10⁻⁵ J m–2 for pure mud and sand-mud mixtures.
TABLE 3
| Sand-mud mixtures | A (10–6 J m−2) | Pure mud | A (10–6 J m−2) |
| Sand-kaolinite mixtures (Torfs, 1995) | 5.75 | Pure kaolinite | 3.88 |
| Sand-bentonite mixtures (Torfs, 1995) | 9.58 | Chikugo estuary mud | 5.94 |
| Sand-kaolinite mixtures (Sharif, 2003) | 3.62 | Lianyungang port mud | 4.65 |
| Sand-silt-kaolinite mixtures (Jacobs et al., 2011) | 11.59 | Lianyungang waterway mud | 4.18 |
| Sand-silt-bentonite mixtures (Jacobs et al., 2011) | 5.93 | Hangzhou bay mud | 2.86 |
| Sand-kaolinite mixtures (Smith et al., 2015) | 1.59 | Zhejiang coastal mud | 2.86 (L1); 2.98 (L2) |
| Sand-kaolinite-bentonite mixtures (Smith et al., 2015) | 4.89 | Tianjin new port mud | 2.98 |
| Sand-mud mixtures (Smith et al., 2015) | 10.38 | Huangmaohai estuary mud | 5.18 |
Application results of the developed formula in sand-mud mixtures and pure muds.
Although the value of A is site- or sediment- specific, a general or practical value is expected, with which Eq. (23) could give a reasonable estimate of critical shear stress of most of the common sediments. Based on the collected data of sand-mud mixtures and pure mud, a general value of 3.97 × 10⁻⁶ J m–2 is recommended, which was obtained by the following method. The value of A was allowed to increase from 1.0 × 10⁻⁷ J m–2 to 1.0 × 10⁻⁴ J m–2 with a step of 1.0 × 10⁻⁸ J m–2. For each value of A, Eq. (23) was applied to all the collected datasets, and the logarithmic root-mean-square error of the calculated critical shear stresses was computed. The logarithmic root-mean-square error is used as a statistical indicator to evaluate the performance of the regression model for the quantity of the measured critical shear stress varies in several orders of magnitude. The general value of A is obtained when the logarithmic root-mean-square error of the calculated critical shear stresses reaches its minimum value. The logarithmic root-mean-square error, denoted as logErms, is defined by:
where τcr,c,i and τcr,m,i are the calculated and measured critical shear stresses, respectively; i is the data index and M is the total number of the collected data.
The comparisons of Eq. (23) and the measured critical shear stresses in all the datasets are shown in Figures 9A,B. For Figure 9A, the best-fit value of A (see Table 3) is used for each dataset; and for Figure 9B, the general value of A, 3.97 × 10⁻⁶ J m–2, is used for all the datasets. The comparisons of the formulae of Wu et al. (2017) and Chen et al. (2018) with measurements are also shown in Figures 9C,D. As shown in Figure 9, Eq. (23) with best-fit values of A has the best prediction performance. Eq. (23) with the general value of A also has a good prediction performance, better than the formulae of Wu et al. (2017) and Chen et al. (2018). The average relative error (E), defined as E = [∑(τcr,c,i/τcr,m,i−1)]/M×100%, is 22.9% for Eq. (23) with best-fit values of A, 34.3% for Eq. (23) with the general value of A, 38.3% for the formula of Chen et al. (2018) and 54.5% for the formula of Wu et al. (2017). For Eq. (23) with best-fit values of A, 90.3 and 99.2% of the collected data points are, respectively, within the range of 50 and 100% error (i.e., |τcr,c/τcr,m−1| < 0.5 and |τcr,c/τcr,m−1| < 1.0). Accordingly, for Eq. (23) with the general value of A, 79.3 and 97.4% of the data points are, respectively, within the range of 50 and 100% errors; for the formula of Chen et al. (2018), 73.3 and 93.0% of the data points are, respectively, within the range of 50 and 100% errors; and for the formula of Wu et al. (2017), 62.7 and 82.1% of the data points are, respectively, within the range of 50 and 100% errors.
FIGURE 9
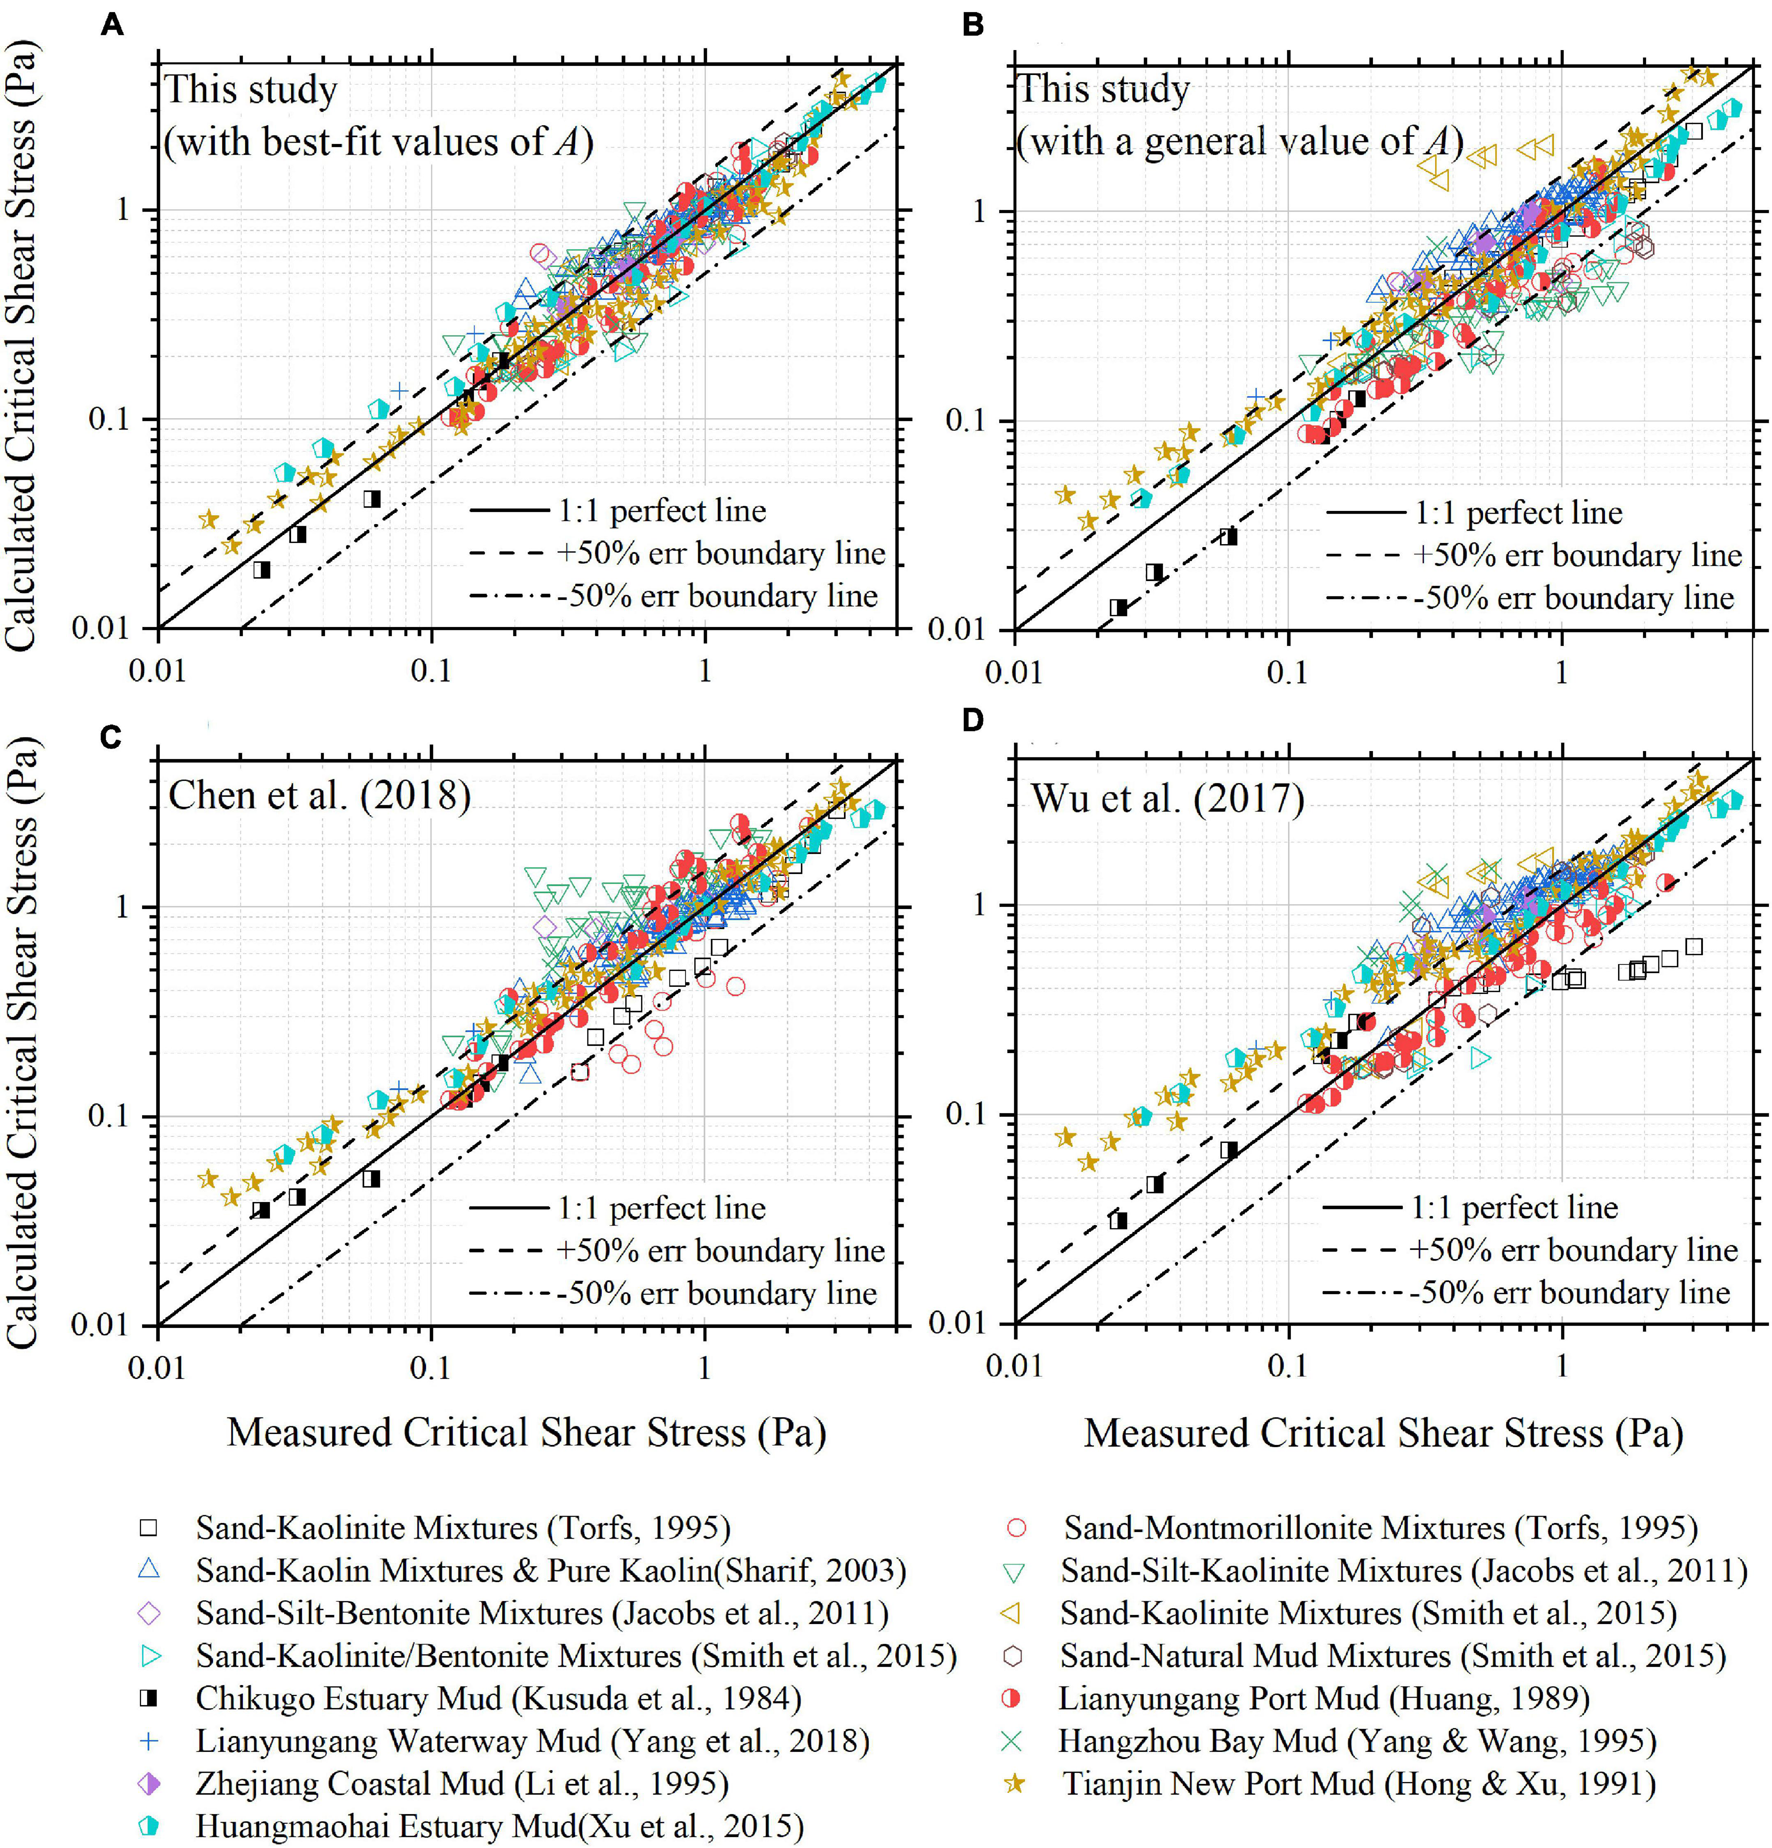
The comparisons of the calculated and measured critical shear stresses in the collected datasets: (A) Eq. (23) (in which the best-fit value of A is used for each dataset), (B) Eq. (23) (in which a constant value of A is used for all the datasets: 3.97 × 10⁻⁶ J m–2), (C) the formula of Chen et al. (2018), and (D) the formula of Wu et al. (2017).
Although Eq. (23) with the general/practical value of A has an acceptable prediction accuracy, it is noted that the value of A could be optimized when Eq. (23) is applied to a specific site. The accurate value of A for a specific site can be determined by applying Eq. (23) to the sediment of known critical shear stress, which could be obtained by a laboratory or field erosion test. Then Eq. (23) can be applied to calculate the critical shear stress of sediments of different mud contents and bulk densities in the site.
Effects of the Network Structure of Sand-Mud Mixtures
Equation (23) indicates that the dry bulk density of the mud component is a more direct factor affecting the erodibility of a mixture than the dry bulk density of the mixture. The variation of the critical shear stress of sand-mud mixtures with mud content is mainly caused by the varying dry bulk density of the mud component in the mixture. These findings are consistent with previous observations by Migniot (1989); Waeles et al. (2008), Dickhudt et al. (2011); Le Hir et al. (2011), Wu et al. (2017), and Chen et al. (2018). As the network structure of sand-mud mixtures affects the consolidation of sand-mud mixtures, the network structure of sand-mud mixtures would have effects on the dry bulk density of the mud component and also the mixture critical shear stress. Here the effects of the network structure of sand-mud mixtures are investigated using the experimental data of Sharif (2003).
Figure 10 shows the dry bulk density of the mud component (Figure 10A) and the critical shear stress calculated by the developed formula (Figure 10B) varying with mud content in the case of Sharif (2003). A is taken the value of 3.62 × 10⁻⁶ J m–2 in the calculations. All the sediments in the experiments were allowed to consolidate for 48 h before the erosion test. The dry bulk density and the critical shear stress of sediment at different depths from the bed surface were measured. Each solid line with markers in Figure 10 represents the results of sediment samples of different mud contents at the same depths.
FIGURE 10
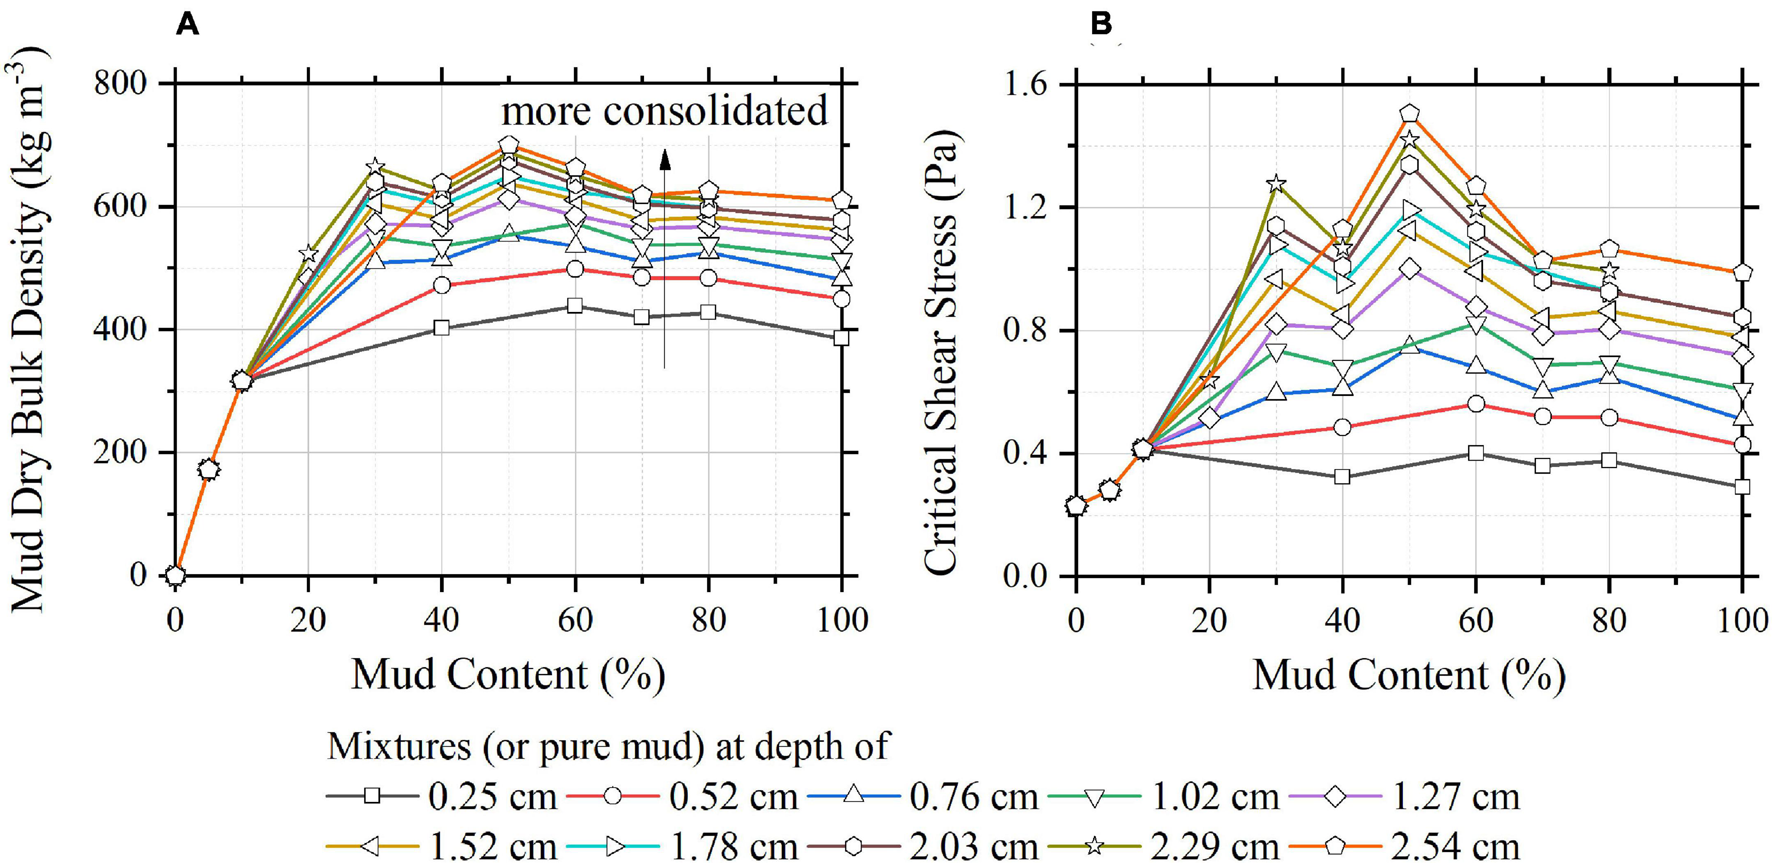
The dry bulk density of the mud component (A) and the calculated critical shear stress (B) vary with mud content in the case of Sharif (2003).
Figure 10A shows that the dry bulk density of the mud component increases markedly with increasing mud content from 0 to 10%. With further increase in mud content, the dry bulk density of the mud component first continues to increase and reaches a maximum at an optimum mud content, after that decreases gradually in a slight rate until 100% mud content. The optimum mud content seems to be in the range of 30–50% in this dataset. The dips of the dry bulk density at 40% mud content may be caused by uncertainty in measurements. As generally predicted by the developed formula, the critical shear stress varies with mud content in a similar way as the dry bulk density of the mud component (Figures 10A,B).
As shown in Figure 10A, the dry bulk density of the mud component does not change with depth for the mud content below 10% and varies with depth when the mud content equals or exceeds 20%. This indicates that the critical mud content for being able to form a sand skeleton is between 10 and 20%. Because when a sand skeleton is formed, the mud particles are in the voids of the sand particles. For such a condition, the mud particles are protected by the sand skeleton, and the sediment depth will have no effect on the consolidation of the mud component. The mud component only consolidates under its self-weight, and therefore, the more mud fraction, the larger the dry bulk density of the mud component. When the mud content is beyond the critical mud content, the complete sand skeleton cannot be formed. For this case, the mud component consolidates under the influence of the effective weight of the overlying layer. Therefore, for the same consolidation time, the deeper sediment depth, the higher the degree of the consolidation of the mud component.
The behavior of the dry bulk density of the mud component increasing first and then decreasing gradually when the mud content is beyond the critical mud content is not well-understood. A reasonable explanation is proposed here. When the mud fraction is not very high, although a complete sand skeleton cannot be formed, some sand particles could still contact each other and form an incomplete skeleton. For this condition, the mud component and the sand component share the load from the effective weight of the overlying layer of sediment. The mud component consolidates under the received load and the self-weight. The more mud fraction means less help from the sand particles and more load received by the mud component. Therefore, a higher mud content will lead to a faster consolidation of the mud component in a mixture. However, if the mud fraction is high enough that all the sand particles lose contact and are dispersed in the mud matrix. For this condition, the mud component consolidates under the self-weight and the load from the overlying layer. As the sand could assist drainage and the density of the sand particles is higher than that of mud blocks, the increase in the mud content will not benefit the consolidation of the mud component. The more mud fraction and the less sand fraction lead to a lower consolidation rate. Under these two opposing influences, the dry bulk density of the mud component in sand-mud mixtures of the same consolidation time will first increase then decrease.
Conclusion
The erosion threshold of sand-mud mixtures has been studied by a theoretical analysis of the momentum balance of a sand particle or a mud parcel under the initial motion condition. A formula for the critical shear stress of sand-mud mixtures was developed, which also applies for pure sand and mud. The developed formula is expressed as a function of the primary particle diameters of the sand and mud components, mud content and the dry bulk density of sediment. Compared with the existing formulae for sand-mud mixtures, the developed formula is much easier for application as it has few coefficients and does not involve the critical shear stress of pure mud and the stable dry bulk density of mud in its expression.
The developed formula can be simplified to the widely used formula for pure sand when the mud content is 0 and has been successfully tested by four sets of experimental data of sand-mud mixtures and nine sets of experimental data of pure mud, which demonstrates the capability of the developed formula in pure sand, pure mud and sand-mud mixtures. The value of A in the developed formula is supposed to be site-specific. According to the collected experimental data, it is generally on the order of magnitude of 10–6 or 10–5 J m–2. A value of A, 3.97 × 10⁻⁶ J m–2, is recommended for general sand-mud mixtures and mud. But it is emphasized that the value of A could be optimized when the developed formula is applied to a specific site.
The developed formula shows that the erosion threshold of sand-mud mixtures is highly affected by the dry bulk density of the mud component. The varying dry bulk density of the mud component in a sand-mud mixture is the main reason for the variation of its critical shear stress with mud content. By analyzing the consolidation behavior of the mud component in mixtures, the effects of the network structure of sand-mud mixtures on the dry bulk density of the mud component and the critical shear stress of sand-mud mixtures were investigated.
Publisher’s Note
All claims expressed in this article are solely those of the authors and do not necessarily represent those of their affiliated organizations, or those of the publisher, the editors and the reviewers. Any product that may be evaluated in this article, or claim that may be made by its manufacturer, is not guaranteed or endorsed by the publisher.
Statements
Data availability statement
The original contributions presented in the study are included in the article/supplementary material, further inquiries can be directed to the corresponding author.
Author contributions
DC and CZ contributed to the conception of the study, the theory development, and manuscript preparation. JZ and YW contributed significantly to the theoretical analysis. DG helped perform the analysis with constructive discussions. YL contributed to the analysis of the data for the work and helped with revising the work. All authors contributed to the article and approved the submitted version.
Funding
This work was supported by the National Natural Science Foundation of China (52101310); the Open Research Project of Key Laboratory of Coastal Disaster and Defence (Hohai University), Ministry of Education (201914); the Fundamental Research Funds for the Central Universities, Hohai University (B200202052); the Open Research Fund of State Key Laboratory of Coastal and Offshore Engineering, Dalian University of Technology (LP2020); the Open Research Fund of State Key Laboratory of Estuarine and Coastal Research, East China Normal University (SKLEC-KF202003); the National Natural Science Foundation of China (51879096); the Key Program of National Natural Science Foundation of China (41930538); the Major International (Regional) Joint Research Project of National Natural Science Foundation of China (51920105013); and the National Science Fund for Distinguished Young Scholars (51425901).
Acknowledgments
The authors would like to thank Liqin Zuo and Eugeny Buldakov for their insightful comments and suggestions, which helped improve the quality of the manuscript.
Conflict of interest
The authors declare that the research was conducted in the absence of any commercial or financial relationships that could be construed as a potential conflict of interest.
Glossary
A, coefficient (J m–2); Ah, Hamaker constant (J); Cd, Cl, drag and lift coefficients (-); cn, coordination number (-); da, diameter of the mud parcel (m); dm, diameter of cohesive particles (m); dr, representative diameter (m); , dimensionless diameter of dr (-); ds, diameter of sand particles (m); , dimensionless diameter of sand particles (-); E, relative error (-); Fc, resultant cohesive force (kg m s–2); Fd, drag force (kg m s–2); Fl, lift force (kg m s–2); fc, van der Waals force (kg m s–2); G, effective gravitational force (kg m s–2); g, gravitational acceleration (m s–2); k1, k2, k3, k4, k5, coefficients (-); ks, equivalent roughness height (m); lΔ, separation distance between two (cohesive) particles (m); logErms, logarithmic root-mean-square error (-); m, exponent (-); N, number of mud particles per unit area of a ruptured surface; n, number of mud particles coating the motion-initiating sand particle or number of mud particles in the buried surface of the motion-initiating mud parcel (-); pm, mud content (%); ps, sand content (%); pmcr, critical mud content (%); r, the solid/void volume ratio (-); rc, the reference solid/void volume ratio (-); s, distance between two neighboring particles (m); ub, near-bed velocity (m s–1); ub,cr, near-bed flow velocity for the incipient motion of sediment (m s–1); , shear velocity (m s–1); zb, the elevation where the drag force acts on the sediment particle or parcel (m); α, coefficient (-); α1, area shape factor of the sand particle or the mud parcel (-); α2, volumetric shape coefficient (-); α2, volumetric shape coefficient (-); βv, βw, coefficients (-); δ, thickness of the water film coating the cohesive particles (m); η, coefficient (-); ηΔ, relative protruding height (-); θcr0, critical Shields parameter of non-cohesive sediment (-); υ, kinematic viscosity of water (m2 s); ρ, density of water (kg m–3); ρd, dry bulk density of sediment (kg m–3); ρdm, dry bulk density of the cohesive (mud) component in a mixture (kg m–3); ρpa, density of the mud parcel (kg m–3); ρpm, density of cohesive (mud) particles (kg m–3); ρpr, density of a sand particles or a mud parcel (kg m–3); ρps, density of sand particles (kg m–3); ρsdm, stable dry bulk density of mud (kg m–3); ζ, coefficient (-); τb, bed shear stress (Pa); τcr, critical shear stress (Pa); τcrc, critical shear stress for reference (Pa); τcr,c, calculated critical shear stress (Pa); τcrs, critical shear stresses of pure sand (Pa); τcrm, critical shear stresses of pure mud (Pa); τcr,m, measured critical shear stress (Pa); τcrL, critical shear stress for mixtures with low mud contents (Pa); τcrmc, critical shear stress for erosion of mud corresponding to the porosity of the mud component in a sediment mixture (Pa); ϕm, mud porosity (-); φs, volume fraction of sand particles (-); χ, the correction factor of Einstein (-).
References
1
Ahmad M. Dong P. Mamat M. Wan Nik W. Mohd M. (2011). The critical shear stresses for sand and mud mixture.Appl. Math. Sci.553–71.
2
Amos C. Bergamasco A. Umgiesser G. Cappucci S. Cloutier D. DeNat L. et al (2004). The stability of tidal flats in Venice Lagoon—the results of in-situ measurements using two benthic, annular flumes.J. Mar. Syst.51211–241. 10.1016/j.jmarsys.2004.05.013
3
Baas J. H. Davies A. G. Malarkey J. (2013). Bedform development in mixed sand–mud: the contrasting role of cohesive forces in flow and bed.Geomorphology18219–32. 10.1016/j.geomorph.2012.10.025
4
Barry K. Thieke R. Mehta A. (2006). Quasi-hydrodynamic lubrication effect of clay particles on sand grain erosion.Estuar. Coast. Shelf Sci.67161–169. 10.1016/j.ecss.2005.11.009
5
Carniello L. Defina A. D’Alpaos L. (2012). Modeling sand-mud transport induced by tidal currents and wind waves in shallow microtidal basins: application to the Venice Lagoon (Italy).Estuar. Coast. Shelf Sci.102105–115. 10.1016/j.ecss.2012.03.016
6
Chen D. Melville B. Zheng J. Wang Y. Zhang C. Guan D. et al (2021). Pickup rate of non-cohesive sediments in low-velocity flows.J. Hydraulic Res.1–11. 10.1080/00221686.2020.1871430
7
Chen D. Wang Y. Huang H. Chen C. Yuan C. (2017). A behavior-oriented formula to predict coastal bathymetry evolution caused by coastal engineering.Cont. Shelf Res.13547–57. 10.1016/j.csr.2017.01.013
8
Chen D. Wang Y. Melville B. Huang H. Zhang W. (2018). Unified formula for critical shear stress for erosion of sand, mud, and sand-mud mixtures.J. Hydraul. Eng.144:04018046. 10.1061/(Asce)Hy.1943-7900.0001489
9
Chiew Y.-M. Parker G. (1994). Incipient sediment motion on non-horizontal slopes.J. Hydraul. Res.32649–660. 10.1080/00221689409498706
10
Das V. K. Roy S. Barman K. Chaudhuri S. Debnath K. (2019). Study of clay–sand network structures and its effect on river bank erosion: an experimental approach.Environ. Earth Sci.78:591.
11
Deriagin B. I. Malkin A. D. (1950). Cohesive forces between quartz fibers in water environments.Coll. J.12431–447. (in Russian)
12
Dickhudt P. J. Friedrichs C. T. Sanford L. P. (2011). Mud matrix solids fraction and bed erodibility in the York River estuary, USA, and other muddy environments.Cont. Shelf Res.31(Suppl. 10)S3–S13. 10.1016/j.csr.2010.02.008
13
Dou G. (1962). Theory for incipient motion of sediment.Sci. Sin.11999–1032. (in Russian).,
14
Dou G. (2000). Incipient motion of sediment under currents.China Ocean Eng.14391–406.
15
Duteil T. Bourillot R. Grégoire B. Virolle M. Brigaud B. Nouet J. et al (2020). Experimental formation of clay-coated sand grains using diatom biofilm exopolymers.Geology481012–1017. 10.1130/g47418.1
16
Einstein H. A. (1950). The Bed-Load Function for Sediment Transportation in Open Channel Flows U. G. P. Office, Vol. 1026. Washington, DC: US Department of Agriculture.
17
Hamaker H. C. (1937). The London—van der Waals attraction between spherical particles.Physica41058–1072. 10.1016/s0031-8914(37)80203-7
18
Han Q. (1982). Characteristics of incipient sediment motion and incipient velocity.J. Sediment Res.211–26. (in Chinese),
19
Hoath S. D. (2016). Fundamentals of Inkjet Printing: The Science of Inkjet and Droplets.Weinheim: John Wiley & Sons.
20
Hong R. Xu S. (1991). Experimental study on incipient of mud in a fluid.J. Tianjin Univ. S2, 79–85. (in Chinese),
21
Huang J. (1989). An experimental study of the scouring and settling properties of cohesive sediment.Ocean Eng.761–70. (in Chinese),
22
Jacobs W. Le Hir P. Van Kesteren W. Cann P. (2011). Erosion threshold of sand-mud mixtures.Cont. Shelf Res.31514–525. 10.1016/j.csr.2010.05.012
23
Kurdistani S. M. Tomasicchio G. R. D’Alessandro F. Hassanabadi L. (2019). River bank protection from ship-induced waves and river flow.Water Sci. Eng.12129–135. 10.1016/j.wse.2019.05.002
24
Kusuda T. Umita T. Koga K. Futawatari T. Awaya Y. (1984). Erosional process of cohesive sediments.Water Sci. Technol.17891–901. 10.2166/wst.1985.0188
25
Le Hir P. Cann P. Waeles B. t. Jestin H. Bassoullet P. (2008). Erodibility of natural sediments: experiments on sand/mud mixtures from laboratory and field erosion tests.Proc. Mar. Sci.9137–153. 10.1016/s1568-2692(08)80013-7
26
Le Hir P. Cayocca F. Waeles B. (2011). Dynamics of sand and mud mixtures: a multiprocess-based modelling strategy.Cont. Shelf Res.31S135–S149.
27
Li H. Yuan M. Zhang X. (1995). Study on critical motion and erosion of cohesive sediment.J. Waterway Harb.320–26. (in Chinese),
28
Li Q. Zeng Y. Bai Y. (2020). Mean flow and turbulence structure of open channel flow with suspended vegetation.J. Hydrodynam.32314–325. 10.1007/s42241-020-0020-6
29
Li Y. Zhang C. Chen D. Zheng J. Sun J. Wang P. (2021). Barred beach profile equilibrium investigated with a process-based numerical model.Cont. Shelf Res.222:104432. 10.1016/j.csr.2021.104432
30
Lick W. Jin L. Gailani J. (2004). Initiation of movement of quartz particles.J. Hydraul. Eng.130755–761. 10.1061/(asce)0733-9429(2004)130:8(755)
31
Mehta A. J. (1989). On estuarine cohesive sediment suspension behavior.J. Geophys. Res. Oceans9414303–14314. 10.1029/jc094ic10p14303
32
Mehta A. J. (2014). An Introduction to Hydraulics of Fine Sediment Transport, Vol. 38. Hackensack, NJ: World Scientific Publishing Company.
33
Mehta A. J. Lee S.-C. (1994). Problems in linking the threshold condition for the transport of cohesionless and cohesive sediment grain.J. Coast. Res.10170–177.
34
Mehta A. J. Letter J. V. (2013). Comments on the transition between cohesive and cohesionless sediment bed exchange.Estuar. Coast. Shelf Sci.131319–324. 10.1016/j.ecss.2013.07.001
35
Mehta A. J. Partheniades E. (1982). “Resuspension of deposited cohesive sediment beds,” in Proceedings of the 18th Conference on Coastal Engineering, Cape Town.
36
Mehta A. Parchure T. (2000). Surface erosion of fine-grained sediment revisited.Proc. Mar. Sci.255–74. 10.1016/s1568-2692(00)80006-6
37
Meissner H. Michaels A. Kaiser R. (1964). Crushing strength of zinc oxide agglomerates.Ind. Eng. Chem. Process Design Dev.3202–205. 10.1021/i260011a003
38
Migniot C. (1989). Tassement et rhéologie des vases. Première partie.La Houille Blanche.711–29. 10.1051/lhb/1989001
39
Miller M. McCave I. Komar P. D. (1977). Threshold of sediment motion under unidirectional currents.Sedimentology24507–527. 10.1111/j.1365-3091.1977.tb00136.x
40
Mitchener H. Torfs H. (1996). Erosion of mud/sand mixtures.Coast. Eng.291–25. 10.1016/s0378-3839(96)00002-6
41
Mostafa T. S. Imran J. Chaudhry M. H. Kahn I. B. (2008). Erosion resistance of cohesive soils.J. Hydraul. Res.46777–787. 10.1080/00221686.2008.9521922
42
Nalluri C. Alvarez E. (1992). The influence of cohesion on sediment behaviour.Water Sci. Tech.25151–164. 10.2166/wst.1992.0189
43
Owen M. (1970). A Detailed Study of the Settling Velocities of an Estuary Mud (INT 78).Wallingford: H. R. Station.
44
Panagiotopoulos I. Voulgaris G. Collins M. (1997). The influence of clay on the threshold of movement of fine sandy beds.Coast. Eng.3219–43. 10.1016/s0378-3839(97)00013-6
45
Partheniades E. (1965). Erosion and deposition of cohesive soils.J. Hydraul. Div.91105–139. 10.1061/jyceaj.0001165
46
Perkey D. W. Smith S. J. Priestas A. M. (2020). Erosion Thresholds and Rates for Sand-Mud Mixtures (ERDC-CHL TR-20-13).Vicksburg, MS: U. A. C. o. Engineers.
47
Revil A. Grauls D. Brévart O. (2002). Mechanical compaction of sand/clay mixtures.J. Geophys. Res. Solid Earth107:2293.
48
Righetti M. Lucarelli C. (2007). May the Shields theory be extended to cohesive and adhesive benthic sediments?J. Geophys. Res. Oceans112:C05039.
49
Sanford L. P. Maa J. P.-Y. (2001). A unified erosion formulation for fine sediments.Mar. Geol.1799–23. 10.1016/s0025-3227(01)00201-8
50
Sharif A. R. (2003). Critical Shear Stress and Erosion of Cohesive Soils.Ph.D thesis. New York, NY: State University of New York at Buffalo.
51
Smith J. Perkey D. Priestas A. (2015). “Erosion thresholds and rates for sand-mud mixtures,” in Proceedings of the 13th International Conference on Cohesive Sediment Transport Processes, Leuven.
52
Soulsby R. Whitehouse R. (1997). “Threshold of sediment motion in coastal environments Pacific Coasts and Ports’ 97,” in Proceedings of the 13th Australasian Coastal and Ocean Engineering Conference and the 6th Australasian Port and Harbour Conference, Christchurch.
53
Tang C. (1963). Law of sediment threshold.J. Hydraul. Eng.21–12. (in Chinese),
54
Ternat F. Boyer P. Anselmet F. Amielh M. (2008). Erosion threshold of saturated natural cohesive sediments: modeling and experiments.Water Resour. Res.44:W11434.
55
Torfs H. (1995). Erosion of mud/sand mixtures.Ph.D. thesis. Leuven: Katholieke Univeriteit Leuven.
56
Torfs H. Jiang J. Mehta A. (2000). Assessment of the erodibility of fine/coarse sediment mixtures.Proc. Mar. Sci.3109–123. 10.1016/s1568-2692(00)80116-3
57
Van Ledden M. (2003). Sand-mud Segregation in Estuaries and Tidal Basins.Delft: Delft University of Technology.
58
Van Ledden M. Van Kesteren W. G. M. Winterwerp J. C. (2004). A conceptual framework for the erosion behaviour of sand-mud mixtures.Cont. Shelf Res.241–11. 10.1016/j.csr.2003.09.002
59
Van Rijn L. C. (1993). Principles of Sediment Transport in Rivers, Estuaries and Coastal Seas, Vol. 1006. Amsterdam: Aqua publications.
60
Van Rijn L. C. (2020). Erodibility of mud-sand bed mixtures.J. Hydraul. Eng.146:04019050. 10.1061/(ASCE)HY.1943-7900.0001677
61
Vollmer S. Kleinhans M. G. (2007). Predicting incipient motion, including the effect of turbulent pressure fluctuations in the bed.Water Resour. Res.43:W05410. 10.1029/2006WR004919
62
Waeles B. Le Hir P. Lesueur P. (2008). “A 3D morphodynamic process-based modelling of a mixed sand/mud coastal environment: the seine estuary,” in France Sediment and Ecohydraulics: INTERCOH, 2005. Proceedings in Marine Science, edsKusudaT.YamanishiH.SpearmanJ.GailaniJ. Z. (Amsterdam: Elsevier) 10.1016/S1568-2692(08)80034-4
63
Winterwerp J. Kesteren W. Prooijen B. Jacobs W. (2012). A conceptual framework for shear flow–induced erosion of soft cohesive sediment beds.J. Geophys. Res. Oceans117:C10020. 10.1029/2012JC008072
64
Worden R. H. Griffiths J. Wooldridge L. J. Utley J. E. P. Armitage P. J. (2020). Chlorite in sandstones.Earth Sci. Rev.204:103105. 10.1016/j.earscirev.2020.103105
65
Wu W. Perera C. Smith J. Sanchez A. (2017). Critical shear stress for erosion of sand and mud mixtures.J. Hydraul. Res.561–15. 10.1080/00221686.2017.1300195
66
Xu D. Bai Y. Ji C. Williams J. (2015). Experimental study of the density influence on the incipient motion and erosion modes of muds in unidirectional flows: the case of Huangmaohai Estuary.Ocean Dyn.65187–201. 10.1007/s10236-014-0803-9
67
Yang B. Luo Y. Jeng D. Feng J. Huhe A. (2018). Experimental studies on initiation of current-induced movement of mud.Appl. Ocean Res.80220–227. 10.1016/j.apor.2018.09.006
68
Yang M. Wang G. (1995). The incipient motion formulas for cohesive fine sediments.J. Basic Sci. Eng.399–109. (in Chinese),
69
Ye Z. Cheng L. Zang Z. (2011). “Experimental study of erosion threshold of reconstituted sediments,” in Proceedings of the 30th International Conference on Ocean, Offshore and Arctic Engineering, Rotterdam. 10.1115/OMAE2011-50067
70
Zhang H. (2012). A unified formula for incipient velocity of sediment.J. Hydraul. Eng.431387–1396. (in Chinese).,
71
Zhang M. Yu G. (2017). Critical conditions of incipient motion of cohesive sediments.Water Resour. Res.537798–7815. 10.1002/2017WR021066
72
Zhang M. Yu G. La Rovere A. Ranzi R. (2017). Erodibility of fluidized cohesive sediments in unidirectional open flows.Ocean Eng.130523–530. 10.1016/j.oceaneng.2016.12.021
73
Zhang Z. Zou Z. (2019). Application of power law to vertical distribution of longshore currents.Water Sci. Eng.1273–83. 10.1016/j.wse.2019.04.004
74
Zheng J. Yao Y. Chen S. Chen S. Zhang Q. (2020). Laboratory study on wave-induced setup and wave-driven current in a 2DH reef-lagoon-channel system.Coast. Eng.162:103772. 10.1016/j.coastaleng.2020.103772
75
Zhu Y. Jinyou L. Liao H. Wang J. Fan B. Yao S. (2008). Research on cohesive sediment erosion by flow: an overview.Sci. China512001–2012. 10.1007/s11431-008-0232-4
76
Zuo L. Roelvink D. Lu Y. Li S. (2017). On incipient motion of silt-sand under combined action of waves and currents.Appl. Ocean Res.69116–125. 10.1016/j.apor.2017.10.005
Summary
Keywords
critical shear stress, erodibility of sediment, erosion threshold, mixed sediment, mud, sand-mud mixtures, multi-fraction sediment
Citation
Chen D, Zheng J, Zhang C, Guan D, Li Y and Wang Y (2021) Critical Shear Stress for Erosion of Sand-Mud Mixtures and Pure Mud. Front. Mar. Sci. 8:713039. doi: 10.3389/fmars.2021.713039
Received
21 May 2021
Accepted
23 September 2021
Published
14 October 2021
Volume
8 - 2021
Edited by
Felice D’Alessandro, University of Milan, Italy
Reviewed by
Liqin Zuo, Nanjing Hydraulic Research Institute, China; Eugeny Buldakov, University College London, United Kingdom
Updates
Copyright
© 2021 Chen, Zheng, Zhang, Guan, Li and Wang.
This is an open-access article distributed under the terms of the Creative Commons Attribution License (CC BY). The use, distribution or reproduction in other forums is permitted, provided the original author(s) and the copyright owner(s) are credited and that the original publication in this journal is cited, in accordance with accepted academic practice. No use, distribution or reproduction is permitted which does not comply with these terms.
*Correspondence: Chi Zhang, zhangchi@hhu.edu.cn
†ORCID: Dake Chen, orcid.org/0000-0002-5160-589X; Chi Zhang, orcid.org/0000-0003-2708-4286
This article was submitted to Coastal Ocean Processes, a section of the journal Frontiers in Marine Science
Disclaimer
All claims expressed in this article are solely those of the authors and do not necessarily represent those of their affiliated organizations, or those of the publisher, the editors and the reviewers. Any product that may be evaluated in this article or claim that may be made by its manufacturer is not guaranteed or endorsed by the publisher.