 Luke Storrie1,2*
 Nigel E. Hussey3
 Shannon A. MacPhee2
 Greg O’Corry-Crowe4
 John Iacozza1
 David G. Barber1
 Alex Nunes5
 Lisa L. Loseto1,2
- 1Centre for Earth Observation Science, Department of Environment and Geography, The University of Manitoba, Winnipeg, MB, Canada
- 2Freshwater Institute, Fisheries and Oceans Canada, Winnipeg, MB, Canada
- 3Department of Integrative Biology, University of Windsor, Windsor, ON, Canada
- 4Harbor Branch Oceanographic Institute, Florida Atlantic University, Fort Pierce, FL, United States
- 5Ocean Tracking Network, Dalhousie University, Halifax, NS, Canada
Dive behavior represents multiple ecological functions for marine mammals, but our understanding of dive characteristics is typically limited by the resolution or longevity of tagging studies. Knowledge on the time-depth structures of dives can provide insight into the behaviors represented by vertical movements; furthering our understanding of the ecological importance of habitats occupied, seasonal shifts in activity, and the energetic consequences of targeting prey at a given depth. Given our incomplete understanding of Eastern Beaufort Sea (EBS) beluga whale behavior over an annual cycle, we aimed to characterize dives made by belugas, with a focus on analyzing shifts in foraging strategies. Objectives were to (i) characterize and classify the range of beluga-specific dive types over an annual cycle, (ii) propose dive functions based on optimal foraging theory, physiology, and association with environmental variables, and (iii) identify whether belugas undergo seasonal shifts in the frequency of dives associated with variable foraging strategies. Satellite-linked time-depth-recorders (TDRs) were attached to 13 male belugas from the EBS population in 2018 and 2019, and depth data were collected in time series at a 75 s sampling interval. Tags collected data for between 13 and 357 days, including three tags which collected data across all months. A total of 90,211 dives were identified and characterized by twelve time and depth metrics and classified into eight dive types using a Gaussian mixed modeling and hierarchical clustering analysis approach. Dive structures identify various seasonal behaviors and indicate year-round foraging. Shallower and more frequent diving during winter in the Bering Sea indicate foraging may be energetically cheaper, but less rewarding than deeper diving during summer in the Beaufort Sea and Arctic Archipelago, which frequently exceeded the aerobic dive limit previously calculated for this population. Structure, frequency and association with environmental variables supports the use of other dives in recovery, transiting, and navigating through sea ice. The current study provides the first comprehensive description of the year-round dive structures of any beluga population, providing baseline information to allow improved characterization and to monitor how this population may respond to environmental change and increasing anthropogenic stressors.
Introduction
Cetaceans spend the vast majority of their lives at various depths below the ocean surface, consequently vertical movement must be considered equally if not more so than horizontal movement to fully understand the ecological significance of animal behavior. Dive behavior of marine mammals may serve a number of functions depending on the structure of the dive and depths targeted, including foraging (Viviant et al., 2014), transiting (McGovern et al., 2019), resting (Wright et al., 2017), aiding digestion (Crocker et al., 1997), reproductive behaviors (Baechler et al., 2002), predator avoidance (Aguilar de Soto et al., 2020), molting (Fortune et al., 2017), and possibly navigation (Matsumura et al., 2011).
For many cetaceans, distinct temporal partitioning of movement behaviors are governed by changes in seasonal insolation and productivity, often coinciding with large scale migrations to more productive foraging habitats during spring and summer (e.g., Zerbini et al., 2006). Among Arctic cetaceans, the seasonal distributions of beluga whales (Delphinapterus leucas), narwhals (Monodon monoceros) and bowhead whales (Balaena mysticetus) are often governed by the annual advance and retreat of sea ice (Laidre et al., 2008). Consequently, seasonal partitioning of behaviors is linked to accessibility to predictable foraging grounds and coastal regions for calving and molting (Laidre and Heide-Jørgensen, 2005; Anderson et al., 2017), as well as seasonal productivity (Laidre et al., 2007). As such, seasonal foraging intensity varies among species and populations depending on their geographic distribution and degree of interconnectedness with sea ice (Laidre and Heide-Jørgensen, 2005; Breton-Honeyman et al., 2016; Watt et al., 2016; Castellote et al., 2020). Optimal foraging theory predicts that central place foragers, such as cetaceans which must return to the surface to breathe, should maximize the time spent at depth as the foraging depth increases to offset the energetic costs associated with greater travel distance (Mori, 1998). Time allocation over a dive cycle, however, also depends on an animal’s aerobic dive limit (ADL); the dive duration after which post-dive lactate accumulation occurs, necessitating longer recovery times and less overall time spent foraging (Costa, 2007; Kooyman et al., 2021). Considering the time and depth structures and seasonal frequency of dives in the context of optimal foraging theory and ADL can provide insight on dive function (Heerah et al., 2019), seasonality of behaviors (Blanchet et al., 2015), energetics (Arce et al., 2019; Friedlaender et al., 2020), and vertical prey distribution (Tennessen et al., 2019).
The Eastern Beaufort Sea (EBS) beluga population occupies one of the greatest ranges among the species. Overwintering in the Bering Sea whilst their northern range is limited by pack ice, they then migrate thousands of kilometers to summering grounds in the Beaufort Sea, Central Arctic Ocean, and into the Arctic Archipelago (Hauser et al., 2014; Figure 1). Hence, EBS belugas occupy a dynamic environment ranging from shallow coastal estuaries characterized by high turbidity and warm temperatures (Loseto et al., 2006; Hornby et al., 2016); to deep offshore waters over the Arctic Basin (Richard et al., 1997); and areas with dense pack ice within parts of the Arctic Archipelago (Loseto et al., 2006). However, regions inhabited by EBS belugas are undergoing rapid alterations including declining sea ice and increasing sea surface temperatures (Wang and Overland, 2015; Huntington et al., 2020), with possible negative consequences for beluga foraging opportunities (Harwood et al., 2015; Choy et al., 2017; Hauser et al., 2018a). Identifying how belugas use vertical habitats, including assessing the behaviors represented by individual dives over a seasonal cycle and in the context of foraging and energetic costs, will be key in monitoring responses to environmental change.
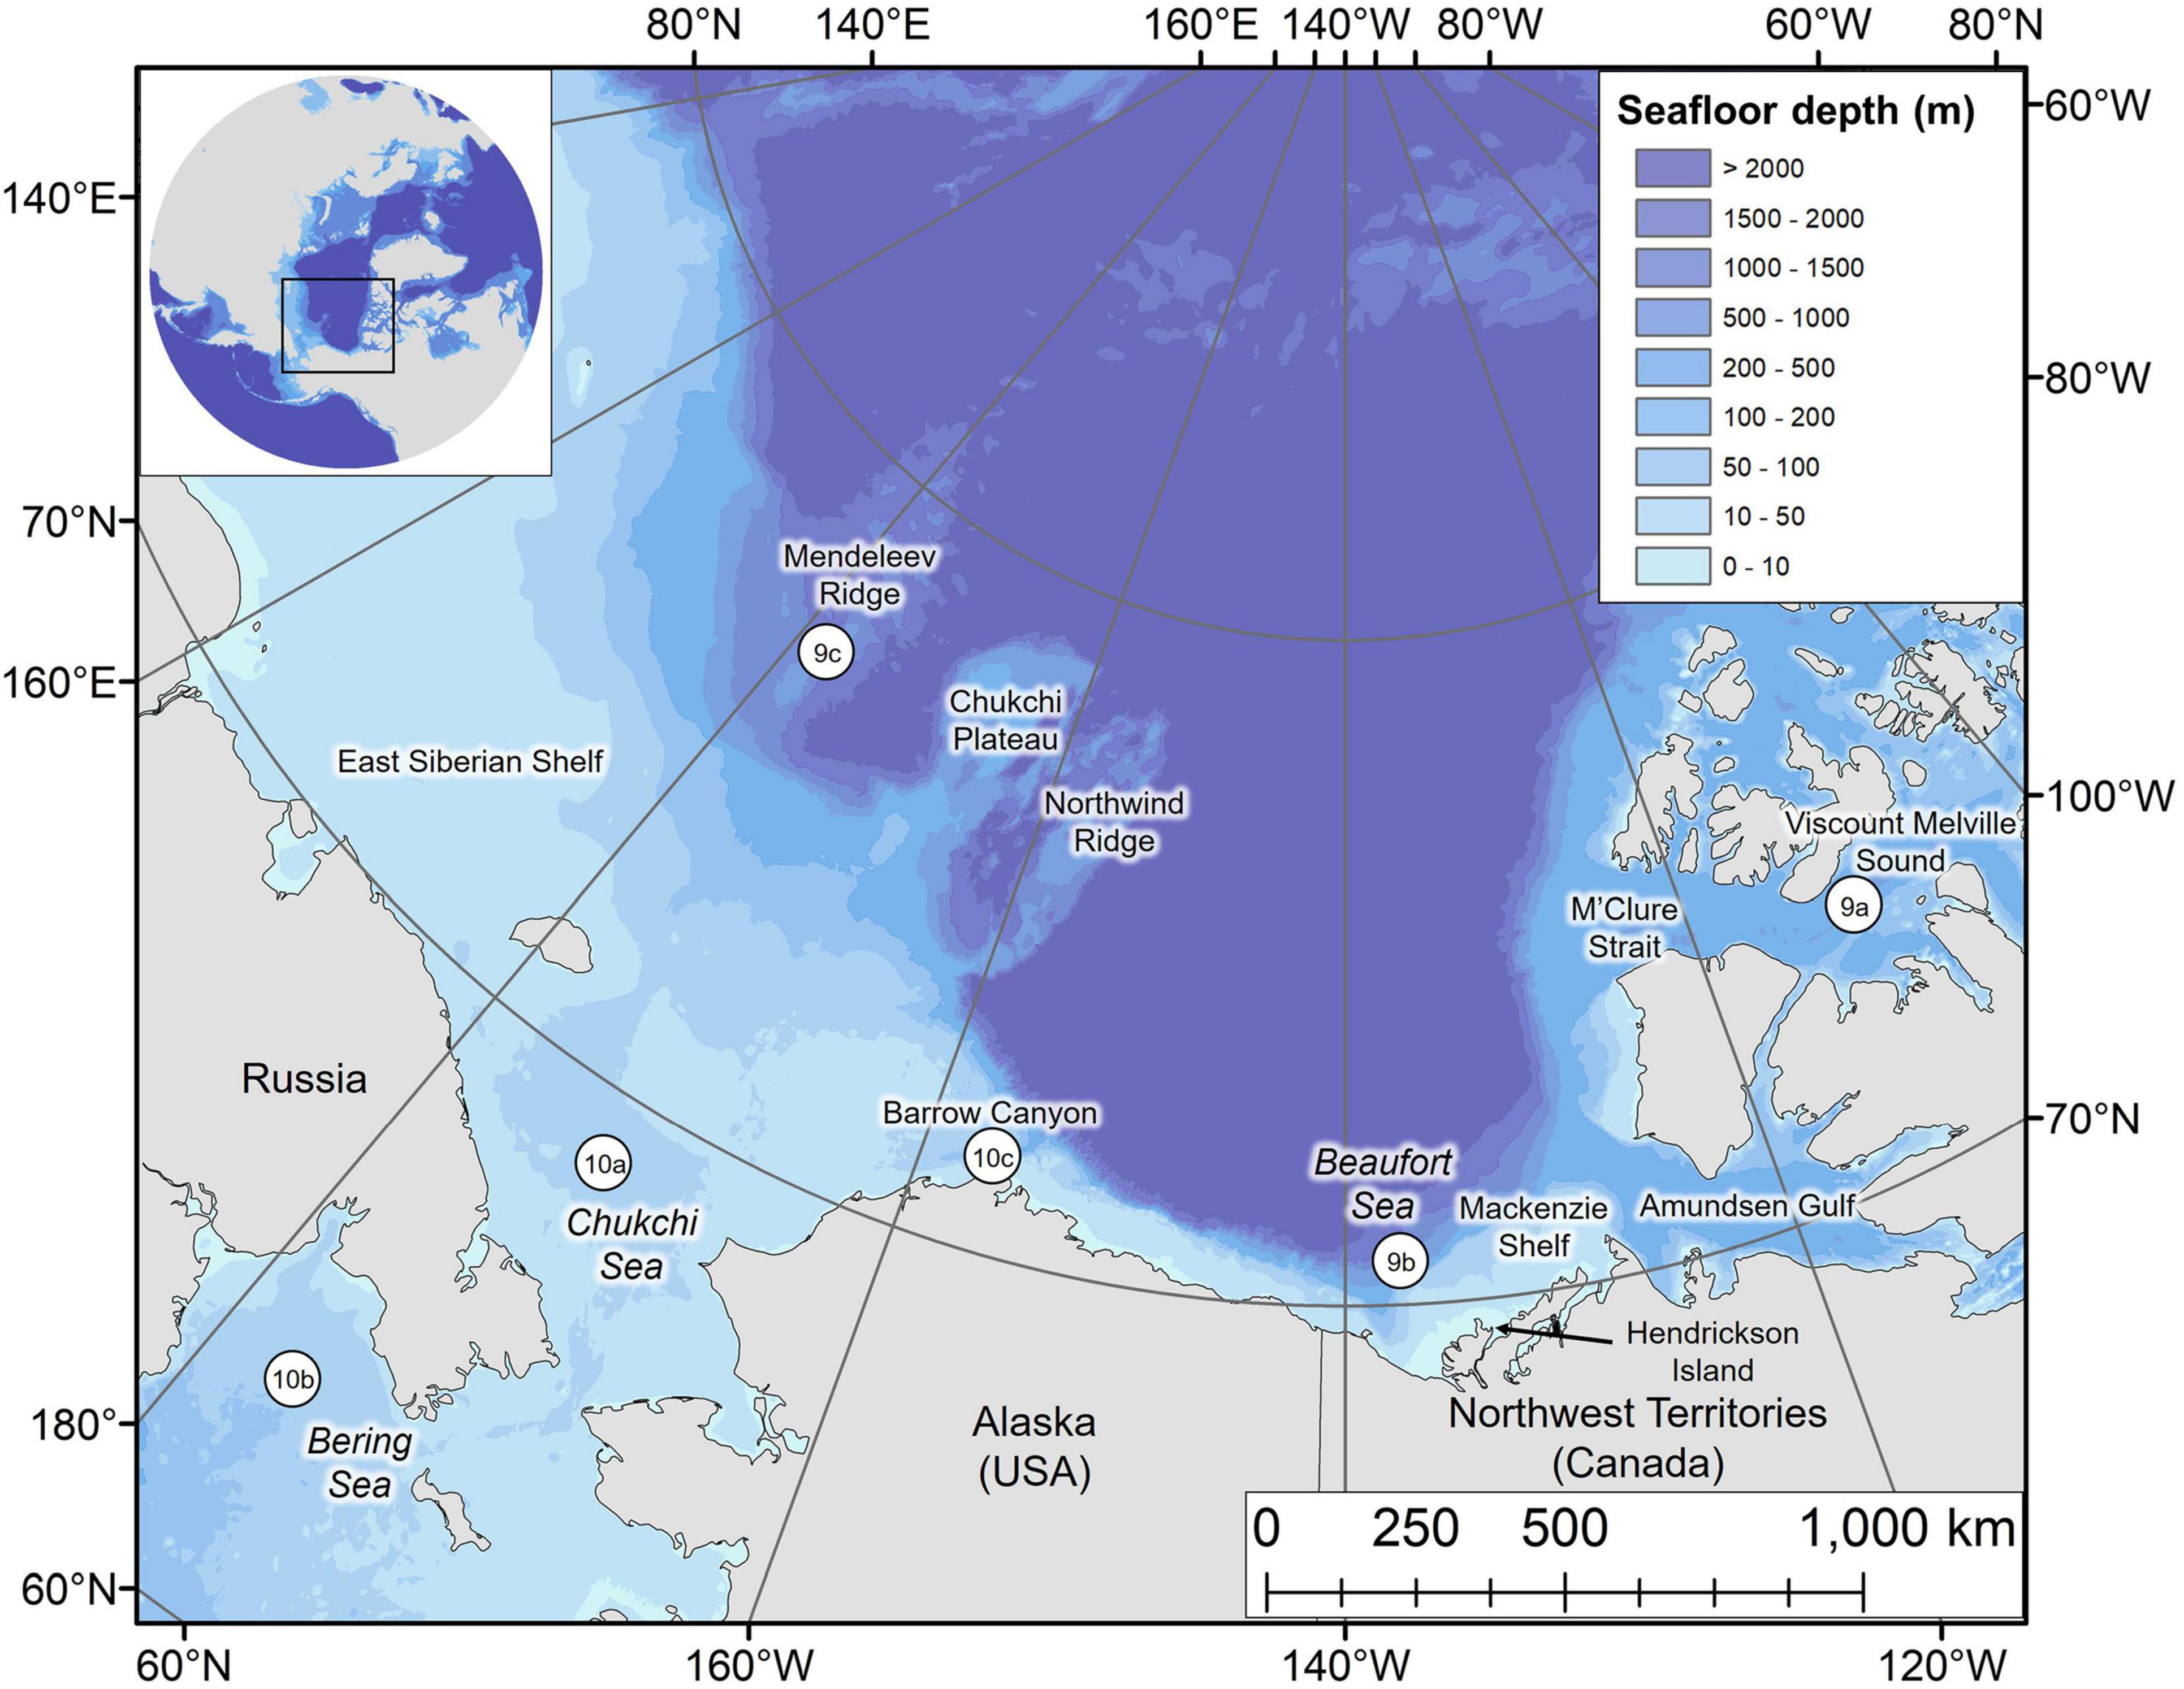
Figure 1. Map of the study area with key locations labeled. Numbered circles 9a–9c and 10a–10c denote the locations of dive profiles shown in Figures 9, 10, respectively.
The use of biotelemetry, using electronic tags attached to animals to collect data on movement, behavior, and their environment (Hussey et al., 2015), has revealed key aspects of the ecology of EBS belugas including patterns in their movements (Hauser et al., 2017a), seasonal ranges (Hauser et al., 2014; Citta et al., 2017), sexual segregation (Loseto et al., 2006), habitat selection (Hauser et al., 2017b), and dive behavior (Richard et al., 1997; Hauser et al., 2015). For biotelemetry (transmission of data from a tag whilst attached to an animal) and biologging (data archived on a tag that must be recovered; Cooke et al., 2021), there are inherent trade-offs between data resolution and longevity of data collection (Carter et al., 2016). For example, summarized histogram data that reduce battery drain have often been used to examine depth use in belugas (e.g., Heide-Jørgensen et al., 1998; Goetz et al., 2012; Hauser et al., 2015; note some older tags were only capable of collecting these data), but this type of data can limit inferences on behavior. While a few studies on belugas have analyzed data on individual dives, these typically cover short time periods, primarily the summer and fall (e.g., Martin and Smith, 1992; Richard et al., 1997; Lefebvre et al., 2018; Vacquié-Garcia et al., 2019).
Given our incomplete understanding of EBS beluga dive behavior over an annual cycle, including the paucity of data from winter and spring, we aimed to characterize the suite of dive types exhibited by this population, to identify if seasonal shifts in dive behaviors occur. We use long-term time series depth data from satellite-linked time-depth recorders (TDRs) and concurrent pop-up archival tags (MiniPATs) deployed on male beluga whales to address three core objectives; (i) to characterize and classify the range of beluga-specific dive types, (ii) to generate hypotheses on the function of derived dive types based on their time and depth structures, optimal foraging theory, life history traits, and association with environmental variables (seafloor depth, seafloor slope angle, and sea ice concentration) and (iii) to identify whether belugas undergo seasonal shifts in the frequency of dive types inferred to be associated with specific behavior. Together these data provide baseline information on the behaviors represented by dive types, allow an assessment of the energetic costs and gains of different foraging behaviors, and identify the ecological significance of various habitats for this population. This is especially important in the context of a shifting prey assemblage (Choy et al., 2017, 2020; Loseto et al., 2018), alterations in environmental conditions (Huntington et al., 2020), and potential threats from increasing human activity across the Arctic (Reeves et al., 2014; Hauser et al., 2018b).
Materials and Methods
Data Collection
Belugas were tagged from Hendrickson Island within the Mackenzie River estuary, Northwest Territories, Canada (Figure 1) during the summers of 2018 and 2019. Live-capture tagging involved herding a whale toward a shallower area, encircling with a net for capture and restraint, followed by guiding the whale closer to shore for tag placement (Orr et al., 2001). In terms of tag placement, SPLASH10-F-238 (WC, Wildlife Computers Ltd., Redmond, WA, United States) tags were attached via stainless steel cables and lock washers to either side of three Delrin® rods which were inserted through the dorsal ridge and secured to lie flat on the beluga’s back. The SPLASH10-F-321 (Wildlife Computers) tags are specifically designed to glide to the surface as an animal surfaces; these tags were attached via two 50 cm long tethers to either side of a single Delrin® rod inserted through the dorsal ridge during live capture. A second method involved remote deployment of tags by Inuvialuit knowledge holders by following a beluga and deploying the tag using a custom anchor and jab-stick configuration. The jab-stick included a modified Wildlife Computers Domeier/Wilton Applicator Pin, with a series of rubber stoppers to limit penetration depth. The new Wildlife Computers Inuvik Dart (anchor) was tethered to each SPLASH10-F-321 tag with a 50 cm monofilament leader which was crimped, and covered in a silicone sleeve to reduce abrasion. A total of 54 belugas were tagged with six different tag types to address various population-specific questions. Due to the requirements of high-resolution depth and location data in the present study, we analyzed data from 13 tagged belugas which transmitted for between 13 and 357 days (Table 1), and were tagged primarily with SPLASH10-F-238 or SPLASH10-F-321 tags. Tag configurations were optimized for longevity whilst maximizing collection of depth time series data (Supplementary Table 1). Tags sampled depth (±0.5 m) at a 1 s interval, and transmitted time series data at 75 s intervals via hourly messages (±DRange, see Supplementary Figure 2a), which were used in characterizing and classifying individual dives. The maximum depth recorded in each hour from the 1 s sampled data was also transmitted, and was used to identify the maximum depth reached by all tagged individuals each day. Tags were programmed to collect Fastloc GPS locations every 7–30 min, and Argos locations were estimated during each transmission. Note that the harpoon-deployed SPLASH10-F-321 tags were also programmed to transmit archived data when the tag released from the animal and surfaced. In addition to SPLASH tags, three belugas were double-tagged with a MiniPAT (pop-up archival tag, Wildlife Computers). MiniPATs were programmed to archive depth time series data during deployment and then transmit summarized data at 75 s intervals when the tag released from the animal and surfaced. MiniPAT data were typically more complete (Supplementary Table 1), and were used to fill in missing data from the primary satellite-linked TDRs (Table 1). Tissue samples were taken from all tagged belugas to confirm sex and total body lengths were measured from rostrum to tail notch. Body lengths ranged from 4.06 to 4.70 m, and molecular analyses (Rosel, 2003) confirmed that all 13 belugas analyzed were male (Table 1).
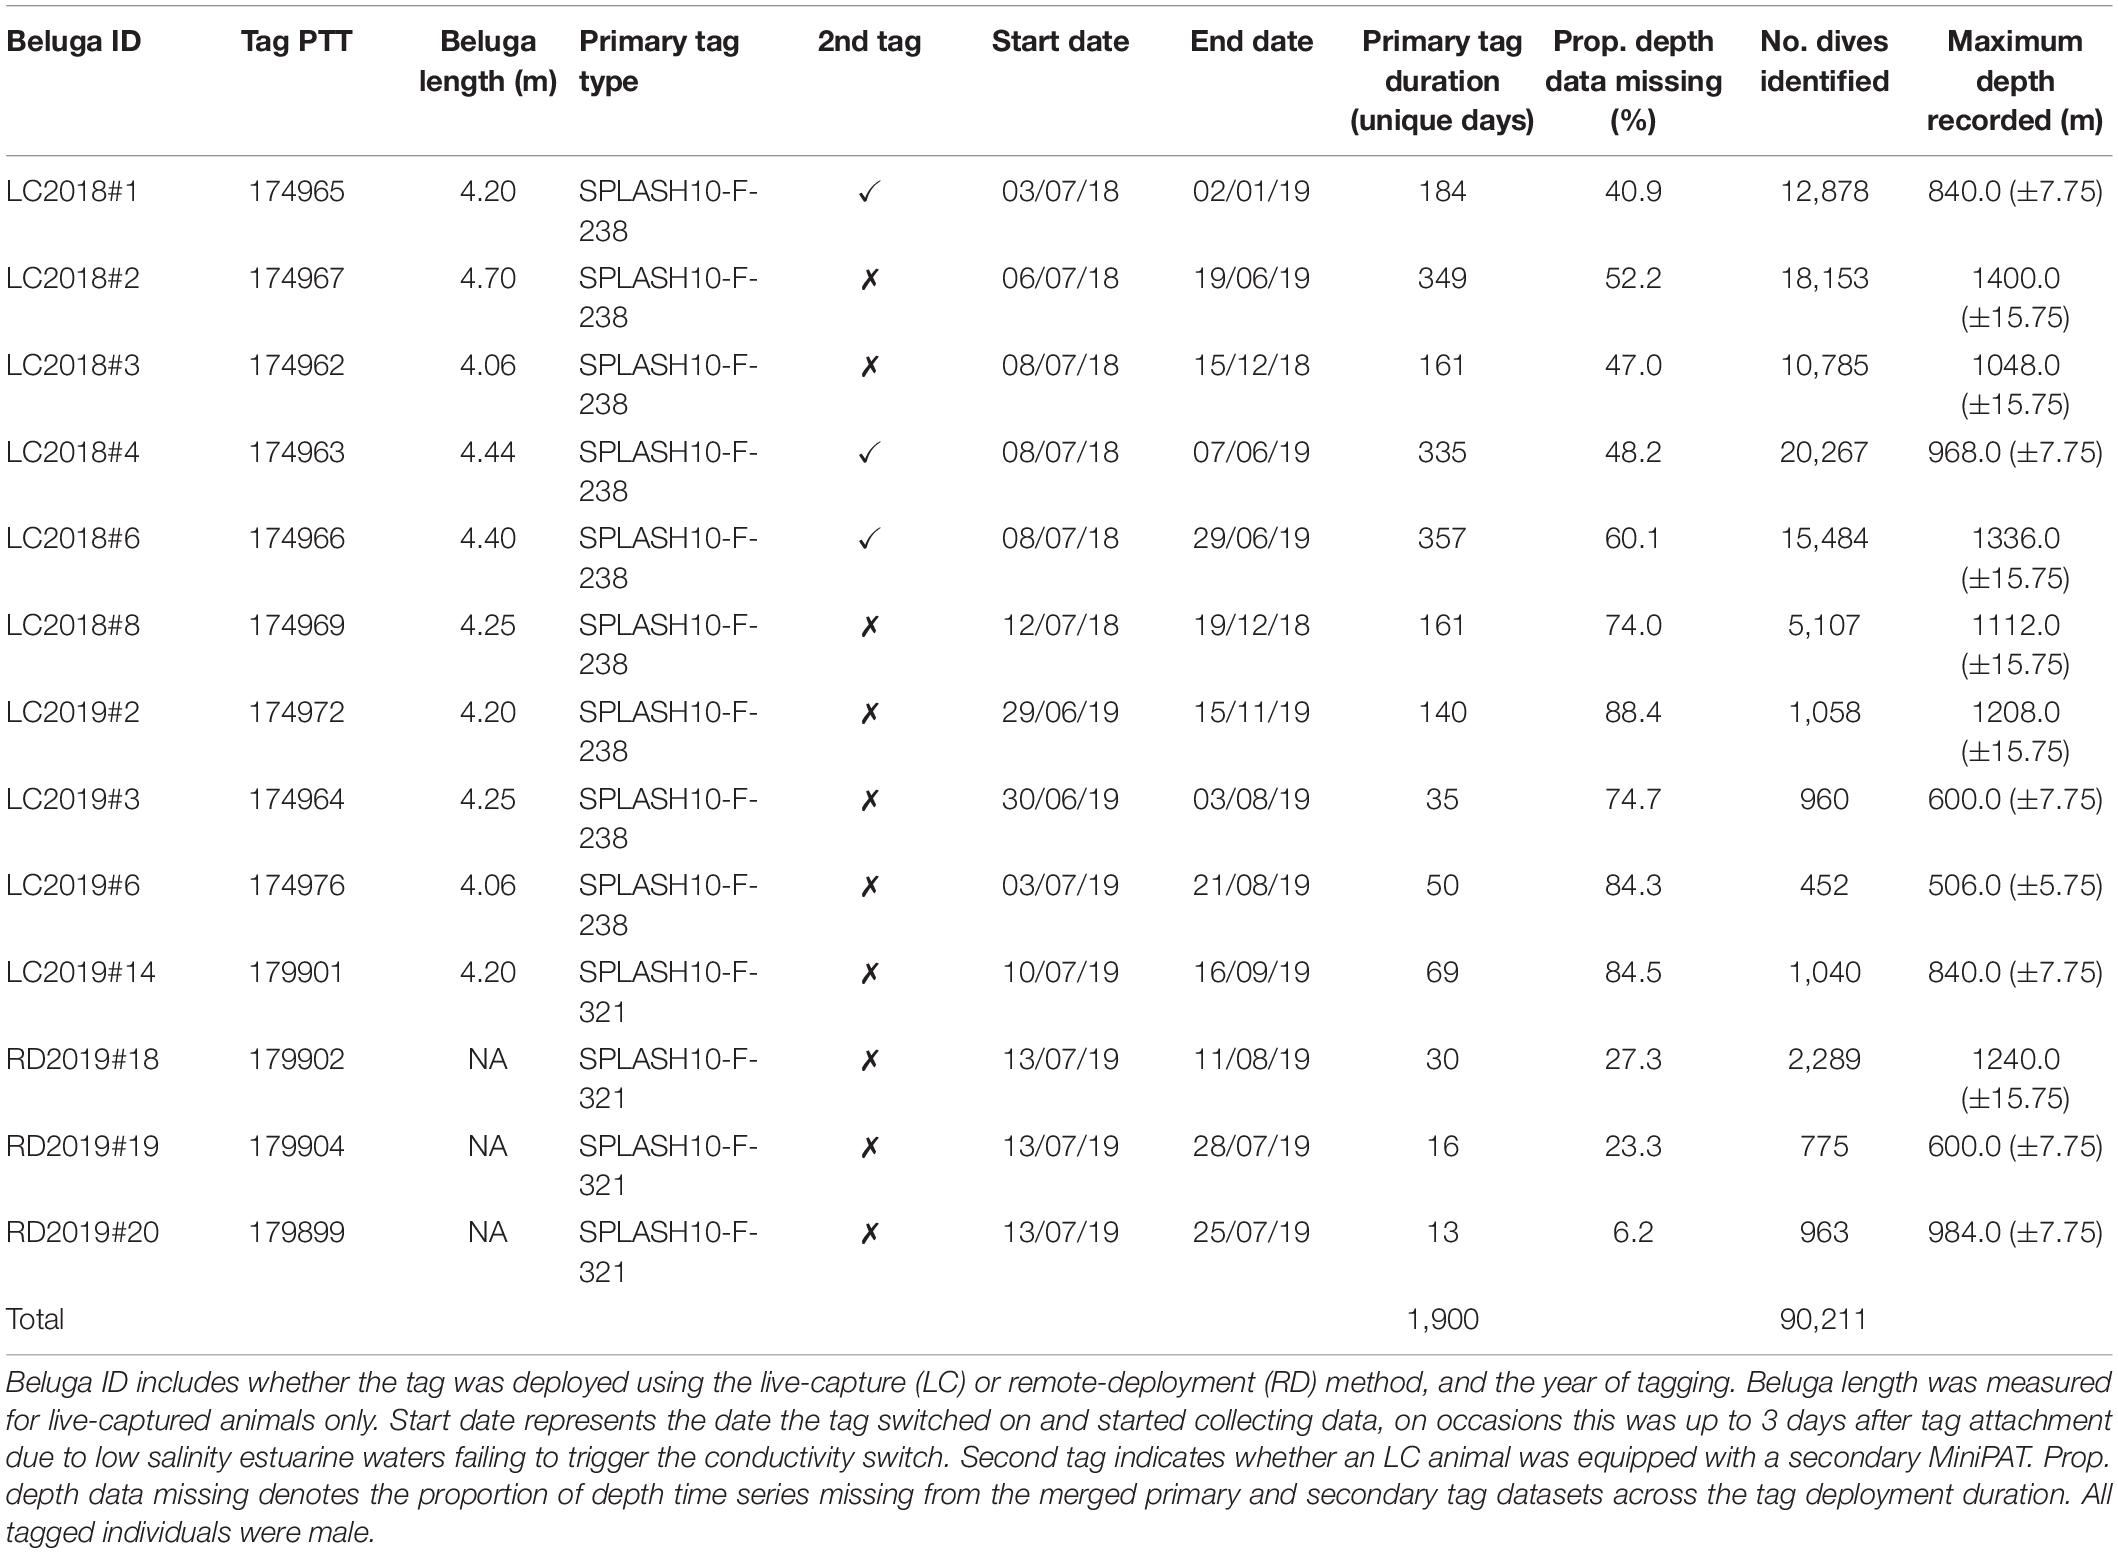
Table 1. Tag deployments, data retrieved, and number of dives identified using divebomb.
Estimating Beluga Dive Locations
Location data (Argos and Fastloc GPS) were filtered, firstly by removing the most erroneous locations; consisting of Argos locations with no associated ellipse error and Fastloc GPS locations with residual values ≥35 (Dujon et al., 2014). The sdafilter function from the “argosfilter” package (Freitas et al., 2008) in R v3.6.0 (R Core Development Team, 2019), was then used to remove locations based on unrealistic swimming speeds while retaining locations which result from higher swimming speeds over short distances (<5 km from the previous location, Freitas et al., 2008). The swim speed threshold was set at 3 m/s (Richard et al., 1998, 2001). The “ang” argument was set to −1 to retain spikes in the movement path. The filtered locations occurred 35.1 min apart on average, however 8.4% of locations occurred ≥1 h after the previous location, hence a continuous-time correlated random walk (CTCRW) model was used to predict animal locations at regular time intervals. Models were fit using the “crawl” package, version 2.2.3 (Johnson et al., 2008, 2018) in R, with combined Argos and Fastloc GPS data; using the ellipse errors for Argos locations. Fastloc GPS locations have greater accuracy when calculated using more satellites (Dujon et al., 2014); 81.6% of the filtered GPS locations were calculated with ≥6 satellites, therefore an error radius of 50 m was assigned to all Fastloc GPS locations following London and Johnson (2018). The CTCRW was fit separately for each beluga and locations were predicted at 15 min intervals.
Environmental Data
Seafloor depths associated with CTCRW model-derived locations for the entire tracks of all 13 belugas were extracted from the International Bathymetric Chart of the Arctic Ocean (IBCAO) version 3.0 (Jakobsson et al., 2012), with a spatial resolution of 500 m, for each location north of 64°N. As the IBCAO does not cover regions south of this latitude, the General Bathymetric Chart of the Oceans (GEBCO Bathymetric Compilation Group, 2020), with a spatial resolution of 15 arc seconds, was used to assign a seafloor depth to each location south of 64°N. We note the Arctic Ocean is less well-represented by this grid due to the distortion in the longitudinal direction at high latitudes (grid cell size = ∼220 × 465 m at these latitudes). Slope angle was calculated from the two bathymetric products using the terrain function in the “raster” package v3.4-13 (Hijmans et al., 2021), and sea ice concentration data was downloaded from NOAA/NSIDC Climate Data Record of Passive Microwave Sea Ice Concentration, Version 4, on a 25 km grid (Meier et al., 2021), and assigned to each CTCRW location.
Characterizing and Classifying Beluga Dives
Individual beluga dives were isolated and characterized using divebomb v1.1.2 (Nunes, 2019; see Supplementary Material 2) in Python v3.7.1 (Van Rossum and Drake, 2009). Prior to analyses, depth time series data were upsampled from 75 to 15 s using linear interpolation, as divebomb requires unique time-depth data points representative of descent, ascent, and surface phases in each dive (see Supplementary Figures 2b–d for details). In brief, divebomb isolates dives and characterizes their phases based on user-specified parameters; “surface threshold,” “at depth threshold,” “minimal time between dives,” and “dive detection sensitivity”; and the rate of change in depth. In the current version of divebomb (v1.1.2), “dive detection sensitivity” and “minimal time between dives” only effect dive characterization for infrequently surfacing animals such as sharks, so are not discussed further here. When considering each unique dive, the descent phase begins when the “surface threshold” is passed. The bottom phase begins when there is no longer a positive rate of change in depth between two data points (the animal stops descending), and the “at depth threshold” depth has been passed (for example an “at depth threshold” of 0.1 gives a depth of 900 m for a dive which reaches 1,000 m). The ascent phase begins when there is a negative rate of change in depth between two data points (the animal starts ascending), and there are no subsequent periods where the animal descends below the “at depth threshold” depth. The surface phase begins when the animal has crossed the “surface threshold.”
The following parameter values were assigned; a surface threshold of 5 m and at depth thresholds of 0.1 and 0.5 for modeling dives <15 m and ≥15 m, respectively (see Supplementary Figures 2e–g for details). Following the final model runs a sample of 2,000 dives was viewed in Jupyter Notebook (Kluyver et al., 2016) to manually confirm correct characterization (Supplementary Figures 2h–p). Divebomb characterizes individual dives by 16 metrics and these were summarized into 11 metrics for this study; maximum depth, dive duration, maximum depth/dive duration, bottom duration, bottom duration/dive duration, bottom variance (standard deviation of depths recorded during the bottom phase), descent rate, ascent rate, descent rate/ascent rate, ascent rate/descent rate, and post-dive surface interval. Each dive was then associated with a seafloor depth based on the timestamp of the CTCRW derived locations. To standardize amongst varying bottom depths where dives occurred, relative proximity of the seafloor was calculated for each dive by dividing the maximum dive depth by the seafloor depth; this provided an additional metric for dive classification (total = 12). For some dives (21.1%), dive depths were marginally greater than seafloor depths likely due to the horizontal resolution of the bathymetric charts, uncertainty in the locations from the CTCRW model, and error in the time series depth data. Under these scenarios the dive was deemed to reach the seafloor.
Prior to dive type classification, incorrectly identified/characterized dives as a result of gaps in the time series data were filtered and removed (Supplementary Material 2). Gaps in the data when an animal is at the surface, can also lead to uncertainty in the post-dive surface interval metric. In the interest of maximizing the number of dives included in the classification procedure, the post-dive surface interval metric was consequently excluded. Following dive classification, this metric was calculated for each derived dive type where the post-dive surface interval was complete, and compared among dive types using analysis of variance (ANOVA) followed by a Tukey’s test (Supplementary Material 3), to allow a full assessment of all 12 metrics among derived dive types. Common dive classification procedures using time-depth data typically transform some derived dive metrics and run a principal components analysis (PCA) prior to clustering analysis (e.g., Irvine et al., 2017; Lefebvre et al., 2018). However, variable transformation and PCA may obscure key patterns in data that is asymmetric or has outliers (e.g., Hubert et al., 2009). To check for this, the distributions of the 11 (excluding post-dive surface interval) metrics were first explored. Of these, the maximum depth metric exhibited multimodality. We consequently adopted a mixed classification procedure to differentiate amongst dive types (see Figure 2 and Supplementary Material 2 for details). In brief, step one involved splitting dives into three depth categories (Shallow, Intermediate, and Deep) using a Gaussian mixture model. Step two further subdivided the Intermediate and Deep dive categories into Benthic and Pelagic categories based on the relative proximity of the dive to the seafloor (Benthic: maximum dive depth ≥ 80% of seafloor depth, Pelagic: maximum dive depth < 80% of seafloor depth). Step 3 involved reducing the 10 dive metrics (excluding maximum depth/seafloor depth) to a set of uncorrelated principal components using a PCA with a varimax rotation (Supplementary Tables 2a–k; Lesage et al., 1999; Lefebvre et al., 2018). A hierarchical clustering approach was then undertaken for each of the above defined dive categories using the principal component scores, and cluster stability was assessed to determine confidence in the number of clusters in the data (Supplementary Table 2l).
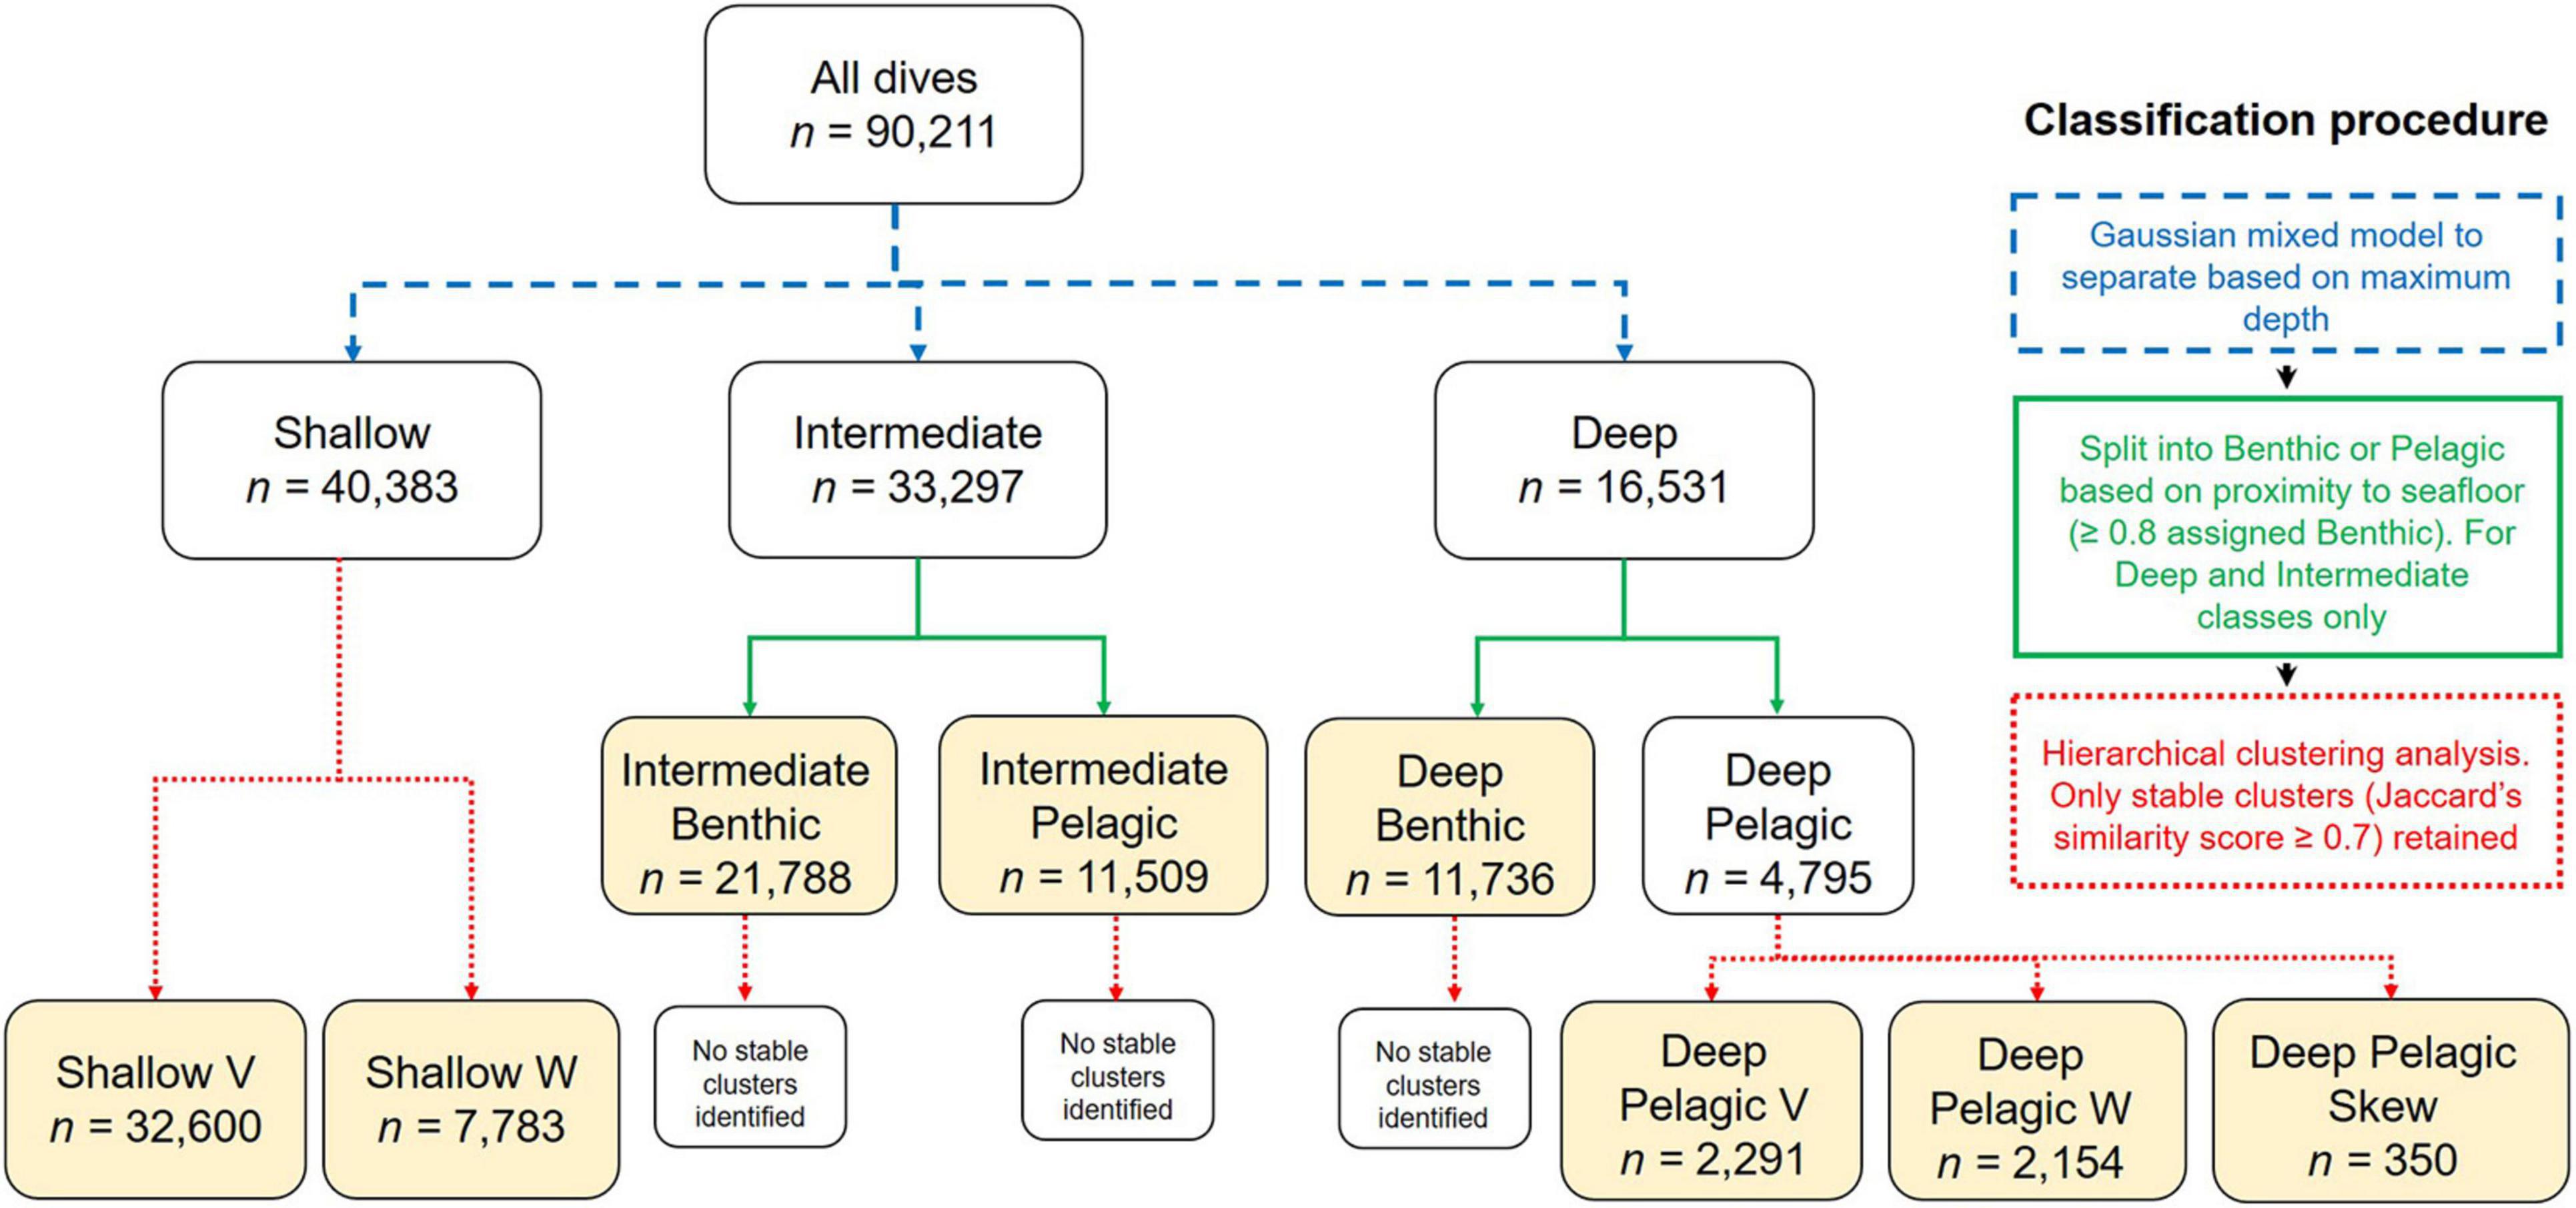
Figure 2. Flow chart of the mixed classification procedure for differentiating between beluga dive types. Arrow color denotes method of classification used at each stage; step 1 = blue, step 2 = green, step 3 = red. Yellow boxes denote the final dive types identified.
Comparing Dive Behavior by Seasons and Environmental Variables
Following classification, the frequency of each dive type was calculated for individual belugas per hour based on the dive start time. Although time series data were complete for each hour (i.e., one transmitted message), dives could not be modeled correctly if they crossed over 2 h data sections and the second hour was missing, i.e., the transmission was not received. Hence, for each summarized hour of data a single dive could be missing from that hour if the following hour was devoid of data (38.3% of hours had missing data); the total number of dives per hour should thus be seen as a lower estimate. The mean seafloor depth, slope angle and ice concentration were calculated for each hour based on the CTCRW derived locations. Each hour of data was also assigned to the season in which it occurred; summer (June-August), fall (September-November), winter (December-February), or spring (March-May).
To identify seasonal differences in the frequency of each dive type, generalized linear mixed-effects models (GLMMs) were fit using the “glmmTMB” v1.1.2 package (Magnusson et al., 2021) in R separately for each dive type as a function of season. Prior to running the models for the Deep Benthic, Deep Pelagic V, and Deep Pelagic W dive types, winter was excluded as it contained zero of these dive types across all hours of data. Models were not run for Deep Pelagic Skew as they were recorded infrequently (Table 2). Poisson regression models, suitable for count data (i.e., number of dives per hour) were fit separately for the hourly frequency of each dive type as a function of season, with individual beluga included as a random effect. For each model we calculated the Pearson χ2 dispersion statistic (Zuur et al., 2009), and compared the observed and predicted number of zeros. All models exhibited over-dispersion and zero-inflation, so the models were rerun as zero-inflated negative-binomial regression models. The “emmeans” v1.5.2-1 package (Lenth et al., 2020) in R was used to calculate estimated marginal means for GLMMs and to statistically compare the frequency of dive types among pairs of seasons using a Tukey’s test.
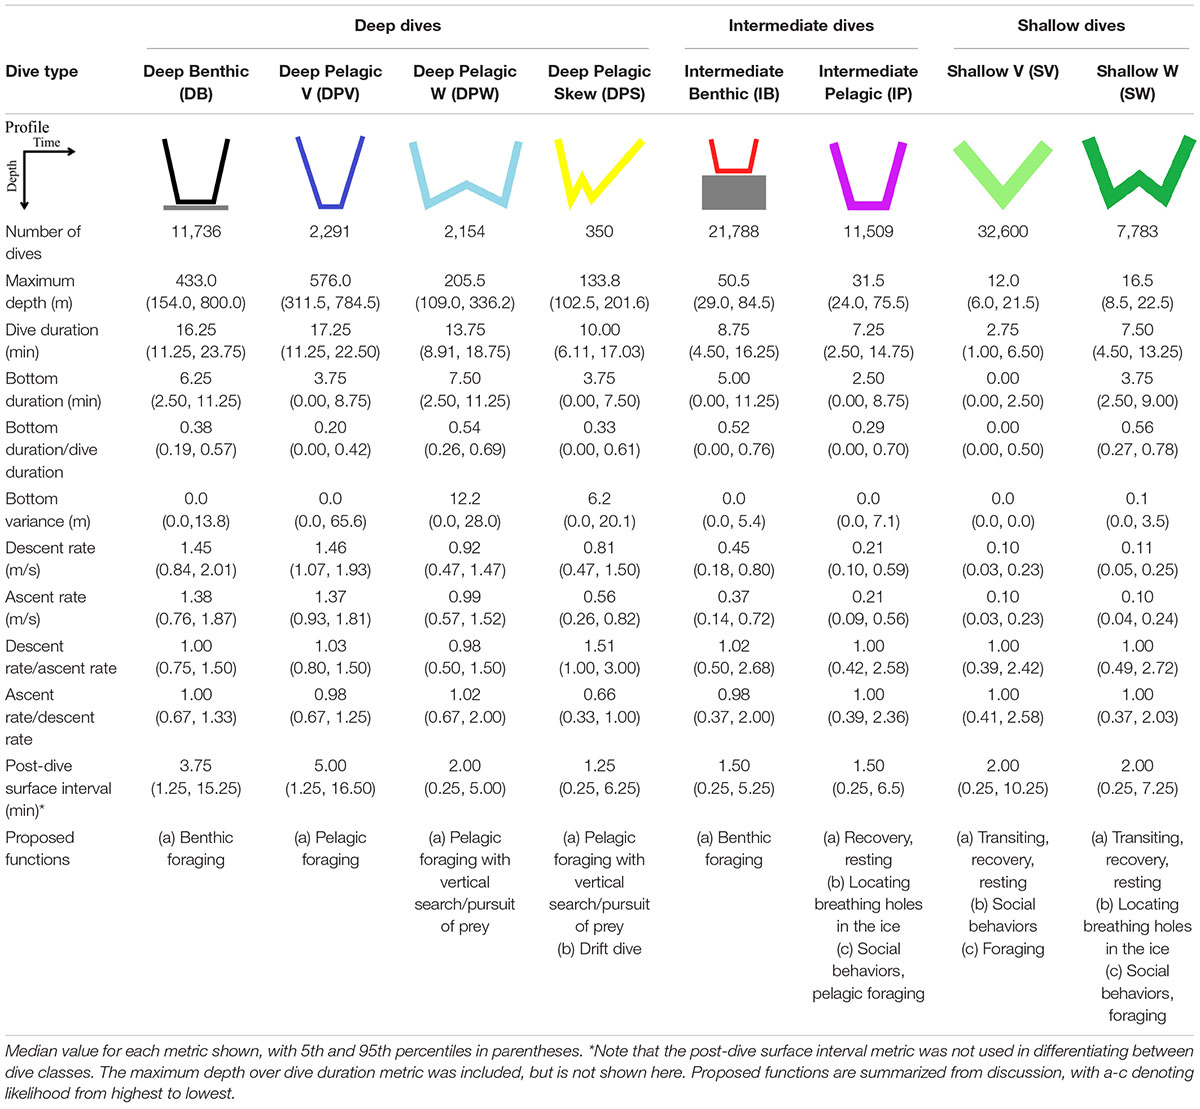
Table 2. Characteristics of the eight dive types identified using Gaussian mixed models, PCA, and hierarchical clustering analyses for male EBS belugas.
To explore the environmental parameters associated with each dive type, we ran and plotted classification and regression tree (CART) models using the “rpart” v4.1-15 (Therneau et al., 2019), and “rpart.plot” v3.1.0 (Milborrow, 2021) packages, respectively, in R. The hourly frequency of each dive type (excluding Deep Pelagic Skew) was modeled as a function of seafloor depth, seafloor slope angle, and sea ice concentration. Due to the a priori discrimination of dive types by maximum dive depth and seafloor depth during dive type classification, datasets for each model were first filtered to remove hours of data where it was impossible for a certain dive type to occur. These included data with a mean seafloor depth ≤101 m for the three Deep dive types, >101 m or ≤23 m for the Intermediate Benthic dive type, and ≤23 m for the Intermediate Pelagic dive type. To prevent the CART models from overfitting the data, models were first run with pre-pruning to set a minimum group size to 5% of all the observations. The plotcp function was then used to plot the relationship between the complexity parameter and cross-validation error, and the model rerun with the complexity parameter which was within one standard deviation of the complexity parameter with the minimum cross-validation error.
Results
Seasonal Movements
Tagged EBS male belugas occurred in distinct geographical regions over the seasonal cycle (Figures 3–6). During summer, belugas occupied the shallow Mackenzie Shelf (<50 m deep, Figure 3), deeper regions of the Arctic Archipelago (∼200–500 m deep) including Amundsen Gulf and Viscount Melville Sound, and the Eastern Beaufort Slope (∼500–1,500 m deep). Belugas then migrated westwards over the Arctic Basin in late summer/early fall (Figures 3, 4). During this period, belugas spent periods of time in slope habitats off the Beaufort, Chukchi, and East Siberian shelves, but core habitat was centered around the Mendeleev Ridge (>1,000 m deep, Figure 4) in September, before moving into the Chukchi Sea (∼50 m deep) in October and November. Belugas then occupied the northern Bering Sea (∼50 m deep) from winter (Figure 5) into mid-spring (Figure 6), whilst dense pack ice was present north of the Bering Strait (Supplementary Figure 3b), after which they migrated northwards via Barrow Canyon and along the Beaufort Slope (Figure 6), concomitant with reduced ice cover in these regions (Supplementary Figure 3b). As expected, due to premature failure of tags, location and dive data were most complete in the months immediately following tagging (July = 13 belugas, Figure 3), and least complete later in the season (January through June = 3 belugas, Table 1 and Figures 3–6).
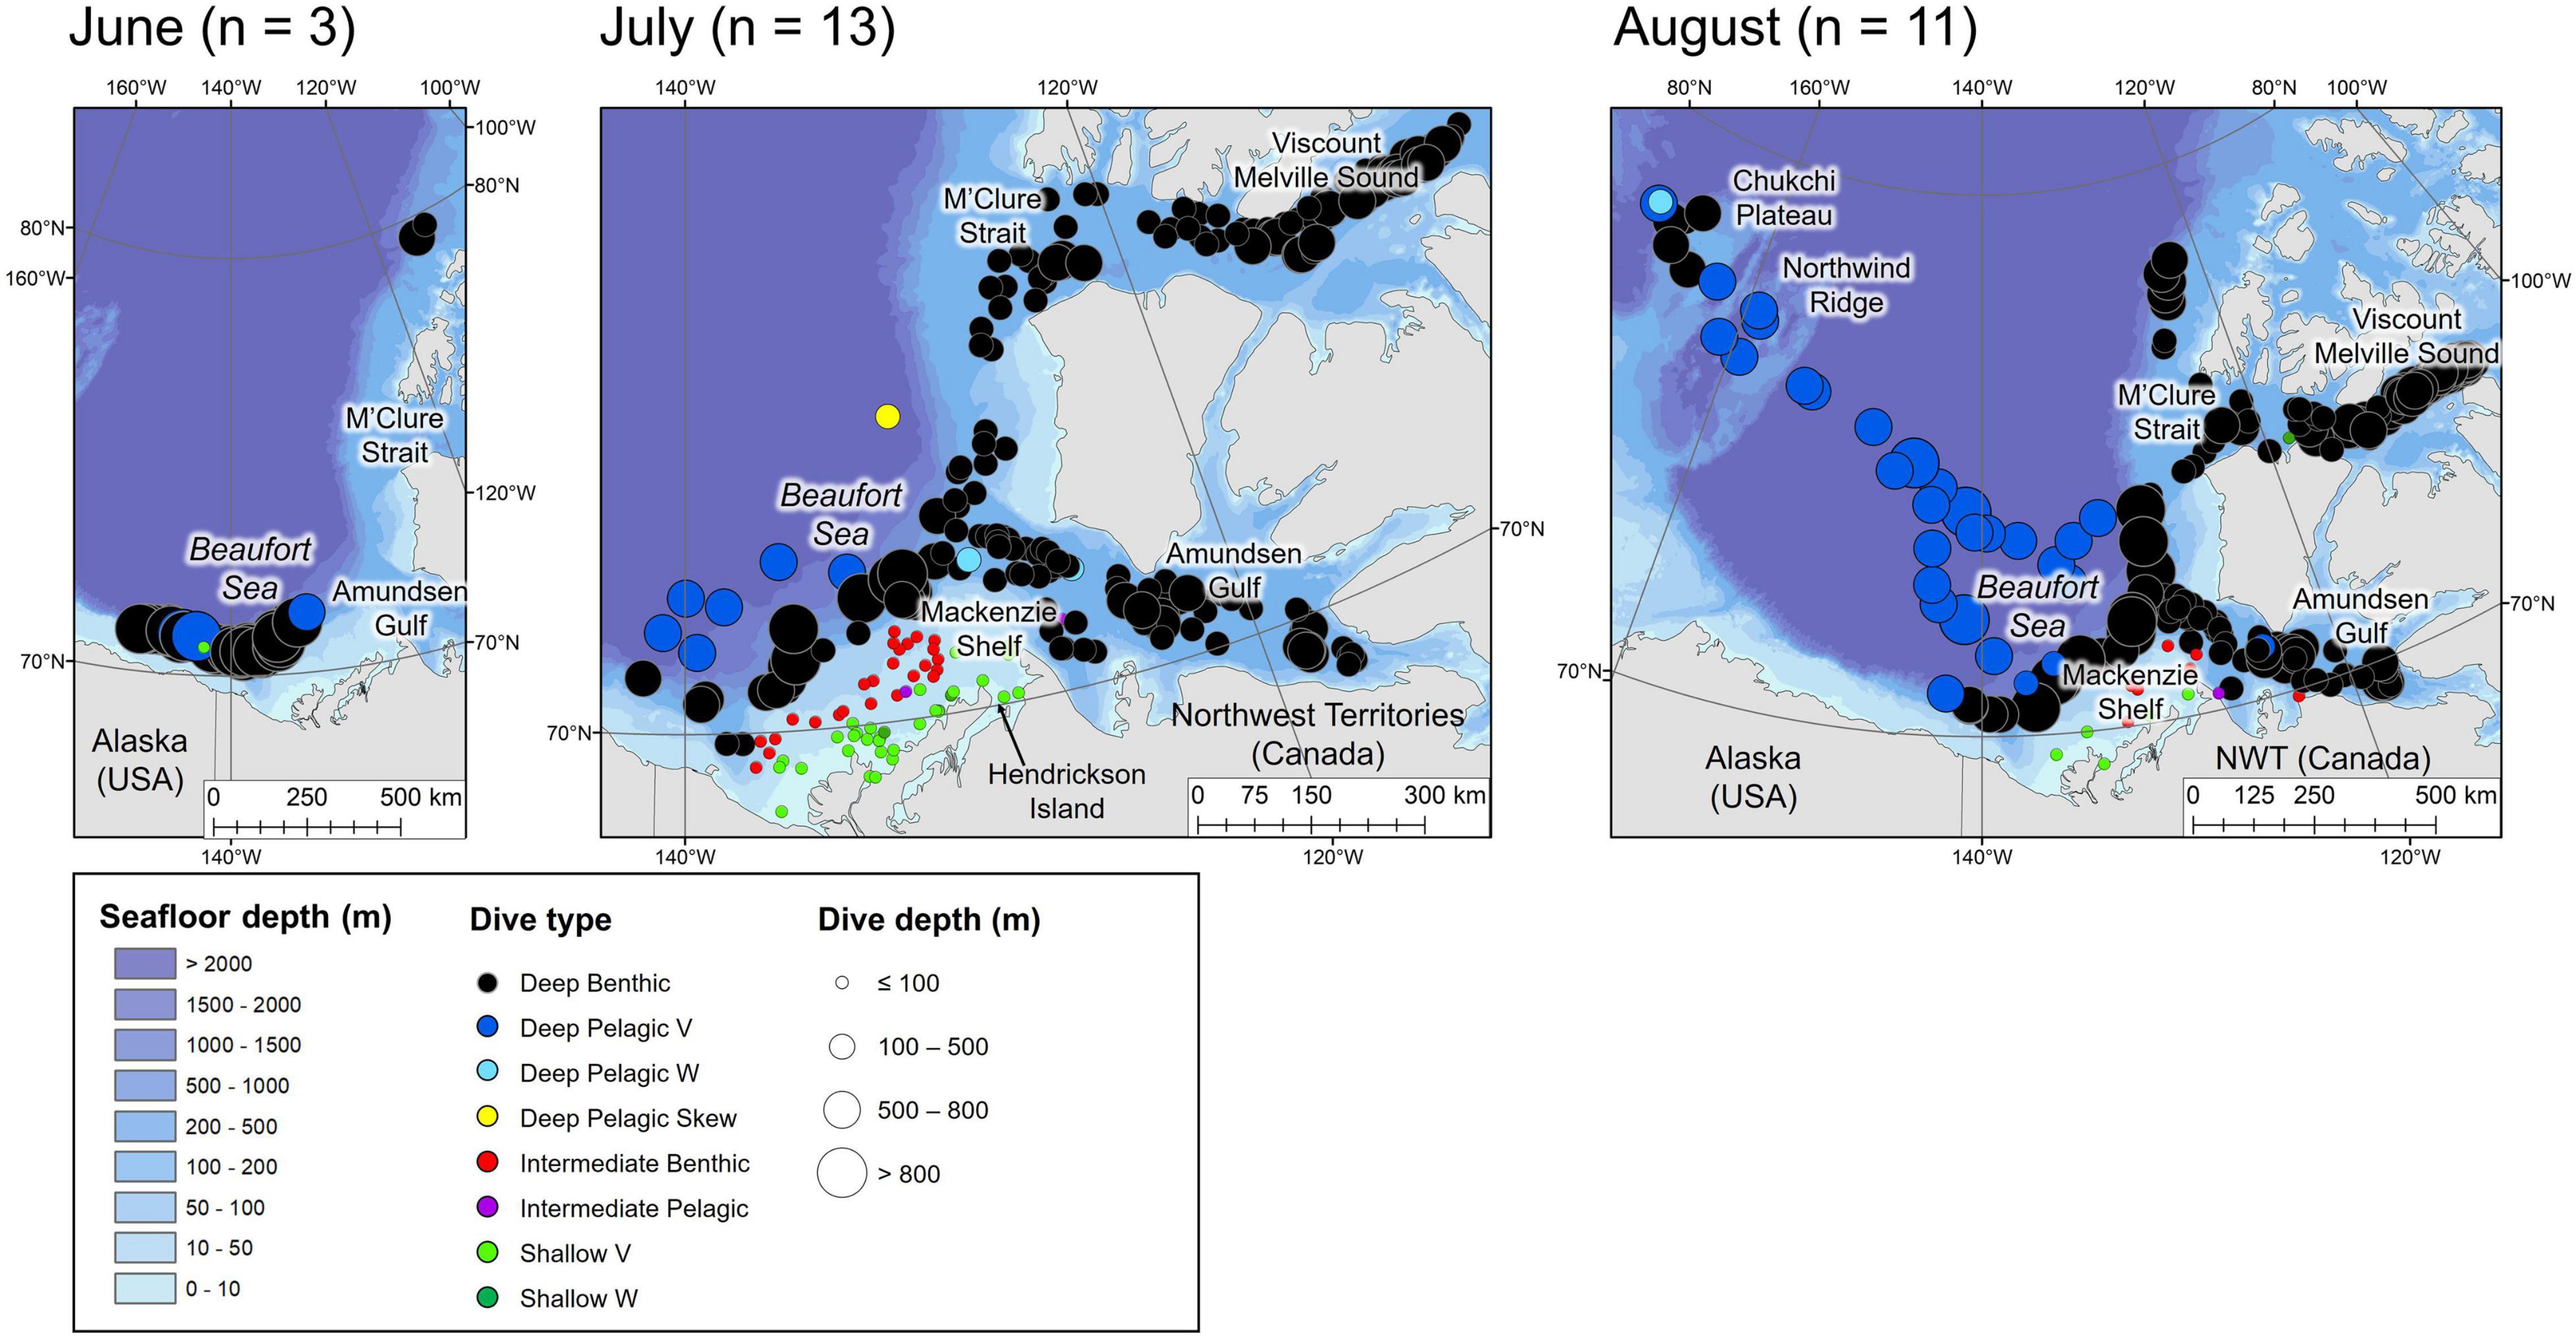
Figure 3. Locations of the daily deepest dive made by each beluga during the summer months. Symbol color represents dive type and symbol size represents the maximum depth reached. n in parentheses gives the number of belugas which transmitted data in the given month. Note that the panel for June denotes locations of dives recorded in 2019 (made by belugas which were tagged in July 2018). July and August are for 2018 and 2019.
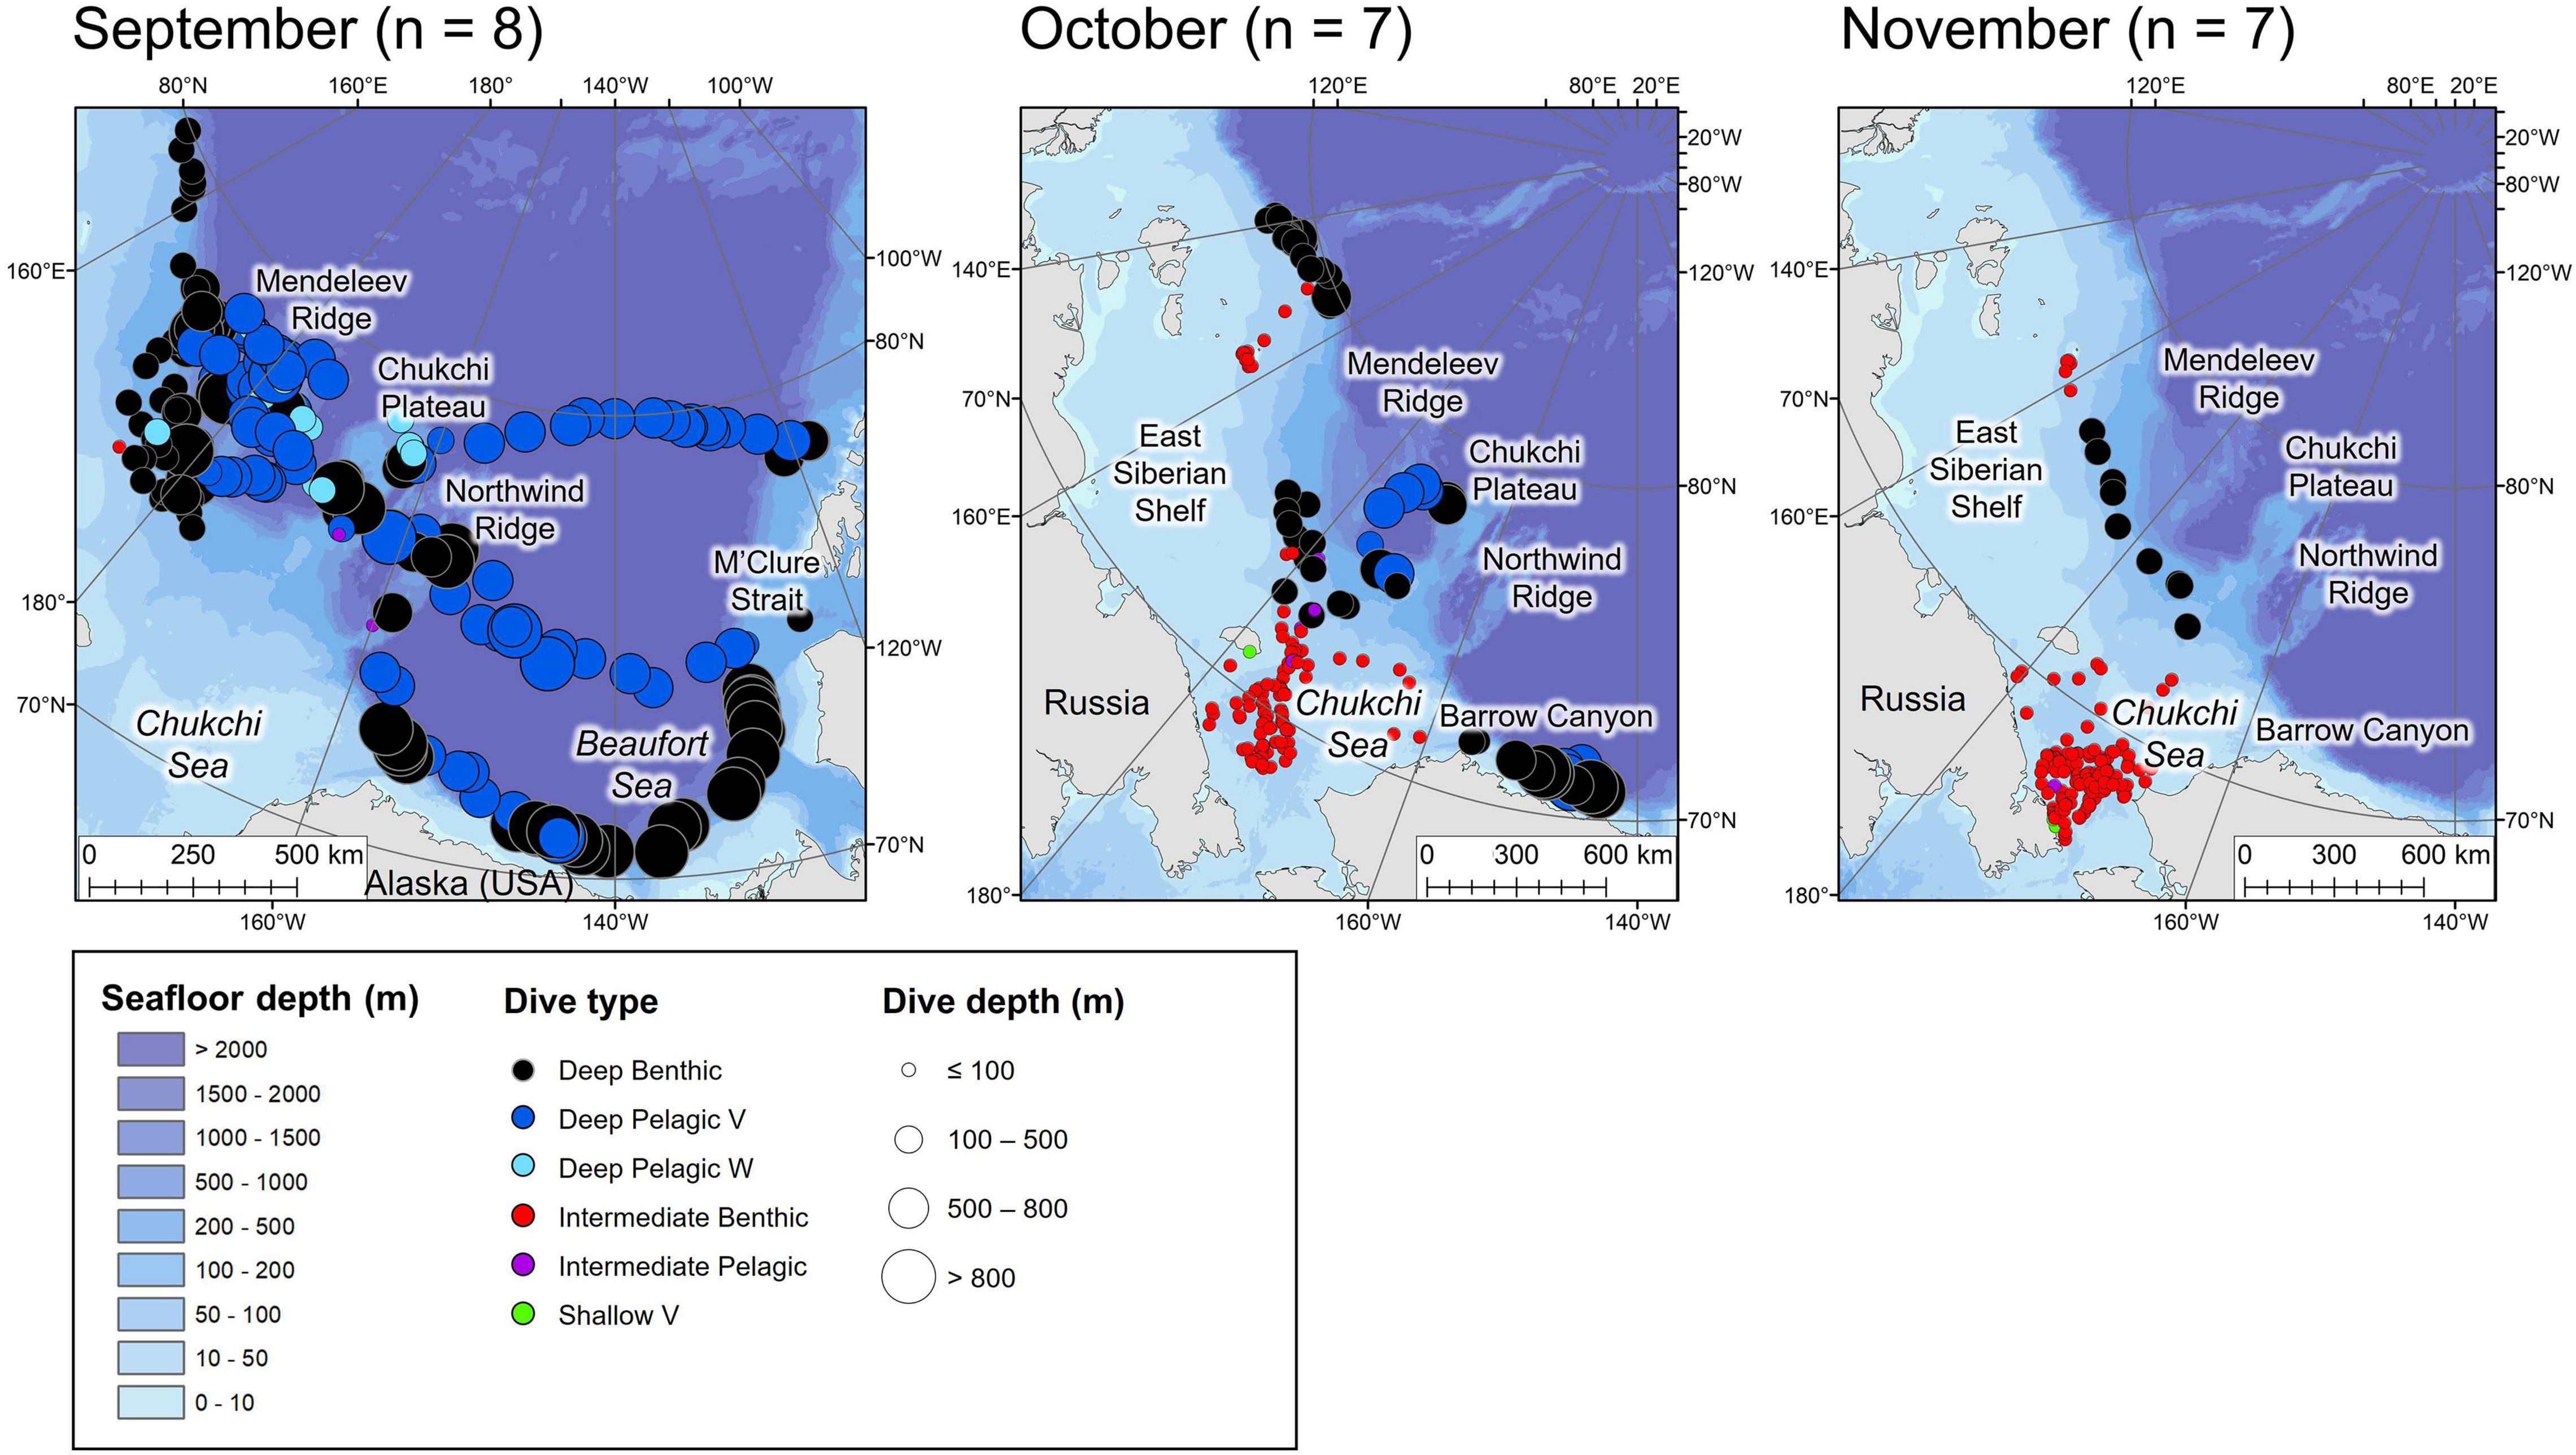
Figure 4. Locations of the daily deepest dive made by each beluga during the fall months. Symbol color represents dive type and symbol size represents the maximum depth reached. n in parentheses gives the number of belugas which transmitted data in the given month.
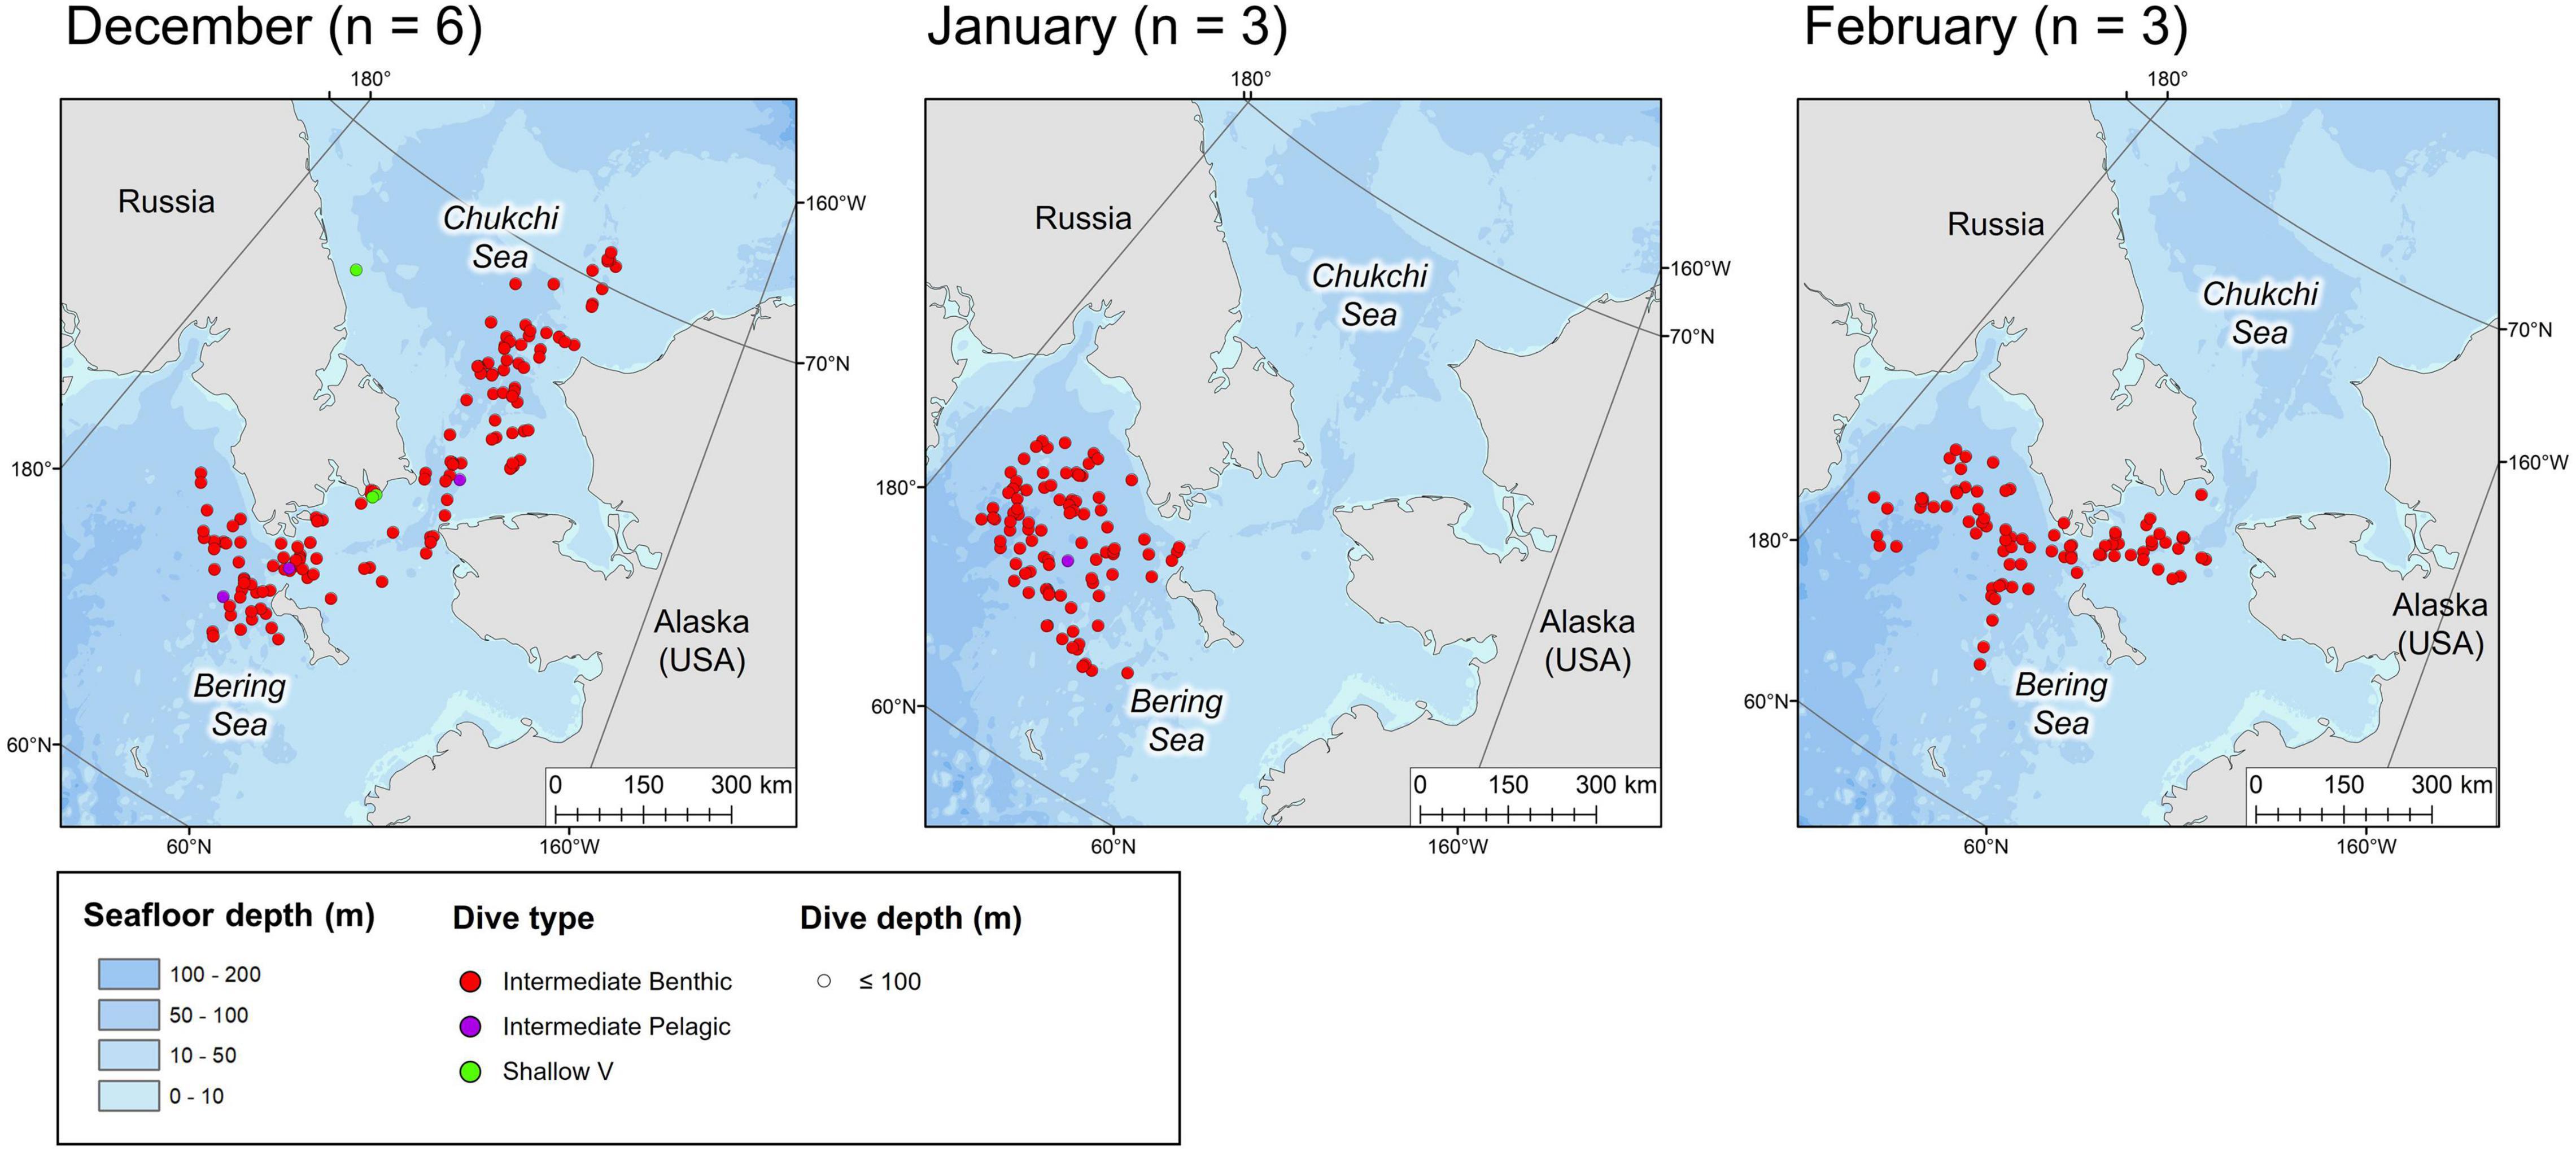
Figure 5. Locations of the daily deepest dive made by each beluga during the winter months. Symbol color represents dive type and symbol size represents the maximum depth reached. n in parentheses gives the number of belugas which transmitted data in the given month.
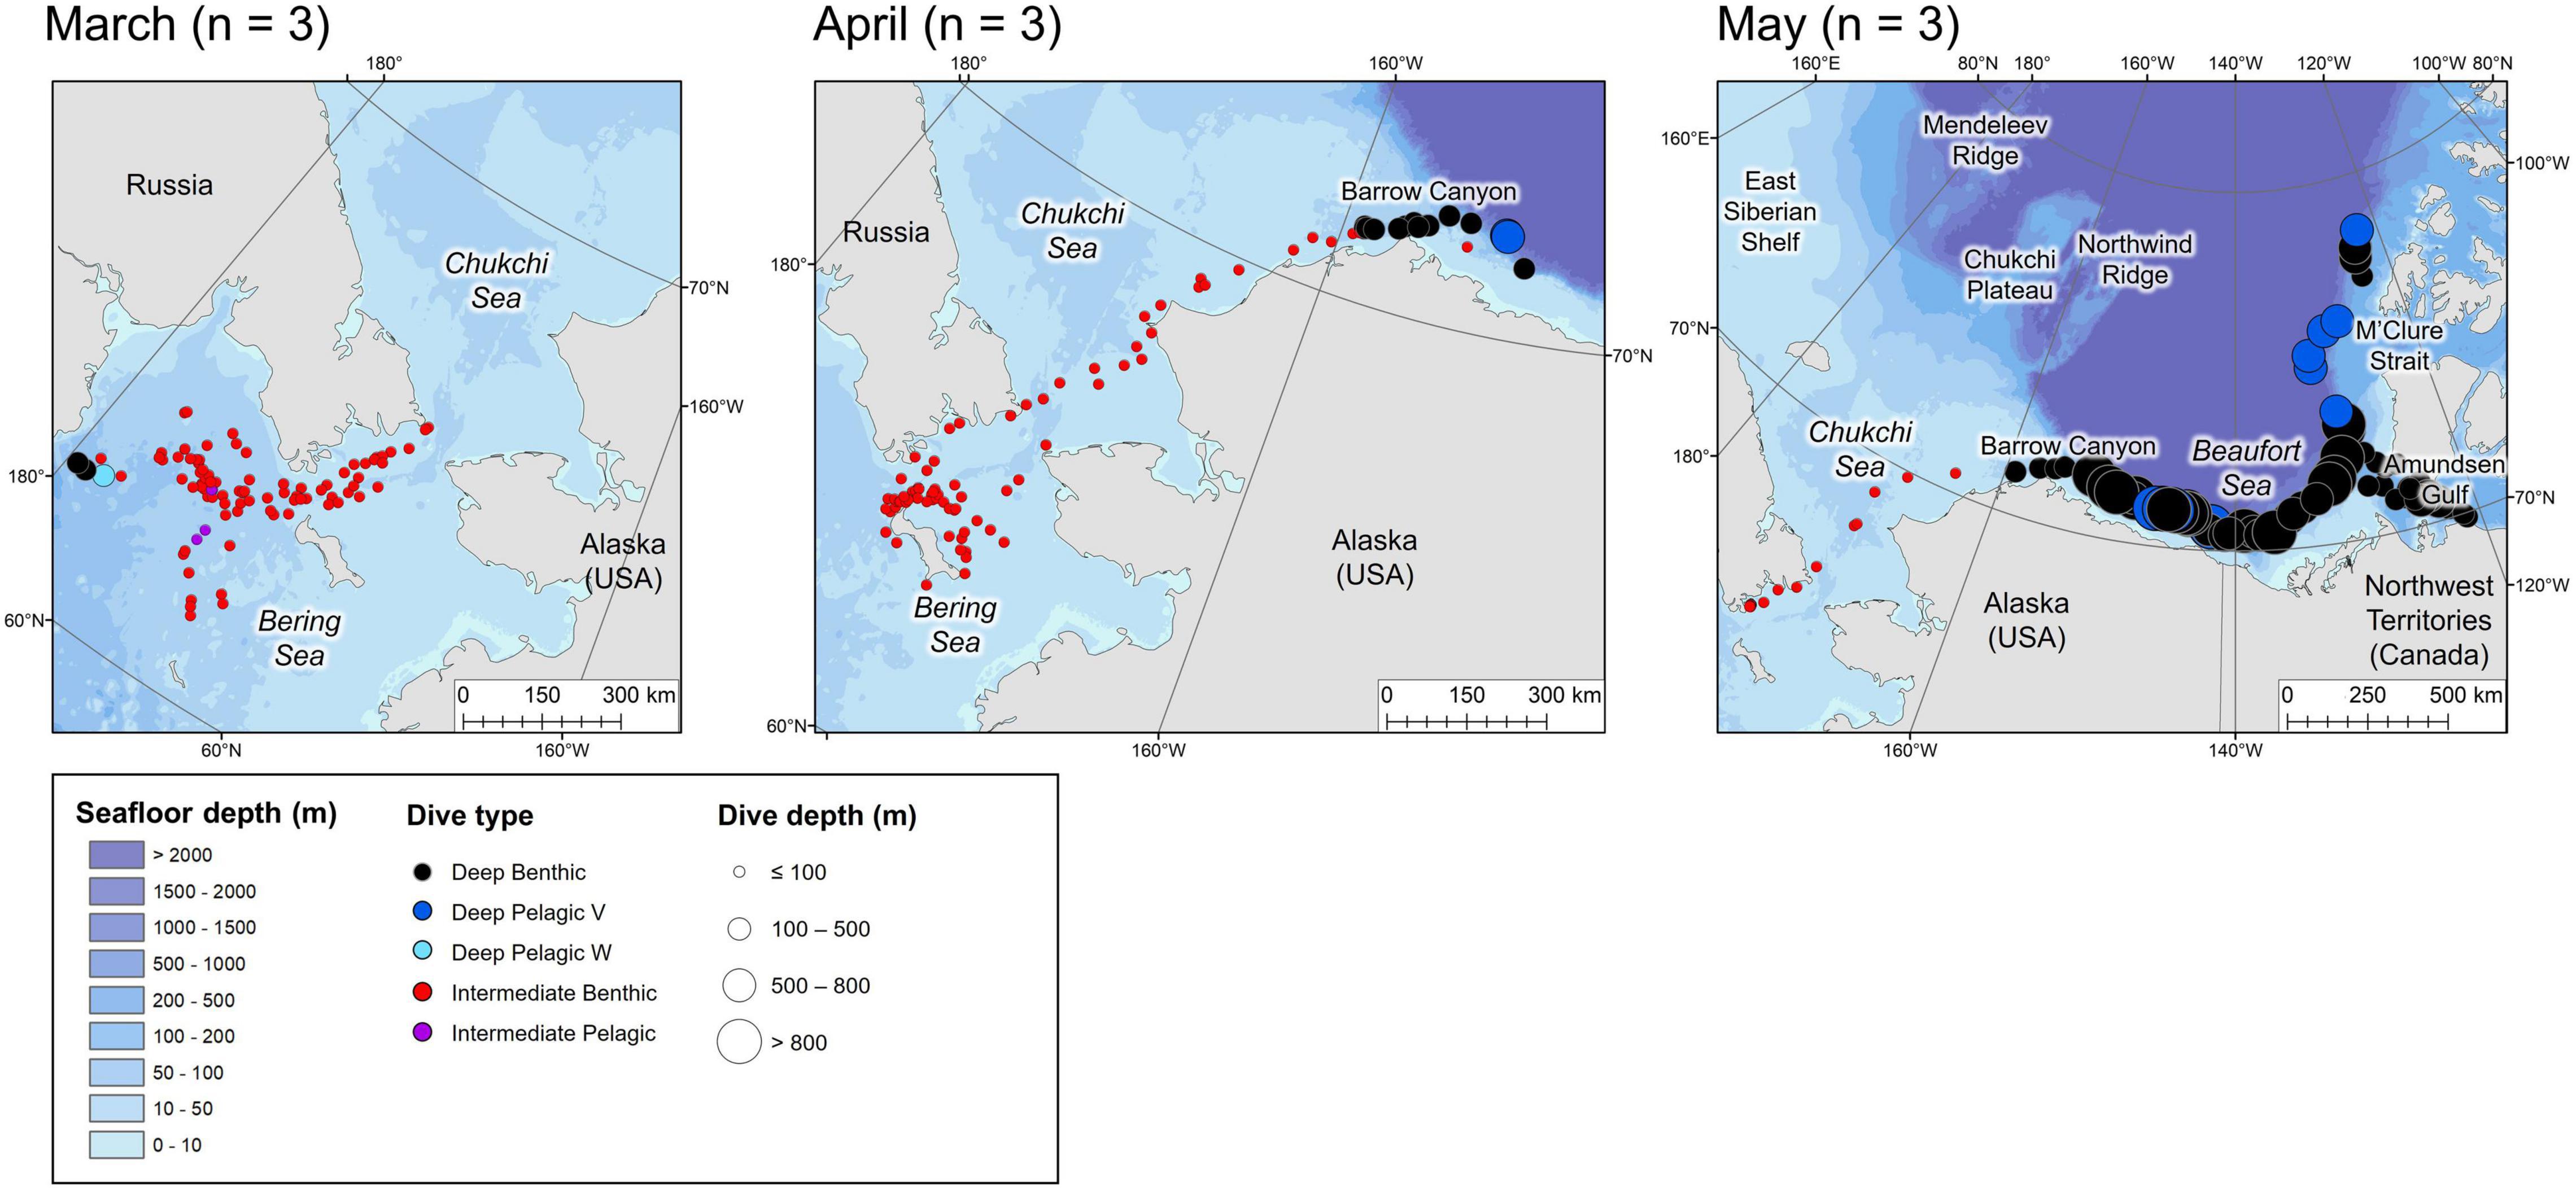
Figure 6. Locations of the daily deepest dive made by each beluga during the spring months. Symbol color represents dive type and symbol size represents the maximum depth reached. n in parentheses gives the number of belugas which transmitted data in the given month.
Beluga Dive Type Classification and Associated Characteristics
A total of 96,984 individual dives were identified over 1,900 days of tracking data. Following removal of incorrectly modeled dives due to gaps in the data (6.98%), 90,211 dives were recorded by 13 male belugas between July 2018 and November 2019 (Table 1).
Eight dive types were identified using the Gaussian mixed modeling and hierarchical clustering analyses approaches (Table 2). The Gaussian mixed modeling first categorized dives according to three depth classes; Deep (max. depth > 101 m), Intermediate (max. depth = 23.1–101 m), and Shallow (max. depth ≤ 23 m). Deep and Intermediate dives were then further subdivided into Benthic or Pelagic classes based on the proximity of the dive to the seafloor (Figure 2, n = 4 dive categories). Hierarchical clustering analysis revealed stable clusters (Jaccard’s similarity index ≥ 0.7, Supplementary Table 2l) within the Deep Pelagic (n = 3) and Shallow (n = 2) dive categories, and these were each further subdivided into dive types. Names assigned to each dive type describe the general dive structure, accepting a degree of variability observed within each of the eight determined dive types (Table 2 and Supplementary Figures 2h–p). It should be noted that due to the sampling frequency and surface threshold used, it was not possible to characterize the shallowest dives (≤5 m) and that depth changes which may have occurred between the 75 s sampling intervals are underestimated, which will result in less accurate characterization of short dives.
Benthic Dives
Deep Benthic and Intermediate Benthic dives, U-shape in form, were typically characterized by consistent bottom depths (median bottom variance = 0.0 m, Table 2), and long bottom durations relative to total dive duration (median bottom duration/dive duration = 0.38 and 0.52, respectively, Table 2). Deep Benthic dives were the most frequently recorded amongst the Deep dive types (n = 11,736, 13.0% of total dives), and included the deepest dive (max. depth = 1400.0 ± 15.75 m, duration = 22.5 ± 1.25 min) and longest dive (max. depth = 432.0 ± 3.75 m, duration = 32.5 ± 1.25 min) recorded for a beluga whale. However, results of the CART model indicate infrequent occurrence in regions with seafloor depths ≥743 m (mean = 0.22 dives/hour, Figure 7), and this dive type principally occurred in regions with seafloor depths from 101 to 743 m (mean = 1.5 dives/hour, Figure 7), under both high ice (≥60%, mean = 1.3 dives/hour), and lower ice concentrations (<60%, mean = 1.8 dives/hour). Intermediate Benthic dives were also recorded frequently (n = 21,788, 24.2% of total dives, Table 2). The CART models identified high frequency in all regions with seafloor depths between 23 and 101 m (mean = 2.9 dives/hour, Figure 7), and they occurred in greatest frequency when seafloor depths were <57 m and in sea ice concentrations <35% (mean = 3.9 dives/hour). Intermediate Benthic dives were shorter (median = 8.75 min vs. 16.25 min), shallower (median max. depth = 50.5 vs. 433.0 m, Table 2) and had slower rates of vertical movement (median descent rate = 0.45 vs. 1.45 m/s, median ascent rate = 0.37 vs. 1.38 m/s, Table 2) than Deep Benthic dives.
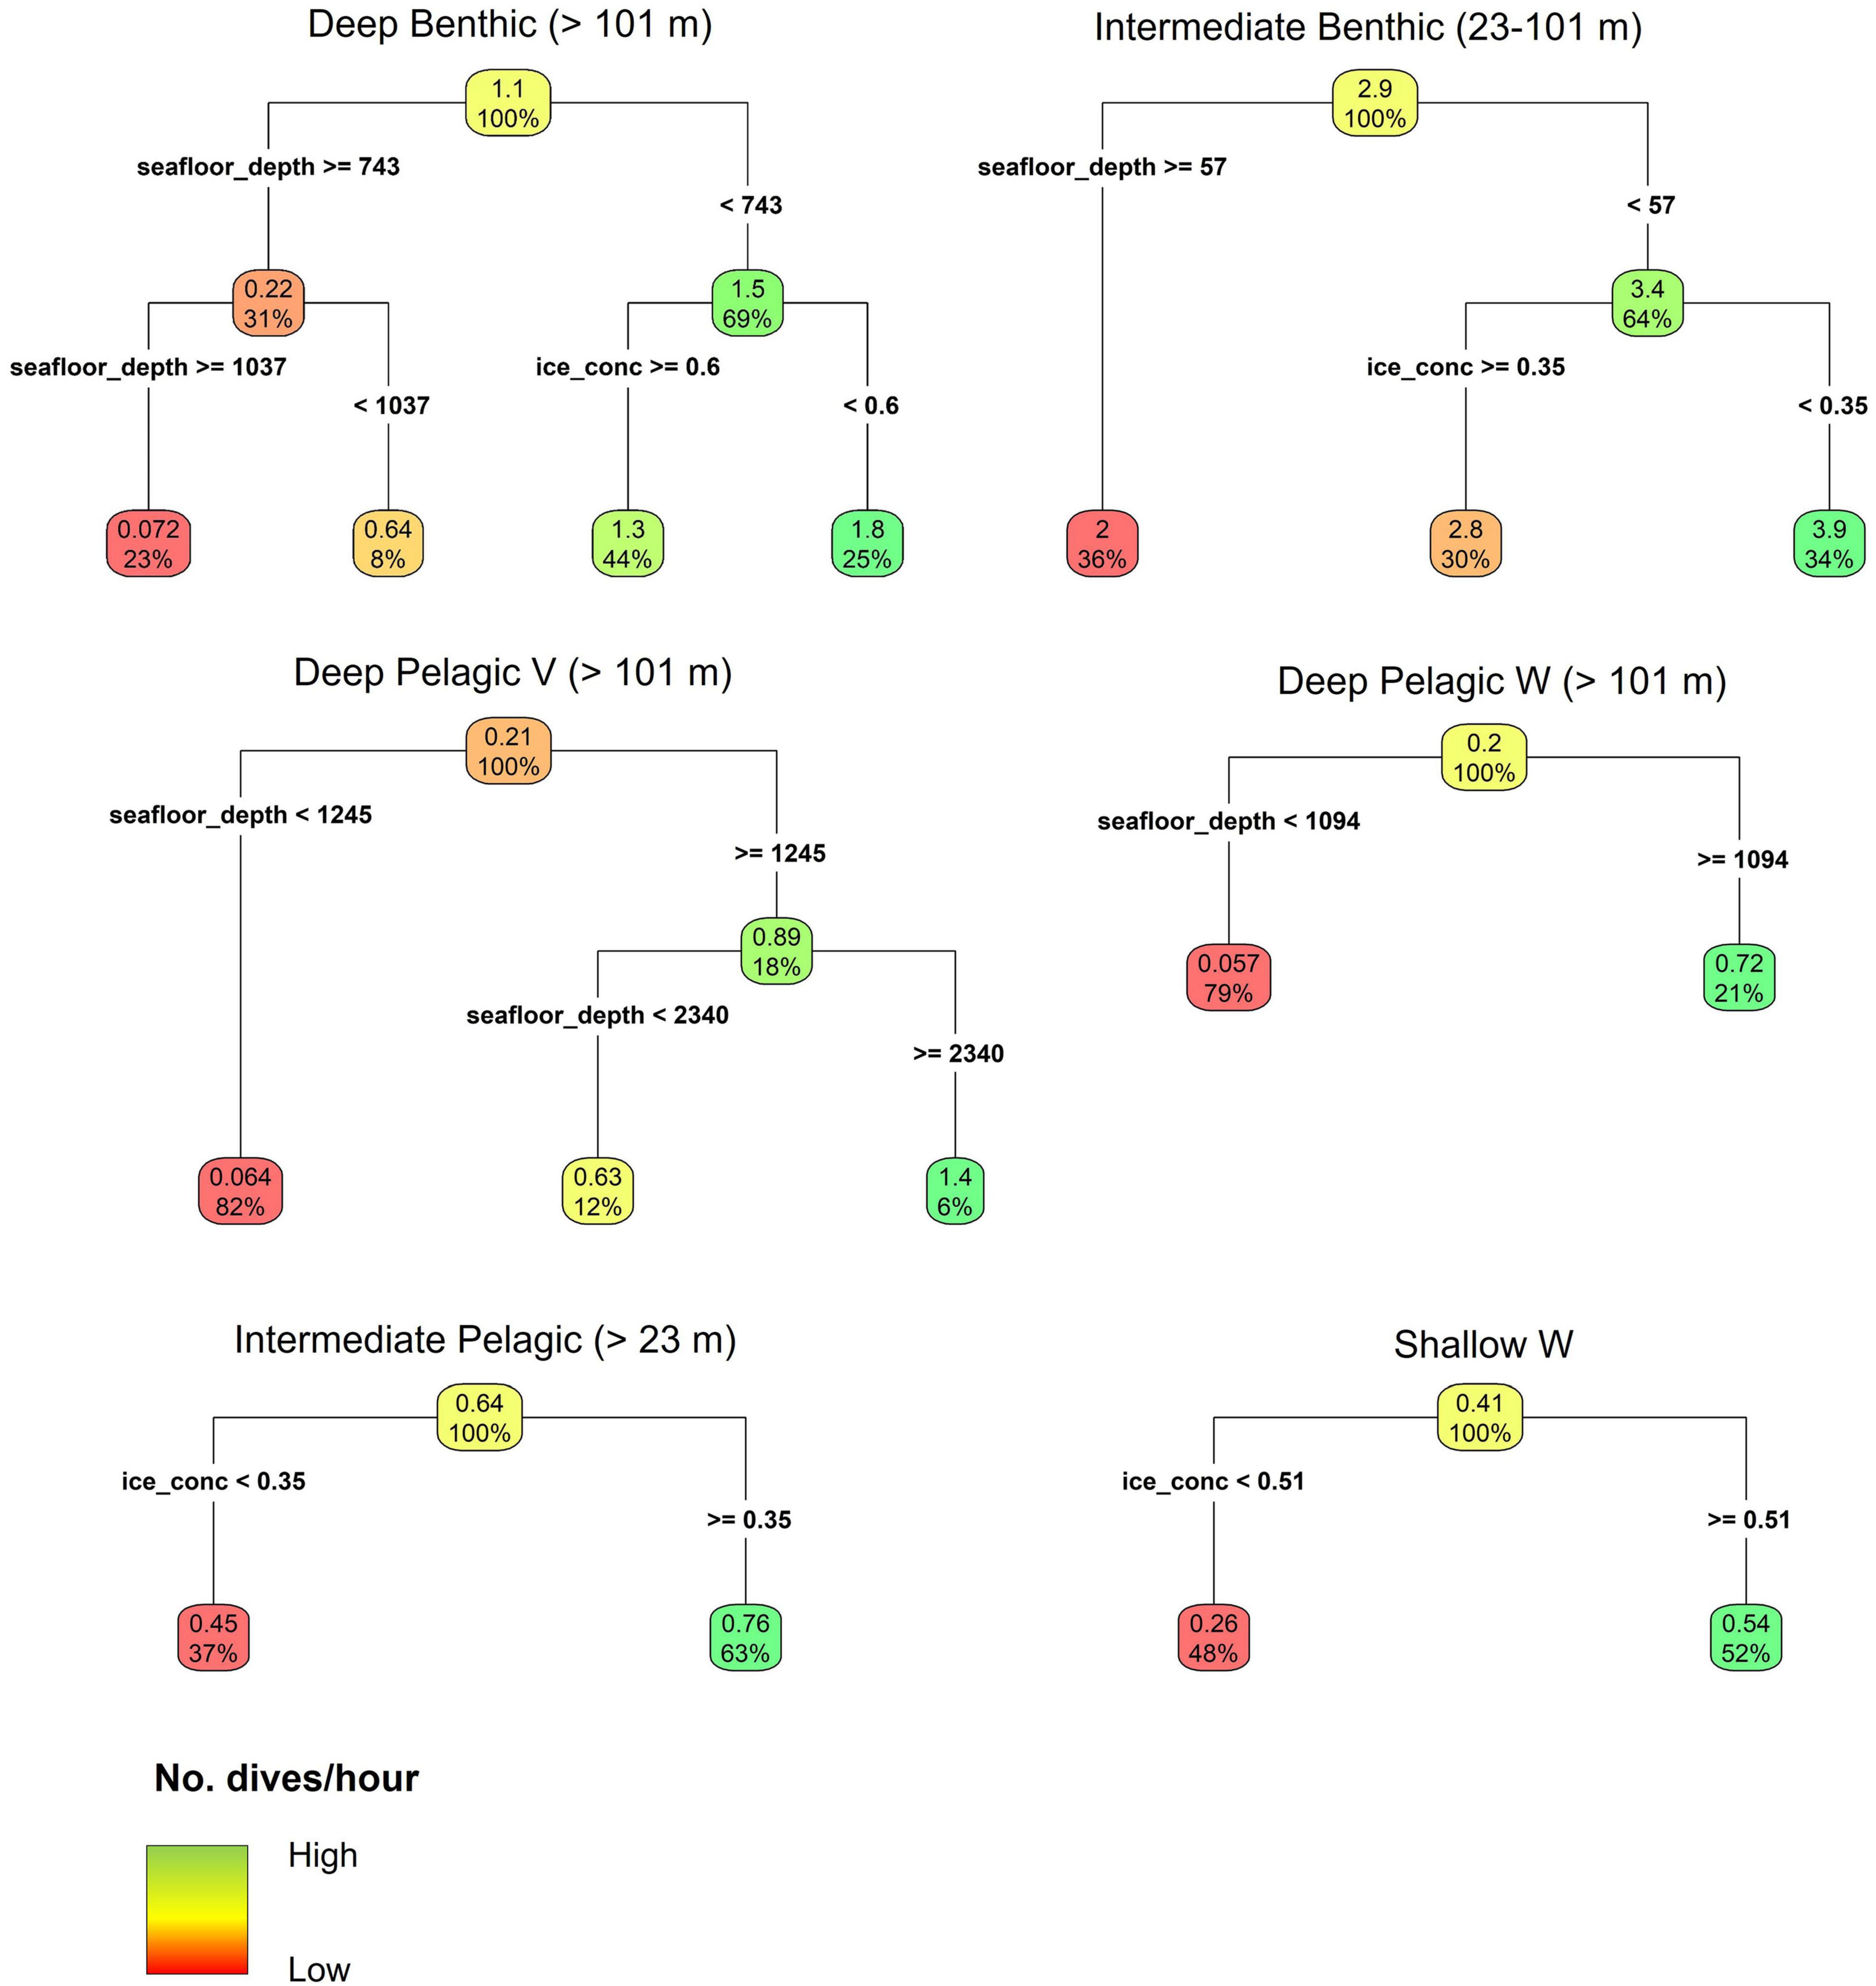
Figure 7. Regression tree models for the hourly frequency of each dive type in relation to seafloor depth (seafloor_depth), sea ice concentration (ice_conc), and slope angle. Note that the model for the Shallow V dive type is not shown as regression trees identified no relationship between dive frequency and environmental parameters. The Deep Pelagic Skew dive type was not modeled due to low sample size. Parentheses next to the dive type show the range of seafloor depths over which the given dive type was modeled, due to prior discrimination in depth limits of certain dive types during the classification. The upper number in each node and leaf denotes the mean number of dives per hour given the environmental conditions above. The percentage in each node and leaf gives the proportion of the total number of observations conforming to the environmental conditions above. Sea ice concentration is the proportion of each 25 km2 grid cell covered by ice.
Pelagic Dives
Four pelagic dive types were identified; Deep Pelagic V, Deep Pelagic W, Deep Pelagic Skew, and Intermediate Pelagic. Due to their very low frequency of occurrence, Deep Pelagic Skew dives were not analyzed in the CART models. The CART models identified that Deep Pelagic V dives were principally made in regions with seafloor depths ≥1,245 m (mean = 0.89 dives/hour, Figure 7), and with greatest frequency when seafloor depths were ≥2,340 m (mean = 1.4 dives/hour), but rarely over shallower depths (mean = 0.064 dives/hour, Figure 7). Deep Pelagic V dives were the deepest of all dive types in general (median max. depth = 576.0 m, Table 2), were long duration (median = 17.25 min), but with a short bottom phase relative to the total dive duration (median bottom duration/dive duration = 0.20), and low bottom variance (median = 0.00 m), forming more of a V-shape than the Deep Benthic, Intermediate Benthic, or Deep Pelagic W dives. Deep Pelagic W dives were also only made frequently in deeper regions (CART model seafloor depth ≥ 1,094 m, mean = 0.72 dives/hour, Figure 7). These dives were shallower (median max. depth = 205.5 m) and shorter (median = 13.75 min) than Deep Pelagic V dives, but had the longest bottom phase duration of any dive type (median bottom duration = 7.50 min, Table 2). These dives typically had a W-shape, often with one or more depth changes during the bottom phase of the dive (median bottom variance = 12.2 m), and occasionally with large depth changes >50 m (Supplementary Figure 2j). The Deep Pelagic Skew dives were infrequently recorded (n = 350, 0.39% of total dives), hence CART models were not used to identify environmental associations. These dives had similar structure to Deep Pelagic W dives, but showed a prominent right-skew, with a slower ascent rate than descent rate (median ascent rate/descent rate = 0.66, Table 2). While this one skewed dive class was differentiated using the hierarchical clustering approach, other dive classes included some level of skewed dives (see descent rate/ascent rate and ascent rate/descent rate metrics in Table 2, and Supplementary Figures 2h–o). The Intermediate Pelagic dives were recorded frequently (n = 11,509, 12.8% of total dives), and tended to occur more frequently under higher ice concentrations (≥35% ice concentration, mean = 0.76 dives/hour, CART model, Figure 7) than lower ice concentrations (mean = 0.45 dives/hour). This dive type was variable in form, and included both short V-shaped dives, and longer U- or W-shaped dives (Table 2 and Supplementary Figure 2m).
Shallow Dives
Two shallow dive types were identified; Shallow V and Shallow W. Shallow V dives were the most frequently recorded of all dive types (n = 32,600, 36.1% of total dives), and the CART models identified no relationship among the frequency of this dive type with seafloor depth, sea ice concentration, or slope angle. These dives were short (median = 2.75 min, Table 2), and involved the beluga reaching the bottom of the dive and heading directly to the surface (median bottom duration = 0.0 min), forming a distinct V-shape (Table 2). Shallow W dives were made more frequently in regions with higher ice concentrations (≥51%, mean = 0.54 dives/hour, CART model, Figure 7). They were characterized by an intermediate duration (median = 7.50 min), and a long bottom phase relative to the total dive duration (median bottom duration/dive duration = 0.56 m). Shallow W dives included U-shaped profiles with no bottom variance, as well as W-shaped dives with some variance in depth during the bottom phase (median bottom variance = 0.1 m, see Table 2 and Supplementary Figure 2o). Shallower dives had slower rates of descent and ascent than deeper dives among all dive types (Table 2).
Post-dive Behavior
As would be expected, the two deepest dive classes, Deep Benthic and Deep Pelagic V, had the longest post-dive surface intervals (median = 3.75 and 5.0 min, respectively, Table 2, p < 0.001, Supplementary Table 3a). The next deepest dive, Deep Pelagic W, had a significantly shorter post-dive surface interval (median = 2.0 min, p < 0.001). Deep Pelagic Skew, Intermediate Benthic and Intermediate Pelagic dive types had the shortest post-dive surface intervals on average (median = 1.25, 1.50, and 1.50 min, respectively, p < 0.001, Supplementary Table 3a). All dive types except Deep Pelagic Skew were most frequently followed by a dive of the same type or by a Shallow V dive type (Supplementary Figure 3a), with Intermediate Benthic type dives having the greatest likelihood of being followed by a dive of the same type (78.0% of Intermediate Benthic dives followed by an Intermediate Benthic dive, Supplementary Figure 3a). Intermediate Pelagic dives also frequently followed other dive types (Supplementary Figure 3a). The deepest dive types (Deep Benthic and Deep Pelagic V) had longer post-dive surface intervals before making a dive of the same type (median = 5.00 min, Supplementary Table 3b) than before making a Shallow V dive type (median 3.75 min) or an Intermediate Pelagic dive type (median = 2.50 and 3.00 min, respectively, p < 0.001, Supplementary Table 3c).
Seasonal Dive Behavior
Beluga whales exhibited distinct changes in the frequency of dive types over an annual cycle (Figure 8), identified through Tukey’s tests following zero-inflated negative binomial GLMMs (Table 3). During summer, belugas made the greatest number of Deep Benthic dives (Table 3 and Figure 8); for example beluga LC2018#1 made 50 Deep Benthic dives to ∼450 m in Viscount Melville Sound over a 24-h period in July (Figure 9A). In June, belugas recorded fewer Deep Benthic dives (e.g., 9 vs. 47% of hours with ≥2 dives in June vs. August, Figure 8), concomitant with their late spring/early summer distribution over the deeper waters of the Beaufort Slope (Figures 3, 6). As expected, belugas made deeper Deep Benthic dives in this region than in the Arctic Archipelago regions (Figure 3); beluga LC2018#6 recorded 21 Deep benthic dives to between 890 and 1,070 m along the Beaufort Slope over a 24-h period in June (Figure 9B). During fall, belugas made significantly fewer Deep Benthic dives (p = 0.042, Table 3), and significantly more Deep Pelagic V and W type dives (p ≤ 0.004, Table 3), both of which were recorded in greatest numbers in September (30% of hours with ≥ 1 Deep Pelagic V dive, 26% of hours with ≥ 1 Deep Pelagic W dive, Figure 8). Beluga LC2018#3, for example, recorded 10 Deep Pelagic V and 43 Deep Pelagic W dives over a 24-h period in the region around the Mendeleev Ridge during September (Figure 9C). From mid-fall through winter, belugas made large numbers of Intermediate Benthic dives whilst occupying the Chukchi and then the Bering Sea (Figures 4, 5), that occurred in greater frequency than any other dive type (46–75% of hours with ≥ 3 Intermediate Benthic dives from October through February, Figure 8). Such extensive Intermediate Benthic is exemplified by beluga LC2018#3, that recorded 51 dives to ∼50 m over a 9-h period in the Chukchi Sea during November (Figure 10A). Between fall and spring belugas tended to decrease the frequency at which they made Intermediate Benthic dives, and increase the frequency of Intermediate Pelagic and Shallow W dives (p < 0.001, Table 3 and Figure 8, see series of dives by beluga LC2018#6; Figure 10B). The frequency of Deep Benthic dives increased again as belugas moved northeastwards toward the Beaufort Sea in late spring (Figures 6, 8), via deeper waters over Barrow Canyon and the Beaufort Slope. Shallow V dives were recorded in high numbers throughout the year (Figure 8), but tended to occur most frequently during the summer, although this was not significant (p ≥ 0.069, Table 3).
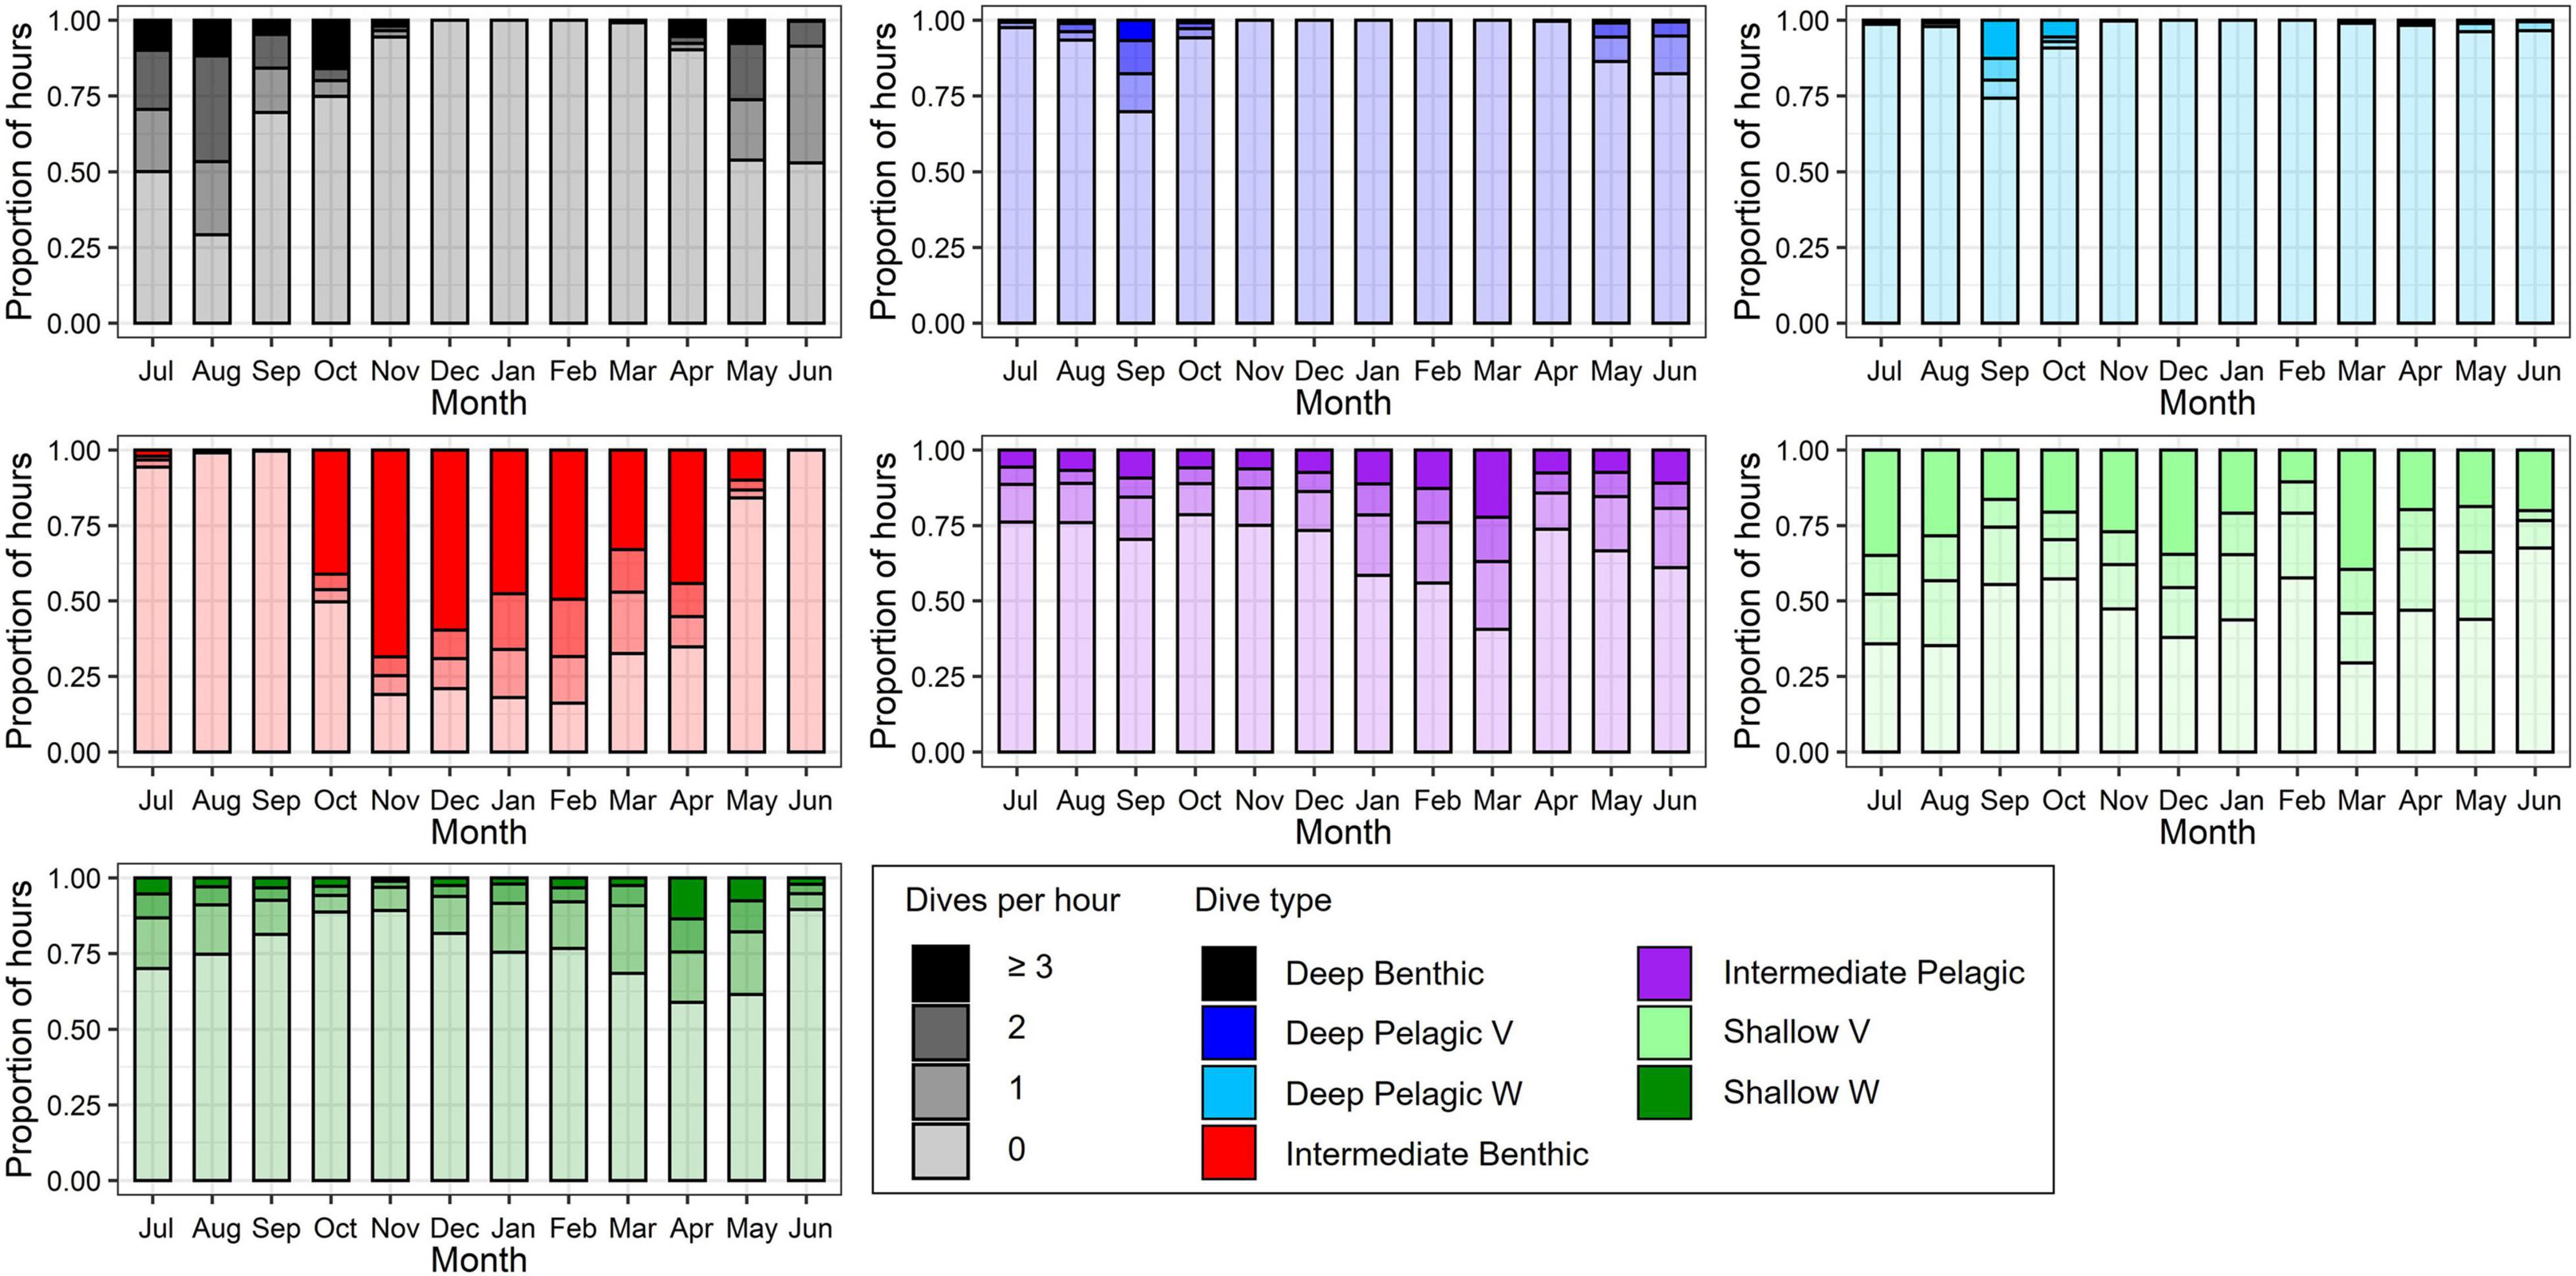
Figure 8. Proportional frequency of number of each dive type per hour by month, color-coded by dive type and shaded by dive frequency. Hours with ≥3 dives of a given dive type combined into a single group for display.
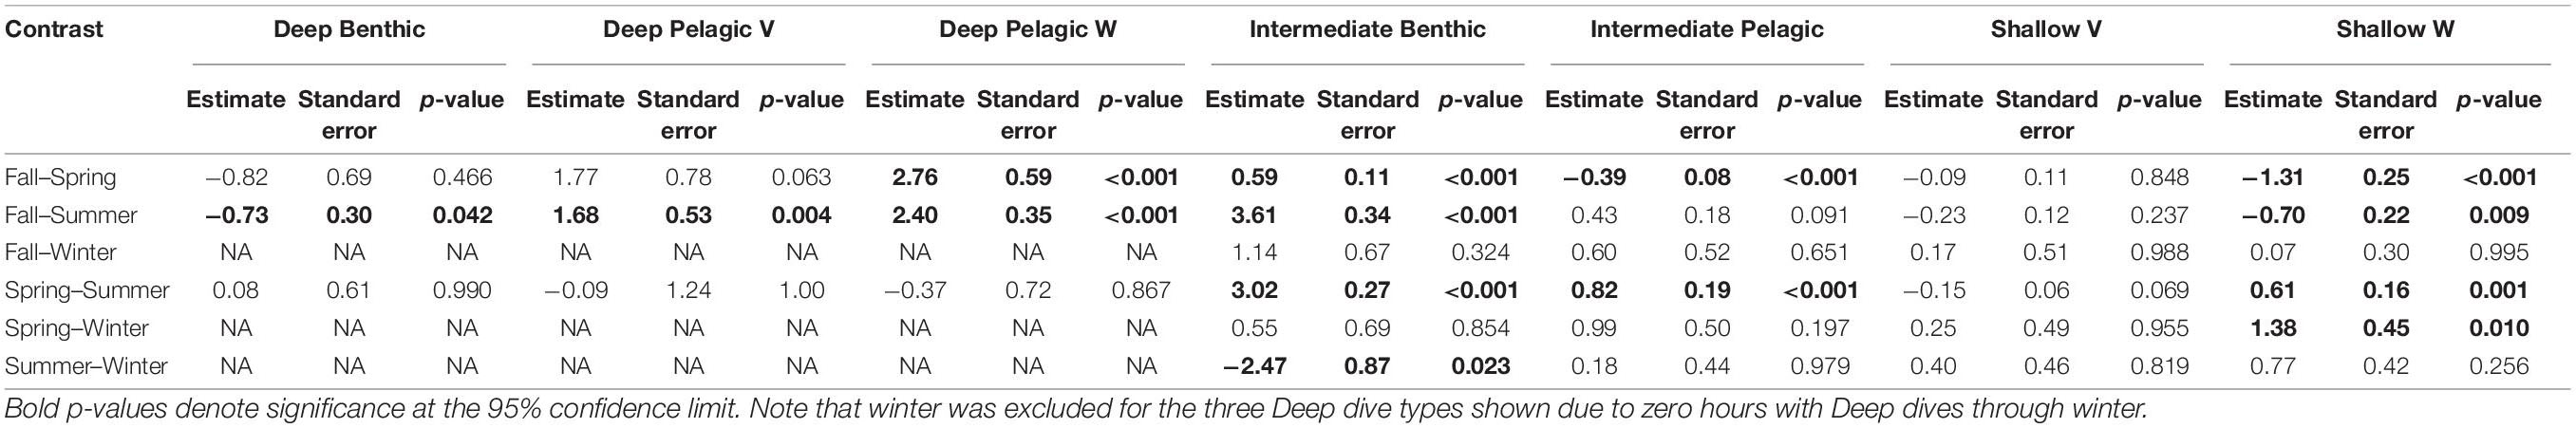
Table 3. Results of the Tukey tests comparing zero-inflated negative-binomial generalized mixed effects modeled differences in hourly frequency of each dive type as a function of season, with individual beluga included as a random effect.
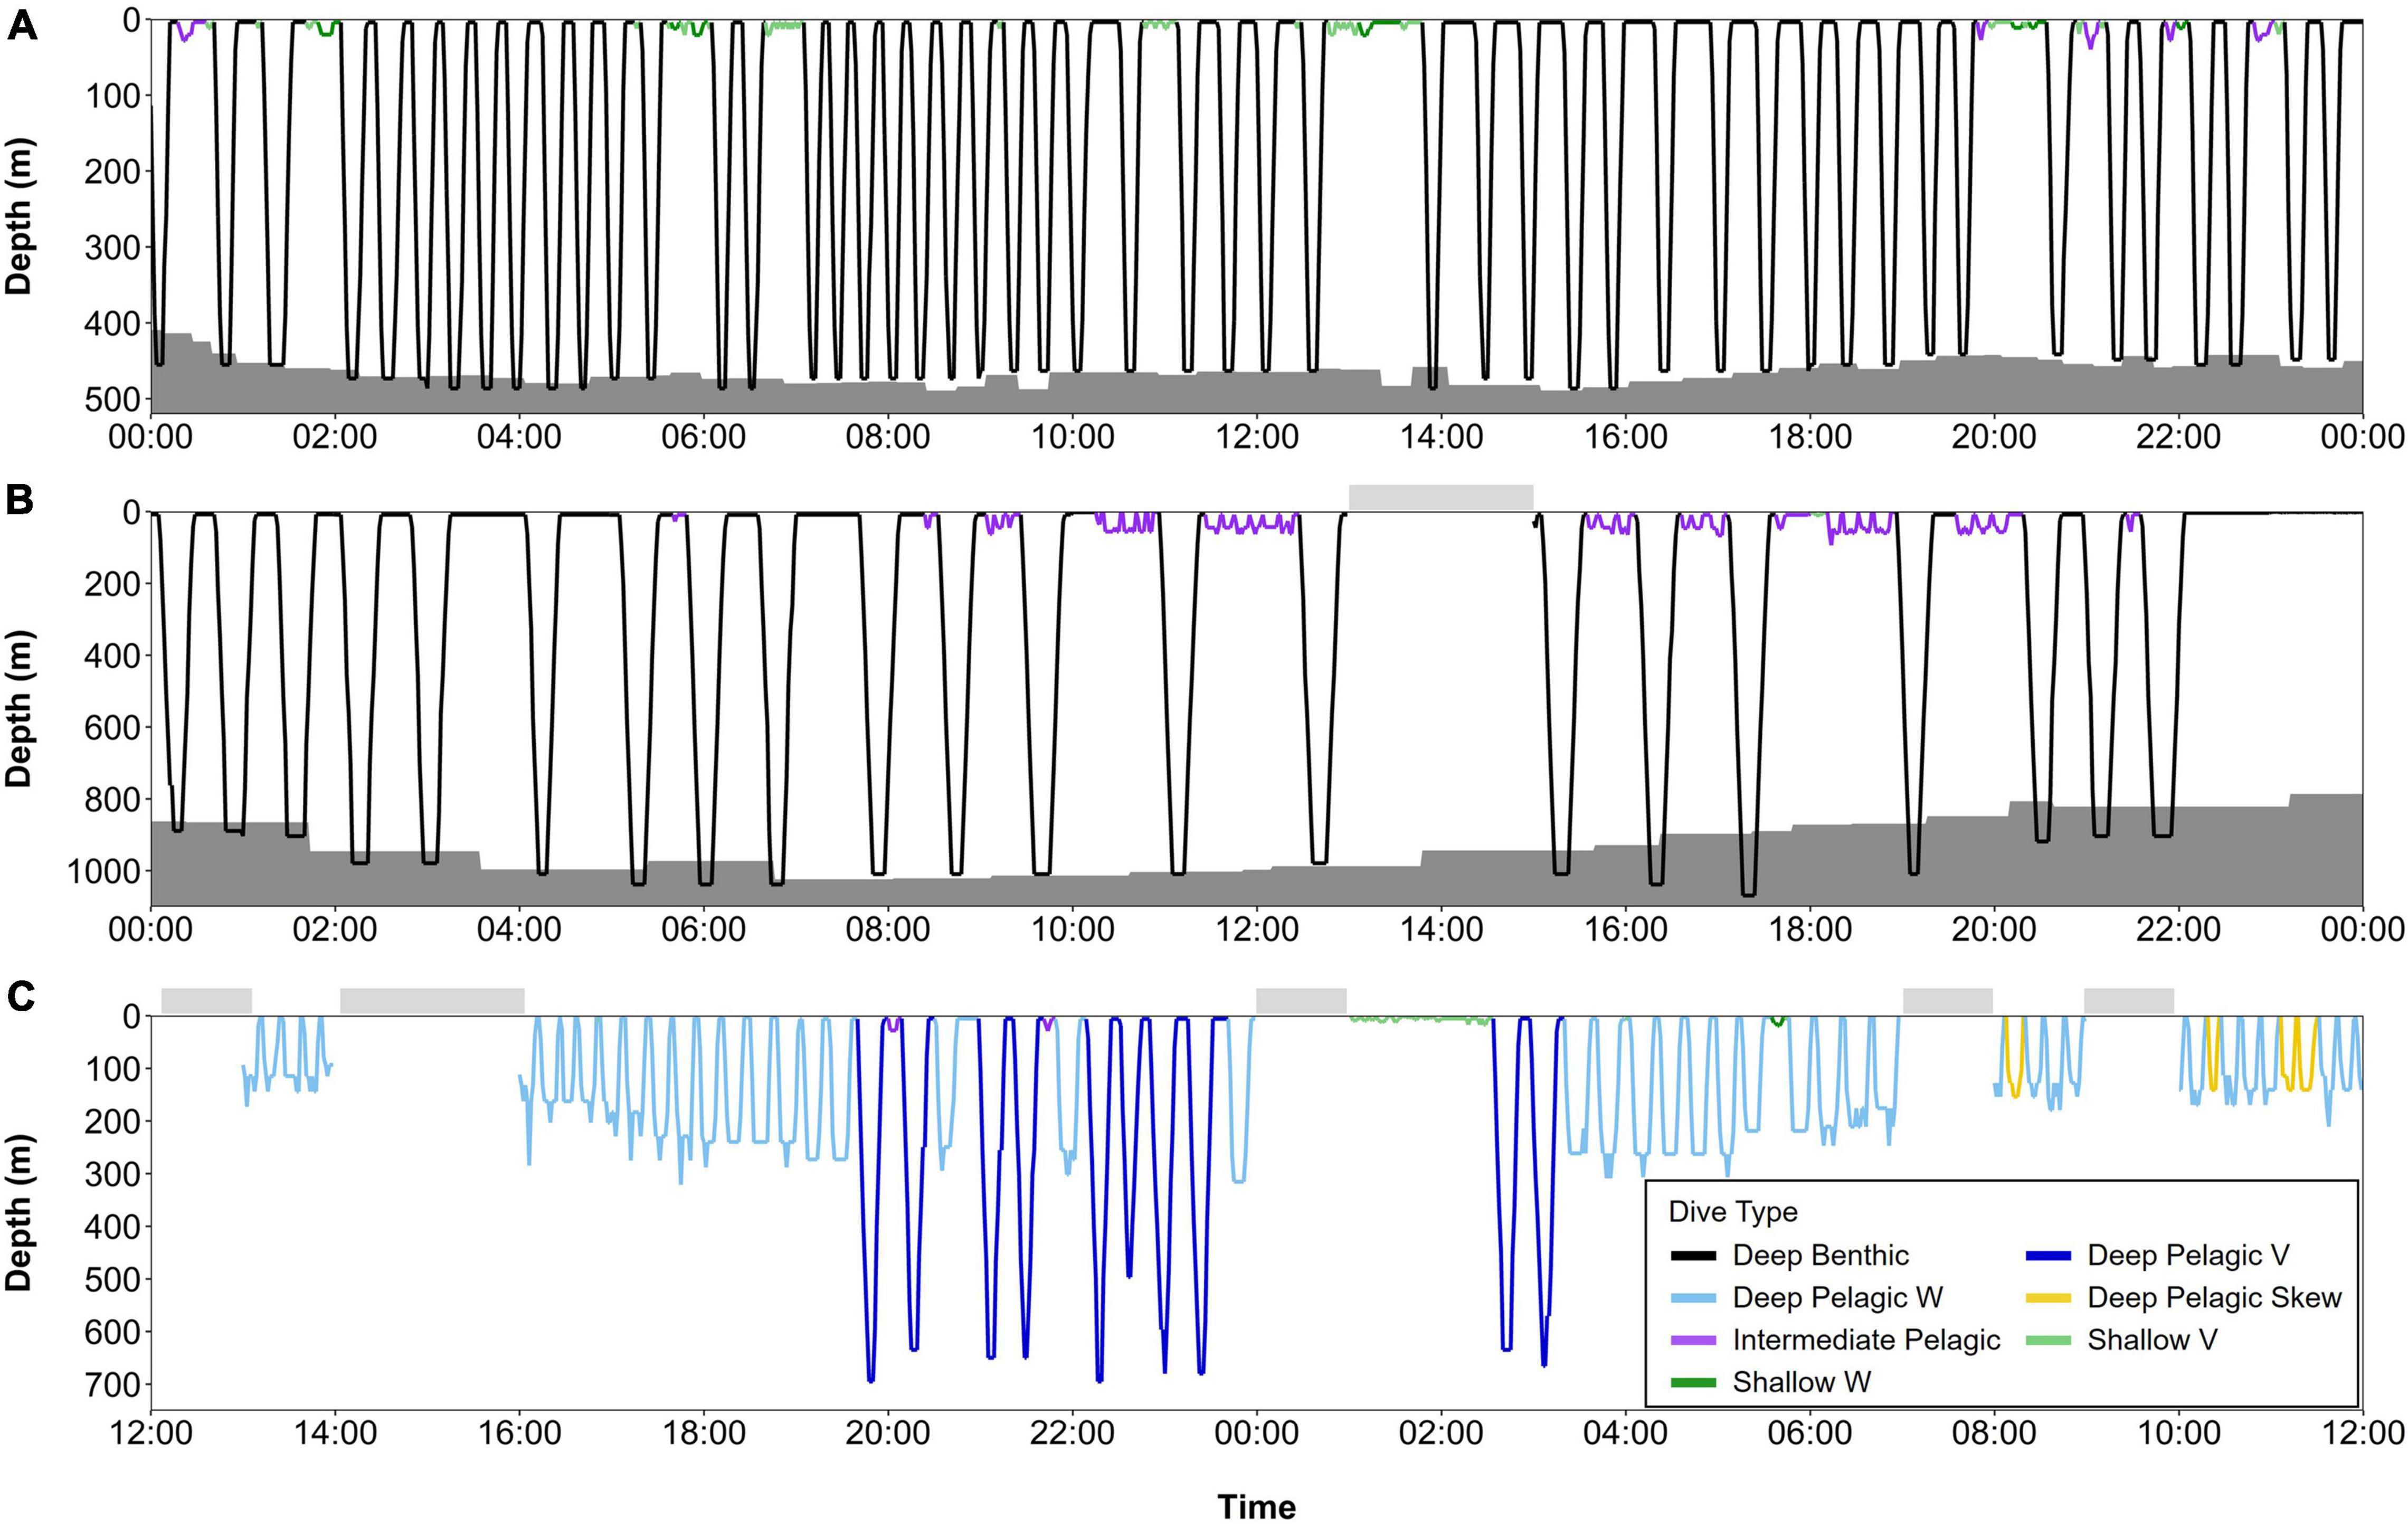
Figure 9. Series of dives over 24-h periods from summer and early fall, color-coded by dive type: (A) beluga LC2018#1 on 23rd July 2018 (74.30°N, 110.68°W, Viscount Melville Sound), (B) beluga LC2018#6 on 18th June 2019 (70.55°N, 137.81°W, Beaufort slope), and (C) beluga LC2018#3 on 27th September 2018 (77.10°N, 178.12°W, Mendeleev Ridge). Gray shaded areas denote seafloor depth; dive depth sometimes exceeds the estimated seafloor depth due to error in the bathymetric maps, CTCRW-modeled locations, and dive depth. Horizontal bars above each plot denote periods with missing data. All times in UTC. Note the different y-axes scales. Locations of dive profiles shown in Figure 1.
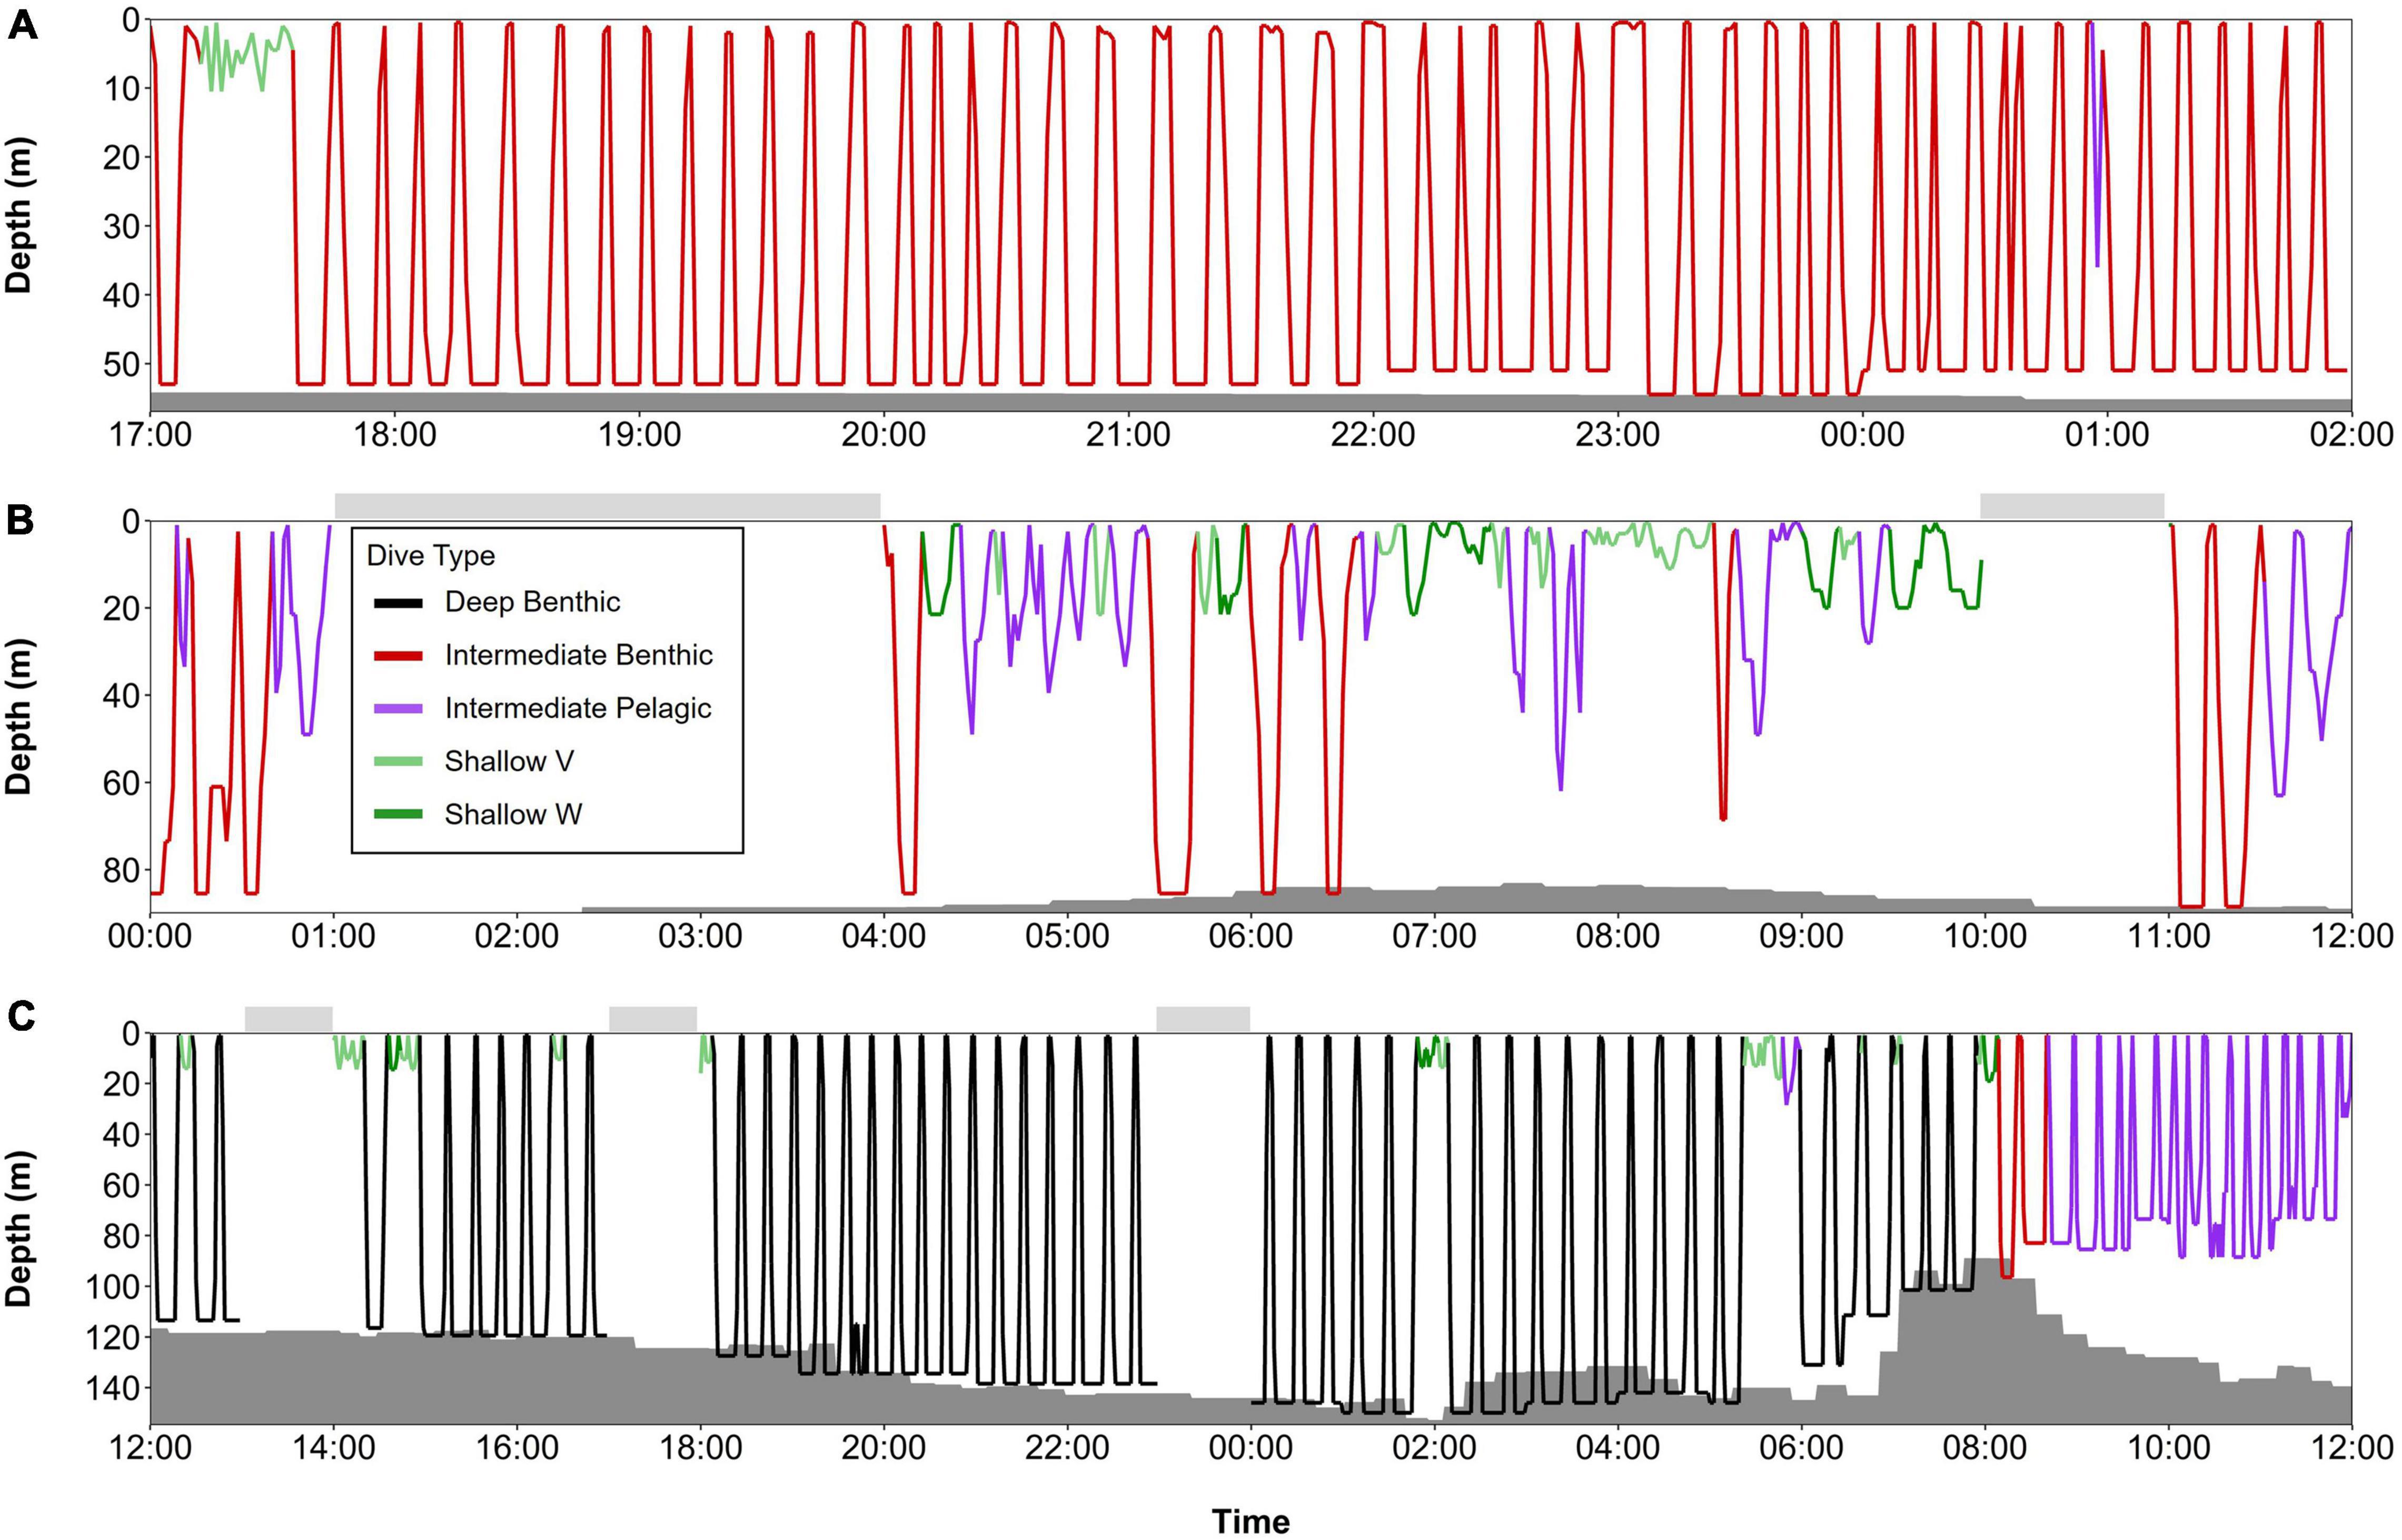
Figure 10. Series of dives from late fall and spring, color-coded by dive type: (A) beluga LC2018#3 on 17th November 2018 (68.94°N, 171.82°W, Chukchi Sea) over a 9-h period, (B) beluga LC2018#6 on 21st March 2019 (63.48°N, 176.50°W, Bering Sea) over a 12-h period, and (C) beluga LC2018#2 on 17th May 2019 (71.48°N, 157.16°W, Barrow Canyon) over a 24-h period. Gray shaded areas denote seafloor depth; dive depth sometimes exceeds the estimated seafloor depth due to error in the bathymetric maps, CTCRW-modeled locations, and dive depth. Horizontal bars above each plot denote periods with missing data. All times in UTC. Note the different x and y axes scales used due to missing data in surrounding hours and/or to improve visualization of dive structure. Locations of dive profiles shown in Figure 1.
Discussion
Time series depth data from satellite-linked and pop-up archival tags revealed that EBS male belugas employ diverse dive profiles; with differing time spent at various depths, descent and ascent rates, vertical movements during the bottom phases of dives, and post-dive behavior to exploit the three-dimensional habitat they occupy over an annual cycle. Belugas notably altered their dive behavior depending on seafloor depth, sea ice concentration, and season; accepting that the sample size was small for winter and spring. Here we develop hypotheses for the potential functions of dive types when considering physiological constraints and optimal foraging theory (summarized in Table 2). Future targeted work using ancillary data on animal acoustics and acceleration can be used to test these hypotheses. Seasonal dive behavior is discussed in relation to prey distribution, and provides evidence of year-round foraging, but with strategies varying by season. The dive characteristics and seasonal frequency of dive types classified here will be key for establishing baselines to determine ongoing impacts of climate change and human-induced disturbance on EBS beluga whales; including bioenergetics and regional impact assessments.
Dive Structure and Potential Function in Eastern Beaufort Sea Belugas
Foraging Dives
In marine mammals, deep dives with rapid descent rates such as the Deep Benthic, Deep Pelagic V, Deep Pelagic W, and Intermediate Benthic dives classified here, are primarily associated with foraging (e.g., Lefebvre et al., 2018; Barlow et al., 2020). Deep diving is energetically costly, and optimal foraging theory predicts that as distance required to capture and consume prey increases, diving predators should optimize the time spent in the foraging patch (Mori, 1998), which has been validated with ancillary data in seals (Thums et al., 2013; Viviant et al., 2014) and baleen whales (Doniol-Valcroze et al., 2011; Friedlaender et al., 2020). This suggests these dives exhibited by beluga whales are most likely related to foraging behavior. Alternate explanations for deep diving include predator avoidance or anthropogenic disturbance (Miller et al., 2015; Aguilar de Soto et al., 2020). Killer whales (Orcinus orca), represent the only fully aquatic predator of EBS belugas and are present in the Bering and Chukchi Seas (Seger and Miksis-Olds, 2020), and infrequently in the Beaufort Sea (Higdon et al., 2013); while vessel traffic is increasing over much of the EBS beluga’s range (Dawson et al., 2018). Belugas may change their surface movement patterns and vocalizations in response to killer whales and vessels (Westdal et al., 2016; Erbe et al., 2019; Seger and Miksis-Olds, 2020), however, a deep diving response is yet to be observed.
The aerobic dive limit (ADL) of adult belugas with a high body condition index is estimated at 17.4 min (Choy et al., 2019), which is close to the average dive durations of the two deepest dive classes reported here (Deep Benthic = 16.25 min and Deep Pelagic V = 17.25 min, Table 2). Deep Pelagic W dives were instead shorter than the belugas’ ADL on average, and rarely exceeded this limit (median duration = 13.75 min, see Table 2). These long dive durations (maximum = 32.5 ± 1.25 min, and see Table 2) indicate that EBS belugas sometimes exceed their ADL, a finding previously reported for belugas in the eastern Canadian Arctic (Martin and Smith, 1999). There is uncertainty as to how some species may continuously exceed their ADL, however, ADL is variable and depends on how oxygen stores are used during a dive (Kooyman et al., 2021). Conservation of energy in repetitive deep diving (e.g., Figure 9), may be facilitated by a decrease in animal buoyancy with depth (Aoki et al., 2017), or use of slower movements or stroke and glide motions as observed in other marine mammals (Costa, 1991; Williams, 2001; Arranz et al., 2019). Feeding kinematics may also vary between dive types; belugas can undertake both ram and suction feeding, with the latter likely to play a more important role during benthic dives (Kane and Marshall, 2009). Such a strategy could require a lower metabolic rate than ram feeding, and enable conservation of oxygen stores for longer dives.
Differences between the time-depth structures of the dive types agree with time allocation models (Houston and Carbone, 1992). As the vertical distance to and from a foraging patch increases, the time spent in the foraging patch should increase up to a point, and then decrease when the travel duration becomes large. This supports the longer bottom phase of the Deep Pelagic W dive type than the shallower dive types; and the shorter bottom phases of Deep Benthic and Deep Pelagic V dive types relative to Deep Pelagic W dives. Vertical movements during the bottom phases of Deep Pelagic W dives could represent searching or pursuit of prey, as has been suggested in other studies on belugas and narwhals (Martin et al., 1994, 1998). Despite possible lowering of the ADL due to the increased diving metabolic rate associated with pursuing prey (Thums et al., 2013), these dives were followed by short post-dive surface intervals (median = 2.00 min, and see Figure 9C), suggesting that belugas were diving well within their ADL for this dive type. Conversely, the Deep Benthic and Deep Pelagic V dive types typically did not include vertical movements during the bottom phase. This may suggest that prey biomass outweighs the energetic costs of making these two deep dive types, which frequently exceeded the ADL of 17.4 min (Choy et al., 2017), and were associated with the longest post-dive surface intervals among all dive types (3.75 and 5.00 min, respectively, Table 2). We suggest that these dives involved feeding on prey which is aggregated at a consistent depth and/or of higher quality than for shallower dive types. Deep Benthic dives are comparable to “square” shaped dives previously identified for EBS belugas (Richard et al., 1997), and those from the Eastern High Arctic (Martin et al., 1998), which were also proposed as benthic foraging dives. Deep dives with a distinct V-shape (short bottom duration), comparable to Deep Pelagic V dives here, have instead been proposed as exploratory or aborted dives (Martin et al., 1998). In shallow dives there may be a net energetic benefit for an animal to prematurely return to the surface before reaching its ADL if no prey is encountered early in the dive (Thompson and Fedak, 2001). For deeper dives, however, the physiological benefit of prematurely returning to the surface is reduced (Jouma’a et al., 2016), hence we propose that the Deep Pelagic V dive type represents a pelagic foraging dive with a bottom phase constrained by depth and beluga physiology. Alternatively, bottom phase duration may be shortened due to recent ingestion of prey (Favilla and Costa, 2020); beluga stomach temperature may drop by 22.3°C after an ingestion event (Gallagher et al., 2021), and diversion of blood to the stomach to facilitate digestion may result in a return to the surface before ADL is reached (Thompson and Fedak, 2001), or a decrease in their ADL for subsequent foraging due to the metabolism required for digestion (Rosen et al., 2007). A short bottom phase duration can also indicate foraging in higher quality prey patches (Thums et al., 2013). During Deep Pelagic dives it is possible that belugas use the descent and ascent phases, as well as vertical movements during the bottom phase of the dive to search for and forage on prey, similar to other odontocetes which target prey in the deep scattering layer (Arranz et al., 2011; Guerra et al., 2017). The relatively long bottom durations and fast descent rate of Intermediate Benthic dives supports their primary function in foraging and are comparable to Square-W and Square-U shaped dives identified in Lefebvre et al. (2018). By diving well within their ADL (Choy et al., 2019), belugas required shorter recovery times after making these dives than for deeper dives suggesting they can spend more time at the foraging depth (Figure 10A).
The potential for the use of some Shallow V, Shallow W, and Intermediate Pelagic dives in foraging or other behaviors cannot be discounted; a number of beluga populations undertake shallow foraging (Martin et al., 2001; Goetz et al., 2012; Lefebvre et al., 2018), and recently, a presumed consumption of a tagged Dolly Varden (Salvelinus malma) at 12.5 m depth north of Shingle Point, Yukon, was attributed to a beluga from the EBS population (Gallagher et al., 2021). The time-depth structures of these dives suggest foraging is not their primary function, however, future work using higher resolution depth data and ancillary data on animal acoustics or acceleration is required to confirm this.
Transiting and Recovery Dives
Dives represented by the Shallow V type are often regarded as transiting or recovery type dives (Lefebvre et al., 2018; Vacquié-Garcia et al., 2019), which is supported here by the slow rates of vertical movement, shallow depths, and the high frequency of occurrence of this dive type throughout the year (Figure 8). Furthermore, EBS belugas spent less time at the surface after Deep Benthic or Deep Pelagic V dives when followed by a Shallow V dive (Supplementary Table 3b), which could represent recovery, or digestion of prey after foraging. Short, shallow dives following deeper dives can facilitate increased uptake of oxygen and removal of carbon dioxide and other by-products of anaerobic respiration (Castellini et al., 1988; Fahlman et al., 2007), and at depths shallower than 30 m, may reduce blood and tissue supersaturation of nitrogen to limit the risk of decompression sickness (Hooker et al., 2009; Fahlman et al., 2021). Shallow W dives, also characterized by slow rates of vertical movement, could represent a similar function, but possibly with a foraging component during a prolonged bottom phase. Calculations indicate that forces exerted by surface wave drag are important when an animal is within three body depths of the surface (Hertel, 1966; Williams, 2001), corresponding to around 3 m for belugas. Due to the sampling frequency and the 5 m dive threshold used, shallow dives and subsurface swimming were underestimated, however, it is possible that some Shallow W dives represent optimal transiting under turbulent surface conditions in this region (Nose et al., 2018). For the St. Lawrence Estuary belugas, which inhabit shallower regions than EBS belugas, Lefebvre et al. (2018) identified a v-Deep dive type, with equivalent depth and relative bottom duration as Intermediate Pelagic dives. The authors suggested that the relatively short bottom duration and rapid descent rate of these dives represented searching the water column for prey patches. Such behavior may be represented by some of the Intermediate Pelagic dives here, however, the much slower average rate of descent in this study compared to Lefebvre et al. (2018) (0.21 vs. 0.87 m/s), provides support for their use in recovery or transiting. Alternatively, Intermediate Pelagic dives could represent some social function, as suggested for the comparable “state 1” dives in short-finned pilot whales (Globicephala macrorhynchus) (Quick et al., 2017).
Diving to Navigate Sea Ice
Both Shallow W and Intermediate Pelagic type dives occurred more frequently in regions with greater ice concentrations, and Shallow W dives occurred more frequently in spring when EBS belugas migrate into the Beaufort Sea through leads in the sea ice (Hornby et al., 2016). EBS belugas encounter dense sea ice over much of their range, including closed sea ice during summer in Viscount Melville Sound (Barber et al., 2001; Loseto et al., 2006), implying that they must undertake some subsurface activity to locate breathing holes. Richard et al. (1997) suggested that V-shaped dives reaching 700–900 m could be used in locating breathing holes in ice-covered regions, as they were only made in deep waters of the Arctic Basin with heavy ice cover; however, the energetic costs and often long recovery times associated with reaching such depths raise questions on whether this is their primary function, and we instead propose that belugas use the shallower dive types to locate breathing holes.
Drift Dives
The Deep Pelagic Skew dive was the only dive characterized by having unequal phases of descent and ascent to and from the bottom phase, and was the least frequently recorded dive type. Skewed dives have been commonly identified as drift dives in pinnipeds, whereby the animal’s buoyancy assists in travel efficiency and may enable partitioning of metabolism toward digestion (Crocker et al., 1997; Arce et al., 2019). Such dives have been identified less frequently in cetaceans, but have been proposed as energetically efficient drift dives (Simon et al., 2009), or exploratory dives with an active searching or foraging component (Lefebvre et al., 2018). Dives with unequal descent and ascent rates were present in other dive types (see Supplementary Figures 2h–o and Table 2), but were not classified into skewed types as the ascent/descent and descent/ascent metrics had weaker loadings with the first two principal components than the other metrics (Supplementary Tables 2g–k). EBS belugas undergo seasonal changes in blubber thickness (Harwood et al., 2014), which would support the potential use of drift diving. Such behaviors were likely underrepresented in this study and future work should examine changes in rates of vertical movement during the descent and ascent phases (Arce et al., 2019) to identify whether this is an important component of beluga behavior.
Seasonal Variation in Dive Behavior
Summer
Areas within the western Arctic Archipelago including the deep trench within Viscount Melville Sound, the M’Clure Strait, and Amundsen Gulf; as well as the Beaufort Slope, have previously been identified as hotspots for the EBS beluga population from mid to late summer (Loseto et al., 2006; Hauser et al., 2014). In the current study, deep dives in these regions were almost exclusively benthic, with dives averaging 16.25 min and frequently reaching depths over 400 m (Figures 3, 9A). These results contrast those of Hauser et al. (2015), where maximum dive durations recorded in the Beaufort Sea and Amundsen Gulf were typically 6–9 min, and targeted the mid-water column at depths of 200–300 m. This may be a result of sex differences; three of the four tagged EBS belugas examined in Hauser et al. (2015) were females. EBS belugas are known to segregate by sex and age classes during late summer, with females using shallower open water habitat, and large males using deeper ice-covered habitat (Loseto et al., 2006). Mature males are larger than females, and differential habitat use may support distinct foraging strategies and dietary composition among age and sex classes (Loseto et al., 2006, 2008). In sexually dimorphic marine mammals, larger individuals often have a greater physiological capacity to dive for longer and to greater depths which may enable targeting of prey patches which are of higher quality or greater density (Michaud, 2005; Newland et al., 2009). Adult male belugas from the EBS population are thought to rely more on large offshore Arctic cod (Boreogadus saida) during summer than females and younger males (Loseto et al., 2009; Choy et al., 2020), which is found in high abundance and dominates the demersal fish assemblage during summer along the Canadian Beaufort slope and in Viscount Melville Sound (Majewski et al., 2013, 2017; Bouchard et al., 2018). In the Amundsen Gulf, deep aggregations of Arctic cod may disperse by summer (Geoffroy et al., 2011), however, their abundance was highest near the sea floor during surveys conducted in 2018 and 2019 (Andrew Majewski, Fisheries and Oceans Canada, unpublished data). Arctic cod have been identified down to 1,000 m along the Beaufort Slope and remain near the seafloor from February to September (Geoffroy et al., 2016; Majewski et al., 2016), which could explain the benthic dives made by EBS belugas in May and June (Figures 3, 6, 9B). Inuvialuit hunters report that belugas harvested during summer sink, whereas those harvested during fall float due to their thicker blubber and the higher salinity of the water (Dennis Arey, Aklavik, personal communication). Together, this suggests that deep foraging close to the seafloor during summer could be critical for male belugas to rebuild their blubber layer after the spring migration and summer estuarine molting periods. The prevalence of Arctic cod in the summer diet of EBS male belugas and the overlap between beluga dive depth and the vertical distribution of Arctic cod identify that belugas were primarily targeting this species. Other fish species found in this region including Greenland halibut (Reinhardtius hippoglossoides), capelin (Mallotus villosus), and Canadian eelpout (Lycodes polaris) (Majewski et al., 2017) contribute to the male beluga diet (Choy et al., 2020), and are likely targeted when there is a lower abundance of Arctic cod. The observation of a small number of Deep Pelagic V dives in summer (Figures 3, 8) could be linked to EBS belugas targeting fronts or stratified layers as noted for the Eastern Chukchi Sea beluga population (Citta et al., 2020). However, the principal use of Deep Benthic dives indicates that feeding close to benthos, including at depths ≥1,000 m, is more important for EBS belugas. While belugas are known to undertake other behaviors in shallow coastal regions during the summer, including molting (at 2–4 m depth; Smith et al., 1992; Whalen et al., 2020), the depth sampling frequency and dive threshold used here would have underrepresented this behavior.
Early Fall
Eastern Beaufort Sea belugas occupied diverse bathymetric habitats during fall, from deep waters of the Arctic Basin to the shallow Chukchi Sea, explaining large variation in dive behavior observed during this period (Figures 4, 8). Benthic diving to >800 m along the Beaufort, Chukchi, and East Siberian slopes (Figure 4) could represent feeding on Greenland halibut, which is found in greatest abundance at seafloor depths ≥500 m (Majewski et al., 2017), when Arctic cod in the Beaufort Sea redistribute into the mesopelagic layer in fall (Geoffroy et al., 2016; Pettitt-Wade et al., 2021). EBS belugas principally made two deep dive types in the Arctic Basin: deeper Deep Pelagic V and shallower Deep Pelagic W dives (Figures 8, 9C), suggesting that two different depth layers were targeted at ∼100–300 m and >500 m (Table 2). Whilst Hauser et al. (2015) did not observe such behavior in EBS belugas; the Eastern Chukchi Sea population recorded a higher proportion of modal depths in the 100–200 m and >400 m depth bins than in the 50–100 or 300–400 m depth bins, suggestive of similar behaviors. The diet of EBS belugas during this period is not well-known as dietary studies have only been undertaken during spring and summer (Quakenbush et al., 2015; Loseto et al., 2018; Choy et al., 2020). There is also a paucity of information on the distribution and assemblage of fishes in the Central Arctic Ocean, although Arctic cod are known to inhabit the region (Snoeijs-Leijonmalm et al., 2020). The greater energetic costs associated with Deep Pelagic V dives could require a higher biomass of prey to be targeted than in the Deep Pelagic W dives, suggesting vertical segregation among prey species, or among size classes within a prey species (e.g., Geoffroy et al., 2016). Alternatively, prey may undertake diel vertical migrations leading to the formation of aggregations at certain times of day whereby belugas would benefit from switching between the depth layers targeted to optimize food intake. This strategy has previously been observed in other cetaceans (Friedlaender et al., 2015; Arranz et al., 2019). Further studies are needed on diel patterns in dive behavior in EBS belugas, and on the assemblage and distribution of prey in the region.
Late Fall Through Spring
From late-fall to mid-spring, the advance of fast ice limits the EBS beluga distribution to the Chukchi, then the Bering Sea (Hauser et al., 2017a; Supplementary Figure 3b). Belugas made Intermediate Benthic dives with great frequency (Figure 8), suggesting that foraging occurs throughout this period. The durations of these dives were well within the ADL of belugas (Choy et al., 2019), precluding the need to rest for long periods on the surface and enabling belugas to dive frequently (Figure 10A). This could enable belugas to be less selective over prey consumed than on deeper dives made in summer and early fall. The northern Bering and southern Chukchi Seas contain a large and diverse benthic biomass (Grebmeier et al., 2018), and the large number of invertebrate and fish taxa, including greater prevalence of octopus and shrimp than Arctic cod identified in the stomachs of EBS belugas harvested during their spring migration (Quakenbush et al., 2015), support a more generalist feeding strategy in this region than in the Beaufort Sea during summer. Moreover, studies on other marine mammals have shown that a higher number of dives per unit time may be indicative of lower foraging success, or feeding on lower quality prey (Viviant et al., 2014), hence extensive use of lower quality prey cannot be ruled out. Energetic gains may still be substantial during this time due to the lower costs of shallower foraging, with implications for the timing of migration toward deeper summer habitats which may be more energetically costly, but more nutritious. Future work is required to analyze horizontal and vertical movement data in relation to environmental covariates to address this question.
Eastern Beaufort Sea belugas typically mate during winter and spring (Suydam, 2009), and likely in the Bering Sea. Beluga socio-sexual behaviors have been observed at the surface (Lomac-Macnair et al., 2015), and sexual dimorphism in this species suggests male-male competition occurs (Kelley et al., 2015). Reproductive behaviors, however, have only been characterized in captive animals (Hill et al., 2015), and are not well-documented in wild belugas. The increase in frequency of Intermediate Pelagic dives in March (Figures 8, 10B) indicates a distinct change in behavior at this time. Belugas are highly social, forming multi-scale societies with related and un-related individuals of different ages and sexes (O’Corry-Crowe et al., 2020), and have the capacity to produce social calls at depths up to 300 m (Ridgway et al., 2001). As such, the possibility that certain dive types represent social behaviors in belugas cannot be excluded. The observed increase in Intermediate Pelagic dives could alternatively suggest a seasonal shift toward more pelagic feeding on fish ascending to shallower depths after the ice-edge break up and increase in surface productivity (Geoffroy et al., 2011; Supplementary Figure 3b). Barrow Canyon is an important summer habitat for the Eastern Chukchi Sea beluga population, where they tend to make pelagic dives targeting fronts and stratified layers (Stafford et al., 2018; Citta et al., 2020), however, the three EBS belugas which transmitted through spring all passed via this region and principally made benthic dives (Figures 6, 10C), implying important benthic foraging grounds for EBS belugas during their northward migration. It should be noted that few belugas transmitted during late winter and spring (n = 3), hence there may be more variability in the population than was represented by these individuals.
Conclusion
Understanding the vertical movement behavior of marine mammals, especially those inhabiting the extremes of the Arctic environment is key for establishing baselines on the energetic costs and gains of specific behaviors, and for determining ongoing impacts of climate change and human-induced disturbance. We provide the first comprehensive analysis of the time-depth structures of dives for any beluga population throughout an annual cycle and across their entire range, and present hypotheses on dive functions. Despite undertaking long migrations and having seasonal distributions constrained by sea ice, EBS male belugas exhibit dive characteristics which suggest year-round foraging with the strategies used dependent on region and season. Likely foraging dives in the Chukchi Sea and Bering Sea from late fall through winter were shallow (∼50 m), were within the calculated aerobic dive limit and required short recovery times between dives, suggesting they are energetically cheap. In contrast, dives from late spring through early fall along the Beaufort slope, Arctic Archipelago and Arctic Basin regions were deeper and longer, often exceeding the aerobic dive limit. Diving during this period is likely more energetically costly, but diet and prey distribution data suggest they may provide high energetic gains due to the prevalence of Arctic cod in the diet during summer compared to a more generalist diet during early spring. Male belugas primarily targeted the seafloor for foraging in all regions except the Arctic Basin; where they undertook two deep pelagic dive types, potentially to optimize targeting of prey which is vertically segregated by species or size class, or undertakes diel vertical migrations. The high frequency of shallow V-shaped dives in all regions and seasons, as well as the shorter recovery times associated with deeper dive types if they were followed by this dive type supports their use in recovery and transiting. Two dive types (Shallow W and Intermediate Pelagic) were made more frequently in regions with higher ice concentrations, suggesting their use in navigating through sea ice. Future studies can now focus in certain regions and incorporate targeted ancillary data on acoustics, video, and/or acceleration to advance our understanding of EBS beluga dive functions.
The variable dive strategies observed in male EBS belugas and their potential for targeting different prey types and/or prey occurrence at different depth zones support flexibility within this population. The lack of historically comparable data limits interpretation related to climate change impacts or effects, however, these dive types provide a baseline to monitor changes in beluga dive behavior over time, and a foundation for bioenergetics modeling to examine the costs and gains of dive behavior.
Data Availability Statement
The datasets presented in this article are available upon reasonable request. Requests should be directed to LL (TGlzYS5Mb3NldG9AZGZvLW1wby5nYy5jYQ==) and will be reviewed by the Inuvialuit Game Council and Fisheries and Oceans Canada.
Ethics Statement
The following approvals were required for whale capture and handling procedures: DFO License to Fish for Scientific Purposes (S-18/19-3020-YK and S-19/20-3020-YK), Freshwater Institute Animal Care Committee permit (FWI-ACC-2018-24 and FWI-ACC-2019-29), and Letter(s) of Support from Inuvialuit Hunters and Trappers Committees.
Author Contributions
LS performed all data analyses, wrote the manuscript, and created all figures and tables. LL and SM led on program implementation and secured the funding and partnerships. LS, LL, NH, SM, and GO’C-C conceptualized the study and collected the data. LL, NH, SM, and GO’C-C planned the field programs. LL and NH were involved in critical discussions of the manuscript with LS throughout the process. LL, NH, SM, GO’C-C, JI, and DB supported early discussions with LS regarding objectives and methods, and revised the manuscript. AN developed and adapted the divebomb package. All authors approved the final submitted version.
Funding
Funding was provided by the Crown-Indigenous Relations and Northern Affairs Canada (Beaufort Regional Strategic Environmental Assessment), the Fisheries and Oceans Canada (Intergovernmental Strategy, Strategic Program for Ecosystem-based Research and Advice, National Conservation Plan), the Fisheries Joint Management Committee (Tarium Niryuitait Marine Protected Area Funds, Anguniaqvia niqiqyuam Marine Protected Area Funds, FJMC Core Funds), and the Natural Resources Canada (Polar Continental Shelf Program).
Conflict of Interest
The authors declare that the research was conducted in the absence of any commercial or financial relationships that could be construed as a potential conflict of interest.
Publisher’s Note
All claims expressed in this article are solely those of the authors and do not necessarily represent those of their affiliated organizations, or those of the publisher, the editors and the reviewers. Any product that may be evaluated in this article, or claim that may be made by its manufacturer, is not guaranteed or endorsed by the publisher.
Acknowledgments
We acknowledge our partners, the Inuvialuit Game Council and Fisheries Joint Management Committee for their work in supporting the EBS beluga tagging program, as well as members of the Tagging Advisory Group. Special thanks to members of the field crew for their work in data collection, advice on project delivery, and discussions on beluga ecology: John Noksana Sr., Joseph Felix Jr., Raymond Ettagiak, James Pokiak, and Mikkel Panaktalok (Tuktoyaktuk), Lawrence Kaglik and Linley Day (Inuvik), Dennis Arey and Dwayne Benoit (Aklavik), Patrick Akhiatak (Ulukhaktok), Norman Anikina (Sachs Harbour), Émilie Couture and Benjamin Lamglait (Granby Zoo/Canadian Wildlife Health Cooperative), Greg Elias (Aurora Research Institute), and Jeremy Hansen (Fisheries and Oceans Canada, Inuvik). Thank you to Laura Murray (Fisheries and Oceans Canada), Emily Way-Nee (Joint Secretariat), Jimmy Kalinek (Only Way Outfitting), and James Keevik for key logistical support. Ph.D. stipend for LS was provided by ArcticNet and the University of Manitoba Graduate Fellowship. We thank the two reviewers for their extensive feedback that improved the manuscript.
Supplementary Material
The Supplementary Material for this article can be found online at: https://www.frontiersin.org/articles/10.3389/fmars.2021.715412/full#supplementary-material
References
Aguilar de Soto, N., Visser, F., Tyack, P. L., Alcazar, J., Ruxton, G., Arranz, P., et al. (2020). Fear of killer whales drives extreme synchrony in deep diving beaked whales. Sci. Rep. 10:13.
Anderson, P. A., Poe, R. B., Thompson, L. A., Weber, N., and Romano, T. A. (2017). Behavioural responses of beluga whales (Delphinapterus leucas) to environmental variation in an Arctic estuary. Behav. Process. 145, 48–59. doi: 10.1038/s41598-019-55911-3
Aoki, K., Sato, K., Isojunno, S., Narazaki, T., and Miller, P. J. O. (2017). High diving metabolic rate indicated by high-speed transit to depth in negatively buoyant long-finned pilot whales. J. Exp. Biol. 220, 3802–3811. doi: 10.1016/j.beproc.2017.09.007
Arce, F., Bestley, S., Hindell, M. A., McMahon, C. R., and Wotherspoon, S. (2019). A quantitative, hierarchical approach for detecting drift dives and tracking buoyancy changes in southern elephant seals. Sci. Rep. 9:8936. doi: 10.1242/jeb.158287
Arranz, P., Aquilar de Soto, N., Madsen, P. T., Brito, A., Bordes, F., and Johnson, M. P. (2011). Following a foraging fish-finder: diel habitat use of Blainville’s beaked whales revealed by echolocation. PLoS One 6:e28353. doi: 10.1371/journal.pone.0028353
Arranz, P., Benoit-Bird, K. J., Friedlaender, A. S., Hazen, E. L., Goldbogen, J. A., Stimpert, A. K., et al. (2019). Diving behaviour and fine-scale kinematics of free-ranging Risso’s dolphins foraging in shallow and deep-water habitats. Front. Ecol. Evol. 7:53. doi: 10.3389/fevo.2019.00053
Baechler, J., Beck, C. A., and Bowen, W. D. (2002). Dive shapes reveal temporal changes in the foraging behaviour of different age and sex classes of harbor seals (Phoca vitulina). Can. J. Zool. 80, 1569–1577.
Barber, D. G., Saczuk, E., and Richard, P. R. (2001). Examination of beluga-habitat relationships through the use of telemetry and a geographic information system. Arctic 54, 305–316. doi: 10.14430/arctic790
Barlow, J., Schorr, G. S., Falcone, E. A., and Moretti, D. (2020). Variation in dive behaviour of Cuvier’s beaked whales with seafloor depth, time-of-day, and lunar illumination. Mar. Ecol. Prog. Ser. 644, 199–214. doi: 10.3354/meps13350
Blanchet, M.-A., Lydersen, C., Ims, R. A., and Kovacs, K. M. (2015). Seasonal, oceanographic and atmospheric drivers of diving behaviour in a temperature seal species living in the high arctic. PLoS One 10:e0132686. doi: 10.1371/journal.pone.0132686
Bouchard, C., Geoffroy, M., LeBlanc, M., and Fortier, L. (2018). Larval and adult fish assemblages along the Northwest Passage : the shallow Kitikmeot and ice-covered Parry Channel as potential barriers to dispersal. Arctic Sci. 4, 781–793. doi: 10.1139/as-2018-0003
Breton-Honeyman, K., Hammill, M. O., Furgal, C. M., and Hickie, B. (2016). Inuit Knowledge of beluga whale (Delphinapterus leucas) foraging ecology in Nunavik (Arctic Quebec), Canada. Can. J. Zool. 94, 713–726. doi: 10.1139/cjz-2015-0259
Carter, M. I. D., Bennett, K. A., Embling, C. B., Hosegood, P. J., and Russell, D. J. F. (2016). Navigating uncertain waters: a critical review of inferring foraging behaviour from location and dive data in pinnipeds. Mov. Ecol. 4:25. doi: 10.1186/s40462-016-0090-9
Castellini, M. A., Davis, R. W., and Kooyman, G. L. (1988). Blood chemistry regulation during repetitive diving in weddell seals. Physiol. Zool. 61, 379–386. doi: 10.1086/physzool.61.5.30161259
Castellote, M., Small, R. J., Lammers, M. O., Jenniges, J., Mondragon, J., Garner, C. D., et al. (2020). Seasonal distribution and foraging occurrence of Cook Inlet beluga whales based on passive acoustic monitoring. Endanger. Species Res. 41, 225–243. doi: 10.3354/esr01023
Choy, E. S., Campbell, K. L., Berenbrink, M., Roth, J. D., and Loseto, L. L. (2019). Body condition impacts blood and muscle oxygen storage capacity of free-living beluga whales (Delphinapterus leucas). J. Exp. Biol. 222:191916. doi: 10.1242/jeb.191916
Choy, E. S., Giraldo, C., Rosenburg, B., Roth, J. D., Ehrman, A. D., Majewski, A., et al. (2020). Variation in the diet of beluga whales in response to changes in prey availability: insights on changes in the Beaufort Sea ecosystem. Mar. Ecol. Prog. Ser. 647, 195–210. doi: 10.3354/meps13413
Choy, E. S., Rosenberg, B., Roth, J. D., and Loseto, L. L. (2017). Inter-annual variation in environmental factors affect the prey and body condition of beluga whales in the eastern Beaufort Sea. Mar. Ecol. Prog. Ser. 579, 213–225. doi: 10.3354/meps12256
Citta, J. J., Okkonen, S. R., Suydam, R. S., Quakenbush, L., Bryan, A. L., and Olnes, J. (2020). Beluga dive behaviour relative to fronts and stratified layers near Barrow Canyon, Alaska. Deep Sea Res. Part I Oceanogr. Res. Pap. 165:103392. doi: 10.1016/j.dsr.2020.103392
Citta, J. J., Richard, P., Lowry, L. F., O’Corry-Crowe, G., Marcoux, M., Suydam, R., et al. (2017). Satellite telemetry reveals population specific winter ranges of beluga whales in the Bering Sea. Mar. Mamm. Sci. 33, 236–250. doi: 10.1111/mms.12357
Cooke, S. J., Brownscombe, J. W., Lennox, R. J., Iverson, S. J., Whoriskey, F. G., Millspaugh, J. J., et al. (2021). A case for restoring unity between biotelemetry and biologging to enhance animal tracking research. FACETS 6, 1260–1265. doi: 10.1139/facets-2020-0112
Costa, D. P. (1991). Reproductive and foraging energetics of high latitude penguins, albatrosses and pinnipeds: implications for life history patterns. Am. Zool. 31, 111–130. doi: 10.1093/icb/31.1.111
Costa, D. P. (2007). “Diving physiology of marine vertebrates,” in Encyclopedia of Life Sciences, ed. Clavier (Hoboken, NJ: John Wiley & Sons), doi: 10.1002/9780470015902.a0004230
Crocker, D. E., Boeuf, B. J. L., and Costa, D. P. (1997). Drift diving in female northern elephant seals: Implications for Food Processing. Can. J. Zool. 75, 27–39. doi: 10.1139/z97-004
Dawson, J., Pizzolato, L., Howell, S. E. L., Copland, L., and Johnston, M. E. (2018). Temporal and spatial patterns of ship traffic in the Canadian Arctic from 1990 to 2015. Arctic 71, 15–26. doi: 10.14430/arctic4698
Doniol-Valcroze, T., Lesage, V., Giard, J., and Michaud, R. (2011). Optimal foraging theory predicts diving and feeding strategies of the largest marine predator. Behav. Ecol. 22, 880–888. doi: 10.1093/beheco/arr038
Dujon, A. M., Lindstrom, T. R., and Hays, G. C. (2014). The accuracy of Fastloc-GPS locations and implications for animal tracking. Methods Ecol. Evol. 5, 1162–1169. doi: 10.1111/2041-210X.12286
Erbe, C., Marley, S. A., Schoeman, R. P., Smith, J. N., Trigg, L. E., and Embling, C. B. (2019). The effects of ship noise on marine mammals – a review. Front. Mar. Sci. 6:606. doi: 10.3389/fmars.2019.00606
Fahlman, A., Moore, M. J., and Wells, R. S. (2021). How do marine mammals manage and usually avoid gas emboli formation and gas embolic pathology? Critical clues from studies of Wild Dolphins. Front. Mar. Sci. 8:598633. doi: 10.3389/fmars.2021.598633
Fahlman, A., Schmidt, A., Jones, D. R., Bostrom, B. L., and Handrich, Y. (2007). To what extent might N2 limit dive performance in king penguins? J. Exp. Biol. 210, 3344–3355. doi: 10.1242/jeb.008730
Favilla, A. B., and Costa, D. P. (2020). Thermoregulatory strategies of diving air-breathing marine vertebrates: a review. Front. Ecol. Evol. 8:555509. doi: 10.3389/fevo.2020.555509
Fortune, S. M. E., Koski, W. R., Higdon, J. W., Trites, A. W., Baumgartner, F., and Ferguson, S. H. (2017). Evidence of molting and the function of “rock-nosing” behavior in bowhead whales in the eastern Canadian Arctic. PLoS One 12:e0186156. doi: 10.1371/journal.pone.0186156
Freitas, C., Lydersen, C., Fedak, M. A., and Kovacs, K. M. (2008). A simple new algorithm to filter marine mammal Argos locations. Mar. Mamm. Sci. 24, 315–325. doi: 10.1111/j.1748-7692.2007.00180.x
Friedlaender, A. S., Bowers, M. T., Cade, D., Hazen, E. L., Stimpert, A. K., Allen, A. N., et al. (2020). The advantages of diving deep: Fin whales quadruple their energy intake when targeting deep krill patches. Funct. Ecol. 34, 497–506. doi: 10.1111/1365-2435.13471
Friedlaender, A. S., Goldbogen, J. A., Hazen, E. L., Calambokidis, J., and Southall, B. L. (2015). Feeding performance by sympatric blue and fin whales exploiting a common prey resource. Mar. Mamm. Sci. 31, 345–354. doi: 10.1111/mms.12134
Gallagher, C. P., Storrie, L., Courtney, M. B., Howland, K. L., Lea, E. V., Macphee, S. A., et al. (2021). Predation of Archival Tagged Dolly Varden, Salvelinus malma, Reveals Predator Avoidance Behaviour and Tracks Feeding Events by Presumed Beluga Whale, Delphinapterus leucas, in the Beaufort Sea. (Biomed central, Springer), In review.
GEBCO Bathymetric Compilation Group (2020). The GEBCO_2020 Grid – A Continuous Terrain Model of the Global Oceans and Land. Liverpool: British Oceanographic Data Centre, National Oceanography Centre, NERC, doi: 10.5285/a29c5465-b138-234d-e053-6c86abc040b9
Geoffroy, M., Majewski, A., LeBlanc, M., Gauthier, S., Walkusz, W., Reist, J. D., et al. (2016). Vertical segregation of age-0 and age-1+ polar cod (Boreogadus saida) over the annual cycle in the Canadian Beaufort Sea. Polar Biol. 39, 1023–1037. doi: 10.1007/s00300-015-1811-z
Geoffroy, M., Robert, D., Darnis, G., and Fortier, L. (2011). The aggregation of polar cod (Boreogadus saida) in the deep Atlantic layer of ice-covered Amundsen Gulf (Beaufort Sea) in winter. Polar Biol. 34, 1959–1971. doi: 10.1007/s00300-011-1019-9
Goetz, K. T., Robinson, P. W., Hobbs, R. C., Laidre, K. L., Huckstadt, L. A., and Shelden, K. E. W. (2012). Movement and Dive Behavior of Beluga Whales in Cook Inlet, Alaska. AFSC Processed Rep. 2012-03, 40. Seattle WA: Alaska Fisheries Science Center, NOAA, 98115.
Grebmeier, J. M., Frey, K. E., Cooper, L. W., and Kêdra, M. (2018). Trends in benthic macrofaunal populations, seasonal sea ice persistence, and bottom water temperatures in the Bering Strait region. Oceanography 31, 136–151. doi: 10.5670/oceanog.2018.224
Guerra, M., Hickmott, L., van der Hoop, J., Rayment, W., Leunissen, E., Slooten, E., et al. (2017). Diverse foraging strategies by a marine top predator: Sperm whales exploit pelagic and demersal habitats in the Kaikoura submarine canyon. Deep Sea Res. Part 1 Oceanogr. Res. Pap. 128, 98–108. doi: 10.1016/j.dsr.2017.08.012
Harwood, L. A., Kingsley, M. C. S., and Smith, T. G. (2014). An emerging pattern of declining growth rates in belugas of the Beaufort Sea: 1989-2008. Arctic 67, 483–492. doi: 10.14430/arctic4423
Harwood, L. A., Smith, T. G., George, J. C., Sandstrom, S. J., Walkusz, W., and Divoky, G. J. (2015). Change in the Beaufort Sea ecosystem: Diverging trends in body condition and/or production in five marine vertebrate species. Prog. Oceanogr. 136, 263–273. doi: 10.1016/j.pocean.2015.05.003
Hauser, D. D. W., Laidre, K. L., Stern, H. L., Suydam, R. S., and Richard, P. R. (2018a). Indirect effects of sea ice loss on summer-fall habitat and behaviour for sympatric populations of an Arctic marine predator. Divers. Distrib. 24, 791–799. doi: 10.1111/ddi.12722
Hauser, D. D. W., Laidre, K. L., and Stern, H. L. (2018b). Vulnerability of Arctic marine mammals to vessel traffic in the increasingly ice-free Northwest Passage and Northern Sea Route. Proc. Natl. Acad. Sci. U.S.A. 115, 7617–7622. doi: 10.1073/pnas.1803543115
Hauser, D. D. W., Laidre, K. L., Parker-Stetter, S. L., Horne, J. K., Suydam, R. S., and Richard, P. R. (2015). Regional dive behaviour of Pacific Arctic beluga whales Delphinapterus leucas and possible associations with prey. Mar. Ecol. Prog. Ser. 541, 245–264. doi: 10.3354/meps11530
Hauser, D. D. W., Laidre, K. L., Stafford, K. M., Stern, H. L., Suydam, R. S., and Richard, P. R. (2017a). Decadal shifts in autumn migration timing by Pacific Arctic beluga whales are related to delayed annual sea ice formation. Glob. Change Biol. 23, 2206–2217. doi: 10.1111/gcb.13564
Hauser, D. D. W., Laidre, K. L., Stern, H. L., Moore, S. E., Suydam, R. S., and Richard, P. R. (2017b). Habitat selection by two beluga whale populations in the Chukchi and Beaufort seas. PLoS One 12:e0172755. doi: 10.1371/journal.pone.0172755
Hauser, D. D. W., Laidre, K. L., Suydam, R. S., and Richard, P. R. (2014). Population-specific home ranges and migration timing of Pacific Arctic beluga whales (Delphinapterus leucas). Polar Biol. 37, 1171–1183. doi: 10.1007/s00300-014-1510-1
Heerah, K., Cox, S. L., Blevin, P., Guinet, C., and Charassin, J.-B. (2019). Validation of dive foraging indices using archived and transmitted acceleration data: the case of the Weddell seal. Front. Ecol. Evol. 7:30. doi: 10.3389/fevo.2019.00030
Heide-Jørgensen, M. P., Richard, P. R., and Rosing-Asvid, A. (1998). Dive patterns of belugas (Delphinapterus leucas) in Waters Near Eastern Devon Island. Arctic 51, 17–26. doi: 10.14430/arctic1041
Higdon, J. W., Byers, T., Brown (née Hartwig), L., and Ferguson, S. H. (2013). Observations of killer whales (Orcinus orca) in the Canadian Beaufort Sea. Polar Record 49, 307–314. doi: 10.1017/S0032247412000356
Hijmans, R. J., van Etten, J., Sumner, M., Cheng, J., Baston, D., Bevan, A., et al. (2021). raster: Geographic Data Analysis and Modeling. R Package Version 3.4-13. Available online at: https://cran.r-project.org/web/packages/raster/index.html (accessed August 6, 2021).
Hill, H. M., Dietrich, S., Yeater, D., McKinnon, M., Miller, M., Aibel, S., et al. (2015). Developing a catalog of socio-sexual behaviours of beluga whales (Delphinapterus leucas) in the care of humans. Anim. Behav. Cogn. 2, 105–123. doi: 10.12966/abc.05.01.2015
Hooker, S. K., Baird, R. W., and Fahlman, A. (2009). Could beaked whales get the bends? Effect of diving behaviour and physiology on modelled gas exchange for three species: Ziphius cavirostris, Mesoplodon densirostris and Hyperoodon ampullatus. Respir. Physiol. Neurobiol. 167, 234–246. doi: 10.1016/j.resp.2009.04.023
Hornby, C. A., Hoover, C., Iacozza, J., Barber, D. G., and Loseto, L. L. (2016). Spring conditions and habitat use of beluga whales (Delphinapterus leucas) during arrival to the Mackenzie River Estuary. Polar Biol. 39, 2319–2334. doi: 10.1007/s00300-016-1899-9
Houston, A. L., and Carbone, C. (1992). The optimal allocation of time during the diving cycle. Behav. Ecol. 3, 255–265. doi: 10.1093/beheco/3.3.255
Hubert, M., Rousseeuw, P., and Verdonck, T. (2009). Robust PCA for skewed data and its outlier map. Comput. Stat. Data Anal. 53, 2264–2274. doi: 10.1016/j.csda.2008.05.027
Huntington, H. P., Danielson, S. L., Wiese, F. K., Baker, M., Boveng, P., Citta, J. J., et al. (2020). Evidence suggests potential transformation of the Pacific Arctic ecosystem is underway. Nat. Clim. Change 10, 342–348. doi: 10.1038/s41558-020-0695-2
Hussey, N. E., Kessel, S. T., Aarestrup, K., Cooke, S. J., Cowley, P. D., Fisk, A. T., et al. (2015). Aquatic animal telemetry: A panoramic window into the underwater world. Science 348:1255642. doi: 10.1126/science.1255642
Irvine, L., Palacios, D. M., Urban, J., and Mate, B. (2017). Sperm whale dive behaviour characteristics derived from intermediate-duration archival tag data. Ecol. Evol. 7, 7822–7837. doi: 10.1002/ece3.3322
Jakobsson, M., Mayer, L. A., Coakley, B., Dowdeswell, J. A., Forbes, S., Fridman, B., et al. (2012). The international bathymetric chart of the Arctic Ocean (IBCAO) version 3.0. Geophys. Res. Lett. 39:L12609. doi: 10.1029/2012GL052219
Johnson, D. S., London, J. M., and Wilson, K. (2018). crawl: Fit Continuous-Time Correlated Random Walk Models to Animal Movement Data. R Package Version 2.2.1. Available online at: https://cran.r-project.org/web/packages/crawl/index.html (accessed May 1, 2020).
Johnson, D. S., London, J. M., Lea, M.-A., and Durban, J. W. (2008). Continuous-time correlated random walk model for animal telemetry data. Ecology 89, 1208–1215. doi: 10.1890/07-1032.1
Jouma’a, J., Le Bras, Y., Richard, G., Vacquié-Garcia, J., Picard, B., El Ksabi, N., et al. (2016). Adjustment of diving behaviour with prey encounters and body condition in a deep diving predator: the Southern Elephant Seal. Funct. Ecol. 30, 636–648. doi: 10.1111/1365-2435.12514
Kane, E. A., and Marshall, C. D. (2009). Comparative feeding kinematics and performance of odontocetes: belugas, Pacific white-sided dolphins and long-finned pilot whales. J. Exp. Biol. 212, 3939–3950. doi: 10.1242/jeb.034686
Kelley, T. C., Stewart, R. E. A., Yurkowski, D. J., Ryan, A., and Ferguson, S. H. (2015). Mating ecology of beluga (Delphinapterus leucas) and narwhal (Monodon monoceros) as estimated by reproductive tract metrics. Mar. Mamm. Sci. 31, 479–500. doi: 10.1111/mms.12165
Kluyver, T., Ragan-Kelley, B., Pérez, F., Granger, B., Bussonier, M., Frederic, J., et al. (2016). “Jupyter Notebooks – a publishing format for reproducible computational workflows,” in Positioning and Power in Academic Publishing: Players, Agents and Agendas, eds F. Loizides and B. Schmidt (Amsterdam: IOS-Press), 87–90.
Kooyman, G. L., McDonald, B. I., Williams, C. L., Meir, J. U., and Ponganis, P. J. (2021). The aerobic dive limit: After 40 years, still rarely measured but commonly used. Comp. Biochem. Physiol. Part A 252:110841. doi: 10.1016/j.cbpa.2020.110841
Laidre, K. L., and Heide-Jørgensen, M. P. (2005). Winter feeding intensity of narwhals (Monodon monoceros). Mar. Mamm. Sci. 21, 45–57. doi: 10.1111/j.1748-7692.2005.tb01207.x
Laidre, K. L., Heide-Jørgensen, M. P., and Nielsen, T. G. (2007). Role of the bowhead whale as a predator in West Greenland. Mar. Ecol. Prog. Ser. 346, 285–297. doi: 10.3354/meps06995
Laidre, K. L., Stirling, I., Lowry, L. F., Wiig, Ø, Heide-Jørgensen, M. P., and Ferguson, S. H. (2008). Quantifying the sensitivity of Arctic marine mammals to climate-induced habitat change. Ecol. Applic. 18, S97–S125. doi: 10.1890/06-0546.1
Lefebvre, S. L., Lesage, V., Michaud, R., and Humphries, M. M. (2018). Classifying and combining herd surface activities and individual dive profiles to identify summer behaviours of beluga (Delphinapterus leucas) from the St. Lawrence Estuary, Canada. Can. J. Zool. 96, 393–410. doi: 10.1139/cjz-2017-0015
Lenth, R., Buerkner, P., Herve, M., Love, J., Riebl, H., and Singmann, H. (2020). emmeans: Estimated Marginal Means, aka Least-Squares Means v1.5.2-1. Available online at: https://cran.r-project.org/web/packages/emmeans/index.html (accessed November 15, 2020).
Lesage, V., Hammill, M. O., and Kovacs, K. M. (1999). Functional classification of harbour seal (Phoca vitulina) dives using depth profiles, swimming velocity, and an index of foraging success. Can. J. Zool. 77, 74–87. doi: 10.1139/z98-199
Lomac-Macnair, K. S., Smultea, M. A., Cotter, M. P., Thissen, C., and Parker, L. (2015). Socio-sexual and probable mating behavior of Cook Inlet beluga whales, Delphinapterus leucas, observed from an aircraft. Mar. Fish. Rev. 77, 32–39. doi: 10.7755/MFR.77.2.2
London, J. M., and Johnson, D. S. (2018). A Guide to Crawl-ing with R. A Book Based on the ‘Learning to Crawl’ Workshop(s). Available online at: https://jmlondon.github.io/crawl-workshop/index.html (accessed May 1, 2020).
Loseto, L. L., Brewster, J. D., Ostertag, S. K., Snow, K., MacPhee, S. A., McNicholl, D. G., et al. (2018). Diet and feeding observations from an unusual beluga harvest in Ulukhaktok Northwest Territories, Canada. Arctic Sci. 4, 421–431. doi: 10.1139/as-2017-0046
Loseto, L. L., Richard, P., Stern, G. A., Orr, J., and Ferguson, S. H. (2006). Segregation of Beaufort Sea beluga whales during the open-water season. Can. J. Zool. 84, 1743–1751. doi: 10.1139/z06-160
Loseto, L. L., Stern, G. A., and Ferguson, S. H. (2008). Size and biomagnification: how habitat selection explains beluga mercury levels. Environ. Sci. Technol. 42, 3982–3988. doi: 10.1021/es7024388
Loseto, L. L., Stern, G. A., Connelly, T. L., Deibel, D., Gemmill, B., Prokopowicz, A., et al. (2009). Summer diet of beluga whales inferred by fatty acid analyses of the eastern Beaufort Sea food web. J. Exp. Mar. Biol. Ecol. 374, 12–18. doi: 10.1016/j.jembe.2009.03.015
Magnusson, A., Skaug, H., Nielsen, A., Berg, C., Kristensen, K., Maechler, M., et al. (2021). glmmTMB: Generalized Linear Mixed Models using Template Model Builder. R package version 1.1.2. Available online at: https://cran.r-project.org/web/packages/glmmTMB/index.html (accessed August 6, 2021).
Majewski, A. R., Atchison, S., MacPhee, S., Eert, J., Niemi, A., Michel, C., et al. (2017). Marine fish community structure and habitat associations on the Canadian Beaufort shelf and slope. Deep Sea Res. Part I 121, 169–182. doi: 10.1016/j.dsr.2017.01.009
Majewski, A. R., Lynn, B. R., Lowdon, M. K., Williams, W. J., and Reist, J. D. (2013). Community composition of demersal marine fishes on the Canadian Beaufort Shelf and at Herschel Island, Yukon Territory. J. Mar. Syst. 127, 55–64. doi: 10.1016/j.jmarsys.2013.05.012
Majewski, A. R., Walkusz, W., Lynn, B. R., Atchison, S., Eert, J., and Reist, J. D. (2016). Distribution and diet of demersal Arctic cod, Boreogadus saida, in relation to habitat characteristics in the Canadian Beaufort Sea. Polar Biol. 39, 1087–1098. doi: 10.1007/s00300-015-1857-y
Martin, A. R., and Smith, T. G. (1992). Deep diving in wild, free ranging beluga whales, Delphinapterus leucas. Can. J. Fish. Aquat. Sci. 49, 462–466. doi: 10.1139/f92-055
Martin, A. R., and Smith, T. G. (1999). Strategy and capability of wild belugas, Delphinapterus leucas, during deep, benthic diving. Can. J. Zool. 77, 1783–1793. doi: 10.1139/z99-129
Martin, A. R., Hall, P., and Richard, P. R. (2001). Dive behaviour of belugas (Delphinapterus leucas) in the shallow waters of western Hudson Bay. Arctic 54, 276–283. doi: 10.14430/arctic787
Martin, A. R., Kingsley, M. C. S., and Ramsay, M. A. (1994). Diving behaviour of narwhals (Monodon monoceros) on their summer grounds. Can. J. Zool. 72, 118–125. doi: 10.1139/z94-015
Martin, A. R., Smith, T. G., and Cox, O. P. (1998). Dive form and function in belugas Delphinapterus leucas of the eastern Canadian High Arctic. Polar Biol. 20, 218–228. doi: 10.1007/s003000050299
Matsumura, M., Watanabe, Y. Y., Robinson, P. W., Miller, P. J. O., Costa, D. P., and Miyazaki, N. (2011). Underwater and surface behavior of homing juvenile Northern elephant seals. J. Exp. Biol. 214, 629–636. doi: 10.1242/jeb.048827
McGovern, K. A., Rodríguez, D. H., Lewis, M. N., and Davis, R. W. (2019). Diving classification and behaviour of free-ranging southern elephant seals based on three-dimensional movements and video-recorded observations. Mar. Ecol. Prog. Ser. 620, 215–232. doi: 10.3354/meps12936
Meier, W. N., Fetterer, F., Windnagel, A. K., and Stewart, J. S. (2021). NOAA/NSIDC Climate Data Record of Passive Microwave Sea Ice Concentration, Version 4. July 3rd 2018 – November 15th 2019. Boulder, CO: NSIDC: National Snow and Ice Data Center.
Michaud, R. (2005). “Sociality and ecology of the odontocetes,” in Sexual Segregation in Vertebrates: Ecology of the Two Sexes, eds K. E. Ruckstuhl and P. Neuhaus (Cambridge: Cambridge University Press), doi: 10.1017/CBO9780511525629
Milborrow, S. (2021). rpart.plot: Plot ‘rpart’ Models: An Enhanced Version of ‘plot.rpart’. R package version 3.1.0. Available online at: https://cran.r-project.org/web/packages/rpart.plot/index.html (accessed August 6, 2021).
Miller, P. J. O., Kvadsheim, P. H., Lam, F. P. A., Tyack, P. L., Curé, C., DeRuiter, S. L., et al. (2015). First indications that northern bottlenose whales are sensitive to behavioural disturbance from anthropogenic noise. R. Soc. Open Sci. 2:140484. doi: 10.1098/rsos.140484
Mori, Y. (1998). Optimal choice of foraging depth in divers. J. Zool. 245, 279–283. doi: 10.1111/j.1469-7998.1998.tb00102.x
Newland, C., Field, I. C., Nichols, P. D., Bradshaw, C. J. A., and Hindell, M. A. (2009). Blubber fatty acid profiles indicate dietary resource partitioning between adult and juvenile southern elephant seals. Mar. Ecol. Prog. Ser. 384, 303–312. doi: 10.3354/meps08010
Nose, T., Webb, A., Waseda, T., Inoue, J., and Sato, K. (2018). Predictability of storm wave heights in the ice-free Beaufort Sea. Ocean Dyn. 68, 1383–1402. doi: 10.1007/s10236-018-1194-0
Nunes, A. (2019). divebomb Dive Classification Algorithm. Python Package v1.1.2. Available online at: https://pypi.org/project/divebomb/ (accessed February 4, 2020).
O’Corry-Crowe, G., Suydam, R., Quakenbush, L., Smith, T. G., Lydersen, C., Kovacs, K. M., et al. (2020). Group structure and kinship in beluga whale societies. Sci. Rep. 10:11462. doi: 10.1038/s41598-020-67314-w
Orr, J. R., Joe, R., and Evic, D. (2001). Capturing and handling of white whales (Delphinapterus leucas) in the Canadian Arctic for instrumentation and release. Arctic 54, 299–304. doi: 10.14430/arctic789
Pettitt-Wade, H., Loseto, L. L., Majewski, A., and Hussey, N. E. (2021). Cod movement ecology in a warming world: circumpolar Arctic gadids. Fish Fish. 22, 562–591. doi: 10.1111/faf.12536
Quakenbush, L. T., Suydam, R. S., Bryan, A. L., Lowry, L. F., Frost, K. J., and Mahoney, B. A. (2015). Diet of beluga whales, Delphinapterus leucas, in Alaska from stomach contents, March-November. Mar. Fish. Rev. 77, 70–84. doi: 10.7755/MFR.77.1.7
Quick, N. J., Isojunno, S., Sadykova, D., Bowers, M., Nowacek, D. P., and Read, A. J. (2017). Hidden Markov Models reveal complexity in the diving behaviour of short-finned pilot whales. Sci. Rep. 7:45765. doi: 10.1038/srep45765
R Core Development Team (2019). R: A Language and Environment for Statistical Computing. Vienna: R Foundation for Statistical Computing.
Reeves, R. R., Ewins, P. J., Agbayani, S., Heide-Jørgensen, M. P., Kovacs, K. M., Lydersen, C., et al. (2014). Distribution of endemic cetaceans in relation to hydrocarbon development and commercial shipping in a warming Arctic. Mar. Policy 44, 375–389. doi: 10.1016/j.marpol.2013.10.005
Richard, P. R., Heide-Jørgensen, M. P., and St. Aubin, D. (1998). Fall movements of belugas (Delphinapterus leucas) with satellite-linked transmitters in Lancaster sound, jones sound, and northern Baffin bay. Arctic 51, 5–16. doi: 10.14430/arctic1040
Richard, P. R., Martin, A. R., and Orr, J. R. (1997). Study of summer and fall movements and dive behaviour of Beaufort sea belugas, using satellite telemetry: 1992-1995. Environ. Stud. Res. Funds Rep. 134:26.
Richard, P. R., Martin, A. R., and Orr, J. R. (2001). Summer and autumn movements of belugas of the eastern Beaufort Sea stock. Arctic 54, 223–236. doi: 10.14430/arctic783
Ridgway, S. H., Carder, D. A., Kamolnick, T., Smith, R. R., Schlundt, C. E., and Elsberry, W. R. (2001). Hearing and whistling in the deep sea: depth influences whistle spectra but does not attenuate hearing by white whales (Delphinapterus leucas) (Ocontoceti, Cetacea). J. Exp. Biol. 204, 3829–3841. doi: 10.1242/jeb.204.22.3829
Rosel, P. E. (2003). PCR-based sex determination in Odontocete cetaceans. Conserv. Genet. 4, 647–649. doi: 10.1023/A:1025666212967
Rosen, D. A. S., Winslip, A. J., and Hoopes, L. A. (2007). Thermal and digestive constraints to foraging behaviour in marine mammals. Philos. Trans. R. Soc. B 362, 2151–2168. doi: 10.1098/rstb.2007.2108
Seger, K. D., and Miksis-Olds, J. L. (2020). A decade of marine mammal acoustical presence and habitat preference in the Bering Sea. Polar Biol. 43, 1549–1569.
Simon, M., Johnson, M., Tyack, P., and Madsen, P. T. (2009). Behaviour and kinematics of continuous ram filtration in bowhead whales (Balaena mysticetus). Proc. R. Soc. B Biol. Sci. 276, 3819–3828.
Smith, T. G., St. Aubin, D. J., and Hammill, M. (1992). Rubbing-behaviour of belugas, Delphinapterus leucas, in a high Arctic estuary. Can. J. Zool. 70, 2405–2409.
Snoeijs-Leijonmalm, P., Flores, H., Volckaert, F., Niehoff, B., Schaafsma, F., Hjelm, J., et al. (2020). Review of the Research Knowledge and Gaps on Fish Populations, Fisheries and Linked Ecosystems in the Central Arctic Ocean (CAO). Luxembourg: Publications Office of the European Union. doi: 10.2826/387890
Stafford, K. M., Ferguson, M. C., Hauser, D. D. W., Okkonen, S. R., Berchok, C. L., Citta, J. J., et al. (2018). Beluga whales in the western Beaufort Sea: Current state of knowledge on timing, distribution, habitat use and environmental drivers. Deep Sea Res. Part II 152, 182–194.
Suydam, R. S. (2009). Age, Growth, Reproduction and Movements of Beluga Whales (Delphinapterus leucas) from the Eastern Chukchi Sea. Doctoral dissertation. Seattle, WA: University of Washington, 169.
Tennessen, J. B., Holt, M. M., Hanson, M. B., Emmons, C. K., Giles, D. A., and Hogan, J. T. (2019). Kinematic signatures of prey capture from archival tags reveal sex differences in killer whale foraging activity. J. Exp. Biol. 222:jeb191874.
Therneau, T., Atkinson, B., and Ripley, B. (2019). rpart: Recursive Partitioning and Regression Trees. R package version 4.1-15. Available online at: https://cran.r-project.org/web/packages/rpart/index.html (accessed August 6, 2021).
Thompson, D., and Fedak, M. A. (2001). How long should a dive last? A simple model of foraging decisions by breath-hold divers in a patchy environment. Anim. Behav. 61, 287–296.
Thums, M., Bradshaw, C. J. A., Sumner, M. D., Horsburgh, J. M., and Hindell, M. A. (2013). Depletion of deep marine food patches forces divers to give up early. J. Anim. Ecol. 82, 72–83.
Vacquié-Garcia, J., Lydersen, C., and Kovacs, K. M. (2019). Diving behaviour of adult male white whales (Delphinapterus leucas) in Svalbard, Norway. Polar Res. 38:3605.
Viviant, M., Monestiez, P., and Guinet, C. (2014). Can we predict foraging success in a marine predator from dive patterns only? Validation with prey capture attempt data. PLoS One 9:e88503. doi: 10.1371/journal.pone.0088503
Wang, M., and Overland, J. E. (2015). Projected future duration of the sea-ice-free season in the Alaskan Arctic. Prog. Oceanogr. 136, 50–59.
Watt, C. A., Orr, J., and Ferguson, S. H. (2016). A shift in foraging behaviour of beluga whales Delphinapterus leucas from the threatened Cumberland Sound population may reflect a changing Arctic food web. Endanger. Species Res. 31, 259–270.
Westdal, K. H., Davies, J., MacPherson, A., Orr, J., and Ferguson, S. H. (2016). Behavioural changes in belugas (Delphinapterus leucas) during a killer whale (Orcinus orca) attack in Southwest Hudson Bay. Can. Field Nat. 130, 315–319.
Whalen, D., Loseto, L. L., Hornby, C. A., Harwood, L., and Hansen-Craik, K. (2020). Mapping and understanding the role of seabed morphology in relation to beluga whale (Delphinapterus leucas) hotspots and habitat use in the Mackenzie estuary, NT. Estuar. Coast 43, 161–173.
Williams, T. M. (2001). Intermittent swimming by mammals: a strategy for increasing energetic efficiency during diving. Am. Zool. 41, 166–176.
Wright, A. J., Akamatsu, T., Mouritsen, K. N., Sveegaard, S., Dietz, R., and Teilmann, J. (2017). Silent porpoise: potential sleeping behaviour identified in wild harbour porpoises. Anim. Behav. 133, 211–222.
Zerbini, A. N., Andriolo, A., Heide-Jørgensen, M. P., Pizzorno, J. L., Maia, Y. G., VanBlaricom, G. R., et al. (2006). Satellite-monitored movements of humpback whales Megaptera novaeangliae in the Southwest Atlantic Ocean. Mar. Ecol. Prog. Ser. 313, 295–304.
Keywords: Beaufort Sea, biologging, dive classification, energetics, foraging, beluga whale (Delphinapterus leucas), diving behavior
Citation: Storrie L, Hussey NE, MacPhee SA, O’Corry-Crowe G, Iacozza J, Barber DG, Nunes A and Loseto LL (2022) Year-Round Dive Characteristics of Male Beluga Whales From the Eastern Beaufort Sea Population Indicate Seasonal Shifts in Foraging Strategies. Front. Mar. Sci. 8:715412. doi: 10.3389/fmars.2021.715412
Received: 26 May 2021; Accepted: 25 November 2021;
Published: 03 January 2022.
Edited by:
Phil J. Bouchet, University of St Andrews, United KingdomReviewed by:
William Richard Cioffi, Southall Environmental Associates, Inc., United StatesKimberly Thea Goetz, National Oceanic and Atmospheric Administration, United States
Copyright © 2022 Storrie, Hussey, MacPhee, O’Corry-Crowe, Iacozza, Barber, Nunes and Loseto. This is an open-access article distributed under the terms of the Creative Commons Attribution License (CC BY). The use, distribution or reproduction in other forums is permitted, provided the original author(s) and the copyright owner(s) are credited and that the original publication in this journal is cited, in accordance with accepted academic practice. No use, distribution or reproduction is permitted which does not comply with these terms.
*Correspondence: Luke Storrie, c3RvcnJpZWxAbXl1bWFuaXRvYmEuY2E=