 Savannah L. Lewis1
 Georges Saliba2
 Lynn M. Russell1*
 Patricia K. Quinn3
 Timothy S. Bates3,4
 Michael J. Behrenfeld5
- 1Scripps Institution of Oceanography, University of California, San Diego, La Jolla, CA, United States
- 2Pacific Northwest National Laboratory, Richland, WA, United States
- 3Pacific Marine Environmental Laboratory, National Oceanic and Atmospheric Administration, Seattle, WA, United States
- 4Cooperative Institute for Climate, Oceans, and Ecosystem Studies, University of Washington, Seattle, WA, United States
- 5Department of Botany and Plant Pathology, Oregon State University, Corvallis, OR, United States
Submicron atmospheric primary marine aerosol (aPMA) were collected during four North Atlantic Aerosol and Marine Ecosystem Study (NAAMES) research cruises between November 2015 and March 2018. The average organic functional group (OFG) composition of the aPMA samples was 72–85% hydroxyl group mass, 6–13% alkane group mass, and 5–8% amine group mass, which is similar to prior observations and to aerosol generated from Sea Sweep. The carboxylic acid group had seasonal averages that ranged from 1% for Winter, 8% for Late Spring, and 10% for Autumn. The carboxylic acid group mass concentration correlated with nitrate mass concentration and weakly with photosynthetically active radiation (PAR) above 100 W m–2, suggesting a substantial secondary organic aerosol contribution in sunnier months. The three sizes of aPMA aerosol particles (<0.18, <0.5, and <1 μm) had the same four organic functional groups (hydroxyl, alkane, amine, and carboxylic acid groups). The aPMA spectra of the three sizes showed more variability (higher standard deviations of cosine similarity) within each size than between the sizes. The ratio of organic mass (OM) to sodium (OM/Na) of submicron generated primary marine aerosol (gPMA) was larger for Autumn with project average of 0.93 ± 0.3 compared to 0.55 ± 0.27 for Winter, 0.47 ± 0.16 for Late Spring, and 0.53 ± 0.24 for Early Spring. When the gPMA samples were separated by latitude (47–60°N and 18–47°N), the median OM/Na concentration ratio for Autumn was higher than the other seasons by more than the project standard deviations for latitudes north of 47°N but not for those south of 47°N, indicating that the seasonal differences are stronger at higher latitudes. However, the high variability of day-to-day differences in aPMA and gPMA composition within each season meant that seasonal trends in organic composition were generally not statistically distinguishable.
Introduction
Composition of the organic components of atmospheric marine aerosol (aMA) particles can influence aerosol direct and indirect effects on radiative budgets (Tsigaridis et al., 2013). This influence makes the quantification of the organic fraction an important property for accurately modeling aerosol effects in the marine environment (Randles et al., 2004). Sea spray aerosol is a mixture of water and sea salt and contains a significant fraction of organic material (Blanchard, 1964). The composition and concentration of the organic mass (OM) can vary between different ocean basins and seasons (Liu et al., 2021), but observations constraining these seasonal differences are rare (Saliba et al., 2020).
There are a few coastal sites with multiple seasons of observations of organic aerosol mass concentrations and one of the most studied is Mace Head, a coastal site in the eastern North Atlantic. Three years of continuous measurements showed that the aerosol non-refractory organic mass observed in polar air masses arriving at Mace Head is highest in summer (0.36 μg m–3) and reaches a minimum in winter (0.05 μg m–3) (Ovadnevaite et al., 2014). At the same site, the organic mass fraction of submicron marine aerosol varied from 15% during low chlorophyll periods (winter) to 63% during high chlorophyll periods (spring through autumn) (O’Dowd et al., 2004). Sea salt was the largest signal, regardless of chlorophyll concentrations, in sizes larger than 1 μm, but the organic fraction was consistently the largest component in the smaller sizes. During high chlorophyll periods, the organic signal was up to 80% of the total mass for particles <0.25 μm diameter (O’Dowd et al., 2004).
Biological activity [often represented by chlorophyll-a (Chl a) concentration] has been shown to covary with the organic composition of seawater (Carlson et al., 1994; Gaston et al., 2011; Collins et al., 2013; Prather et al., 2013; Rinaldi et al., 2013; Wang et al., 2015), but the extent to which these changes are reflected in ambient sea spray composition is an open question (Meskhidze et al., 2013). Actively bubbling seawater during open ocean studies provides one technique for linking seawater properties to emitted sea spray aerosol (Keene et al., 2007; Bates et al., 2012). Sea Sweep (Bates et al., 2012) is a commonly deployed seawater bubbling system and, here, we refer to aerosol particles produced by this system as “generated primary marine aerosol” (gPMA). Observations during previous deployments of Sea Sweep showed that the organic functional group composition of both seawater and gPMA were similar in the Atlantic, Arctic, and Pacific during spring and summer (Frossard et al., 2014) and that no significant differences exist between submicron organic mass fractions for five separate cruises in the North Atlantic (Bates et al., 2020). In all, while there are coastal observations that have shown links between marine biological activity and atmospheric organic aerosol (O’Dowd et al., 2004; Sciare et al., 2009; Mansour et al., 2020), there are very few remote marine observations that show a difference in the organic composition of gPMA under different biological conditions (Facchini et al., 2008).
There is even less information about changes in the composition of marine aerosol organic mass over the seasonal cycle. The composition of atmospheric primary marine aerosol (aPMA) in the Arctic, Atlantic, and coastal Pacific has been found to be remarkably consistent, with the hydroxyl organic functional group being the largest by mass followed by roughly equivalent contributions of alkane and amine groups (Russell et al., 2010; Frossard et al., 2014). Saliba et al. (2020) used the contribution of the hydroxyl group as a marker of seawater organics in ambient aerosol and showed a difference in the fraction of organic components by season. Higher sea spray organic mass was present when wind speed and sea salt concentration were higher. However, their work did not assess the seasonal differences in contributions of other organic functional groups.
The size distribution of marine particles is well-documented (Hoppel et al., 1990; Russell et al., 1996; Meskhidze et al., 2013), but there is very limited size-dependent composition information. The organic mass fraction has been shown to increase with decreasing particle diameter (O’Dowd et al., 2004; Keene et al., 2007; Facchini et al., 2008; Prather et al., 2013). One of the few seasonal marine studies that included size resolved information showed that water soluble organic carbon and total carbon in fine mode particles have maximum concentrations in early- to mid-summer, which coincides with the typical time for high biological activity (Yoon et al., 2007). Different particle sizes have also been shown to be chemically distinct from each other, such as the bimodal distribution of transparent exopolymer particles (<180 and >5,000 nm) and size-specific saccharides (Leck et al., 2013; Aller et al., 2017).
There is very limited information on seasonal differences in particle composition, the relationship of seawater source to primary aerosol, or differences in organic composition of marine aerosol particles with size, all of which have an influence on the direct and indirect effects of aerosol particles (Tsigaridis et al., 2013). For the current study, co-located atmospheric and seawater measurements were conducted to examine how ocean properties and atmospheric aerosols are linked. Samples were collected during four research cruises corresponding to four different seasons as part of the North Atlantic Aerosols and Marine Ecosystems Study (NAAMES; Behrenfeld et al., 2019). Understanding how the organic fraction and composition of ambient and bubble-generated marine aerosol particles change with size and season is an important first step in assessing these linkages. This study shows the dependence of marine organic composition on size and season by comparing organic compositions from Fourier transform infrared spectroscopy (FTIR) for generated and ambient aerosols under clean marine conditions.
Materials and Methods
North Atlantic Aerosols and Marine Ecosystems Study
North Atlantic Aerosols and Marine Ecosystems Study was an interdisciplinary investigation conducted in the western North Atlantic to improve understanding of Earth’s ocean ecosystem-aerosol-cloud system. NAAMES consisted of four 26-day cruises on the R/V Atlantis occurring in November 2015 (NAAMES 1, Winter), May–June 2016 (NAAMES 2, Late Spring), September 2017 (NAAMES 3, Autumn), and March–April 2018 (NAAMES 4, Early Spring). The ship traveled from Woods Hole, MA, to ∼55°N for the first three cruises and returned again to Woods Hole (Figure 1). For the last cruise, the ship traveled from San Juan, Puerto Rico, to ∼44.5°N and finished at Woods Hole. During each cruise, the ship occupied 5–7 multi-day sampling stations to conduct ecological and atmospheric measurements.
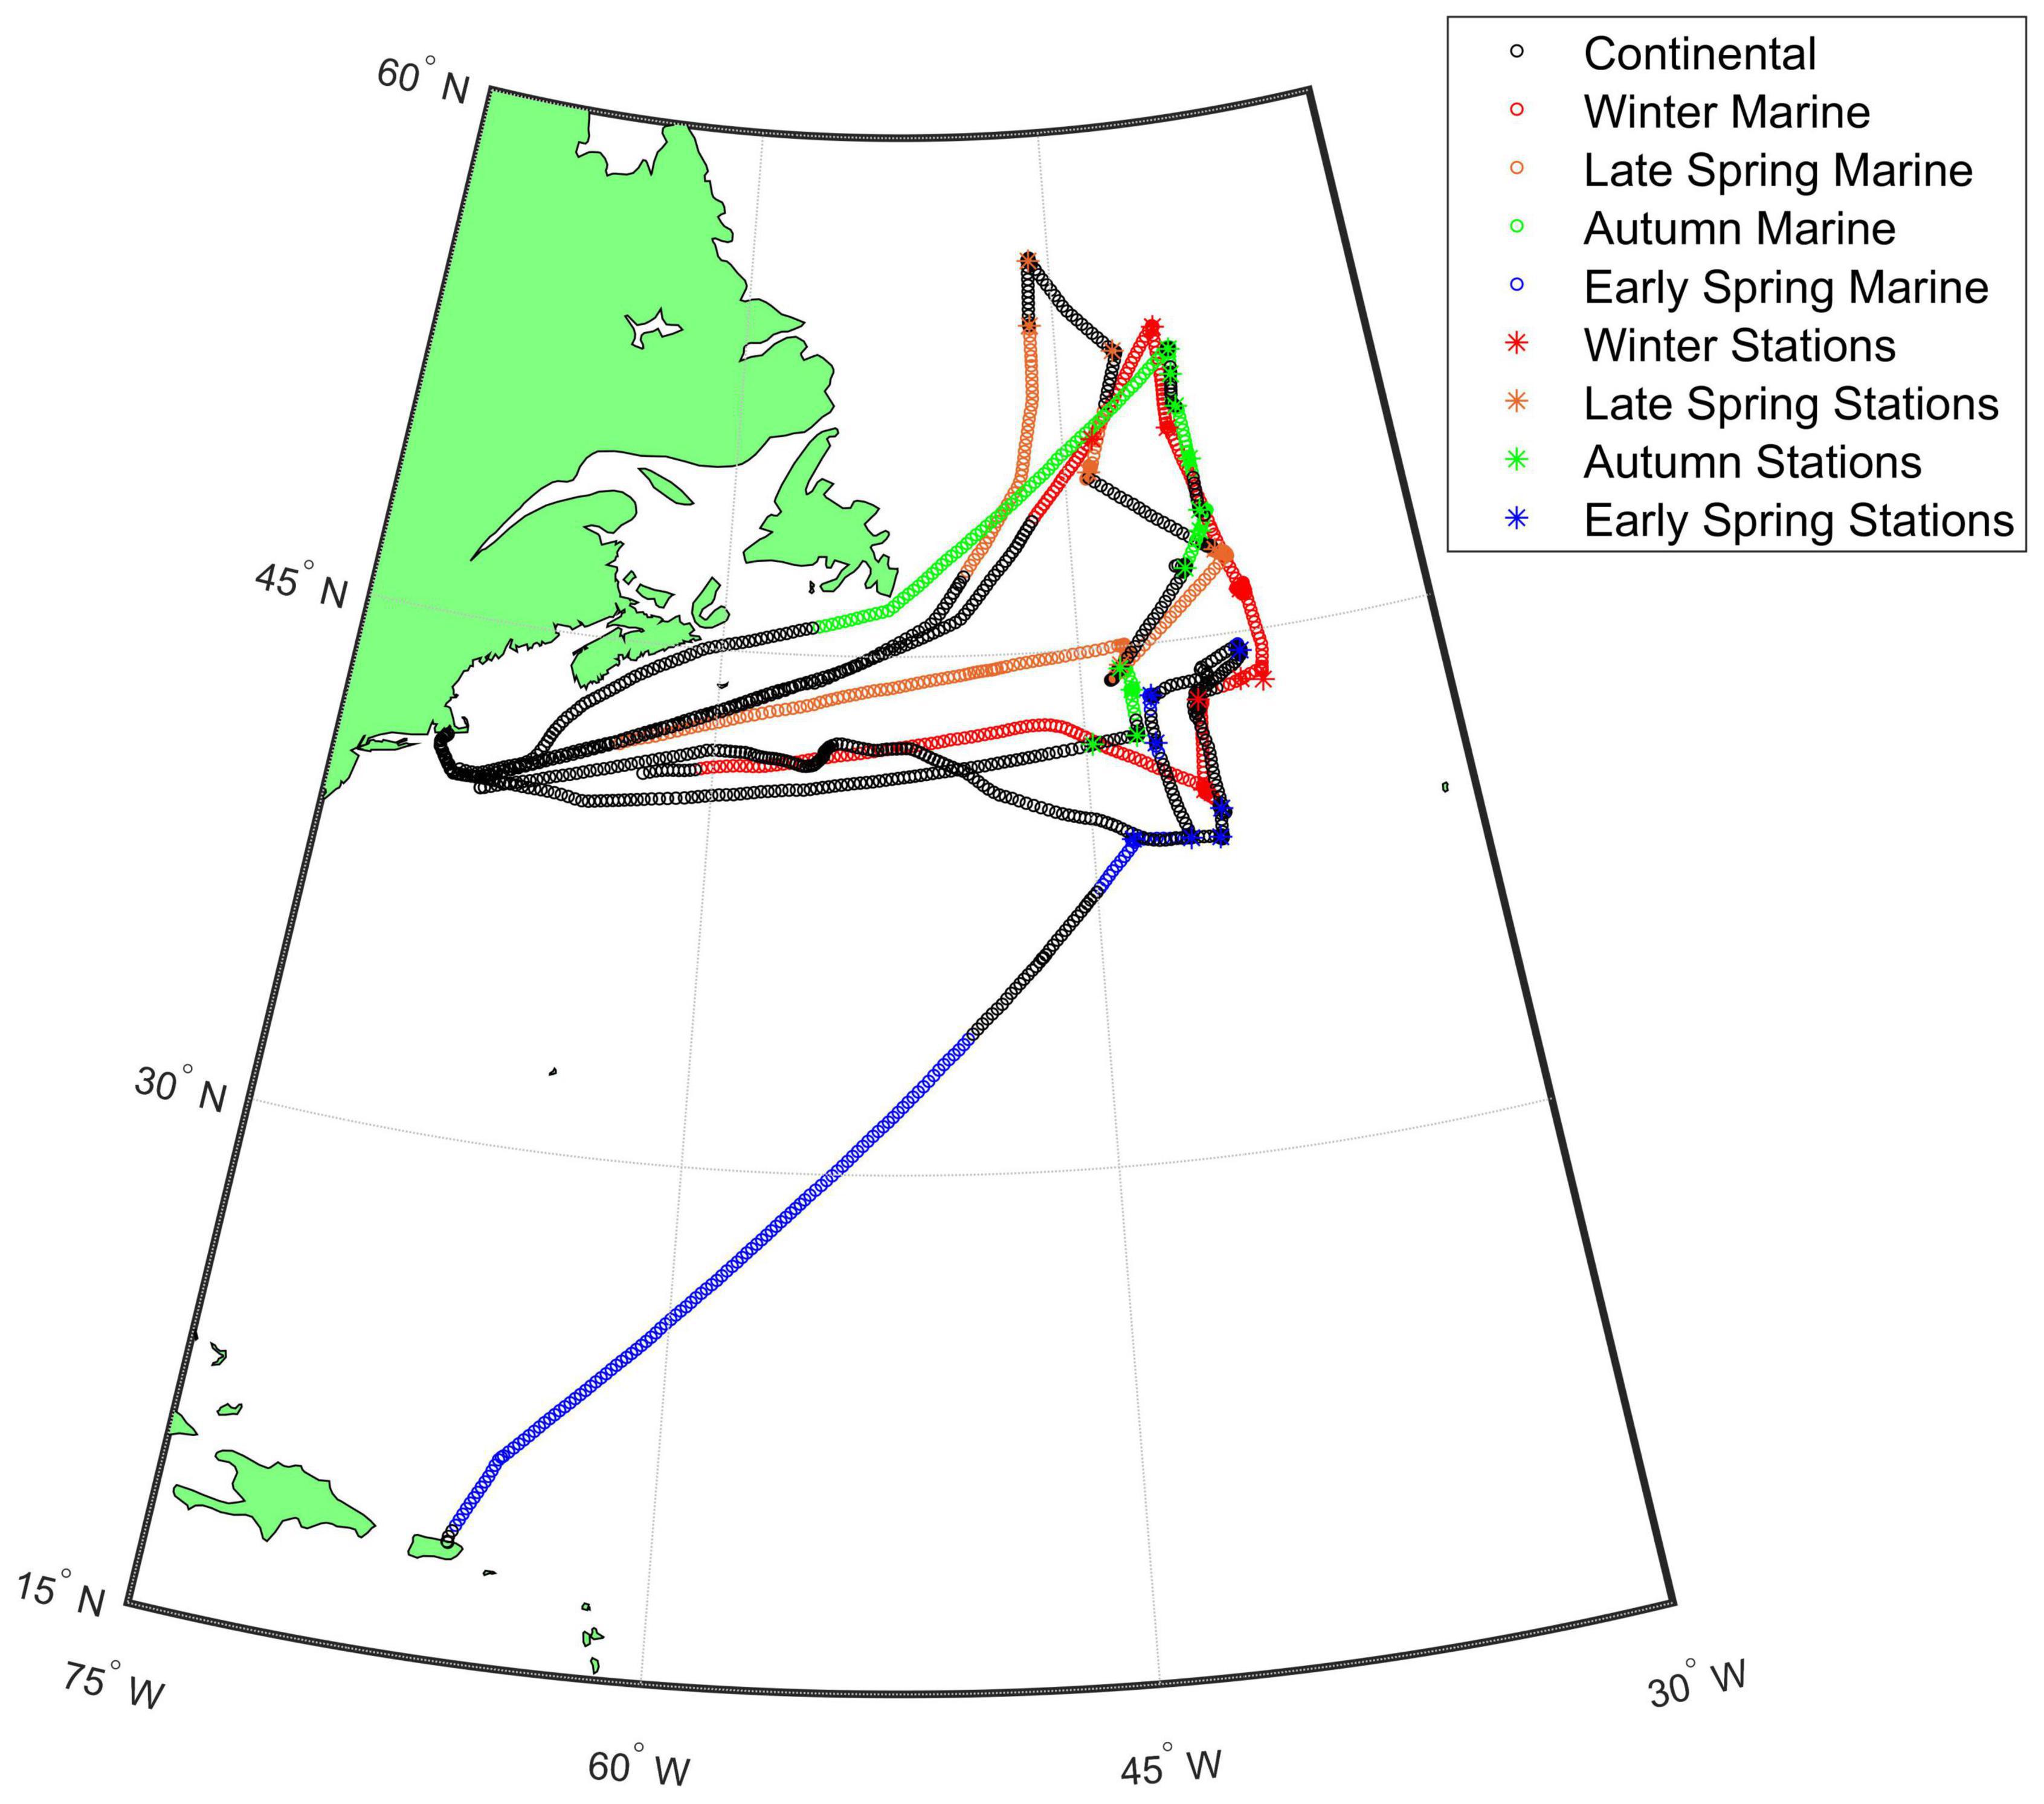
Figure 1. Map of the NAAMES study region with intensives sampling locations indicated with asterisks. The air mass categories are shown for each cruise with continental air masses (black) and marine air masses [Winter (red), Late Spring (orange), Autumn (green), and Early Spring (blue)]. The Winter, Late Spring, and Autumn cruises departed from Woods Hole, MA and the Early Spring cruise departed from San Juan, Puerto Rico.
Sea Sweep
Sea Sweep is a marine aerosol generator that has been used to simulate bubble bursting at the ocean surface and identify properties of primary marine aerosol (Bates et al., 2012). Aerosols produced by Sea Sweep are identified here as gPMA to distinguish them from naturally occurring sea spray. Sea Sweep consists of a stainless-steel frame attached to two inflatable pontoon floats and was deployed off the port bow of the R/V Atlantis. A stainless-steel hood on top of the Sea Sweep frame maintains a laminar flow air curtain of particle-free air (charcoal and HEPA filtered) at the bow and stern ends of the frame (Bates et al., 2012). Stainless steel frits, 200 μm in size, were positioned below the sea surface at approximately 0.75 m. The resulting particles were then transported to a variety of instruments for analysis.
Filter Collection
Ambient and Sea Sweep (gPMA) aerosol particles were collected through a temperature- and humidity-controlled inlet during NAAMES. Ambient and gPMA particles were dried using diffusion driers filled with silica gel and collected on 37 mm Teflon filters (Pall Inc., 1 μm pore size) at a sample flow rate of 8.3 L min–1 (1 μm) or 10 L min–1 (0.18, 0.5, and 1.1 μm size cut). The total <1 μm cyclone flow was 16.7 L min–1. The <0.18, <0.5, and <1.1 μm Berner impactor total flows were 30 L min–1. Filters were collected for 12–23 h for ambient samples (<0.18, <0.5, and <1 μm) and 2 h for Sea Sweep samples (<0.18, <1, and <1.1 μm), resulting in filtered air volumes of 1.0–13.8 m3. After collection, the filters were immediately unloaded, stored in petri dishes, and frozen for offline analysis at Scripps Institution of Oceanography.
FTIR Spectroscopy and Algorithm
Field samples were analyzed using FTIR spectroscopy (Bruker Tensor 27 spectrometer with a deuterated triglycine sulfate, DTGS, detector) to measure the infrared transmission using 2 cm–1 resolution (Takahama et al., 2013). Sea Sweep filters that showed hydrate peaks were dehydrated in a temperature and humidity controlled clean room (between 2 and 5 weeks) until the hydrate signature was no longer present (Frossard and Russell, 2012). Dehydration was required for 17 Sea Sweep (gPMA) filters from Winter, 27 from Late Spring, none for Autumn, and 10 from Early Spring. The FTIR spectrum for each filter was analyzed using an automated fitting algorithm (Maria et al., 2002; Russell et al., 2009b; Takahama et al., 2013). When the baselining procedure resulted in degenerate spectra (defined as spectra that have no discernable peaks and low signal to noise), they were excluded from further analysis. Five organic functional groups were quantified from these mixtures (alkane, hydroxyl, amine, carboxylic acid, and non-acidic carbonyl) and summed together to quantify organic mass (OM) concentration, with groups below detection limits excluded. Organic mass group concentrations were considered above detection if they met three criteria: (1) the fitted peak area for the individual functional group exceeded the minimum observable peak area (defined below), (2) the fitted peak area for the individual functional group exceeded twice the standard deviation of the pre-scan background area, and (3) the alkane functional group was one of the groups that met the first two criteria. Forty-four percent of <0.18 μm, 77% of <0.5 μm, and 63% of <1 μm ambient samples were above the detection limit. The low percentage of above detection limit <0.18 μm filters is due to the low mass collected in this size range.
The minimum observable peak areas for the five functional groups reported here were determined based on comparison of peak areas fitted by the algorithm to visual determination of which peaks could be distinguished from the noise by trained analysts (Russell et al., 2009b). Alkenes, aromatic compounds, and organo-sulfates were below detection limit for 90% of the samples and, thus, are not included in our analysis. Organic mass from this technique has an uncertainty of ±20% due to functional groups that overlap the Teflon absorption, unquantified functional groups, and semi-volatile properties (Maria et al., 2002; Russell, 2003; Russell et al., 2009a, b; Takahama et al., 2013). To account for different bubbling rates, OM concentrations from Sea Sweep samples are reported here as normalized to Na mass concentrations from IC measurements on synchronous samples.
Marine Air Mass Criteria
Ambient samples were divided into three main categories: continental, mixed, and marine. A solenoid valve was used to redirect flow from the sample filters when particle counts exceeded thresholds set between 1,000 and 2,000 particles cm–3, depending on proximity to the port. This conditioned sampling was used to ensure that filters were not contaminated by local shipboard emissions. Ambient samples were considered to be “marine” when 90% or more of the filter sampling time met the following criteria from Saliba et al. (2020): (1) HYSPLIT 48 hour back trajectories (Draxler and Hess, 1998) originated from the North or tropical Atlantic and did not pass over land during that time, (2) ammonium (NH4+) concentrations were below 0.1 μg m–3, (3) particle concentrations were below 2,000 particles cm–3, (4) the relative wind direction was within 90° of the bow, and (5) 50% or more of the filter sampling time must not exceed a black carbon (BC) threshold of 50 ng m–3. Forty-eight hour back trajectories were used because they provide the best tradeoff between longer time-periods with higher uncertainty and shorter time periods showing fewer upwind contributions (Quinn et al., 2019; Saliba et al., 2020). Sampling time was defined as the time between the start and stop time of the filtration, excluding times when filter sampling was shut off by the solenoid valve. This resulted in categorizing 19 <1 μm filters as aMA during the four NAAMES cruises. Continental filters were defined as times when 48 hour HYSPLIT back trajectories originated from North America, a relative wind direction within 90° of the bow, and sampling 10% or less during marine periods. Fourteen <1 μm filters were categorized as continental for the four NAAMES cruises. Eleven <1 μm filters fell between the “marine” and ‘continental’ categories and were thus categorized as “mixed filters.” These “mixed filters” corresponded to sampling for 10–90% under marine conditions and the remaining time under continental conditions. These aMA samples include contributions from other sources present in marine areas, such as ship emissions and transported constituents from coastal or continental emissions (Frossard et al., 2014).
Atmospheric primary marine aerosol, a sub-category of aMA, was defined to better isolate ocean sources of particles that result from bubble bursting at the sea surface. aPMA filters were defined as <1 μm aMA filters that had cosine similarity values >0.9 with the aPMA spectrum from Frossard et al. (2014) (Figure 2). The aPMA sub-category represented more than half of the aMA samples overall, including 8 of 8 samples in Winter, none of 1 in Early Spring, 3 of 6 in Late Spring, and 3 of 6 in Autumn. Similarity to the Frossard et al. (2014) aPMA spectra was used as a criterion because that spectrum had a high cosine similarity to the gPMA of that earlier study and that observed during NAAMES. This similarity provides a strong indication that aPMA samples are largely “primary” because they have a composition similar to bubbled seawater previously measured during five separate campaigns in different clean marine regions (Frossard et al., 2014). Cosine similarity (namely the dot-product cosine of two normalized spectra) was used to quantify spectral similarity because it has been shown to be sensitive to small spectral differences in FTIR (Stein and Scott, 1994; Wan et al., 2002; Frossard et al., 2014; Liu et al., 2017). Filters for size cutoffs smaller than 1 μm (<0.5 and <0.18 μm) were defined as aPMA if their start and stop time was within 2 h of <1 μm aPMA filters. There are no filters that met the aPMA criteria during Early Spring, likely due to substantial continental influences at the lower latitudes sampled during this cruise. A similar issue was not encountered during the other three seasons (Figure 1).

Figure 2. Fourier transform infrared spectroscopy (FTIR) spectra normalized to the alcohol group peak of the <1 μm atmospheric primary marine aerosol (aPMA) seasonal averages (Winter in red, Late Spring in orange, and autumn in green) and generated primary marine aerosol (gPMA) (black) averages with the individual aPMA spectra shown in gray. The pie charts show the average organic functional group (OFG) composition with hydroxyl (pink), alkane (blue), amine (orange), and acid (green) groups. The spectral peak locations for the OFG are indicated with the hydroxyl region in the shaded pink area, four alkane peaks (vertical blue lines), carbonyl (both acidic and non-acidic, vertical teal line), and amine (vertical orange line).
Results
aMA Composition and Seasonal Differences
The aMA filters had variable spectra, and therefore variable OFG composition, that may have reflected the different aerosol transport patterns sampled during each cruise (Behrenfeld et al., 2019). The aMA category includes aPMA filters and other filters that fulfilled the marine airmass trajectory and low continental tracer concentration requirements (see section “Materials and Methods”).
Organic composition of <1 μm aMA samples for the four cruises are summarized in Table 1. Winter aMA had the highest average OM concentration (0.30 ± 0.22 μg m–3) when average wind speed was high and there were minimal contributions from other sources. These conditions generally corresponded to sampling of air masses of polar origin. Winter samples had the highest hydroxyl group mass (85 ± 5%) of the four cruises (Table 1) and had similar composition to a previous cruise in the Arctic (ICEALOT) (Frossard et al., 2014).
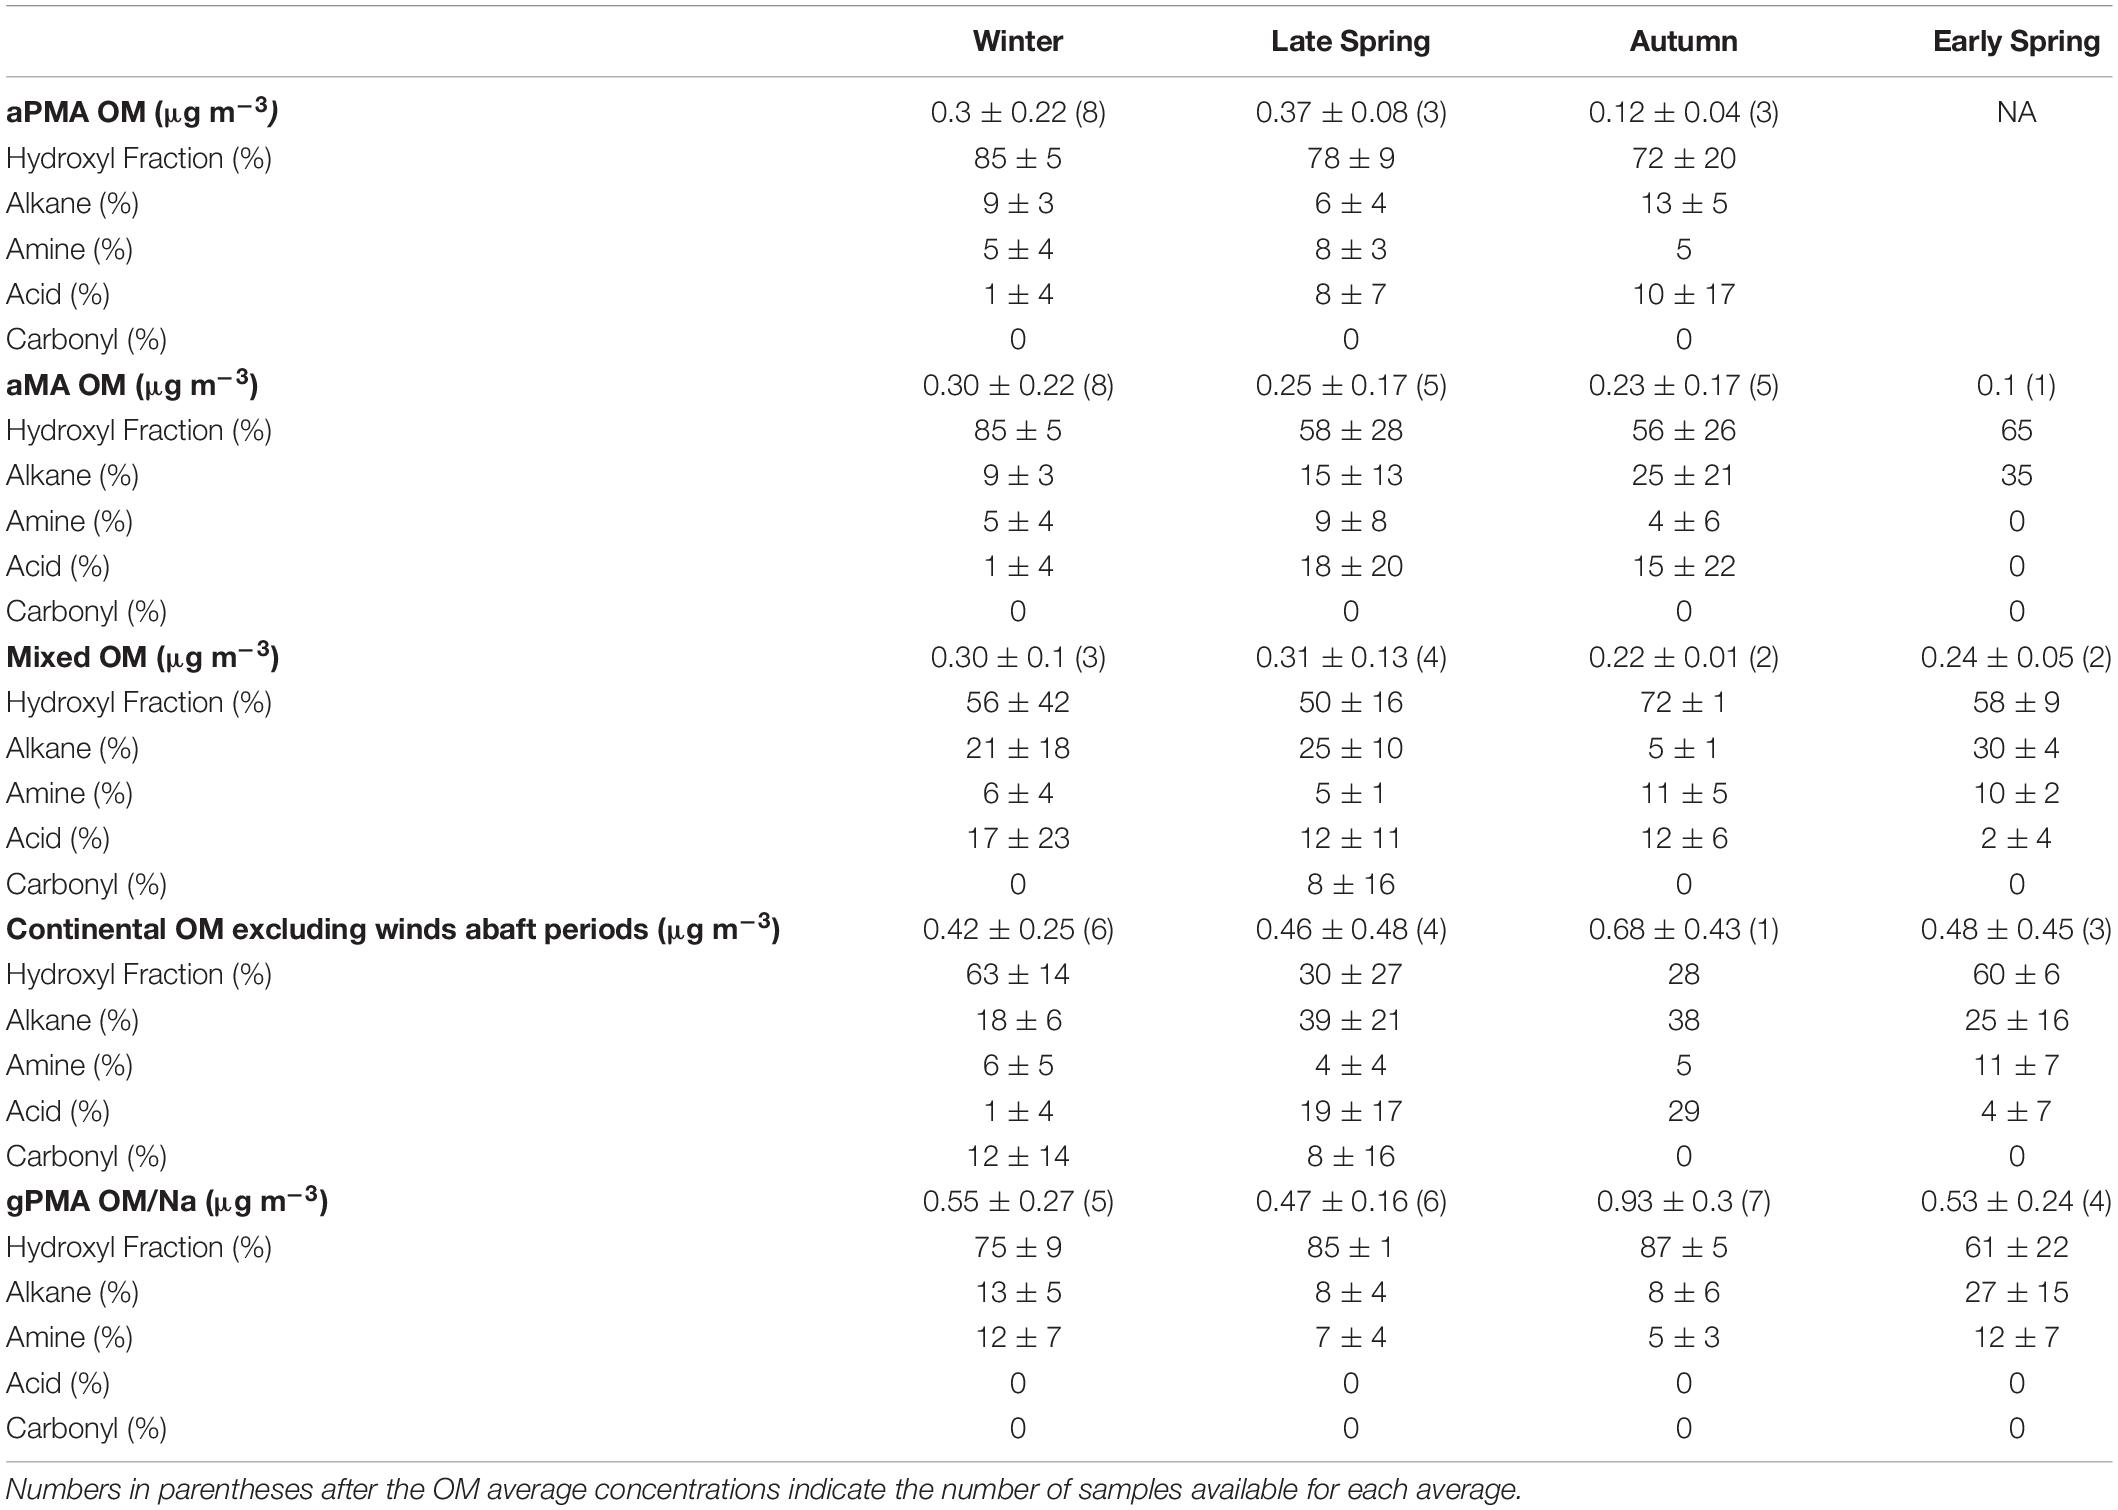
Table 1. Average organic functional group composition and organic mass (OM) averages of <1 μm filters from four different air mass categories during the four NAAMES campaigns.
Early Spring had one aMA filter above the detection limit with an OM concentration of 0.1 μg m–3 (Table 1). The number of aMA samples during Early Spring was limited because the majority of the ship time was sampling continental air masses (69%) (Supplementary Table 1). Early Spring aMA filters had a higher alkane group amount (35%) than the other campaigns, which is likely due to the persistent continental influence in the marine environment during this campaign (Table 1 and Supplementary Table 1).
The Late Spring campaign coincided with the climax of the annual phytoplankton bloom and samples collected during this period had the second highest average OM during clean marine periods (0.25 ± 0.17 μg m–3) (Table 1). The contribution of carboxylic acid group to aMA OM was substantially higher during this cruise than in Winter or Early Spring (18% vs. 1 and 0%, respectively), but similar to Autumn (Table 1).
The Autumn campaign corresponded to the declining phase of the phytoplankton bloom. Samples collected during this period had an aMA OM average of 0.23 ± 0.17 μg m–3 (Table 1) and a relatively high carboxylic acid group mass fraction of aMA OM with an average of 15% (Table 1).
The aMA OM concentrations were not statistically different between seasons (p ≫ 0.01 and Supplementary Table 9), but the maximum value was observed in Winter (0.30 ± 0.22 μg m–3, n = 8) and the minimum in Early Spring (0.1 μg m–3, n = 1) (Table 1). Hydroxyl group concentrations were strongly correlated (r = 0.9) with Na concentrations obtained from thermal desorption chemical ionization mass spectrometry (TDCIMS) (Lawler et al., 2020; Saliba et al., 2020). This finding supports the interpretation that the hydroxyl group is from a marine source (Bahadur et al., 2010; Russell et al., 2010, 2011; Frossard et al., 2014). Furthermore, hydroxyl group OM for all four campaigns did not correlate with BC (Saliba et al., 2020; Supplementary Figure 4), providing additional evidence that the hydroxyl group is a primary marine compound rather than a combustion or secondary product. High wind speeds and consistent polar air masses during the Winter campaign likely resulted in the stronger marine signature, which was dominated by hydroxyl group contributions (Russell et al., 2010) and less continental mixing compared to others seasons.
There were no statistical differences in the OM mass concentrations between the different seasons, though Winter did have the strongest marine signal with the highest hydroxyl group concentration. Overall, these results show that aMA filters are a complex mixture of marine and continental components, with the marine components comprising the majority of the signal.
aPMA Composition and Seasonal Differences
The aPMA category is likely most representative of ocean sea spray sources. aPMA had a broad range of OM concentrations (0.07–0.83 μg m–3), even though condensation nuclei (CN) number concentrations were consistently below 500 cm–3 for 96% of the sampling time. The average aPMA OM concentrations for Winter, Late Spring, and Autumn were not statistically different from each other (p > 0.01, two-sample Student’s t-test (Walpole et al., 2012; Supplementary Table 9), with the Late Spring only nominally different from Autumn (p = 0.0103) and the other seasons indistinguishable (Winter vs Late Spring p = 0.66, Winter vs Autumn p = 0.21, Supplementary Table 9). Late Spring had the highest average aPMA OM concentration at 0.37 ± 0.08 μg m–3, Winter had an average aPMA OM concentration of 0.3 ± 0.22 μg m–3, and Early Spring had the lowest aPMA OM concentration of 0.12 ± 0.04 μg m–3 (Table 1).
Three cruises had half or more of the aMA samples classified as aPMA because of their similar composition, with an average of 78 (±6)% hydroxyl, 10 (±4)% alkane, 6 (±2)% amine, and 7 (±5)% OFG (Table 1). Campaign mass averages for OFG of aPMA were within one standard deviation of each other, but we note here that the acid group standard deviation was high relative to the average (Winter: 1 ± 4%, Late Spring: 8 ± 7%, and Autumn: 10 ± 17%). The aPMA and aMA filters have high acid group mass concentration in Late Spring and Autumn, whereas Winter and Early Spring (aMA only) showed little to no acid group mass concentration (Table 1). Since the Early Spring aMA category included only one sample, this result is not assumed to be representative of the entire season. The aPMA composition is generally comparable to measurements from prior North Atlantic and Arctic sampling (Russell et al., 2010), with the hydroxyl group mass ranging from 70 to 85% followed by alkane group masses ranging from roughly 5 to 10%, and amine groups ranging from 5 to 8% (Table 1). More specifically, the NAAMES aPMA filters were slightly more enriched in hydroxyl groups and slightly more depleted in alkane groups in comparison to values reported for ocean cruises in Frossard et al. (2014) (Western Atlantic in 2012, North Atlantic and Arctic in 2008, and the Eastern Pacific in 2010 and 2011), which had an average hydroxyl mass of 65 ± 12% and alkane mass of 21 ± 9%.
The spectral averages of aPMA for each NAAMES cruise are similar to each other with cosine similarity values ranging from 0.89 to 0.94 (Supplementary Table 6). Winter had consistent spectra with the highest cosine similarities and low standard deviation (0.97 ± 0.02), whereas Autumn was more similar to other seasons (0.9 ± 0.08) than to itself (0.82 ± 0.1, Supplementary Table 6). These high cosine similarities result from the spectral characteristics of the <1 μm filters, which were similar for all seasons. The NAAMES aPMA seasonal averages show a persistent maximum hydroxyl peak at 3,380 cm–1 (Figure 2), which is consistent with the aPMA hydroxyl peak location identified previously (Frossard et al., 2014). C–H alkane absorption was present for all seasons, with the 2,925 cm–1 peak consistently being the sharpest peak throughout the alkane region (Figure 2). As expected given the aPMA selection criteria, the aPMA spectra had a cosine similarity >0.9 for <1 μm filters (thus OFG mass fractions from different seasons were within one standard deviation of each other) (Supplementary Table 6). This result is somewhat surprising given that the biological conditions corresponding to the aPMA filters were highly variable between seasons and that chlorophyll concentrations ranged from 0.2 in Autumn to 5.3 mg C m–3 in Late Spring (Behrenfeld et al., 2019; Fox et al., 2020).
The relative invariability between seasons of aPMA composition (Figure 2) is consistent with the hypothesis that the organic fraction of aPMA is influenced more by dissolved organic carbon (DOC) than particulate organic carbon (POC) (Quinn et al., 2014; Kieber et al., 2016; Bates et al., 2020), as DOC is a larger and less variable fraction of ocean carbon than is POC (Hansell et al., 2009).
gPMA Composition and Seasonal Differences
Average <1 μm OM concentrations of gPMA normalized to Na showed a maximum during Autumn (0.93 ± 0.3) and a minimum in Late Spring (0.47 ± 0.16) (Supplementary Table 5). gPMA composition was relatively constant, with the hydroxyl group having the largest amount of OM relative to the quantified OM for all four seasons. Autumn had the highest average gPMA hydroxyl organic functional group mass (87 ± 5%) and Early Spring had the lowest (61 ± 22%) (Supplementary Table 5). The average gPMA alkane group mass varied from 8 to 27% of the quantified OM, with a maximum in Early Spring. Average amine group mass varied from 5 to 12% for gPMA. The <1 and <1.1 μm gPMA had the highest hydroxyl contribution to masses in Autumn (87 and 86%, respectively) and the highest alkane group contributions to masses in Early Spring (27 and 22%, respectively). The <0.18 μm filters also had the highest OM contribution during Autumn (0.85 ± 0.71). The highest hydroxyl group concentration for <0.18 μm gPMA filters (83 ± 5%) was observed during Early Spring (Supplementary Table 5).
Campaign average values of OM/Na for <1.1 μm gPMA (Supplementary Table 5) showed that Autumn was statistically different from the other seasons (p < 0.01, Supplementary Table 9). Less than 0.18 μm gPMA filters had no seasons that were statistically different and only Late Spring compared to Autumn was statistically different for <1 μm gPMA filters (p < 0.01, Supplementary Table 9). While these differences were statistically significant, within-campaign standard deviations for each size class were greater than observed between-campaign (i.e., seasonal) differences. Additionally, gPMA number size distributions and cloud condensation nuclei (CCN) activity exhibited campaign averages varied less between seasons than within seasons (Bates et al., 2020). However, the low number of samples with OFG above detection during each season (Supplementary Table 5) means that such averages may not be statistically representative of each season.
The gPMA samples had a large range of average OFG fractions and OM/Na values and, statistically, the 1.1 μm Autumn OM/Na was significantly different than the other campaigns (p < 0.01). However, the variations within each campaign were larger, on average, than the differences between seasons for all sizes.
Discussion
Here we discuss the seasonal carboxylic acid group contribution in aMA and aPMA filters and their possible sources, compare the composition of different sized aPMA samples, and investigate the effect of latitude on organic functional group composition. Finally, we compare and contrast gPMA and aPMA composition to identify the extent to which gPMA accounts for the composition of aPMA.
aPMA and aMA Carboxylic Acid Group Contribution
Carboxylic acid groups were only present in 1 of 8 aMA filters in Winter and 0 of 1 in Early Spring, but they were present in 5 of 5 aMA filters in Late Spring and 2 of 5 in Autumn. This difference between seasons was also present in the aPMA filters, where only 1 of 8 filters in Winter contained acid groups, whereas 3 of 3 in Late Spring and 1 of 3 in Autumn had detectable acid group mass. The average aPMA acid group concentration for Winter (0.002 μg m–3) was an order of magnitude less than the Late Spring average (0.027 μg m–3), and the average acid group mass concentration in Autumn was 0.014 μg m–3. There is a large standard deviation in the average acid group mass fraction for the <1 μm aPMA and aMA filters in Late spring and Autumn (Table 1). While some carboxylic acids are measured in seawater (Gagosian and Stuermer, 1977), seawater concentrations (relative to Na) that have been reported are much lower than what could be measured by FTIR for either ambient or Sea Sweep. This finding suggests that the measured acid groups have an atmospheric source. The lack of carboxylic acid groups in gPMA and presence of a substantial acid group fraction in aMA and aPMA for Late Spring and Autumn both support a secondary source. A strong correlation with the carboxylic acid group fraction of OM and photosynthetically active radiation (PAR) above 100 Wm–2 was found in a previous study, indicating recent formation of secondary organic aerosol (SOA) (Frossard et al., 2014). The carboxylic acid group concentration for aMA from NAAMES had a weak (r = 0.26) correlation with PAR above 100 W m–2 (Supplementary Figure 1). This weak correlation to sunlight may have been caused by conditions during NAAMES being less homogeneous regionally than during previously reported studies (Frossard et al., 2014). In addition, there could have been a longer or variable time lag between photooxidation and acid group mass concentrations that would have prevented a correlation (Gantt et al., 2011). NAAMES also had a large range of locations, sea surface temperature, biological activity, and other variables that could have confounded an acid-group-to-PAR relationship.
Black carbon (BC) can be a useful anthropogenic tracer since it is a combustion product that has no natural ocean source. The range of correlations between BC and carboxylic acid group mass concentration varies from no correlation (r = −0.01) in Early Spring to moderate correlation (r = 0.58) in Late Spring (Supplementary Figure 4). The inconsistency of this correlation could indicate that the acid group is associated with local ship emissions in Late Spring but not in Early Spring or Autumn, or it could suggest a greater contribution from transported continental emissions. Marine and mixed filters had high correlations of acid group mass concentration with nitrate mass concentration (marine filters r = 0.80, mixed filters r = 0.71), but continental filters had only weak correlations (r = 0.20) (Supplementary Figure 8). The clean marine atmosphere has few sources of nitrate (Prospero et al., 1995; Jickells et al., 2003), making it likely that the nitrates are from continental sources or ship emissions. Gaseous nitrate radicals could be contributing to the acid group concentrations present in the aPMA filters by oxidizing larger unsaturated hydrocarbons or fatty acids (Kawamura and Gagosian, 1987; Monks, 2005). It is interesting that the acid group is negligible in the continental air masses in both Winter and Early Spring, but the acid group fraction is present in all ambient filter categories (aPMA, aMA, mixed, and continental) for both the Late Spring and Autumn (Table 1). The acid group mass concentration weakly correlates with PAR and strongly correlates with nitrate concentration (Supplementary Figures 1, 8). Since nitrate likely has continental sources that are co-located with continental VOCs, this correlation is consistent with SOA with some contribution from continental sources. Together, these results show that the carboxylic acid group is likely SOA resulting from continental VOCs reacting in the marine atmosphere during sunny seasons.
aPMA and gPMA Size Differences
Three different sizes of ambient aerosol particles (<0.18, <0.5, and <1 μm) were collected simultaneously and analyzed during the NAAMES campaigns. The aPMA subset was classified based on back-trajectory restrictions and high spectral similarity with the Frossard et al. (2014) aPMA cluster of <1 μm filters. The <0.18 and <0.5 μm samples were identified as aPMA if they were concurrent with <1 μm aPMA filters, where we defined concurrent as start and stop times within 2 h. There were eight aPMA filters in Winter for <1 μm, but only two of those had times in which all sizes were sampled. The other seasons had the same number of <1 μm and smaller size aPMA samples. All three size filters generally have the same four OFG: hydroxyl, alkane, amine, and acid groups, but in varying relative amounts. For paired sets of samples, the <0.18 and <0.5 μm filters often have sharp double-peaked alkane group absorbances, but the hydroxyl group absorbance was frequently below detection for the <0.18 μm filters.
The <1 μm filters have higher cosine similarity values within each season (0.82, 0.94, 0.97 from Supplementary Table 8) and lower standard deviations (<0.1) than do the filters in the smaller sizes, which had lower cosine similarity values for Late Spring and Autumn (<0.8, Supplementary Table 8). Not surprisingly, cosine similarity values were below 0.9 for six of the seven comparisons between different size cuts (Figure 3 and Supplementary Table 8). There is a lot of variability within the individual seasons of <0.18 and <0.5 μm spectra with lower cosine similarity values and higher standard deviations (Supplementary Table 8). The smaller size cut filters were more similar with higher cosine similarities (>0.9) during Late Spring. The low cosine similarity values of the smaller samples indicates that the OFG composition is more varied filter-to-filter than the <1 μm filters, which is likely due to a more dynamic mixture of sources including sea spray, long-range transport, and local ship emissions.
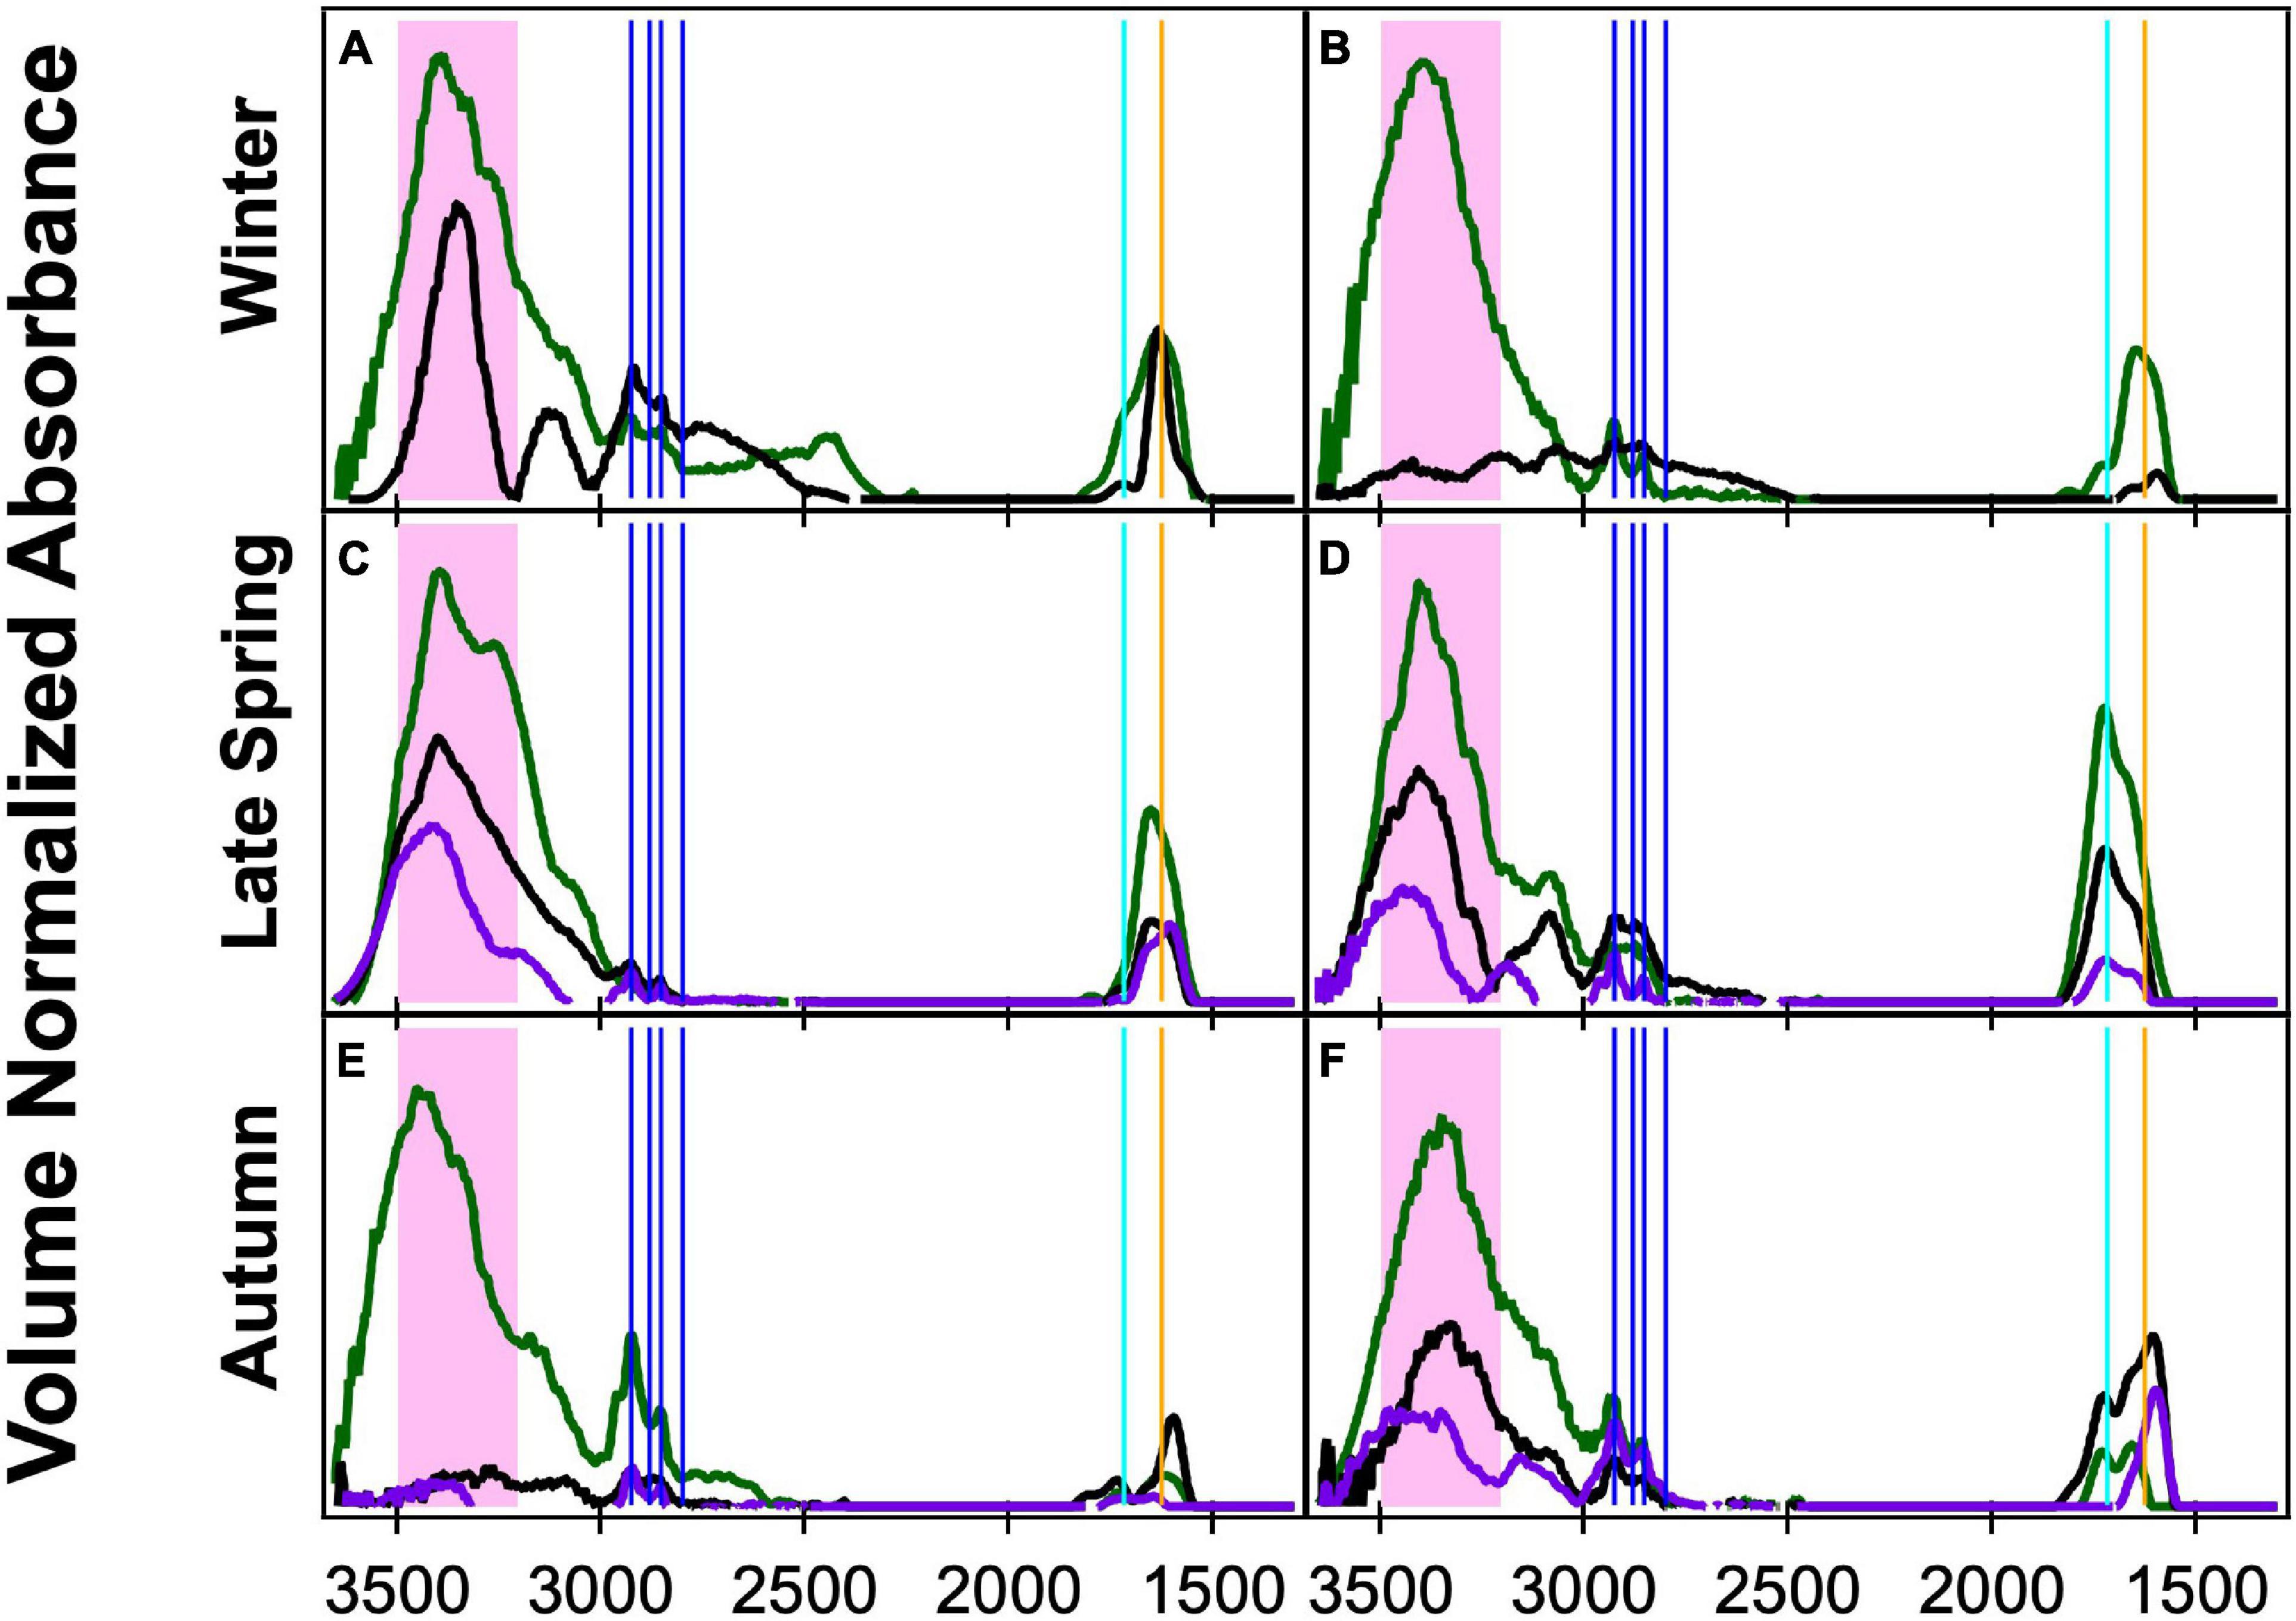
Figure 3. Fourier transform infrared spectroscopy (FTIR) spectra normalized by volume of concurrently sampled filters in three size ranges: <1 μm (green), <0.5 μm (black), and <0.18 μm (purple) during clean marine periods. The spectral peak locations for the OFG are indicated with the hydroxyl region in the shaded pink area, four alkane peaks (vertical blue lines), carbonyl (both acidic and non-acidic, vertical teal line), and amine (vertical orange line). The times of sampling are as follows: (A) 11/12/15 10:00–11/13/15 8:00, (B) 11/24/15 22:00–11/25/15 8:00, (C) 5/15/16 10:00–5/17/16 8:00, (D) 6/1/16 10:50–6/2/16 9:00, (E) 9/9/17 8:00–9/10/17 7:00, and (F) 9/17/17 8:00–9/18/17 7:00.
Ocean biogenic sources from a variety of campaigns included high relative amounts of oxidized functional groups, with hydroxyl being the largest functional group by relative mass (typically >50% of quantified OM being hydroxyl group mass) (Russell et al., 2011). The similarity in composition among the gPMA filters in which the OFG fraction averages are within one standard deviation of each other, regardless of size (except for the <0.18 μm Winter filter, Supplementary Table 5), suggests that there is not a clear size-related difference in gPMA composition when the particles are initially emitted, although the OM/Na ratio is generally lower for <0.18 μm relative to <1 and <1.1 μm size cuts.
Differences in composition between the simultaneously collected filters at different sizes may be due to sizes smaller than 1 μm being disproportionately affected by sources other than sea spray. Higher variability in cosine similarity values for the <0.5 and <0.18 μm aPMA filters indicates that the smaller particles may be more influenced by a mix of sea spray, long-range transport, and regional ship emissions than by more homogeneous ocean sea spray sources.
Latitudinal Dependence
To investigate whether regional effects, such as weather and phytoplankton bloom dynamics, could be influencing composition, samples from individual days were binned by low and high latitude with a cutoff of 47°N latitude (Bolaños et al., 2020; Fox et al., 2020). The 47°N latitude cutoff was chosen because it was close to the average latitude (47.5°N) of the Winter, Late Spring, and Autumn cruises (Early Spring was excluded from this average since it started at a much lower average latitude). The median <1 μm gPMA OM/Na above 47°N showed a maximum during Autumn and a minimum during Winter (Figure 4). However, the low latitude gPMA showed little to no change between seasons, with less variability within each campaign (Figure 4). The median value of OM/Na in Autumn is higher than the standard deviation of the other seasons for high latitudes, but this difference is not seen in the low or combined latitudes. The higher variability and fewer seasonal differences at low latitudes means that the differences at high latitudes are dampened in the combined average. Additionally, there are more samples below 47°N than above, which also weights the combined average toward the low latitude results of no seasonal differences. In addition to OM/Na, three other variables were separated by latitude to investigate seasonal differences: hydroxyl group mass (%), amine group mass (%), and the ratio of alkane group mass to hydroxyl group mass. Unlike OM/Na, there is no seasonal difference in these other variables at the high latitudes, as all medians fall within the standard deviations of the other seasons (Figure 4). Some minor differences with latitude are evident, although the variability within the campaigns may be masked by the project averages. The differences in OM/Na medians between high and low latitudes persist when the campaigns are separated by project median latitude rather than 47°N, indicating that the lack of seasonality in the combined average is not a result of the higher number of low-latitude samples (Supplementary Figure 2).
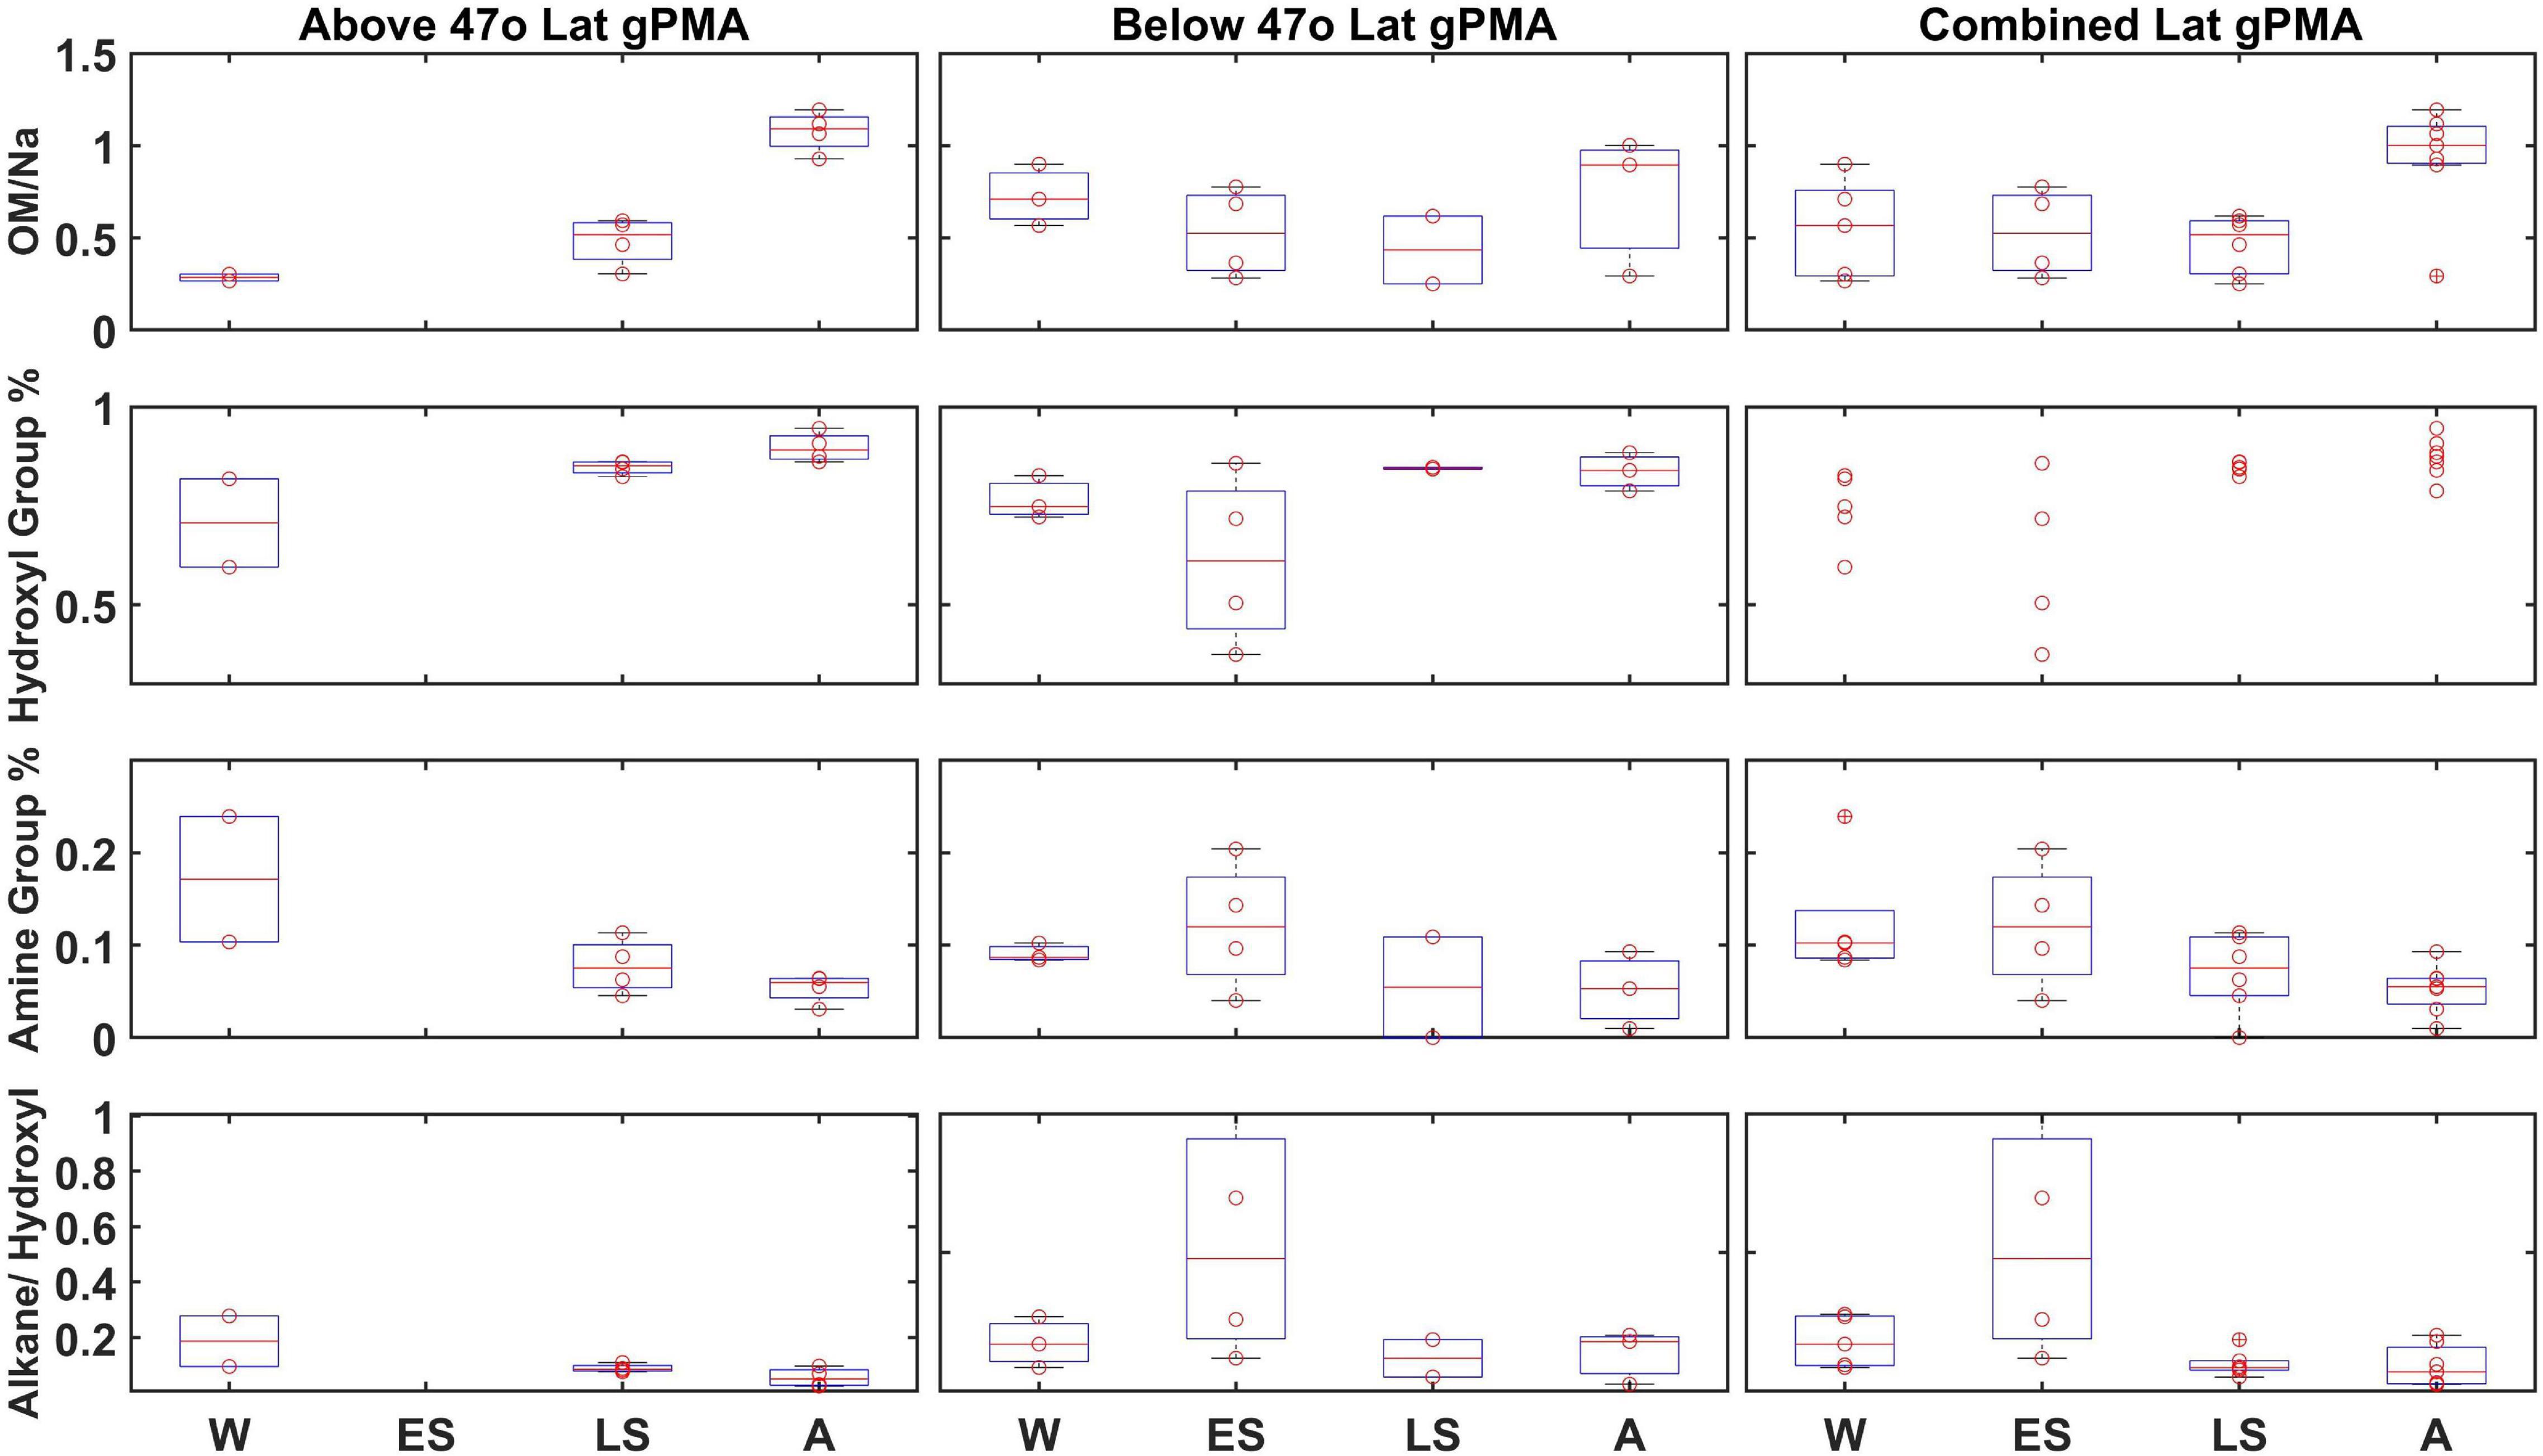
Figure 4. Less than 1 μm gPMA OM, normalized by Na, hydroxyl group percentage, amine group percentage, and alkane group percentage divided by hydroxyl group percentage (top to bottom) from each campaign (W, Winter; ES, Early Spring; LS, Late Spring; and A, Autumn): above 47°N, 47°N or below, and with no latitudinal separation (left to right). There were no filters above 47°N for Early Spring. The data are presented as box-whisker plots. The solid red line is the median and boxes cover the 25–75% percentile in the data. Red circle datapoints (individual measurements) are shown on top of box plots.
The aPMA and aMA OM seasonal medians were all within their standard deviations when separated by latitude (Supplementary Tables 6, 7). The lack of difference in ambient samples could reflect the more direct relationship between seawater properties and aerosol composition in gPMA, whereas aPMA and aMA filters are not produced where sampling occurs, leading to a less direct relationship to seawater properties. Differences between gPMA results at low and high latitudes suggests that the ocean properties at these different latitudes (SST, phytoplankton composition, etc.) could drive some differences in sea spray composition, but more localized sampling for longer time periods would be needed to substantiate those trends.
gPMA and aPMA Comparison
The <1 μm NAAMES gPMA and aPMA filters have cosine similarity >0.85 within each cruise (Supplementary Table 7). The similarity of gPMA and aPMA to each other supports the idea that aPMA mass is largely sea spray aerosol during these seasons. The <1 μm gPMA and aPMA have similar spectral shapes, with a prominent hydroxyl peak at 3,380 cm–1 (Figure 2) and most of the quantified organic mass being attributed to the hydroxyl group (72–87%, Table 1 and Supplementary Table 5). The <0.18 μm gPMA filters also have the largest mass contribution from the hydroxyl group (60–83%, Supplementary Table 5). The alkane group peaks in the <0.18 μm gPMA filters are visually sharper than in the <1 μm gPMA filters, but in both cases the alkane group mass contributions are substantially smaller than the hydroxyl group mass when the former is above the detection limit. There are only three <0.18 μm aPMA filters that are above the OM detection limit and those three filters have hydroxyl groups as the largest OFG by mass as well (Figure 5). The <0.18 μm gPMA and aPMA have high cosine similarity during Late Spring (>0.8), but lower values during Autumn (<0.7) (Supplementary Table 7). This is reflected in the <1 μm gPMA and aPMA comparison as well, although the Autumn difference is not as pronounced.
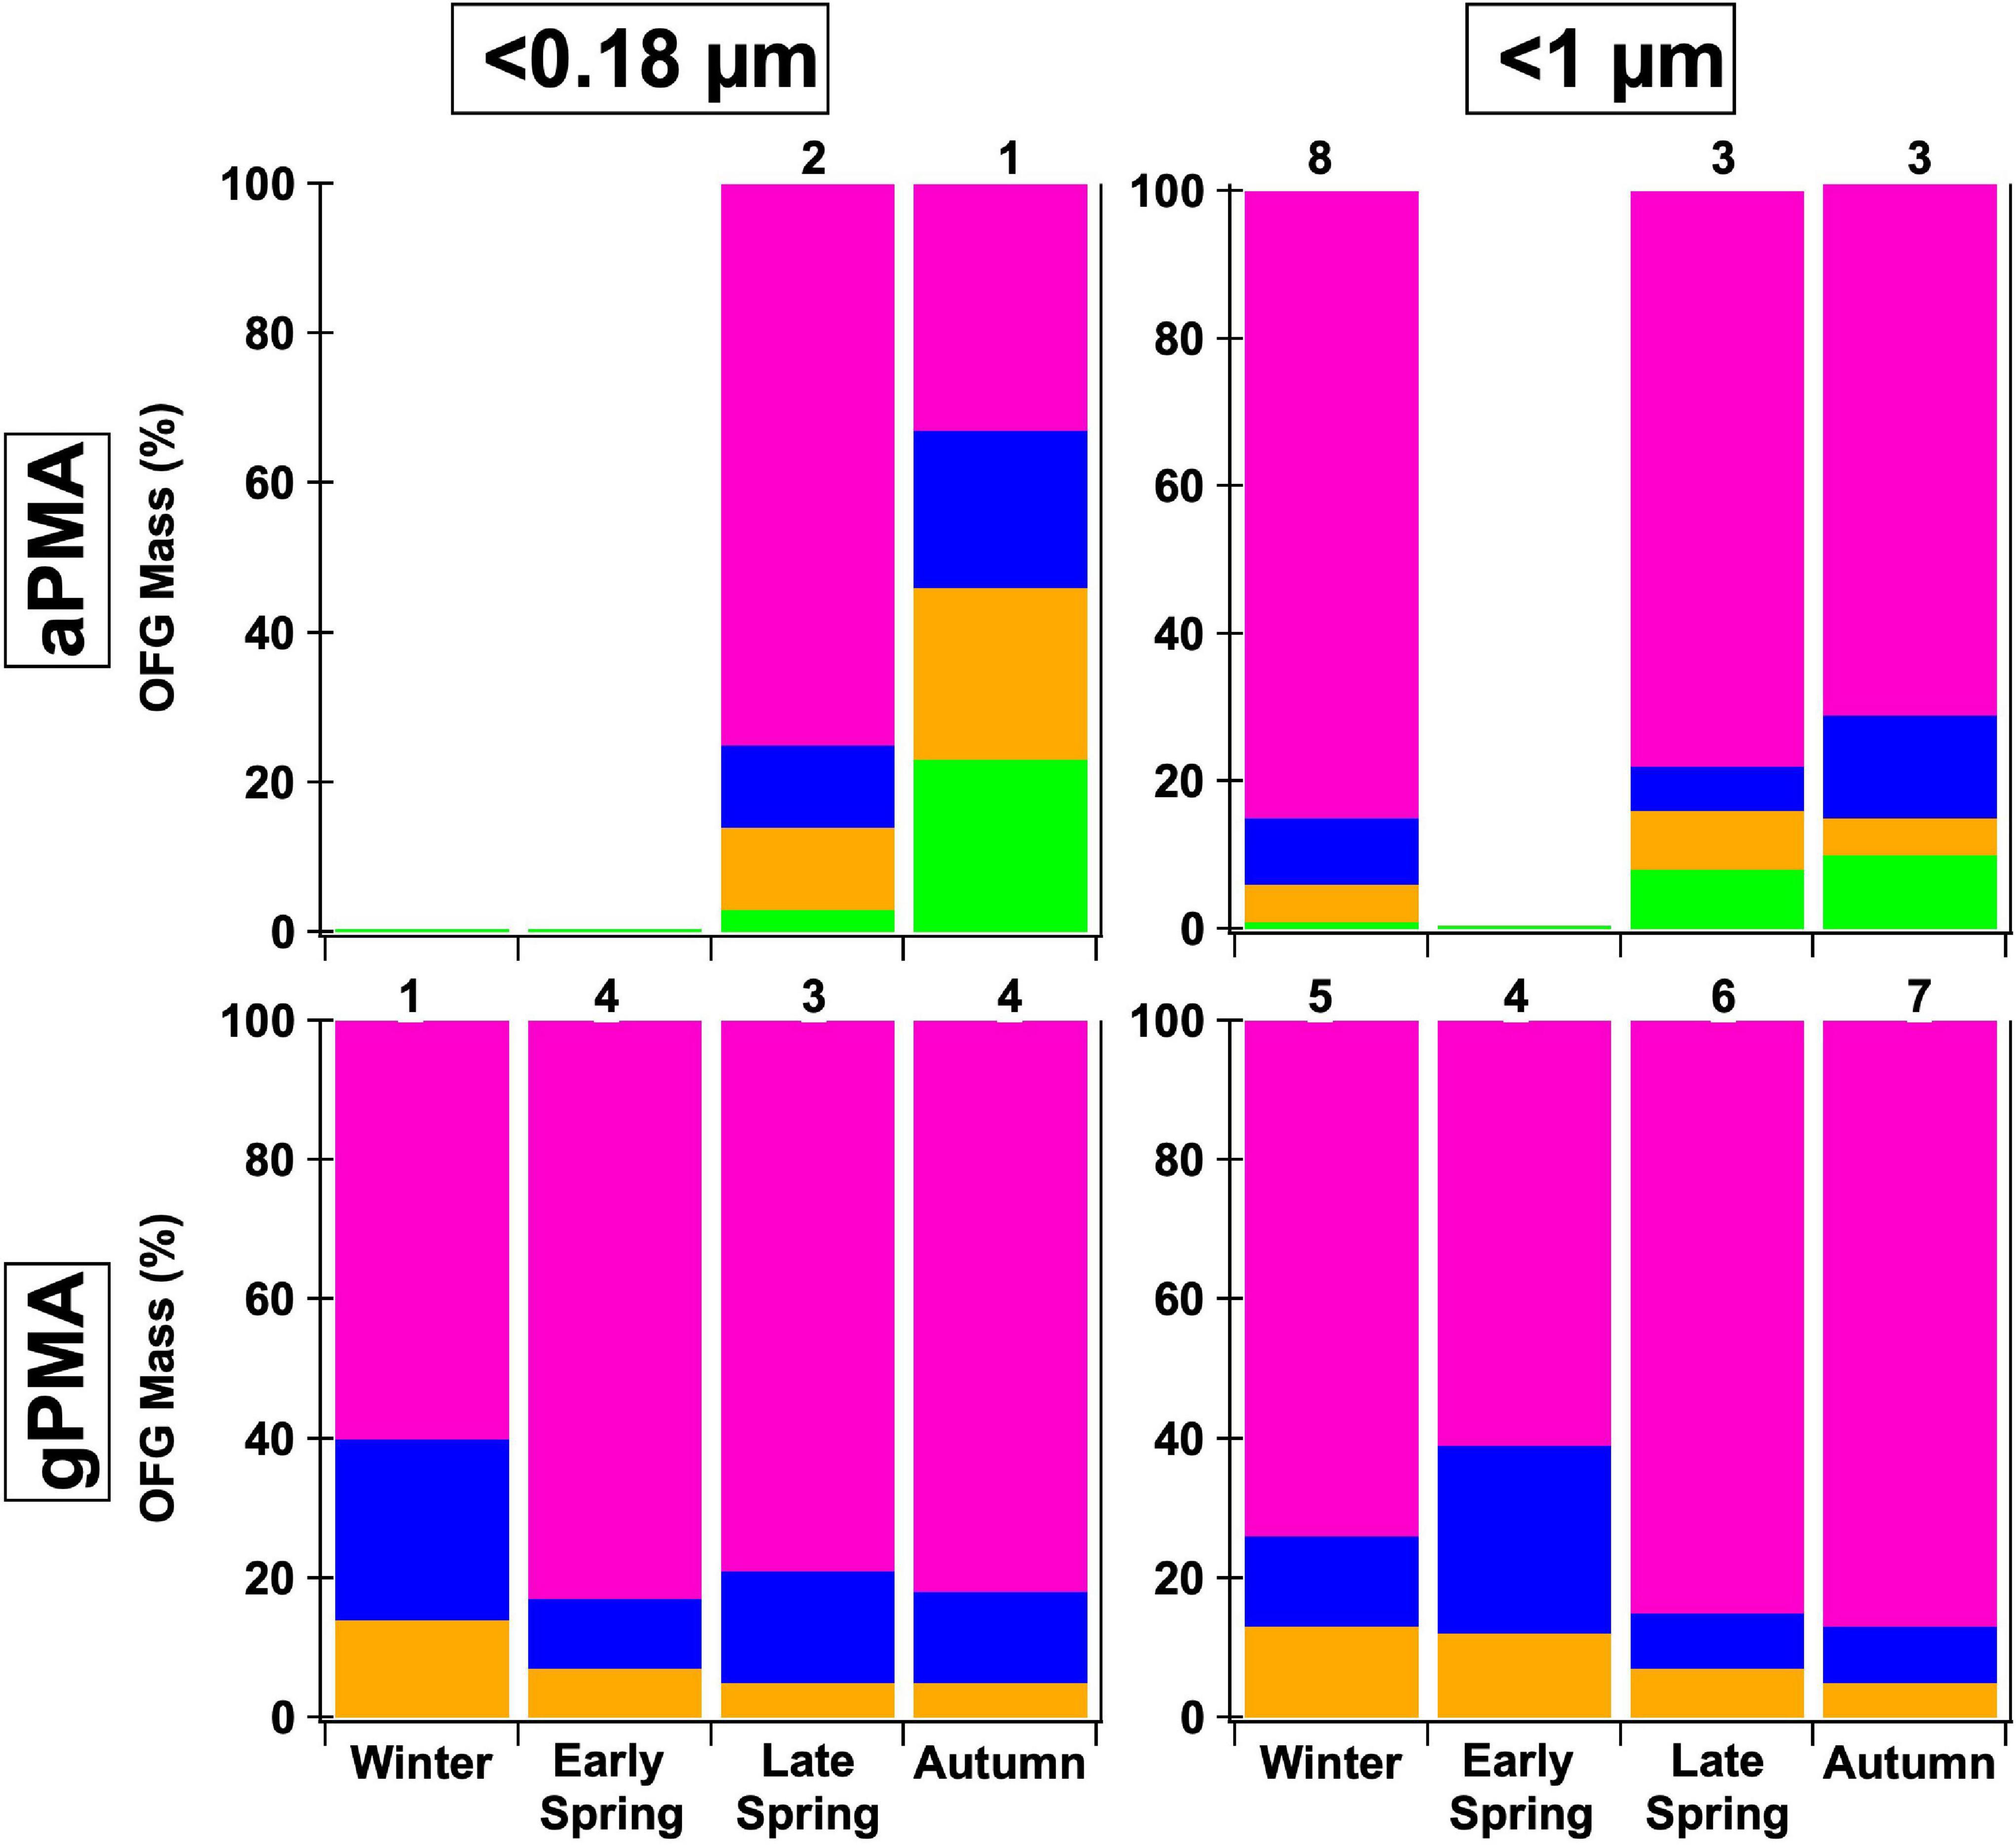
Figure 5. Comparison of two sizes, <0.18 and <1 μm, and two different sampling methods—ambient (aPMA) and generated (gPMA) throughout the four seasons. The average composition percentage is shown with the following functional groups: hydroxyl (pink), alkane (blue), amine (orange), and acid (green) groups. Less than 0.18 μm aPMA filters have a larger alkane group fraction than the gPMA filters whereas <1 μm filters have similar alkane group fractions in both aPMA and gPMA. Numbers above each bar indicate the number of samples available for each average. Less than 0.5 μm aPMA filters are not included because there are no complementary <0.5 μm gPMA.
When comparing gPMA and aPMA, the gPMA for sizes <0.18 and <1 μm shows a more consistent composition of three functional groups (hydroxyl, alkane, and amine groups), with hydroxyl group mass comprising over 75% of the quantified OM for the majority of samples (Figure 5). There were more samples in the gPMA category than the aPMA category due to the limited sampling of clean air masses. The aPMA subset showed more variability in composition than the gPMA filters, including the consistent presence of four functional groups (hydroxyl, alkane, amine, and acid groups), with hydroxyl groups ranging from 30 to 85% of the quantified mass for the <0.18 μm samples (Figure 5). The <1 μm aPMA and gPMA hydroxyl group mass fraction throughout the seasons are within 10% of each other, whereas the average hydroxyl group mass fractions are 20% different between the <0.18 μm gPMA and aPMA (81 and 61%, Figure 5). The similarity in composition between the <1 μm aPMA and gPMA samples indicates the aPMA is often representative of freshly emitted sea spray. The <0.18 μm aPMA and gPMA were similar, but not as consistent as the <1 μm pairing, further supporting the interpretation that <0.18 μm aPMA variability reflects a mixture of sea spray and transported continental components.
Conclusion
Three seasons of <1 μm aPMA OM in the North Atlantic had similar composition: the hydroxyl group was consistently the largest by mass at 78 (±6)% of the quantified organic mass, followed by 10 (±4)% for the alkane group, 6 (±2)% for the amine group, and 7 (±5)% for the carboxylic acid group. The aPMA OFG mass fractions were within the standard deviation of each other for all seasons, as expected given the selection criteria. OM concentrations of aMA and aPMA were not significantly different from each other (p > 0.01), suggesting that there are not strong seasonal differences in the organic mass contribution to aPMA in the North Atlantic. The aMA filters showed a wider range of OFG composition than aPMA, reflecting contributions from more non-marine sources.
The different sizes for the aPMA filters (<0.18, <0.5, and <1 μm) yielded samples with similar composition, where the majority of organic mass consisted of hydroxyl groups, followed by alkane, amine, and carboxylic acid groups. The <0.18 and <0.5 μm filters showed more variability within the filters in those size cuts than between different sizes. The variability in spectra during marine periods for <0.18 and <0.5 μm filters was larger than for the <1 μm filters, suggesting that these two smaller size cuts were likely a mixture of combustion and marine sources. This is consistent with the fact that the <0.18 and <0.5 μm particles are smaller and have longer lifetimes, making them more likely to have contributions from a variety of sources. Characterizing seasonal changes in organic composition for different sizes in the remote marine environment would require additional observations to quantify how the composition of the smaller sizes of aPMA and gPMA differ from that of the <1 μm size fraction.
Average gPMA composition was consistent across the four seasons when all latitudes were included, however there was a large range of OM/Na concentrations during each season. When the gPMA samples were separated by latitude, low latitudes (<47°N) showed negligible differences in OM/Na between seasons, but high latitudes (>47°N) showed a maximum in Autumn, with a median value that exceeded the medians of the other seasons by more than one standard deviation. The lack of change at lower latitudes in the North Atlantic is consistent with the smaller seasonal changes in sea surface temperatures and Chl a at these latitudes. The seasonal difference for high latitudes provides some caution against combining both high and low latitude regions, as this may hide the more northerly seasonal dependence. Regardless, a longer latitude-constrained time series would be needed to unravel such process-based regional differences in this dynamic area of the North Atlantic Ocean.
Data Availability Statement
The datasets presented in this study can be found in online repositories. The names of the repository/repositories and accession number(s) can be found below: All NAAMES data: https://naames.larc.nasa.gov; Scripps measurements: https://library.ucsd.edu/dc/collection/bb34508432; Shipboard measurements: https://seabass.gsfc.nasa.gov/.
Author Contributions
SL led the analysis of the FTIR spectra and the writing of this manuscript. LR provided review of results and their interpretation, as well as manuscript editing. GS, PQ, TB, and MB provided supporting measurements and editorial comments. All authors contributed to the article and approved the submitted version.
Funding
This work was funded by NASA NAAMES grant NNX15AE66G and SL was supported by the National Science Foundation Graduate Research Fellowship. This is PMEL contribution number 5258.
Conflict of Interest
The authors declare that the research was conducted in the absence of any commercial or financial relationships that could be construed as a potential conflict of interest.
Publisher’s Note
All claims expressed in this article are solely those of the authors and do not necessarily represent those of their affiliated organizations, or those of the publisher, the editors and the reviewers. Any product that may be evaluated in this article, or claim that may be made by its manufacturer, is not guaranteed or endorsed by the publisher.
Acknowledgments
The authors would like to thank the dedicated officers and crew of the R/V Atlantis. The authors would also like to acknowledge Laura Ravelin, Chia-Li Chen, Raghu Betha, Derek Price, Maryam Askari Lamjiri, Derek Coffman, and Lucia Upchurch for their contributions to collecting and reducing data.
Supplementary Material
The Supplementary Material for this article can be found online at: https://www.frontiersin.org/articles/10.3389/fmars.2021.720208/full#supplementary-material
References
Aller, J. Y., Radway, J. C., Kilthau, W. P., Bothe, D. W., Wilson, T. W., Vaillancourt, R. D., et al. (2017). Size-resolved characterization of the polysaccharidic and proteinaceous components of sea spray aerosol. Atmos. Environ. 154, 331–347. doi: 10.1016/j.atmosenv.2017.01.053
Bahadur, R., Uplinger, T., Russell, L. M., Sive, B. C., Cliff, S. S., Millet, D. B., et al. (2010). Phenol Groups in Northeastern U.S. Submicrometer Aerosol Particles Produced from Seawater Sources. Environ. Sci. Technol. 44, 2542–2548. doi: 10.1021/es9032277
Bates, T. S., Quinn, P., Frossard, A., Russell, L., Kieber, D. J., Jani, H., et al. (2012). Measurements of ocean derived aerosol off the coast of California. J. Geophys. Res. Atmosph. 117:D00V15. doi: 10.1029/2012jd017588
Bates, T. S., Quinn, P. K., Coffman, D. J., Johnson, J. E., Upchurch, L., Saliba, G., et al. (2020). Variability in Marine Plankton Ecosystems Are Not Observed in Freshly Emitted Sea Spray Aerosol Over the North Atlantic Ocean. Geophy. Res. Lett. 47:e2019GL085938. doi: 10.1029/2019GL085938
Behrenfeld, M. J., Behrenfeld, M. J., Moore, R. H., Hostetler, C. A., Graff, J. R., Gaube, P., et al. (2019). The North Atlantic Aerosol and Marine Ecosystem Study (NAAMES): science Motive and Mission Overview. Front. Mar. Sci. 6:122. doi: 10.3389/fmars.2019.00122
Blanchard, D. C. (1964). Sea-to-Air Transport of Surface Active Material. Science 146:396. doi: 10.1126/science.146.3642.396
Bolaños, L. M., Karp-Boss, L., Choi, C. J., Worden, A. Z., Graff, J. R., Haëntjens, N., et al. (2020). Small phytoplankton dominate western North Atlantic biomass. ISME J. 14, 1663–1674. doi: 10.1038/s41396-020-0636-0
Carlson, C. A., Ducklow, H. W., and Michaels, A. F. (1994). Annual flux of dissolved organic carbon from the euphotic zone in the northwestern Sargasso Sea. Nature 371, 405–408. doi: 10.1038/371405a0
Collins, D. B., Ault, A. P., Moffet, R. C., Ruppel, M. J., Cuadra-Rodriguez, L. A., and Guasco, T. L. (2013). Impact of marine biogeochemistry on the chemical mixing state and cloud forming ability of nascent sea spray aerosol. J. Geophys. Res. Atmos. 118, 8553–8565. doi: 10.1002/jgrd.50598
Draxler, R. R., and Hess, G. (1998). An overview of the HYSPLIT_4 modelling system for trajectories. Austr. Meteorol. Mag. 47, 295–308.
Facchini, M. C., Rinaldi, M., Decesari, S., Carbone, C., Finessi, E., Mircea, M., et al. (2008). Primary submicron marine aerosol dominated by insoluble organic colloids and aggregates. Geophys. Res. Lett. 35:L17814. doi: 10.1029/2008gl034210
Fox, J., Behrenfeld, M. J., Haëntjens, N., Chase, A., Boss, K. S. J., Karp-Boss, L., et al. (2020). Phytoplankton Growth and Productivity in the Western North Atlantic: observations of Regional Variability From the NAAMES Field Campaigns. Front. Mar. Sci. 7:24. doi: 10.3389/fmars.2020.00024
Frossard, A. A., and Russell, L. M. (2012). Removal of Sea Salt Hydrate Water from Seawater-Derived Samples by Dehydration. Environ. Sci. Tech. 46, 13326–13333. doi: 10.1021/es3032083
Frossard, A. A., Russell, L. M., Burrows, S. M., Elliott, S. M., Bates, T. S., and Quinn, P. K. (2014). Sources and composition of submicron organic mass in marine aerosol particles. J. Geophys. Res. Atmos. 119, 977–913. doi: 10.1002/2014JD021913
Gagosian, R. B., and Stuermer, D. H. (1977). The cycling of biogenic compounds and their diagenetically transformed products in seawater. Mar. Chem. 5, 605–632. doi: 10.1016/0304-4203(77)90045-7
Gantt, B., Meskhidze, N., Facchini, M. C., Rinaldi, M., Ceburnis, D., and O’Dowd, C. D. (2011). Wind speed dependent size-resolved parameterization for the organic mass fraction of sea spray aerosol. Atmos. Chem. Phys. 11, 8777–8790. doi: 10.5194/acp-11-8777-2011
Gaston, C. J., Furutani, H., Guazzotti, S. A., Coffee, K. R., Bates, T. S., Quinn, P. K., et al. (2011). Unique ocean-derived particles serve as a proxy for changes in ocean chemistry. J. Geophys. Res. Atmos. 116:51. doi: 10.1029/2010JD015289
Hansell, D. A., Carlson, C. A., Repeta, D. J., and Schlitzer, R. (2009). DISSOLVED ORGANIC MATTER IN THE OCEAN A CONTROVERSY STIMULATES NEW INSIGHTS. Oceanography 22, 202–211.
Hoppel, W. A., Fitzgerald, J. W., Frick, G. M., Larson, R. E., and Mack, E. J. (1990). Aerosol size distributions and optical properties found in the marine boundary layer over the Atlantic Ocean. J. of Geophys. Res. Atmos. 95, 3659–3686. doi: 10.1029/JD095iD04p03659
Jickells, T. D., Kelly, S. D., Baker, A. R., Biswas, K., Dennis, P. F., Spokes, L. J., et al. (2003). Isotopic evidence for a marine ammonia source. Geophys. Res. Lett. 30:2002GL016728. doi: 10.1029/2002GL016728
Kawamura, K., and Gagosian, R. B. (1987). Implications of ω-oxocarboxylic acids in the remote marine atmosphere for photo-oxidation of unsaturated fatty acids. Nature 325, 330–332. doi: 10.1038/325330a0
Keene, W. C., Hal, M., Maben, J. R., Kieber, D. J., Pszenny, A. A. P., Dahl, E. E., et al. (2007). Chemical and physical characteristics of nascent aerosols produced by bursting bubbles at a model air-sea interface. J. Geophys. Res. Atmos. 112:D21202. doi: 10.1029/2007JD008464
Kieber, D. J., Keene, W. C., Frossard, A. A., Long, M. S., Maben, J. R., Russell, L. M., et al. (2016). Coupled ocean-atmosphere loss of marine refractory dissolved organic carbon. Geophys. Res. Lett. 43, 2765–2772. doi: 10.1002/2016gl068273
Lawler, M., Lewis, S., Russell, L., Quinn, P., Bates, T., Coffman, D., et al. (2020). North Atlantic marine organic aerosol characterized by novel offline thermal desorption mass spectrometry approach: polysaccharides, recalcitrant material, secondary organics. Atmos. Chem. Phys. 20, 16007–16022. doi: 10.5194/acp-2020-562
Leck, C., Gao, Q., Mashayekhy Rad, F., and Nilsson, U. (2013). Size-resolved atmospheric particulate polysaccharides in the high summer Arctic. Atmos. Chem. Phys. 13, 12573–12588. doi: 10.5194/acp-13-12573-2013
Liu, J., Russell, L. M., Lee, A. K. Y., McKinney, K. A., Surratt, J. D., and Ziemann, P. J. (2017). Observational evidence for pollution-influenced selective uptake contributing to biogenic secondary organic aerosols in the southeastern U.S. Geophys. Res. Lett. 44, 8056–8064. doi: 10.1002/2017GL074665
Liu, S., Liu, C. C., Froyd, K. D., Schill, G. P., Murphy, D. M., Bui, T. P., et al. (2021). Sea spray aerosol concentration modulated by sea surface temperature. Proc. Natl. Acad. Sci. 118:e2020583118. doi: 10.1073/pnas.2020583118
Mansour, K., Decesari, S., Facchini, M. C., Belosi, F., Paglione, M., Sandrini, S., et al. (2020). Linking Marine Biological Activity to Aerosol Chemical Composition and Cloud-Relevant Properties Over the North Atlantic Ocean. J. Geophys. Res. Atmos. 125:e2019JD032246. doi: 10.1029/2019JD032246
Maria, S. F., Russell, L. M., Turpin, B. J., and Porcja, R. J. (2002). FTIR measurements of functional groups and organic mass in aerosol samples over the Caribbean. Atmos. Environ. 36, 5185–5196. doi: 10.1016/s1352-2310(02)00654-4
Meskhidze, N., Petters, M. D., Tsigaridis, K., Bates, T., O’Dowd, C., Reid, J., et al. (2013). Production mechanisms, number concentration, size distribution, chemical composition, and optical properties of sea spray aerosols. Atmos. Sci. Lett. 14, 207–213. doi: 10.1002/asl2.441
Monks, P. S. (2005). Gas-phase radical chemistry in the troposphere. Chem. Soc. Rev. 34, 376–395. doi: 10.1039/b307982c
O’Dowd, C. D., Facchini, M. C., Cavalli, F., Ceburnis, D., Mircea, M., Decesari, S., et al. (2004). Biogenically driven organic contribution to marine aerosol. Nature 431, 676–680. doi: 10.1038/nature02959
Ovadnevaite, J., Ceburnis, D., Leinert, S., Dall’Osto, M., Canagaratna, M., O’Doherty, S., et al. (2014). Submicron NE Atlantic marine aerosol chemical composition and abundance: seasonal trends and air mass categorization. J. Geophys. Res. Atmos. 119, 11,850–11,863. doi: 10.1002/2013jd021330
Prather, K. A., Seinfeld, J. H., Hersey, S., and Mui, W. (2013). Bringing the ocean into the laboratory to probe the chemical complexity of sea spray aerosol. Proc. Natl. Acad. Sci. U. S. A. 110, 7550–7555. doi: 10.1073/pnas.1300262110
Prospero, J. M., Savoie, D. L., Arimoto, R., Olafsson, H., and Hjartarson, H. (1995). Sources of aerosol nitrate and non-sea-salt sulfate in the Iceland region. Sci. Total Environ. 160–161, 181–191. doi: 10.1016/0048-9697(95)04355-5
Quinn, P. K., Bates, T. S., Coffman, D. J., Upchurch, L., Johnson, J. E., Moore, R., et al. (2019). Seasonal Variations in Western North Atlantic Remote Marine Aerosol Properties. J. Geophys. Res. Atmos. 124, 14240–14261. doi: 10.1029/2019JD031740
Quinn, P. K., Bates, T. S., Schulz, K. S., Coffman, D. J., Frossard, A. A., Russell, L. M., et al. (2014). Contribution of sea surface carbon pool to organic matter enrichment in sea spray aerosol. Nat. Geosci. 7, 228–232. doi: 10.1038/ngeo2092
Randles, C., Russell, L., and Ramaswamy, V. (2004). Hygroscopic and optical properties organic sea salt aerosol and consequences for climate forcing. Geophys. Res. Lett. 31:L16108. doi: 10.1029/2004GL020628
Rinaldi, M., Fuzzi, S., Decesari, S., Marullo, R., Santoleri, R., Provenzale, A., et al. (2013). Is chlorophyll-a the best surrogate for organic matter enrichment in submicron primary marine aerosol? J. Geophys. Res. Atmos. 118, 4964–4973. doi: 10.1002/jgrd.50417
Russell, L. M. (2003). Aerosol Organic-Mass-to-Organic-Carbon Ratio Measurements. Environ. Sci. Technol. 37, 2982–2987. doi: 10.1021/es026123w
Russell, L. M., Bahadur, R., Hawkins, L. N., Allan, J., Baumgardner, D., Quinn, P. K., et al. (2009a). Organic aerosol characterization by complementary measurements of chemical bonds and molecular fragments. Atmos. Environ. 43, 6100–6105. doi: 10.1016/j.atmosenv.2009.09.036
Russell, L. M., Takahama, S., Liu, S., Hawkins, L. N., Covert, D. S., Quinn, P. K., et al. (2009b). Oxygenated fraction and mass of organic aerosol from direct emission and atmospheric processing measured on the R/V Ronald Brown during TEXAQS/GoMACCS 2006. J. Geophys. Res. Atmos. 114. doi: 10.1029/2008jd011275
Russell, L. M., Bahadur, R., and Ziemann, P. J. (2011). Identifying organic aerosol sources by comparing functional group composition in chamber and atmospheric particles. Proc. Natl. Acad. Sci. 108:3516. doi: 10.1073/pnas.1006461108
Russell, L. M., Hawkins, L. N., Frossard, A. A., Quinn, P. K., and Bates, T. S. (2010). Carbohydrate-like composition of submicron atmospheric particles and their production from ocean bubble bursting. Proc. Natl. Acad. Sci. U. S. A. 107, 6652–6657. doi: 10.1073/pnas.0908905107
Russell, L. M., Huebert, B. J., Flagan, R. C., and Seinfeld, J. H. (1996). Characterization of submicron aerosol size distributions from time-resolved measurements in the Atlantic Stratocumulus Transition Experiment/Marine Aerosol and Gas Exchange. J. Geophys. Res. Atmos. 101, 4469–4478. doi: 10.1029/95JD01372
Saliba, G., Chen, C.-L., Lewis, S., and Russell, L. M, Quinn, P. K, Bates, T. S, et al. (2020). Seasonal Differences and Variability of Concentrations, Chemical Composition, and Cloud Condensation Nuclei of Marine Aerosol Over the North Atlantic. J. Geophys. Res. Atmos. 125:e2020JD033145. doi: 10.1029/2020JD033145
Sciare, J., Favez, O., Sarda-Estève, R., Oikonomou, K., Cachier, H., and Kazan, V. (2009). Long-term observations of carbonaceous aerosols in the Austral Ocean atmosphere: evidence of a biogenic marine organic source. J. Geophys. Res. Atmos. 114:113. doi: 10.1029/2009JD011998
Stein, S. E., and Scott, D. R. (1994). Optimization and testing of mass spectral library search algorithms for compound identification. J. Am. Soc. Mass Spect. 5, 859–866. doi: 10.1016/1044-0305(94)87009-8
Takahama, S., Johnson, A., and Russell, L. M. (2013). Quantification of Carboxylic and Carbonyl Functional Groups in Organic Aerosol Infrared Absorbance Spectra. Aerosol Sci. Technol. 47, 310–325. doi: 10.1080/02786826.2012.752065
Tsigaridis, K., Koch, D., and Menon, S. (2013). Uncertainties and importance of sea spray composition on aerosol direct and indirect effects. J. Geophys. Res. Atmos. 118, 220–235. doi: 10.1029/2012JD018165
Walpole, R. E., Myers, R. H., Myers, S. L., and Ye, K. (2012). Probability and Statistics for Engineers and Scientists. Boston: Prentice Hall.
Wan, K. X., Vidavsky, I., and Gross, M. L. (2002). Comparing similar spectra: from similarity index to spectral contrast angle. J. Am. Soc. Mass Spect. 13, 85–88. doi: 10.1016/S1044-0305(01)00327-0
Wang, X., Sultana, C. M., Jonathan, T., Hill, T. C. J., Francesca, M., Christopher, L., et al. (2015). Microbial Control of Sea Spray Aerosol Composition: a Tale of Two Blooms. ACS Central Sci. 1, 124–131. doi: 10.1021/acscentsci.5b00148
Keywords: aerosol, North Atlantic Aerosols and Ecosystems Study, seasonal, North Atlantic, marine aerosol chemical composition, Fourier transform infrared spectroscopy, organic composition
Citation: Lewis SL, Saliba G, Russell LM, Quinn PK, Bates TS and Behrenfeld MJ (2021) Seasonal Differences in Submicron Marine Aerosol Particle Organic Composition in the North Atlantic. Front. Mar. Sci. 8:720208. doi: 10.3389/fmars.2021.720208
Received: 03 June 2021; Accepted: 13 August 2021;
Published: 03 September 2021.
Edited by:
Jun Sun, China University of Geosciences Wuhan, ChinaReviewed by:
Francois L. L. Muller, National Sun Yat-sen University, TaiwanMaria Dolores Gelado-Caballero, University of Las Palmas de Gran Canaria, Spain
Copyright © 2021 Lewis, Saliba, Russell, Quinn, Bates and Behrenfeld. This is an open-access article distributed under the terms of the Creative Commons Attribution License (CC BY). The use, distribution or reproduction in other forums is permitted, provided the original author(s) and the copyright owner(s) are credited and that the original publication in this journal is cited, in accordance with accepted academic practice. No use, distribution or reproduction is permitted which does not comply with these terms.
*Correspondence: Lynn M. Russell, bG1ydXNzZWxsQHVjc2QuZWR1