 Silvia Angelini1,2*
 Enrico N. Armelloni1,3
 Ilaria Costantini1
 Andrea De Felice1
 Igor Isajlović4
 Iole Leonori1
 Chiara Manfredi5
 Francesco Masnadi1,3
 Giuseppe Scarcella1
 Vjekoslav Tičina4
 Alberto Santojanni1
- 1National Research Council, Institute for Marine Biological Resources and Biotechnology (CNR IRBIM), Ancona, Italy
- 2Fano Marine Center, The Inter-Institute Center for Research on Marine Biodiversity, Resources and Biotechnologies, Fano, Italy
- 3Department of Biological, Geological, and Environmental Sciences (BiGeA), Alma Mater Studiorum—University of Bologna, Bologna, Italy
- 4Institute of Oceanography and Fisheries, Split, Croatia
- 5Department of Biological, Geological, and Environmental Sciences (BiGeA), Marine Biology and Fisheries Laboratory, Alma Mater Studiorum—University of Bologna, Fano, Italy
The status of fishery resources in the Mediterranean Sea is critical: most of the fish and shellfish stocks are in overexploitation and only half of them are routinely assessed. This manuscript presents the use of Surplus Production Models (SPMs) as a valid option to increase the number of assessed stocks, with specific attention to the Adriatic basin. Particularly, the stock of European sprat (Sprattus sprattus), Mediterranean horse mackerel (Trachurus mediterraneus), and Atlantic horse mackerel (Trachurus trachurus) living in the Adriatic Sea have been evaluated comparing three SPMs: Catch Maximum Sustainable Yields (CMSY), Stochastic surplus Production model in Continuous Time (SPiCT), and Abundance Maximum Sustainable Yields (AMSY). The different approaches present some variations; however, they generally agree on describing all the stocks close to the reference values for both biomass and fishing mortality in the most recent year. For the European sprat, AMSY results are the most robust model for this species’ survey data allow depicting a clearer picture of the history of this stock. Indeed, for the horse mackerel species, CMSY or SPiCT results are the preferred models, since for these species landings are not negligible. Notwithstanding, age-structured assessments remain the most powerful approach for evaluating the status of resources, but SPMs have proved to be a powerful tool in a data-limited context.
Introduction
The status of fishing resources in the Mediterranean Sea is critical: less than 50% of the fish and shellfish stocks inhabiting the basin are routinely assessed and the majority of them are considered overexploited (European Environment Agency (EEA), 2019). This fact underlines the need to improve the number of stocks assessed in order to have a complete picture of the status of fishing resources within the basin. Progress has been made to reach this objective as the last FAO report about the status of the resources in the Mediterranean and the Black Sea reveals a positive trend in the number of evaluated stocks. In particular, from 18 stocks assessed in 2006 to the highest peak of 85 in 2018, corresponding to ca. 80% of the total landing reported for the Mediterranean area (FAO, 2020). This fact is of relevant importance, particularly for this area in which the multispecies nature of Mediterranean fisheries (Lleonart and Maynou, 2003), the relatively recent history in fishery management (Colloca et al., 2013; Maunder and Piner, 2015), as well as the recent commitment of Mediterranean researchers in stock assessment (Colloca et al., 2013) have not facilitated the spreading of stock assessment applications.
Generally, one of the main reasons for the low number of stock evaluations is the lack of population structure data (Free et al., 2020), which are mainly represented by age information. The determination of age, when possible, represents a time-consuming task, thus generating a potential obstacle for the application of age-structured methodology. In reality, these models are widely diffused, this is due to the possibility of using statistical methods to convert lengths into ages, and also to the wide range of available approaches that can adapt to various requirements [e.g., XSA (Shepherd, 1999), SAM (Berg et al., 2014), SS (Methot and Wetzel, 2013)]. Moreover, age-structured models produce robust estimations, since age information offers the possibility of following cohorts’ progression over time, as well as evaluating changes in fishing selectivity (Wang et al., 2014) and detecting fluctuation in spawning and recruitment (Aalto et al., 2015). In addition, these models are able to produce exhaustive results, e.g., trends of spawning stock biomass, recruitment, and fishing mortality at age, thus representing a powerful tool for evaluating the status of fisheries resources. However, to properly perform, age-based models need a wide range of input data, which are not always available. In these cases, Surplus Production Models (SPMs) represent a valid option to produce stock assessments. This type of model requires limited information, such as a time series of catch and, if available, an abundance index or effort data, and can estimate population biomass and produce evaluations of maximum sustainable yield (MSY), that is the maximum yield that the stock can sustain without affecting its long-term productivity (Sparre and Venema, 1998). These models provide also fishing mortality and biomass at the corresponding MSY level (FMSY and BMSY), which are useful to address the management objectives. Nevertheless, SPMs may be seen as a too simplistic approach that is not able to represent the complexity of population dynamics (e.g., Pedersen and Berg, 2017), as length or age data are not available or are not reliable (Punt, 2003). In these situations of data-limited context, the use of historical catch and survey or effort data is advisable (Jackson et al., 2001; Branch et al., 2011.); this will favor a truthful description of the status of the stock, as well as improving targets and limited reference points’ estimates (Gabriel and Mace, 1999).
In the last two decades, SPMs have undergone important improvements (e.g., Punt, 2003; McAllister, 2014), like the inclusion of state-space factors, that allowed them to better account for real-world variability into the biomass dynamic modeling and favored further dissemination of these models (Meyer and Millar, 1999). The state-space formulation has the advantage of including uncertainties both in observed data and in the model process, in the form of, respectively, observation and process errors, thus resulting in improved parameter estimations (Ono et al., 2012). Also, these models allow the use of priors that can facilitate and address the estimation of reliable parameters. These priors can derive from literature or expert knowledge; thus, it is important to proceed with sensitivity tests or compare different approaches to select the most appropriate configuration (Pedersen and Berg, 2017). The Abundance Maximum Sustainable Yield model (AMSY; Froese et al., 2020), the Catch Maximum Sustainable Yield model (CMSY; Froese et al., 2017), and the Stochastic surplus Production model In Continuous Time (SPiCT; Pedersen and Berg, 2017), represent some of the most novel approaches among current SPMs. They summarize all the features and improvements listed before, representing at this time a solid option for developing stock assessments in data-poor contexts.
In this manuscript, these SPMs are used for evaluating the status of some pelagic stocks which were never previously assessed in the Adriatic Sea, such as European sprat (Sprattus sprattus), Mediterranean horse mackerel (Trachurus mediterraneus), and Atlantic horse mackerel (Trachurus trachurus). This area represents an important fishing ground for the Mediterranean Sea, accounting for 15% of the total landing coming from this basin (FAO, 2020) and is also one of the most intensively fished areas in Europe and the world (Eigaard et al., 2017; Amoroso et al., 2018). In the Adriatic Sea, small pelagics, specifically anchovy (Engraulis encrasicolus) and sardine (Sardina pilchardus) account for the highest landings (FAO, 2020). In a context of high fishing activity, the increase of assessed stocks can be helpful to understand the status of the entire basin and, in this case, specifically those of the pelagic domain. The three selected species can be considered as ancillary species of the small pelagic fishery occurring in the Adriatic basin. However, they assume a certain importance as traditional food and for their commercial value as well as in the ecological context (Barausse et al., 2009). Since data are not enough to develop age-structure approaches, these species represent a good case study for developing and comparing different SPMs.
Materials and Methods
Study Area and Species Object of the Study
The study area is represented by the North Adriatic Sea, a semi-enclosed basin in the central Mediterranean Sea between Italy and the Balkan peninsula included in the Geographical Sub-Areas (GSA) 17 (General Fisheries Commission for the Mediterranean (GFCM), 2009; Figure 1). Anchovy and sardine represent the main target species of the fishing fleet operating in this area and are characterized by the use of pelagic trawlers and purse seiners. However, based on the information included in the European Union—Data Collection Framework (EU-DCF), which can be defined as the European database grouping fisheries data from all member states, the pelagic vessels fishing in the Adriatic Sea also report catches of other species, such as Mugilidae, European sprat (Sprattus sprattus), mackerels (Scombrus spp.), horse mackerels (Trachurus spp.), and others (source EU-DCF database 2019; European Commission (EC), 2017).
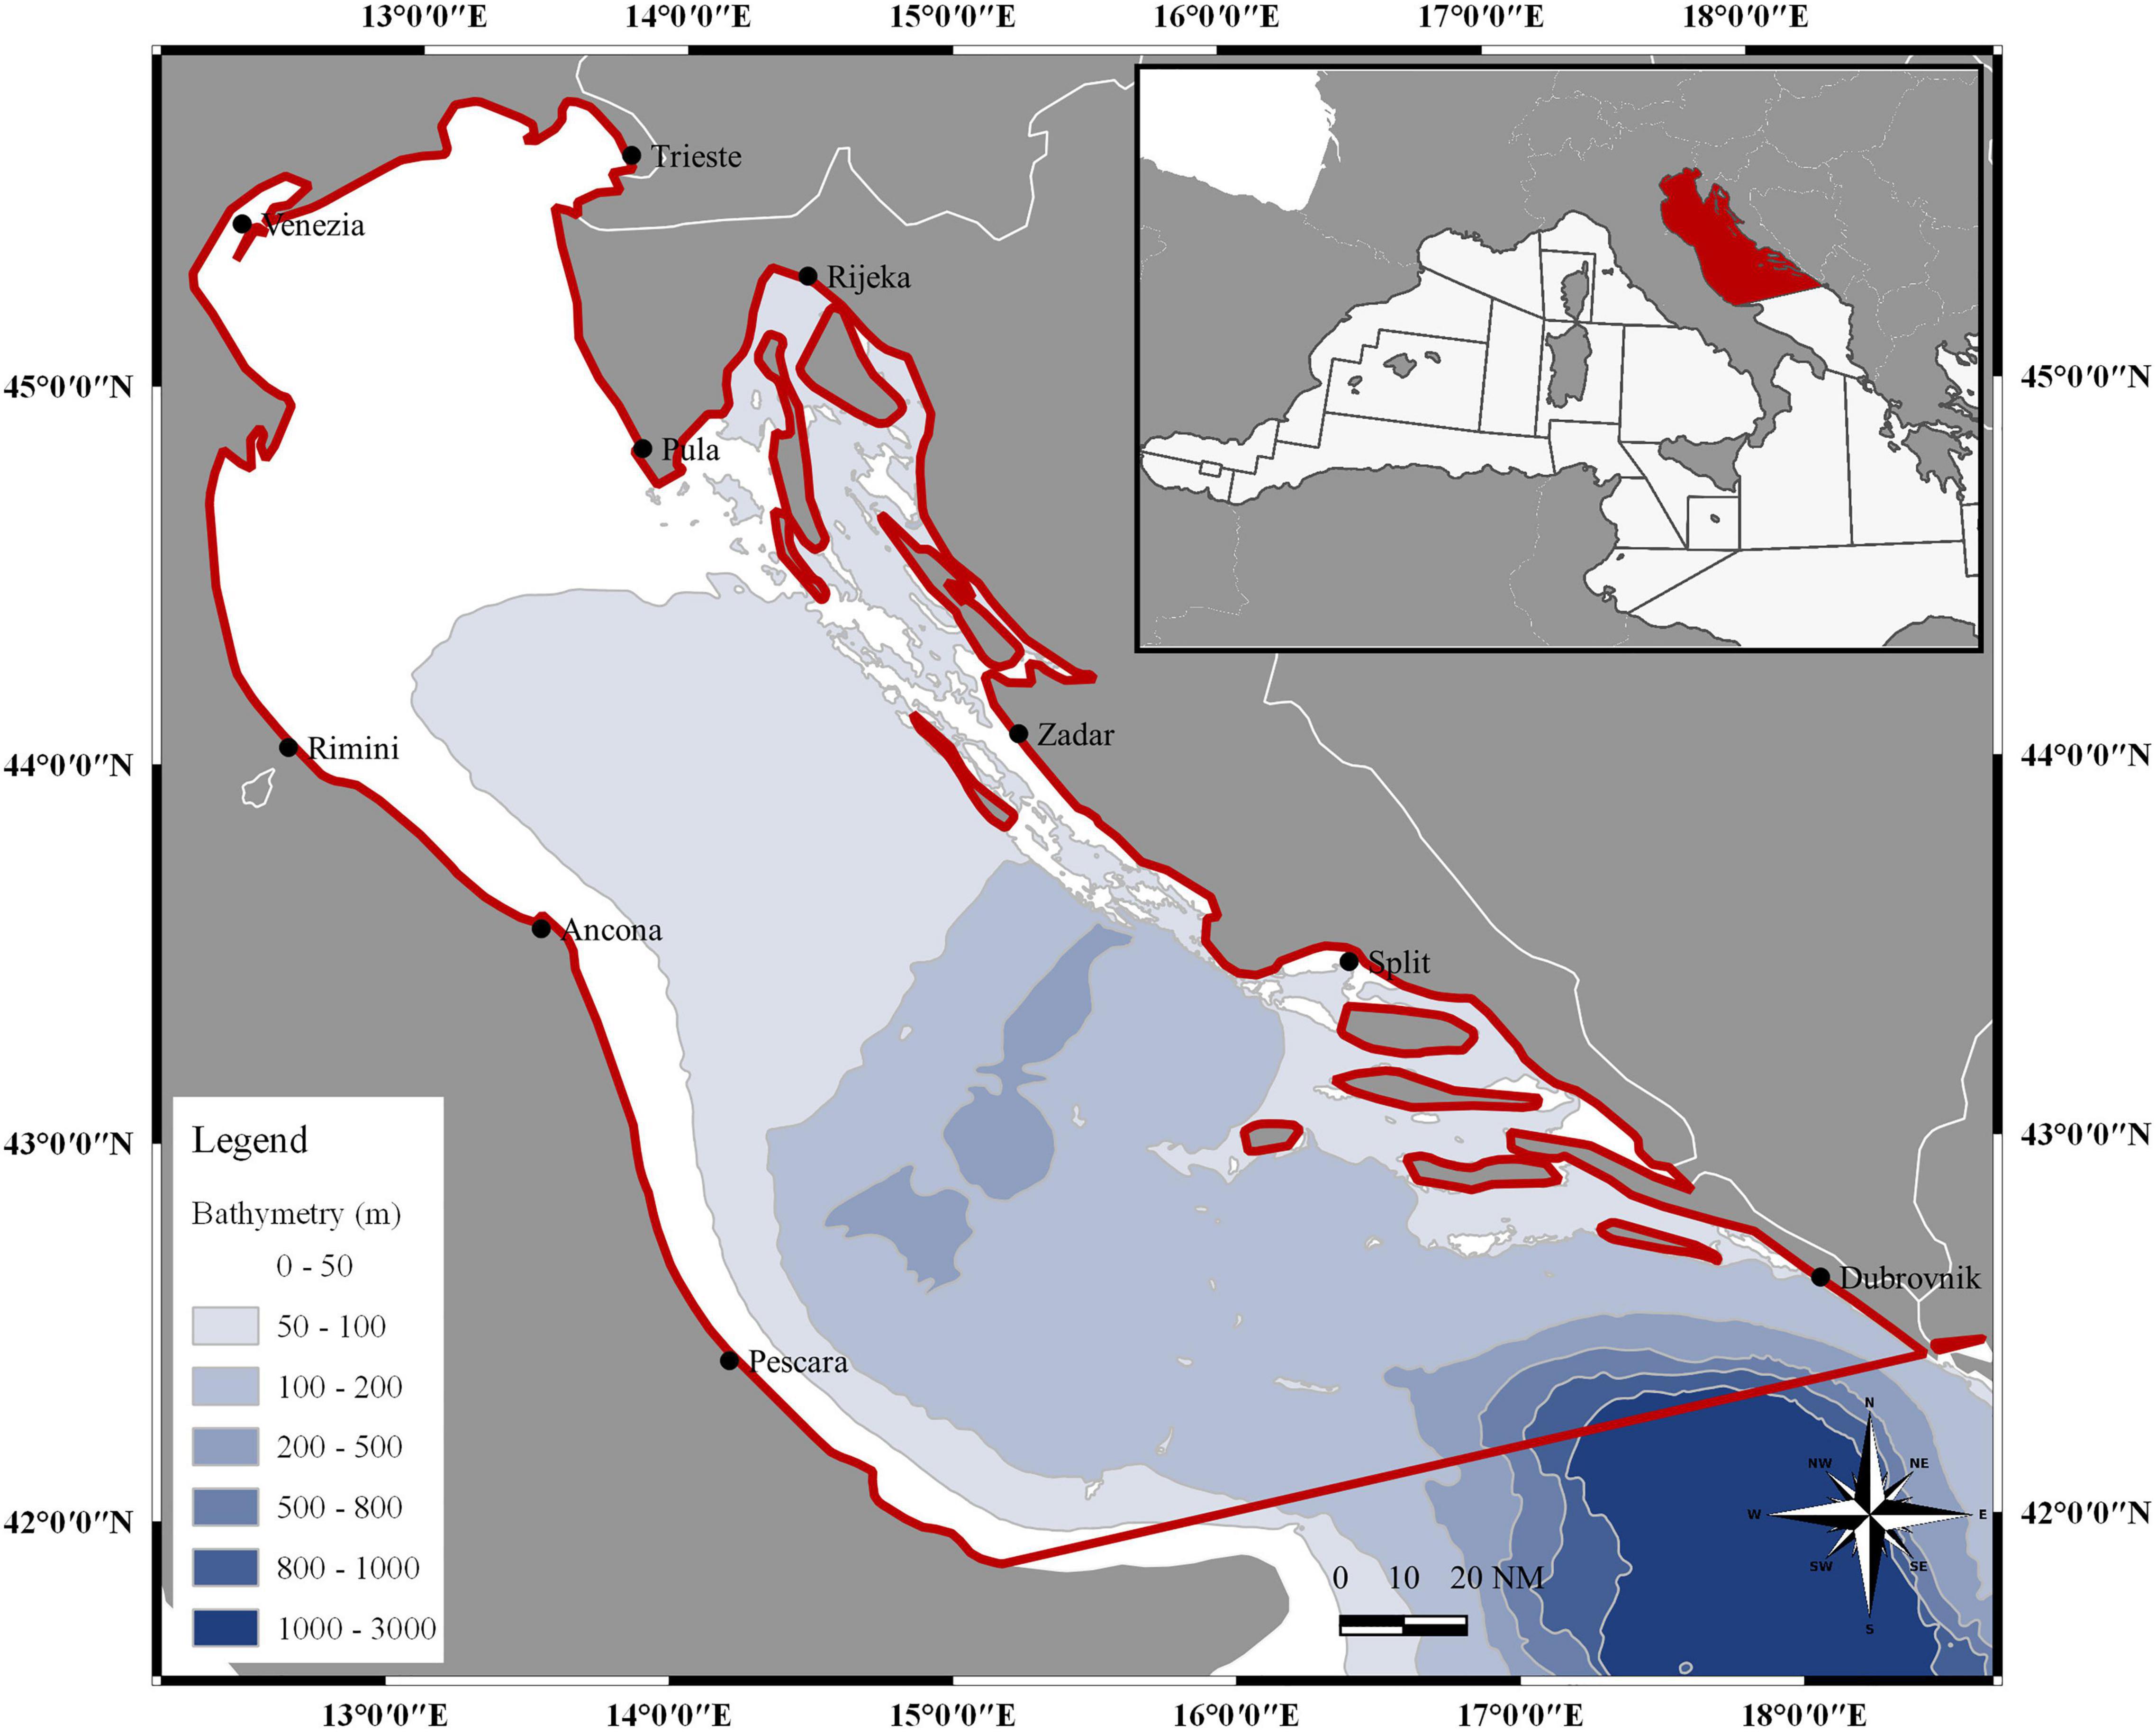
Figure 1. Map of the study area, which is defined by the red line and corresponds to the GSA 17 (Northern Adriatic Sea).
In this study European sprat, Mediterranean, and Atlantic horse mackerels are considered. European sprat (sprat, from here onward) is a pelagic species mainly fished by pelagic trawlers. In the Adriatic Sea, this species is found mainly in the northwestern area (Figure 2), where it represents a traditional food. According to data availability, landing data includes years from 2004 to 2019 for both Italy and Croatia (Figure 3, top right panel); Italian data and Croatian data since 2013 correspond to those from the EU-DCF (European Commission (EC), 2017), whereas Croatian data from 2009 to 2012 refers to Eurostat (2021) and Croatian data from 2004 to 2008 were reconstructed through a mean proportion based on the years in which landing data were available for both countries. Historical total biomass estimates (Figure 3, bottom right panel) were obtained from Italian national acoustic surveys ECHOADRI carried out since 1976 up to 2008 in the Western Adriatic Sea, and from Croatian national acoustic survey PELMON carried out from 2003 up to 2012 in the eastern part of the Adriatic Sea (Azzali et al., 2002; Tičina et al., 2006; Leonori et al., 2012, 2017). Since 2009, European national acoustic surveys are internationally coordinated in the ambit of the EU MEDiterranean International Acoustic Surveys (MEDIAS) program (MEDIAS Handbook, 2019), and since 2013 the Croatian national survey has also been part of it. The MEDIAS coordinates acoustic surveys aimed at detecting the abundance and biomass of small pelagic species, their spatial distribution and demography together with oceanographic information. The survey period is in summer (June–September), although in some years and areas it has been shifted to early autumn. The ECHOADRI and the PELMON surveys represent the ancestors of the MEDIAS survey; before 2009, no acoustic common protocol was available in European waters, however at a national level research institutes carried out acoustic investigations using a methodology comparable to the one used in the MEDIAS surveys that was derived by the harmonization of the national protocols (Leonori et al., 2021).
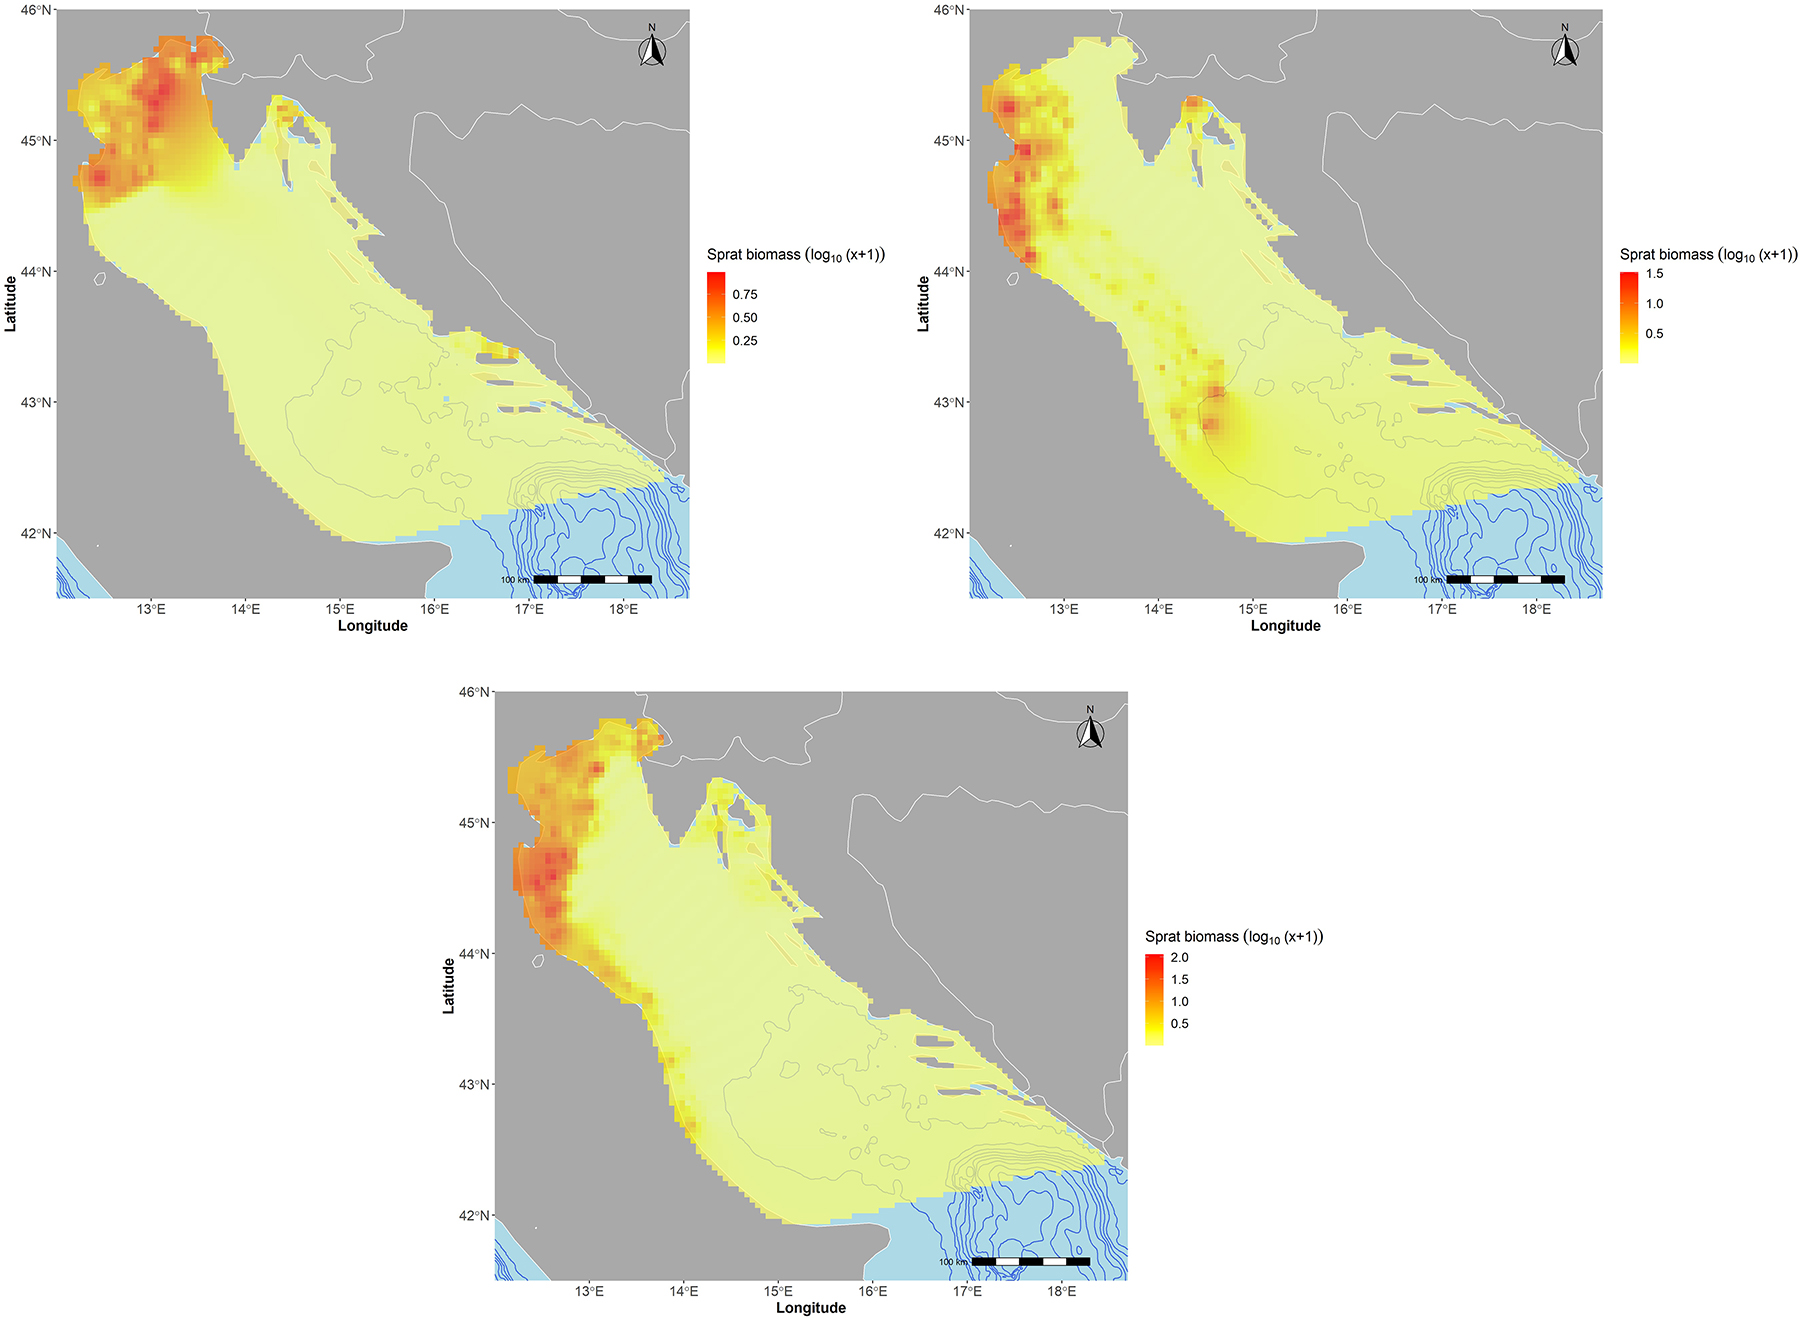
Figure 2. European sprat. Biomass distribution expressed in log10(x + 1) where x is the biomass index (tons/nm2) related to the MEDIAS survey carried out in GSA 17 East and West for years 2014 in September (top left), 2018 (top right), and 2019 (bottom) in June–July.
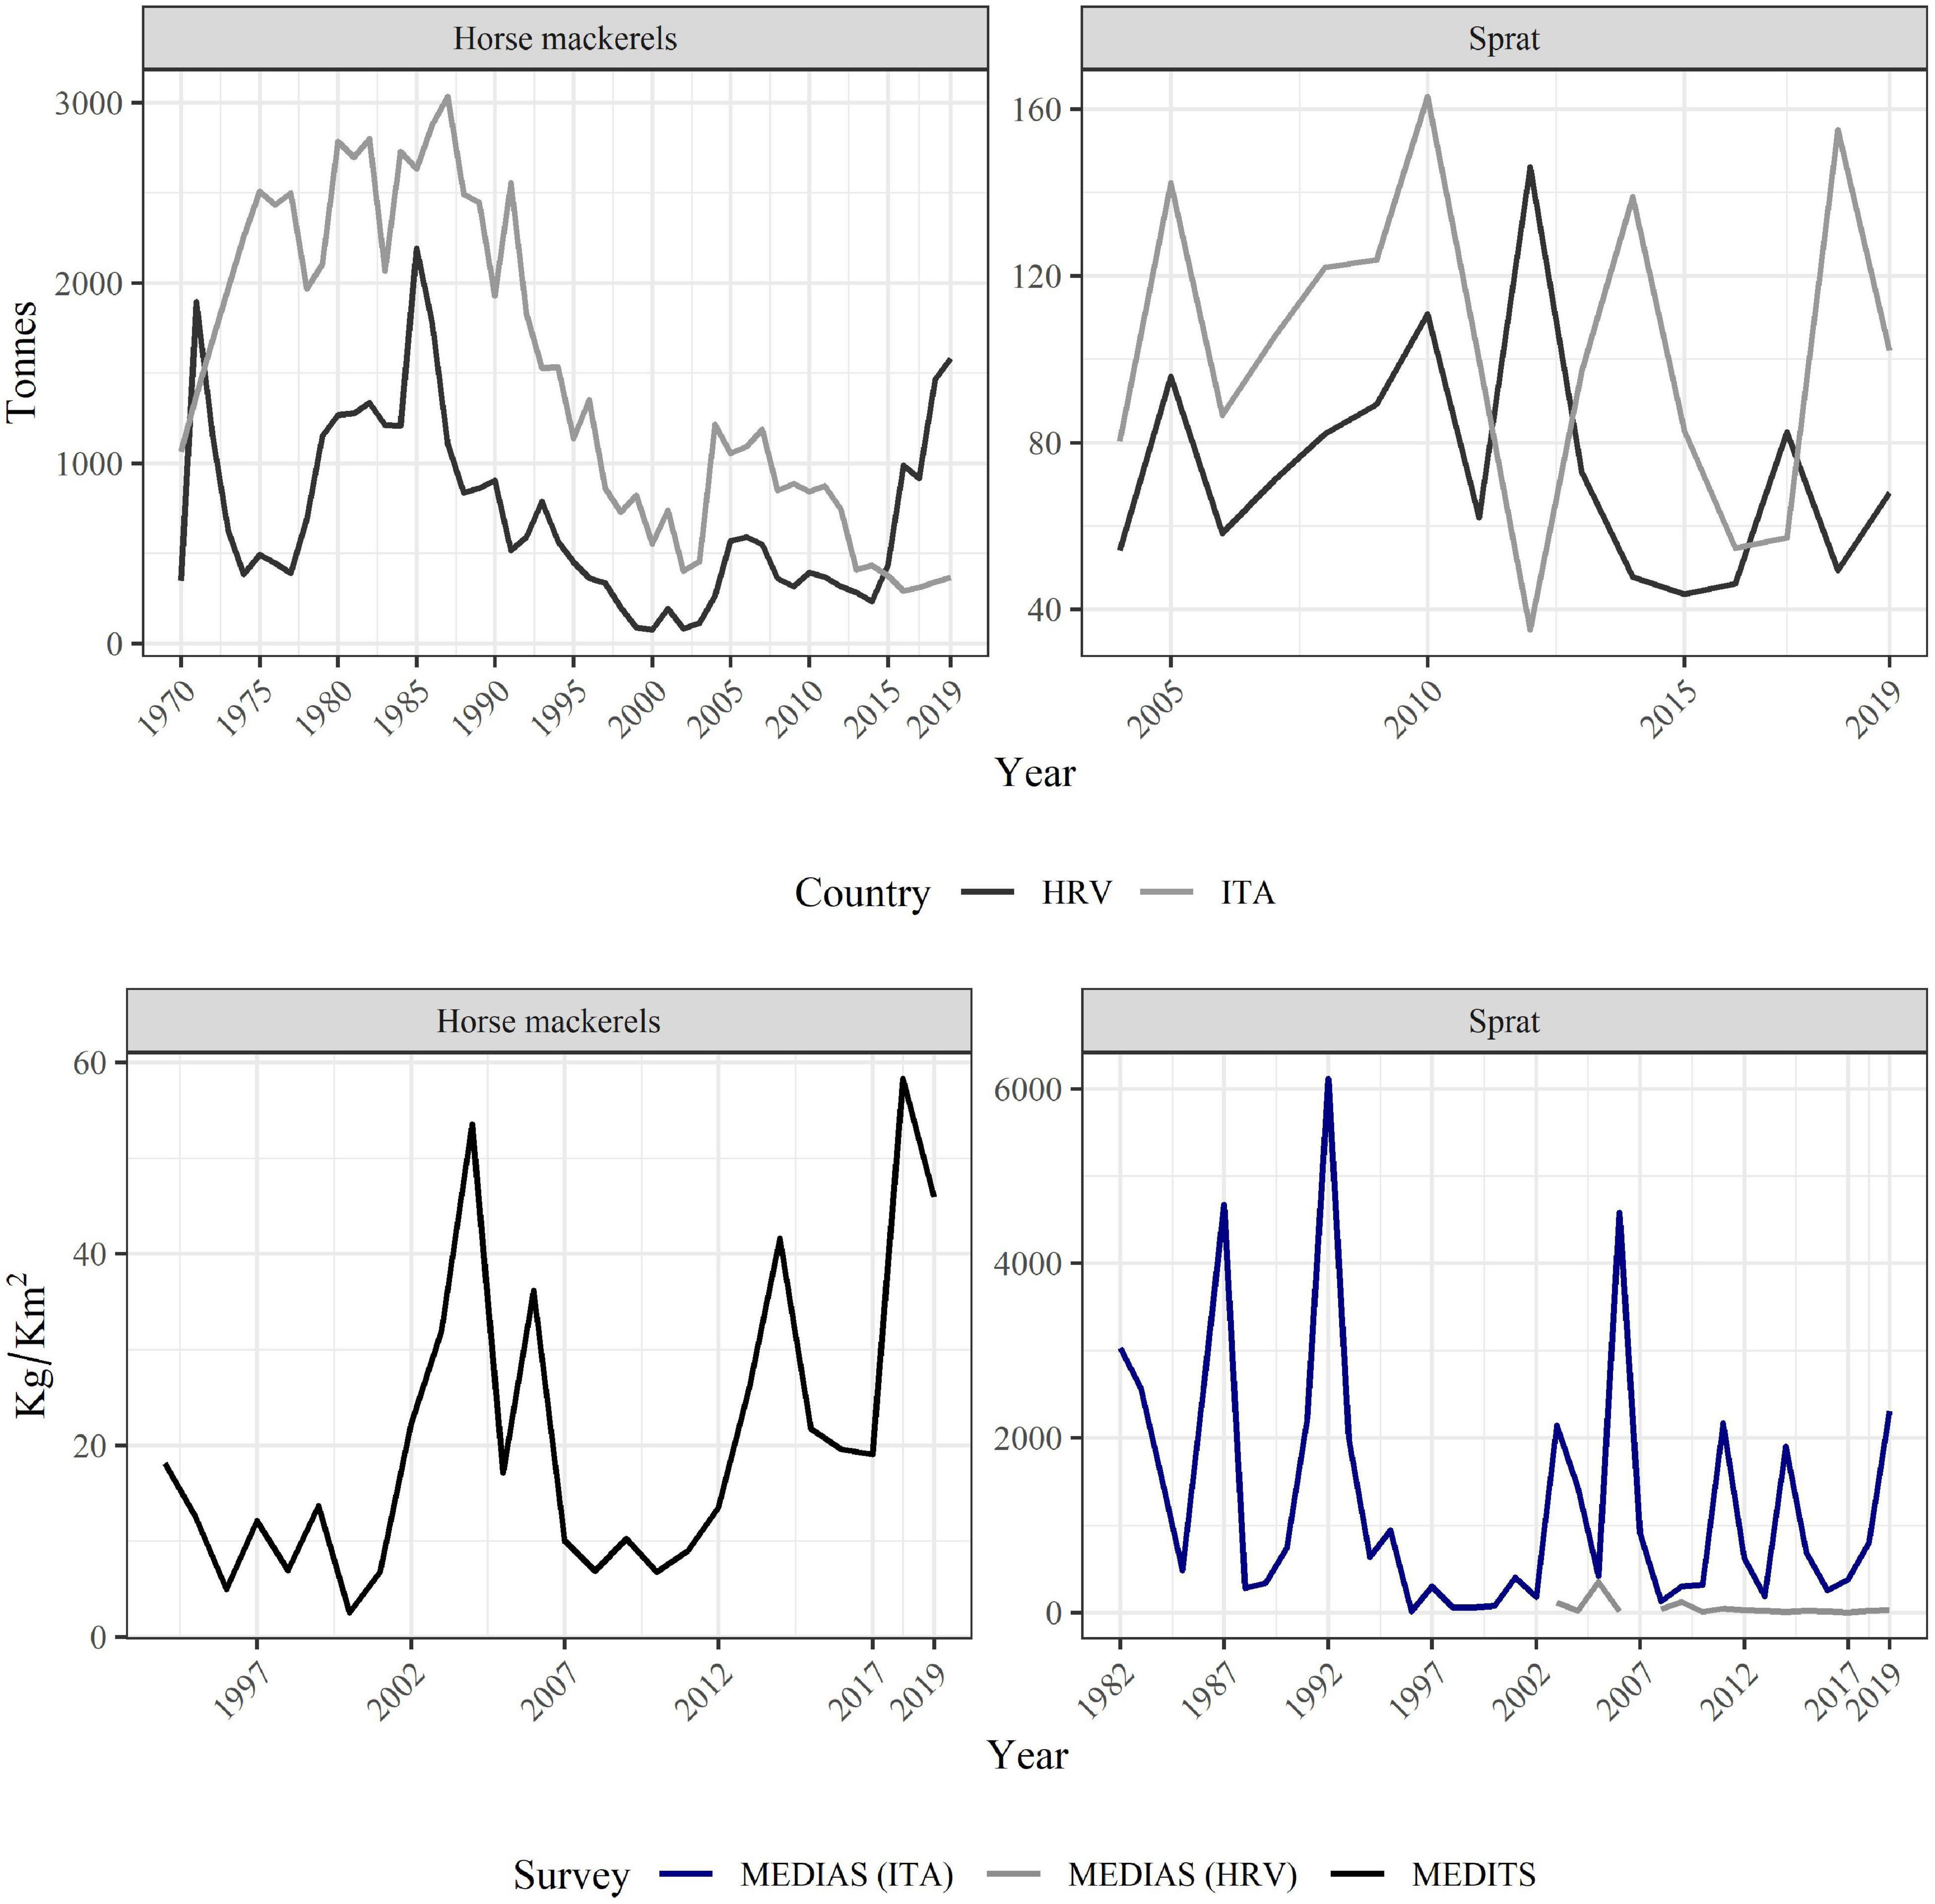
Figure 3. Top panels: landing data in tons for horse mackerel species (left side) and sprat (right side) divided by country (Croatia = HRV, black line, Italy = ITA, gray line). Bottom left panel: survey index in kg/km2 for horse mackerels from MEDITS survey (black line) including both Italy and Croatia from the year 1994 to the year 2019 (years 1994, 1995, and 1999 include only Italy). Bottom right panel: survey index in kg/km2 for European sprat from acoustic surveys (Italy: ECHOADRI from 1982 to 2008 and MEDIAS from 2009 to 2019; Croatia: PELMON from 2003 to 2012 and MEDIAS from 2013 to 2019) divided by Italy [MEDIAS (ITA)—blue line] from the year 1982 to the year 2019 (years 1984, 1986, 2002, and 2003 have been estimated) and Croatia [MEDIAS (HRV)—gray line] from the year 2003 to the year 2019.
Mediterranean and Atlantic horse mackerels (horse mackerels from here onward) are fished with different gears, mainly bottom trawlers, pelagic trawlers, and purse seiners. Although these species are semi-pelagic, they are found in surface waters but also close to the bottom, particularly the Mediterranean horse mackerel (Šantić et al., 2003; Piccinetti et al., 2012), and they are spread all over the GSA 17 (Figure 4). In this work, these two species are considered as a unique stock, since most of the landings are confounded: at the beginning of the time series, landings are reported at genus level without any indication on how to divide them by species. While in the most recent years, landings at the species level are available but unreliable, because only information relating to one of the two species is reported at year. Also, notwithstanding that these species show some differences in growth as well as in their depth distribution (Šantić et al., 2002, 2003; Piccinetti et al., 2012), these are not so relevant that they suggest avoiding this assumption. According to data availability, landing data includes years from 1970 to 2019 for both Italy and Croatia (Figure 3, top left panel). Italian data before 2004 are from Fortibuoni et al. (2018), while after this year they are derived from EU-DCF (European Commission (EC), 2017). Croatian data before 2013 correspond to those available from FishStatJ database (FAO-GFCM, 2019), whereas data from 2013 to 2019 are from EU-DCF (European Commission (EC), 2017). Survey data are from the MEDiterranean International Trawl Survey (MEDITS; Bertrand et al., 2002a). The MEDITS bottom trawl survey is a European program started in 1994 with the aim of collecting data on demersal communities to describe their distribution and demographic structure. Notwithstanding the MEDITS is focused on the demersal resources, the gear configuration used for this survey as well as the species behavior improve MEDITS trawl efficiency for horse mackerels (Dremière et al., 1999; Fiorentini et al., 1999; Bertrand et al., 2002b; Ragonese et al., 2004); given their semi-pelagic habit they could also be monitored with acoustic surveys, even if these surveys generally target more appropriately pure pelagic species. Sampling procedures, data collection, and management are standardized, according to a common protocol over GSAs and years, whose specific details can be found in the MEDITS handbook (Anonymous, 2017) and summarized in Spedicato et al. (2019). The survey is usually carried out in the late spring-summer period although in some years, and particularly in the west side of GSA 17, cruises were postponed to late summer or early autumn. The considered MEDITS time series extends from 1994 to 2019 and concerns annual biomass indices (kg/km2) (Figure 3, bottom left panel). This index has been calculated by aggregating the two horse mackerel species and the two countries following the procedure of stratified mean and variance after raw abundance data were normalized by the trawl surface (Souplet, 1996).
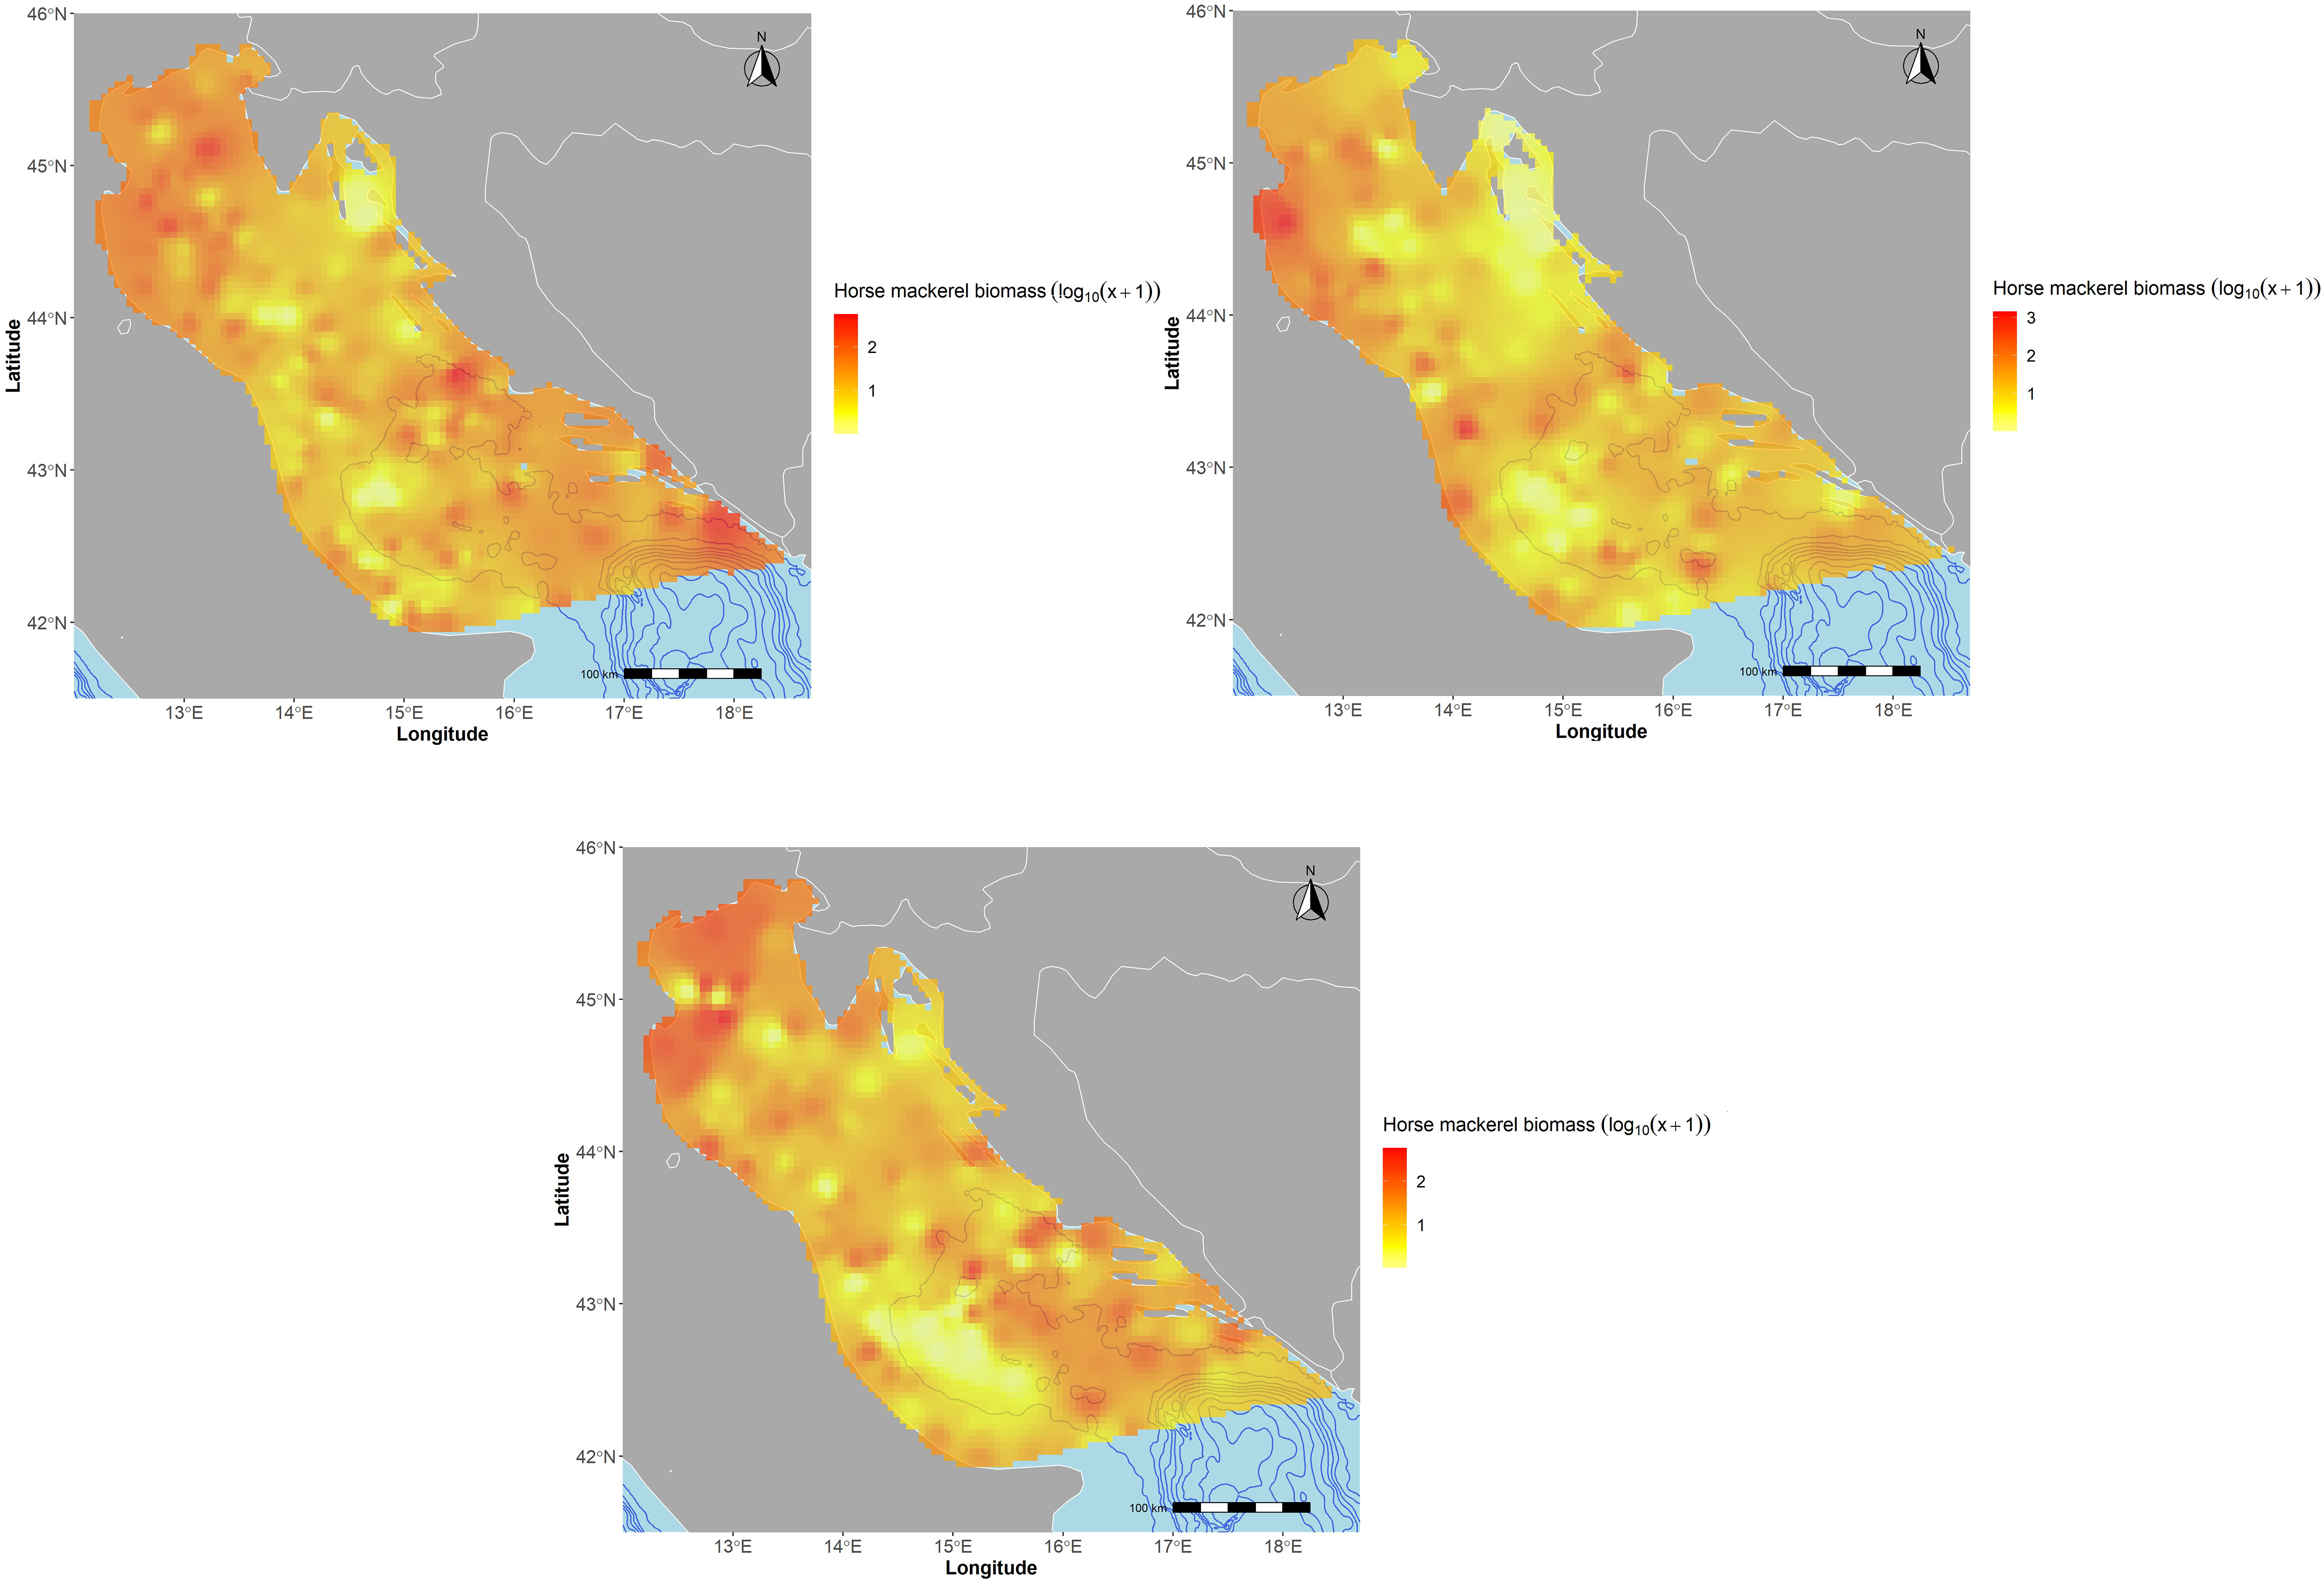
Figure 4. Horse mackerels. Biomass distribution expressed in log10(x + 1) where x is the biomass index (Kg/Km2) related to the MEDITS survey carried out in GSA 17 East and West for years 2014 (top left), 2018 (top right), and 2019 (bottom).
Stock Assessment Models
Considering the data availability, three different stock assessment models are considered in this study. Models’ priors for stock resilience were derived from the best available literature (Froese and Pauly, 2019), and revised after inspecting model diagnostics. Prior selection for exploitation status reflects the trend observed in the landings and the status of fishing capacity along the timeframe considered, which continuously increased during the 70s, peaked between the 80s and 90s, and then in the last 20 years was gradually reduced by the mean of management plans (Osio, 2012; Piroddi et al., 2015; Marini et al., 2017). After individuating credible ranges for the prior’s distribution, a number of runs were done to test the sensitivity of the model to parameter variations. Runs diagnostics were compared in terms of priors-vs.-posterior distribution, residuals, stock trajectories, and retrospective patterns. For the SPiCT model, the guidelines for the acceptance of this type of model were also verified (Mildenberger et al., 2021). The following paragraphs are considering only the best-performing parameters.
Catch Maximum Sustainable Yields
The Catch Maximum Sustainable Yield model (CMSY; Froese et al., 2017) is an SPM that needs catch data, catch per unit effort (CPUE) or survey index, and priors on the maximum intrinsic rate of population increase (r) and depletion status (B/K) to estimate biomass, exploitation rate, MSY, and related reference points. The method is based on a two-step analysis that combines the CMSY model and a Bayesian state-space implementation of the Schaefer model (BSM). Within the CMSY model, catch data and r and K priors serve to estimate the carrying capacity (K) and biomass trajectories based on the population dynamics of the Schaefer model. Ranges of r and K priors are filtered with a Monte-Carlo algorithm to detect “viable” r-K pairs for which the corresponding biomass trajectories are compatible with the observed catches. Subsequently, the BSM model uses CPUE or survey index and catch data to estimate r and K-values. The output of the two models is compared to assess the robustness of the results, whereas final figures derive from the BSM model. The CMSY (version 9f) reported in this study is a further development of the one used in Froese et al. (2017) (information and R code available at http://oceanrep.geomar.de/33076/).
CMSY was applied to both sprat and horse mackerels; input data are summarized in Table 1. For the first species, landings were only available for the years from 2004 to 2019 and the same time series was also considered for the acoustic survey index. Only one survey index can be included in this model, thus considering that the bulk of the sprat population is localized in the western side of the Adriatic Sea (Figure 2), only the Italian survey index was taken into account. r was included in the range 0.32–0.74 (Froese and Pauly, 2019), and modified to 0.4–0.8 after inspecting the prior vs. posterior distribution. The B/K range for the initial and intermediate year (2011) was set as a medium to lo low depletion (0.2–0.8) and as a medium-to-strong depletion (0.2–0.6) at the end of the time series: we expect that the fishing pressure on this resource was not drastically changed along the short time-series, however, the priors for the initial and intermediate depletion status were set slightly higher than the final one in order to decrease the possibility of constraining the model. For horse mackerels, CMSY was developed including landing data for both Italy and Croatia, available for years from 1970 to 2019; while for the survey index the time series included years from 1994 to 2019. The r prior available in literature ranged between 0.31 and 0.72 for Trachurs trachurus and 0.33–0.76 for Trachurus mediterranesus, as suggested by Froese and Pauly (2019). We opted to adopt the more conservative r-values for both the two species and our choice was confirmed by model diagnostics. B/K priors were set as low depletion (0.6–0.9) at the beginning of the time-series, as strong depletion (0.1–0.4) in 1996, corresponding to a period when the fishing pressure was at its maximum, and as medium depletion (0.2–0.6) in the last year.
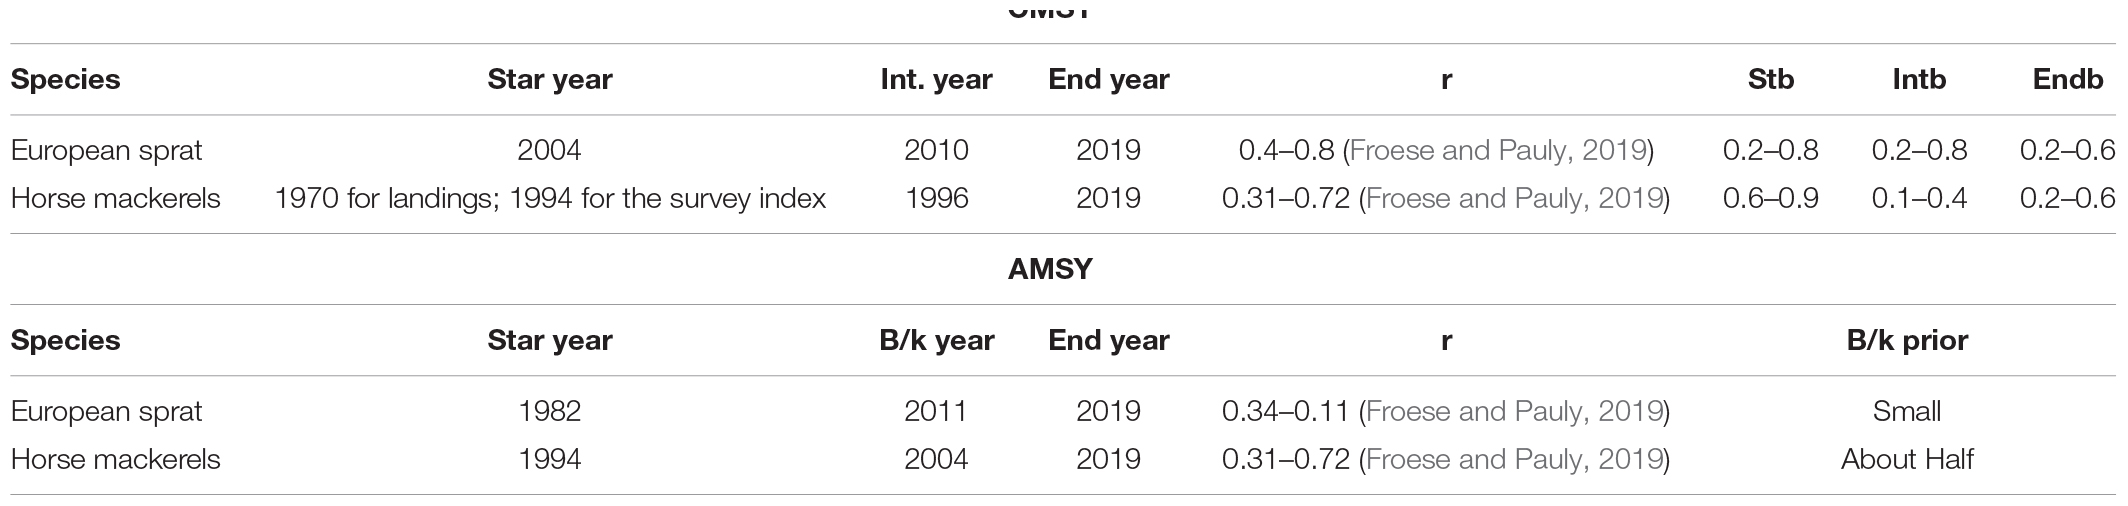
Table 1. Input data for the CMSY and the AMSY SPMs.
Surplus Production Model in Continuous Time
The Stochastic surplus Production model in Continuous Time (SPiCT, Pedersen and Berg, 2017) corresponds to a state-space version of the Pella-Tomlinson surplus production model (Pella and Tomlinson, 1969). This model is developed for incorporating the dynamics of both fisheries and biomass data including an observation error for both the input data. If available, SPiCT can work considering multiple survey indexes or effort data and offer the possibility to use seasonal information. Auxiliary information can be included in the Bayesian estimation framework, which allows the use of informative priors for helping the model to find parameter estimates in a closet range of values. Principal outputs of the model are the biomass reference points, BMSY and B/BMSY, and the fishing mortality reference points, FMSY and F/FMSY, together with estimates for r, K, and MSY. The model is developed using Template Model Builder (TMB, Kristensen et al., 2015), which is recently conceived to be used within the R framework.
In this study, SPiCT was developed for both the considered species. Table 2 summarizes the input data. For sprat, SPiCT was set including both landing data and acoustic survey indexes from 2004 to 2019. These two sources of information reflect all the specimens targeted by the fishing activity; this is also valid for the horse mackerel stock. Considering the characteristics of SPiCT, the two survey data, the Italian and the Croatian acoustic surveys, have been included, and specify the season in which they occurred. Some priors were used, specifically the initial relative biomass was considered close to the BMSY level, since the cyclic dynamic of the small pelagic species, represented also in the trend of landings, as well as the local commercial importance of this species does not suggest a strong depletion of this stock before the beginning of the time-series. However, a medium level of exploitation was assumed at the beginning of the time series due to a potentially important fishing capacity at the beginning of the 2000s mitigated by the start of management plans (Osio, 2012; Piroddi et al., 2015). A prior for r was included following the information included in FishBase (Froese and Pauly, 2019) for the same species, whereas the prior for the production curve was adjusted as suggested by Thorson et al. (2012) for the Clupeiformes. For horse mackerels, landing data has been included from the year 1970 to the year 2019, whereas the MEDITS index has been included from the year 1994 to the year 2019. SPiCT offers the possibility to specify the time of year when the survey was performed, thus MEDITS data have been included specifying the month in which the survey occurred. To help the convergence of the model, some priors have been set. Specifically, the initial relative biomass was considered close to the BMSY level, whereas the initial exploitation level was considered negligible since the fishing activity at the beginning of the 70s’ can be held as not as impactful as the present (Osio, 2012; Piroddi et al., 2015). Additionally, r was derived from the FishBase database (Froese and Pauly, 2019), whereas the prior for the production curve was adjusted as suggested by Thorson et al. (2012). Finally, considering the low value, which seems not to be consistent with the rest of the time series, for the landing data in 1970 compared to the following years, this value was scaled by a factor of 5 compared to the rest of the time series.
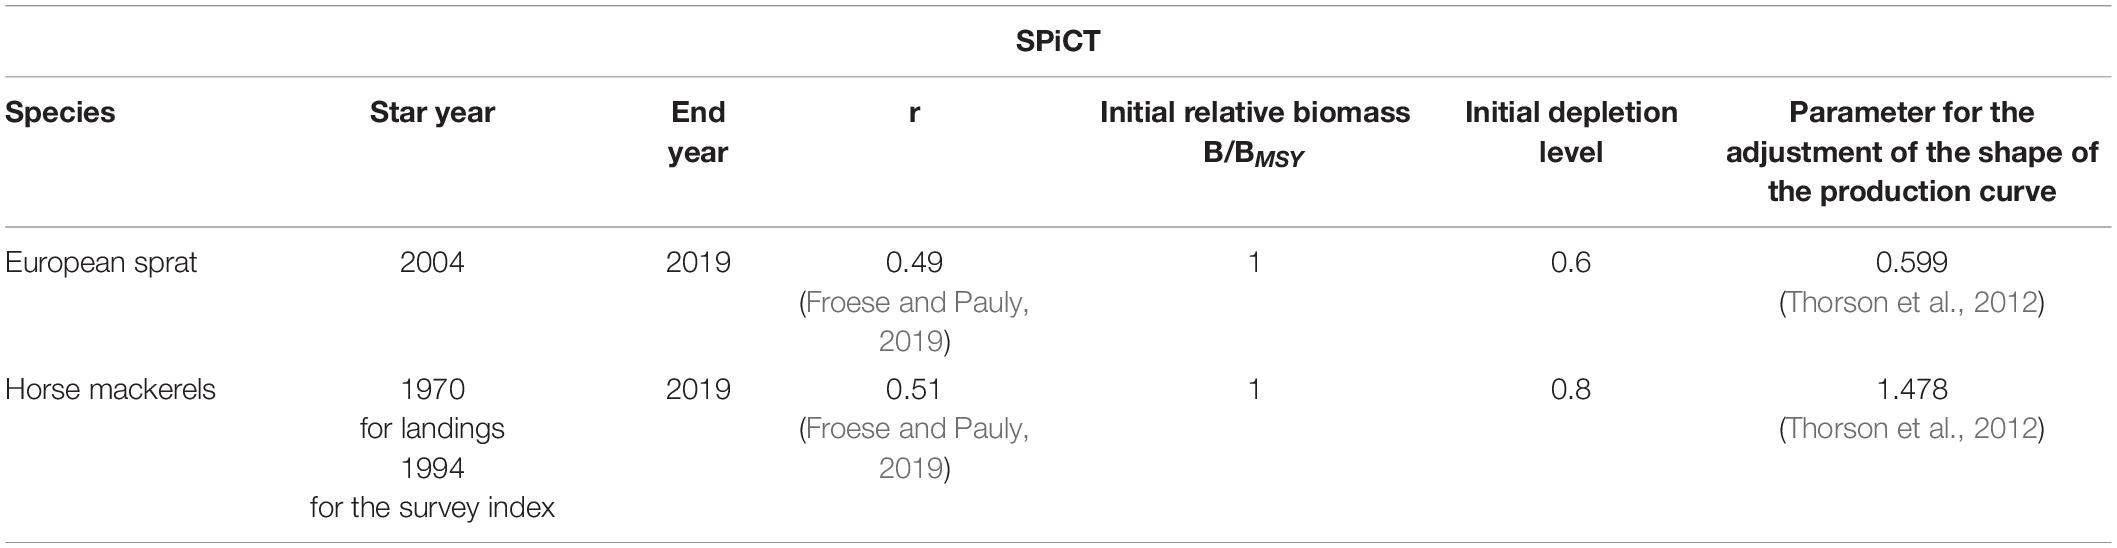
Table 2. Input data for the SPiCT model.
Abundance Maximum Sustainable Yields
Abundance Maximum Sustainable Yields (AMSY) is a SPM suitable for data-limited cases (Froese et al., 2020), that estimates fisheries reference points (FMSY, F/FMSY, B/BMSY) of a stock combining its abundance (CPUE or total biomass), its resilience, and a prior for relative stock size (range of B/K, between 0 and 1). This method was specifically developed for situations for which total catch is unknown or unreliable or for bycatch species where abundances may be estimable only from survey data. AMSY takes information and tests a high number of combinations of productivity (r) and unexploited stock size or carrying capacity (K) for their compatibility with the input data through a Monte Carlo filtering process. AMSY estimates relative catches at year t with a rearranged form of the Schaefer equation that needs biomass at years t and t + 1; this implies that catches may be estimated up to the second last year in the time series, thus not estimating F for the last considered year. The lack of catch data also implies that catches and carrying capacity are estimated as relative values, thus AMSY does give an estimation of the relative carrying capacity (Kq). AMSY estimates of fishing pressure have wide margins of uncertainty, which may not be ideal for management purposes. Nevertheless, it seems to be well suited for estimating productivity as well as the relative stock size and may, therefore, be fundamental in the context of a data-poor stock.
AMSY was developed for both species; input data are summarized in Table 1. For sprat, a long time series (1982–2019) of estimated total biomass data belonging to the Italian acoustic surveys (ECHOADRI and MEDIAS) was available; r prior range was much wider than those used in the CMSY model (0.32–1.1 based on FishBase data and sensitivity analysis), this was needed to satisfy the large oscillations of this index and to identify enough viable r-Kq to reasonably accommodate the stock dynamic. The B/K prior was set as “Small” in 2011 based on the observation of the CPUE value for 2011 was ca. 30% of the maximum value observed in the longest time series (CPUE). For horse mackerels, AMSY was developed using the MEDITS index for the time series from 1994 to 2019; likewise, to the CMSY model, r was included in the range 0.31–0.72 (Froese and Pauly, 2019), and B/K priors were set in 2004, a year in which CPUE and catch data present important peaks. Considering this and taking into account the longer time series of landings, the corresponding prior was set as “About half,” since the catch value for this year was ca. 40% of the maximum value observed in the longest time series.
Results
European Sprat
Sprat is a migratory species mainly distributed on the western side of the north Adriatic Sea, as shown by the acoustic estimates available from both Italy and Croatia (Figure 2). Maps are shown only for the years 2014, 2018, and 2019, as an example of different periods.
Regarding the status of this stock, CMSY and SPiCT describe a similar situation: biomass results above the reference points for the first years, while since 2007 for CMSY and 2011 for SPiCT it moves below the reference point describing an increasing trend in the last years reaching the value of B/BMSY equal to 0.867 and 0.902 in 2019, respectively, for the CMSY and the SPiCT models (Figure 5 bottom right panel and Table 3). Also, trends of F/FMSY for these two models are very similar, describing an overexploited stock for most of the time series and specifically since 2008 for CMSY and since 2009 for SPiCT; in 2019 F/FMSY is equal to 1.151 for CMSY and equal to 1.124 for SPiCT (Figure 5 bottom left panel and Table 3).
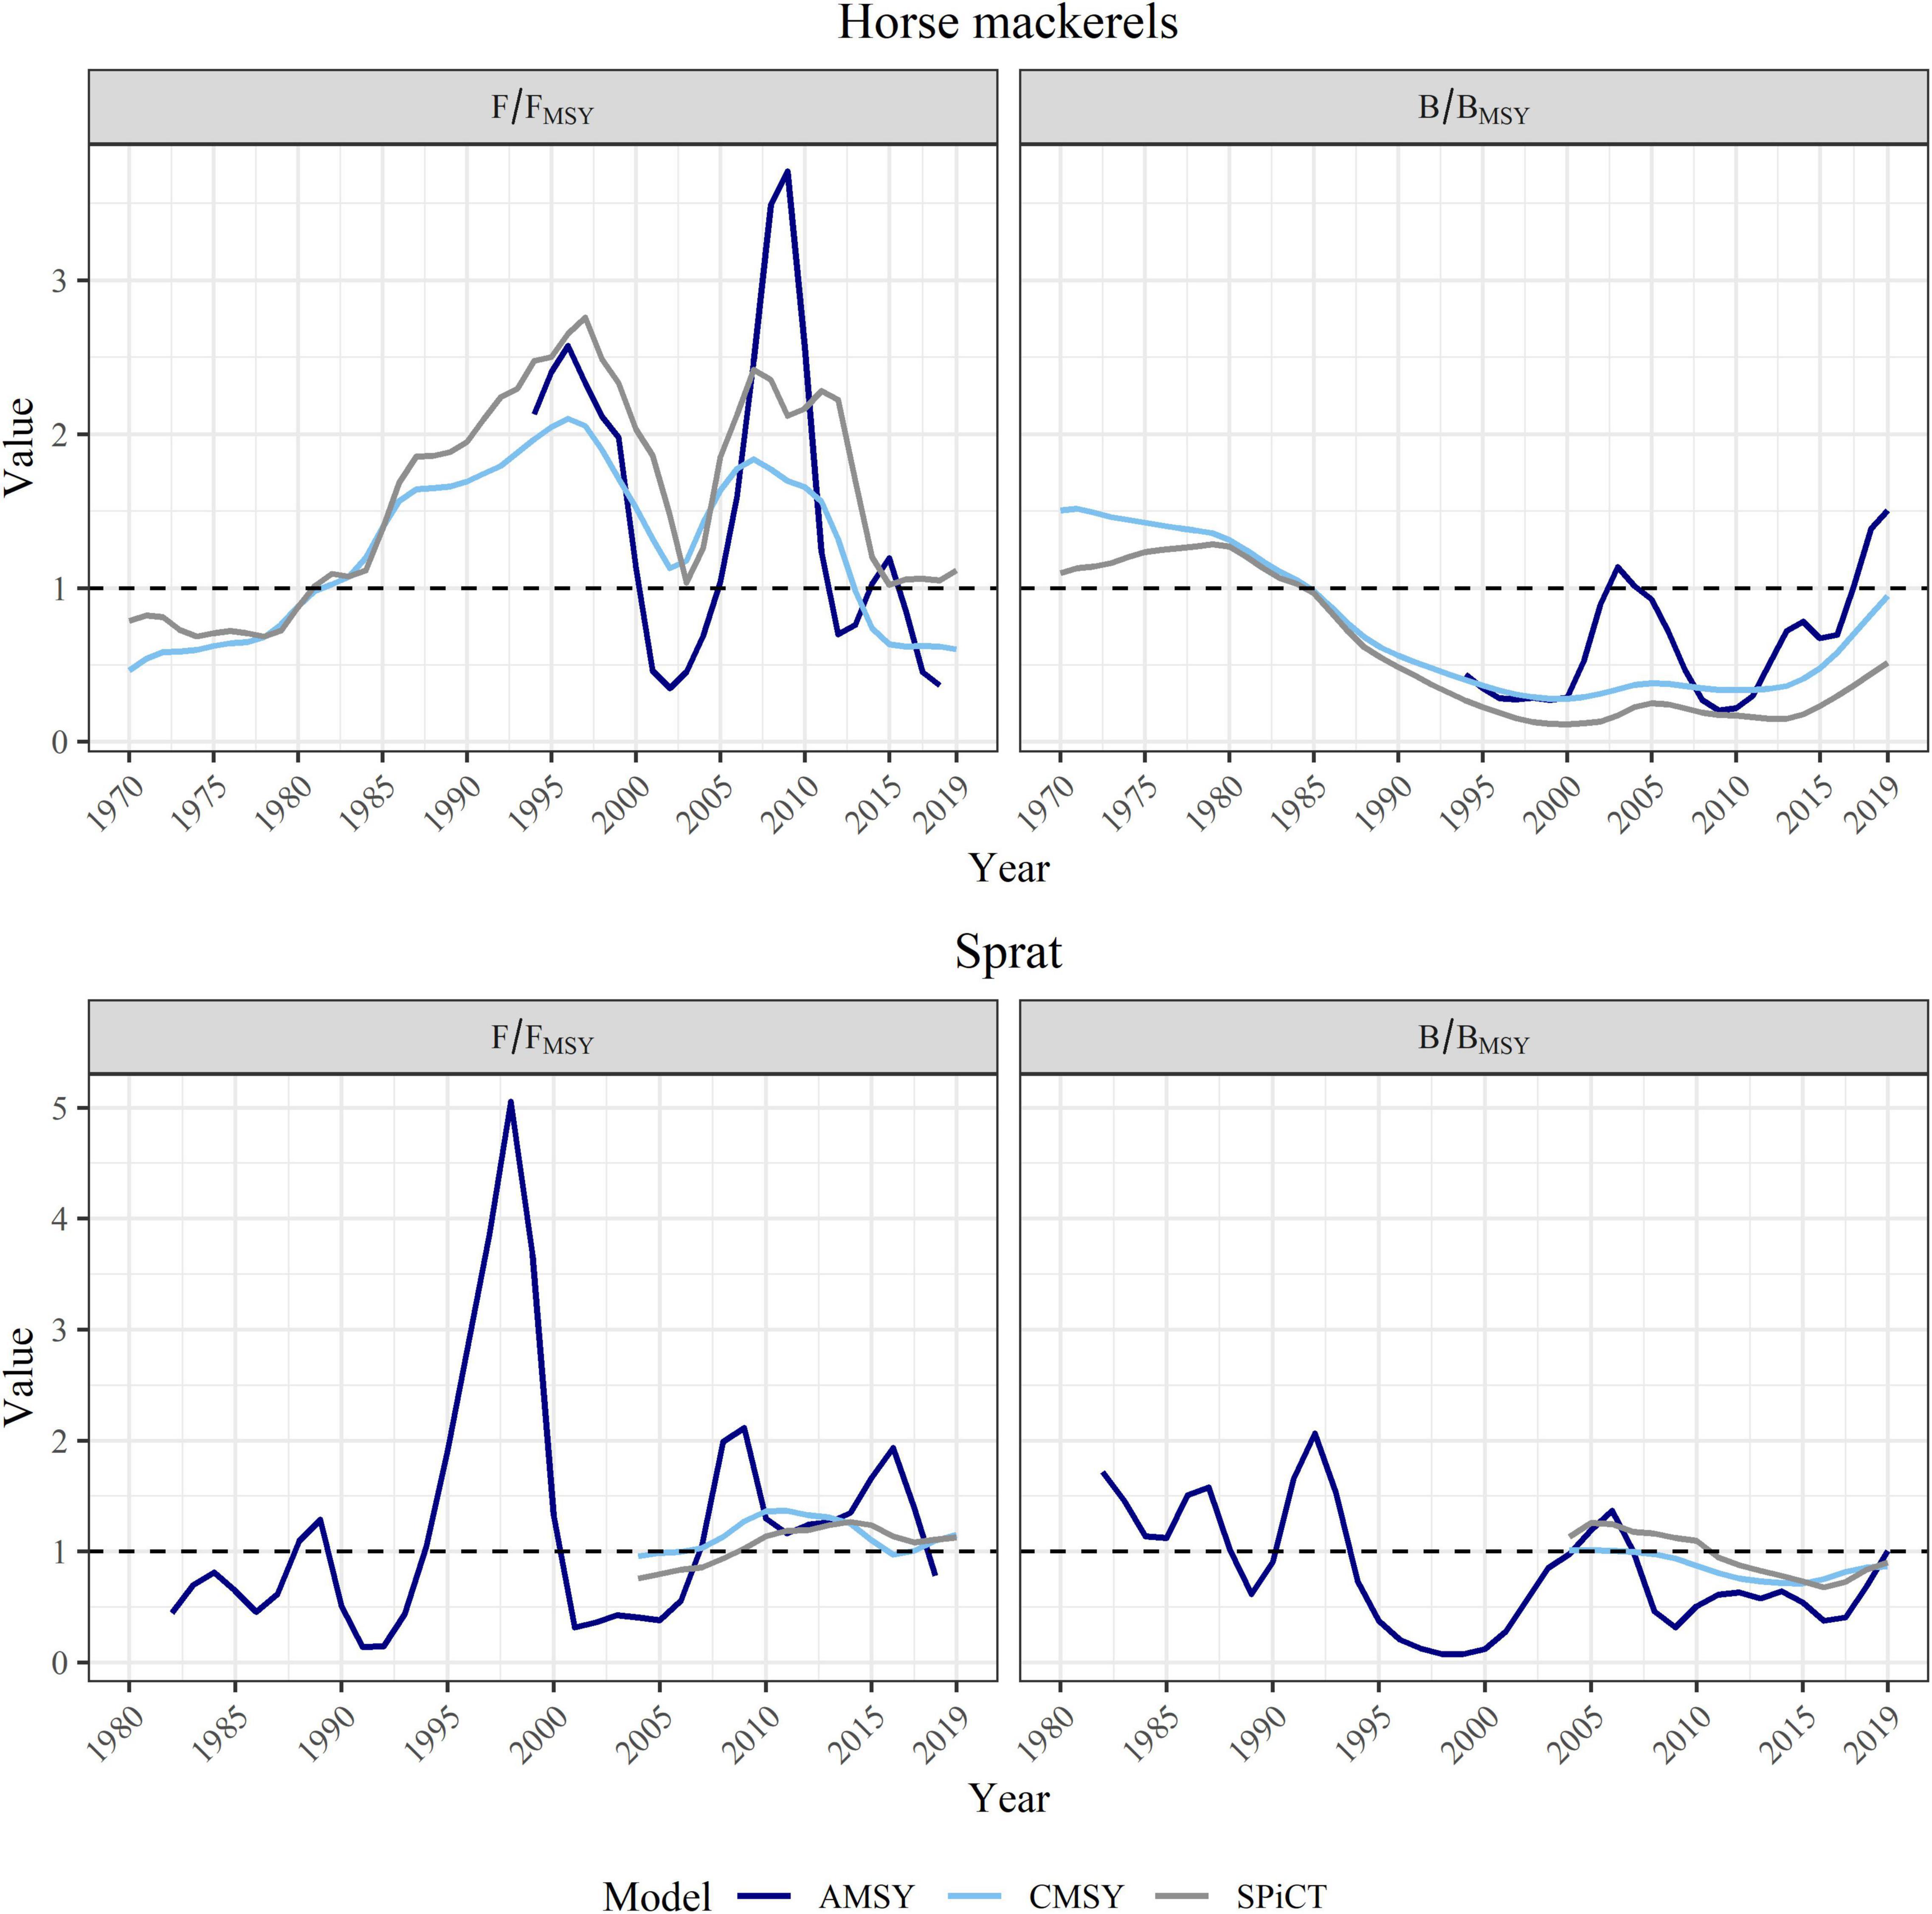
Figure 5. B/BMSY (right panels) and F/FMSY (left panels) trends for the horse mackerel species (top panels) and European sprat (bottom panels) for the three SPMs (AMSY—blue line, CMSY—light blue line, SPiCT—gray line). The dashed line corresponds to the reference values.
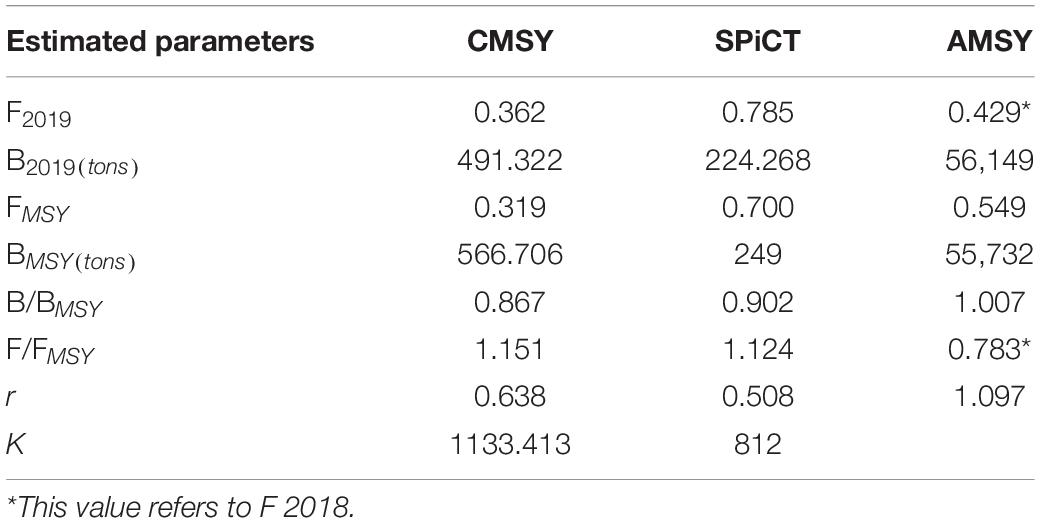
Table 3. European sprat—estimated parameters from the three SPMs.
The longer time series considered by the AMSY model describes a fluctuating situation over the years (Figure 5 bottom panels). At the beginning of the time series, this stock appears in good status being B and F, respectively, above and below the reference points (Figure 5 bottom panels and Table 3). In the mid-90s, the high values of F/FMSY (equal to 5.05 in 1998) caused an important decay in biomass (Figure 5 bottom left panels). In the following period, the stock trend is similar to the other two models, although more fluctuating. However, this model suggests a better stock’s status since 2018, F/FMSY results equal to 0.78 and in 2019 B/BMSY results equal to 1.01 (Figure 5 bottom panel and Table 3). K is not shown (Table 3), since AMSY only estimates relative carrying capacity, Kq.
Diagnostics (Supplementary Figures 1A–9A) present a good fitting for all the models, particularly for AMSY. Estimated parameters are summarized in Table 3: r-values are quite similar for the CMSY and the SPiCT models, while AMSY estimates a higher value; estimates of K are available only for SPiCT and CMSY with quite different values. These differences might be due to the diverse models’ configuration and input data: CMSY comprises only the Italian acoustic index, whereas SPiCT offers the possibility to include both the Italian and the Croatian acoustic indexes. Considering the quite stable trend of the Croatian acoustic index accounting for lower values compared to those presented by the Italian acoustic survey (Figure 3, bottom right panel), the consequent estimated biomass is lower than the one estimated by CMSY. This fact is also reflected in the resulting K, which is lower for the SPiCT model compared to the one estimated by CMSY (Table 3). Notwithstanding, the numerical estimations are different, the trends of B/BMSY and F/FMSY are comparable, thus describing a very similar status of this stock (Figure 6, top panel). More generally, the three selected SPMs present variations among the estimated parameters (Table 3) that can be retained reasonably since they were developed considering different settings. Lastly, AMSY results are the most appropriate model for evaluating this stock: they show the best retrospective patterns (Supplementary Figures 4A, 6A, 9A), while also avoiding the uncertainty related to landing data. Moreover, AMSY considers only the Italian acoustic survey, which represents the best available and longest source of information for this stock, thus supporting the integrity of this approach.
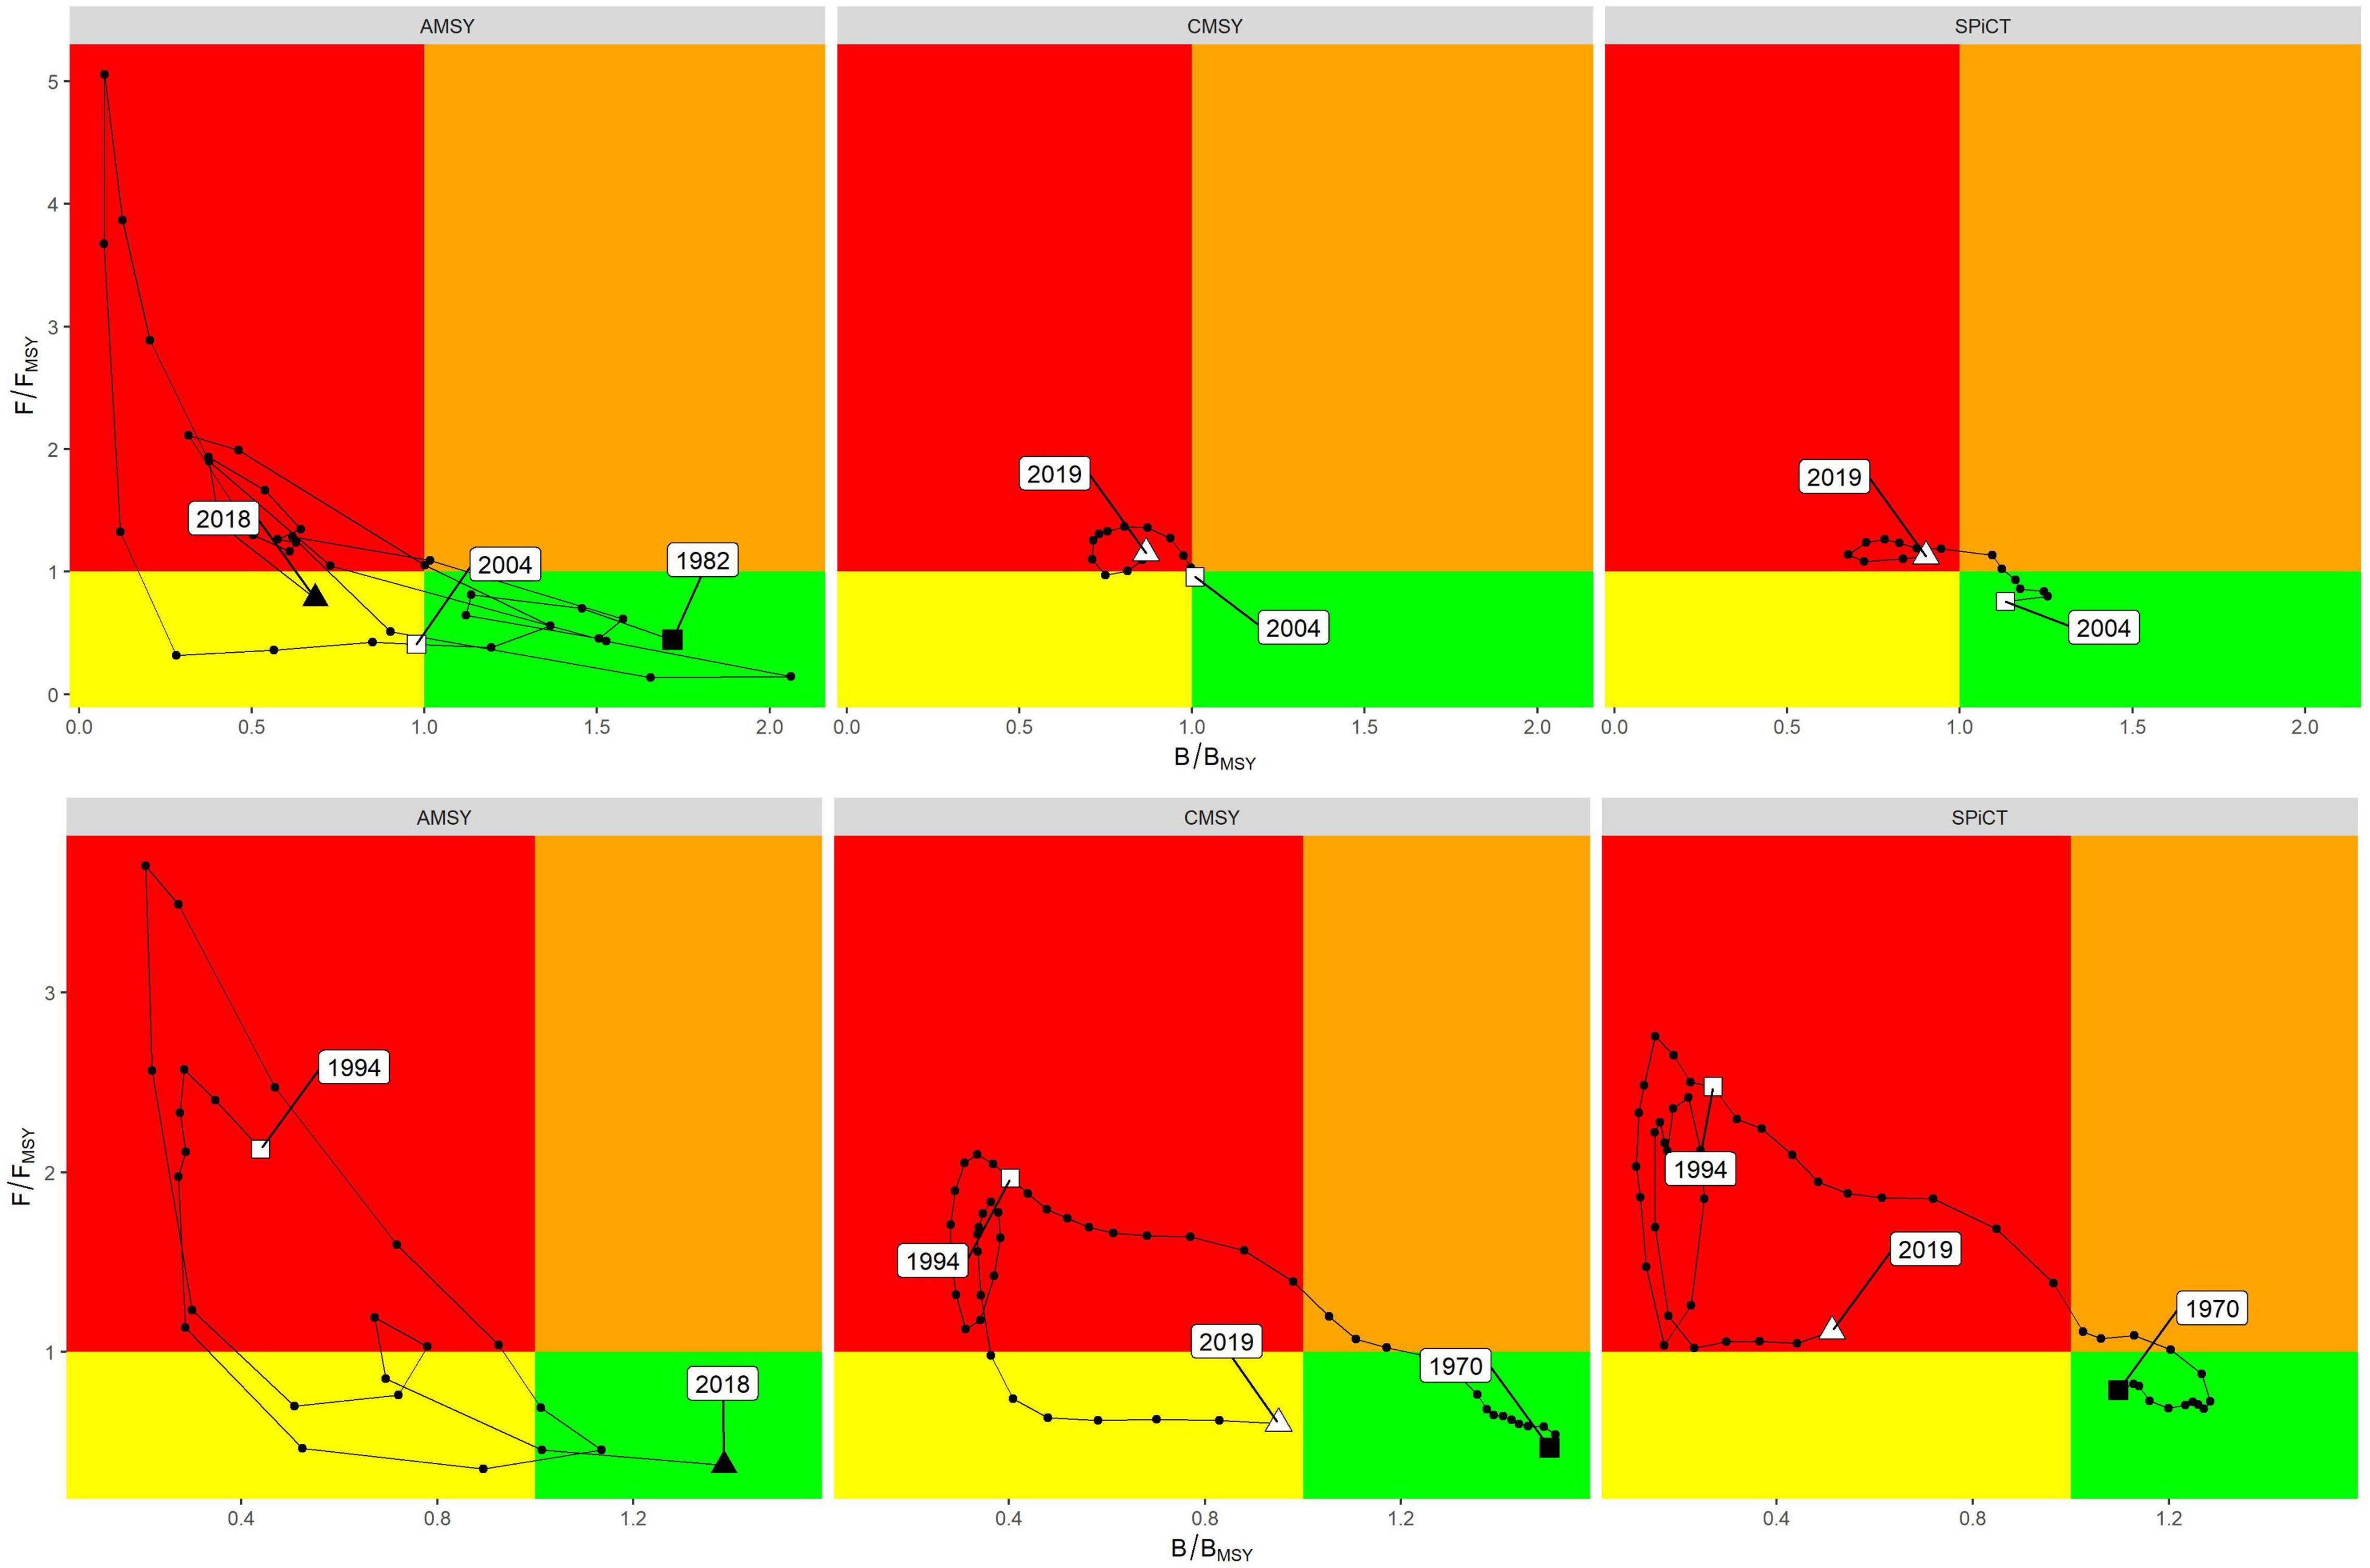
Figure 6. Kobe plots for each of the tested SPMs divided by species: European sprat (top panel) and horse mackerels (bottom panel).
Horse Mackerel Species
Horse mackerel species, Trachurus trachurus, and Trachurus mediterraneus, are diffused around the entire north and central Adriatic Sea, as shown by the maps obtained by the MEDITS data (Figure 4). This figure presents the species’ distribution for the years 2014, 2018, and 2019, for which georeferenced data were made available.
The situation depicted for Adriatic horse mackerel species differs among the three models. The models, i.e., CMSY and SPiCT, that take into account both landing and survey data, are developed considering a longer time series compared to the AMSY model and present a quite similar trend in terms of biomass and fishing mortality (Figure 5 top panels, Figure 6 bottom panel). Stock biomass results are above the reference value until the year 1985, and then decrease up to 2000; after this year biomass follows a quite stable trend before increasing continuously from 2015 up until present, reaching the value of B/BMSY equal to 0.950 and 0.513 for, respectively, CMSY and SPiCT (Figure 5 top right panel and Table 4). Fishing mortality describes an opposite trend: at the beginning of the time series, F/FMSY describes a continuous increase up to F/FMSY equal to 2.099 in 1996 and 2.757 in 1997, respectively, for CMSY and SPiCT, which then decreases rapidly until it reaches the value of 1.128 in 2002 for CMSY and 1.043 in 2003 for SPiCT (Figure 5 top left panel). In the following years, a new increase followed by a stable period is registered, which then decreases again in recent years, reaching a value of F/FMSY equal to 0.600 for CMSY and 1.115 for SPiCT in 2019 (Figure 5 top left panel and Table 4).
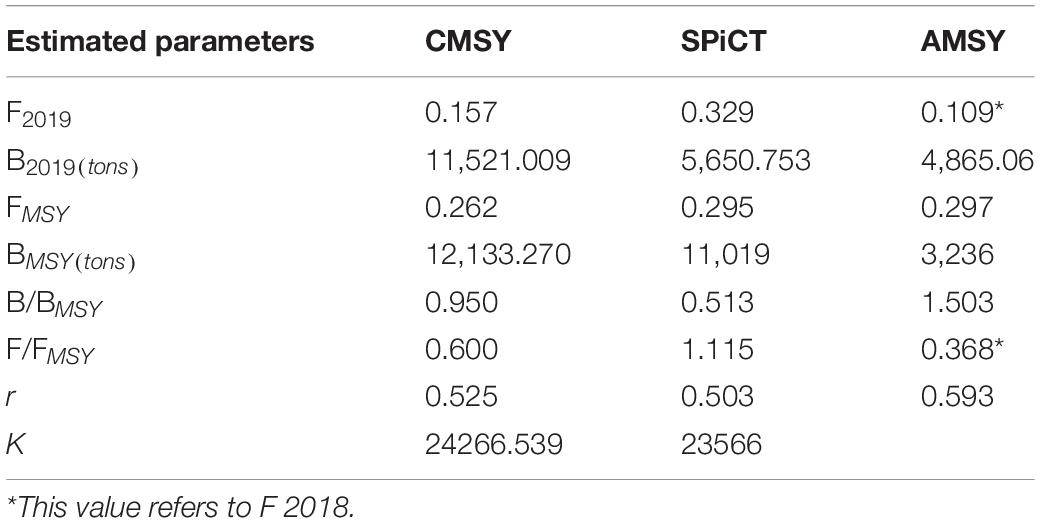
Table 4. Horse mackerel species—estimated parameters from the three SPMs.
In agreement with data availability, AMSY was developed for a shorter time series. The general trend described by this model appears similar to those depicted by the other two models; however, AMSY, which describes a general increasing biomass trend from 1994 up until present (B/BMSY in 2019 equal to 1.503), also reveals a peak in 2003 (B/BMSY = 1.135) not shown in the other two approaches (Figure 5 top right panel). This peak is probably due to the survey index that shows a peak in 2004. The trend of F/FMSY is similar to those described by CMSY and SPiCT; however, it accounts for the highest drop in the early 2000s (F/FMSY = 0.349 in 2002), as well as the highest peak in 2009 (F/FMSY = 3.707 in 2009), to then decrease accounting for the value of F/FMSY = 0.368 in 2018 (Figure 5 top left panel and Table 4).
Diagnostics (Supplementary Figures 10A–18A) present a good fitting for all the models. Estimated parameters are summarized in Table 4: r and K (this is not estimated for the AMSY model) values are very similar among the models; this is probably influenced by the fact that the three models use very similar input data. Considering the availability of a long time series of landing data and their important amount, particularly at the beginning of the time series, the use of a model able to include both landing and survey information can facilitate the understanding of the status of this stock. Thus, CMSY or SPiCT results are the candidate models for describing the situation of horse mackerel species in the Adriatic Sea.
Discussion
This study presents the comparison of three SPMs developed for evaluating the status of European sprat and horse mackerel species (Atlantic horse mackerel and Mediterranean horse mackerel) living in the Adriatic Sea. The focus on these species represents an opportunity to increase knowledge about the status of the pelagic domain in this basin since, at present, only anchovy (Engraulis encrasicolus) and sardine (Sardina pilchardus) are regularly assessed (General Fisheries Commission for the Mediterranean (GFCM), 2020) and a management plan has been in place for almost a decade (FAO, 2013). However, an increase in the number of assessed species, even if they have a low economic value, is of fundamental consequence, taking into account the increasing worldwide importance of adopting an ecosystem-centric approach, focusing both on the impacts of fisheries on the environment, and the environment on the fishes in it. In the Adriatic Sea framework, the evaluation of other small pelagic stocks rather than anchovy and sardine is going to favor the development of this approach, since ecosystem models, based on outputs available also from the present study, can be used as fisheries management tools in the context of a holistic approach and proposing plans of action (Dimarchopoulou et al., 2019; Dimarchopoulou, 2020).
Sprat is a migratory species with local importance. Considering the seasonal information from acoustic surveys and literature (Tičina and Giovanardi, 1997; Tičina et al., 2000; Azzali et al., 2002; Leonori et al., 2011), its distribution is not constant, but it is dependent on migration between the more productive shallow western Adriatic (feeding grounds) and deeper areas (spawning grounds) in the eastern Adriatic (Tičina, 2000, 2003). However, it seems concentrated mainly in the north-western side of the Adriatic Sea, as also demonstrated by the acoustic survey. This supports the use of only the Italian survey data when SPMs, i.e., CMSY and AMSY, are not able to include more than one survey index. Sprat represents a traditional food with low commercial value, as confirmed by limited landing values compared to other commercial species (EU-DCF database 2019; European Commission (EC), 2017). For this reason, sprat is considered an accessory species for the small pelagic fishery, often discarded if caught in an area where there is no market or, mostly in the eastern Adriatic, landed but reported as a mix of species (Sinovčić, 2001). This confirms the possibility that the use of landing data can be misleading for the evaluation of this stock, whereas the use of survey data, annually collected using a defined systematic scheme, seems the best source of information for estimating the status of this stock. However, it has to be mentioned that acoustic surveys underwent some modifications over the years (Leonori et al., 2021), e.g., the use of different vessels, different sampling times between the eastern and western sides, and a shift in the survey period of the western acoustic survey. The presence of these variables does not allow for easily combining the different surveys, suggesting the need for a standardization protocol to derive a single survey index to be used in stock assessment models. Consequently, in this work, since the main differences are between the eastern and western surveys, these two investigations were kept separated and, in the case of the SPiCT model, the differences in the survey period were accounted for. Finally, AMSY allows the use of a longer time series of information; this is of relevant importance in the context of SPMs in which only a limited number of information is included, thus the use of a longer time series can help in obtaining a more precise picture. A further argument for evaluating the models’ reliability are the values estimated for current B and BMSY (Table 3): the estimates provided by CMSY and SPiCT, which are based on the landing time-series, are far lower than those from AMSY, which are based on the MEDIAS biomass time-series. The pessimistic situation revealed by CMSY and SPiCT are probably due to the fluctuating landings paired with a general decreasing trend of the survey index, which reveals an important peak only at the beginning of the considered time series. In the future, improvements to these models can be obtained by the inclusion of a longer time series of catches with more reliable data, that can be obtained by the organization of a specific data collection in the main harbors which historically land sprat. Considering the uncertainty in the landing values, MEDIAS total biomass results being the best proxy of the stock biomass in a given year, this makes the CMSY and SPiCT estimates unrealistic. All these observations support the use of the AMSY model as the most appropriate approach to evaluate the status of this stock; this is also sustained by Cook (2013) who promotes the use of survey-based assessment when catch data are unreliable or unavailable while survey data have an adequate temporal and spatial coverage. However, in this case, the extreme fluctuations observed in the survey required a very wide r prior range to accommodate for the Schaefer dynamic. An unrealistically high value of r may theoretically lead to overestimating the ability of the stock to recover from low biomass status. However, the possibility that extreme values of r cause biased or unlikely stock productivity is lowered by the filtering process of the AMSY algorithm, which excluded r-Kq pairs giving unreasonable results when combined with CPUE data (Froese et al., 2020). Nevertheless, the wide uncertainty in the r prior is an undesirable condition, which may be better tackled if detailed uncertainty estimation is available and used for data weighting. For instance, yearly estimation of survey uncertainty may be used to model the observation error in the state-space formulation of the AMSY model. At present, very few species have been formally assessed using the AMSY model, and, based on our knowledge, the present study was the first application on a pelagic stock based on acoustic data. Instead, different examples of demersal stocks are presented in literature: Tsikliras et al. (2021) developed an AMSY model for 74 species never assessed in the Aegean Sea, Falsone et al. (2021) built AMSY and CMSY models for the Lepidopus caudatus in the Strait of Sicily. The limited diffusion of this model is also due to the fact that it was developed only recently. Regardless, in the upcoming future, considering the availability of survey data further developments of this model can be envisaged.
The three models used to assess the sprat stock present different outcomes; this is probably due to the fact that input data are used differently. CMSY and SPiCT were developed considering both landing and survey data, resulting in much more similar results compared to those revealed by AMSY. Also, SPiCT presents the advantages of using both the Italian and the Croatian acoustic indexes, whereas AMSY and CMSY allow the inclusion of only one survey. Notwithstanding that the Italian and the Croatian acoustic survey follow the same sampling scheme (MEDIAS Handbook, 2019), they present important differences, and thus it was preferred to keep them separated. Specifically, the two surveys are carried out by two different research vessels equipped with a different acoustic range of frequencies for acoustic data collection, even if the leading frequency (38 kHz) is the same (MEDIAS Handbook, 2019); moreover, since 2015 surveys at sea are performed in a different period (June-July for the Italian acoustic survey, September for the Croatian one). Considering the migrations of sprat, different acoustic estimates in the two survey areas (eastern and western Adriatic Sea) may occur due to different sampling seasons, even if the survey period was the same until 2014. These differences have to be treated appropriately, e.g., using a standardization protocol, if the survey information is to be used together. The choice of using different survey indexes for the West and East side of the Adriatic Sea was also the preferred solution for the anchovy and sardine assessments (General Fisheries Commission for the Mediterranean (GFCM), 2020).
Atlantic horse mackerel and Mediterranean horse mackerel have a similar distribution in the Mediterranean basin, however, the first species inhabits deeper areas and it is more common in northern Europe (source: AquaMaps, 2019a,b). In recent years another species of Trachurus, Trachurus picturatus, was reported in Mediterranean and Adriatic landings, however, it is not considered in this study since few records are available. The biology of Trachurus is poorly reported, while genetic studies are much more diffuse. These reveal the existence of 14 species belonging to the Trachurus genus, possibly lumped into three historical groups trachurus, picturatus, and mediterraneus (Shaboneyev, 1981) with some uncertainties about the relationship among them: some authors report a closer connection between T. mediterraneus and T. picturatus (Karaiskou et al., 2003), others describe these species as different clades (Cárdenas et al., 2005). Considering the need of clarifying the phylogeographic aspects of these species, as well as their biology and the need for reporting landing by species, we can retain the assumption of assessing T. trachurus and T. mediterraneus together as a valid option, specifically in a study like this one in which the main aim is testing different stock assessment models and not addressing management aspects. Additionally, these species are mainly captured by bottom trawlers; this type of gear represents a multispecies fishing technique (Caddy, 1993; Sánchez et al., 2007), thus the management of this fishing gear is based on the results of the stock assessments of different species.
Horse mackerel species have been also assessed comparing the three SPMs. In this case, considering the availability of a longer time series of landing data and their significant amount, particularly at the beginning of the time series, the use of a model able to include both landing and survey information can facilitate the understanding of the status of this stock. Thus, CMSY or SPiCT are as a result the favorite models to evaluate the status of these species. Only the SPiCT models describe these species in overexploitation, e.g., fishing mortality exceeds the reference point, while both models depict biomass below the reference value, though describe an improving trend for the most recent years. This positive trend is probably due to the reduction of fishing effort undergone in the last decade, for which a drop in the number of fishing days, as well as a decrease in the number of fishing boats, occurred (FAO, 2002, 2006, 2019). B and BMSY estimates given by CMSY and SPiCT, based on the landing time-series, are comparable to the AMSY estimates, based on the survey index, thus supporting the reliability of these different sources of information and the coherence between them. However, the BMSY value estimated by AMSY represents just 28% of the averaged value between CMSY and SPiCT; this is probably due to the shorter duration of survey data, which is not able to describe the higher biomass estimated by the other two models at the beginning of the time-series. This evidence implies that for these species the use of the AMSY model is not suggested; since the use of only the MEDITS survey data for a shorter time series might result in a misleading representation of the status of horse mackerels in the Adriatic Sea. Nevertheless, such exploration permitted to highlight how the use of different time-series (the shorter 24 years and the longer 50 years) caused an abrupt decrease of the value used as a reference point for the stock biomass, a dynamic that perfectly fits “shifting baseline syndrome” (Pauly, 1995).
In this study, different SPMs have been tested in different situations; similar comparisons are not common in literature, for which few examples are available (e.g., Bouch et al., 2020; Falsone et al., 2021). In particular, Bouch et al. (2020) tested the differences between CMSY and SPiCT and compared these results with the ICES assessments developed using age-based models. This study highlighted the fact that SPiCT generally describes a more optimistic status compared to CMSY, but both models present different results compared to the more structured approaches approved within the ICES framework. For the Adriatic case study, the performances of SPMs vs. age-based models could not be evaluated since no other assessments, other than those developed in this study, are available for these species. Also, in this study, only two stocks have been examined and for only one, the sprat, does SPiCT describe a more positive situation compared to CMSY. However, these results do not invalidate the previous study since here only a limited number of species were considered, rather they suggest developing further studies to clarify the performances between SPMs and age-based models also in the Mediterranean area. Also, since for the species considered in this study no other formal stock assessments are available, the fact remains that testing different model results is a good practice to select the most appropriate model to describe the status of these resources. In addition, the quality of the input data, together with the validity of the selected assumptions, as well as the strengthens and limitations of each approach have to be considered before selecting the best model. Moreover, instead of comparing outputs and selecting a single final model, future approaches can lead to the development of ensemble methods, which are promising approaches when a decision has to be made despite multiple and potentially conflicting estimates of stock status being present (Anderson et al., 2017). In addition, due to increasing calls in accounting for structural and parameter uncertainty (Punt et al., 2017), ensemble stacking procedure can be tested to represent variability in life-history parameters and fundamental determinants of stock status estimates in data-limited situations (Rudd et al., 2019).
Notwithstanding age-structured assessments remaining the favored models for evaluating the status of resources (Maunder, 2003; Punt and Szuwalski, 2012; Wang et al., 2014), in the last two decades, SPMs improved considerably such that they have been used for assessing important species, such as Atlantic bigeye tuna (Thunnus obesus; ICCAT, 2018), Mediterranean albacore tuna (Thunnus alalonga; ICCAT, 2017), and Indian Ocean blue shark (Prionace glauca; IOTC, 2017). Several examples are also developed in Mediterranean waters, where SPiCT was used for a variety of species and areas, e.g., Mullus barbatus in Greek waters (GSAs 20 and 22), and anchovy and sardine in the Thyrrenian sea (GSA 9) (General Fisheries Commission for the Mediterranean (GFCM), 2019a,b), whereas different stock assessments were developed using CMSY in the Adriatic basin, e.g., Sepia officinalis in GSA 17, and Squilla mantis in GSA 18 (General Fisheries Commission for the Mediterranean (GFCM), 2019a). CMSY was also attempted in a multispecies context and to test the effect of different harvest control rules (Armelloni et al., 2021). SPMs based on survey information only are less common, whereas these data are mainly used within a survey-based model, i.e., SURBA (Beare et al., 2005) or SURBAR (Needle, 2015), or used alone as trends, e.g., anchovy and sardine in GSA 7 are evaluated using survey trends only (General Fisheries Commission for the Mediterranean (GFCM), 2019b).
Conclusion
In this manuscript, SPMs have been tested and compared for three species, European sprat, and Mediterranean and Atlantic horse mackerel living in the Adriatic Sea, which were never previously assessed, with the aim of extending the number of the stocks’ evaluations and thus investigate the impact of fishing activity on non-routinely assessed pelagic species and, more generally, on the pelagic ecosystem. Depending on the data availability a different model was suggested for describing the status of these resources: a survey-based model in the case of sprat, for which survey data were more accurate and available for a long time series, and a model based on landing and survey information when commercial landings were relevant, i.e., horse mackerel species. All these approaches were based on SPMs since age/length-structure data were not available or very scarce for these species. Notwithstanding, the use of age-based assessments is generally suggested, the use of this type of model can help in situations in which little information is available and for this reason, can have further applications in the near future.
Data Availability Statement
The landing data that support the findings of this study are available in Supplementary Material, whereas data referring to DCF research surveys at sea are available upon official DCF data request. A dedicated template for data requests is available on the DCF website [Guidelines—European Commission (europa.eu)]. Requests to access the datasets should be directed to DCF website, https://datacollection.jrc.ec.europa.eu/guidelines/data-request-template.
Author Contributions
IL, CM, II, VT, IC, and SA provided data and biological information. SA and EA developed stock assessment analysis. SA and EA wrote the manuscript with contributions from all authors. All authors discussed the results.
Funding
This study was supported by the Direzione Generale della Pesca Marittima e dell’Acquacoltura of the Italian Ministry of Agricultural, Food and Forestry Policies (MIPAAF) and by the Croatian Ministry of Agriculture within the EU Data Collection Framework (DCF—MEDITS and MEDIAS), and the Ministry of Science and Education of the Republic of Croatia (Grant No. 001-0013077-0532).
Conflict of Interest
The authors declare that the research was conducted in the absence of any commercial or financial relationships that could be construed as a potential conflict of interest.
Publisher’s Note
All claims expressed in this article are solely those of the authors and do not necessarily represent those of their affiliated organizations, or those of the publisher, the editors and the reviewers. Any product that may be evaluated in this article, or claim that may be made by its manufacturer, is not guaranteed or endorsed by the publisher.
Acknowledgments
We thank Martina Scanu for her help in setting the stock assessment models and Giampaolo Coro for his useful comments. The research leading to these results has been conceived under the International Ph.D. Program “Innovative Technologies and Sustainable Use of Mediterranean Sea Fishery and Biological Resources (www.fishmed-phd.org)”. This study represents a partial fulfillment of the requirements for the Ph.D. thesis of ENA.
Supplementary Material
The Supplementary Material for this article can be found online at: https://www.frontiersin.org/articles/10.3389/fmars.2021.728948/full#supplementary-material
References
Aalto, E. A., Dick, E. J., and McCall, A. D. (2015). Separating recruitment and mortality time lags for a delay-difference production model. Can. J. Fish. Aquat. Sci. 165, 161–165. doi: 10.1139/cjfas-2013-0415
Amoroso, R. O., Pitcher, C. R., Rijnsdorp, A. D., McConnaughey, R. A., Parma, A. M., Suuronen, P., et al. (2018). Bottom trawl fishing footprints on the world’s continental shelves. Proc. Natl. Acad. Sci. U.S.A. 115, E10275–E10282. doi: 10.1073/pnas.1802379115
Anderson, S. C., Cooper, A. B., Jensen, O. P., Minto, C., Thorson, J. T., Walsh, J. C., et al. (2017). Improving estimates of population status and trend with superensemble models. Fish Fish. 18, 732–741. doi: 10.1111/faf.12200
Anonymous (2017). MEDITS Handbook, Version No. 9. MEDITS Working Group. 106. Avaliable online at: http://www.sibm.it/MEDITS%202011/principaledownload.htm
AquaMaps (2019a). Computer Generated Distribution Maps for Trachurus Mediterraneus (Mediterranean horse mackerel), with modelled year 2050 native range map based on IPCC RCP8.5 emissions scenario. Available online at: https://www.aquamaps.org (accessed March 2021).
AquaMaps (2019b). Computer Generated Distribution Maps for Trachurus Trachurus (Atlantic horse mackerel), with modelled year 2050 native range map based on IPCC RCP8.5 emissions scenario. Available online at: https://www.aquamaps.org (accessed March 2021).
Armelloni, E. N., Scanu, M., Masnadi, F., Coro, G., Angelini, S., and Scarcella, G. (2021). Data poor approach for the assessment of the main target species of rapido trawl fishery in Adriatic Sea. Front. Mar. Sci. 8:552076. doi: 10.3389/fmars.2021.552076
Azzali, M., De Felice, A., Luna, M., Cosimi, G., and Parmiggiani, F. (2002). The state of the Adriatic Sea centered on the small pelagic fish populations. PSZN. Mar. Ecol. 23, 78–91. doi: 10.1111/j.1439-0485.2002.tb00009.x
Barausse, A., Duci, A., Mazzoldi, C., Artioli, Y., and Palmeri, L. (2009). Trophic network model of the Northern Adriatic Sea: analysis of an exploited and eutrophic ecosystem. Estuarine Coast. Shelf Sci. 83, 577–590. doi: 10.1016/j.ecss.2009.05.003
Beare, D. J., Needle, C. L., Burns, F., and Reid, D. G. (2005). Using survey data independently from commercial data in stock assessment: an example using haddock in ICES division VIa. ICES J. Mar. Sci. 62, 996–1005. doi: 10.1016/j.icesjms.2005.03.003
Berg, C. W., Nielsen, A., and Kristensen, K. (2014). Evaluation of alternative age-based methods for estimating relative abundance from survey data in relation to assessment models. Fish. Res. 151, 91–99. doi: 10.1016/j.fishres.2013.10.005
Bertrand, J. A., Gil de Sola, L., Papaconstantinou, C., Relini, G., and Souplet, A. (2002a). The general specifications of the MEDITS surveys. Sci. Mar. 66, 9–17.
Bertrand, J. A., Leonori, I., Dremière, P. Y., and Cosimi, G. (2002b). Depth trajectory and performance of a trawl used for an international bottom trawl survey in the Mediterranean. Sci. Mar. 66(Suppl. 2), 169–182. doi: 10.3989/scimar.2002.66s2169
Bouch, P., Minto, C., and Reid, D. G. (2020). Comparative performance of data-poor CMSY and data-moderate SPiCT stock assessment methods when applied to data-rich, real-world stocks. ICES J. Mar. Sci. 78, 264–276. doi: 10.1093/icesjms/fsaa220
Branch, T. A., Jensen, O. P., Ricard, D., Ye, Y., and Hilborn, R. (2011). Contrasting global trends in marine fishery status obtained from catches and from stock assessments. Conserv. Biol. 25, 777–786. doi: 10.1111/j.1523-1739.2011.01687.x
Caddy, J. F. (1993). Some future perspectives for assessment and management of Mediterranean fisheries. Sci. Mar. 57, 121–130.
Cárdenas, L., Hernández, C. E., Poulin, E., Magoulas, A., Kornfield, I., and Ojeda, F. P. (2005). Origin, diversification, and historical biogeography of the genus Trachurus (Perciformes: Carangidae). Mol. Phylogenet. Evol. 35, 496–507. doi: 10.1016/j.ympev.2005.01.011
Colloca, F., Cardinale, M., Maynou, F., Giannoulaki, M., Scarcella, G., Jenko, K., et al. (2013). Rebuilding Mediterranean fisheries: a new paradigm for ecological sustainability. Fish Fish. 14, 89–109. doi: 10.1111/j.1467-2979.2011.00453.x
Cook, R. M. (2013). A fish stock assessment model using survey data when estimates of catch are unreliable. Fish. Res. 143, 1–11. doi: 10.1016/j.fishres.2013.01.003
Dimarchopoulou, D. (2020). Ecosystem Approach to Fisheries Management in the Aegean Sea. Doctorate Thesis. Thessaloniki: Aristotle University of Thessaloniki.
Dimarchopoulou, D., Tsagarakis, K., Keramidas, I., and Tsikliras, A. C. (2019). Ecosystem models and effort simulations of an untrawled gulf in the central Aegean Sea. Front. Mar. Sci. 6:648. doi: 10.3389/fmars.2019.00648
Dremière, P. Y., Fiorentini, L., Cosimi, G., Leonori, I., Sala, A., and Spagnolo, A. (1999). Escapement from the main body of the bottom trawl used for the Mediterranean International Trawl Survey (MEDITS). Aquat. Living Resour. 12, 207–217. doi: 10.1016/S0990-7440(00)88471-5
Eigaard, O. R., Bastardie, F., Hintzen, N. T., Buhl-Mortensen, L., Buhl-Mortensen, P., Catarino, R., et al. (2017). The footprint of bottom trawling in European waters: distribution, intensity, and seabed integrity. ICES J. Mar. Sci. 74, 847–865. doi: 10.1093/icesjms/fsw194
European Commission (EC) (2017). Regulation (EU) 2017/1004 on the Establishment of a Union Framework for the Collection, Management and Use of Data in the Fisheries Sector and Support for Scientific Advice Regarding the Common Fisheries Policy and Repealing Council Regulation (EC) No 199/2008. Brussels: European Commission.
European Environment Agency (EEA), (2019). The European Environment – State and Outlook 2020. Knowledge for Transition to a Sustainable Europe. Copenhagen: European Environment Agency.
Eurostat (2021). Catches – Mediterranean and Black Sea (From 2000 Onwards). Available online at: https://ec.europa.eu/eurostat/databrowser/view/fish_ca_atl37/default/table?lang=en (accessed October 2020).
Falsone, F., Scannella, D., Geraci, M. L., Gancitano, V., Vitale, S., and Fiorentino, F. (2021). How fishery collapses: the case of Lepidopus caudatus (Pisces: Trichiuridae) in the Strait of Sicily (Central Mediterranean). Front. Mar. Sci. 7:584601. doi: 10.3389/fmars.2020.584601
FAO (2002). Council Regulation (EC) No 2371/2002 of 20 December 2002 on the Conservation and Sustainable Exploitation of Fisheries Resources under the Common Fisheries Policy. Rome: FAO.
FAO (2006). Council Regulation (EC) No 1198/2006 of 27 July 2006 on the European Fisheries Fund. Rome: FAO.
FAO (2013). Recommendation GFCM/37/2013/1 on a Multiannual Management Plan for Fisheries Exploiting Small Pelagic Stocks in Geographical Subarea 17 (Northern Adriatic Sea) and on Transitional Conservation Measures for Fisheries Exploiting Small Pelagic Stocks in Geographical Subarea 18 (Southern Adriatic Sea). Rome: FAO.
FAO (2019). Recommendation GFCM/43/2019/5 on a Multiannual Management Plan for Sustainable Demersal Fisheries in the Adriatic Sea (Geographical Subareas 17 and 18). Rome: FAO.
FAO (2020). The State of Mediterranean and Black Sea Fisheries 2020. General Fisheries Commission for the Mediterranean. Rome: FAO.
FAO-GFCM (2019). Fishery and Aquaculture Statistics. GFCM Capture Production 1970-2017 (FishstatJ). Rome: FAO Fisheries and Aquaculture Department.
Fiorentini, L., Dremière, P. Y., Leonori, I., Sala, A., and Palumbo, V. (1999). Efficiency of the bottom trawl used for the Mediterranean international trawl survey (MEDITS). Aquat. Living Resour. 12, 187–205. doi: 10.1016/S0990-7440(00)88470-3
Fortibuoni, T., Libralato, S., Arneri, E., Giovanardi, O., Solidoro, C., and Raicevich, S. (2018). Erratum: fish and fishery historical data since the 19th century in the Adriatic Sea, Mediterranean. Sci. Data 5:180144. doi: 10.1038/sdata.2018.144
Free, C. M., Jensen, O. P., Anderson, S. C., Gutierrez, N. L., Kleisner, K. M., Longo, C., et al. (2020). Blood from a stone: performance of catch-only methods in estimating stock biomass status. Fish. Res. 223:105452. doi: 10.1016/j.fishres.2019.105452
Froese, R., and Pauly, D. (2019). FishBase, Version 05/2019. World Wide Web Electronic Publication. Available online at: www.fishbase.org (accessed November 7, 2019)
Froese, R., Demirel, N., Gianpaolo, C., Kleisner, K. M., and Winker, H. (2017). Estimating fisheries reference points from catch and resilience. Fish Fish. 18, 506–526. doi: 10.1111/faf.12190
Froese, R., Winker, H., Coro, G., Demirel, N., Tsikliras, A. C., Dimarchopoulou, D., et al. (2020). Estimating stock status from relative abundance and resilience. ICES J. Mar. Sci. 77, 527–538. doi: 10.1093/icesjms/fsz230
Gabriel, W. L., and Mace, P. M. (1999). “A review of biological reference points in the context of the precautionary approach,” in Proceedings of the Fifth National NMFS Stock Assessment Workshop: Providing Scientific Advice to Implement the Precautionary Approach under the Magnuson-Stevens Fishery Conservation and Management Act, NOAA Technical Memorandum NMFS-F/SPO-40, ed. V. R. Restrepo (Silver Spring, MD: National Marine Fisheries Service), 34–45.
General Fisheries Commission for the Mediterranean (GFCM) (2009). Resolution GFCM/33/2009/2 on the Establishment of Geographical Subareas in the GFCM Area of Application, Amending Resolution GFCM/31/2007/2. Rome: General Fisheries Commission for the Mediterranean.
General Fisheries Commission for the Mediterranean (GFCM) (2019a). Scientific Advisory Committee on Fisheries (SAC). Working Group on Stock Assessment of Demersal Species (WGSAD). Rome: FAO.
General Fisheries Commission for the Mediterranean (GFCM) (2019b). Scientific Advisory Committee on Fisheries (SAC). Working Group on Stock Assessment of Small Pelagic Species (WGSASP). Rome: FAO.
General Fisheries Commission for the Mediterranean (GFCM) (2020). Scientific Advisory Committee on Fisheries (SAC). Report of the Benchmark Session for the Assessment of Sardine and Anchovy in GSAs 17-18. Working Group on Stock Assessment of Small Pelagic Species (WGSASP). Rome: FAO.
ICCAT (2017). Report of the 2017 ICCAT albacore species group intersessional meeting (including assessment of Mediterranean albacore). Collect. Vol. Sci. Pap. ICCAT 74, 508–583.
ICCAT (2018). Report of the 2018 ICCAT Bigeye Tuna Stock Assessment Meeting, ICCATSCRS. Pasaia: ICCAT.
IOTC (2017). Report of the 13th Session of the IOTC Working Party on Ecosystems and Bycatch, IOTC–2017–WPEB13. San Sebastian: IOTC.
Jackson, J. B. C., Kirby, M. X., Berger, W. H., Bjorndal, K. A., Botsford, L. W., Bourque, B. J., et al. (2001). Historical overfishing and the recent collapse of coastal ecosystems. Science 293, 629–638. doi: 10.1126/science.1059199
Karaiskou, N., Apostolidis, A., Triantafyllidis, A., Kouvatsi, A., and Triantafyllidis, C. (2003). Genetic identification and phylogeny of three species of the genus Trachurus based on mitochondrial DNA analysis. Mar. Biotechnol. 5, 493–504. doi: 10.1007/s10126-002-0099-5
Kristensen, K., Nielsen, A., Berg, C. W., Skaug, H. J., and Bell, B. (2015). TMB: automatic differentiation and Laplace approximation. J. Stat. Softw. 70, 1–21. doi: 10.18637/jss.v070.i05
Leonori, I., De Felice, A., Biagiotti, I., Canduci, G., Costantini, I., and Malavolti, S. (2017). “La valutazione degli stock dei piccoli pelagici in Adriatico: l’approccio acustico,” in Il mare Adriatico e le sue risorse, eds M. Marini, G. Bombace, and G. Iacobone (Palermo: Carlo Saladino Editore), 61–79.
Leonori, I., De Felice, A., Campanella, F., Biagiotti, I., and Canduci, G. (2011). Assessment of small pelagic fish biomass in the Western Adriatic Sea by means of acoustic methodology. Fish. Sea Resour. Mar. Res. CNR DTA/06-2011, 2019–2029.
Leonori, I., Tičina, V., De Felice, A., Vidjak, O., Grubišić, L., and Pallaoro, A. (2012). Comparisons of two research vessels’ properties in the acoustic surveys of small pelagic fish. Acta Adriat. 53, 389–398.
Leonori, I., Tičina, V., Giannoulaki, M., Hattab, T., Iglesias, M., Bonanno, A., et al. (2021). History of hydroacoustic surveys of small pelagic fish species in the European Mediterranean Sea. Mediterr. Mar. Sci. In press. doi: 10.12681/mms.26001
Lleonart, J., and Maynou, F. (2003). Fish stock assessment in the Mediterranean: state of the art. Sci. Mar. 67, 37–49. doi: 10.3989/scimar.2003.67s137
Marini, M., Bombace, G., and Iacobone, G. (2017). Il mare Adriatico e le sue risorse. Palermo: Carlo Saladino Editore, 267.
Maunder, M. N. (2003). Is it time to discard the Schaefer model from the stock assessment scientist’s toolbox? Fish. Res. 61, 145–149. doi: 10.1016/S0165-7836(02)00273-4
Maunder, M. N., and Piner, K. R. (2015). Contemporary fisheries stock assessment: many issues still remain. ICES J. Mar. Sci. 72, 7–18. doi: 10.1093/icesjms/fsu015
McAllister, M. K. (2014). A generalized Bayesian surplus production stock assessment software (BSP2). Collect. Vol. Sci. Pap. ICCAT 70, 1725–1757.
MEDIAS Handbook (2019). Common Protocol for the Pan-MEditerranean Acoustic Survey (MEDIAS), Version Athens, Greece. 24. Available online at: http://www.mediasproject.eu/medias/website/handbooks-menu/handbooks/MEDIAS-Handbook-April-2019.pdf/
Methot, R. D., and Wetzel, C. R. (2013). Stock synthesis: a biological and statistical framework for fish stock assessment and fishery management. Fish. Res. 142, 86–99. doi: 10.1016/j.fishres.2012.10.012
Meyer, R., and Millar, R. B. (1999). BUGS in Bayesian stock assessments. Can. J. Fish. Aquat. Sci. 56, 1078–1086. doi: 10.1139/cjfas-56-6-1078
Mildenberger, T. K., Kokkalis, A., and Berg, C. W. (2021). Guidelines for the Stochastic Production Model in Continuos Time (SPiCT). Available online at: https://raw.githubusercontent.com
Needle, C. (2015). Using self-testing to validate the SURBAR survey-based assessment model. Fish. Res. 171, 78–86. doi: 10.1016/j.fishres.2015.03.001
Ono, K., Punt, A. E., and Rivot, E. (2012). Model performance analysis for Bayesian biomass dynamics models using bias, precision and reliability metrics. Fish. Res. 125-126, 173–183. doi: 10.1016/j.fishres.2012.02.022
Osio, G. C. (2012). The historical fisheries in the Mediterranean Sea: a reconstruction of trawl gear, effort and trends in demersal fish stocks. Diss. Abstr. Int. 74 Suppl. B:329.
Pauly, D. (1995). Anecdotes and the shifting baseline syndrome of fisheries. Trends Ecol. Evol. 10:430. doi: 10.1016/S0169-5347(00)89171-5
Pedersen, M. W., and Berg, C. W. (2017). A stochastic surplus production model in continuous time. Fish Fish. 18, 226–243. doi: 10.1111/faf.12174
Pella, J. J., and Tomlinson, P. K. (1969). A generalized stock production model. Bull. Inter Am. Trop. Tuna Comm. 13, 421–458.
Piccinetti, C., Vrgoć, N., Marćeta, B., and Manfredi, C. (2012). Recent State of demersal resources in the Adriatic Sea. Acta Adriat. 5, 1–220.
Piroddi, C., Gristina, M., Zylich, K., Greer, K., Ulman, A., Zeller, D., et al. (2015). Reconstruction of Italy’s marine fisheries removals and fishing capacity, 1950-2010. Fish. Res. 172, 137–147. doi: 10.1016/j.fishres.2015.06.028
Punt, A. E. (2003). Extending production models to include process error in the population dynamics. Can. J. Fish. Aquat. Sci. 60, 1217–1228. doi: 10.1139/f03-105
Punt, A. E., Akselrud, C. A., and Cronin-Fine, L. (2017). The effects of applying mis-specified age- and size-structured models. Fish. Res. 188, 58–73. doi: 10.1016/j.fishres.2016.11.017
Punt, A. E., and Szuwalski, C. (2012). How well can FMSY and BMSY be estimated using empirical measures of surplus production? Fish. Res. 134–136, 113–124. doi: 10.1016/j.fishres.2012.08.014
Ragonese, S., Fiorentino, F., Garofalo, G., Gristina, M., Levi, D., Gancitano, S., et al. (2004). Distribution, abundance and biological features of picarel (Spicara flexuosa), Mediterranean (Trachurus mediterraneus) and Atlantic (T. trachurus) horse mackerel based on experimental bottom-trawl data (MEDITS, 1994–2002) in the Strait of Sicily. MedSudMed Tech. Doc. 5, 110–114.
Rudd, M. B., Thorson, J. T., and Sagarese, S. R. (2019). Ensemble models for data-poor assessment: accounting for uncertainty in life-history information. ICES J. Mar. Sci. 76, 870–883. doi: 10.1093/icesjms/fsz012
Sánchez, P., Sartor, P., Recanses, L., Ligas, A., Martin, J., De Ranieri, S., et al. (2007). Trawl catch composition during different fishing intensity periods in two Mediterranean demersal fishing grounds. Sci. Mar. 71, 765–773. doi: 10.3989/scimar.2007.71n4765
Šantić, M., Jardas, I., and Pallaoro, A. (2002). Age, growth and mortality rates of horse mackerel, Trachurus trachurus (L.), living in the eastern central Adriatic. Period. Biol. 104, 165–173.
Šantić, M., Jardas, I., and Pallaoro, A. (2003). Biological parameters of Mediterranean horse mackerel, Trachurus mediterraneus (Steind.) in the eastern Adriatic. Period. Biol. 105, 393–399.
Shaboneyev, I. Y. (1981). Systematics, morpho-ecological characteristics and origin of Carangids of the genus Trachurus. J. Ichthyol. 20, 15–24.
Shepherd, J. G. (1999). Extended survivors analysis: an improved method for the analysis of catch-at-age data and abundance indices. ICES J. Mar. Sci. 56, 584–591. doi: 10.1006/jmsc.1999.0498
Sinovčić, G. (2001). Small Pelagic Fish from the Croatian Fishing Grounds. (Split, Croatia 12th-13th October 2000). Annex of GCP/RER/010/ITA/TD-03; AdriaMed Technical Documents No 3. Available online at: https://www.faoadriamed.org/pdf/publications/
Souplet, A. (1996). “Calculation of abundance indices and length frequencies in the MEDITS survey,” in Campagne internationale de chalutage demersal en Mediterranee (MEDITS). Campagne 1995. Rapport final Vol. 11I. Rapport de contract CEEIFREMER-IEO-SIBM-NCMR (MED/93/020, 018, 006, 004), eds J. Bertrand et al. 5–9.
Sparre, P., and Venema, S. C. (1998). Introduction to Tropical Fish Stock Assessment. Part 1. Manual. FAO Fish. Tech. Pap. No. 306.1, Rev. 2. Rome: FAO, 407.
Spedicato, M. T., Massutí, E., Mérigot, B., Tserpes, G., Jadaud, A., and Relini, G. (2019). The MEDITS trawl survey specifications in an ecosystem approach to fishery management. Sci. Mar. 83S1, 9–20. doi: 10.3989/scimar.04915.11X
Thorson, J. T., Cope, J. M., Branch, T. A., and Jensen, O. P. (2012). Spawning biomass reference points for exploited marine fishes, incorporating taxonomic and body size information. Can. J. Fish. Aquat. Sci. 69, 1556–1568. doi: 10.1139/f2012-077
Tičina, V. (2000). Biology and Commercial Importance of Sprat (Sprattus sprattus phalericus L.) in the Adriatic Sea. (in Croatian) Ph.D. Thesis. Zagreb: Faculty of natural sciences, University of Zagreb, 133.
Tičina, V., and Giovanardi, O. (1997). “Osservazioni sulla pesca del “pesce azzurro”,” in Alto Adriatico Pesca e Ambiente nella laguna di Venezia e nell’Alto Adriatico, eds O. Giovanardi and F. Pranovi (Chioggia: ICRAM-Fondazione della pesca di Chioggia), 91–97.
Tičina, V., Katavić, I., Dadić, V., Marasović, I., Kršinić, F., Grbec, B., et al. (2006). Acoustic estimates of small pelagic fish stocks in the eastern part of Adriatic Sea. Biol. Mar. Mediterr. 13 Part 2, 124–136.
Tičina, V., Vidjak, O., and Kačić, I. (2000). Feeding of adult sprat, Sprattus sprattus, during spawning season in the Adriatic Sea. Ital. J. Zool. 67, 307–311. doi: 10.1080/11250000009356329
Tsikliras, A. C., Touloumis, K., Pardalou, A., Adamidou, A., Keramidas, I., Orfanidis, G. A., et al. (2021). Status and exploitation of 74 un-assessed demersal fish and invertebrate stocks in the Aegean Sea (Greece) using abundance and resilience. Front. Mar. Sci. 7:578601. doi: 10.3389/fmars.2020.578601
Keywords: sprat, horse mackerel, Adriatic Sea, surplus production model, survey-based stock assessment
Citation: Angelini S, Armelloni EN, Costantini I, De Felice A, Isajlović I, Leonori I, Manfredi C, Masnadi F, Scarcella G, Tičina V and Santojanni A (2021) Understanding the Dynamics of Ancillary Pelagic Species in the Adriatic Sea. Front. Mar. Sci. 8:728948. doi: 10.3389/fmars.2021.728948
Received: 22 June 2021; Accepted: 25 October 2021;
Published: 23 November 2021.
Edited by:
Oscar Sosa-Nishizaki, Center for Scientific Research and Higher Education in Ensenada (CICESE), MexicoReviewed by:
Emiliano García-Rodríguez, Center for Scientific Research and Higher Education in Ensenada (CICESE), MexicoWeiwei Xian, Institute of Oceanology, Chinese Academy of Sciences (CAS), China
Copyright © 2021 Angelini, Armelloni, Costantini, De Felice, Isajlović, Leonori, Manfredi, Masnadi, Scarcella, Tičina and Santojanni. This is an open-access article distributed under the terms of the Creative Commons Attribution License (CC BY). The use, distribution or reproduction in other forums is permitted, provided the original author(s) and the copyright owner(s) are credited and that the original publication in this journal is cited, in accordance with accepted academic practice. No use, distribution or reproduction is permitted which does not comply with these terms.
*Correspondence: Silvia Angelini, c2lsdmlhLmFuZ2VsaW5pQGNuci5pdA==