 Alexander Osadchiev1,2*
 Dmitry Frey1,3
 Eduard Spivak4Sergey Shchuka1,2Natalia Tilinina1
 Igor Semiletov4,5
- 1Shirshov Institute of Oceanology, Russian Academy of Sciences, Moscow, Russia
- 2Moscow Institute of Physics and Technology, Dolgoprudny, Russia
- 3Marine Hydrophysical Institute of RAS, Sevastopol, Russia
- 4V.I. Il’Ichev Pacific Oceanological Institute, Far Eastern Branch of the Russian Academy of Sciences, Vladivostok, Russia
- 5Institute of Ecology, Higher School of Economics, Moscow, Russia
This work is focused on the structure and inter-annual variability of the freshened surface layer (FSL) in the Laptev and East-Siberian seas during ice-free periods. This layer is formed mainly by deltaic rivers among which the Lena River contributes about two thirds of the inflowing freshwater volume. Based on in situ measurements, we show that the area of this FSL during certain years is much greater than the area of FSL in the neighboring Kara Sea, while the total annual freshwater discharge to the Laptev and East-Siberian seas is 1.5 times less than to the Kara Sea (mainly from the estuaries of the Ob and Yenisei rivers). This feature is caused by differences in morphology of the estuaries and deltas. Shallow and narrow channels of the Lena Delta are limitedly affected by sea water. As a result, undiluted Lena discharge inflows to sea from multiple channels and forms relatively shallow plume, as compared to the Ob-Yenisei plume, which mixes with subjacent saline sea water in deep and wide estuaries. Due to small vertical extents of FSL in the Laptev and East-Siberian seas, wind conditions strongly affect its spreading and determine its significant inter-annual variability, as compared to relatively stable FSL in the Kara Sea. During years with prevailing western and northern winds, FSL is localized in the southern parts of the Laptev and East-Siberian seas due to southward Ekman transport, meridional extent (<250 km) and area (∼250,000 km2) of FSL are relatively small. During years with strong eastern winds FSL spreads northward over large area (up to 500,000 km2), its meridional extent increases up to 500–700 km. At the same time, area and position of FSL do not show any dependence on significant variability of the annual river discharge volume and ice coverage during warm season.
Introduction
The shallow Laptev and East-Siberian seas are located in the Eastern Arctic and comprise approximately a quarter of the Arctic shelf (Figure 1). These seas receive large river discharge that forms sea-wide freshened surface layer (FSL). This FSL is the largest freshened surface layer in the World Ocean in terms of area (Kang et al., 2013) and is among the largest freshwater reservoirs in the Arctic Ocean in terms of volume (Haine et al., 2015; Williams and Carmack, 2015). As a result, knowledge about structure and variability of this FSL is essential for assessment of large-scale freshwater transport in the Arctic Ocean, which plays a key role in stratification and ice formation (Polyakov et al., 2013; Carmack et al., 2015, 2016). Spreading and transformation of freshwater discharge in the Arctic Ocean also affects many physical, biological, and geochemical processes in the Eastern Arctic, including water circulation, transport of dissolved and suspended sediments, primary productivity, anthropogenic pollution, acidification, and deposit of terrigenous material (Li et al., 2009; Yamamoto-Kawai et al., 2009; McLaughlin and Carmack, 2010; Semiletov et al., 2011, 2012, 2016; Tremblay et al., 2011; Dudarev et al., 2015; Nummelin et al., 2016; Dubinina et al., 2019a,b; Pogojeva et al., 2021; Yakushev et al., 2021).
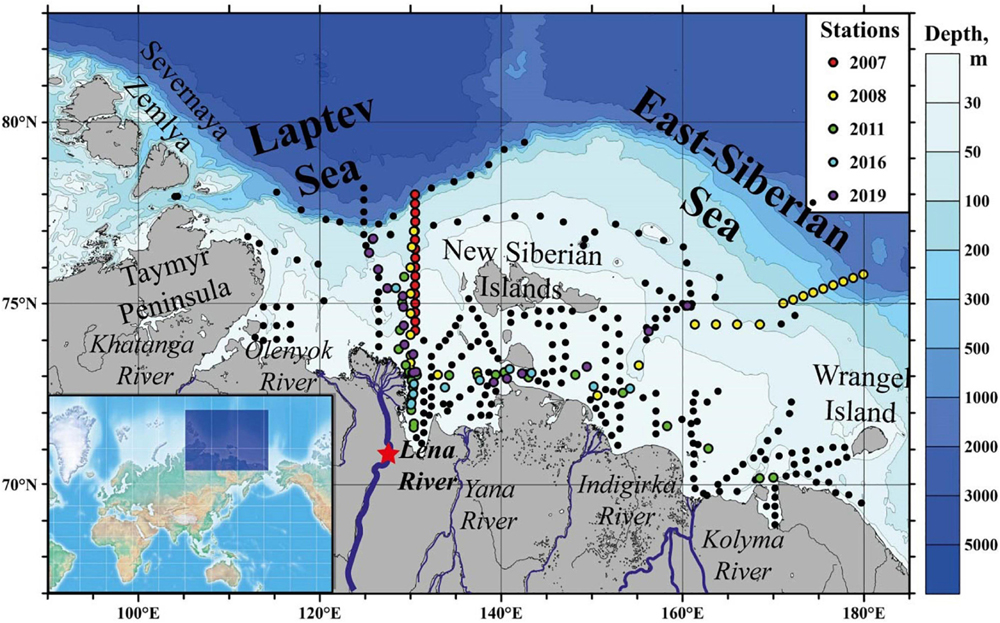
Figure 1. Study area; main rivers inflowing to the Laptev and East-Siberian seas (blue lines); locations of hydrographic stations (black dots) and stations were vertical thermohaline measurements were organized in zonal and meridional transects (color dots); location of the gauge station at the Lena River (red star). The inset shows location of the study area at the World map.
Generally, river discharge and wind forcing control structure, dynamics, and variability of river plumes (Garvine, 1987; O’Donnell, 1990; Whitney and Garvine, 2005), including those formed by large rivers (Grodsky et al., 2014; Vic et al., 2014; Fournier et al., 2017; Osadchiev, 2017). However, various regional features, such as coastline configuration, river mouth morphology, bathymetry, interaction between neighboring river plumes, sea ice, among others, strongly affect river plumes, which results in significant variety of spreading and mixing patterns of river plumes in the World Ocean (Horner-Devine et al., 2015). This fact supports necessity of regional field studies of river plumes in different climatic and oceanographic conditions.
General spreading pattern of FSL in the Laptev and East-Siberian seas was described in previous works. Berezovskaya et al. (2002); Dmitrenko et al. (2005)Dmitrenko et al. (2008), and Janout et al. (2020) showed that atmospheric vorticity in the study area controls variability of spreading of FSL on inter-annual and quasi-decadal timescales. Fofonova et al. (2015) demonstrated that even moderate wind forcing (>6 m/s) strongly affects dynamics of the Lena plume, while tides play secondary role in plume dynamics. Osadchiev et al. (2020b) revealed that intensity of freshwater transport from the Laptev Sea to the East-Siberian Sea during ice-free periods is governed by eastward Ekman transport at the southeastern Laptev Sea and is prone to large synoptic variability.
However, in these studies, limited attention was paid to vertical structure of FSL in the Laptev and East-Siberian seas, including its seasonal and inter-annual variability. The processes of initial mixing between freshwater and seawater near river deltas and formation of FSL also remain largely unstudied. The objective of this study is to make progress at these aspects using extensive in situ data set collected at this remote region with hard climatic conditions and short ice-free season. This study continues our previous research of river plumes and FSL’s in the Eastern Arctic focused, first, on regional processes and specific river plumes (Ob, Yenisei, Khatanga, Lena, Indigirka, and Kolyma) (Osadchiev, 2017; Osadchiev et al., 2017, 2019, 2020a,c, 2021b; Spivak et al., 2021) and, second, on large-scale freshwater transport in the Eastern Arctic (Osadchiev et al., 2020b, 2021a).
In this study, we analyze continuous surface measurements and surface measurements at hydrographic stations performed during 17 field surveys in 1999–2019 (Table 1). Also, we describe in detail vertical structure of FSL during ice-free season obtained from in situ measurements at hydrographic stations along the zonal and meridional transects across this layer performed in 2007, 2008, 2011, 2016, and 2019 (Figure 1, colored circles). In order to reveal dependences between the position and vertical structure of FSL and the external forcing conditions, we analyze freshwater discharge from the Lena Delta, wind forcing, and ice conditions in Laptev and East-Siberian seas during summer and autumn.
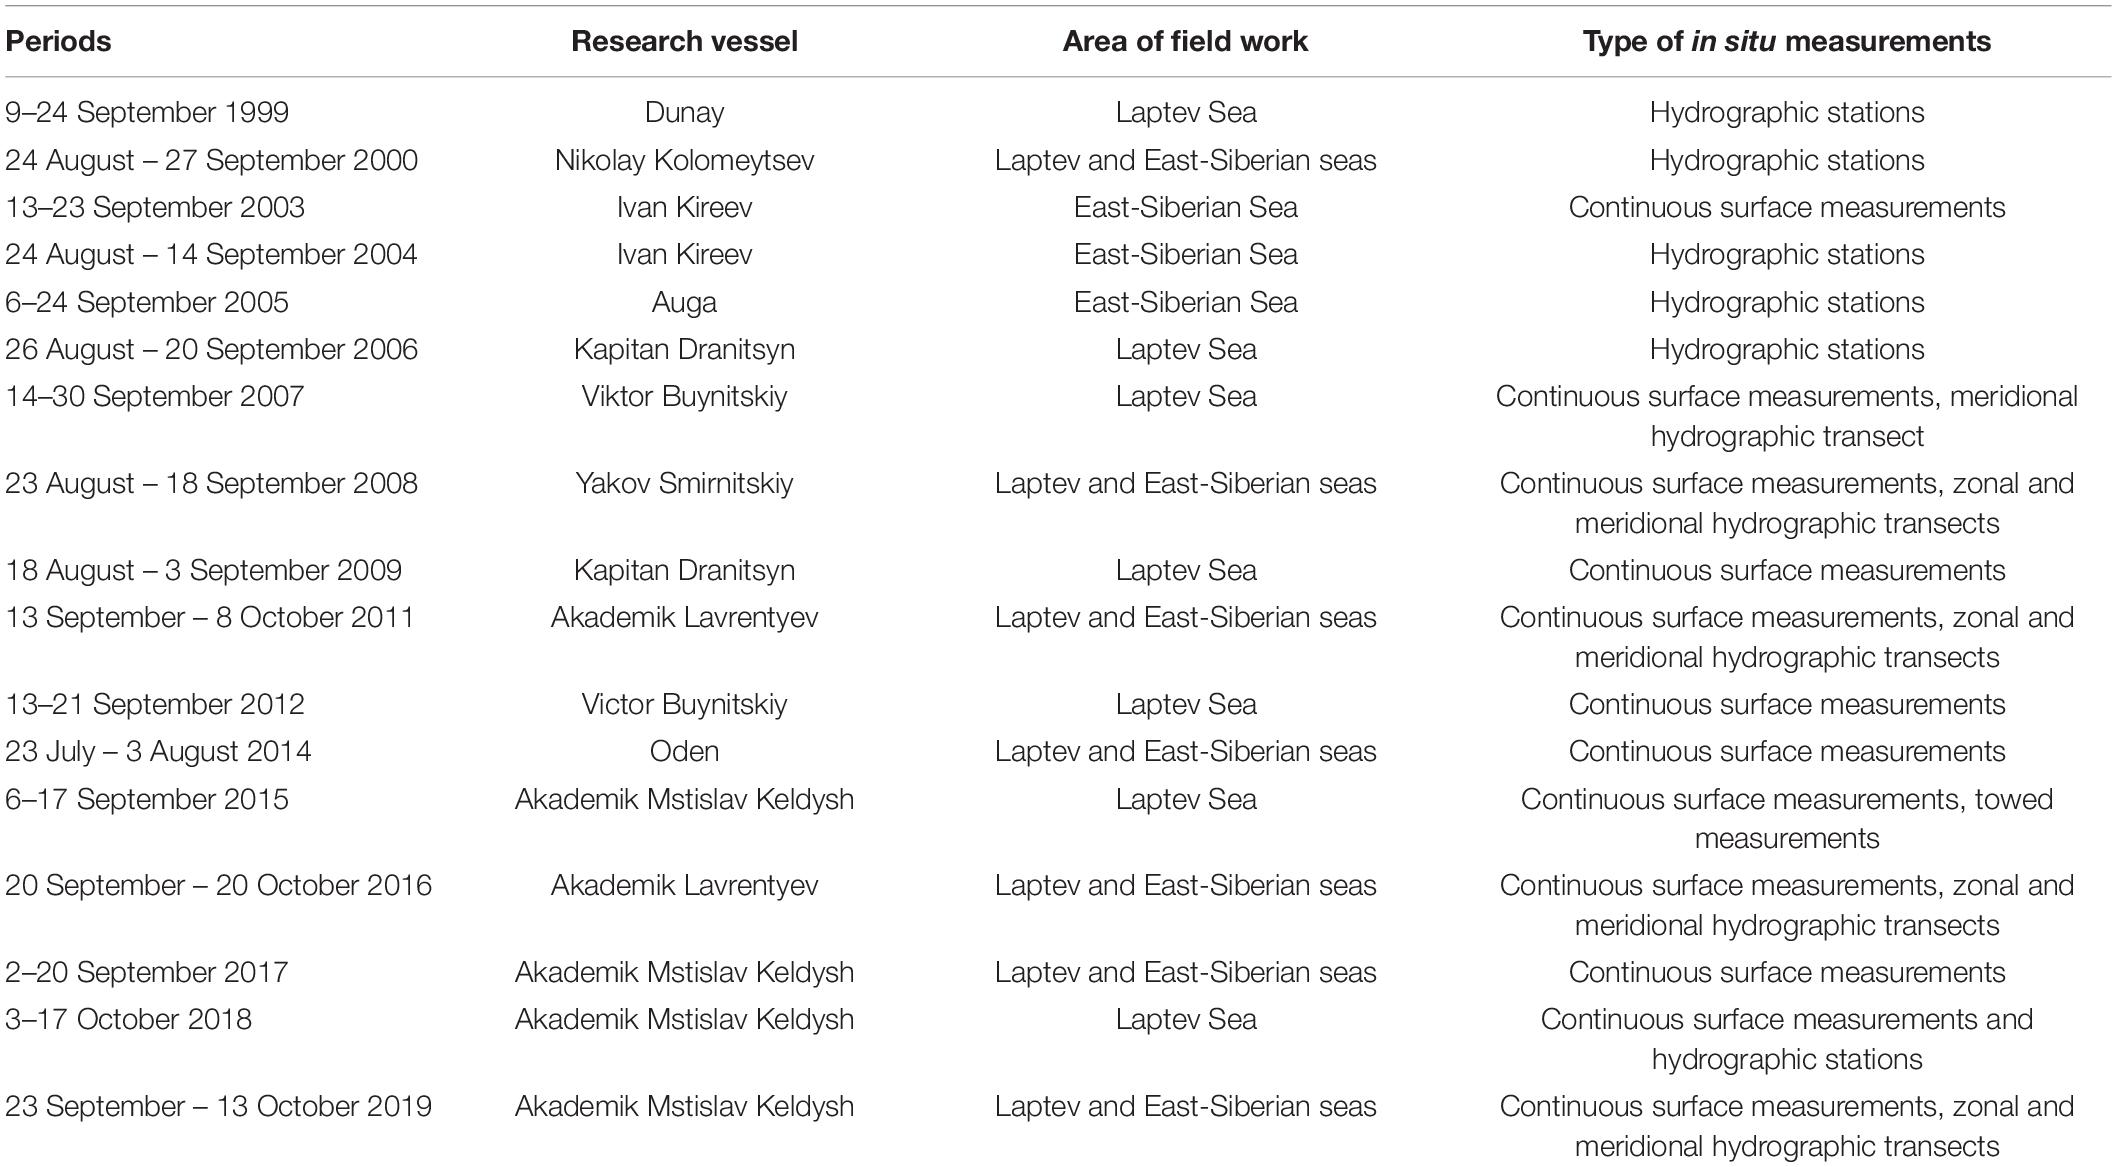
Table 1. Periods, research vessels, areas of field work, and types of in situ measurements of oceanographic surveys.
The main strength of this study consists in analysis of very extensive in situ dataset for studying FSL. Satellite products can potentially support determination of spatial extents and internal structure of FSL, however, satellite data is useful only if it is validated against in situ data. Despite certain progress in deriving sea surface salinity from satellite measurements in the Arctic Ocean, these products demonstrate proper accuracy only for high salinity values (>28–30), while there is no evidence that they operate well at salinities <25, which are typical for FSL (Matsuoka et al., 2016; Olmedo et al., 2018; Tang et al., 2018; Supply et al., 2020). In particular, satellite-derived sea surface salinity at the study area analyzed recently by Tarasenko et al. (2021) was not properly validated against in situ salinity data for low-saline shelf areas. As a result, the presented satellite-derived salinity distributions did not reproduce sharp salinity gradients typical for the outer border of FSL. The area of FSL was overestimated due to artifacts of satellite-derived salinity, and the resulting temporal variability of FSL is speculative. The latter demonstrates crucial importance of in situ salinity measurements for study FSL’s in the Arctic Ocean.
The paper is organized as follows. Section “Study Area, Data, and Methods” provides general information about the study region and describes the extensive in situ data set analyzed in this work, as well as atmospheric reanalysis, river discharge, and satellite-derived ice coverage data. The relation between atmospheric forcing, river discharge, and ice conditions, on the one hand, and the spatial extents and vertical structure of FSL in the Laptev and East-Siberian seas, on the other hand, is analyzed in section “Results.” Influence of morphology of freshwater sources, i.e., river deltas, as well as external forcing conditions on structure, dynamics, and variability of FSL are discussed in section “Discussion.” The conclusions are presented in section “Conclusion.”
Study Area, Data, and Methods
Study Area
The Laptev and East-Siberian seas are marginal and shallow seas in the Eastern Arctic Ocean (Figure 1). The Laptev Sea is located between the Siberian coast in the south, the Taymyr Peninsula and Severnaya Zemlya Archipelago in the west, and the New Siberian Islands in the east. The East-Siberian Sea is located between the Siberian coast in the south, the New Siberian Islands in the west, and the Wrangel Island in the east. Approximately half of the Laptev Sea and almost the whole area of the East-Siberian Sea rest on the continental shelf. The majority of this shelf area is shallower than 50 m. The shelf break is located 100–200 km far from the continental shore in the western part of the Laptev Sea. The shelf width increases to 700–1,000 km in the eastern part of the Laptev Sea and in the East-Siberian Sea.
The Laptev and East-Siberian seas receive 750–820 and 200–250 km3 of river discharge annually, respectively. The majority of these volumes is provided by discharges from large deltaic rivers, namely, the Lena (590 km3), Olenyok (36 km3), and Yana (36 km3) rivers in the Laptev Sea and the Kolyma (136 km3) and Indigirka (61 km3) rivers in the East-Siberian Sea (Gordeev et al., 1996; Pavlov et al., 1996). The Khatanga River (105 km3) is the only large estuarine river in this region, which inflows to the southwestern Laptev Sea (Osadchiev et al., 2020a). Approximately 90% of annual river runoff inflows to the Laptev and East-Siberian seas in June – October and forms large FSL in these seas (Polyakov et al., 2003; Semiletov et al., 2005).
The Laptev and East-Siberian seas are covered by ice during the majority of year. Melting out of sea ice at the southern parts of the Laptev and East-Siberian seas along the Siberian coast occurs in June–July. Ice cover in the offshore parts of these seas shows significant inter-annual variability. According to satellite sea ice products, during certain years (e.g., 2013, 2014, and 2018) the southern boundary of ice cover was located less than 200–300 km far from the Siberian coast in the middle of September. The opposite situation was observed in 2012, 2017, and 2019, when almost the whole area of the Laptev and East-Siberian seas was free of ice in August–October. Ice formation starts in the end of October and from the middle of November these seas are covered by ice.
General water circulation at the shallow shelf areas in the Laptev and East-Siberian seas is wind-driven (Pavlov et al., 1996; Berezovskaya et al., 2002; Dmitrenko et al., 2005, 2008; Fofonova et al., 2015) with important role of barotropic wind-induced upwelling events (Dmitrenko et al., 2001; Osadchiev et al., 2020c). In absence of strong wind forcing, the Coriolis force and large salinity gradient between FSL and ambient shelf water induce eastward baroclinic flow along the coast, which induces large-scale freshwater transport from the Laptev Sea to the East-Siberian Sea and further to the Chukchi Sea (Munchow et al., 1999; Weingartner et al., 1999; Carmack et al., 2015; Osadchiev et al., 2020b). A large part of FSL is also transported northward across the shelf break to the central part of the Arctic Ocean as a part of the Transpolar Drift current (Ekwurzel et al., 2001; Guay et al., 2001; Schlosser et al., 2002; Charette et al., 2020). Tidal circulation in the Laptev and East-Siberian seas is governed by semidiurnal tides (Kowalik and Proshutinsky, 1994; Kagan et al., 2008, 2010). Tidal-induced mixing affects FSL to a certain extent (Fofonova et al., 2015). However, it is less intense at the inner shelf (Padman and Erofeeva, 2004; Janout and Lenn, 2014) and during the ice-free period (Dmitrenko et al., 2012), except the southwestern part of the Laptev Sea, which receives discharge from the Khatanga River (Osadchiev et al., 2020a).
In this study, we consider two types of water masses with different thermohaline and dynamical properties, which compose FSL in the Laptev and East-Siberian seas. We distinguish a number of mesoscale river plumes (Lena plume, Kolyma plume, Khatanga plume, etc.) and one joint region of freshwater influence (Laptev/East-Siberian ROFI) (Osadchiev and Zavialov, 2019; Osadchiev et al., 2021a). River plumes are low-saline water masses with spatial extents ∼10–100 km, which are adjacent to river deltas and estuaries. River plumes represent initial transformation of freshwater discharge in the sea, i.e., residence time of river water within a river plume is less than several weeks. As a result, structure and dynamics of a river plume have quick response to variability of river discharge rate. The Laptev/East-Siberian ROFI, on the opposite, is a relatively stable water mass with spatial extents ∼1000 km. Residence time of river water within the ROFI is large, therefore the ROFI shows variability on seasonal and inter-annual temporal scales. The Lena plume and the plumes formed by smaller rivers on the study area are embedded into the Laptev/East-Siberian ROFI. River plumes together with the ROFI compose FSL in the Laptev and East-Siberian seas. Analogously to the Kara Sea, we determine river plumes as water areas with salinities <15 and the Laptev/East-Siberian ROFI as the area with salinities between 15 and 25 (Osadchiev et al., 2021a).
Data and Methods
In this work, we analyzed an extensive in situ data set, which was collected in 1999–2019 during 17 oceanographic surveys in the Laptev and East-Siberian seas (Table 1). Continuous measurements of salinity in the surface layer (2–3 m depth) were carried during 12 cruises in 2003, 2007–2009, 2011–2012, and 2014–2019. These measurements were performed along the ship track using a shipboard pump-through system equipped with a thermosalinograph (SBE 21 SeaCAT) with a frequency of 1 Hz. Vertical thermohaline measurements analyzed in this study were performed using a CTD instrument (SBE 911plus) at a 24 Hz sampling rate. These measurements were organized along quasi-meridional (in 2007, 2008, 2011, 2016, and 2019) and quasi-zonal (in 2008, 2011, 2016, and 2019) transects starting from the eastern part of the Lena Delta (Figure 1, color dots). Also we used surface salinity data collected at hydrographic stations distributed in the southeastern Laptev Sea and the southwestern East-Siberian Sea (not organized in zonal or meridional transects), which were performed in 1999, 2000, 2004, 2005, and 2006. Continuous measurements of vertical thermohaline structure along the ship track were performed by a towed CTD instrument (Idronaut 320 Plus) along the eastern part of the Lena Delta in 2015. The CTD instrument was installed into a streamlined and dynamically balanced body, which was towed along the ship track aside of the ship wake and was repeatedly lowered and raised between the sea surface and the bottom. The measurement rate was 27 cycles per second. The horizontal towing velocity was about 2 m s–1, while the vertical lowering/raising velocity was about 1 m s–1. Horizontal/vertical resolution of the obtained CTD data is about 0.5/0.25 m. The CTD-data were processed based on standard programming package (SBE Data Processing, version 7.26.7) using recommended settings (Sea-Bird Electronics, 2017).
Wind forcing conditions and atmospheric pressure during 1999–2019 were examined using ERA5 atmospheric reanalysis with a 0.25° spatial and hourly temporal resolution (Hersbach et al., 2020). The ERA5 reanalysis data were downloaded from the European Centre for Medium-Range Weather Forecasts (ECMWF) website1. The Lena River discharge measurements analyzed in this study were acquired during 1999–2019 in the most downstream gauge station located in Kyusyur (Figure 1, red star), which is approximately 300 km far from the sea. Therefore, we shifted the daily discharge rates measured at this station by 7 days onward to obtain the freshwater discharge rate from the Lena Delta to the Laptev Sea according to estimate of the flow speed in the lower part of the Lena River (0.5 m/s) during the beginning of the freshet period (Kääb et al., 2013). The river discharge data were downloaded from the Arctic Great Rivers Observatory (ArcticGRO) website2. The sea ice data retrieved for 1999–2019 from satellite products were downloaded from the Arctic and Antarctic Research Institute (AARI) website3.
Results
Atmospheric Forcing, River Discharge, and Ice Conditions
Monthly averaged wind forcing conditions and sea level pressure shortly before and during the field surveys when detailed measurements of the vertical structure of FSL were performed along the zonal and meridional transects (2007, 2008, 2011, 2016, and 2019) are shown in Figures 2, 3. Figure 2 shows prevailing western and northern winds at the shelf area of the Laptev and East-Siberian seas in August–September 2007 (average wind speed 4–6 m/s) and in September–October 2016 (6–9 m/s). Figure 3 shows opposite wind conditions for 2008, 2011, and 2019. In particular, eastern and southern winds prevailed at the shelf area in August–September 2008 (average wind speed 5–7 m/s). Strong eastern winds prevailed in August 2011 (7–9 m/s) followed by moderate winds with complex pattern (western in the Laptev Sea and eastern in the East-Siberian Sea) in September 2011 (4–5 m/s) and strong eastern wind in October 2011 (9–10 m/s). Strong eastern winds prevailed in August–September 2019 (6–9 m/s), which then switched to western winds in October 2019.
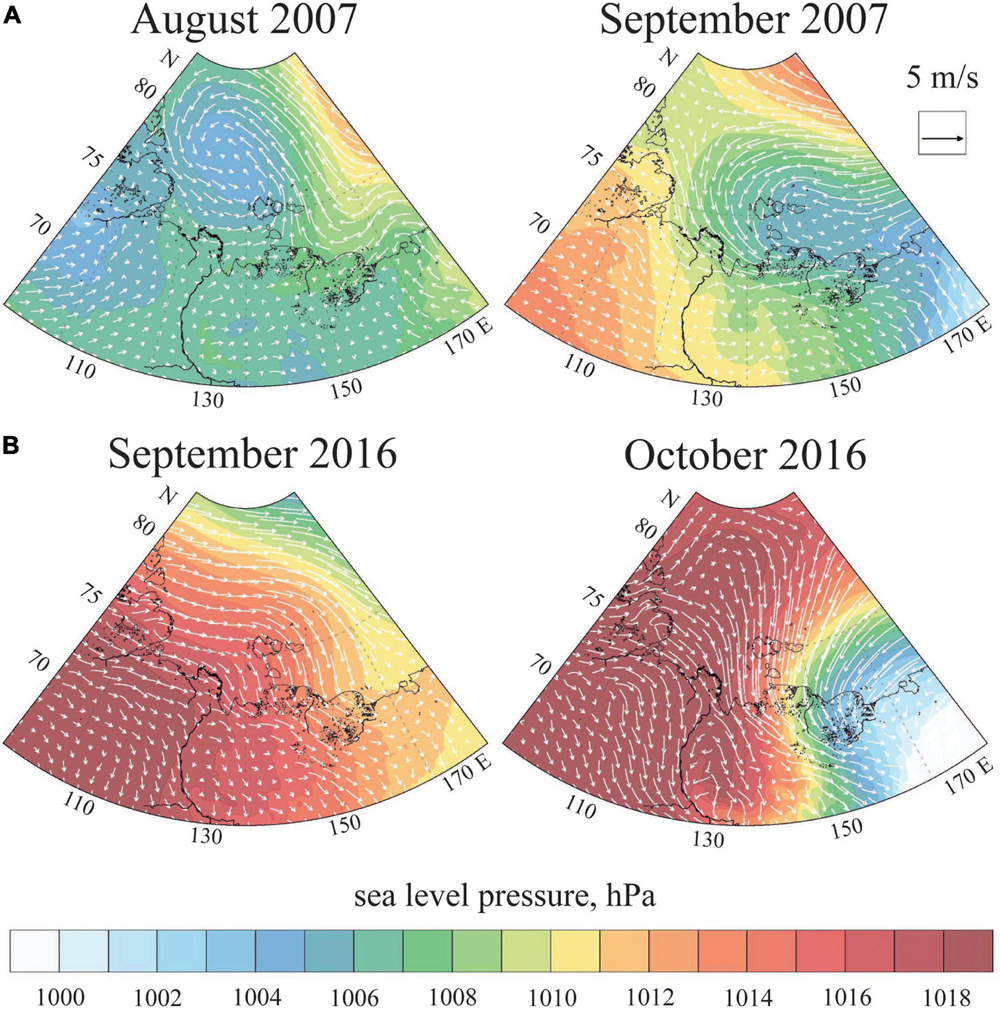
Figure 2. Monthly averaged wind forcing (arrows) and sea level pressure (color) in the Laptev and East-Siberian seas in August and September 2007 (A), and September and October 2016 (B).
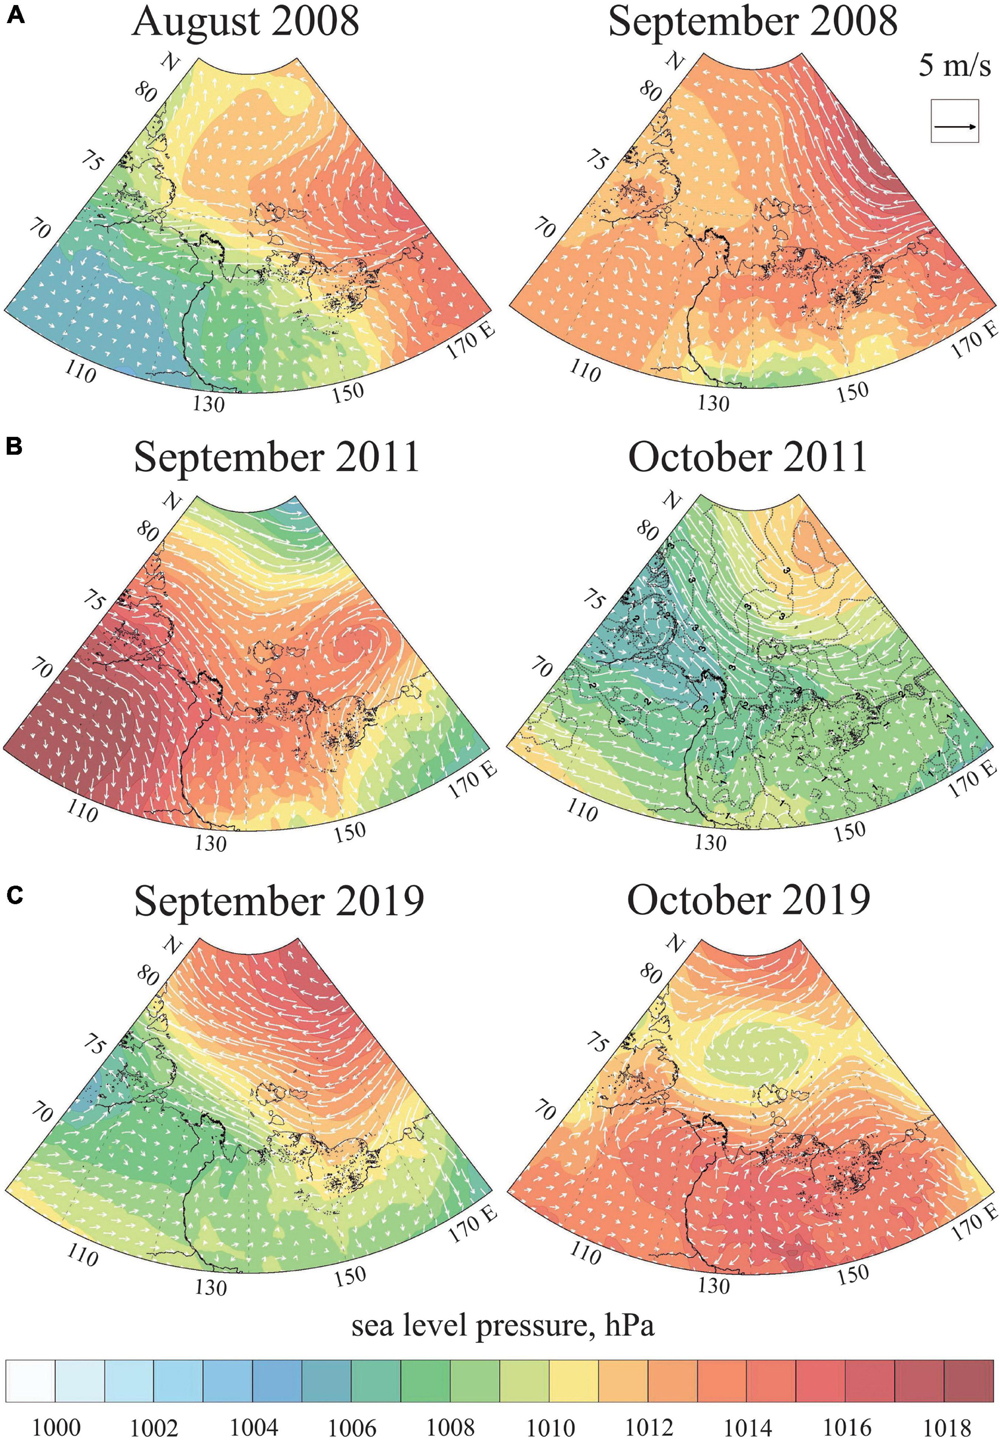
Figure 3. Monthly averaged wind forcing (arrows) and sea level pressure (color) in the Laptev and East-Siberian seas in August and September 2008 (A), September and October 2011 (B), and September and October 2019 (C).
The main sources of fresh water in the Laptev and East-Siberian seas are river discharge and ice melting. The role of annual precipitation (100–300 mm) is negligible, because it is mostly provided during the cold season, when the seas are covered by ice (Pavlov et al., 1996). Due to low air temperatures over these seas (<5°C during ice-free season), evaporation also play insignificant role in the regional freshwater balance (Pavlov et al., 1996; Lambert et al., 2019). Discharge rate of the Lena River is characterized by a distinct freshet in June–July (up to 80,000–140,000 m3/s) followed by steady decrease of discharge until November (5,000–10,000 m3/s) and low discharge period in December–May (2,000–3,000 m3/s) (Figure 4A). Total freshwater runoff from the Lena River in May–October during the last 20 years significantly varied from 390 km3 (2019), 420 km3 (2003), and 440 km3 (2011) to 600–610 km3 (2007, 2008, 2016, and 2018) (Figure 4B). Seasonal discharge variability of other rivers inflowing to the Laptev and East-Siberian seas is similar to that of the Lena River with short-term summer freshet and drought in winter and spring (Pavlov et al., 1996).
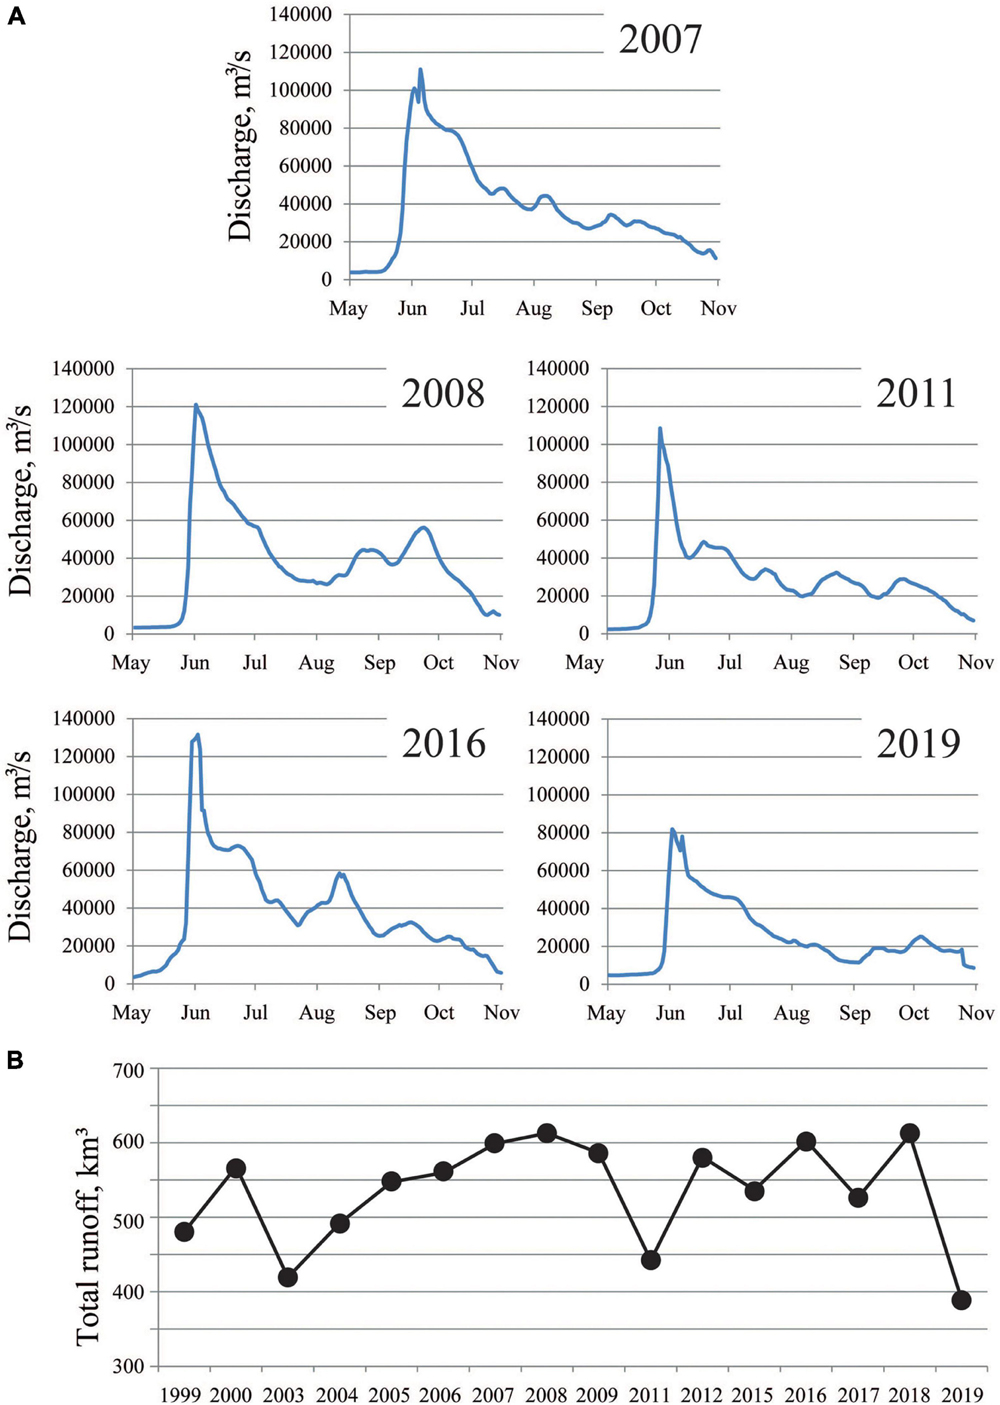
Figure 4. Discharge rates of the Lena River in May–October measured at the gauge station in Kyusyur in 2007, 2008, 2011, 2016, and 2019 (A) and total river runoff in May–October between 1999 and 2019 (B).
Ice conditions in the Laptev and East-Siberian seas also have large inter-annual variability. Figure 5 shows ice coverage in the Laptev and East-Siberian seas in the middle of July, August, and September for 2007, 2008, 2011, 2016, and 2019. In 2007 central parts of both seas were free of ice from the second half of July. In 2008, on the opposite, ice coverage was very extensive until the second half of August, ice melted in the central parts of these seas only in the middle of September. In 2011 and 2019, sea ice remained in the central East-Siberian Sea until the middle of September, while the Laptev Sea was free of ice by the middle of July. The opposite situation, i.e., ice-free East-Siberian Sea and ice-covered Laptev Sea by the middle of September, was observed in 2016.
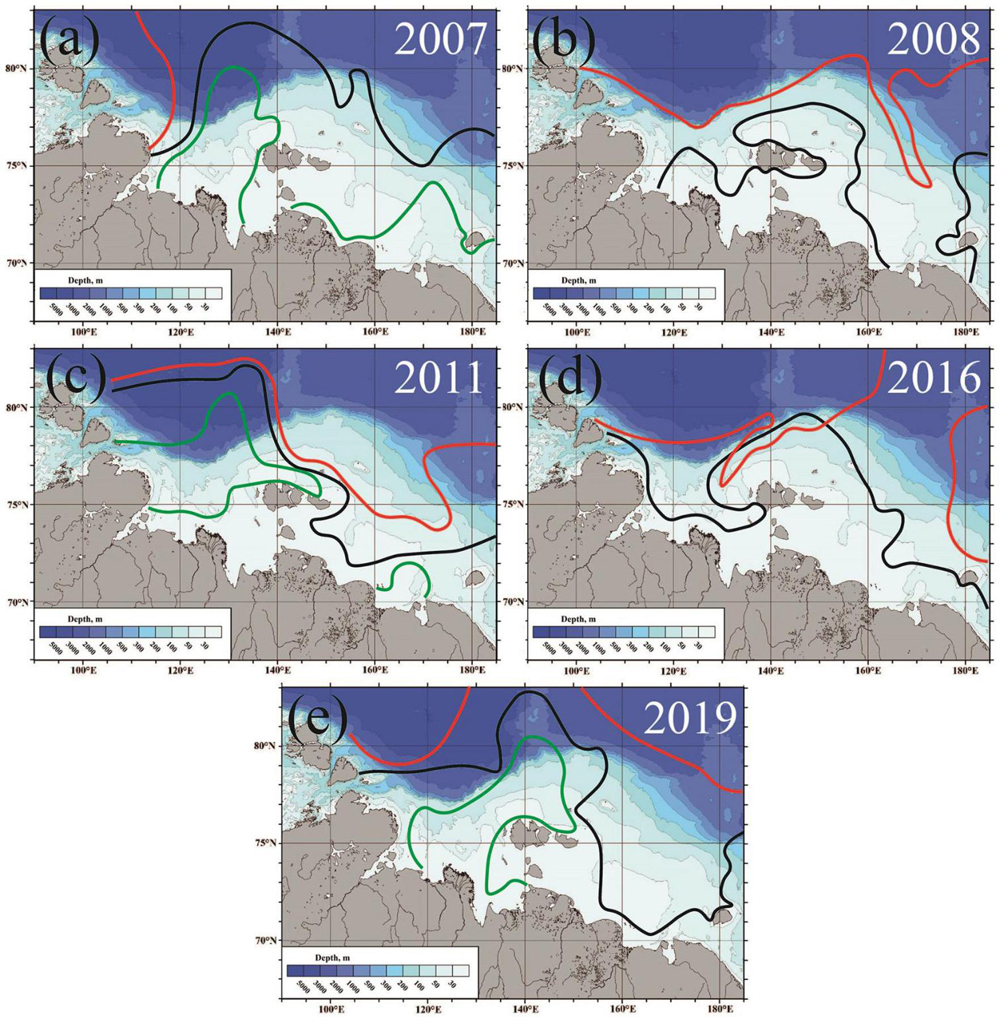
Figure 5. Position of the seasonal sea ice edge in the Laptev and East-Siberian seas on 15 July (green line), 15 August (black line), and 15 September (red line) in 2007 (a), 2008 (b), 2011 (c), 2016 (d), and 2019 (e).
Spatial Extents of Freshened Surface Layer
In this study, we address structure and spatial extents of the Lena plume (salinity <15) formed in the southeastern Laptev Sea and the Laptev/East-Siberian ROFI (salinity between 15 and 25), which occupy wide area in the eastern Laptev Sea and the western East-Siberian Sea. Analogously to FSL formed in the Kara Sea, we determine the isohaline of 15 as the boundary between the Lena plume and the Laptev/East-Siberian ROFI, while the isohaline of 25 represents the boundary between the Laptev/East-Siberian ROFI and the ambient sea (Osadchiev et al., 2021a).
Figure 6 shows the analyzed salinity dataset collected during 12 oceanographic field surveys in 2003–2019 with good spatial coverage of continuous in situ measurements in the surface layer along the ship track. The whole dataset was split into two groups according to predominant western/eastern winds at the study area defined by positive/negative zonal component of average wind speed. Predominant eastern winds result in distinct northward spreading of both the Lena plume and the ROFI (Figure 6a). Predominant western winds, on the opposite, press the Lena plume and the ROFI to the Siberian coast (Figure 6b).
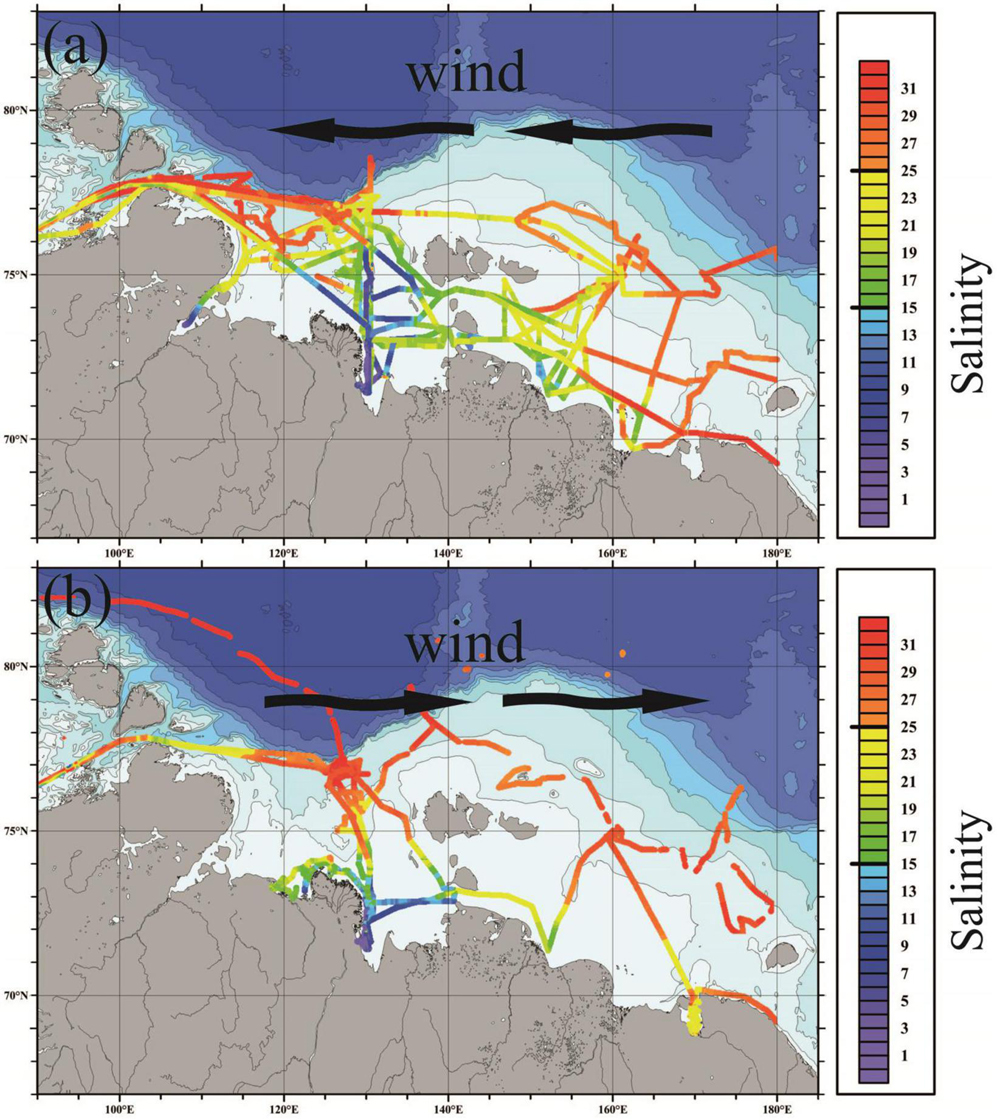
Figure 6. Salinity in the surface layer along the ship tracks in 2003, 2008, 2011, 2012, 2015, 2017, and 2019 (a) and in 2007, 2009, 2014, 2016, and 2018 (b) with predominant eastern (a) and western (b) winds in the Laptev and East-Siberian seas during ice-free period.
Figure 7 demonstrates locations of isohalines of 15 and 25 in the surface layer in the study area, which were reconstructed using discrete measurements at hydrologic stations and continuous measurements along the ship track. The reconstructed isohalines of 15 and 25 strictly correspond to areas covered by in situ measurements and were not extended arbitrary elsewhere. If measurements were limited to the southeastern part of the Laptev Sea (as in 1999 and 2005), only locations of the isohaline of 15 were drawn. If measurements were limited to one meridional transect from the Lena Delta (as in 2006 and 2015), locations of the isohalines of 15 and 25 were drawn only at this transect. Despite certain bias of detection of location of these isohalines based on discrete stations and individual ship tracks, the obtained data provides important information about positions, shapes, and sizes of the Lena plume and the Laptev/East-Siberian ROFI during the considered periods. A half of the considered field surveys took place in September (in several cases including a few days in August or October) (Table 1). Therefore, the obtained data set is representative of inter-annual variability (in September of different years) of spatial extents of the Lena plume and the Laptev/East-Siberian ROFI. Surface freshening attributed to sea ice can also bias determination of borders of the Lena plume and the Laptev/East-Siberian ROFI. However, according to Bauch et al. (2013) meltwater provides significant (compared to river discharge) freshening of surface layer only at salinities >30. Therefore, we presume that the detected locations of the isohalines of 15 and 25 are not affected by melting of sea ice in the study area during late summer and autumn.
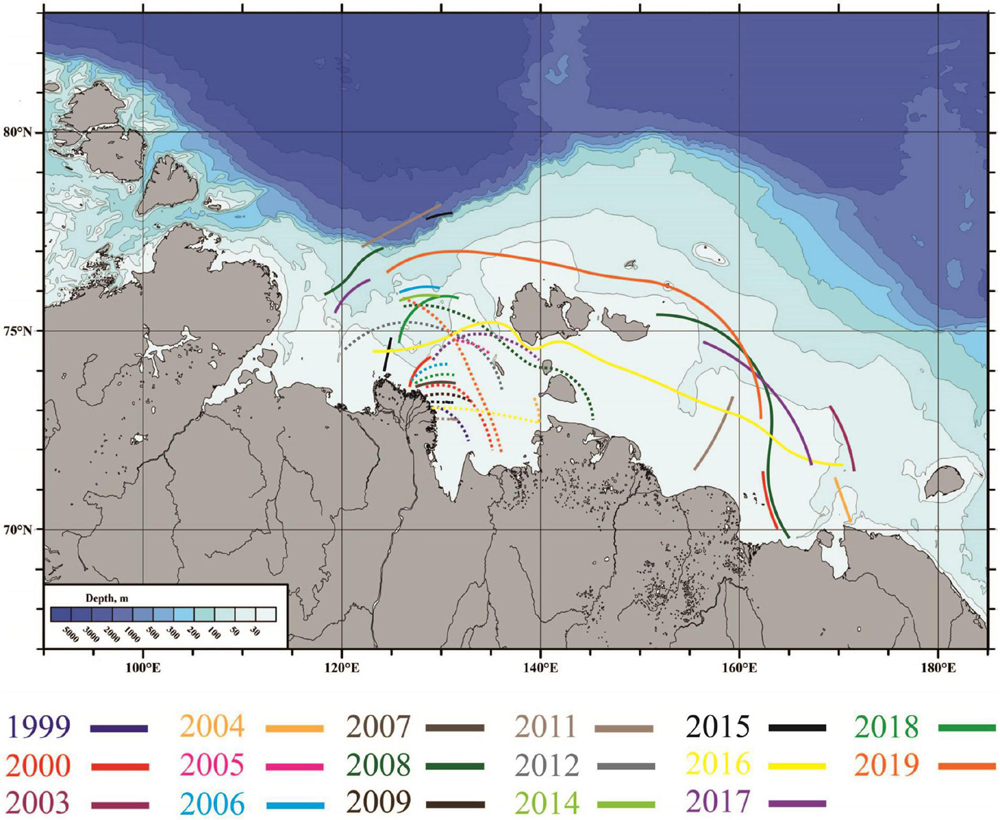
Figure 7. Locations of the isohalines of 15 (dashed lines) and 25 (solid lines) in the Laptev and East-Siberian seas detected by in situ measurements of 17 oceanographic field surveys.
The most extensive continuous measurements of surface salinity in the study area were made in 2008, 2011, 2016, and 2019 (Figure 8). During these surveys, the ship tracks covered wide areas in the eastern Laptev Sea and in the western East-Siberian Sea from 90°E in the west to 180°E in the east and from the Siberian coast in the south to 78°N in the north. Also, the detailed vertical thermohaline measurements were performed along zonal and meridional transects during these surveys. As a result, these transects performed in August/September 2008, September/early October 2011, September/October 2016, and late September/October 2019 provide certain information about the seasonal variability of the Lena plume and the Laptev/East-Siberian ROFI as further described in section “Discussion.” The northern boundary of FSL in the Laptev Sea was located below 76°N in 2000, 2007, 2009, 2014, 2016, and 2018 while in 2008, 2011, and 2015 salinities <25 were registered reaching as far as 77–78°N (Figure 7). The eastern and western boundaries of FSL varied less significantly, salinities <25 were observed between the longitudes of 120°E and 170°E (Figure 7). Despite the fact that reconstruction of the isohaline of 25 is speculative to a certain extent, extensive continuous measurements of surface salinity revealed very large FSL in 2008, 2011, and 2019 with area of 400,000–500,000 km2 (calculated according to the isohaline of 25), while in 2016 FSL was pressed to the Siberian coast and occupied almost twice less area (Figure 8). According to our assessment, the meridional extent of FSL varied from 250–350 km in 2016 to 600–700 km in 2008, 2011, and 2019. The zonal extent of FSL was 1,300–1,500 km.
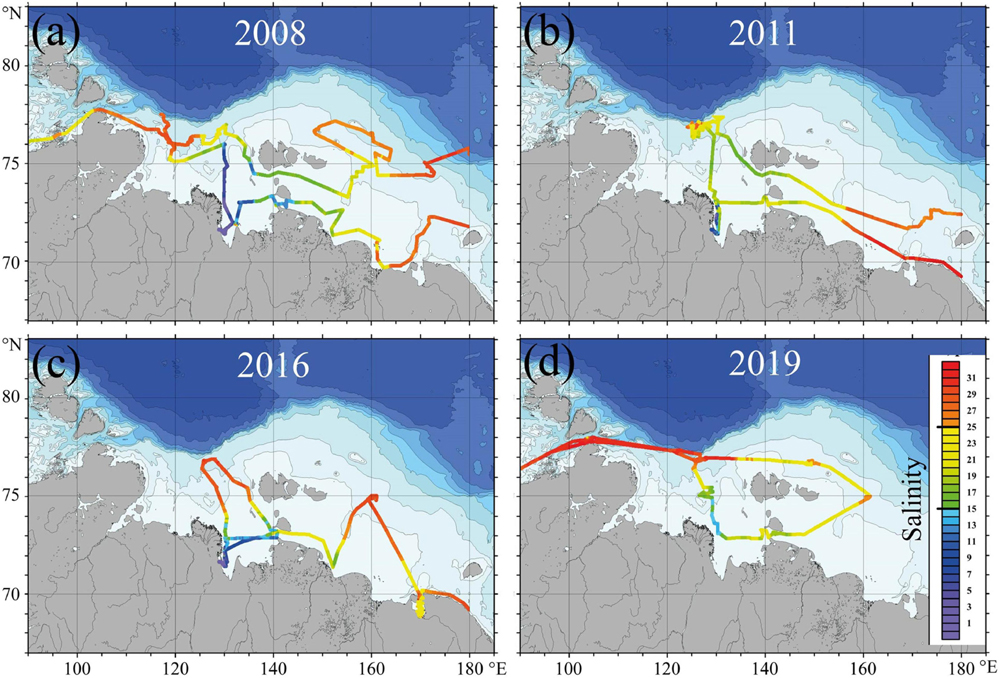
Figure 8. Salinity in the surface layer in the Laptev and East-Siberian seas along the ship tracks on 23 August – 18 September 2008 (a), 13 September – 8 October 2011 (b), 20 September – 20 October 2016 (c), and 27 September – 13 October 2019 (d).
The Lena plume also showed large variability of area and position (Figures 6–8). In 1999, 2000, 2009, 2011, 2015, and 2016 the northern boundary of the plume was located at the latitudes of 72.5–73°N and the plume occupied relatively small area (20,000–40,000 km2) adjacent to the eastern part of the Lena Delta (Figures 7, 8b,c). In 2005, 2008, 2012, 2017, and 2019, on the opposite, the northern plume boundary was located at the latitude above of 75°N (Figures 7, 8a,d). During 2008 and 2017 the Lena plume was reaching the New Siberian Islands and its area was 120,000–150,000 km2 (Figures 7, 8a). Therefore, the meridional extent of the Lena plume varied from 150 km (1999, 2011, 2015, and 2016) to 400 km (2008 and 2019), while its zonal extent varied from 100 km (1999 and 2011) to 400–500 km (2008 and 2017) (Figures 7, 8).
Vertical Structure of Freshened Surface Layer
The vertical structure of FSL in the Laptev and East-Siberian seas was studied based on the vertical thermohaline measurements performed at hydrographic stations along the zonal and meridional transects. The most southern and western stations of these transects were located near the eastern part of the Lena Delta, which provides the majority of discharge from the Lena Delta to the Laptev Sea (Fedorova et al., 2015). As a result, these transects crossed the central part of FSL and are representative of its vertical structure. Figures 9–12 show large differences among the vertical thermohaline structure of FSL observed in 2007, 2008, 2011, 2016, and 2019.
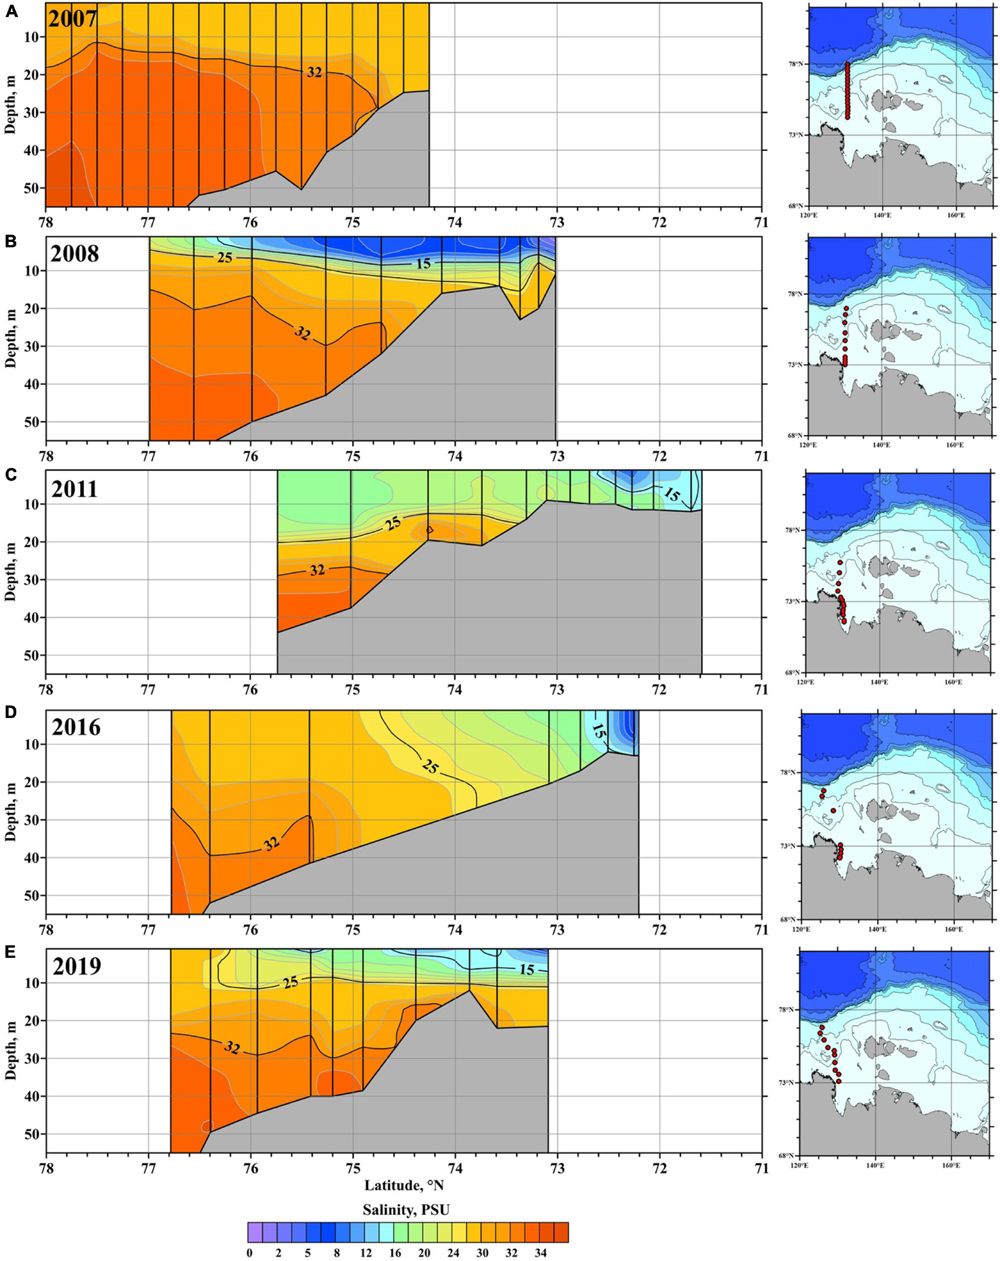
Figure 9. The vertical salinity structure along the meridional transects in the Laptev Sea on 14–30 September 2007 (A), 23–25 August 2008 (B), 19–26 September 2011 (C), 25 September – 2 October 2016 (D), and 6–13 October 2019 (E). The isohalines of 15, 25, and 32 are shown by bold lines. Locations of the stations are shown by black vertical lines. Locations of the transects are shown in the right insets.
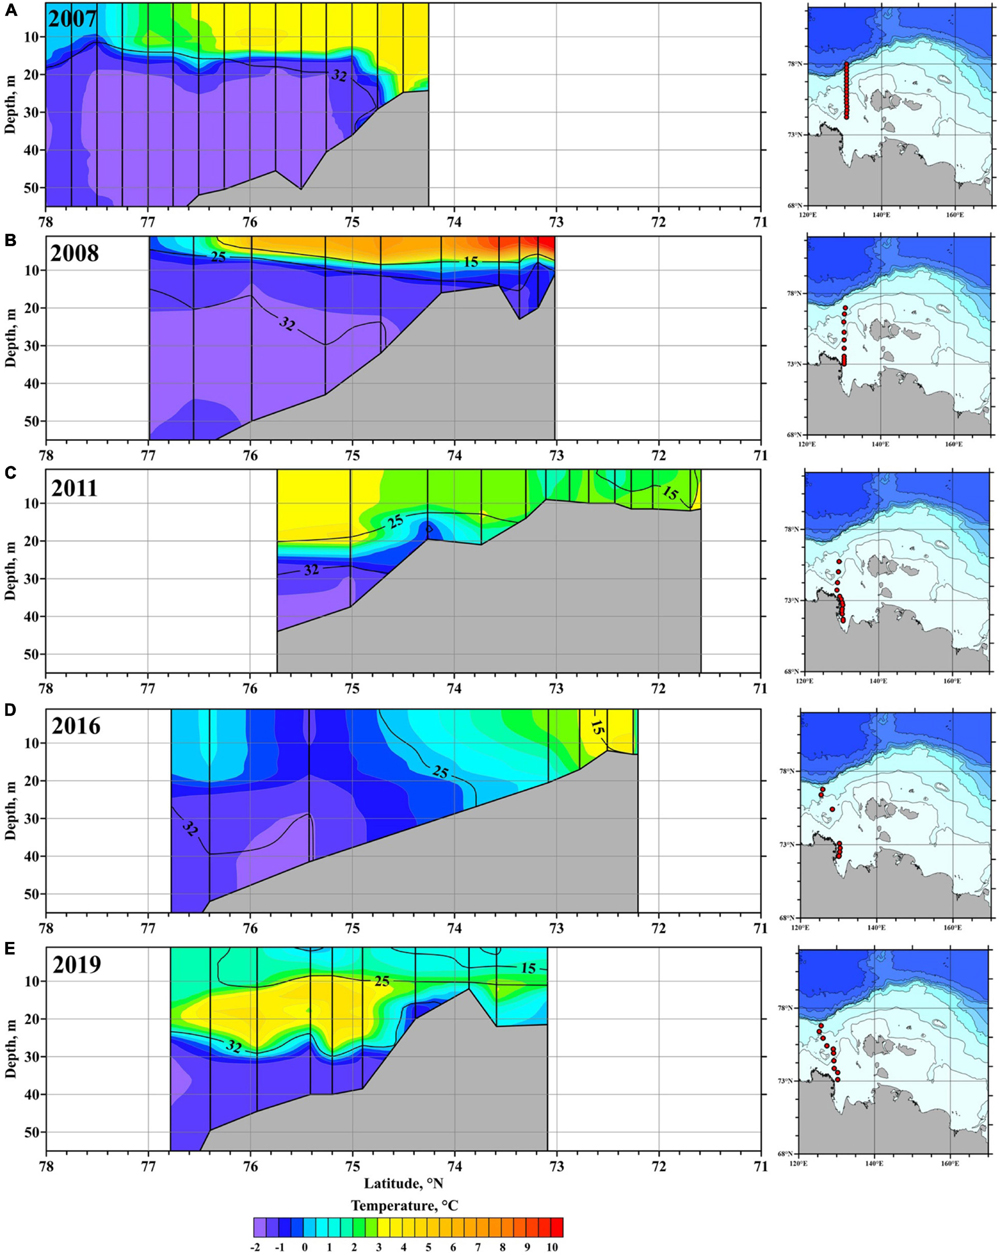
Figure 10. The vertical temperature structure along the meridional transects in the Laptev Sea on 14–30 September 2007 (A), 23–25 August 2008 (B), 19–26 September 2011 (C), 25 September – 2 October 2016 (D), and 6–13 October 2019 (E). The isohalines of 15, 25, and 32 are shown by bold lines. Locations of the stations are shown by black vertical lines. Locations of the transects are shown in the right insets.
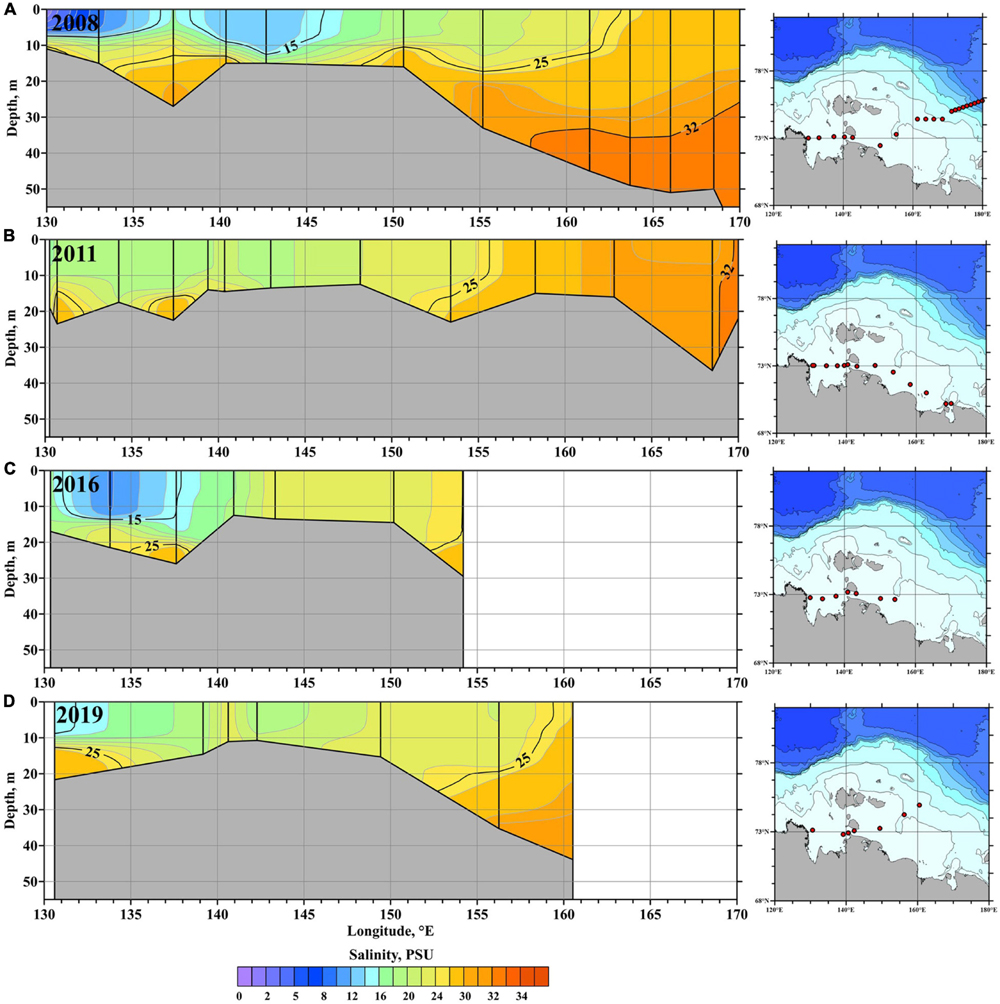
Figure 11. The vertical salinity structure along the zonal transects in the Laptev and East-Siberian seas on 25–30 August 2008 (A), 30 September – 3 October 2011 (B), 2–9 October 2016 (C), and 3–6 October 2019 (D). The isohalines of 15, 25, and 32 are shown by bold lines. Locations of the stations are shown by black vertical lines. Locations of the transects are shown in the right insets.
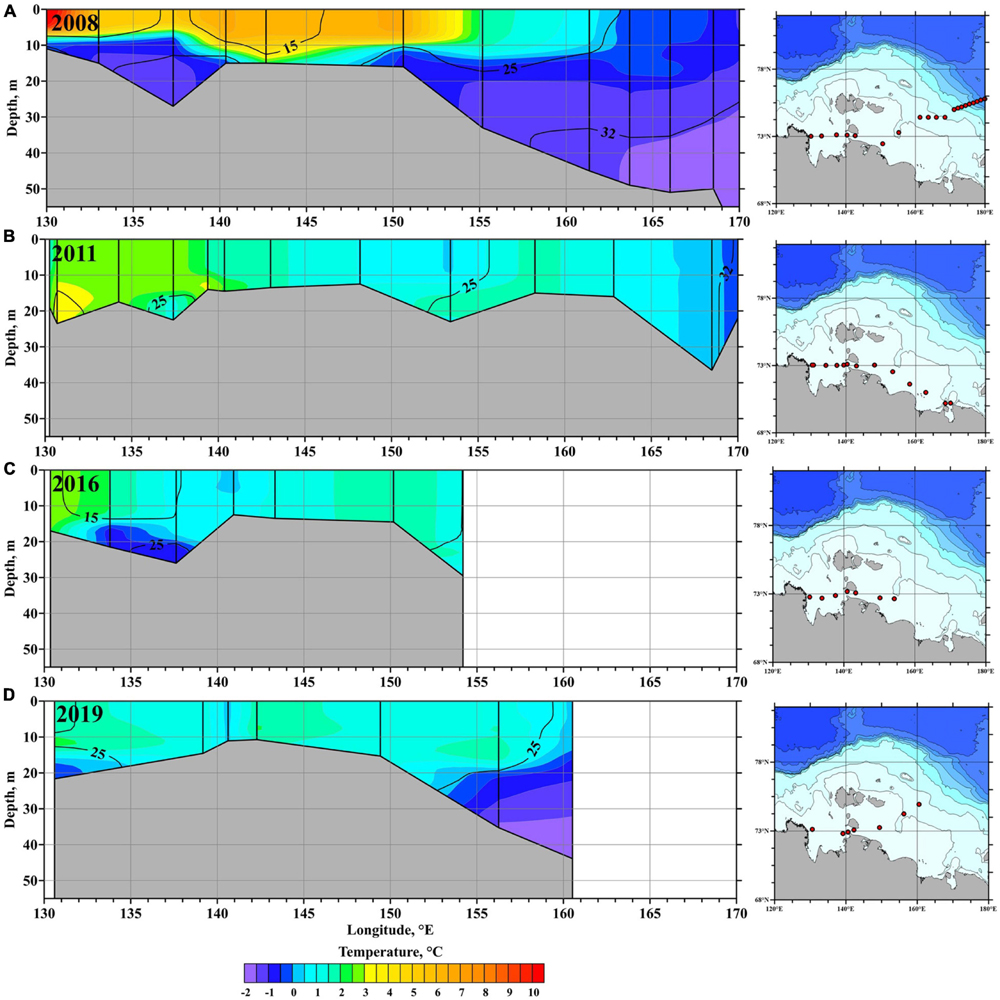
Figure 12. The vertical temperature structure along the zonal transects in the Laptev and East-Siberian seas on 25–30 August 2008 (A), 30 September – 3 October 2011 (B), 2–9 October 2016 (C), and 3–6 October 2019 (D). The isohalines of 15, 25, and 32 are shown by bold lines. Locations of the stations are shown by black vertical lines. Locations of the transects are shown in the right insets.
In September 2007 the most southern station of the meridional transect was located at the latitude of 74.2°N, i.e., 100 km northward from the Lena Delta (Figures 9A, 10A). Salinities along the transect were >25, so FSL was located southward from the transect (Figure 9A). In September–October 2016 low salinities at the meridional transect were registered only near the Lena Delta, while at the most southern station outside the delta region located at the latitude of 75.5°N salinities exceeded 26 (Figure 9D). FSL near the delta was well mixed and occupied the whole water column from surface to sea bottom (15–20 m deep). Surface salinities of this layer steadily increased from 1–2 to 17, while temperatures decreased from 3 to 0°C (Figure 10D). Continuous salinity measurements along the ship track showed that the isohaline of 25 in the surface layer was located at the latitude of 74.8°N indicating the northern boundary of FSL. The zonal transect in 2016 was stretched along the sea coast reaching the longitude of 154°E (Figure 11C). Similarly to the southern part of the meridional transect, FSL was well mixed and occupied the whole water column from surface to sea bottom (15–20 m deep) along the whole zonal transect. Surface salinities were 11–16 in the Laptev Sea, eastward from the Laptev Strait it increased to 18–24. Temperatures along the zonal transect were equal to 0–2°C, except in the proximity of the Lena Delta where it was 2–3°C (Figure 12C).
By contrast to 2007 and 2016, in August 2008 FSL propagated more than 500 km northward from the Lena Delta, salinities <25 were observed until the end of the meridional transect at the latitude of 77°N (Figure 9B). The depth of FSL steadily decreased from 12 m near the delta to 5 m at the most northern station of the transect. The majority of volume of this layer was formed by the fresh (5–15) and warm (4–10°C) Lena plume (Figures 9B, 10B). In eastward direction, the Lena plume reached the Laptev Strait, while FSL was observed along the zonal transect until the longitude of 164°E (Figure 11A). The depth of this layer along the zonal transect varied between 10 and 15 m, its temperatures decreased from 10°C near the Lena Delta to 0°C at the central East-Siberian Sea (Figures 11A, 12A).
FSL also occupied large area in the Laptev and East-Siberian seas in September 2011 and October 2019. In 2011 salinities <25 were observed until the end of the meridional transect at the latitude of 75.8°N (Figure 9C), while in 2019 the isohaline of 25 was located at the latitude of 76.2°N (Figure 9E). The depth of FSL varied between 12 and 20 m in 2011, in 2019 its depth was 9–11 m along the whole transect. The northern boundary of the Lena plume was located at the latitude of 72.6°N in 2011 and of 74.6°N in 2019. FSL propagated eastward reaching the longitude of 156°E along the coast in 2011 (Figure 11B) and reaching the longitude of 159°E at the central East-Siberian Sea in 2019 (Figure 11D). This layer was well mixed along the zonal transects and occupied the whole water column until the depths of 20–25 m during both surveys. Temperatures of this layer were 0–3°C during both surveys (Figures 10C,E, 12B,D). Note that the Lena plume was not detected along the zonal transect in 2011 presumably because of the complex pattern of the wind in September 2011. The change of eastern/western prevailing winds in August–September 2011 (Figure 3B) presumably limited the eastward spread of the plume.
High-resolution vertical structure of FSL in vicinity of the Lena Delta was studied based on thermohaline measurements by a towed CTD instrument in the beginning of September 2015. These measurements were performed along the 145 km long meridional transect located on a distance of 25 km eastward from the eastern shore of the Lena Delta (Figure 13). Surface salinities along the transect varied from 10 to 15 at the southern and central parts of the transect to 15–20 at the northern part of the transect (Figure 13A). The lowest salinities (0–4) and the highest temperatures (7–9°C) along the transect were registered in the surface layer vicinity the large deltaic channels indicating low mixed freshwater discharge from them. Strong stratification was observed, first, between the Lena plume and the ROFI at the depth of 5–8 m in the central and southern parts of the transect and, second, between the ROFI and the subjacent saline sea at the depth of 10–15 m along the whole transect.
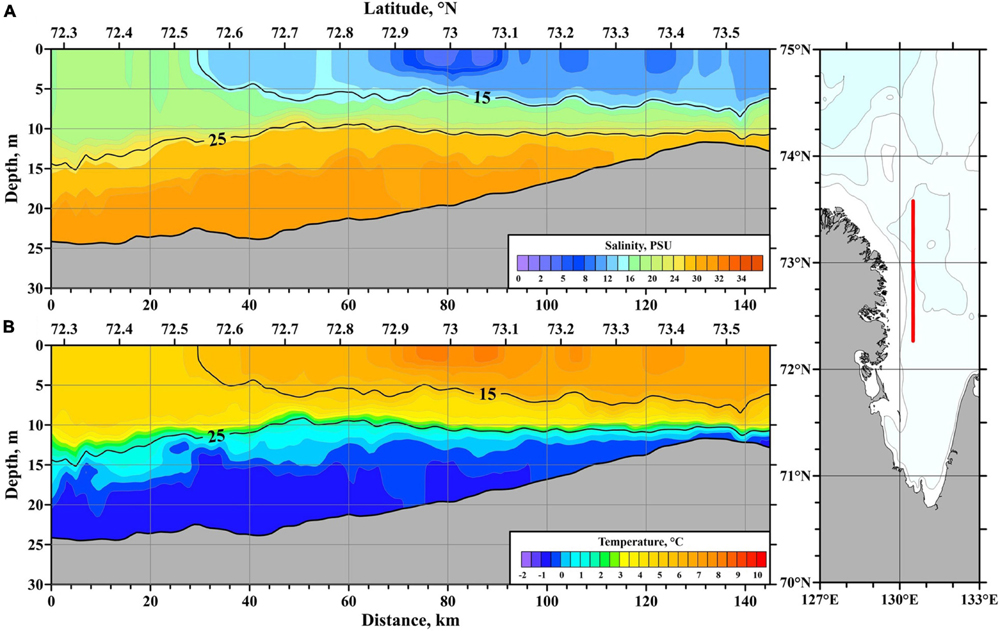
Figure 13. The vertical salinity (A) and temperature (B) structure along the eastern shore of the Lena Delta on 7–8 September 2015. The isohalines of 15 and 25 are shown by bold lines. Location of the transect is shown in the right inset.
The high-resolution salinity structure reconstructed in vicinity of the Lena Delta demonstrates low intensity of mixing between the inflowing river discharge and the subjacent sea water. First, vertical extent of the Lena plume is stable along the transect. Depth of the plume only slightly increases from 5 to 6 m in vicinity of large deltaic channels (indicated by the lowest salinities) to 7–8 m at the southern part of the transect on a distance of 50 km from the main freshwater sources. Second, horizontal salinity gradient is large only in vicinity of the large deltaic channels. Depth of ROFI is also stable and is equal to 10–11 m along the transect except its northern part, where it increases to 15 m. Note that this structure is observed in the beginning of September, i.e., 3 months after the freshet period, which demonstrates that strong vertical stratification and small vertical extent of FSL is still maintained during the low discharge period.
Discussion
In situ measurements (Figures 6, 7) during ice-free periods show significant inter-annual variability of FSL in the Laptev and East-Siberian seas with two typical spreading patterns, which were explicitly addressed in previous studies (Berezovskaya et al., 2002; Dmitrenko et al., 2005, 2008, 2010; Janout et al., 2020). During years with predominant western/eastern winds in the study area, FSL is forced to move eastward/northward and have relatively small/large meridional extents (Figure 6). Detailed salinity measurements in the study area made in 2007, 2008, 2011, 2016, and 2019 provide new information about spatial extents and vertical structure of FSL (Figures 8–12). In 2008, 2011, and 2019, FSL occupied large area in the Laptev and East-Siberian seas, its meridional and zonal extents were 500–600 km and 1,200–1,300 km, respectively (Figures 6–8). Eastern and southern winds prevailed at the shelf area of the Laptev and East-Siberian seas in August-September 2008. In 2011 and 2019, the atmospheric circulation was rather variable. Eastern winds prevailed in August and October 2011, while winds presented a complex pattern in September 2011, namely, western winds in the Laptev Sea and eastern winds in the East-Siberian Sea. Similarly, eastern winds prevailed in August and September 2019 followed by western winds in October 2019. Nevertheless, both in 2011 and 2019, eastern winds occurred at the shelf area during longer period than western winds. In 2007 and 2016 during predominant western and northern winds, FSL was stretched along the Siberian coast, its meridional extent was <250 km, i.e., twice less as compared to the first pattern, while its zonal extent was >1,000 km which is similar to the first pattern. The observed inter-annual variability of FSL in the Laptev and East-Siberian seas is much greater as compared to FSL formed in the Kara Sea, which occupies relatively stable area every year (Osadchiev et al., 2021a). Moreover, the area of FSL in the Laptev and East-Siberian seas during certain years is almost twice greater than the area of FSL in the neighboring Kara Sea, while the total annual freshwater discharge to the Laptev and East-Siberian seas (∼1,000 km3) is much less than to the Kara Sea (∼1,500 km3) (Gordeev et al., 1996; Osadchiev et al., 2021a).
In contrast to wind forcing conditions, large inter-annual variability of river discharge rate and ice coverage during warm season does not show any relation to variability of area, position, and depth of FSL. The lowest freshet discharge peak and the lowest total runoff volume from the Lena River among the considered years occurred in 2011 and 2019 (Figure 4) and was accompanied by large area of FSL in the Laptev and East-Siberian seas (Figure 7). Total runoff volume from the Lena River in 2007, 2008, and 2016 was similar (and 1.5 times higher than in 2011 and 2019) (Figure 4), while area of FSL was large in 2008 and small in 2007 and 2016 (Figure 7). In particular, area of this layer in 2016 was two times smaller than in 2008 and 2019. The smallest depth of FSL in the Laptev Sea was observed in 2008 and 2019 (Figure 9) with significantly different river discharge conditions (Figure 4). Inter-annual variability of seasonal ice coverage also does not show any relation to variability of area of FSL. Large/small area of FSL was observed during years with extensive summer ice coverage (2008/2016), as well as during years with early ice melting (2019/2007).
The Lena plume is spreading as a low saline (<15) and stratified water mass in the study area during and shortly after the freshet period of the Lena River. In particular, it occupied almost the whole volume of FSL in the Laptev Sea in August 2008 (Figure 9B), while no well-developed ROFI was observed along this transect. Then in September 2011 and October 2019 the Lena plume transforms to ROFI due to mixing with subjacent saline sea water (Figures 9C,E). This seasonal transformation is also demonstrated by location of the isohaline of 15 during different months in different years even though it strongly depends on wind forcing (Figures 6, 7). During years with predominant western and northern winds, FSL is stretched along the coast and salinities <15 are registered only southward from the latitude of 74°N, i.e., in vicinity of the Lena Delta (Figures 6–8). On the opposite, during years with predominant eastern and southern winds (Figure 6a), the isohaline of 15 moves southward from 76.5°N in August 2008 to 75°N in September 2005, September 2012, September 2015, and September 2017 and to 74°N in October 2011, October 2018, and October 2019 (Figures 7, 8a,b,d). As a result, in September and October in 2011, 2016, and 2019 the Lena plume is registered at relatively small area in the southeastern Laptev Sea adjacent to the eastern part of the Lena Delta, while the majority of the area of FSL corresponds to the Laptev/East-Siberian ROFI (Figure 8). Similar seasonal transformation of the Ob-Yenisei plume to the Kara ROFI occurs in the Kara Sea (Osadchiev et al., 2021a).
The depth of the Lena plume in the Laptev Sea in August (5–8 m) (Figure 9B) is twice less than the depth of the Ob-Yenisei plume in the Kara Sea in August (12–15 m) (Osadchiev et al., 2021a). This feature is caused by difference in morphology of estuarine and deltaic freshwater sources of these river plumes. The Ob and Yenisei rivers inflow to the Kara Sea through wide (30–60 km) and deep (15–20 m) estuaries, which results in formation of a deep river plume. The liftoff area of FSL within these estuaries, i.e., the area where this layer loses contact with the sea bottom, determines initial vertical extent of the river plume. In situ measurements show that liftoff occurs within the Ob and Yenisei gulf and sea depths in these areas are equal to 10–15 m (Osadchiev et al., 2021a). As a result, discharges from the Ob and Yenisei rivers experience intense mixing with saline seawater within their large estuaries before freshened water inflow to open sea.
Different situation is observed at the Lena Delta. The Lena River inflows to the Laptev Sea through numerous narrow (up to several km) and shallow (up to 2–3 m) deltaic branches along the 250 km segment of sea shore (Are and Reimnitz, 2000; Alekseevskii et al., 2014; Fedorova et al., 2015; Fuchs et al., 2021b). In situ measurements show that seawater does not inflow even to the largest and deepest deltaic branches and salinity within the Lena Delta is equal to zero from surface to bottom (Semiletov et al., 2011; Fuchs et al., 2021a). Moreover, in the open sea in the shallow (<5 m) vicinity of the Lena Delta salinity is also <1 from surface to bottom even during the low discharge period in winter and spring (Charkin et al., 2011; Fuchs et al., 2021a; Spivak et al., 2021). As a result, the undiluted Lena discharge inflows to sea from multiple channels and forms a narrow (10–15 km wide) stripe of zero-saline water from surface to bottom along the Lena Delta. In situ measurements demonstrate that this process occurs at least along the 150 km eastern part of the delta (Figure 13) which receives the majority of river discharge (80–90% of total Lena discharge). It can be also the case of several segments at the northeastern and southwestern parts of the Lena Delta, both areas receive 5–10% of total Lena discharge. Therefore, initial mixing of the Lena river discharge and saline seawater occurs at the open sea, once the zero salinity water propagates off the shallow vicinity of the delta to the sea deeper than 5 m.
Tidal circulation in the spreading areas of both FSL’s in the Kara Sea and in the Laptev and East-Siberian seas is low, average tidal velocities do not exceed 0.2 m/s (Kagan et al., 2008, 2010). Maximal velocities of tidal currents in the Ob and Yenisei gulfs are equal to 0.4–0.5 m/s and 0.3–0.4 m/s, respectively (Voinov, 2002; Osadchiev et al., 2020a). Velocity shear between freshened surface layer and saline bottom layer within the Ob and Yenisei gulfs have similar magnitudes equal to 0.3–0.5 m/s, respectively. Maximal velocities of tidal currents in the area adjacent to the Lena Delta are equal to 0.1 m/s (Fofonova et al., 2014, 2015; Kagan and Timofeev, 2020).
Based on these velocity assessments we can calculate Froude numbers for the Ob-Yenisei and Lena plumes, which are indicative of mixing intensity (Horner-Devine et al., 2009; Geyer and MacCready, 2014). Freshwater Froude number for the Ob and Yenisei gulfs is calculated using the formula , where Uf is the velocity shear between surface and bottom layers, g is the gravity acceleration, S is the salinity of the bottom layer, H is the depth of the estuary (Geyer and MacCready, 2014). In case of the Ob and Yenisei gulfs these numbers vary from to . The tidal Froude number for the Ob-Yenisei and Lena plumes is calculated using the formula , where Ut is the average tidal velocity, h is the depth of the river plume, is the reduced gravity within the plume, ρp and ρs are the densities of the plume and saline sea, respectively. In case of the Ob-Yenisei and Lena plumes these numbers are equal to and , respectively. This result shows that the Lena discharge inflows to sea undiluted, while the Ob and Yenisei discharges are substantially mixed with saline seawater within their estuaries. Therefore, the Lena plume experiences lower tidal mixing in the open sea than the Ob-Yenisei plume.
In order to assess mixing of FSL in the Kara, Laptev, and East-Siberian seas, we calculated the vertical distribution of freshwater fraction F = (S0 – S)/S0 along the meridional and zonal transects from surface to the isohaline of 32, where S is the observed salinity, S0 = 32 is the reference ambient sea water salinity according to typical salinity of ambient saline sea water at the study region (Pavlov et al., 1996). F represents the volume fraction of freshwater in the surface layer that produced the observed salinity after mixing with ambient saline sea water (Nash et al., 2009). Then, based on the reconstructed distributions of F, we calculated the local freshwater content , along the transects, that is, freshwater content in the water column, where x and z are the horizontal (along a transect) and vertical coordinates, respectively, F(x, z) is the freshwater fraction at the point (x, z), h(x) is the sea depth.
Figure 14 illustrates that distribution of freshwater content in the Laptev and East-Siberian seas is significantly different from that observed in the Kara Sea. First, freshwater content near freshwater source in the Laptev Sea (4–8 m near the Lena Delta) (Figures 14A,B) is much lower than in the Ob (10–18 m) and Yenisei (8–16 m) gulfs (Figure 14C; Osadchiev et al., 2021a). Second, freshwater content is more stable in the Laptev and East-Siberian seas. It varies mainly between 5 and 9 m near the Lena Delta indicating low intensity of mixing of the river discharge and saline seawater in this area. Then freshwater content decreases to 3–4 m at the distance of 350–500 km in meridional direction (Figure 14A) and at the distance of 800–1,100 km in zonal direction (Figure 14B) from the Lena Delta. In the Kara Sea the local freshwater content abruptly drops to 8–12 m within the northern parts of the estuaries and then decreases to 4 m on a distance of 100–400 km from the estuaries in meridional direction (Figure 14C).
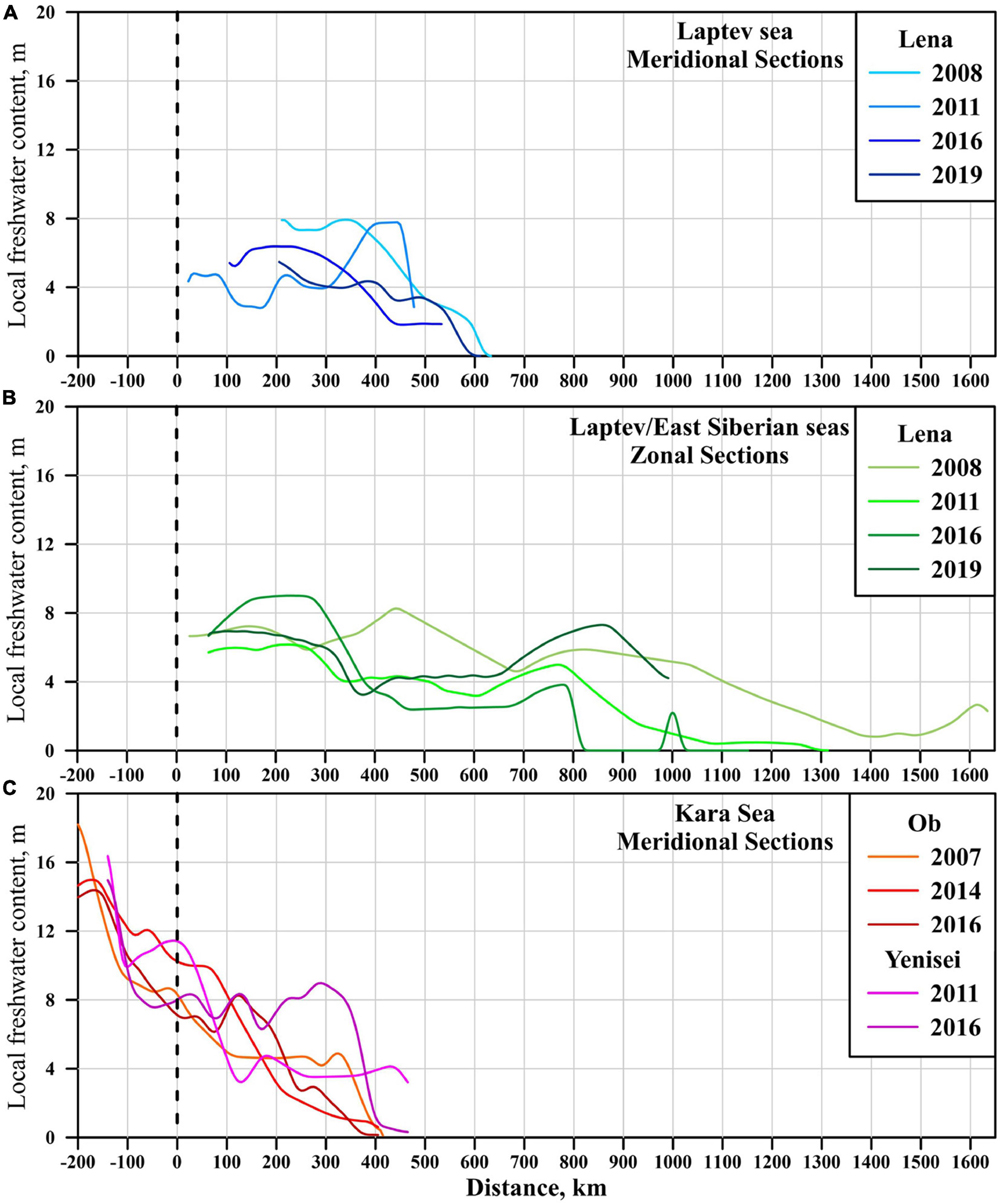
Figure 14. Local freshwater content along the meridional transects in the Laptev Sea (A), the zonal transects in the Laptev and East-Siberian seas (B), the meridional transects in the Kara Sea (C) [from Osadchiev et al. (2021a)]. The dashed line indicates boundary of the open sea, i.e., the Lena Delta shoreline in (A,B) and the seaward boundaries of the Ob and Yenisei gulfs in (C).
Large freshwater discharge to the Kara Sea from the Ob and Yenisei rivers experiences intense mixing in the estuaries and adjacent areas and forms 12–15 m deep Ob-Yenisei plume. This plume is expanding in the sea during June-July and occupies relatively stable area (200,000–250,000 km2) in the central Kara Sea until the end of the ice-free season, as shown by Osadchiev et al. (2021a). Freshwater discharge from the Lena River to the Laptev Sea is almost twice less, than from the Ob and Yenisei rivers. However, this discharge experiences low mixing near the Lena Delta due to, first, small depth of the deltaic channels and the sea area adjacent to the delta, and, second, lower tidal mixing at the open sea. As a result, 5–8 m deep Lena plume is spreading on extremely large area in the Laptev and East-Siberian seas (up to 500,000 km2) during and shortly after the freshet period. Due to its smaller vertical extent, the Lena plume is more affected by wind forcing than the Ob-Yenisei plume. Therefore, wind forcing conditions govern its spreading pattern and cause significant inter-annual variability of its position and spatial extents, which is not the case of FSL formed in the Kara Sea.
Ice melting, which occurs in the Laptev and East-Siberian seas much later than in the Kara Sea, also contributes to formation of FSL in the study area. This process increases freshwater content and increases stratification in this layer in the areas located far from the river deltas. In particular, we speculate that local peaks of freshwater content associated with ice melting were registered in the central Laptev Sea in 2011 along the meridional transect (Figure 14A) and in the central East-Siberian Sea in 2019 along the zonal transect (Figure 14B).
Conclusion
This work is focused on the freshened surface layer (FSL) formed in the Laptev and East-Siberian seas by large continental runoff mainly from the Lena River and several smaller deltaic rivers (Kolyma, Indigirka, Olenyok, and Yana). Based on in situ measurements, we study spatial extents and vertical structure of this layer during ice-free periods. Freshwater discharge from numerous shallow and narrow channels located along the 250-km segment of the Lena Delta forms shallow Lena plume, which initial depth does not exceed 10 m. During and shortly after the freshet period, the Lena plume is spreading over wide area in the Laptev and East-Siberian seas. Then in late summer and autumn it transforms into the Laptev/East-Siberian ROFI and determines position of FSL in these seas, which zonal extent exceeds 1,000 km. Position and area of this layer strongly depends on the local wind forcing conditions during the ice-free periods. Prevailing western and northern winds at the shelf area force this water along the Siberian shore. In this case, FSL is localized in the southern parts of the Laptev and East-Siberian seas, its meridional extent (<250 km) and area (∼250,000 km2) are relatively small. On the opposite, FSL spreads over large area in the central parts of these seas (up to 500,000 km2) under eastern wind forcing at the sea shelf. In this case meridional extent of FSL increases up to 500–700 km.
The Laptev/East-Siberian ROFI is the largest ROFI formed by continental discharge in the World Ocean (Kang et al., 2013), albeit it does not receive the largest volume of freshwater discharge. In particular, freshwater discharge to the neighboring Kara Sea is 1.5 times greater than to the Laptev and East-Siberian seas, while the area of the Kara ROFI is less than the area of the Laptev/East-Siberian ROFI. We demonstrate that it can be even twice less during certain years. This feature is caused by differences in distribution of freshwater content in these ROFI’s formed by estuarine and deltaic rivers (Figure 15). Due to low intensity of mixing of freshwater discharge from narrow and shallow deltaic channels of the Lena River with subjacent sea, as compared to large estuaries of the Ob and Yenisei rivers, the Lena plume experience significantly lower mixing near its source than the Ob-Yenisei plume. As a result, freshwater content in the Lena plume does not significantly decrease near the delta, while freshwater content in the Ob-Yenisei plume halves within the Ob and Yenisei estuaries. Therefore, the Lena River forms shallow river plume with stable freshwater content, while the Ob and Yenisei rivers form twice deeper plume with abruptly decreasing freshwater content. Shallow Lena plume is significantly affected by wind forcing conditions, which results in large inter-annual variability of its position and spatial extents.
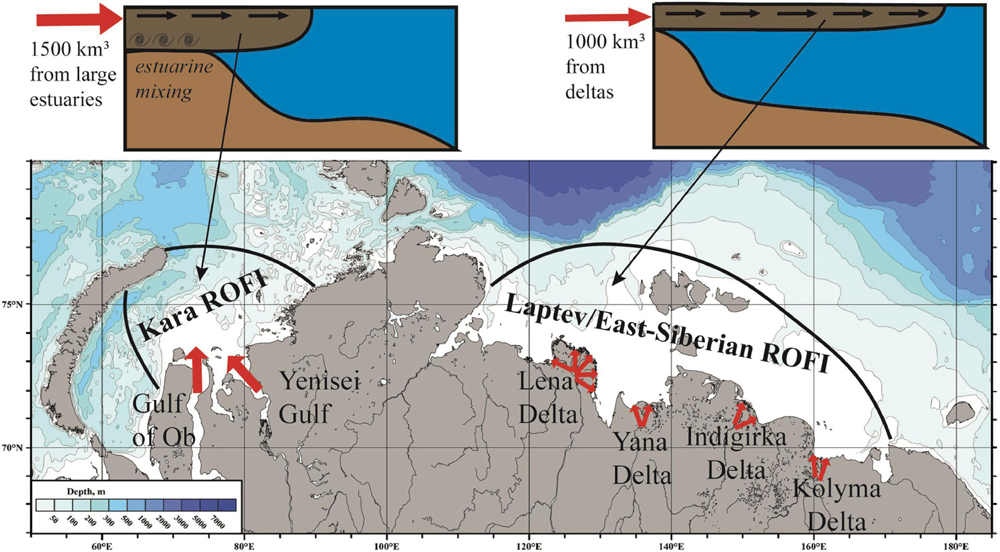
Figure 15. Schematic of formation of deep Kara ROFI by discharges from large estuaries and shallow Laptev/East-Siberian ROFI by discharges from deltas.
The Laptev and East-Siberian seas are strongly influenced by the ongoing climate change in the Arctic Ocean, including increase of discharge of the Lena River and decrease of seasonal ice-coverage (Peterson et al., 2002; Lehner et al., 2012; Haine et al., 2015; Nummelin et al., 2016). Earlier melting of sea ice in summer and longer ice-free season will increase the role of wind forcing and can modify the existing spreading patterns of FSL. Based on the obtained results, we assume that changes in hydrological regime and total runoff volume of the Lena River will not significantly affect structure and spreading patterns of FSL in these seas, because these characteristics do not depend on the current large inter-annual variability of freshwater discharge from the Lena River. However, these issues require additional studies using numerical modeling.
In this study, we demonstrate that morphology of river estuaries/deltas plays very important role in structure and spatial extents of the large FSL. This factor can be of the same importance as freshwater discharge rate and wind forcing. Thus, the comparison between FSL’s in the Kara Sea and in the Laptev and East-Siberian seas described in this work can be the case for other FSL’s formed by large rivers in the World Ocean. In particular, large deltaic rivers, such as Lena and Ganges/Brahmaputra, form the first and the second largest ROFI’s in the World Ocean, respectively (Kang et al., 2013). The related studies are essential for assessment of many physical, biological, and geochemical processes, which occur in coastal and shelf areas affected by discharges of large rivers.
Data Availability Statement
The original contributions presented in the study are included in the article/Supplementary Material, further inquiries can be directed to the corresponding author/s.
Author Contributions
AO designed the study. DF organized the database. AO, DF, ES, SS, and IS collected, processed, and performed the analysis of the in situ data. NT collected, processed, and performed the analysis of the meteorological data. AO and DF wrote the first draft of the manuscript. ES, SS, NT, and IS wrote sections of the manuscript. All authors contributed to manuscript revision, read, and approved the submitted version.
Funding
This research was funded by the Ministry of Science and Higher Education of the Russian Federation, theme 0128-2021-0001 (collecting of in situ data), Russian Science Foundation, project 21-77-30001 (processing of in situ data) and project 21-17-00278 (processing of sea ice data and study of dynamical processes), and Russian Foundation for Basic Research, project 20-35-70039 (study of FSL) and project 20-35-70025 (processing of meteorological data).
Conflict of Interest
The authors declare that the research was conducted in the absence of any commercial or financial relationships that could be construed as a potential conflict of interest.
Publisher’s Note
All claims expressed in this article are solely those of the authors and do not necessarily represent those of their affiliated organizations, or those of the publisher, the editors and the reviewers. Any product that may be evaluated in this article, or claim that may be made by its manufacturer, is not guaranteed or endorsed by the publisher.
Supplementary Material
The Supplementary Material for this article can be found online at: https://www.frontiersin.org/articles/10.3389/fmars.2021.735011/full#supplementary-material
Footnotes
- ^ https://www.ecmwf.int/en/forecasts/datasets/archive-datasets/reanalysis-datasets/era5
- ^ https://arcticgreatrivers.org/data/
- ^ http://www.aari.ru/odata/_d0015.php?mod=1
References
Alekseevskii, N. I., Aibulatov, D. N., Kuksina, L. V., and Chetverova, A. A. (2014). The structure of streams in the Lena delta and its influence on streamflow transformation processes. Geogr. Nat. Resour. 35, 63–70. doi: 10.1134/s1875372814010090
Are, F., and Reimnitz, E. (2000). An overview of the Lena River Delta settings: geology, tectonics, geomorphology, and hydrology. J. Coast. Res. 16, 1083–1093.
Bauch, D., Hölemann, J. A., Nikulina, A., Wegner, C., Janout, M. A., Timokhov, L. A., et al. (2013). Correlation of river water and local sea-ice melting on the Laptev Sea shelf (Siberian Arctic). J. Geophys. Res. Oceans 118, 550–561. doi: 10.1002/jgrc.20076
Berezovskaya, S. L., Dmitrenko, I. A., Gribanov, V. A., Kirillov, S. A., and Kassens, H. (2002). Distribution of river waters over the Laptev Sea Shelf under different atmospheric circulation conditions. Dokl. Earth Sci. 386, 804–808.
Carmack, E. C., Winsor, P., and Williams, W. (2015). The contiguous panarctic riverine coastal domain: a unifying concept. Progr. Oceanogr. 139, 13–23.
Carmack, E. C., Yamamoto–Kawai, M., Haine, T. W., Bacon, S., Bluhm, B. A., Lique, C., et al. (2016). Freshwater and its role in the Arctic Marine System: sources, disposition, storage, export, and physical and biogeochemical consequences in the Arctic and global oceans. J. Geophys. Res. Biogeosci. 121, 675–717. doi: 10.1002/2015JG003140
Charette, M. A., Kipp, L. E., Jensen, L. T., Dabrowski, J. S., Whitmore, L. M., Fitzsimmons, J. N., et al. (2020). The transpolar drift as a source of riverine and shelf-derived trace elements to the Central Arctic Ocean. J. Geophys. Res. Oceans 125:e2019JC015920. doi: 10.1029/2019JC015920
Charkin, A. N., Dudarev, O. V., Semiletov, I. P., Kruhmalev, A. V., Vonk, J. E., Sánchez-García, L., et al. (2011). Seasonal and interannual variability of sedimentation and organic matter distribution in the Buor-Khaya Gulf: the primary recipient of input from Lena River and coastal erosion in the southeast Laptev Sea. Biogeoscience 8, 2581–2594. doi: 10.5194/bg-8-2581-2011
Dmitrenko, I. A., Holemann, J. A., Kirillov, S. A., Berezovskaya, S. L., and Kassens, H. (2001). Role of barotropic sealevel changes in current formation on the eastern shelf of the Laptev Sea. Dokl. Earth Sci. 377, 243–249.
Dmitrenko, I. A., Kirillov, S. A., Bloshkina, E., and Lenn, Y.-D. (2012). Tide-induced vertical mixing in the Laptev Sea coastal polynya. J. Geophys. Res. 117:C00G14. doi: 10.1029/2011JC006966
Dmitrenko, I. A., Kirillov, S. A., Krumpen, T., Makhotin, M., Abrahamsen, E. P., Willmes, S., et al. (2010). Wind-driven diversion of summer river runoff preconditions the Laptev Sea coastal polynya hydrography: evidence from summer-to-winter hydrographic records of 2007–2009. Cont. Shelf Res. 30, 1656–1664. doi: 10.1016/j.csr.2010.06.012
Dmitrenko, I., Kirillov, S., and Tremblay, L. B. (2008). The long-term and interannual variability of summer fresh water storage over the eastern Siberian shelf: Implication for climatic change. J. Geophys. Res. 113:C03007. doi: 10.1029/2007JC004304
Dmitrenko, I., Kirillov, S., Eicken, H., and Markova, N. (2005). Wind-driven summer surface hydrography of the eastern Siberian shelf. Geophys. Res. Lett. 32:L14613. doi: 10.1029/2005GL023022
Dubinina, E. O., Miroshnikov, A. Y., Kossova, S. A., and Shchuka, S. A. (2019b). Modification of the Laptev Sea freshened shelf waters based on isotope and salinity relations. Geochem. Int. 57, 1–19. doi: 10.1134/S001670291901004X
Dubinina, E. O., Miroshnikov, A. Y., Kossova, S. A., and Flirt, M. V. (2019a). Numerical estimations of desalinated seawater modification using waters of the Laptev Sea shelf as an example. Dokl. Earth Sci. 484, 109–113. doi: 10.1134/S1028334X19010264
Dudarev, O. V., Charkin, A. N., Semiletov, I. P., Pipko, I. I., Pugach, S. P., Chernykh, D. V., et al. (2015). Peculiarities of the present-day morpholithogenesis on the Laptev Sea Shelf: semenovskaya shoal (Vasema Land). Dokl. Earth Sci. 462, 510–516. doi: 10.1134/S1028334X15050116
Ekwurzel, B., Schlosser, P., Mortlock, R. A., Fairbanks, R. G., and Swift, J. H. (2001). River runoff, sea ice meltwater, and Pacific water distribution and mean residence times in the Arctic Ocean. J. Geophys. Res. Oceans 106, 9075–9092. doi: 10.1029/1999JC000024
Fedorova, I., Chetverova, A., Bolshiyanov, D., Makarov, A., Boike, J., Heim, B., et al. (2015). Lena Delta hydrology and geochemistry: long-term hydrological data and recent field observations. Biogeoscience 12, 345–363. doi: 10.5194/bg-12-345-2015
Fofonova, V., Androsov, A., Danilov, S., Janout, M., Sofina, E., and Wiltshire, K. H. (2014). Semidiurnal tides in the Laptev Sea Shelf zone in the summer season. Cont. Shelf Res. 73, 119–132. doi: 10.1016/j.csr.2013.11.010
Fofonova, V., Danilov, S., Androsov, A., Janout, M., Bauer, M., Overduin, P., et al. (2015). Impact of wind and tides on the Lena River freshwater plume dynamics in the summer sea. Ocean Dyn. 65, 951–968. doi: 10.1007/s10236-015-0847-573
Fournier, S., Vialard, J., Lengaigne, M., Lee, T., Gierach, M. M., and Chaitanya, A. V. S. (2017). Modulation of the ganges-brahmaputra river plume by the indian ocean dipole and eddies inferred from satellite observations. J. Geophys. Res. Oceans 122, 9591–9604. doi: 10.1002/2017JC013333
Fuchs, M., Palmtag, J., Juhls, B., Overduin, P. P., Grosse, G., Abdelwahab, A., et al. (2021b). High-resolution bathymetry models for the Lena Delta and Kolyma Gulf coastal zones. Earth Syst. Sci. Data Discuss. doi: 10.5194/essd-2021-256
Fuchs, M., Ogneva, O., Sanders, T., Schneider, W., Polyakov, V., Becker, O. O., et al. (2021a). “CACOON sea – water sampling along the sardakhskaya channel and near shore of the Laptev Sea,” in Reports on Polar and Marine Research, Russian-German Cooperation: Expeditions to Siberia in 2019, Bremerhaven, eds M. Fuchs, D. Bolshiyanov, M. N. Grigoriev, A. Morgenstern, and A. Dill (Bremerhaven: Alfred Wegener Institute), 141–149. doi: 10.48433/BzPM_0749_2021
Garvine, R. W. (1987). Estuary plumes and fronts in shelf waters: a layer model. J. Phys. Oceanogr. 17, 1877–1896.
Geyer, W. R., and MacCready, P. (2014). The estuarine circulation. Annu. Rev. Fluid Mech. 46, 175–197. doi: 10.1146/annurevfluid-010313-141302
Gordeev, V. V., Martin, J. M., Sidorov, J. S., and Sidorova, M. V. (1996). A reassessment of the Eurasian river input of water, sediment, major elements, and nutrients to the Arctic Ocean. Am. J. Sci. 296, 664–691. doi: 10.2475/ajs.296.6.664
Grodsky, S. A., Reverdin, G., Carton, J. A., and Coles, V. J. (2014). Year-to-year salinity changes in the Amazon plume: contrasting 2011 and 2012 Aquarius/SACD and SMOS satellite data. Remote Sens. Environ. 140, 14–22. doi: 10.1016/j.rse.2013.08.033
Guay, C. K., Falkner, K. K., Muench, R. D., Mensch, M., Frank, M., and Bayer, R. (2001). Wind-driven transport pathways for Eurasian Arctic river discharge. J. Geophys. Res. 106, 11469–11480. doi: 10.1029/2000JC000261
Haine, T. W., Curry, B., Gerdes, R., Hansen, E., Karcher, M., Lee, C., et al. (2015). Arctic freshwater export: status, mechanisms, and prospects. Glob. Planet. Change 125, 13–35. doi: 10.1016/j.gloplacha.2014.11.013
Hersbach, H., Bell, B., Berrisford, P., Hirahara, S., Horányi, A., Muñoz-Sabater, J., et al. (2020). The ERA5 global reanalysis. Q. J. R. Meteorol. Soc. 146, 1999–2049. doi: 10.1002/qj.3803
Horner-Devine, A. R., Hetland, R. D., and MacDonald, D. G. (2015). Mixing and transport in coastal river plumes. Annu. Rev. Fluid Mech 47, 569–594. doi: 10.1146/annurev-fluid-010313-141408
Horner-Devine, A. R., Jay, D. A., Orton, P. M., and Spahn, E. Y. (2009). A conceptual model of the strongly tidal columbia river plume. J. Mar. Syst. 78, 460–475. doi: 10.1016/j.jmarsys.2008.11.0
Janout, M. A., and Lenn, Y. (2014). Semidiurnal tides on the Laptev Sea shelf with implications for shear and vertical mixing. J. Phys. Oceanogr. 44, 202–219. doi: 10.1175/JPO-D-12-0240.1
Janout, M. A., Holemann, J., Laukert, G., Smirnov, A., Krumpen, T., Bauch, D., et al. (2020). On the variability of stratification in the freshwater-influenced Laptev Sea region. Front. Mar. Sci. 7:543489. doi: 10.3389/fmars.2020.543489
Kääb, A., Lamare, M., and Abrams, M. (2013). River ice flux and water velocities along a 600 km-long reach of Lena River, Siberia, from satellite stereo. Hydrol. Earth Syst. Sci. 17, 4671–4683. doi: 10.5194/hess-17-4671-2013
Kagan, B. A., and Timofeev, A. A. (2020). Dynamics and energetics of tides in the Laptev Sea: the results of high-resolving modeling of the surface semidiurnal tide M2. Fundament. Prikl. Gidrofiz 13, 15–23. doi: 10.7868/S2073667320010025
Kagan, B. A., Romanenkov, D. A., and Sofina, E. V. (2008). Tidal ice drift and ice-generated changes in the tidal dynamics/energetic on the Siberian continental shelf. Cont. Shelf Res. 28, 351–368. doi: 10.1016/j.csr.2007.09.004
Kagan, B. A., Timofeev, A. A., and Sofina, E. V. (2010). Seasonal variability of surface and internal M2 tides in the Arctic Ocean. Izv. Atmos. Ocean. Phys. 46, 652–662. doi: 10.1134/S0001433810050105
Kang, Y., Pan, D., Bai, Y., He, X., Chen, X., Chen, C. T. A., et al. (2013). Areas of the global major river plumes. Acta Oceanol. Sin. 32, 79–88. doi: 10.1007/s13131-013-0269-5
Kowalik, Z., and Proshutinsky, A. Y. (1994). “The arctic ocean tides,” in The Polar Oceans and Their Role in Shaping the Global Environment, Geophysics Monography Series, Vol. 85, eds O. M. Johannessen, R. D. Muench, and J. E. Overland (Washington, DC: AGU), 137–158. doi: 10.1029/GM085p0137
Lambert, E., Nummelin, A., Pemberton, P., and Ilıcak, M. (2019). Tracing the imprint of river runoff variability on Arctic water mass transformation. J. Geophys. Res. Oceans 124, 302–319.
Lehner, F., Raible, C. C., Hofer, D., and Stocker, T. F. (2012). The freshwater balance of polar regions in transient simulations from 1500 to 2100 AD using a comprehensive coupled climate model. Clim. Dyn. 39, 347–363. doi: 10.1007/s00382-011-1199-6
Li, W. K. W., McLaughlin, F. A., Lovejoy, C., and Carmack, E. C. (2009). Smallest algae thrive as the Arctic Ocean freshens. Science 326:539. doi: 10.1126/science.1179798
Matsuoka, A., Babin, M., and Devred, E. C. (2016). A new algorithm for discriminating water sources from space: a case study for the southern Beaufort Sea using MODIS ocean color and SMOS salinity data. Remote Sens. Environ. 184, 124–138. doi: 10.1016/j.rse.2016.05.006
McLaughlin, F. A., and Carmack, E. C. (2010). Nutricline deepening in the Canada Basin, 2003–2009. Geophys. Res. Lett. 37:L24602. doi: 10.1029/2010GL045459
Munchow, A., Weingartner, T. J., and Cooper, L. W. (1999). The summer hydrography and surface circulation of the East Siberian Shelf Sea. J. Phys. Oceanogr. 19, 2167–2182.
Nash, J. D., Kilcher, L. F., and Moum, J. N. (2009). Structure and composition of a strongly stratified, tidally pulsed river plume. J. Geophys. Res 114:C00B12. doi: 10.1029/2008JC005036
Nummelin, A., Ilicak, M., Li, C., and Smedsrud, L. H. (2016). Consequences of future increased Arctic runoff on Arctic Ocean stratification, circulation, and sea ice cover. J. Geophys. Res. Oceans 121, 617–637. doi: 10.1002/2015JC011156
O’Donnell, J. (1990). The formation and fate of a river plume: a numerical model. J. Phys. Oceanogr. 20, 551–569.
Olmedo, E., Gabarro, C., Gonzalez-Gambau, V., Martinez, J., Ballabrera-Poy, J., Turiel, A., et al. (2018). Seven years of SMOS sea surface salinity at high latitudes: variability in Arctic and sub-Arctic regions. Remote Sens. 10:1772. doi: 10.3390/rs10111772
Osadchiev, A. A. (2017). Spreading of the amur river plume in the amur liman, the sakhalin gulf, and the strait of tartary. Oceanology 57, 376–382. doi: 10.1134/S0001437017020151
Osadchiev, A. A., and Zavialov, P. O. (2019). “Structure and dynamics of plumes generated by small rivers,” in Estuaries and Coastal Zones – Dynamics and Response to Environmental Changes, ed. J. Pan (London: IntechOpen), doi: 10.5772/intechopen.87843
Osadchiev, A. A., Izhitskiy, A. S., Zavialov, P. O., Kremenetskiy, V. V., Polukhin, A. A., Pelevin, V. V., et al. (2017). Structure of the buoyant plume formed by Ob and Yenisei river discharge in the southern part of the Kara Sea during summer and autumn. J. Geophys. Res. Oceans 122, 5916–5935. doi: 10.1002/2016JC012603
Osadchiev, A. A., Asadulin, E. E., Miroshnikov, A. Y., Zavialov, I. B., Dubinina, E. O., and Belyakova, P. A. (2019). Bottom sediments reveal inter-annual variability of interaction between the Ob and Yenisei plumes in the Kara Sea. Sci. Rep. 9:18642. doi: 10.1038/s41598-019-55242-3
Osadchiev, A. A., Konovalova, O. P., and Gordey, A. S. (2021b). Water exchange between the Gulf of Ob and the Kara Sea during ice-free seasons: the roles of river discharge and wind forcing. Front. Mar. Sci. Available online at: https://www.frontiersin.org/articles/10.3389/fmars.2021.741143/abstract
Osadchiev, A. A., Frey, D. I., Shchuka, S. A., Tilinina, N. D., Morozov, E. G., and Zavialov, P. O. (2021a). Structure of freshened surface layer in the Kara Sea during ice-free periods. J. Geophys. Res. Oceans 126:e2020JC016486. doi: 10.1029/2020JC016486
Osadchiev, A. A., Pisareva, M. N., Spivak, E. A., Shchuka, S. A., and Semiletov, I. P. (2020b). Freshwater transport between the kara, laptev, and east-siberian seas. Sci. Rep. 10:13041. doi: 10.1038/s41598-020-70096-w
Osadchiev, A. A., Medvedev, I. P., Shchuka, S. A., Kulikov, M. E., Spivak, E. A., Pisareva, M. N., et al. (2020a). Influence of estuarine tidal mixing on structure and spatial scales of large river plumes. Ocean Sci. 16, 1–18. doi: 10.5194/os-16-1-2020
Osadchiev, A. A., Silvestrova, K. P., and Myslenkov, S. A. (2020c). Wind-driven coastal upwelling near large river deltas in the Laptev and East-Siberian seas. Remote Sens. 12:844. doi: 10.3390/rs12050844
Padman, L., and Erofeeva, S. (2004). A barotropic inverse tidal model for the Arctic Ocean. Geophys. Res. Lett. 31:L02303. doi: 10.1029/2003GL019003
Pavlov, V. K., Timokhov, L. A., Baskakov, G. A., Yu, M., Kulakov, V.K. Kurazhov, Pavlov, P. V., et al. (1996). Hydrometeorological Regime Of The Kara, Laptev, And East-Siberian Seas. Technical Memorandum, APL-UW TM 1-96. St, Seattle, WA: Applied Physics Laboratory, University of Washington.
Peterson, B. J., Holmes, R. M., McClelland, J. W., Vorosmarty, C. J., Lammers, R. B., Shiklomanov, A. I., et al. (2002). Increasing river discharge to the Arctic ocean. Science 298, 2171–2173. doi: 10.1126/science.1077445
Pogojeva, M., Zhdanov, I., Berezina, A., Lapenkov, A., Kosmach, D., Osadchiev, A., et al. (2021). Distribution of floating marine macro-litter in relation to oceanographic characteristics in the Russian Arctic Seas. Mar. Pollut. Bull. 166:112201. doi: 10.1016/j.marpolbul.2021.112201
Polyakov, I. V., Pnyushkov, A. V., Rember, R., Padman, L., Carmack, E. C., and Jackson, J. M. (2013). Winter convection transports Atlantic water heat to the surface layer in the eastern Arctic Ocean. J. Phys. Oceanogr. 43, 2142–2155. doi: 10.1175/JPO-D-12-0169.1
Polyakov, I., Walsh, D., Dmitrenko, I., Colony, R., and Timokhov, L. (2003). Arctic Ocean variability derived from historical observations. Geophys. Res. Lett. 30:1298. doi: 10.1029/2002GL016441
Schlosser, P., Newton, R., Ekwurzel, B., Khatiwala, S., Mortlock, R., and Fairbanks, R. (2002). Decrease of river runoff in the upper waters of the Eurasian Basin, Arctic Ocean, between 1991 and 1996: evidence from δ18O data. Geophys. Res. Lett. 29, 31–34. doi: 10.1029/2001gl013135
Sea-Bird Electronics (2017). SEASOFT-V2: SBE Data Processing User’s Manual. Bellevue, DC: Sea-Bird Electronics, 177.
Semiletov, I. P., Pipko, I. I., Shakhova, N. E., Dudarev, O. V., Pugach, S. P., Charkin, A. N., et al. (2011). Carbon transport by the Lena River from its headwaters to the Arctic Ocean, with emphasis on fluvial input of terrestrial particulate organic carbon vs. carbon transport by coastal erosion. Biogeoscience 8, 2407–2426. doi: 10.5194/bg-8-2407-2011
Semiletov, I. P., Shakhova, N. E., Sergienko, V. I., Pipko, I. I., and Dudarev, O. V. (2012). On carbon transport and fate in the East Siberian Arctic land–shelf–atmosphere system. Environ. Res. Lett. 7:015201. doi: 10.1088/1748-9326/7/1/015201
Semiletov, I., Dudarev, O., Luchin, V., Charkin, A., Shin, K.-H., and Tanaka, N. (2005). The East Siberian Sea as a transition zone between Pacific-derived waters and Arctic shelf waters. Geophys. Res. Lett. 32:L10614. doi: 10.1029/2005GL022490
Semiletov, I., Pipko, I., Gustafsson, Ö, Anderson, L. G., Sergienko, V., Pugach, S., et al. (2016). Acidification of East Siberian Arctic Shelf waters through addition of freshwater and terrestrial carbon. Nat. Geosci. 9:361. doi: 10.1038/ngeo2695
Spivak, E. A., Osadchiev, A. A., and Semiletov, I. P. (2021). Structure and variability of the Lena river plume in the south-eastern part of the Laptev Sea. Oceanology 61, 832–836. doi: 10.1007/978-3-030-25674-6
Supply, A., Boutin, J., Vergely, J.-L., Kolodziejczyk, N., Reverdin, G., Reul, N., et al. (2020). New insights into SMOS Sea Surface Salinity retrievals in the Arctic Ocean. Remote Sens. Environ. 249:112027. doi: 10.1016/j.rse.2020.112027
Tang, W., Yueh, S., Yang, D., Fore, A., Hayashi, A., Lee, T., et al. (2018). The potential and challenges of using Soil Moisture Active Passive (SMAP) sea surface salinity to monitor Arctic Ocean freshwater changes. Remote Sens. 10:869. doi: 10.3390/rs10060869
Tarasenko, A., Supply, A., Kusse-Tiuz, N., Ivanov, V., Makhotin, M., Tournadre, J., et al. (2021). Properties of surface water masses in the Laptev and the East Siberian seas in summer 2018 from in situ and satellite data. Ocean Sci. 17, 221–247. doi: 10.5194/os-17-221-2021
Tremblay, J. E., Belanger, S., Barber, D. G., Asplin, M., Martin, J., Darnis, G., et al. (2011). Climate forcing multiplies biological productivity in the coastal Arctic Ocean. Geophys. Res. Lett. 38:L18604. doi: 10.1029/2011GL048825
Vic, C., Berger, H., Treguier, A. M., and Couvelard, X. (2014). Dynamics of an equatorial river plume: theory and numerical experiments applied to the Congo plume case. J. Phys. Oceanogr. 44, 980–994. doi: 10.1175/JPO-D-13-0132.1
Voinov, G. (2002). “Tide and tidal streams,” in Polar Seas Oceanography: An Integrated Case Study of the Kara Sea, eds V. A. Volkov, O. M. Johannessen, V. E. Borodachev, G. N. Voinov, L. H. Pettersson, L. P. Bobylev, et al. (Berlin: Springer), 147–216.
Weingartner, T. J., Danielson, S., Sasaki, Y., Pavlov, V., and Kulikov, M. (1999). The siberian coastal current: a wind and buoyancy forced coastal current. J. Geophys. Res. 104, 29697–29713. doi: 10.1029/1999JC900161
Whitney, M. M., and Garvine, R. W. (2005). Wind influence on a coastal buoyant outflow. J. Geophys. Res. 110:C03014. doi: 10.1029/2003jc002261
Williams, W. J., and Carmack, E. C. (2015). The ‘interior’ shelves of the Arctic Ocean: physical oceanographic setting, climatology and effects of sea-ice retreat on cross-shelf exchange. Progr. Oceanogr. 139, 24–31. doi: 10.1016/j.pocean.2015.07.008
Yakushev, E., Gebruk, A., Osadchiev, À, Pakhomova, S., Lusher, A., Berezina, A., et al. (2021). Microplastics distribution in the eurasian arctic is affected by atlantic waters and siberian rivers. Commun. Earth Environ. 2:23. doi: 10.1038/s43247-021-00091-0
Keywords: river plume, freshened surface layer, stratification, Lena River, Laptev Sea, East-Siberian Sea, Arctic Ocean
Citation: Osadchiev A, Frey D, Spivak E, Shchuka S, Tilinina N and Semiletov I (2021) Structure and Inter-Annual Variability of the Freshened Surface Layer in the Laptev and East-Siberian Seas During Ice-Free Periods. Front. Mar. Sci. 8:735011. doi: 10.3389/fmars.2021.735011
Received: 01 July 2021; Accepted: 22 November 2021;
Published: 10 December 2021.
Edited by:
Andrea Cucco, National Research Council (CNR), ItalyReviewed by:
Nino Krvavica, University of Rijeka, CroatiaRui Caldeira, Agência Regional para o Desenvolvimento da Investigação Tecnologia e Inovação (ARDITI), Portugal
Copyright © 2021 Osadchiev, Frey, Spivak, Shchuka, Tilinina and Semiletov. This is an open-access article distributed under the terms of the Creative Commons Attribution License (CC BY). The use, distribution or reproduction in other forums is permitted, provided the original author(s) and the copyright owner(s) are credited and that the original publication in this journal is cited, in accordance with accepted academic practice. No use, distribution or reproduction is permitted which does not comply with these terms.
*Correspondence: Alexander Osadchiev, b3NhZGNoaWV2QG9jZWFuLnJ1