 Xiangqi Yi
 Di Zhang
 Jiazhen Sun
 John Beardall
 Kunshan Gao
- 1State Key Laboratory of Marine Environmental Science, College of the Environment and Ecology, Xiamen University, Xiamen, China
- 2State Key Laboratory of Marine Environmental Science, College of the Ocean and Earth Sciences, Xiamen University, Xiamen, China
- 3School of Biological Sciences, Monash University, Clayton, VIC, Australia
In the warm, oligotrophic oceans, phytoplankton frequently experience high light exposure and must compete for a potentially limited nutrient supply. Additionally, the light regimes are dynamic in view of the diel solar cycle, weather conditions, and depth. Dealing with these challenges is critical to their survival. Here, we explored, using active chlorophyll a fluorescence, the photophysiological responses of cyanobacteria-dominated phytoplankton assemblages to intra-day variations in the light regime in the oligotrophic South China Sea (SCS). Experiments were conducted at three stations (SEATS, DC2, and DC6) where phytoplankton communities were dominated by Prochlorococcus and Synechococcus, and environmental conditions were similar except for daytime light conditions. We found that, at each station, the maximum quantum yield of PSII (Fv/Fm) at dawn was as high as ∼0.5, although concentrations of both dissolved inorganic nitrogen and soluble reactive phosphate were below the detection limits. Subsequently, diurnal patterns of Fv/Fm diverged between stations. At stations DC2 and DC6, we observed significant drops (25–48%) of Fv/Fm around midday, coinciding with the incident solar photosynthetically active radiation (PAR) reaching over 2,000 μmol quanta m–2 s–1, but Fv/Fm was nearly stable at SEATS where the daily maximal PAR was less than 1,000 μmol quanta m–2 s–1. Further analysis suggests that the midday drops in Fv/Fm at DC2 and DC6 were a consequence of high light-induced PSII photoinactivation. On the other hand, we found that the patterns of diurnal variation in maximum relative electron transport rate (rETRmax) presented as being unimodal with a peak around midday at all three stations. Furthermore, we found that the diurnal pattern of rETRmax was mainly controlled by the extent of photochemical quenching (qP) which reflects the redox status of electron carriers downstream of PSII. In conclusion, our results indicate that, in the oligotrophic SCS, through increasing the activity of the electron-consuming mechanisms (high qP), the phytoplankton communities are able to maintain their midday photosynthetic potential (high rETRmax) even with a degree of PSII photoinactivation (low Fv/Fm).
Introduction
Marine phytoplankton are responsible for approximately half of global net primary production (Field et al., 1998; Westberry et al., 2008; Zhao and Running, 2010). This production supports nearly all life in the oceans and substantially affects global biogeochemical cycles and climate. The distribution and abundance of marine phytoplankton, being spatially and temporally dynamic, are mainly controlled by such key environmental drivers as temperature, nutrients, and light (Falkowski and Raven, 2007). Light is, on the one hand, the driving force of photosynthesis, but on the other hand, excessive light can inhibit photosynthesis and present a threat to phytoplankton (Raven, 2011; Campbell and Serôdio, 2020). In the oceans, the light regimes to which phytoplankton are exposed are primarily determined by solar irradiance, and thus present as periodically variable, with diel and seasonal cycles. Superimposed on such regularity are chaotic and stochastic variations relating to meteorological conditions such as cloud cover, precipitation, and atmospheric aerosol concentration and composition. Moreover, as solar irradiance enters the marine system, it is further absorbed and scattered by seawater, dissolved organic materials and particles, including photosynthetic organisms. Thus, the light regime for phytoplankton can be highly variable on different time scales, driven by both predictable and unpredictable elements.
For photoautotrophs, the ability to perceive the variations in the light regime and properly adjust and respond to such changes is critical to their survival. Indeed, there are a number of physiological mechanisms to cope with light regime variations that occur on different time scales, such as non-photochemical quenching, adjustment of pigment composition and content, and altering the composition and concentration of other components of the photosynthetic apparatus (Müller et al., 2001; Dubinsky and Stambler, 2009). In this study, we focus on the intra-day adjustments and responses of the phytoplankton occurring on the surface of the northern South China Sea (SCS). The South China Sea, the world’s largest tropical marginal sea, plays important roles in regulating regional climate and biogeochemical cycles owing to its vast area and volume (Zhai et al., 2013). The shelf of the SCS is influenced by river inputs and is nutrient-rich. In contrast, its wide basin area is permanently stratified, depleted in surface nutrients, and contains low surface phytoplankton biomass (Tseng et al., 2005; Du et al., 2017), typical of the oligotrophic oceans. The surface phytoplankton community in the SCS basin area is dominated by pico-cyanobacteria, Prochlorococcus and Synechococcus, in the summer (Xiao et al., 2018). Due to its location in the tropical region, the incident solar radiation in the SCS was high, with surface photosynthetically active radiation at noon over 2,000 μmol quanta m–2 s–1 on a clear day (Xie et al., 2018). Additionally, intensively stratified upper layer in warmed regions constrains the vertical mixing path of phytoplankton close to the sea surface, thus exposing phytoplankton to a high level of solar radiation (Gao et al., 2012). Therefore, dealing effectively with high light exposure, combined with a limited nutrient supply is critical for their survival (Mella-Flores et al., 2012; Murphy et al., 2017; Xie et al., 2018).
Here, we explored the diurnal patterns of photophysiological characteristics of phytoplankton in the northern South China Sea. Through comparing results obtained at different stations, we tried to identify the key environmental factors determining the diurnal variations of photophysiological characteristics on the intra-day time scale and found that the surface phytoplankton community in the oligotrophic SCS were able to maintain photosynthetic potential even with PSII photoinactivation.
Materials and Methods
Study Sites and Sampling
Our research was conducted during an oceanographic expedition to the northern SCS aboard the R/V Dongfanghong 2 in the summer of 2017 (July 11 – August 11, 2017). The northern SCS is characterized by warm (∼23–31°C), oligotrophic, and stratified surface waters, with the mixed layer depth being between 20 and 40 m during most of the year (Tseng et al., 2005; Li et al., 2020 and the references therein). The whole cruise consists of 63 water-sampling stations, and our experiments were carried out at three stations (SEATS, DC2, and DC6; Figure 1) where the research vessel remained on each station for more than 24 h (Table 1).
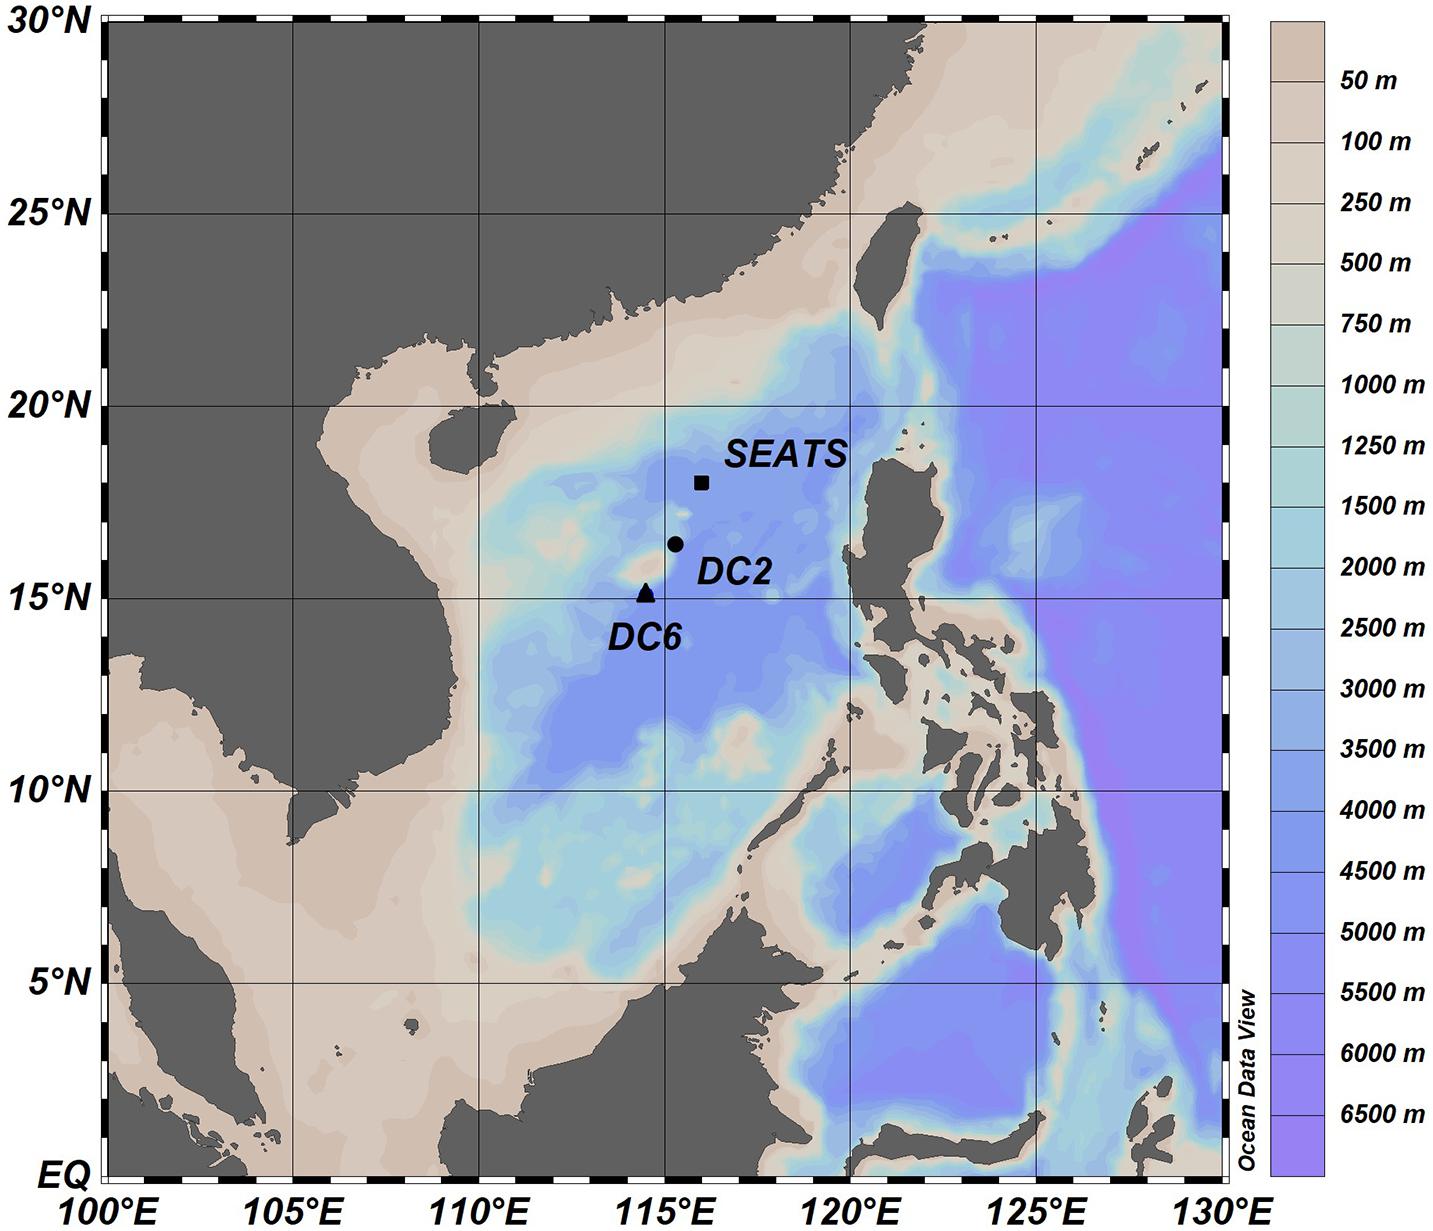
Figure 1. Sampling stations in the northern South China Sea.
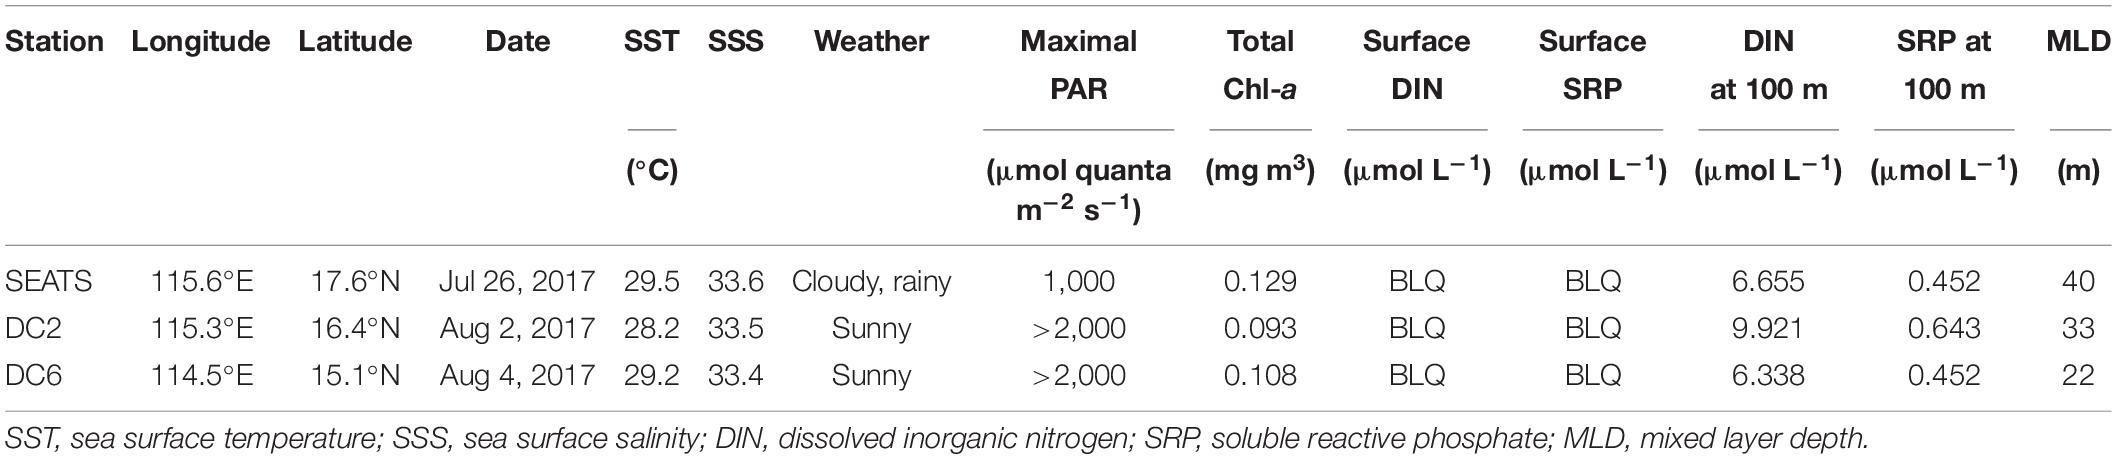
Table 1. Physical and chemical conditions at the sampling stations.
For nutrient measurements (see below), seawater samples were collected using a CTD-rosette equipped with 10 L acid-cleaned Niskin bottles. Hydrological parameters, including pressure, salinity, and temperature, were measured using a Seabird CTD. The mixed layer depth (MLD) was calculated from the temperature profiles, with the criterion being >0.8°C difference from the sea surface temperature (SST) (Kara et al., 2000). Additionally, surface seawater samples were collected with a 10 L acid-cleaned plastic bucket at different times of the day, then transferred to 10 L acid-cleaned polycarbonate carboys and immediately taken to the onboard laboratory for active Chl a fluorescence and phytoplankton pigment analyses (see below). The incident solar irradiance was measured by a portable LI-COR 2π PAR sensor (PMA2100, Solar light, United States). The PAR sensor is calibrated with a continuous solar irradiance monitor (SOLAR-2UV, TianNuo HuanNeng, China) which is set up on the roof of our experimental building and is routinely calibrated by the manufacturer. Additionally, we utilized satellite-measured daily PAR and a simple model to simulate the diurnal pattern of incident solar irradiance (Iqbal, 1983; Sung et al., 2015; see Supplementary Information for further details).
Nutrients
Nutrient concentrations were analyzed onboard using a four-channel, continuous-flow Technicon AA3 Auto-Analyzer (Bran+Lube, GmbH, Germany). The concentrations of dissolved inorganic nitrogen (DIN, nitrate + nitrite), soluble reactive phosphate (SRP), and silicate were measured using standard colorimetric methods. The limits of quantification for DIN, SRP, and silicate are 0.1, 0.08, and 0.16 μmol L–1, and the analytical precision was better than 1% for DIN, 2% for SRP, and 2.5% for silicate, respectively. More details are described in Han et al. (2012).
Phytoplankton Pigments
The concentrations of phytoplankton pigments were analyzed using high-performance liquid chromatography (HPLC). The sampling and analytical procedures for the HPLC analysis generally followed the protocol of Huang et al. (2010). Briefly, 6–10 L of seawater was filtered onto glass-fiber filters (diameter 25 mm, pore size 0.7 μm, Whatman GF/F). The filters were preserved in liquid nitrogen until analysis. The filter was submerged in 1 ml of N, N-dimethylformamide (DMF) for 1 h in the dark at −20°C. An aliquot (600 μL) of the DMF containing the extracted pigments was then mixed (1:1) with 1 M ammonium acetate. The pigments in the mixture after the removal of filter debris were analyzed using an UltiMate 3000 high-performance liquid chromatography system (Thermo Fisher Scientific, United States). The pigments were identified by the retention times and quantified using peak areas with standard curve calibration. Quantification was performed with standards purchased from DHI Water and Environment, Hørsholm, Denmark. Chemotaxonomic analysis was carried out using the CHEMTAX program (Mackey et al., 1996), which gave the proportions of nine phytoplankton classes [Dinoflagellates, Diatoms, Haptophytes (type 8), Haptophytes (type 6), Cryptophytes, Chlorophytes, Prasinophytes, Synechococcus, and Prochlorococcus]. Although CHEMTAX only allowed identification of Synechococcus and Prochlorococcus among cyanobacteria, neglecting other cyanobacterial genera should not affect our main results and conclusions, because their biomass is extremely low in this region (Tseng et al., 2015).
Active Chl a Fluorometry
Since we did not have access to the most widely used active Chl a fluorometry technique in field investigations, namely, fast repetition rate fluorometry (FRRf) (Kolber et al., 1998), which has a high measuring sensitivity that is best suitable for the low Chl a concentration found in large areas of the oceans, our variable fluorescence data were obtained using a Multiple Excitation Wavelength Chlorophyll Fluorescence Analyzer (multi-color-PAM, Walz, German). To satisfy the Chl a concentration requirement of the multi-color-PAM, phytoplankton cells were concentrated before measurement (Bailleul et al., 2017). Water samples (1,000 mL) were filtered through Nucleopore membrane filters (0.4 or 0.8 μm pore-size) by gravity or under a very low vacuum (<0.3 kPa). Cells were resuspended in 2 mL of the original seawater sample by soaking and gentle shaking in a 50-mL polypropylene centrifuge tube. The process was repeated two to four times. The cell enrichment procedure was typically finished within 0.5 h in the onboard laboratory where the temperature was similar to the SST of the study sites and light intensity during the enrichment process was <10 μmol quanta m–2 s–1. After cell enrichment, cells were kept in the darkness for 10 min. Keeping cells under low light intensity for 30 min (during the cell enrichment) and subsequently in the darkness for 10 min allows photosynthetic apparatus relaxation from potential non-photochemical quenching processes but not recovery from photodamage (Campbell and Tyystjärvi, 2012). Subsequently, the maximum quantum yield of PSII (Fv/Fm) was determined:
where Fo and Fm are the dark-acclimated minimum and maximum fluorescence, respectively. The values of Fv/Fm reported in this study were within expected values (Suggett et al., 2009) and comparable to those reported in other research conducted in the northern SCS (Xie et al., 2018), so the process of cell enrichment appeared to not significantly affect the phytoplankton photophysiological characteristics. After measurement of Fv/Fm, the functional absorption cross-section of PSII was determined according to the procedures of Schreiber et al. (2012) and the manufacturer’s manual. The definition of the functional absorption cross section of PSII was introduced by Ley and Mauzerall (1982) and is used to quantify the light absorption and utilization potential of PSII. This parameter has been widely and readily measured using FRRf and is usually denoted as σPSII in the literature (Kolber et al., 1998; Suggett et al., 2009). The correct determination of the functional absorption cross section of PSII relies on the high time-resolution record of the fluorescence rise kinetics induced by strong light, which is achieved by FRRf and PAM using different approaches. Following the suggestions of the manufacturers of the multi-color-PAM (Schreiber et al., 2012), the functional absorption cross section of PSII determined by multi-color-PAM is denoted as Sigma(II) to highlight its difference from σPSII. In terms of data interpretation, Sigma(II) is only valid for the reference state in which it is measured and any changes of PSII efficiency occurring, e.g., during illumination are assumed to be covered by corresponding changes in the effective PSII photochemical efficiency, whereas σPSII changes during illumination (Schreiber et al., 2012).
Determination of relative electron transport rate (rETR) relied on measurement of effective photochemical efficiency of PSII(ΦPSII). ΦPSII was successively measured at eight levels of actinic light with intensity (E) being 0, 8, 26, 57, 113, 218, 350, and 508 μmol quanta m–2 s–1, respectively. Cells were allowed to acclimate to each light level for 3 min before ΦPSII measurements (Suggett et al., 2007):
where Fm′ is the light-adapted maximum fluorescence and F′ is the stable fluorescence under actinic light. rETR at each actinic light level (E) was calculated as Ralph and Gademann (2005):
The light response curve of rETR was analyzed according to the model proposed by Eilers and Peeters (1988):
where a, b and c are parameters that were obtained through non-linear least squares regression using R (version 4.0.5). Photosynthetic parameters including light use efficiency (α), rETR maximum (rETRmax), and light saturation point (Ek) were calculated as:
During the ΦPSII measurements, Fo′, the light-acclimated minimum fluorescence was also measured, based on which we calculated the light-acclimated maximum photochemical efficiency (Fv′/Fm′) and the photochemical quenching (qP) at each level of actinic light:
From Equations 1, 8, 9, we can get:
Blue light (440 nm) was selected as the measuring light to obtain the active Chl a fluorescence data. Sample temperature in the fluorometer during the measurements was maintained at the corresponding in situ temperature using a US-T temperature control unit (Walz, Germany). Two independent samples were used for active Chl a fluorescence measurement at each time point.
Statistical Analyses
A Generalized Additive Model (GAM) was used to analyze the diurnal variations of PAM-derived parameters in which time was treated as the covariate and the PAM-derived parameter was treated as the dependent variable. This helps to highlight and compare the patterns of diurnal variations between stations. Additionally, to quantitatively compare the patterns of diurnal variation between stations, Pearson’s correlations were used. Because sampling time points were different between stations, the calculations of Pearson’s correlations were based on the values predicted by GAM. All statistical analyses were completed using R (version 4.0.5), and the core package was “mgcv” (version 1.8–34). Figure 1 was created using Ocean Data View (version 5.4.0), and other figures were created in R (version 4.0.5) using packages “ggplot2” (version 3.3.3), “ggpubr” (version 0.4.0), and “ggtext” (version 0.1.1).
Results
Environmental Conditions of the Study Sites
Environmental conditions were similar among the three stations during the experimental period (Table 1). The sea surface temperature (SST) was ∼29°C, the sea surface salinity was ∼33.5, and the mixed layer depth (MLD) was less than 40 m across all three stations. The concentrations of both DIN and SRP in the surface waters were below the limit of quantification (0.1 μmol L–1 for DIN; 0.08 μmol L–1 for SRP), and the silicate concentration was about 2 μmol L–1 at all three stations. There existed, however, one readily noticeable and significant difference between different stations, that is, the weather conditions. At station SEATS, the experiment was conducted on a cloudy and rainy day with the daily maximum of surface PAR below 1,000 μmol quanta m–2 s–1, whereas experiments at stations DC2 and DC6 were carried out on sunny days with the surface PAR maxima higher than 2,000 μmol quanta m–2 s–1. This difference was also reflected in the values of daily PAR which were separately 30.37, 57.24, and 50.95 Einstein m–2 d–1 at stations SEATS, DC2, and DC6 (Supplementary Figure 1 and Supplementary Table 1).
Phytoplankton Pigments and Community Structures
The total Chl a (chlorophyll a + divinyl-chlorophyll a) concentrations of the surface waters were similar between stations, at a level of ∼0.1 mg m–3 (Table 1). The surface phytoplankton assemblages were dominated by Prochlorococcus and Synechococcus (Figure 2) regardless of station and sampling time, accounting for 63–81% and 12–31%, respectively, of the total Chl a. However, the diurnal variation of phytoplankton community structure at station SEATS (Figure 2A) was different from those at stations DC2 (Figure 2B) and DC6 (Figure 2C). Specifically, the phytoplankton community composition at station SEATS varied only slightly over the course of the diurnal cycle with no obvious pattern (Figure 2A), but at both station DC2 (Figure 2B) and station DC6 (Figure 2C), the proportion of Prochlorococcus increased gradually during the morning, reaching a daily maximum before noon and thereafter steadily decreasing until the end of the day. Additionally, highly negative correlations between proportions of Prochlorococcus and Synechococcus were detected across all stations (Pearson’s correlations were −0.90, −0.98, and −0.98 at SEATS, DC2, and DC6). The proportions of phytoplankton groups other than Prochlorococcus and Synechococcus were less than 9% regardless of sampling station and time (Figure 2).
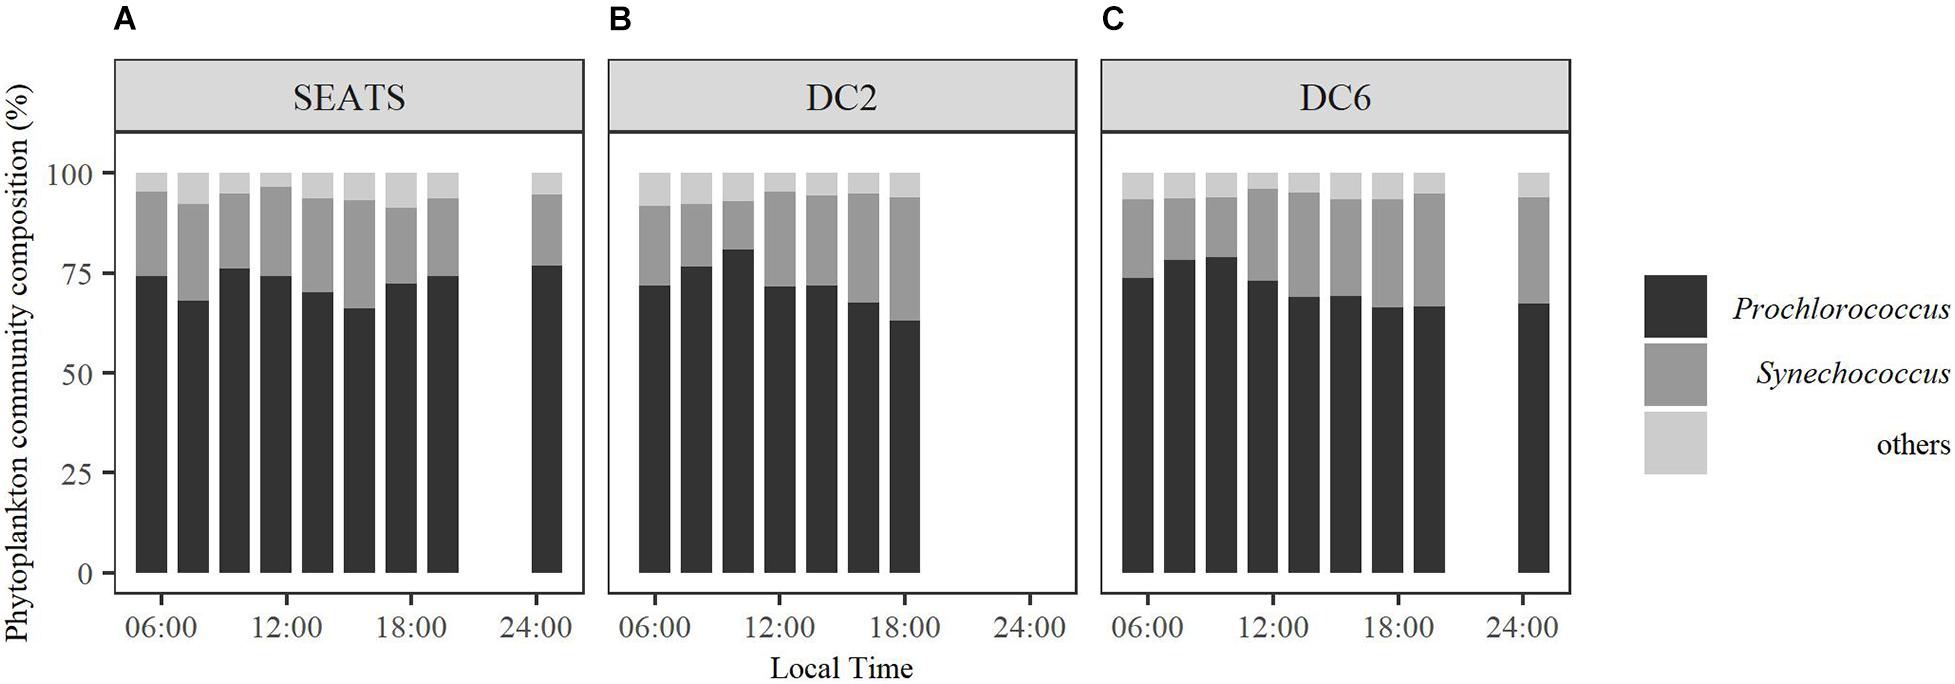
Figure 2. Diurnal variations of surface phytoplankton community structure at stations SEATS (A), DC2 (B), and DC6 (C).
Fv/Fm and Sigma(II)
The values of maximum quantum yield of PSII (Fv/Fm) showed no obvious difference at the beginning of the experiments between stations (∼0.5), but patterns diverged over the course of the day (Figure 3 and Supplementary Figure 2). At station SEATS (Figure 3A), Fv/Fm values fluctuated only slightly within the range of 0.48–0.57. However, at stations DC2 (Figure 3B) and DC6 (Figure 3C), Fv/Fm steadily declined in the morning and dropped to a daily minimum around 14:00 with values of 0.28 at station DC2 and 0.39 at station DC6. Subsequently, Fv/Fm in these two stations recovered and finally returned to values of ∼0.5 at the end of the experiments. Such similarity of diurnal variation patterns between stations DC2 and DC6 was also illustrated by the high correlation (Pearson’s correlation, 0.82), which is not found between SEATS and DC2 (Pearson’s correlation, −0.001) or SEATS and DC6 (Pearson’s correlation, −0.37).
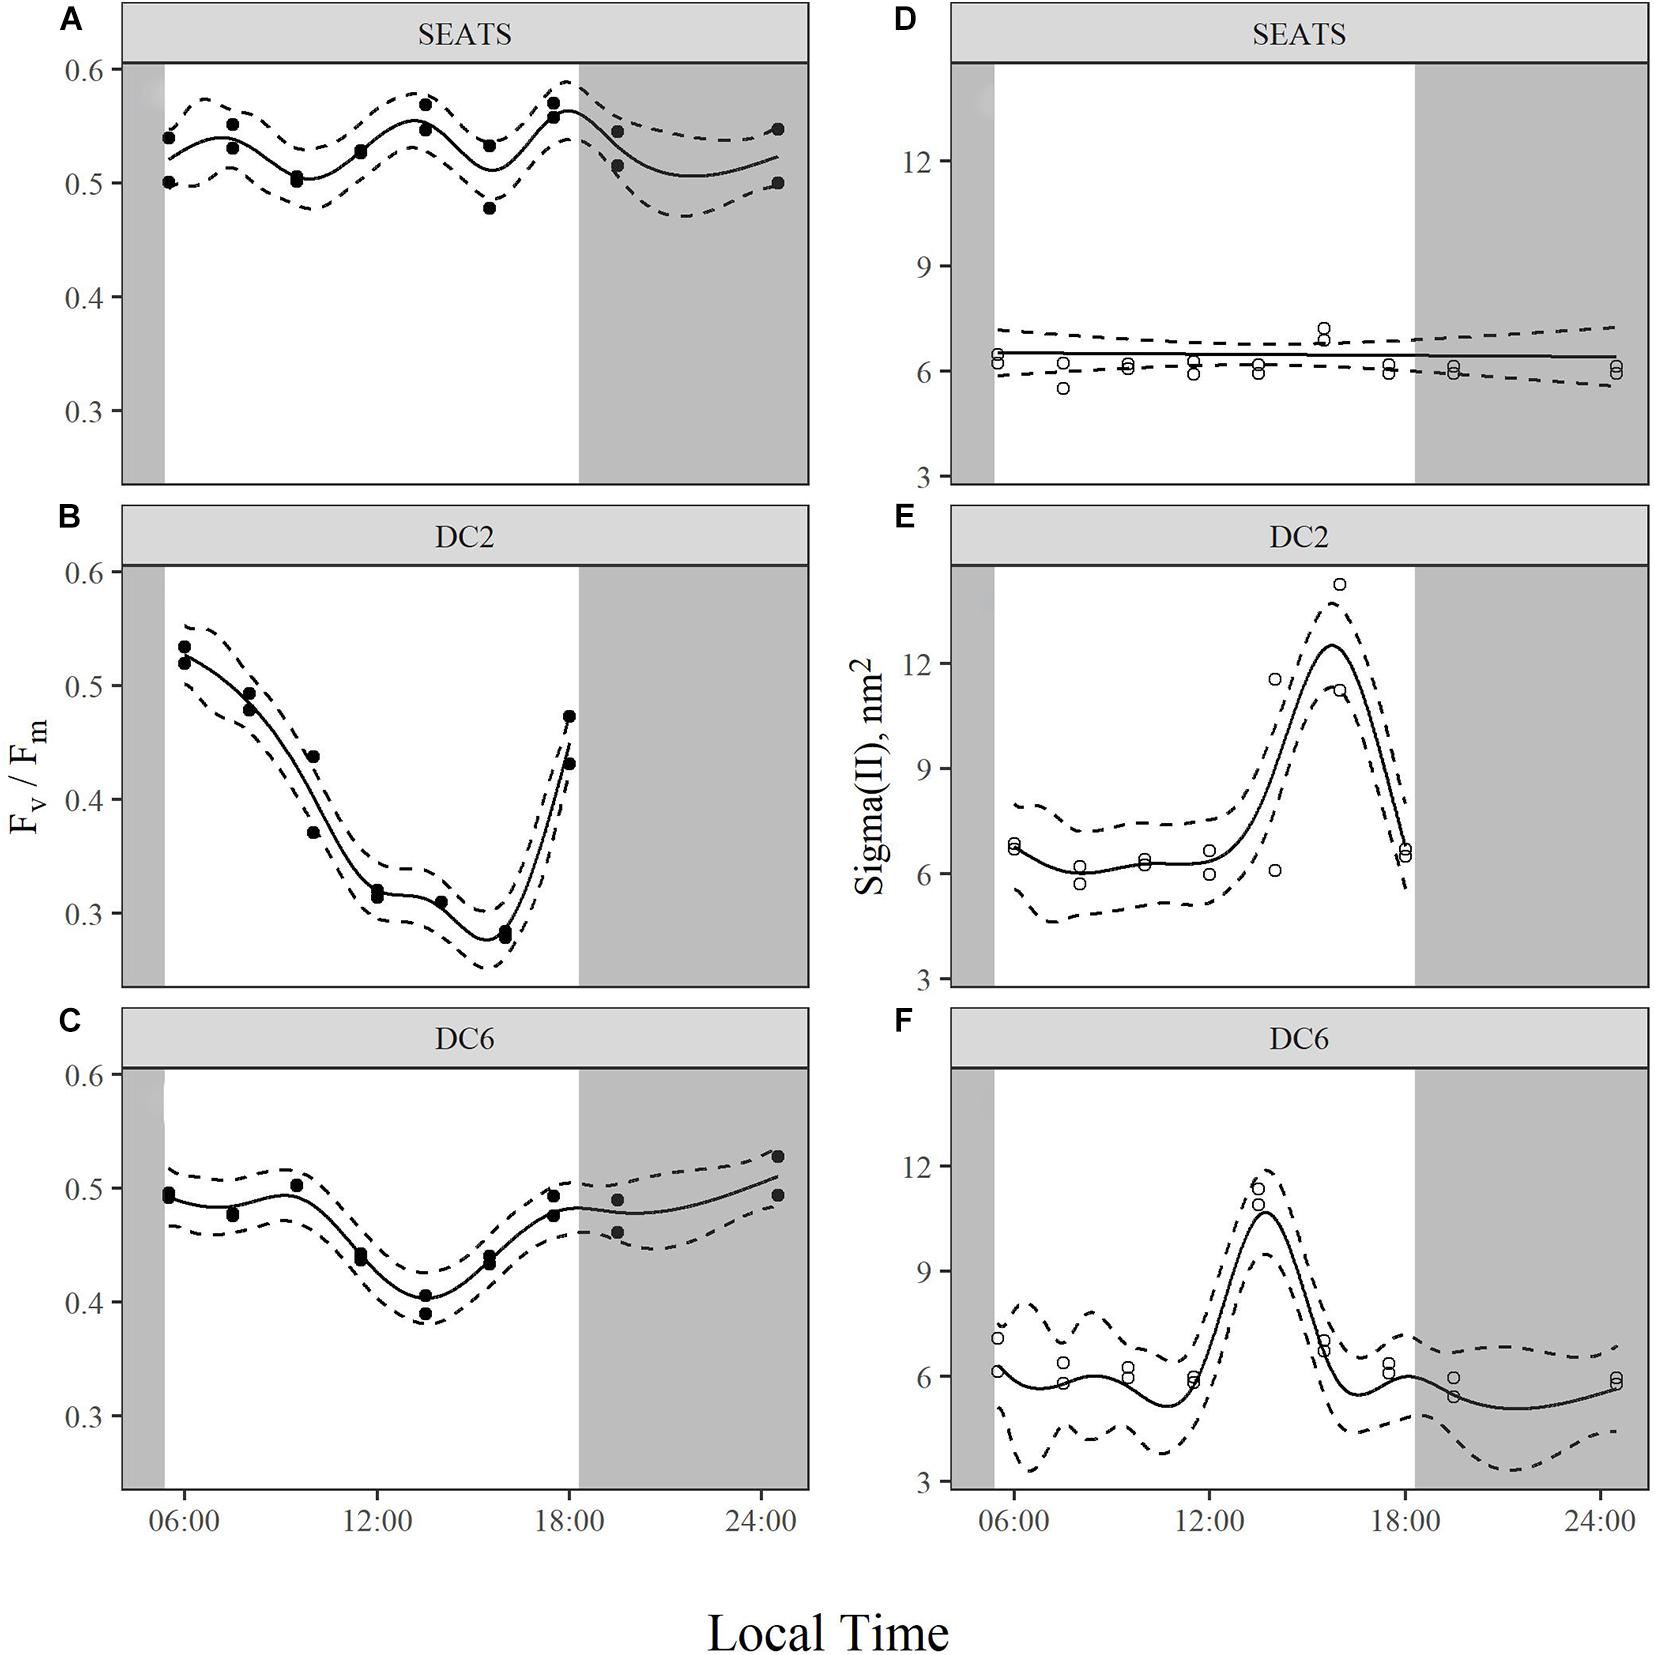
Figure 3. Diurnal variations of maximum quantum yield, Fv/Fm (A–C), and functional absorption cross section of PSII, Sigma(II) (D–F), of surface phytoplankton assemblages at stations SEATS (A,D), DC2 (B,E), and DC6 (C,F). Solid lines and dashed lines are predicted values from GAM with 1.96 times standard errors.
There were similar patterns of diurnal variations of functional absorption cross-section of PSII [Sigma(II)] across three stations (Figures 3D–F). During most of the daytime, the values of Sigma(II) were similar (∼6 nm2), but at around 14:00 the values of Sigma(II) were apparently higher than those measured at other time points. Such a Sigma(II) peak was more prominent at stations DC2 (Figure 3E) and DC6 (Figure 3F) (∼11 nm2) than at the station SEATS (∼7 nm2) (Figure 3D).
The Diurnal Variations of rETR
Over the course of the diurnal cycle, variations in the light dependence of rETR were observed at all stations (Figure 4). These variations were quantitatively described by the changes of the parameters rETRmax and Ek (Figure 5 and Supplementary Figures 3, 4). Generally, rETRmax increased after sunrise, reached maximal values around noon, and decreased afterward at all stations (Figures 5A–C). However, the timing of the peak and the magnitude of the diurnal variation of rETRmax were different between stations. At stations SEATS (Figure 5A) and DC6 (Figure 5C), the daily maximal value of rETRmax was observed at ∼12:00, but was observed at 10:00 at station DC2 (Figure 5B). In addition, the changing range of rETRmax was 30 ∼ 100 a.u. (arbitrary units) at stations SEATS and DC6, but the corresponding range was narrower at station DC2, varying between 40 and 80 a.u. The Ek showed similar patterns of diurnal variations at all stations, with values ranging between ∼50 and ∼200 μmol quanta m–2 s–1, and the daily maxima were all achieved at midday (Figures 5D–F). Additionally, only at station DC2 (Figure 5E), was a second peak of Ek found at around 16:00.
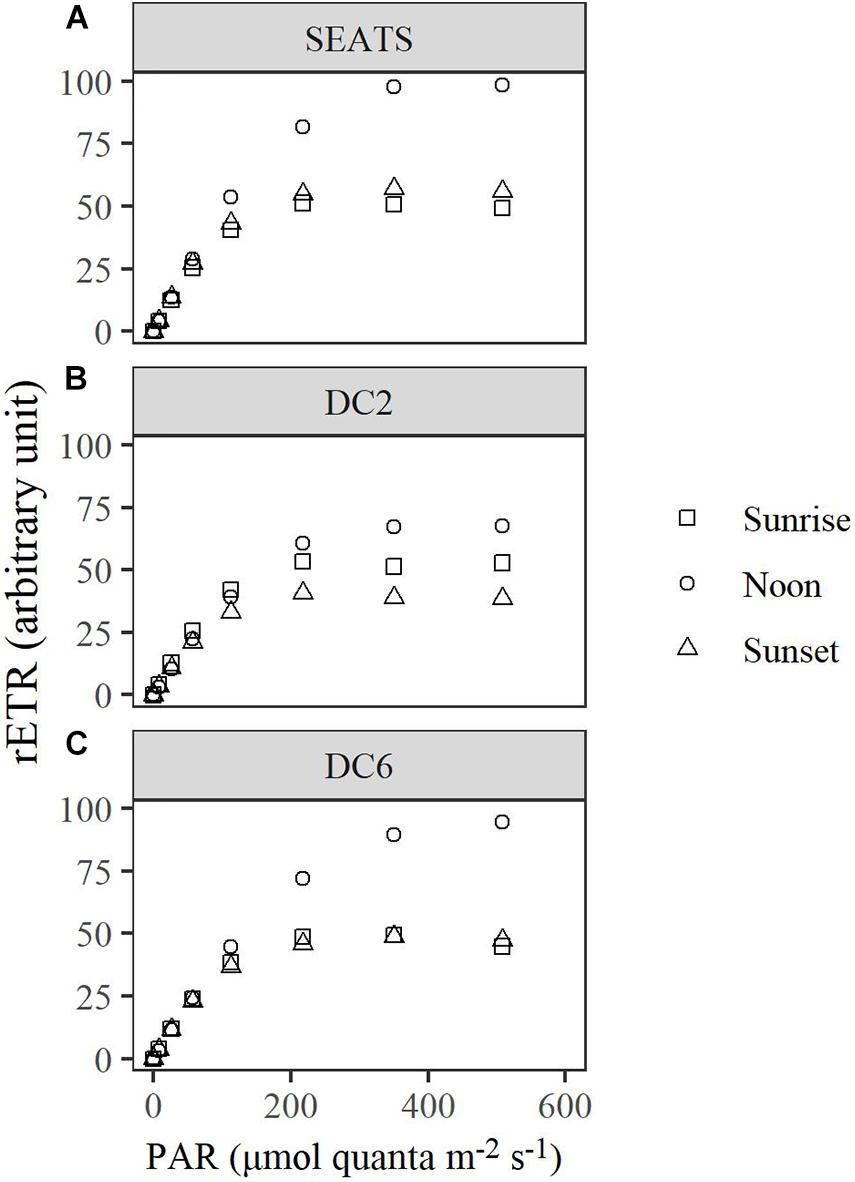
Figure 4. Light curves of relative electron transport rate (rETR) of surface phytoplankton assemblages at stations SEATS (A), DC2 (B), and DC6 (C). Sunrise (05:30 ∼ 06:00), noon (11:30 ∼ 12:00), and sunset (17:30 ∼ 18:00) represent different timings for the measurements, respectively.
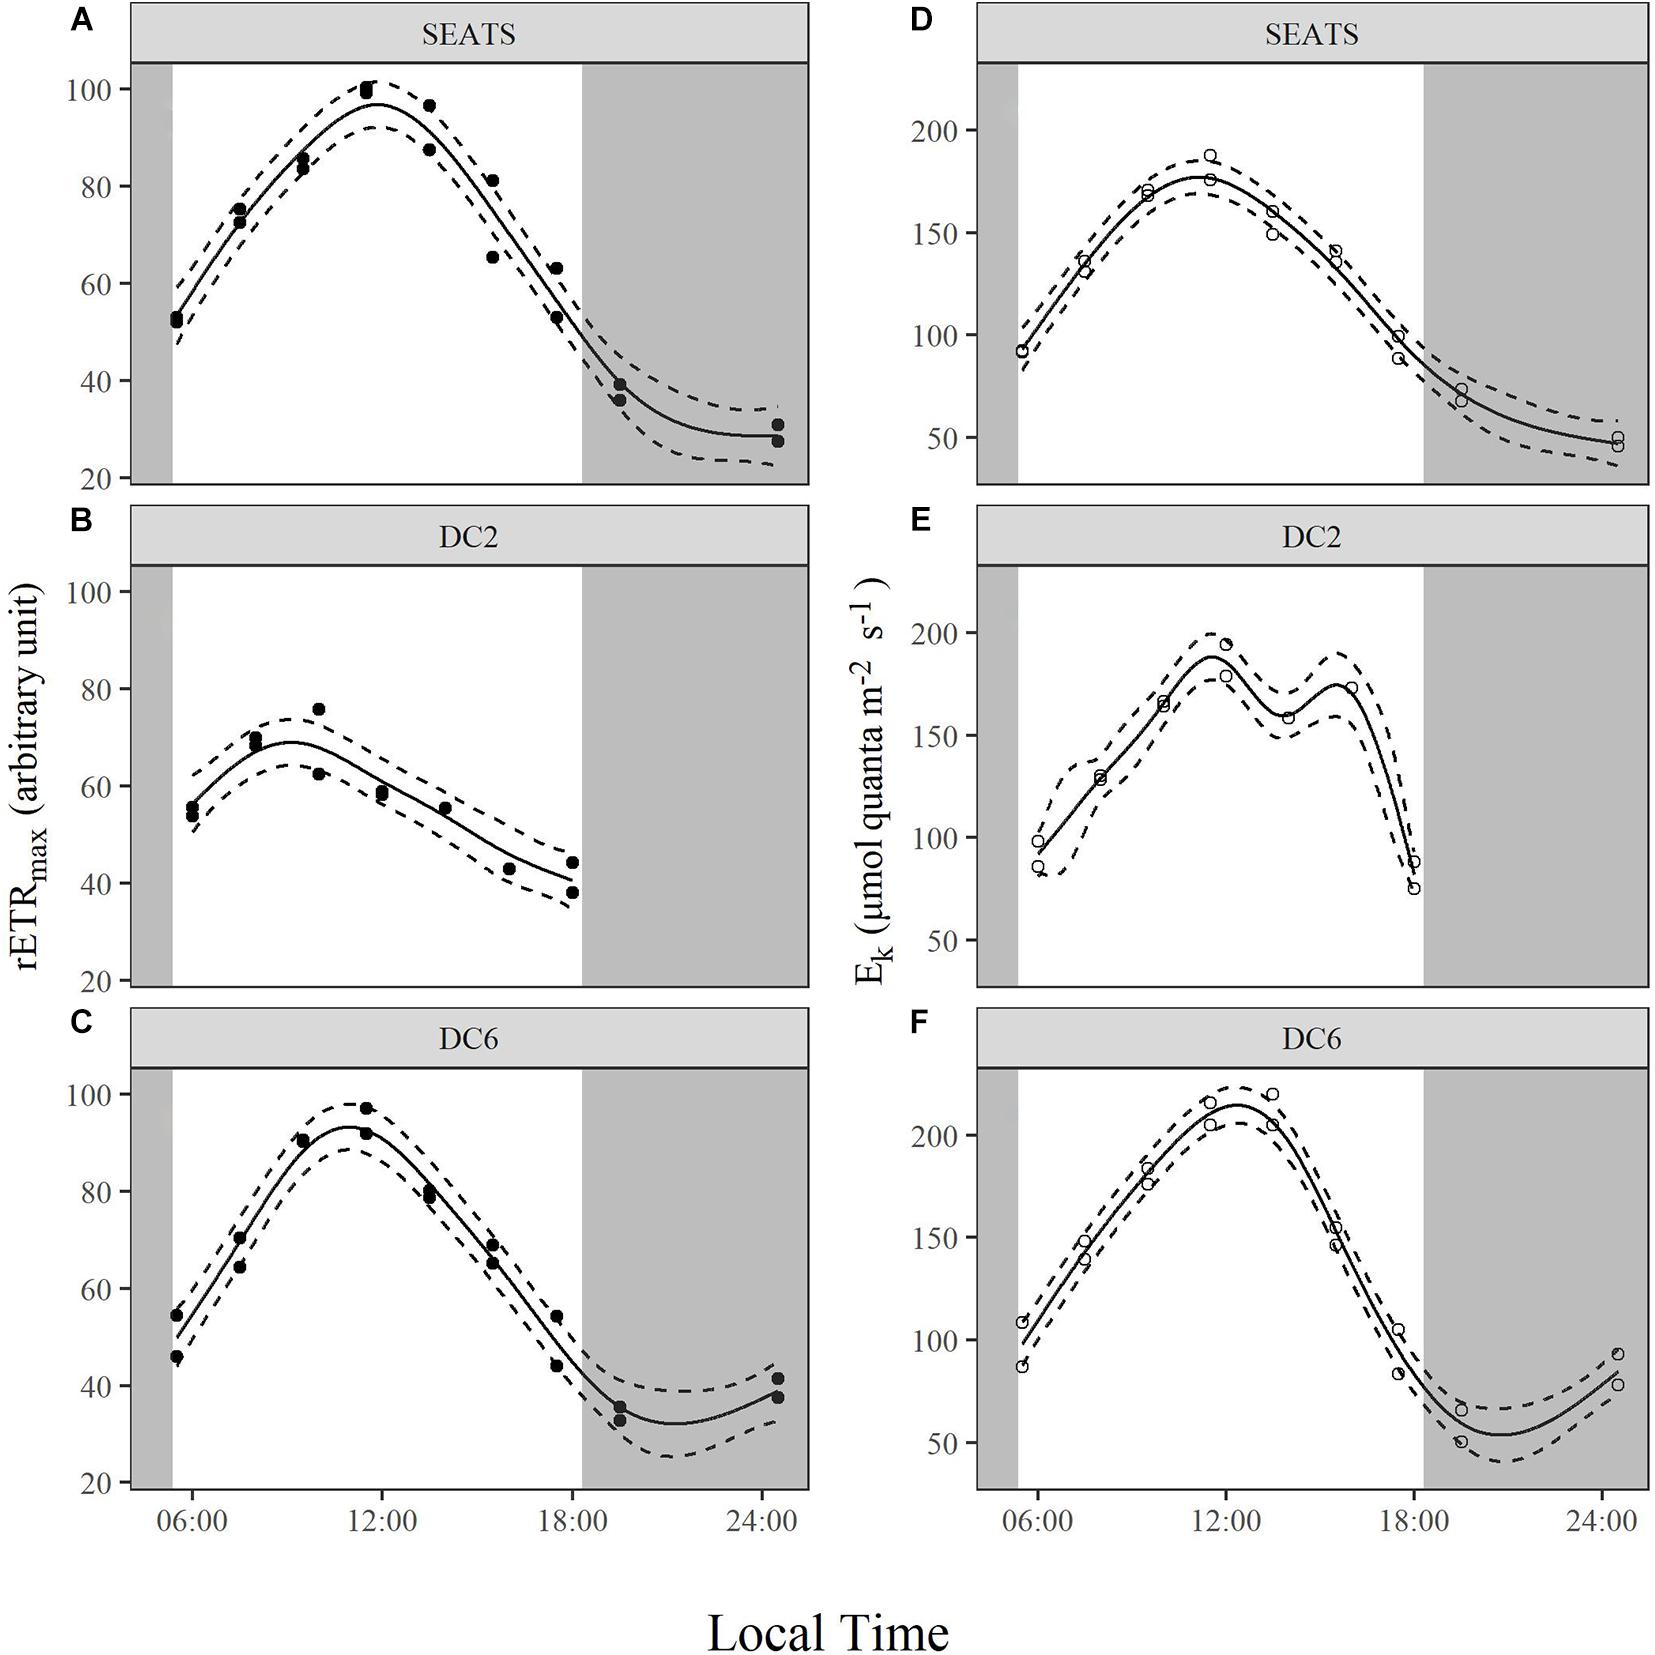
Figure 5. Diurnal variations of maximum relative electron transport rate, rETRmax (A–C), and light saturation point, Ek (D–F), of surface phytoplankton assemblages at stations SEATS (A,D), DC2 (B,E), and DC6 (C,F). Solid lines and dashed lines are predicted values from GAM with 1.96 times standard errors.
Fv′/Fm′ and qP
Note that the values of Fv′/Fm′ and qP shown in Figure 6 and (Supplementary Figures 5, 6) and analyzed below were obtained under an actinic light intensity of 350 μmol quanta m–2 s–1 rather than in situ light intensity at each time point. Measured Fv′/Fm′ exhibited similar values at the beginning of the day at all three stations, but the subsequent diurnal variation patterns were different between stations (Figures 6A–C). At station SEATS (Figure 6A), Fv′/Fm′ increased in the morning, reached the daily maximum at around 13:30, and decreased gradually afterward. However, the values of Fv′/Fm′ at station DC2 (Figure 6B) decreased gradually after the first time point, dropped to a minimum at around 14:00, and then recovered afterward. At station DC6 (Figure 6C), the diurnal pattern of Fv′/Fm′ was similar to that at the SEATS station, except the daily maximum was reached earlier (at ∼10:00). The values of qP at stations SEATS (Figure 6D), DC2 (Figure 6E), and DC6 (Figure 6F) evolved during the daytime in a similar way. At the first time point (around 05:30∼06:00), qP values were around 0.4, gradually increased to approximately 0.8 at midday, and decreased afterward.
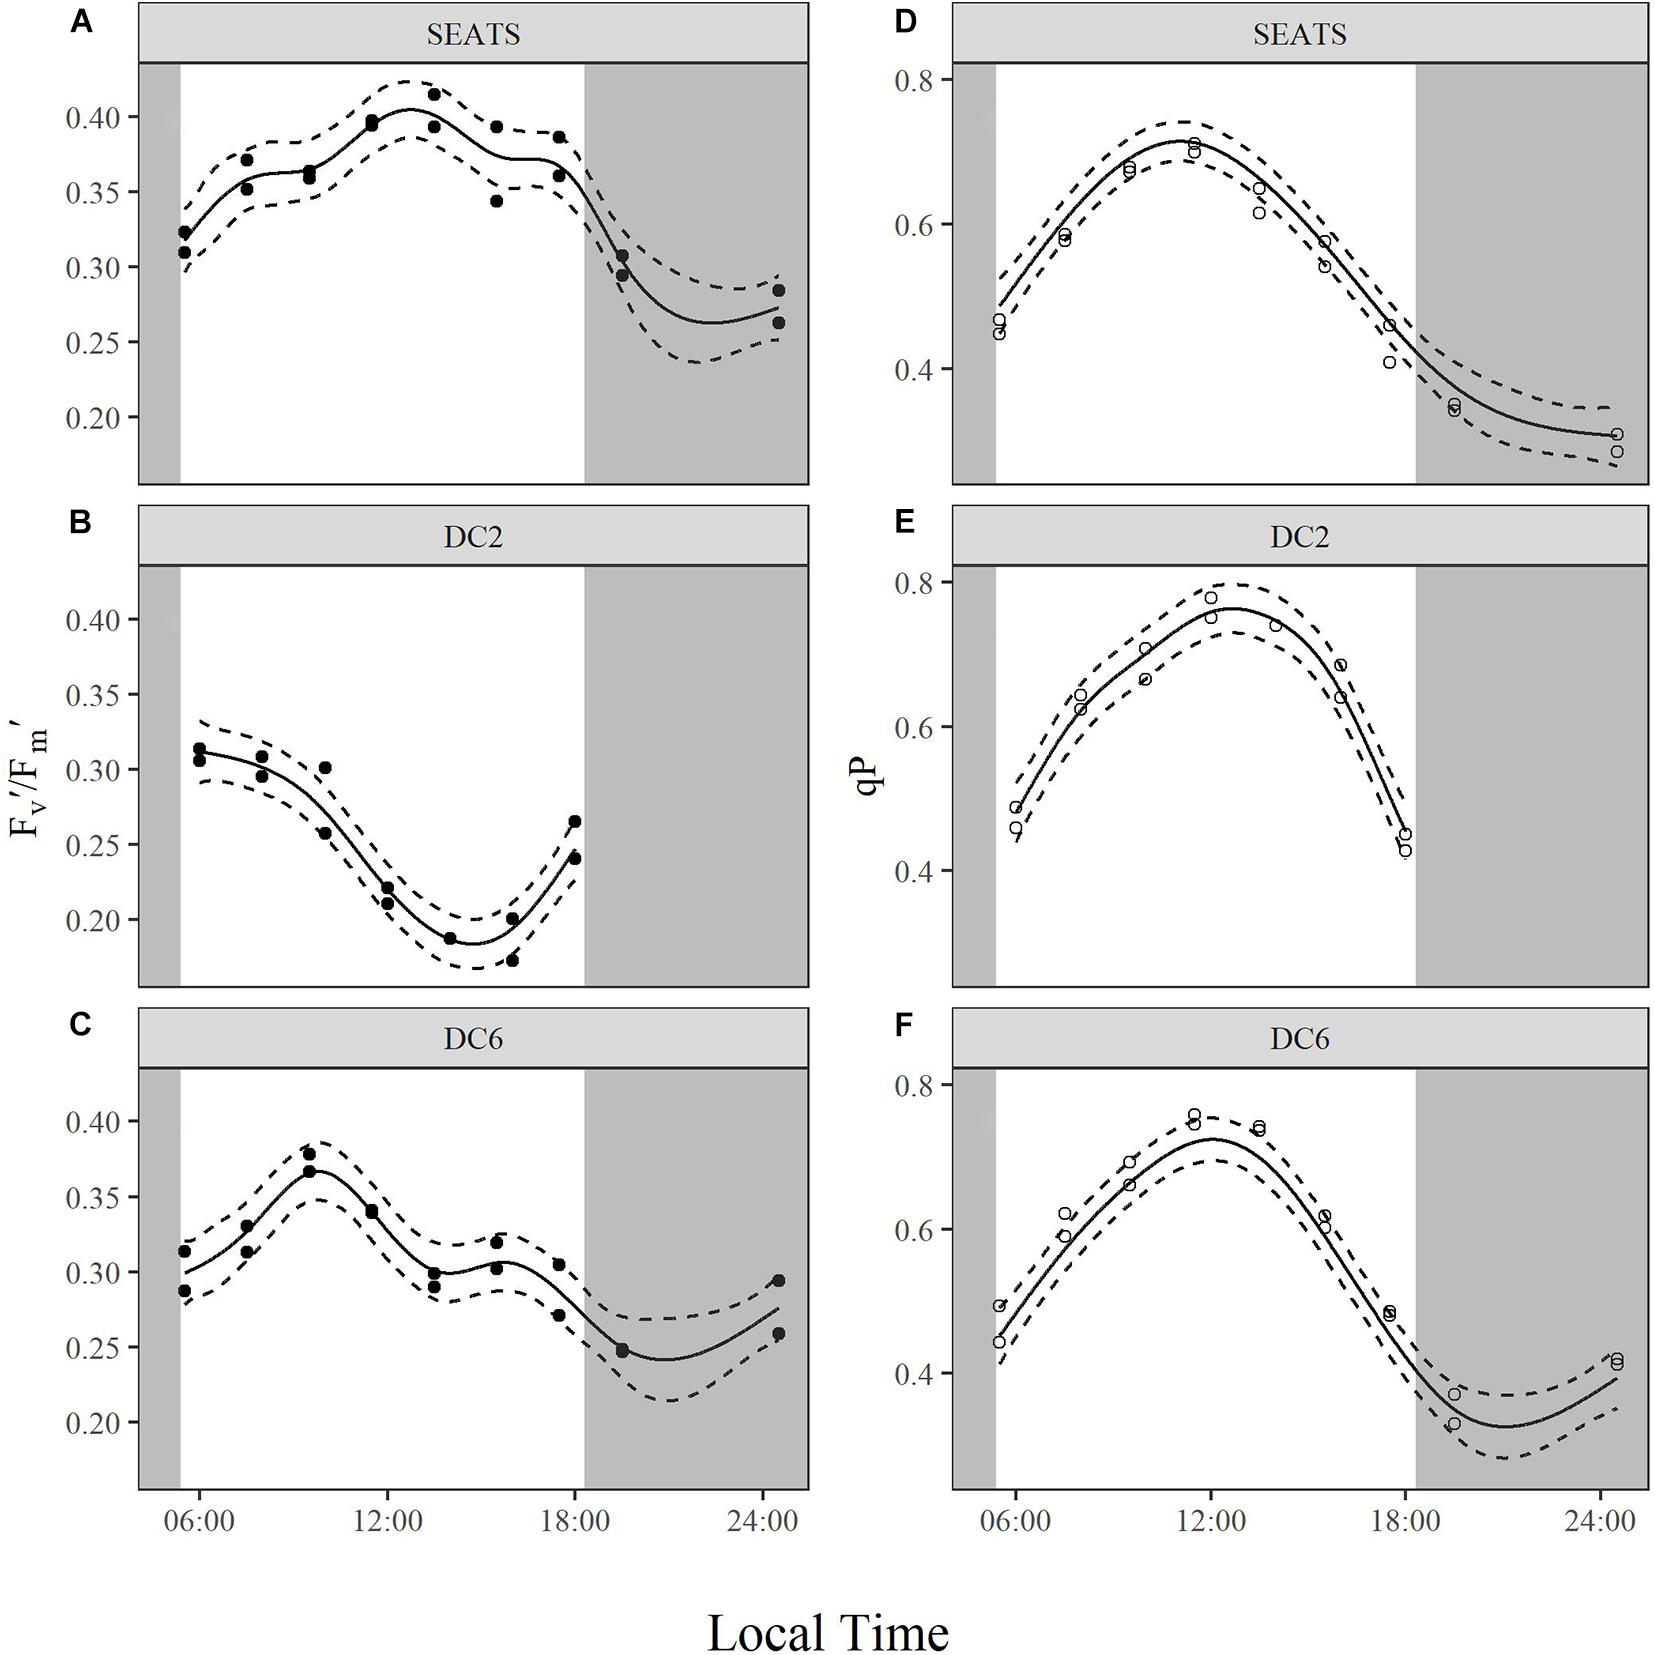
Figure 6. Diurnal variations of light-adapted effective quantum yield of PSII, Fv′/Fm′ (A–C), and photochemical quenching, qP (D–F), of surface phytoplankton assemblages at stations SEATS (A,D), DC2 (B,E), and DC6 (C,F). Solid lines and dashed lines are predicted values from GAM with 1.96 times standard errors.
Discussion
In the present study, we investigated the diurnal patterns of photophysiology of cyanobacteria-dominated phytoplankton at three stations in the northern SCS at which environmental conditions were similar except for the contrasting light regimes at the time of sampling. We could thus ascertain the effects of the light regime through the comparisons of the observations between stations.
The DIN and SPR were depleted (Table 1) and previous studies indicate that the primary limitation to phytoplankton growth in the northern SCS is the availability of nutrients (Lee Chen, 2005; Lee Chen and Chen, 2006), but the values of Fv/Fm at dawn were as high as 0.5 at all stations (Figure 3). Such values were comparable to or slightly less than those reported in laboratory experiments in which Prochlorococcus or Synechococcus were cultured with replete nutrient availability (Bruyant et al., 2005; Mella-Flores et al., 2012; Murphy et al., 2017). It has been shown that phytoplankton are able to maintain balanced growth and high Fv/Fm in a stable environment with continuously limited nutrient supply (Parkhill et al., 2001; Suggett et al., 2009). Therefore, our results indicated that although nutrient supply was limited, phytoplankton were likely under balanced growth.
Across the course of the day, Fv/Fm values at SEATS were relatively constant with the daily maximum of surface PAR being less than 1,000 quanta m–2 s–1, whereas we observed an obvious drop in Fv/Fm around midday with the maximum surface PAR exceeding 2,000 μmol quanta m–2 s–1 at DC2 and DC6 (Figure 2 and Table 1). Additionally, compared to station SEATS, the shallower MLD at stations DC2 and DC6 might also increase the mean light intensity received by phytoplankton within the upper mixed layer (Table 1). Decreasing Fv/Fm is a typical indicator of photoinactivation of PSII induced by high light, which is accompanied by the damage and degradation of the D1 protein in PSII (Ragni et al., 2010; Wu et al., 2011; Campbell and Tyystjärvi, 2012; McKew et al., 2013; Murphy et al., 2017; Ni et al., 2017; Campbell and Serôdio, 2020). In addition, salinity, nutrients, and pH of the seawater and the operation of photoprotective non-photochemical quenching (NPQ) under circadian clocks can also affect the value of Fv/Fm (Berman-Frank et al., 2001; Dijkman and Kromkamp, 2006; Fu et al., 2007; Suggett et al., 2009). During the experimental period, nutrient and salinity conditions were comparable between the three stations and Fv/Fm values at dawn were similar, so if the midday drop of Fv/Fm at stations DC2 and DC6 had been related to the salinity or nutrient status of phytoplankton cells (Behrenfeld and Kolber, 1999; Behrenfeld et al., 2006; Xie et al., 2018), we would have observed a similar phenomenon at station SEATS. Additionally, phytoplankton community structures were highly similar across three stations, so if a circadian clock or photoprotective NPQ had played a role, we also would have observed a similar midday Fv/Fm drop at station SEATS. Furthermore, keeping phytoplankton samples in low light and darkness before active Chl a fluorescence measurement should relax most of the photoprotective NPQ (Campbell and Tyystjärvi, 2012), which also suggests that photoprotective NPQ would not explain our observations. Although we did not measure the parameters of carbonate chemistry, previous studies indicate that these values would be similar across this region (Chen et al., 2006; Du et al., 2020), so the differences in the diurnal patterns of Fv/Fm are unlikely to be related to the seawater pH. However, phytoplankton cells at stations DC2 and DC6 were definitely exposed to higher light intensity. Therefore, we argue that decreasing midday Fv/Fm values at stations DC2 and DC6 were caused by high light, indicating photoinactivation of PSII. Compared to station DC6, light intensity was higher at station DC2, corresponding to the more intense photoinactivation (lower Fv/Fm around noon) found at station DC2 (Supplementary Table 1 and Supplementary Figure 1). Additionally, at both stations DC2 and DC6, daily minima of Fv/Fm slightly lagged behind the daily maxima of PAR, conforming with accumulative effects of photoinactivation (Supplementary Figure 1). Murphy et al. (2017), through laboratory experiments with Prochlorococcus and Synechococcus, showed that under low to moderate light, photoinactivation of PSII is mainly caused by absorbance of short-wavelength light (blue light and UV) by the Mn4Ca cluster in the PSII oxygen-evolving complex, whereas under high excitation pressure, ROS formation is the dominant mechanism leading to photoinactivation. As found in our results, under low to moderate light (at station SEATS), a relatively stable Fv/Fm might be a reflection of a balance between PSII damage and repair (no net photoinactivation), whereas under high light pressure (at DC2 and DC6), cells produced ROS not only can damage PSII directly but also inhibit repair process (Mella-Flores et al., 2012; Murphy et al., 2017), ultimately leading to net photoinactivation. Laboratory experiments indicate that compared to Synechococcus, Prochlorococcus is more susceptible to photoinactivation and invests fewer resources to repair of inactivated PSII, which might be a tradeoff for a high acquisition of nutrients (Mella-Flores et al., 2012; Murphy et al., 2017). Nevertheless, at both stations DC2 and DC6, Fv/Fm values recovered to about 0.5 around dusk, indicating the relief of photoinactivation. A midday drop in Fv/Fm on a clear day is recognized as a general phenomenon for natural phytoplankton communities living in the upper layer of the water column (Doblin et al., 2011; Xie et al., 2018; Schuback and Tortell, 2019; Xu et al., 2020).
Unlike Fv/Fm, Sigma(II) was relatively stable during most of the time at all three stations (Figure 2), though in another study conducted in the same area, light-acclimated σPSII′ (functional absorption cross section measured by FRRf) was negatively correlated to the incident irradiance intensity (Xie et al., 2018). Considering the difference in pre-treatment of samples (dark acclimation vs. no dark acclimation), such inconsistency suggests that the decrease in PSII functional absorption cross section induced by high light might be quickly reversed by dark acclimation. Such conjecture is consistent with the results from another study in which both dark-acclimated and light-acclimated σPSII were simultaneously measured (Schuback and Tortell, 2019). In this study, σPSII is relatively stable during the day and σPSII′ displays a midday minimum. In our study, superimposed on the mostly stable Sigma(II) were abnormally high values near noon at all three stations (Figures 2D–F), especially at stations DC2 and DC6. In addition to some unclear physiological basis for such phenomenon, we have to consider the possibility that the seemingly abnormal peaks at noon might relate to some technical issue. Because the intensive photoinactivation of PSII at noon makes the curve of fluorescence induction kinetics quite flat (data not shown), this might affect the calculation of Sigma(II) which relies on the model fitting of the curve.
Although cyanobacteria-dominated phytoplankton at stations DC2 and DC6 presented as being photoinactivated around noon, they also showed a midday peak of rETRmax as did the phytoplankton at station SEATS. Photosynthetic electron transport chains supply the reductant and energy for the dark reactions of photosynthesis, so the parameter, rETRmax, partially reflects the photosynthetic potential (Ralph and Gademann, 2005). Therefore, our results suggest that phytoplankton in the oligotrophic SCS could maintain photosynthetic potential even under the influence of photoinactivation of PSII. Additionally, based on Figure 4 and Equation 3, rETRmax directly reflects the ability of cells to maintain effective photochemical efficiency (ΦPSII) at high light. Furthermore, the value of ΦPSII can be decomposed into Fv′/Fm′ and qP (Equations 8–10). In the present study, the diurnal patterns of rETRmax were mainly controlled by qP rather than Fv′/Fm′ (Figures 5A–C, 6). At each study site, the diurnal variations of rETRmax mimicked those of qP, and the daily peak of rETRmax was amplified at stations SEATS and DC6 but offset and slightly advanced at station DC2 via changes in Fv′/Fm′. Higher incident solar irradiance at station DC2, which resulted in greater photoinactivation, might explain why the diurnal variations of Fv′/Fm′ at station DC2 were different from those at stations SEATS and DC6 (Figures 6A–C and Supplementary Figure 6). In terms of qP, higher values, generally, reflect a situation in which PSII downstream is in a more oxidizing state, which requires active electron-consuming reactions downstream of PSII, such as the dark reactions of photosynthesis (Falkowski and Raven, 2007). In Prochlorococcus and Synechococcus, the expression of the key carbon fixation enzyme, ribulose bisphosphate carboxylase/oxygenase (Rubisco), has been shown to be partially controlled by an endogenous circadian clock (Pichard et al., 1996; Wyman, 1999; Paul et al., 2000), especially for Synechococcus whose circadian clock can remain after cells are transferred to the continuous light regime (Pattanayak and Rust, 2014; Cohen and Golden, 2015). In addition to the dark reactions, other electron-consuming mechanisms may also contribute to the midday qP peak. These include components such as the plastid terminal oxidase (PTOX) and alternative oxidase (AOX) (McDonald and Vanlerberghe, 2005; Berg et al., 2011), whose activities also show a circadian rhythm. In addition, cyanobacteria are known for their ability to adjust the energy allocation between PSII and PSI (state transition) (Campbell et al., 1998). Several electron consuming processes rely on the operation of PSI (Mullineaux, 2014a,b), and PSI is more tolerant to high light than PSII (Tikkanen et al., 2014), so state transitions may play a role in maintaining the midday photosynthetic potential through channeling more energy to PSI. Overall, our results indicated that the rETRmax, a proxy for photosynthetic potential, presented as being unimodal with a peak around midday, which might be mainly controlled by endogenous circadian clock, and could maintain high values under the influence of high light-induced photoinactivation.
The rETRmax was interpreted as the photosynthetic potential here, but rETR is not necessarily proportional to O2 evolution or carbon fixation (Schuback et al., 2016; Schuback and Tortell, 2019). rETR is a simplified parameter quantifying the overall linear electron transport rate. From electron transport to carbon fixation, the existence of such electron consumption mechanisms as nitrate reduction, sulfate reduction and the water-water cycles (Mullineaux, 2014a,b; Raven et al., 2020) affect the ratio of electron transport to carbon fixation. The inconsistency between electron transport and carbon fixation might cause their patterns of diurnal variation to be different from each other (Schuback et al., 2016; Xie et al., 2018; Schuback and Tortell, 2019). In addition, both Prochlorococcus and Synechococcus contain diverse ecotypes/subclusters that show different niche adaptation (Rocap et al., 2002; Scanlan et al., 2009). Generally, in the SCS, the Synechococcus subcluster 5.2 dominates the coastal cyanobacteria community, and the high-light ecotypes of Prochlorococcus and the subcluster 5.1 of Synechococcus are the major ecotype/subcluster in the open water (Jing and Liu, 2012; Xia et al., 2015). However, there are spatially and temporally variations in the ecotype/subcluster composition (Jing and Liu, 2012; Xia et al., 2015; Singh and Bhadury, 2018). Therefore, concomitantly determining the ecotype/subcluster composition will improve our understanding of the diurnal patterns of phytoplankton photophysiological characteristics and its relationship to the ecotype/subcluster composition in the future.
Data Availability Statement
The raw data supporting the conclusions of this article will be made available by the authors, without undue reservation.
Author Contributions
XY and KG designed the experiment. XY, DZ, and JS carried out the experiment. XY, KG, and JB analyzed the data and wrote the manuscript. All authors contributed to the article and approved the submitted version.
Funding
The study was supported by National Natural Science Foundation of China (41720104005, 41890803, and 41721005).
Conflict of Interest
The authors declare that the research was conducted in the absence of any commercial or financial relationships that could be construed as a potential conflict of interest.
Publisher’s Note
All claims expressed in this article are solely those of the authors and do not necessarily represent those of their affiliated organizations, or those of the publisher, the editors and the reviewers. Any product that may be evaluated in this article, or claim that may be made by its manufacturer, is not guaranteed or endorsed by the publisher.
Acknowledgments
The authors would like to thank the laboratory engineers Xianglan Zeng and Wenyan Zhao for their logistic and technical supports.
Supplementary Material
The Supplementary Material for this article can be found online at: https://www.frontiersin.org/articles/10.3389/fmars.2021.736586/full#supplementary-material
References
Bailleul, B., Park, J., Brown, C. M., Bidle, K. D., Lee, S. H., and Falkowski, P. G. (2017). Direct measurements of the light dependence of gross photosynthesis and oxygen consumption in the ocean. Limnol. Oceanogr. 62, 1066–1079. doi: 10.1002/lno.10486
Behrenfeld, M. J., and Kolber, Z. S. (1999). Widespread iron limitation of phytoplankton in the South Pacific Ocean. Science 283, 840–843. doi: 10.1126/science.283.5403.840
Behrenfeld, M. J., Worthington, K., Sherrell, R. M., Chavez, F. P., Strutton, P., McPhaden, M., et al. (2006). Controls on tropical Pacific Ocean productivity revealed through nutrient stress diagnostics. Nature 442, 1025–1028. doi: 10.1038/nature05083
Berg, G. M., Shrager, J., van Dijken, G., Mills, M. M., Arrigo, K. R., and Grossman, A. R. (2011). Responses of psbA, hli and ptox genes to changes in irradiance in marine Synechococcus and Prochlorococcus. Aquat. Microb. Ecol. 65, 1–14.
Berman-Frank, I., Lundgren, P., Chen, Y.-B., Küpper, H., Kolber, Z., Bergman, B., et al. (2001). Segregation of nitrogen fixation and oxygenic photosynthesis in the marine cyanobacterium Trichodesmium. Science 294, 1534–1537. doi: 10.1126/science.1064082
Bruyant, F., Babin, M., Genty, B., Prasil, O., Behrenfeld, M. J., Claustre, H., et al. (2005). Diel variations in the photosynthetic parameters of Prochlorococcus strain PCC 9511: combined effects of light and cell cycle. Limnol. Oceanogr. 50, 850–863. doi: 10.4319/lo.2005.50.3.0850
Campbell, D., Hurry, V., Clarke, A. K., Gustafsson, P., and Öquist, G. (1998). Chlorophyll fluorescence analysis of cyanobacterial photosynthesis and acclimation. Microbiol. Mol. Biol. Rev. 62, 667–683. doi: 10.1128/MMBR.62.3.667-683.1998
Campbell, D. A., and Serôdio, J. (2020). “Photoinhibition of photosystem II in phytoplankton: processes and patterns,” in Photosynthesis in Algae: Biochemical and Physiological Mechanisms, eds A. W. D. Larkum, A. R. Grossman, and J. A. Raven (Cham: Springer International Publishing), 329–365.
Campbell, D. A., and Tyystjärvi, E. (2012). Parameterization of photosystem II photoinactivation and repair. Biochim. Biophys. Acta 1817, 258–265. doi: 10.1016/j.bbabio.2011.04.010
Chen, C.-T. A., Wang, S.-L., Chou, W.-C., and Sheu, D. D. (2006). Carbonate chemistry and projected future changes in pH and CaCO3 saturation state of the South China Sea. Mar. Chem. 101, 277–305. doi: 10.1016/j.marchem.2006.01.007
Cohen, S. E., and Golden, S. S. (2015). Circadian rhythms in cyanobacteria. Microbiol. Mol. Biol. Rev. 79, 373–385. doi: 10.1128/mmbr.00036-15
Doblin, M. A., Petrou, K. L., Shelly, K., Westwood, K., van den Enden, R., Wright, S., et al. (2011). Diel variation of chlorophyll-a fluorescence, phytoplankton pigments and productivity in the Sub-Antarctic and Polar Front Zones south of Tasmania, Australia. Deep Sea Res. Part II Top. Stud. Oceanogr. 58, 2189–2199. doi: 10.1016/j.dsr2.2011.05.021
Dijkman, N. A., and Kromkamp, J. C. (2006). Photosynthetic characteristics of the phytoplankton in the scheldt estuary: community and single-cell fluorescence measurements. Eur. J. Phycol. 41, 425–434. doi: 10.1080/09670260600937791
Du, C., Gan, J., Hui, C. R., Lu, Z., Zhao, X., Roberts, E., et al. (2020). Dynamics of dissolved inorganic carbon in the South China Sea: a modeling study. Prog. Oceanogr. 186:102367. doi: 10.1016/j.pocean.2020.102367
Du, C., Liu, Z., Kao, S.-J., and Dai, M. (2017). Diapycnal fluxes of nutrients in an oligotrophic oceanic regime: the South China sea. Geophys. Res. Lett. 44, 11, 510–511, 518. doi: 10.1002/2017GL074921
Dubinsky, Z., and Stambler, N. (2009). Photoacclimation processes in phytoplankton: mechanisms, consequences, and applications. Aquat. Microb. Ecol. 56, 163–176. doi: 10.3354/ame01345
Eilers, P. H. C., and Peeters, J. C. H. (1988). A model for the relationship between light intensity and the rate of photosynthesis in phytoplankton. Ecol. Model. 42, 199–215. doi: 10.1016/0304-3800(88)90057-9
Falkowski, P. G., and Raven, J. A. (2007). Aquatic Photosynthesis. Princeton, NJ: Princeton University Press.
Field, C. B., Behrenfeld, M. J., Randerson, J. T., and Falkowski, P. (1998). Primary production of the biosphere: integrating terrestrial and oceanic components. Science 281, 237–240. doi: 10.1126/science.281.5374.237
Fu, F.-X., Warner, M. E., Zhang, Y., Feng, Y., and Hutchins, D. A. (2007). Effects of increased temperature and Co2 on photosynthesis, growth, and elemental ratios in marine Synechococcus and Prochlorococcus (Cyanobacteria). J. Phycol. 43, 485–496. doi: 10.1111/j.1529-8817.2007.00355.x
Gao, K., Helbling, E. W., Häder, D. P., and Hutchins, D. A. (2012). Responses of marine primary producers to interactions between ocean acidification, solar radiation, and warming. Mar. Ecol. Prog. Ser. 470, 167–189. doi: 10.3354/meps10043
Han, A., Dai, M., Kao, S.-J., Gan, J., Li, Q., Wang, L., et al. (2012). Nutrient dynamics and biological consumption in a large continental shelf system under the influence of both a river plume and coastal upwelling. Limnol. Oceanogr. 57, 486–502. doi: 10.4319/lo.2012.57.2.0486
Huang, B., Hu, J., Xu, H., Cao, Z., and Wang, D. (2010). Phytoplankton community at warm eddies in the northern South China Sea in winter 2003/2004. Deep Sea Res. Part II Top. Stud. Oceanogr. 57, 1792–1798. doi: 10.1016/j.dsr2.2010.04.005
Jing, H., and Liu, H. (2012). Phylogenetic composition of Prochlorococcus and Synechococcus in cold eddies of the South China Sea. Aquat. Microb. Ecol. 65, 207–219. doi: 10.3354/ame01546
Kara, A. B., Rochford, P. A., and Hurlburt, H. E. (2000). An optimal definition for ocean mixed layer depth. J. Geophys. Res. 105, 16803–16821. doi: 10.1029/2000jc900072
Kolber, Z. S., Prášil, O., and Falkowski, P. G. (1998). Measurements of variable chlorophyll fluorescence using fast repetition rate techniques: defining methodology and experimental protocols. Biochim. Biophys. Acta 1367, 88–106. doi: 10.1016/S0005-2728(98)00135-2
Lee Chen, Y.-l (2005). Spatial and seasonal variations of nitrate-based new production and primary production in the South China Sea. Deep Sea Res. Part I Oceanogr. Res. Pap. 52, 319–340. doi: 10.1016/j.dsr.2004.11.001
Lee Chen, Y.-l, and Chen, H.-Y. (2006). Seasonal dynamics of primary and new production in the northern South China Sea: the significance of river discharge and nutrient advection. Deep Sea Res. Part I Oceanogr. Res. Pap. 53, 971–986. doi: 10.1016/j.dsr.2006.02.005
Ley, A. C., and Mauzerall, D. C. (1982). Absolute absorption cross-sections for Photosystem II and the minimum quantum requirement for photosynthesis in Chlorella vulgaris. Biochim. Biophys. Acta 680, 95–106. doi: 10.1016/0005-2728(82)90320-6
Li, Q., Guo, X., Zhai, W., Xu, Y., and Dai, M. (2020). Partial pressure of CO2 and air-sea CO2 fluxes in the South China Sea: synthesis of an 18-year dataset. Prog. Oceanogr. 182:102272. doi: 10.1016/j.pocean.2020.102272
Mackey, M. D., Mackey, D. J., Higgins, H. W., and Wright, S. W. (1996). CHEMTAX – a program for estimating class abundances from chemical markers: application to HPLC measurements of phytoplankton. Mar. Ecol. Prog. Ser. 144, 265–283. doi: 10.3354/meps144265
McDonald, A. E., and Vanlerberghe, G. C. (2005). Alternative oxidase and plastoquinol terminal oxidase in marine prokaryotes of the Sargasso Sea. Gene 349, 15–24. doi: 10.1016/j.gene.2004.12.049
McKew, B. A., Davey, P., Finch, S. J., Hopkins, J., Lefebvre, S. C., Metodiev, M. V., et al. (2013). The trade-off between the light-harvesting and photoprotective functions of fucoxanthin-chlorophyll proteins dominates light acclimation in Emiliania huxleyi (clone CCMP 1516). New Phytol. 200, 74–85. doi: 10.1111/nph.12373
Mella-Flores, D., Six, C., Ratin, M., Partensky, F., Boutte, C., Le Corguillé, G., et al. (2012). Prochlorococcus and Synechococcus have evolved different adaptive mechanisms to cope with light and UV stress. Front. Microbiol. 3:285. doi: 10.3389/fmicb.2012.00285
Müller, P., Li, X.-P., and Niyogi, K. K. (2001). Non-photochemical quenching. A response to excess light energy. Plant Physiol. 125, 1558–1566. doi: 10.1104/pp.125.4.1558
Mullineaux, C. W. (2014a). Electron transport and light-harvesting switches in cyanobacteria. Front. Plant Sci. 5:7. doi: 10.3389/fpls.2014.00007
Mullineaux, C. W. (2014b). Co-existence of photosynthetic and respiratory activities in cyanobacterial thylakoid membranes. Biochim. Biophys. Acta 1837, 503–511. doi: 10.1016/j.bbabio.2013.11.017
Murphy, C. D., Roodvoets, M. S., Austen, E. J., Dolan, A., Barnett, A., and Campbell, D. A. (2017). Photoinactivation of photosystem II in Prochlorococcus and Synechococcus. PLoS One 12:e0168991. doi: 10.1371/journal.pone.0168991
Ni, G., Zimbalatti, G., Murphy, C. D., Barnett, A. B., Arsenault, C. M., Li, G., et al. (2017). Arctic Micromonas uses protein pools and non-photochemical quenching to cope with temperature restrictions on photosystem II protein turnover. Photosynth. Res. 131, 203–220. doi: 10.1007/s11120-016-0310-6
Parkhill, J.-P., Maillet, G., and Cullen, J. J. (2001). Fluorescence-based maximal quantum yield for PSII as a diagnostic of nutrient stress. J. Phycol. 37, 517–529. doi: 10.1046/j.1529-8817.2001.037004517.x
Pattanayak, G., and Rust, M. J. (2014). The cyanobacterial clock and metabolism. Curr. Opin. Microbiol. 18, 90–95. doi: 10.1016/j.mib.2014.02.010
Paul, J. H., Kang, J. B., and Tabita, F. R. (2000). Diel patterns of regulation of rbcl transcription in a cyanobacterium and a Prymnesiophyte. Mar. Biotechnol. 2, 429–436. doi: 10.1007/s101260000016
Pichard, S. L., Campbell, L., Kang, J. B., Tabita, F. R., and Paul, J. H. (1996). Regulation of ribulose bisphosphate carboxylase gene expression in natural phytoplankton communities. I. Diel rhythms. Mar. Ecol. Prog. Ser. 139, 257–265. doi: 10.3354/meps139257
Ragni, M., Airs, R. L., Hennige, S. J., Suggett, D. J., Warner, M. E., and Geider, R. J. (2010). PSII photoinhibition and photorepair in Symbiodinium (Pyrrhophyta) differs between thermally tolerant and sensitive phylotypes. Mar. Ecol. Prog. Ser. 406, 57–70. doi: 10.3354/meps08571
Ralph, P. J., and Gademann, R. (2005). Rapid light curves: a powerful tool to assess photosynthetic activity. Aquat. Bot. 82, 222–237. doi: 10.1016/j.aquabot.2005.02.006
Raven, J. A. (2011). The cost of photoinhibition. Physiol. Plant. 142, 87–104. doi: 10.1111/j.1399-3054.2011.01465.x
Raven, J. A., Beardall, J., and Quigg, A. (2020). “Light-driven oxygen consumption in the water-water cycles and photorespiration, and light stimulated mitochondrial respiration,” in Photosynthesis in Algae: Biochemical and Physiological Mechanisms, eds A. W. D. Larkum, A. R. Grossman, and J. A. Raven (Cham: Springer International Publishing), 161–178.
Rocap, G., Distel, D. L., Waterbury, J. B., and Chisholm, S. W. (2002). Resolution of Prochlorococcus and Synechococcus ecotypes by using 16S-23S ribosomal DNA internal transcribed spacer sequences. Appl. Environ. Microbiol. 68, 1180–1191. doi: 10.1128/AEM.68.3.1180-1191.2002
Scanlan, D. J., Ostrowski, M., Mazard, S., Dufresne, A., Garczarek, L., Hess, W. R., et al. (2009). Ecological genomics of marine picocyanobacteria. Microbiol. Mol. Biol. Rev. 73, 249–299. doi: 10.1128/MMBR.00035-08
Schreiber, U., Klughammer, C., and Kolbowski, J. (2012). Assessment of wavelength-dependent parameters of photosynthetic electron transport with a new type of multi-color PAM chlorophyll fluorometer. Photosynth. Res. 113, 127–144. doi: 10.1007/s11120-012-9758-1
Schuback, N., and Tortell, P. D. (2019). Diurnal regulation of photosynthetic light absorption, electron transport and carbon fixation in two contrasting oceanic environments. Biogeosciences 16, 1381–1399. doi: 10.5194/bg-16-1381-2019
Schuback, N., Flecken, M., Maldonado, M. T., and Tortell, P. D. (2016). Diurnal variation in the coupling of photosynthetic electron transport and carbon fixation in iron-limited phytoplankton in the NE subarctic Pacific. Biogeosciences 13, 1019–1035. doi: 10.5194/bg-13-1019-2016
Singh, T., and Bhadury, P. (2018). Distribution patterns of marine planktonic cyanobacterial assemblages in transitional marine habitats using 16S rRNA phylogeny. Phycol. Res. 66, 189–198. doi: 10.1111/pre.12224
Suggett, D. J., Le Floc’H, E., Harris, G. N., Leonardos, N., and Geider, R. J. (2007). Different strategies of photoacclimation by two strains of Emiliania huxleyi (Haptophyta). J. Phycol. 43, 1209–1222. doi: 10.1111/j.1529-8817.2007.00406.x
Suggett, D. J., Moore, C. M., Hickman, A. E., and Geider, R. J. (2009). Interpretation of fast repetition rate (FRR) fluorescence: signatures of phytoplankton community structure versus physiological state. Mar. Ecol. Prog. Ser. 376, 1–19.
Sung, T., Yoon, S. Y., and Kim, K. C. (2015). A mathematical model of hourly solar radiation in varying weather conditions for a dynamic simulation of the solar organic Rankine cycle. Energies 8, 7058–7069. doi: 10.3390/en8077058
Tikkanen, M., Mekala, N. R., and Aro, E.-M. (2014). Photosystem II photoinhibition-repair cycle protects photosystem I from irreversible damage. Biochim. Biophys. Acta 1837, 210–215. doi: 10.1016/j.bbabio.2013.10.001
Tseng, C.-H., Chiang, P.-W., Lai, H.-C., Shiah, F.-K., Hsu, T.-C., Chen, Y.-L., et al. (2015). Prokaryotic assemblages and metagenomes in pelagic zones of the South China Sea. BMC Genomics 16:219. doi: 10.1186/s12864-015-1434-3
Tseng, C.-M., Wong, G. T. F., Lin, I.-I., Wu, C.-R., and Liu, K.-K. (2005). A unique seasonal pattern in phytoplankton biomass in low-latitude waters in the South China Sea. Geophys. Res. Lett. 32:L08608. doi: 10.1029/2004gl022111
Westberry, T., Behrenfeld, M. J., Siegel, D. A., and Boss, E. (2008). Carbon-based primary productivity modeling with vertically resolved photoacclimation. Glob. Biogeochem. Cycles 22:GB2024. doi: 10.1029/2007GB003078
Wu, H., Cockshutt, A. M., McCarthy, A., and Campbell, D. A. (2011). Distinctive photosystem II photoinactivation and protein dynamics in marine diatoms. Plant Physiol. 156, 2184–2195. doi: 10.1104/pp.111.178772
Wyman, M. (1999). Diel rhythms in ribulose-1,5-bisphosphate carboxylase/oxygenase and glutamine synthetase gene expression in a natural population of marine picoplanktonic cyanobacteria (Synechococcus spp.). Appl. Environ. Microbiol. 65, 3651–3659.
Xia, X., Guo, W., and Liu, H. (2015). Dynamics of the bacterial and archaeal communities in the Northern South China Sea revealed by 454 pyrosequencing of the 16S rRNA gene. Deep Sea Res. Part II Top. Stud. Oceanogr. 117, 97–107. doi: 10.1016/j.dsr2.2015.05.016
Xiao, W., Wang, L., Laws, E., Xie, Y., Chen, J., Liu, X., et al. (2018). Realized niches explain spatial gradients in seasonal abundance of phytoplankton groups in the South China Sea. Prog. Oceanogr. 162, 223–239. doi: 10.1016/j.pocean.2018.03.008
Xie, Y., Laws, E. A., Yang, L., and Huang, B. (2018). Diel patterns of variable fluorescence and carbon fixation of picocyanobacteria Prochlorococcus-dominated phytoplankton in the South China Sea basin. Front. Microbiol. 9:1589. doi: 10.3389/fmicb.2018.01589
Xu, G., Liu, J., Song, X., Tan, M., Ren, H., Li, D., et al. (2020). Diel rhythm in photosynthetic performance of phytoplankton assemblages is predicted to be light-dependent from in situ and mesocosm chlorophyll fluorescence. J. Coast. Res. 104, 445–454. doi: 10.2112/jcr-si104-080.1
Zhai, W. D., Dai, M. H., Chen, B. S., Guo, X. H., Li, Q., Shang, S. L., et al. (2013). Seasonal variations of sea–air CO2 fluxes in the largest tropical marginal sea (South China Sea) based on multiple-year underway measurements. Biogeosciences 10, 7775–7791. doi: 10.5194/bg-10-7775-2013
Keywords: photoinactivation, active Chl a fluorescence, phytoplankton, South China Sea, diurnal variation
Citation: Yi X, Zhang D, Sun J, Beardall J and Gao K (2021) Cyanobacteria-Dominated Phytoplankton in the Oligotrophic South China Sea Maintain Photosynthetic Potential Despite Diurnal Photoinactivation of PSII. Front. Mar. Sci. 8:736586. doi: 10.3389/fmars.2021.736586
Received: 05 July 2021; Accepted: 30 September 2021;
Published: 29 October 2021.
Edited by:
Punyasloke Bhadury, Indian Institute of Science Education and Research Kolkata, IndiaReviewed by:
Rajani Kanta Mishra, Ministry of Earth Sciences, IndiaSriyutha Murthy, Bhabha Atomic Research Center, India
Copyright © 2021 Yi, Zhang, Sun, Beardall and Gao. This is an open-access article distributed under the terms of the Creative Commons Attribution License (CC BY). The use, distribution or reproduction in other forums is permitted, provided the original author(s) and the copyright owner(s) are credited and that the original publication in this journal is cited, in accordance with accepted academic practice. No use, distribution or reproduction is permitted which does not comply with these terms.
*Correspondence: Kunshan Gao, a3NnYW9AeG11LmVkdS5jbg==