 Guillaume Cesbron
 Angélique Melet
 Rafael Almar
 Anne Lifermann3
 Damien Tullot
- 1Laboratoire d’Etudes en Géophysique et Océanographie Spatiales, Research Institute for Development – National Centre for Space Studies – National Center for Scientific Research – University of Toulouse, Toulouse, France
- 2Mercator Ocean International, Toulouse, France
- 3French Space Agency (CNES), Toulouse, France
Low-lying coastal zones are home to around 10% of the world’s population and to many megacities. Coastal zones are largely vulnerable to the dynamics of natural and human-induced changes. Accurate large-scale measurements of key parameters, such as bathymetry, are needed to understand and predict coastal changes. However, nearly 50% of the world’s coastal waters remain unsurveyed and for a large number of coastal areas of interest, bathymetric information is unavailable or is often decades old. This lack of information is due to the high costs in time, money and safety involved in collecting these data using conventional echo sounder on ships or LiDAR on aircrafts. Europe is no exception, as European seas are not adequately surveyed according to the International Hydrographic Organisation. Bathymetry influences ocean waves and currents, thereby shaping sediment transport which may alter coastal morphology over time. This paper discusses state-of-the-art coastal bathymetry retrieval methods and data, user requirements and key drivers for many maritime sectors in Europe, including advances in Satellite-Derived Bathymetry (SDB). By leveraging satellite constellations, cloud services and by combining complementary methods, SDB appears as an effective emerging tool with the best compromise in time, coverage and investment to map coastal bathymetry and its temporal evolution.
Introduction
Coastal zones are at the interface between land and ocean and represent a tremendous social, economic and biological value. With around 10% of the world’s population living in low elevation coastal zones and related human activities combined with the exacerbation of natural hazards by climate change (Lichter et al., 2011; Neumann et al., 2015; McMichael et al., 2020), coastal ecosystems are experiencing high pressures and increased vulnerability (Crossland et al., 2005; Melet et al., 2020). An area with the same population exposed to the same hazard is more at risk of suffering in developing regions, where the population has a poorer health system, or where the housing is more fragile.
One of the key parameter to study coastal environments is bathymetry, i.e., the determination of water depths to define submarine topography. Yet, global coastal bathymetry remains mostly unknown. Current measurement methods based on in-situ surveys via echo sounder on ships and LIDAR on airplanes do not provide a wide enough coverage. As a result, approximately 50% of the world’s shallow coastal waters remain unsurveyed (IHO C-55, 2021). In a large number of coastal areas of interest including Europe, bathymetric information is unavailable or is often decades old (IHO C-55, 2021), therefore not taking into account changes in coastal morphology due to storms, multi-timescale variability, or longer-term adaptation to changing environmental conditions (Karunarathna et al., 2016; Bergsma and Almar, 2020). Recent advances in Satellite-Derived Bathymetry (SDB) pave the way for a new method that could reveal the bathymetry of the world’s coastal areas with full coverage, and analyse the dynamics of seabed morphology.
Coastal bathymetry has a key role to play in a wide variety of coastal applications, for monitoring, coastal engineering and protection, marine food, energy, submarine cables, dredging, coastal engineering, navigation, sovereignty, science research and preservation. In Europe, the Copernicus Marine Environment Monitoring Service (CMEMS) provides regular and systematic reference information on the physical state, variability and dynamics of the ocean and marine ecosystems for the global ocean and the European regional seas. CMEMS provides a sustainable response to European user needs in different areas of benefits, such as maritime safety, marine resources, coastal and marine environment, weather, seasonal forecast and climate. CMEMS notably exploits data from the spatial component of the Copernicus Programme, the Sentinel missions. A major objective of the CMEMS is to deliver and maintain a competitive and state-of-the-art European service responding to public and private intermediate user needs, and thus involving explicitly and transparently users in the service delivery definition. User needs are driving the evolution of CMEMS. Because of its influence for a wide range of marine applications (section “Coastal Bathymetry for Coastal Marine Applications”), a better knowledge of bathymetry, especially in coastal areas which concentrate human activities, is unanimously required by users (e.g., European Commission SWD, 2019). An improved knowledge and monitoring of coastal bathymetry would also benefit the implementation of various marine directives (e.g., EU Marine Strategy Framework Directive; Flood Directive; etc.). In late 2018, Mercator Ocean International (MOI) and the European Environmental Agency (EEA), as entrusted entities by the European Commission to implement the Copernicus Marine and Land services, developed a roadmap for the evolution of Copernicus marine and land services to better serve coastal users (MOI and EEA, 2018). An improved monitoring of the coastal topography and bathymetry was included in this coastal roadmap, to complement existing services and data portals, such as EMODnet-Bathymetry, by further exploiting Copernicus Sentinel satellite data.
In this context, MOI is studying the possibility to develop and distribute in the Copernicus Marine Service in the near future (post 2022) a pan-European, dynamic satellite-derived coastal bathymetry product at intermediate horizontal resolution. To prepare this potential new line of activity, a broad market research is conducted to understand the current landscape of coastal bathymetry products and future requirements. To do so, three approaches have been used: a literature review, a market survey among CMEMS and other users, and individual meetings/interviews with users.
This paper is organised as follows. We first exemplify in section “Coastal Bathymetry for Coastal Marine Applications” the need for coastal bathymetry information for a range of marine applications. A review of methodologies used to derive coastal bathymetry, in particular from satellite data, is provided in section “Methods to Retrieve Coastal Bathymetry”. The benchmark of available bathymetric products is presented in section “Benchmark of Available Bathymetric Products”. A broad assessment of user needs in different sectors, that can be addressed through a core service as CMEMS or through downstream or private actors, is conducted in section “User Survey Analysis” based on a specific survey conducted for this study. Lastly, section “Perspectives and Recommendations” discusses perspectives and roadmaps for future products to respond to user needs.
Coastal Bathymetry for Coastal Marine Applications
Accurate and timely information on the state of marine resources and ecosystems remains a challenge. The United Nations Decade of Ocean Science for Sustainable Development (Ocean Decade) 2021–2030 is a global framework that seeks to generate and use knowledge for transformative actions needed to achieve a healthy and resilient, safe and productive ocean. The next 10 years will also be the implementation of S-100, the universal hydrographic data model launched by the International Hydrographic Office (IHO) to develop the future generation of digital products and services.
In this section, the importance of bathymetric information for a range of coastal marine applications is illustrated.
• Aquaculture: About 70% of the seafood consumed in the EU is imported. To meet the growing demand, the future increase in EU seafood supply will have to be driven mainly by aquaculture (EUMOFA, 2018). Detailed bathymetry helps in habitat mapping, impact modelling and identification of locations for offshore aquaculture cages.
• Marine energy: Bathymetric data is essential for the exploration, exploitation and extraction of oil, gas and new energy resources. In a recent briefing for the European Parliament (Scholaert, 2019), offshore wind energy was mentioned as the fastest growing sector (by 18%) among all emerging blue economy sectors. 84% of the world’s offshore wind capacity at the end of 2017 was located in EU waters. Ocean energy (from waves, tides or ocean thermal energy conversion) is another source of renewable energy with strong growth potential that is still in its pioneering stage. According to Ocean Energy Europe, it could generate 10% of EU demand for power by 2050. Electricity production from an offshore wind farm is largely dependent on the integrity of the cables connecting the turbines in series and linking them to the shore. For maintenance reasons, these cables must not be buried. A precise and dynamic bathymetry is essential to monitor sedimentary movements in the corridor between the coast and the energy exploitation site.
• Submarine cables: As of early 2021, almost all (99%) international data are transmitted by around 474 subsea fibre-optic cables all around the world (TeleGeography, 2021). Cables can cost hundreds of millions of dollars and must generally be laid on flat areas of the ocean floor, taking care to avoid coral reefs, shipwrecks, environmentally and politically sensitive areas and geological obstructions. Planning the cable route requires mapping the seabed between the landing points and between the shoreline and the full depth of the ocean (Austine and Pyne, 2017).
• Dredging: Raw materials extracted from the seabed are essential for the industry and civil engineering, but dredging activities put a lot of pressure on the environment and can worsen coastal erosion. Dredging activities are occurring in rather shallow areas, with shallowest limit per operating area is set at 3–5 m depending on the site. For instance, in France, about 25 sites of 5–14 km2 are located between 15 and 30 m deep. Very high resolution and dynamic bathymetry helps to estimate and control the volumes of extracted materials. Port authorities also use dredging for port maintenance to make access to the port possible through channels. A feasible method to monitor the spatio-temporal evolution of nearshore bathymetry due to dredging in the Principality of Asturias (Spain) from satellite data has recently been proposed by Mateo-Pérez et al. (2021).
• Coastal engineering: Combined with the sea level rise, the development of coastal tourism and the trend for population migration toward the coast (e.g., Neumann et al., 2015), coastal erosion has become an issue of growing concern. All coasts in Europe are subject to coastal erosion caused by both natural and anthropogenic factors (e.g., Luijendijk et al., 2018; Mentaschi et al., 2018; Toimil et al., 2020). Some of the natural factors are waves, winds, tides, near-shore currents, storms or sea level rise. Better access to coastal data enables better management of the coastal environment (including ecosystems, land use plans etc.) and thus facilitates predictive modelling and enables the development of innovative coastal defence systems for risk mitigation (such as areas below sea level) and post-crisis analysis (after storms, earthquakes or tsunamis).
• Navigation: Over 90% of international trade relies on sea transportation. Ships are getting bigger and bigger and want to pass in shallower places. Accurate bathymetric data is thus a fundamental requirement for ships and port authorities. However, both in European waters and in other areas of interest for European shipping, the quality of survey data is insufficient to ensure navigation safety.
• Sovereignty: Within a country’s EEZ, hydrographic offices are legally responsible for the safety of navigation under the International Convention for the safety of life at sea (SOLAS) 1974. The port services regularly perform bathymetric surveys to help safe berthing and passage of an increasing number and size of vessels. Navies use nautical chart products for surface, submarine, anti-submarine, mine-hunting and air-sea naval operations and law enforcement. Under the United Nations Convention on the Law of the Sea (UNCLOS), the continental shelf is that part of the seabed over which a coastal state exercises sovereign rights with regard to exploration and exploitation. Understanding the morphology of the seabed can help to delineate boundaries and justify the claims of a coastal State to its maritime territory. For instance, SDB was used in the Gulf of Guinea to extract UNCLOS baselines out of the surf bordering two adjacent African states.
• Science research: The morphology of the seafloor is also an input for models of ocean currents and waves. For instance, using a more accurate bathymetry and characterisation of the location of mud banks offshore the coast of French Guyana led to a more accurate sea-state monitoring, with a reduction of 1.5 m in wave height errors (CNRM, 2019).
• Preservation: better knowledge of the seabed also makes it possible to better protect the oceans, especially in conservation sites and protected areas. Underwater noise modelling caused by human activity is heavily reliant on bathymetry and sediment data to achieve good accuracy and predict human activities impacts. The best resolution and precision is even more essential for the study and research of underwater archaeological sites (Guzinski et al., 2016).
Methods to Retrieve Coastal Bathymetry
Echo Sounders
Also known as depth sounders or fathometers, single beam echo sounders (SBES) determine water depth by measuring the travel time of a short sonar pulse from a ship to the seafloor and back to the ship. Because of its ease of use in terms of data interpretation and operating costs, SBES is particularly useful in very shallow waters, less than 5–10 m deep. Multibeam echo sounders (MBES) allow the detection of depths by scanning a wider seafloor area. MBES emit a sonar pulse that is reflected from the bottom and received by an array of receivers at different angles. The swath angle varies between systems but generally ranges between 120° and 170°, giving swath widths on the seafloor of the order of 3.5–25 times the water depth (Lekkerkerk, 2020). Vessels equipped with the latest multibeam sonars provide hydrographic surveying results that can map the bathymetry at a horizontal resolution of about 0.5 m. However, the use of echo sounders involves mobilising a ship and its crew, sometimes for several days, or in areas that may be hazardous to the crew, which can be very costly.
Modern multibeam echo sounders have a size and power consumption that make them suitable for autonomous operations on aquatic drones. The use of autonomous surface vehicles (ASV) and autonomous underwater vehicles (AUV) equipped with such echo sounders can release ships from dedicated mapping activities. AUVs and ASVs are programmable robotic vehicles that, depending on their design, can drift, drive, or glide through the ocean without being controlled in real time by human operators. AUVs and ASVs can carry sonar or even optical equipment such as LIDAR. Such systems can also make decisions autonomously, modifying their mission profile according to environmental data they receive from sensors along the way. Autonomous vehicles allow costs as well as risks to be considerably reduced and can access traditionally inaccessible regions, such as under ice or navigationally complex areas, including shallow waters, steep slopes or volcanic areas.
Airborne Sensors
Airborne LIDAR Bathymetry (ALB) is an effective and cost-efficient technology to capture both the land topography and ocean bathymetry simultaneously, in order to provide a continuous, detailed 3D elevation model in coastal zones. As opposed to airborne topographic LIDAR, which uses an infrared wavelength of 1,064 nm, bathymetric LIDAR systems use a green wavelength of 532 nm to penetrate the water column for measuring the seafloor down to 75 m depth (Quadros, 2016). Some of these sensors, such as the Leica HawkEye 4X, can now measure more than 140,000 points per second, resulting in surveys with over 5 points per m2 (∼0.45 m of resolution) with a vertical accuracy of 0.15 m in shallow water. LIDAR are more vulnerable to environmental conditions over the ocean than over land (e.g., due to the sea state, water turbidity, tides, ground control accessibility), especially for the detection of small bathymetric features.
In the same way as a satellite, multispectral sensors can be carried out on airplanes or drones to reach a better resolution but with a smaller spatial coverage. While hyperspectral payloads are still not mature enough for the space market, it is, however, increasingly used on drones to offer multiple new specific bands.
Satellite-Derived Bathymetry
Satellite altimetry has made it possible to estimate the bathymetry of the world’s oceans in deep waters, but with an average achievable resolution of 8 km. Satellite altimetry measures the height of the sea surface, which is affected by the gravitational effects of topographical features on the seafloor. The horizontal resolution of altimetry-derived bathymetry is much lower than that of direct echo sounder measurements, but it has enabled seabed mapping on a global scale. Using Geosat and ERS-1 satellite altimetry derived bathymetry to interpolate direct depth soundings, Smith and Sandwell (1997) provided maps of the world’s ocean bathymetry with a horizontal resolution of 1–12 km. These maps have been refined over time using new altimetry missions (e.g., Jason-1 and 2, SARAL/AltiKa geodetic missions, CryoSat-2) and are expected to be further improved by the future SWOT mission (Tozer et al., 2019).
In the coastal zone, satellite-derived bathymetry (SDB) can reach much finer resolutions thanks to two approaches (Pleskachevsky et al., 2011). The first one exploits the attenuation of light with depth in the water column as a function of the wavelength. Bathymetry can be estimated by combining optical satellite data and radiative transfer models or empirical models. The second SDB method is based on the influence of topography on waves in shallow water. Each method and sensor comes with its own strengths, limitations, and scope of applications (Gao, 2009; Jawak et al., 2015). Specifically, methods based on radiative transfer perform best in clear, calm waters, while wave-based inversion techniques require waves and perform well in turbid waters.
Intertidal topography and its variation also benefit from the use of satellite remote sensing (Sagar et al., 2017; Khan et al., 2019; Fitton et al., 2021). The majority of applications involve delineation of the waterline with optical satellites (Mason et al., 1995), followed by new methods with other sensors (Salameh et al., 2019) such as interferometric synthetic aperture radar (InSAR) (Choi and Kim, 2018) and satellite radar altimetry (Salameh et al., 2018).
Satellites may also be used as a tool to validate SDB data. In particular, the Ice, Cloud and Elevation Satellite-2 (ICESat-2) is a space-based laser altimeter launched in September 2018 by NASA, designed for polar ice elevation and tree canopy measurements. The instrument splits its 532-nm wavelength laser into nine beams and samples approximately every 70 cm on the ground, a vertical resolution of 4 mm but with a swath of only 0.013 km (Ramaseri Chandra et al., 2020). This can be applied to measure bathymetry for a depth range of 0–45 m along beam tracks in coastal waters. ICESat-2 data have shown to have as high as 95% accuracy when compared to in situ airborne LIDAR surveys (Parrish et al., 2019). These data provide a worldwide dataset that is currently being used to validate SDB depth retrievals (Thomas et al., 2021).
Multispectral Inversion
The pioneering technique used multispectral aerial photography (Lyzenga, 1978) and was carried forward with multispectral optical satellite imagery, first with Landsat and then a wider application to other satellites such as Sentinel-2 (Caballero and Stumpf, 2019; Evagorou et al., 2019; Sagawa et al., 2019).
SDB is calculated based on the attenuation of radiance as a function of depth and wavelength in the water column, using empirical or semi-analytical imaging methods (Laporte et al., 2020). Empirical methods are based on statistical relationships between image pixel values and ground truth depth measurements (Salameh et al., 2019). Analytical models do not require field data, and are based on radiative transfer models and optical properties of the sea water, such as the attenuation coefficient and backscattering, spectral signatures of suspended and dissolved matter, and bottom reflectance (Capo et al., 2014).
Bathymetries can be estimated down to depths ranging from a few meters (e.g., northern Baltic Sea) to 20–30 m (e.g., Mediterranean Sea, Figure 1) depending on the maximum depth of sunlight penetration, which varies with bottom reflectance, turbidity, location or season. The spatial resolution of such bathymetries depends on the optical sensor, from coarse resolution with for instance Landsat 8 (∼30 m resolution), to medium with SPOT, Sentinel-2 (10 m), Planetscope (3 m) (Poursanidis et al., 2019) and to very high resolution (50–60 cm resolution) with commercial satellites such as WorldView-3 (Collin et al., 2017; Poppenga et al., 2018), Pléiades or Gaofen-6 (Sun et al., 2021). The accuracy of this method is lower than with LIDARs or echo sounders, but is a cost-effective solution to map the nearshore bathymetry over large areas.
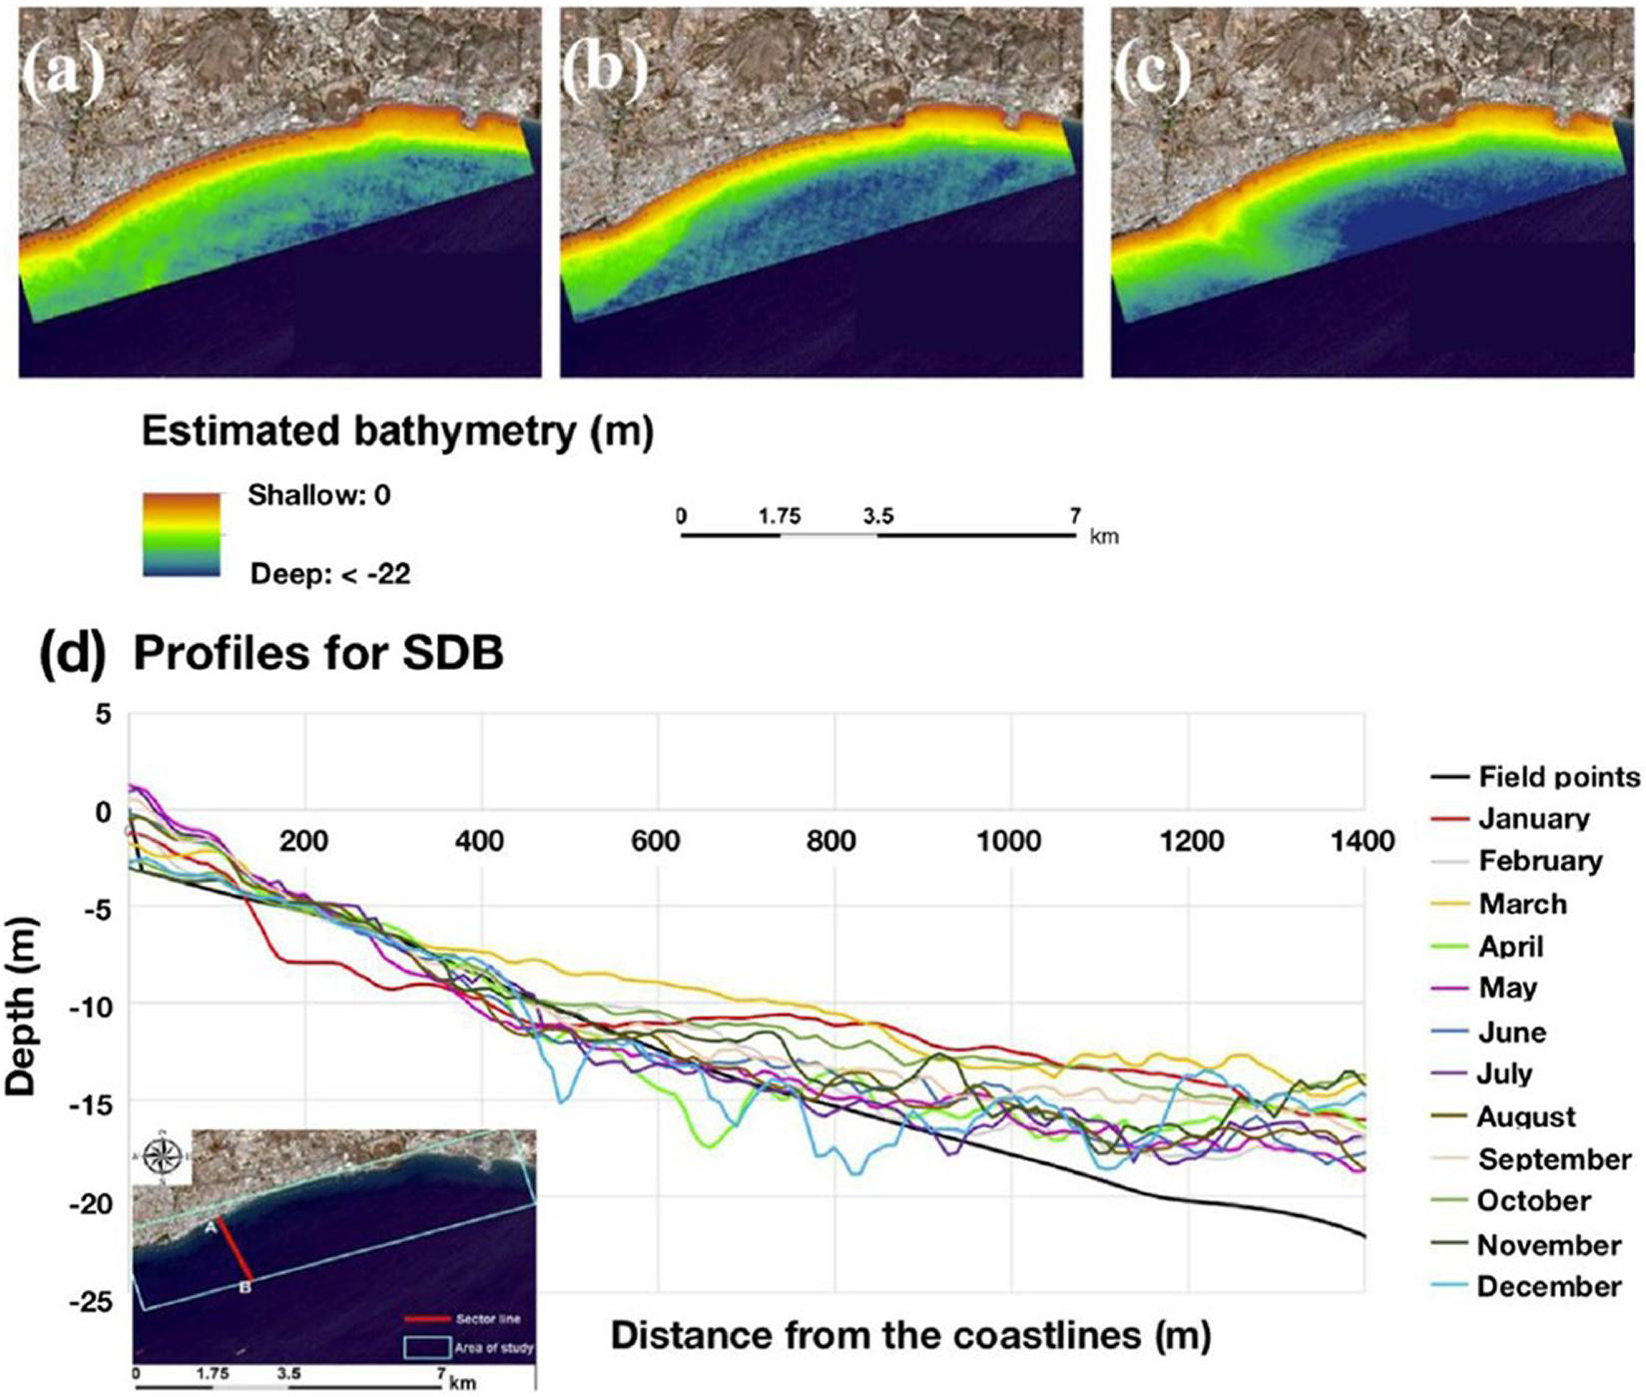
Figure 1. Satellite-derived bathymetry (SDB) from Sentinel-2 multispectral optical data in (a) January 2018, (b) February 2018 and (c) March 2018 for depth shallower than 22 m over a coastal area of southern Cyprus. The monthly evolution of a bathymetric profile (shown in the lower inset) is shown in panel (d) from April 2017 to March 2018 with Sentinel-2 data. Field points correspond to LIDAR data acquired in 2014. Adapted from Evagorou et al. (2019).
Wave-Based Inversion
Other techniques for estimating bathymetry from optical images use wave kinematics (Abileah, 2006; Danilo and Binet, 2013; Poupardin et al., 2016), using the linear wave dispersion relation:
where c is the wave celerity, k is the wave number, g is the gravity acceleration and h is the water depth, hence, the bathymetry. This allows depths of up to 40–60 m to be retrieved, depending on the wave period (Bergsma and Almar, 2020).
These bathymetric inversion codes therefore require temporal information to retrieve the wave kinematics, by acquiring imagery in stereo, burst or video modes, or by making use of the temporal offset between multispectral bands. This method was applied to different optical satellites: IKONOS (Abileah, 2006), WorldView-2 (Myrick, 2011), SPOT-5 (Poupardin et al., 2016), Sentinel-2 (Bergsma et al., 2019; Daly et al., 2020; Figure 2) and Pléiades (Danilo and Binet, 2013; Almar et al., 2019) for unprecedented accuracy when applied at regional scale. Nearshore bathymetry can also be derived with this method from SAR sensors (Bian et al., 2020), such as Sentinel-1 (Sancho et al., 2018; Wiehle and Pleskachevsky, 2018), RISAT-1 (Mishra et al., 2014) or TerraSAR-X/Tandem-X (Wiehle et al., 2019) satellites, even in areas covered by clouds.
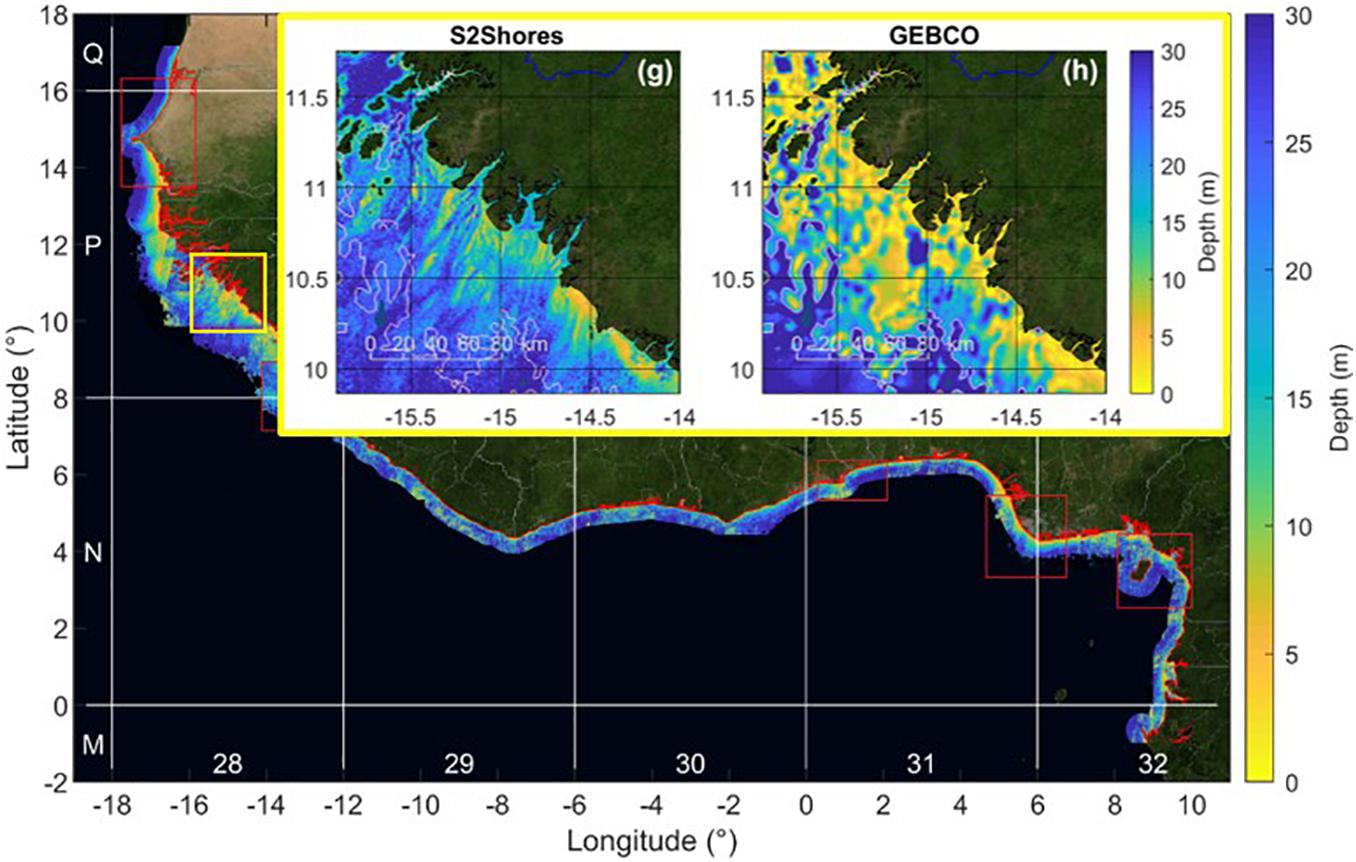
Figure 2. West African coastal bathymetry derived from Sentinel-2 optical data. The shoreline is indicated by the red line. The inset shows the SDB estimate (left) and the GEBCO bathymetry (right) for the region encompassed in the yellow square in the main panel. Adapted from Daly et al. (2020).
A major advantage of this approach is that it is self-contained and does not require additional wave information from observation or models beyond that acquired from satellite remote sensing. However, optical-based SDB seems to better resolve small-scale features in very shallow waters, so that a combination of methods can be beneficial for a more accurate coastal bathymetry.
Satellites for Satellite-Derived Bathymetry
With the democratisation of access to space, there is a wide variety of optical, video and SAR satellites in orbit. Some of their characteristics, including their resolution, are presented in Supplementary Appendix 3. For SDB, there is a trade-off in choosing the right performances, depending on the SDB method as well as the cost of the imagery.
The resolution, or ground sampling distance (GSD), is a key parameter of the satellite for SDB as the order of magnitude of the uncertainties and feature detection in the final SDB product directly depends on it. The influence of optical satellite resolutions on the ability to resolve waves, especially short waves or waves in shallow waters where the wavelength is shortened, has been analysed in Almar et al. (2019). By comparing different optical satellites, they show that the performance of the wave-kinematics method deteriorates drastically when the resolution of the optical images coarsens from 1 to 5 m, but declines only slightly when the resolution coarsens from 5 to 20 m. This analysis highlights the need for high resolution optical satellite missions to obtain more accurate coastal wave characteristics and SDB.
Whether it is for multispectral inversion or for wave-kinematics inversion, the satellite requires multispectral capability in visible and near-infrared bands. In particular, aerosols and other atmospheric effects can scatter light in the coastal zone. By comparing the Coastal/Aerosol (CA) band with the blue band, analysts can correct such effects to get a better view of what is happening at the water surface instead of in the air. The multiplicity of spectral bands thus allows a better validation of the data. However, satellite hyperspectral sensors, with their well-known ability to classify bottom structures, have very narrow bands and receive less photons, delivering less depth information due to their lower signal-to-noise ratio (Laporte et al., 2020).
For the wave-kinematics inversion, the acquisition mode is essential. The multispectral instrument (MSI) aboard Sentinel-2 is a pushbroom sensor with 12 detectors allowing interband analyses, with a maximum temporal offset of 1.005 s, between the blue B02 and red B04 bands. Very high resolution satellites such as Pléiades can acquire in persistent mode, which allows acquiring a sequence of images (12 images) at a regional scale (∼100km2), but with a long time interval between images (8 s, close to the wave period), and a time interval between bands (0.167 s) significantly smaller than for Sentinel-2. In recent years, some commercial satellites have been launched carrying video cameras to deliver full motion video with frame rates as high as 50 fps with a maximum duration of 120 s, such as Planet’s Skysat, Jilin-1 constellation, or Satellogic constellation (Supplementary Appendix 3). While these video satellites can reach very high resolutions (below 1 m), the swath width is considerably narrowed to only a few kilometres.
Finally, the most restrictive parameter remains the cost of acquisition of the image. According to the Apollo Mapping 2020 price list, it ranges from free with 10-m Sentinel-2, to standard tasking prices of $1.80/km2 for 3-m Planetscope, $32.50/km2 for 0.3-m WorldView-3, $62.50/km2 for 0.5-m tri-stereo Pléiades, or $6,284.92 for 30 s of Jilin-1 0.92-m video covering a scene of 11 km × 4.5 km (Supplementary Appendix 3).
Benchmark of Available Bathymetric Products
Bathymetric Data Providers
As hydrographic offices are legally responsible for the safety of navigation within a country’s EEZ, crowdsourced bathymetry in national waters is not yet democratised. Bathymetric data are generally archived by hydrographic offices but are regulated by national legislation in each country for reasons of data security and confidentiality (Wölfl et al., 2019). As a consequence, many countries hold large amounts of bathymetric data with restricted access. Data that are freely available are often not directly downloadable, and with a coarse resolution.
As an example, SHOM (Service hydrographique et océanographique de la Marine) is the French public operator for maritime and coastal geographical information. SHOM mainly uses echo sounders on hydrographic vessels or airborne LIDARs to acquire new bathymetric data. SHOM openly shares on its data platform the composite digital terrain models (DTM) of its coasts with a spatial resolution of 0.001° (∼111 m), as well as some very high resolution local DTMs with a resolution of 0.0002° (∼20 m).
The IHO Digital Bathymetry (DCDB), hosted by the U.S. National Oceanic and Atmospheric Administration (NOAA) on behalf of the IHO Member States, freely distributes unedited single and multibeam bathymetric data provided by hydrographic offices, industry and crowdsourcing. Several free and open initiatives then procure composite maps based on those multi-sensor data, such as NOAA-ETOPO1, GEBCO or EMODnet (Table 1).
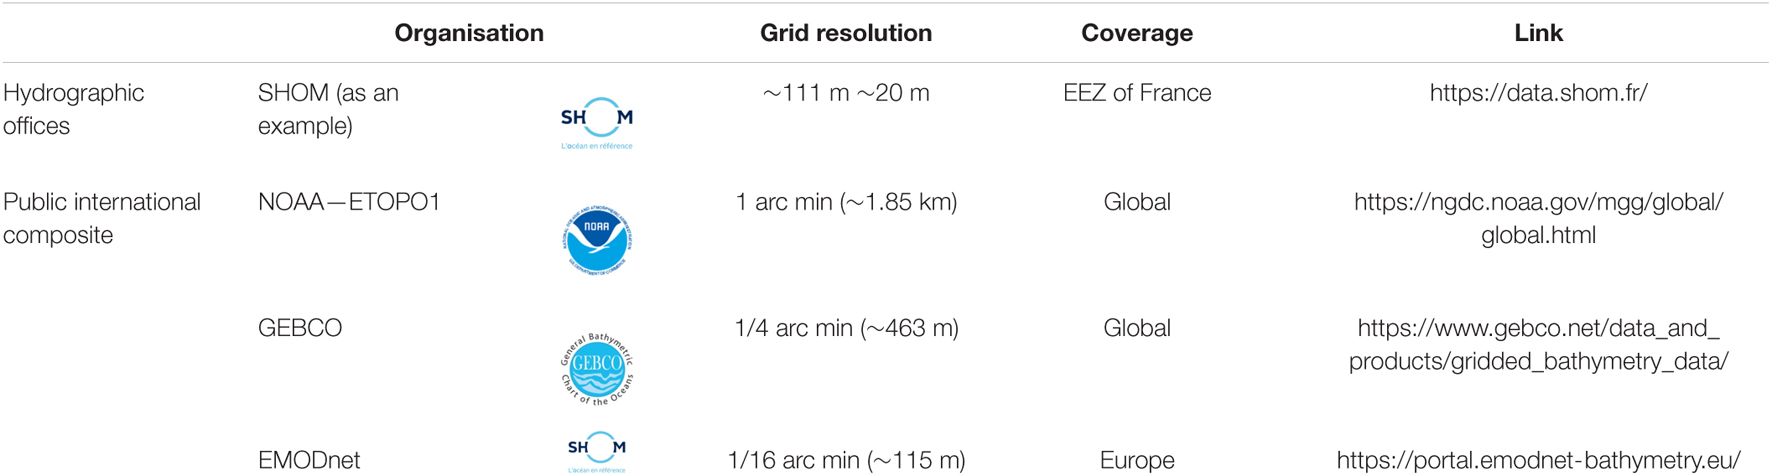
Table 1. Examples of public available bathymetric digital grids.
Although these initiatives ensure that global bathymetric data are freely available in the open ocean, these data are less accurate in shallow waters where vertical and spatial resolution is insufficient. Furthermore, these gridded composite data are often only interpolated with coarser resolution data, or may even include Nineteenth century lead line measurements. Local variations in depth such as sandbanks and coral reefs on the one hand and temporal morphodynamic changes in seabed structures on the other hand can be significant in nearshore areas.
The General Bathymetric Chart of the Oceans (GEBCO) aims to provide the most authoritative and publicly accessible bathymetry of the world’s oceans. It operates under the joint auspices of the IHO and the Intergovernmental Oceanographic Commission (IOC) of UNESCO. The latest version of GEBCO, GEBCO_2020, is based on Version 2 of the SRTM15+ data set (Tozer et al., 2019) and is then merged with regionally compiled gridded bathymetric data sets using many different sources of data with varying quality and coverage (Figure 3), including EMODnet for Europe. As GEBCO is an information product created by interpolating measured data, the resolution of the grid can be significantly different from that of the data used. The GEBCO_2020 grid is the latest published global bathymetric product and provides global coverage on a 15 arc second (∼463 m) grid. The grid was developed as part of the Seabed 2030 project, which is a collaborative project between GEBCO and the Nippon Foundation to facilitate comprehensive mapping of the global seafloor by 2030 (Mayer et al., 2018). The project is aligned with UN Sustainable Development Goal #14 to conserve and sustainably use the oceans, seas and marine resources.
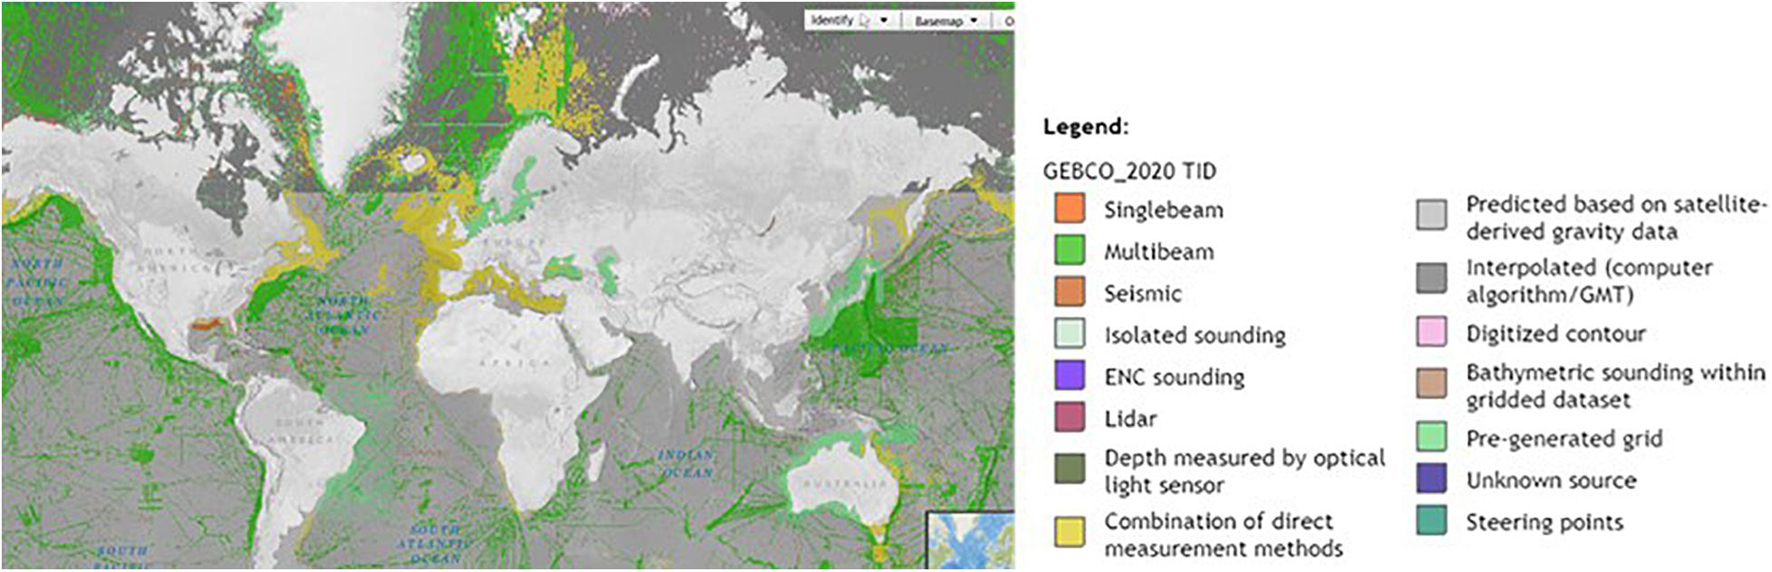
Figure 3. GEBCO Type Identifier (TID) Grid showing the different type of source data used in the GEBCO_2020 gridded bathymetry.
The European Marine Observation and Data Network (EMODnet) combines data products from over 100 marine research bodies on the bathymetry, geology, habitats, physics, chemistry and marine life of the seas around Europe. The EMODnet Bathymetry portal provides a harmonised digital bathymetry on its web platform for Europe’s sea basins with a grid resolution of 1/16 arc minutes (∼115 m). Over 50 different data providers consisting of national hydrographic services, marine research institutes, and private companies, from 26 countries contribute to the development of this composite (Figure 4). Individual datasets at their actual resolution are, however, only accessible on request from the providers. Since 2019, EMODnet Bathymetry and the Seabed 2030 Project have shared a Memorandum of Understanding with the common aim of improving the bathymetric knowledge, while promoting the distribution of this knowledge to all potential users.
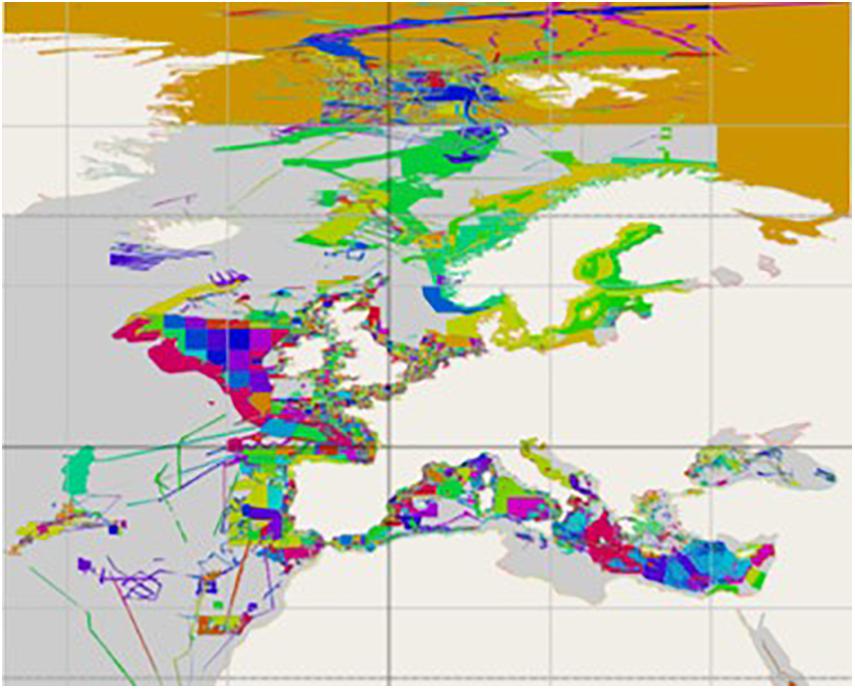
Figure 4. EMODnet different datasets from different providers (26,447 datasets and 181 Composite DTMs).
Commercial hydrographic companies also hold large amounts of bathymetric data. For the most part, these data are owned by the customers of the survey companies that collect them. Considering the cost of acquisition and their potential market sensitivity, these survey data are only shared in the public domain and mapping projects with the permission of the hydrographic company and the customers (Wölfl et al., 2019). For instance, Fugro, a world leading offshore survey company serving the oil and gas, infrastructure, renewables, power, nautical and mining market sectors, have conducted bathymetric surveys and has contributed over 1.1 million square kilometres of in-transit bathymetry data to Seabed 2030 to date. New players, such as the marine robotics companies Ocean Infinity with its “Armada fleet” or iXblue with its “DriX,” are now capable of deploying autonomous USVs for seabed mapping.
Thanks to the considerable advances in SDB methods in recent years various research projects have been carried out, such as the Allen Coral Atlas which provides satellite-derived bathymetry in global coral reef regions (Li et al., 2021). A number of private companies have also emerged to exploit this potential (Supplementary Appendix 1). In the United States, TCarta Marine is developing a system (Figure 5) which brings to bear modern computational resources, multiple satellite platforms, and machine learning to combine multispectral inversion with wave-based inversion “ultimately producing a persistently updated global shallow water bathymetry dataset,” as presented. To further enhance the accuracy of the SDB measurements, TCarta has developed an AI-based technique for leveraging ICESat-2 data to train the SDB algorithm and validate results. TCarta expects to present a worldwide Global-SDB dataset completed by late 2021 to its customers, with depths reaching more than 30 meters, depending on water clarity, at a 10-meter resolution and an accuracy within 10% of depth or less (Ocean News, 2021).
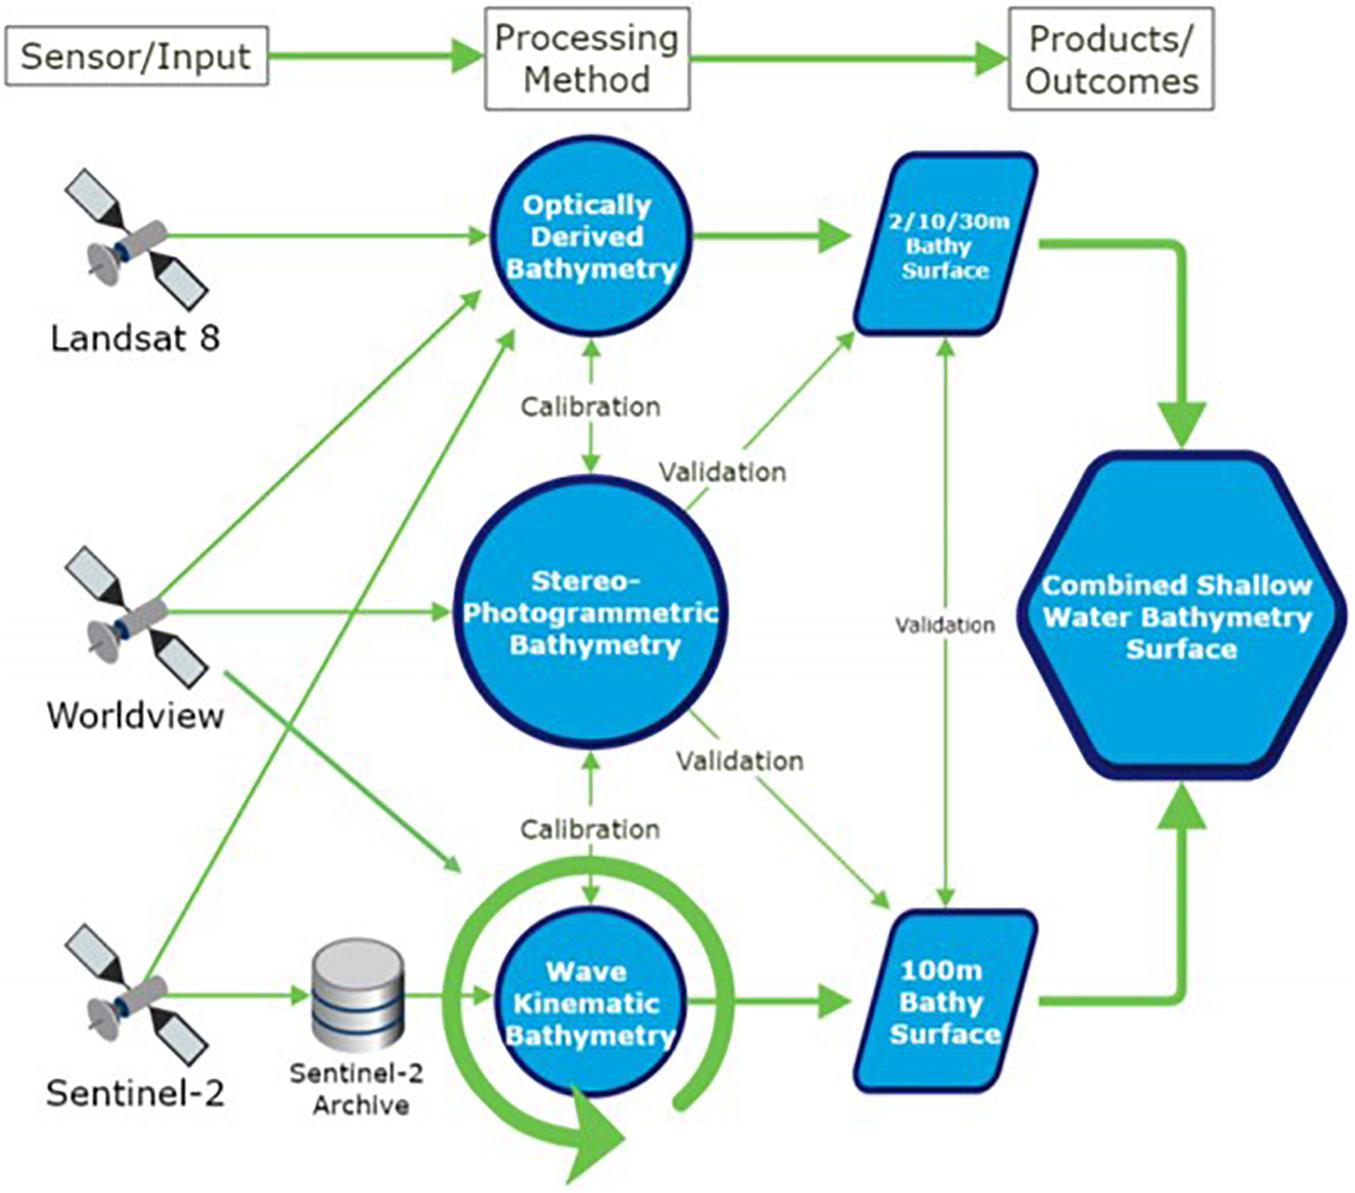
Figure 5. TCarta’s Project Trident Processing Scheme. From Goodrich (2018).
In Europe, companies specialising in SDB are notably supported by projects funded by ESA and by the European Commission within the framework of the H2020 programmes (Supplementary Appendix 2). For the latest one, the German company EOMAP recently joined forces with Fugro and the Hellenic Centre for Marine Research in the H2020-EU project named “4S” (Satellite Seafloor Survey Suite), which started in 2020. The 3-year project will develop an online cloud-based solution that will use highly automated Earth observation algorithms and workflows to remotely map and monitor seafloor habitats, morphology and shallow water bathymetry. 4S will leverage artificial intelligence, physics models, and satellite and airborne data to de-risk marine site characterisation activities in the shallow water zone by quickly analysing seafloor properties using less personnel and equipment.
Hydrographic Data Standards
So far, SDB data are not considered as hydrographic data because of their lower accuracy and the difficulty of estimating uncertainties compared to data from conventional sensors (such as echo sounders or LIDAR). Only the latter are plotted on official maps. For these reasons, SDB data can be displayed on charts as contours but the area will be considered as unsurveyed. To date, for SHOM and UKHO, SDB is only used for a few atolls in the Pacific. In September 2020, the IHO published the new version of the “Standards for Hydrographic Surveys” (S-44), presenting the international standards for hydrographic surveys. These standards provide minimum specifications for safety of navigation (Table 2), with different orders (Order 2, 1b…) defining different strict levels of survey. Recognising that there are both depth-dependent and depth-independent error sources that affect the measurements of depths, the formula below is used to compute the maximum allowable vertical measurement uncertainty. The parameters “a” and “b,” together with the depth “d,” have to be introduced into the formula below in order to calculate the maximum allowable total vertical uncertainty (TVU):
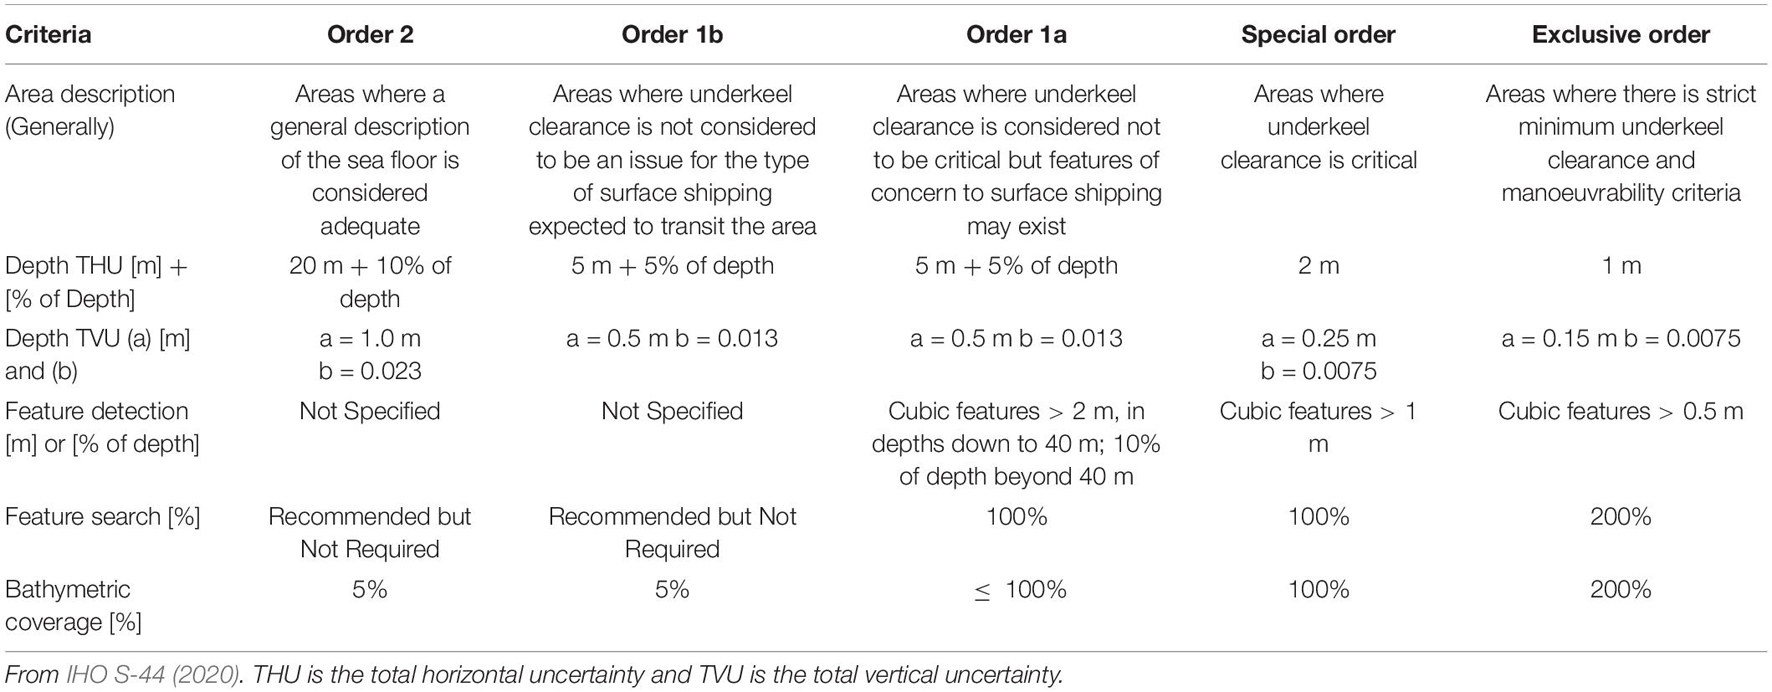
Table 2. IHO S-44 minimum bathymetry standards for safety of navigation hydrographic surveys.
Table 2 specifies the parameters “a” and “b” to compute the maximum allowable TVU of reduced depths for each survey order. The total vertical uncertainties of depth measurements calculated with a 95% confidence level must not exceed this value.
In previous editions, there was no room for surveys dedicated to the knowledge and protection of the marine environment. The new matrix of specifications (Table 3) includes the former criteria (Table 2), but with selectable values so that users can specify their needs and thus identify the appropriate acquisition method. The matrix can be used both as a tool when specifying a survey, but also as a tool for classifying data after a survey has been completed. This common framework has been introduced to provide more flexibility and to expand capabilities for other applications than navigation safety, opening the way to new acquisition technologies such as SDB, only if uncertainties are well defined.
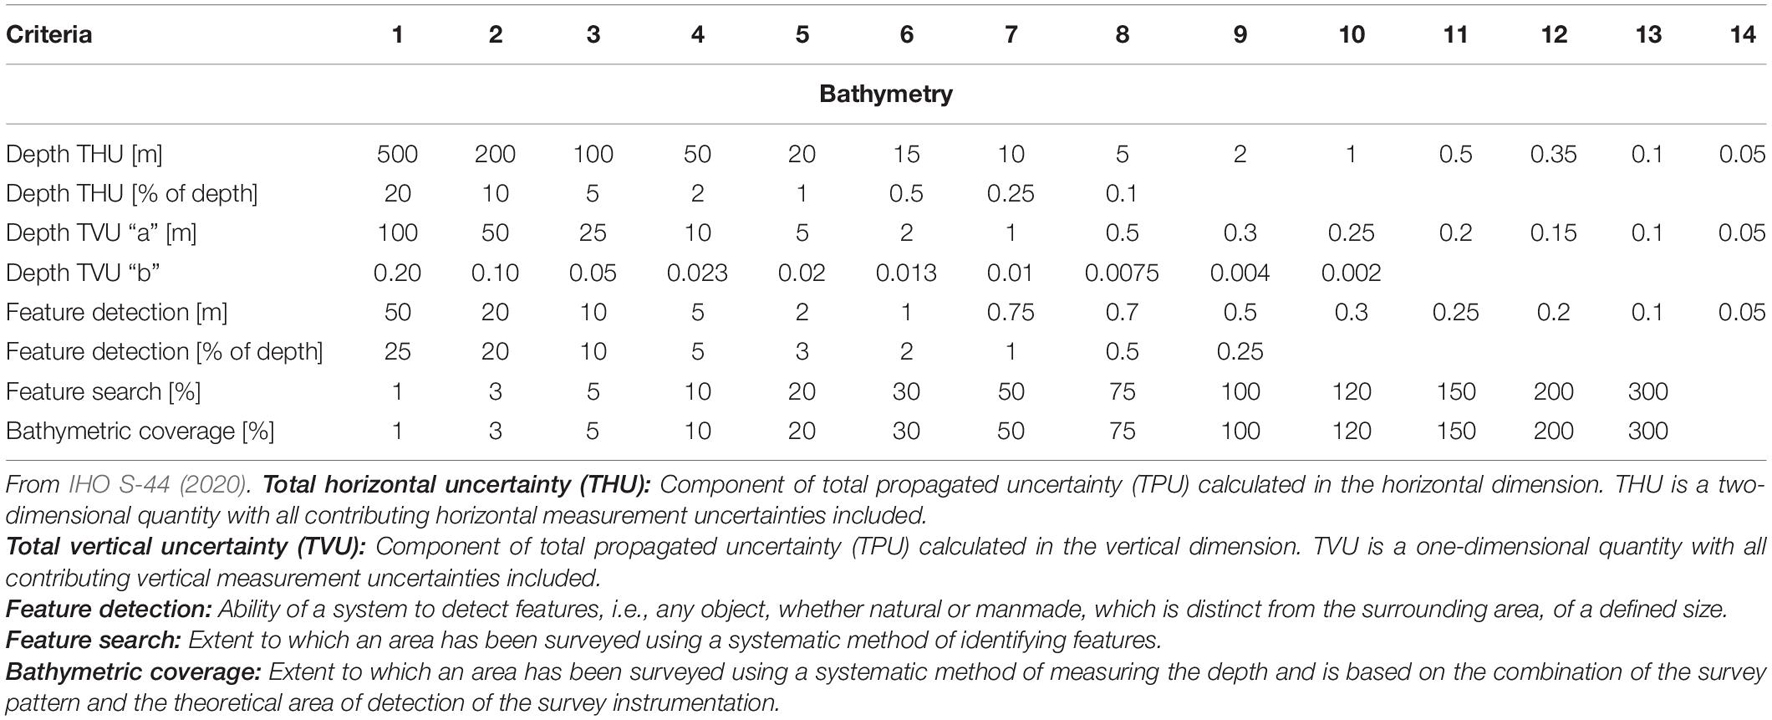
Table 3. IHO S-44 new matrix of specifications for hydrographic surveys.
User Survey Analysis
Method
The accuracy of SDB is expected to increase in the coming years to fill the world’s coastal databases, achieving full bottom coverage in coastal areas with periodic updates. In this context, Mercator Ocean, as the entrusted entity by the European Commission for implementing the Copernicus Marine Service, is studying the possibility to develop and distribute in the near future (post 2022) a pan-European, dynamic satellite-derived coastal bathymetry product at intermediate horizontal resolution. This new dynamic product would be developed in cooperation and complementarity with the EMODnet initiative of DG MARE, using data from the Copernicus Sentinel missions. To identify users’ interest in coastal bathymetric data, their usage and their requirements, a survey form has been sent out to CMEMS regular users and partners. Within the survey, many criteria were considered such as the required spatial and temporal resolution, including very high resolution. This does not imply that the Copernicus Marine Service will produce and distribute such high resolution bathymetry products. It rather supports the goal of creating an overview of user needs for all types of coastal bathymetry products.
The user survey was conducted from 18 February 2021 to 31 March 2021. A total of 170 users using coastal bathymetric data, mainly Europeans (83%), answered the survey, with a balanced representation of the academic community (32%), public organisations (34%) and private companies (23%) (Figure 6). The six most represented countries are Italy (14%), France (12%), the Netherlands (8%) and the United Kingdom (7%) ex-aequo with Spain (7%) and Portugal (7%).
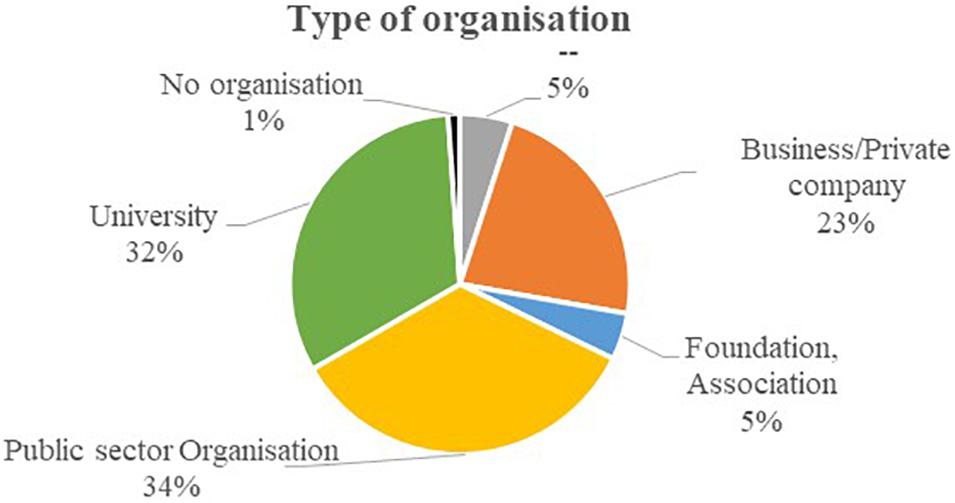
Figure 6. Type of organisation of respondents.
The survey answers reveal a wide range of market segments (Figure 7) and applications for bathymetric data, as presented in section “Coastal Bathymetry for Coastal Marine Applications”. Regarding market segments, the 3 top ones from the pool of users answering the survey are science and innovation (with more than 50% of users selecting this category), coastal services, climate and adaptation. Examples of applications include ocean circulation modelling, forecasts, hydrologic transport mechanisms, habitat and ecosystem mapping, as well as nutrient and sediment transport.
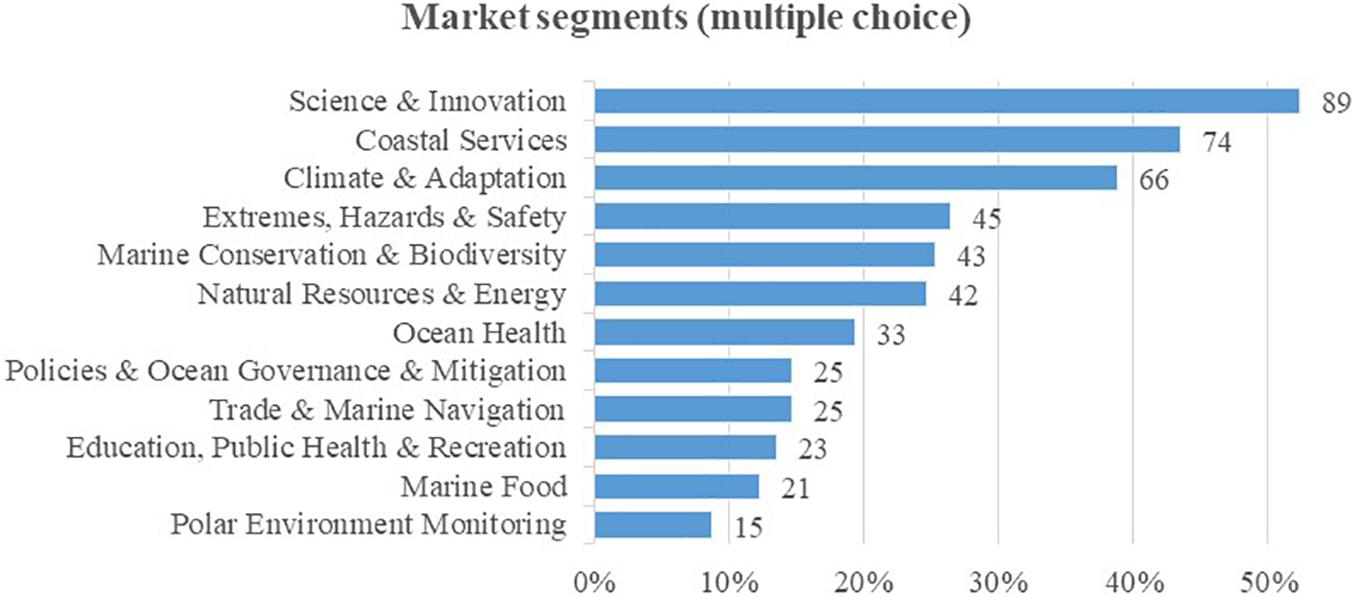
Figure 7. Main market segments of respondents to the survey. The number of users who have selected a given market category is indicated on the right of the bars. The x-axis indicates the percentage of the corresponding users out of 170 respondents.
It must be noted that the survey recognised the potential for participants to be conducting different studies with multiple requirements, and gave participants the required flexibility by allowing multiple answers.
Current Data Use
When asked about the spatial scale at which they worked, only 8% of surveyed people indicated that they work at the global scale, and 6% at international scale. In contrast, over 44% of participants indicated that they work at regional (subnational) scales, 16% at national level, and 26% identifying that they conduct work at local level. In terms of regions, a vast majority (85%) of those surveyed were conducting studies on European areas, principally in the Mediterranean Sea (51%), North West Shelf Seas (39%) and Iberia-Biscay-Ireland Seas (34%).
For their current data use, respondents make as much use of free access data from GEBCO (53%), EMODnet (48%) as they do of hydrographic offices data (52%) (Figure 8). Only 17% of them require commercial solutions, from sensors such as echo sounders (76% of the commercial solutions) or SDB (59% of the commercial solutions).
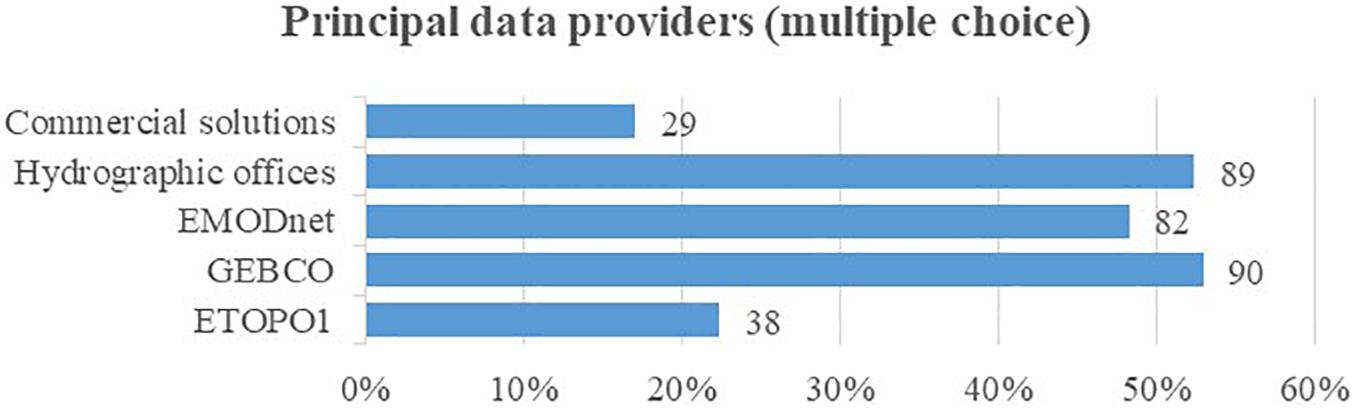
Figure 8. Principal data providers.
Figure 9 shows that over 82% of the participants stated that the data they currently use do not meet their requirements principally due to a too low resolution (76%) and not-up-to-date (46%) data.
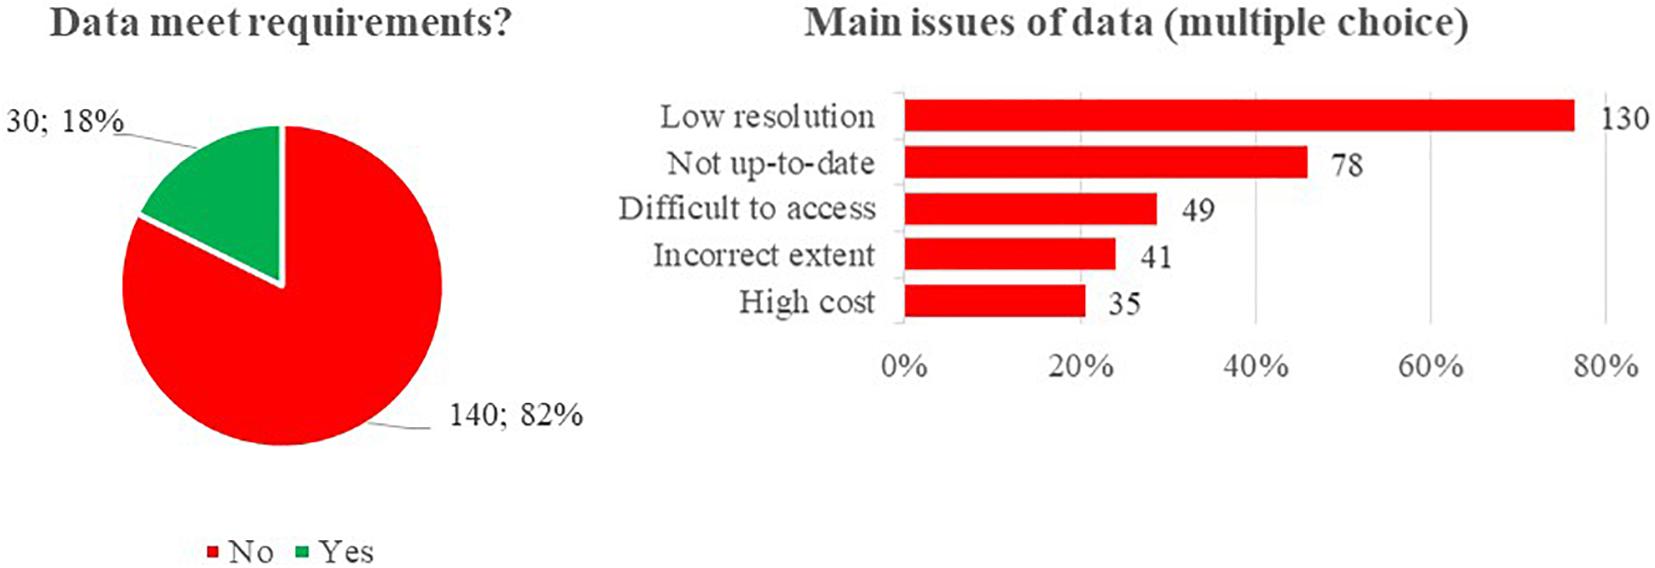
Figure 9. Satisfaction of current data use.
Requirements and Demand
User requirements in terms of resolution by market segments are shown in Figure 10. 44% of users would require a horizontal resolution ranging from 10 to 50 m, generally distributed across the applications, while 41% of users would use bathymetric data with a higher resolution (ranging from 2 to 10 m), mainly for applications such as risk management. Coarser resolutions of 50–100 m are also of great interest to respondents (38%), as are even lower resolutions, especially for scientific research and preservation themes. The answers show an interest in data with the best possible resolutions, but the majority of users (55%) would still use data with a resolution beyond 100 m.
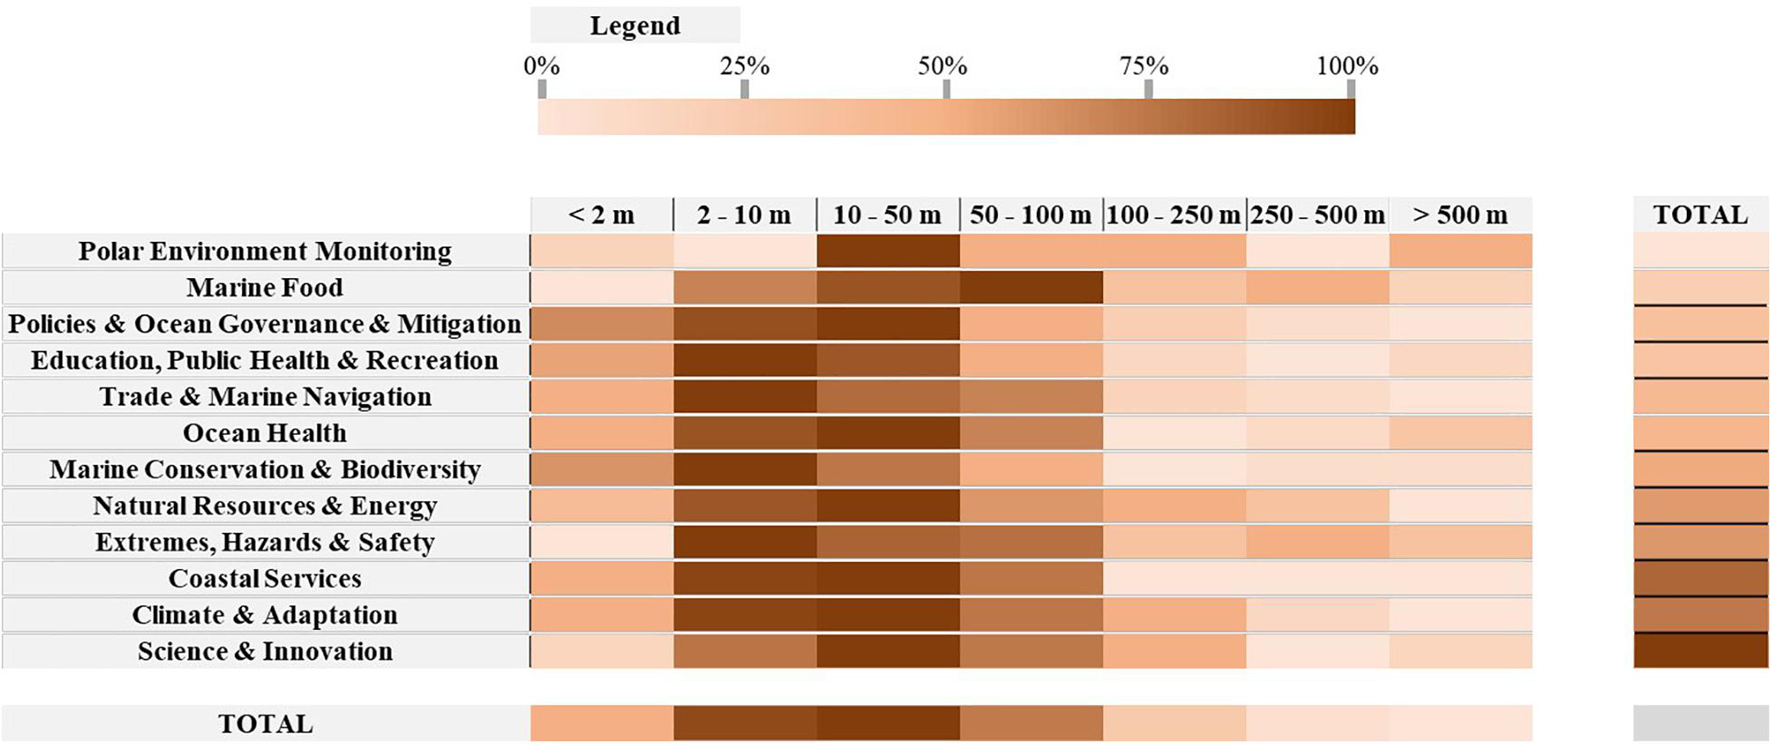
Figure 10. Resolution ranges required by users per market segments. The shading indicates the percentage of the 176 respondents who selected the box (legend at the top).
The survey shows that about half of the users identified areas with depths shallower than 50 m as priorities (Figure 11), which confirms the interest in SDB. Indeed, the needs in terms of navigation and coastal engineering are rather focused on the monitoring of shallow waters.
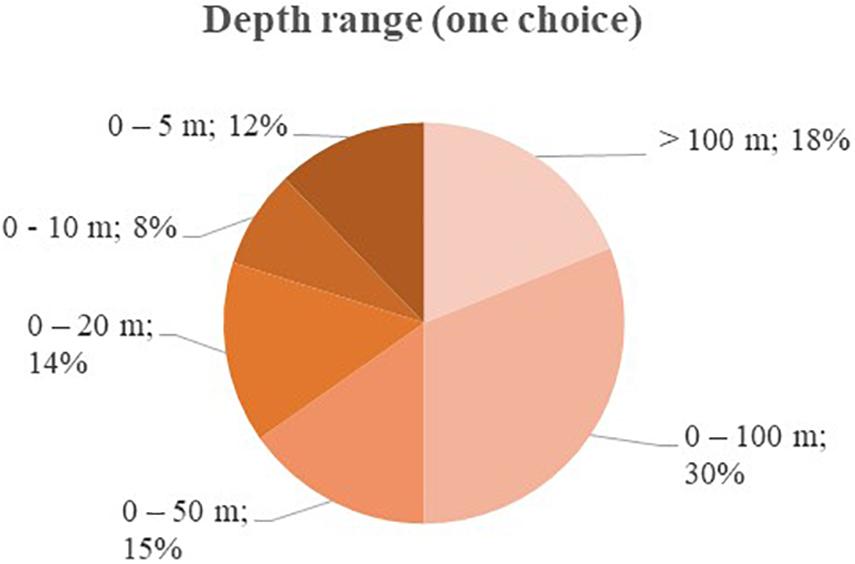
Figure 11. Depth range of interest for surveyed users. Note that depth ranges are not necessarily independent and can overlap.
With the potential of SDB to periodically update a bathymetric atlas, we introduced in this study the notion of temporal updating to estimate the needs for monitoring the dynamics of coastal morphology. The answers showed that updating data episodically after major events would be sufficient for 51% of the respondents, while 42% would require yearly updating, 29% seasonally, 17% monthly and 13% weekly updates of the bathymetry. Figure 12 cross-references expressed requirements between depth ranges and temporal updates. The main demand of users is, in the first instance, to be able to obtain at least a valid, continuous and recent bathymetry of European coastlines. An annual or even seasonal update will subsequently generate strong interest in all depth ranges along the coast.
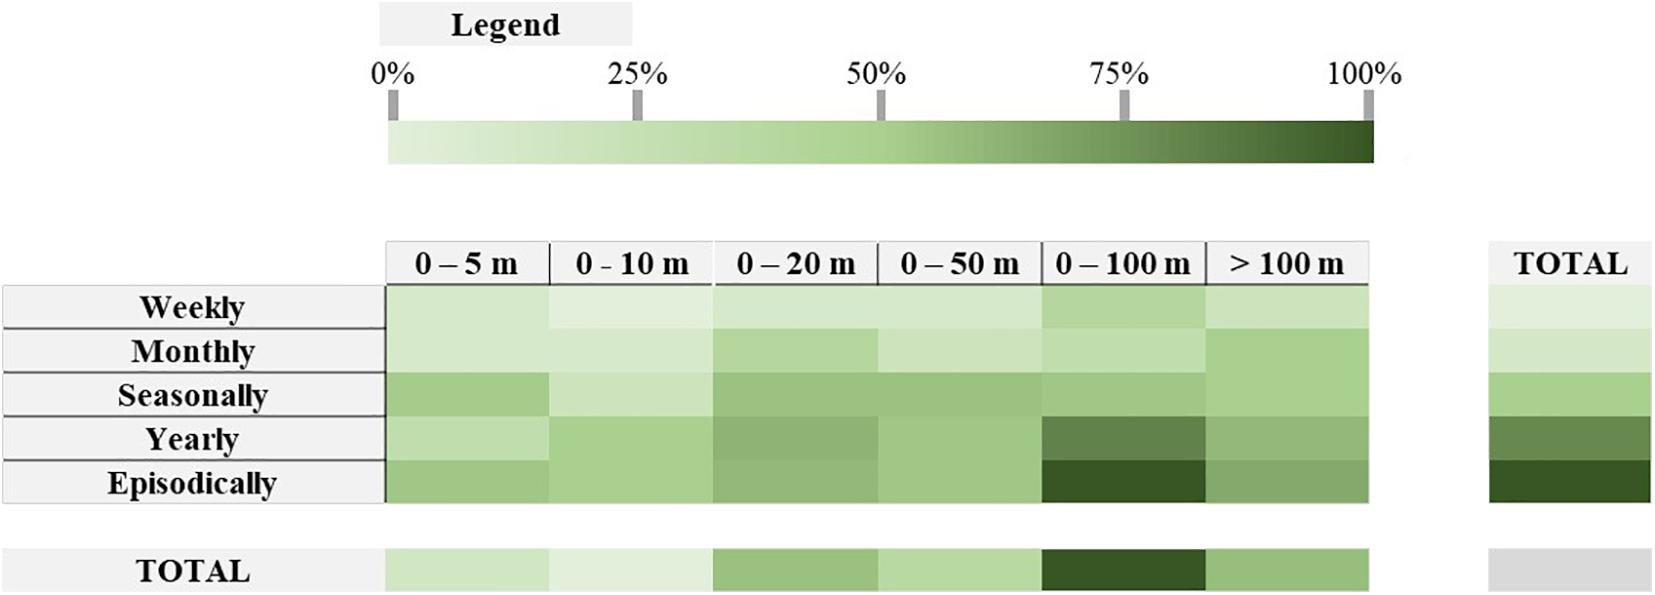
Figure 12. Heatmap of user requirements in depth range and temporal update of potential bathymetry products. The shading indicates the percentage of the 176 respondents who selected the box (legend at the top).
Perspectives and Recommendations
SDB is expected to be an essential tool for hydrographers in the coming years (Laporte et al., 2020). SDB methods can be applied completely remotely, with no associated environmental impacts or human risks, and are cost effective and time efficient compared to traditional methods. Despite this high ambition, SDB has so far only been applied to limited space domains, and efforts remain to be done to map nearshore bathymetry and its time-evolution at global scale, in compliance with IHO standards regarding accuracy and resolution (Mayer et al., 2018; Benveniste et al., 2019; Wölfl et al., 2019).
The emergence of SDB takes advantage of the major shift of the EO market in the so-called “New space” era. The recent emergence of low-cost small satellite technology, particularly due to cheaper manufacturing techniques and the growth of commercial off-the-shelf components, has lowered barriers to entry, and thus democratised access to space. New entrants are beginning to disrupt the EO market by introducing constellations of small satellites into orbit. This in turn is expected to provide ever-increasing production and access to data due to the larger geographical coverage and daily revisit times these constellations can achieve (Turner et al., 2021).
Price pressure on data is anticipated due to the arrival of these lower-cost constellations competing with traditional large satellites, and with free data programs such as Copernicus and Landsat, for applications requiring lower accuracy and higher revisit. More and more, the revenue generations are moving from the imagery to services extracting information from the image itself thanks to AI technologies. Machine learning and big data enable automatic identification, change detection and prediction generating a large volume of data. Cloud computing services such as Google Earth Engine (Li et al., 2021), Microsoft Azure, Amazon AWS, and Copernicus DIAS, then make it possible for multiple new users to compute and access this new type of information. A recently increasing number of works make use of machine learning for SDB (Sagawa et al., 2019), bringing great expectations to solve satellite-based bathymetry issues in areas of complex physics and environmental parameters, by merging different methods and speeding up computation time (Danilo and Melgani, 2016; Benshila et al., 2020). Coastal morphology changes over a wide range of timescales (from storm events, seasonal and interannual variability to longer-term adaptation to changing environmental conditions), in particular in response to changing incoming wave regimes (Karunarathna et al., 2016; Bergsma et al., 2019) and human interventions.
The results of the CMEMS user needs analysis show a strong demand for new coastal bathymetric data. The requirements for very high resolution and very high accuracy can be met with commercial solutions, but with a trade-off for very local coverage and shallower depth. The results of this survey also show a clear interest for lower resolutions achievable with Sentinel-2, especially for scientific research applications where an update frequency would also be highly appreciated. This latter demand encourages the integration of an intermediate resolution SDB product into the CMEMS service catalogue. Further user surveys will be required to define the precise performance parameters to be adopted.
To conclude, even if SDB data cannot provide sufficient quality to be recognised as hydrographic data as of today, it already has the great potential to provide a first-pass tool in unmapped areas or dynamical areas for survey planning, risk reduction, change detection for a wide range of applications (discussed in section “Coastal Bathymetry for Coastal Marine Applications”). SDB could change the value chain, traditionally managed by operator infrastructures (mobilisation of survey fleet or satellite tasking for acquisition of data combined with manual/semi-automated processing), toward an automated online service providing immediate, off-the-shelf, online access to historic and recent bathymetry derived from archived or near real time satellite data.
Author Contributions
GC, AM, RA, and AL initiated and coordinated the review. GC wrote the first draft of the manuscript. AM, RA, AL, and LC contributed to the writing of sections of the manuscript. All authors contributed to manuscript revision, read, and approved the submitted version.
Funding
The activity carried out by the main author was financed by CNES under the CNES—IRD convention no. 201205/00.
Conflict of Interest
The authors declare that the research was conducted in the absence of any commercial or financial relationships that could be construed as a potential conflict of interest.
Publisher’s Note
All claims expressed in this article are solely those of the authors and do not necessarily represent those of their affiliated organizations, or those of the publisher, the editors and the reviewers. Any product that may be evaluated in this article, or claim that may be made by its manufacturer, is not guaranteed or endorsed by the publisher.
Acknowledgments
We are grateful for fruitful discussions and support from Centre National d’Etudes Spatiales (CNES) and Service hydrographique et océanographique de la Marine (SHOM).
Supplementary Material
The Supplementary Material for this article can be found online at: https://www.frontiersin.org/articles/10.3389/fmars.2021.740830/full#supplementary-material
References
Abileah, R. (2006). “Mapping Shallow Water Depth from Satellite,” in Proceedings of the ASPRS Annual Conference, Reno, Nevada (Bethesda, ML: ASPRS), 7.
Almar, R., Bergsma, E. W. J., Maisongrande, P., and de Almeida, L. P. M. (2019). Wave-derived coastal bathymetry from satellite video imagery: A showcase with Pleiades persistent mode. Rem. Sens. Environ. 231:111263. doi: 10.1016/j.rse.2019.111263
Austine, K., and Pyne, A. (2017). Subsea Cable Route Surveying [WWW Document]. Clevedon: Hydro international.
Benshila, R., Thoumyre, G., Najar, M., Abessolo Ondoa, G., Almar, R., Bergsma, E., et al. (2020). A Deep Learning Approach for Estimation of the Nearshore Bathymetry. J. Coastal Res. 95:1011. doi: 10.2112/SI95-197.1
Benveniste, J., Cazenave, A., Vignudelli, S., Fenoglio-Marc, L., Shah, R., Almar, R., et al. (2019). Requirements for a Coastal Hazards Observing System. Front. Mar. Sci. 6:00348. doi: 10.3389/fmars.2019.00348
Bergsma, E. W. J., Almar, R., and Maisongrande, P. (2019). Radon-Augmented Sentinel-2 Satellite Imagery to Derive Wave-Patterns and Regional Bathymetry. Rem. Sens. 11:1918. doi: 10.3390/rs11161918
Bergsma, E. W. J., and Almar, R. (2020). Coastal coverage of ESA’ Sentinel 2 mission. Adv. Space Res. 65, 2636–2644. doi: 10.1016/j.asr.2020.03.001
Bian, X., Shao, Y., Zhang, C., Xie, C., and Tian, W. (2020). The feasibility of assessing swell-based bathymetry using SAR imagery from orbiting satellites. ISPRS J. Photogramm. Rem. Sens. 168, 124–130. doi: 10.1016/j.isprsjprs.2020.08.006
Caballero, I., and Stumpf, R. P. (2019). Retrieval of nearshore bathymetry from Sentinel-2A and 2B satellites in South Florida coastal waters. Estuar. Coast. Shelf Sci. 226:106277. doi: 10.1016/j.ecss.2019.106277
Capo, S., Lubac, B., Marieu, V., Robinet, A., Bru, D., and Bonneton, P. (2014). Assessment of the decadal morphodynamic evolution of a mixed energy inlet using ocean color remote sensing. Ocean Dynam. 64, 1517–1530. doi: 10.1007/s10236-014-0762-1
Choi, C., and Kim, D. (2018). Optimum Baseline of a Single-Pass In-SAR System to Generate the Best DEM in Tidal Flats. IEEE J. Selected Top. Appl. Earth Observat. Rem. Sens. 11, 919–929. doi: 10.1109/JSTARS.2018.2795107
CNRM (2019). Modélisation de l’état de mer: les spécificités de la bande côtière Guyanaise. Rapport Recherche 2019:39.
Collin, A., Etienne, S., and Feunteun, E. (2017). VHR coastal bathymetry using WorldView-3: colour versus learner. Rem. Sens. Lett. 8, 1072–1081. doi: 10.1080/2150704X.2017.1354261
Crossland, C. J., Baird, D., Ducrotoy, J.-P., Lindeboom, H., Buddemeier, R. W., Dennison, W. C., et al. (2005). “The Coastal Zone — a Domain of Global Interactions,” in Coastal Fluxes in the Anthropocene: The Land-Ocean Interactions in the Coastal Zone Project of the International Geosphere-Biosphere Programme, Global Change — The IGBP Series, eds C. J. Crossland, H. H. Kremer, H. J. Lindeboom, J. I. Marshall Crossland, and M. D. A. Le Tissier (Berlin: Springer), 1–37. doi: 10.1007/3-540-27851-6_1
Daly, C., Baba, W., Bergsma, E., Almar, R., and Garlan, T. (2020). The New Era of Regional Coastal Bathymetry from Space: A Showcase for West Africa using Sentinel-2 Imagery. [Preprint]. doi: 10.31223/osf.io/f37rv
Danilo, C., and Binet, R. (2013). “Bathymetry estimation from wave motion with optical imagery: Influence of acquisition parameters, in: 2013 MTS/IEEE OCEANS - Bergen,” in Presented at the 2013 MTS/IEEE OCEANS - Bergen. (Piscataway, NJ: IEEE), 1–5. doi: 10.1109/OCEANS-Bergen.2013.6608068
Danilo, C., and Melgani, F. (2016). Wave Period and Coastal Bathymetry Using Wave Propagation on Optical Images. IEEE Transact. Geosci. Rem. Sens. 54, 1–13. doi: 10.1109/TGRS.2016.2579266
European Commission SWD (2019). COMMISSION STAFF WORKING DOCUMENT - Expression of User Needs for the Copernicus Programme. Brussels: European Commission.
Evagorou, E., Mettas, C., Agapiou, A., Themistocleous, K., and Hadjimitsis, D. (2019). “Bathymetric maps from multi-temporal analysis of Sentinel-2 data: the case study of Limassol, Cyprus, in: Advances in Geosciences,” in Presented at the European Geosciences Union General Assembly 2018, EGU Division Energy, Resources & Environment (ERE) - EGU General Assembly 2018, Vienna, Austria, 8–13 April 2018 (Göttingen: Copernicus GmbH), 397–407. doi: 10.5194/adgeo-45-397-2019
Fitton, J. M., Rennie, A. F., Hansom, J. D., and Muir, F. M. E. (2021). Remotely sensed mapping of the intertidal zone: A Sentinel-2 and Google Earth Engine methodology. Rem. Sens. Applicat. Soc. Environ. 22:100499. doi: 10.1016/j.rsase.2021.100499
Gao, J. (2009). Bathymetric mapping by means of remote sensing: methods, accuracy and limitations. Progress Phys. Geogr. Earth Environ. 33, 103–116. doi: 10.1177/0309133309105657
Guzinski, R., Spondylis, E., Michalis, M., Tusa, S., Brancato, G., Minno, L., et al. (2016). Exploring the Utility of Bathymetry Maps Derived With Multispectral Satellite Observations in the Field of Underwater Archaeology. Open Archaeol. 2:0018. doi: 10.1515/opar-2016-0018
IHO S-44 (2020). Publication S-44 “Standards for Hydrographic Surveys” Edition 6.0.0. Monte Carlo: IHO.
IHO C-55 (2021). Publication C-55 “Status of Hydrographic Surveying and Charting Worldwide.”. Monte Carlo: IHO.
Jawak, S. D., Vadlamani, S. S., and Luis, A. J. (2015). A Synoptic Review on Deriving Bathymetry Information Using Remote Sensing Technologies: Models. Methods Comparis. Adv. Rem. Sens. 4, 147–162. doi: 10.4236/ars.2015.42013
Karunarathna, H., Horrillo-Caraballo, J., Kuriyama, Y., Mase, H., Ranasinghe, R., and Reeve, D. E. (2016). Linkages between sediment composition, wave climate and beach profile variability at multiple timescales. Mar. Geol. 381, 194–208. doi: 10.1016/j.margeo.2016.09.012
Khan, M. J. U., Ansary, N., Durand, F., Testut, L., Ishaque, M., Calmant, S., et al. (2019). High-Resolution Intertidal Topography from Sentinel-2 Multi-Spectral Imagery: Synergy between Remote Sensing and Numerical Modeling. Rem. Sens. 11:rs11242888. doi: 10.3390/rs11242888
Laporte, J., Dolou, H., Avis, J., and Arino, O. (2020). Thirty Years of Satellite Derived Bathymetry: The Charting Tool That Hydrographers Can No Longer Ignore. Monte Carlo: IHO.
Lekkerkerk, H.-J. (2020). State of the Art in Multibeam Echosounders [WWW Document]. Clevedon: Hydro International.
Li, J., Knapp, D. E., Lyons, M., Roelfsema, C., Phinn, S., Schill, S. R., et al. (2021). Automated Global Shallow Water Bathymetry Mapping Using Google Earth Engine. Rem. Sens. 13:1469. doi: 10.3390/rs13081469
Lichter, M., Vafeidis, A. T., Nicholls, R. J., and Kaiser, G. (2011). Exploring Data-Related Uncertainties in Analyses of Land Area and Population in the “Low-Elevation Coastal Zone” (LECZ). COAS 27, 757–768. doi: 10.2112/JCOASTRES-D-10-00072.1
Luijendijk, A., Hagenaars, G., Ranasinghe, R., Baart, F., Donchyts, G., and Aarninkhof, S. (2018). The State of the World’s Beaches. Sci. Rep. 8:6641. doi: 10.1038/s41598-018-24630-6
Lyzenga, D. R. (1978). Passive remote sensing techniques for mapping water depth and bottom features. Appl. Opt. 17, 379–383. doi: 10.1364/AO.17.000379
Mason, D. C., Davenport, I. J., Robinson, G. J., Flather, R. A., and McCartney, B. S. (1995). Construction of an inter-tidal digital elevation model by the ‘Water-Line’ Method. Geophys. Res. Lett. 22, 3187–3190. doi: 10.1029/95GL03168
Mateo-Pérez, V., Corral-Bobadilla, M., Ortega-Fernández, F., and Rodríguez-Montequín, V. (2021). Analysis of the Spatio-Temporal Evolution of Dredging from Satellite Images: A Case Study in the Principality of Asturias (Spain). J. Mar. Sci. Enginee. 9:267. doi: 10.3390/jmse9030267
Mayer, L., Jakobsson, M., Allen, G., Dorschel, B., Falconer, R., Ferrini, V., et al. (2018). The Nippon Foundation—GEBCO Seabed 2030 Project: The Quest to See the World’s Oceans Completely Mapped by 2030. Geosciences 8:63. doi: 10.3390/geosciences8020063
McMichael, C., Dasgupta, S., Ayeb-Karlsson, S., and Kelman, I. (2020). A review of estimating population exposure to sea-level rise and the relevance for migration. Environ. Res. Lett. 15:123005. doi: 10.1088/1748-9326/abb398
Melet, A., Teatini, P., Le Cozannet, G., Jamet, C., Conversi, A., Benveniste, J., et al. (2020). Earth Observations for Monitoring Marine Coastal Hazards and Their Drivers. Surv. Geophys. 41, 1489–1534. doi: 10.1007/s10712-020-09594-5
Mentaschi, L., Vousdoukas, M. I., Pekel, J.-F., Voukouvalas, E., and Feyen, L. (2018). Global long-term observations of coastal erosion and accretion. Sci. Rep. 8:12876. doi: 10.1038/s41598-018-30904-w
MOI, and EEA (2018). Roadmap for the Evolution of Copernicus Marine and Land Services to Better Serve Coastal Users. København: European Environment Agency (EEA).
Mishra, M. K., Ganguly, D., Chauhan, P., and Ajai. (2014). Estimation of Coastal Bathymetry Using RISAT-1 C-Band Microwave SAR Data. IEEE Geosci. Rem. Sens. Lett. 11, 671–675. doi: 10.1109/LGRS.2013.2274475
Myrick, K. B. (2011). Coastal Bathymetry Using Satellite Observation in Support of Intelligence Preparation of the Environment. Monterey: Naval Postgraduate School.
Neumann, B., Vafeidis, A. T., Zimmermann, J., and Nicholls, R. J. (2015). Future Coastal Population Growth and Exposure to Sea-Level Rise and Coastal Flooding - A Global Assessment. PLoS One 10:e0118571. doi: 10.1371/journal.pone.0118571
Ocean News (2021). TCarta Leverages AI Technology and ICESat-2 Data to Create a G-SDB Product. Science & Tech | News. Stuart, FL: ONT.
Parrish, C., Magruder, L., Neuenschwander, A., Forfinski-Sarkozi, N., Alonzo, M., and Jasinski, M. (2019). Validation of ICESat-2 ATLAS Bathymetry and Analysis of ATLAS’s Bathymetric Mapping Performance. Rem. Sens. 11:1634. doi: 10.3390/rs11141634
Pleskachevsky, A., Lehner, S., Heege, T., and Mott, C. (2011). Synergy and fusion of optical and synthetic aperture radar satellite data for underwater topography estimation in coastal areas. Ocean Dynam. 61, 2099–2120. doi: 10.1007/s10236-011-0460-1
Poppenga, S. K., Palaseanu-Lovejoy, M., Gesch, D. B., Danielson, J. J., and Tyler, D. J. (2018). Evaluating the Potential for Near-shore Bathymetry on the Majuro Atoll, Republic of the Marshall Islands, Using Landsat 8 and WorldView-3 Imagery (USGS Numbered Series No. 2018–5024), Evaluating the Potential for Near-Shore Bathymetry on the Majuro Atoll, Republic of the Marshall Islands, using Landsat 8 and WorldView-3 imagery, Scientific Investigations Report. Reston, VA: U.S. Geological Survey, doi: 10.3133/sir20185024
Poupardin, A., Idier, D., Michele, M., de, and Raucoules, D. (2016). Water Depth Inversion From a Single SPOT-5 Dataset. IEEE Transact. Geosci. Rem. Sens. 54, 2329–2342. doi: 10.1109/TGRS.2015.2499379
Poursanidis, D., Traganos, D., Chrysoulakis, N., and Reinartz, P. (2019). Cubesats Allow High Spatiotemporal Estimates of Satellite-Derived Bathymetry. Rem. Sens. 11:rs11111299. doi: 10.3390/rs11111299
Quadros, N. (2016). Technology in Focus: Bathymetric Lidar [WWW Document]. Available online at: https://www.gim-international.com/content/article/technology-in-focus-bathymetric-lidar-2 (accessed 03 September, 2021)
Ramaseri Chandra, S. N., Christopherson, J. B., and Casey, K. A. (2020). 2020 Joint Agency Commercial Imagery Evaluation—Remote sensing satellite compendium (USGS Numbered Series No. 1468), 2020 Joint Agency Commercial Imagery Evaluation—Remote sensing satellite compendium, Circular. Reston, VA: U.S. Geological Survey. doi: 10.3133/cir1468
Sagar, S., Roberts, D., Bala, B., and Lymburner, L. (2017). Extracting the intertidal extent and topography of the Australian coastline from a 28 year time series of Landsat observations. Rem. Sens. Environ. 195, 153–169. doi: 10.1016/j.rse.2017.04.009
Sagawa, T., Yamashita, Y., Okumura, T., and Yamanokuchi, T. (2019). Satellite Derived Bathymetry Using Machine Learning and Multi-Temporal Satellite Images. Rem. Sens. 11:1155. doi: 10.3390/rs11101155
Salameh, E., Frappart, F., Almar, R., Baptista, P., Heygster, G., Lubac, B., et al. (2019). Monitoring Beach Topography and Nearshore Bathymetry Using Spaceborne Remote Sensing: A Review. Rem. Sens. 11:2212. doi: 10.3390/rs11192212
Salameh, E., Frappart, F., Marieu, V., Spodar, A., Parisot, J.-P., Hanquiez, V., et al. (2018). Monitoring Sea Level and Topography of Coastal Lagoons Using Satellite Radar Altimetry: The Example of the Arcachon Bay in the Bay of Biscay. Rem. Sens. 10:297. doi: 10.3390/rs10020297
Sánchez-Arcilla, A., Staneva, J., Cavaleri, L., Badger, M., Bidlot, J., Sørensen, J., et al. (2021). CMEMS-Based Coastal Analyses: Conditioning, Coupling and Limits for Applications. Front. Mar. Sci. 8:604741. doi: 10.3389/fmars.2021.604741
Sancho, F., Birrien, F., and Azevedo, A. (2018). Co-ReSyF SAR-bathymetry application: algorithm testing and performance. Actas Jornadas Engenharia Hidrográfica 2018:1305128. doi: 10.5281/zenodo.1305128
Smith, W. H. F., and Sandwell, D. T. (1997). Global Sea Floor Topography from Satellite Altimetry and Ship Depth Soundings. Science 277, 1956–1962. doi: 10.1126/science.277.5334.1956
Sun, M., Yu, L., Zhang, P., Sun, Q., Jiao, X., Sun, D., et al. (2021). Coastal water bathymetry for critical zone management using regression tree models from Gaofen-6 imagery. Ocean Coast. Manage. 204:105522. doi: 10.1016/j.ocecoaman.2021.105522
TeleGeography (2021). Submarine Cable Map [WWW Document]. Available online at: https://www.submarinecablemap.com/. URL https://www.submarinecablemap.com/ (accessed 03 May, 2021)
Thomas, N., Pertiwi, A. P., Traganos, D., Lagomasino, D., Poursanidis, D., Moreno, S., et al. (2021). Space-Borne Cloud-Native Satellite-Derived Bathymetry (SDB) Models Using ICESat-2 and Sentinel-2. Geophys. Res. Lett. 2021:e2020GL092170. doi: 10.1029/2020GL092170
Toimil, A., Camus, P., Losada, I. J., Le Cozannet, G., Nicholls, R. J., Idier, D., et al. (2020). Climate change-driven coastal erosion modelling in temperate sandy beaches: Methods and uncertainty treatment. Earth Sci. Rev. 202:103110. doi: 10.1016/j.earscirev.2020.103110
Tozer, B., Sandwell, D. T., Smith, W. H. F., Olson, C., Beale, J. R., and Wessel, P. (2019). Global Bathymetry and Topography at 15 Arc Sec: SRTM15+. Earth Space Sci. 6, 1847–1864. doi: 10.1029/2019EA000658
Turner, I. L., Harley, M. D., Almar, R., and Bergsma, E. W. J. (2021). Satellite optical imagery in Coastal Engineering. Coast. Enginee. 167:103919. doi: 10.1016/j.coastaleng.2021.103919
Wiehle, S., and Pleskachevsky, A. (2018). “Bathymetry derived from Sentinel-1 Synthetic Aperture Radar,” in EUSAR 2018. (Aachen: EUSAR).
Wiehle, S., Martinez, B., Hartmann, K., Verlaan, M., Lewis, S., and Schaap, D. (2016). The BASE-platform Project: Deriving the Bathymetry from Combined Satellite Data 8. Berlin: ResearchGate.
Wiehle, S., Pleskachevsky, A., and Gebhardt, C. (2019). Automatic bathymetry retrieval from SAR images. CEAS Space J. 11, 105–114. doi: 10.1007/s12567-018-0234-4
Keywords: bathymetry, satellite, coastal development, Europe, Copernicus
Citation: Cesbron G, Melet A, Almar R, Lifermann A, Tullot D and Crosnier L (2021) Pan-European Satellite-Derived Coastal Bathymetry—Review, User Needs and Future Services. Front. Mar. Sci. 8:740830. doi: 10.3389/fmars.2021.740830
Received: 13 July 2021; Accepted: 07 October 2021;
Published: 29 October 2021.
Edited by:
Achilleas G. Samaras, Democritus University of Thrace, GreeceReviewed by:
Christian M. Appendini, National Autonomous University of Mexico, MexicoJiwei Li, Arizona State University, United States
Copyright © 2021 Cesbron, Melet, Almar, Lifermann, Tullot and Crosnier. This is an open-access article distributed under the terms of the Creative Commons Attribution License (CC BY). The use, distribution or reproduction in other forums is permitted, provided the original author(s) and the copyright owner(s) are credited and that the original publication in this journal is cited, in accordance with accepted academic practice. No use, distribution or reproduction is permitted which does not comply with these terms.
*Correspondence: Rafael Almar, cmFmYWVsLmFsbWFyQGlyZC5mcg==