 Gianpiero Cossarini*
 Laura Feudale
 Anna Teruzzi
 Giorgio BolzonGianluca Coidessa
 Cosimo SolidoroValeria Di BiagioCarolina Amadio
 Paolo Lazzari
 Alberto BrosichStefano Salon
- National Institute of Oceanography and Applied Geophysics - OGS, Trieste, Italy
Ocean reanalyses integrate models and observations to provide a continuous and consistent reconstruction of the past physical and biogeochemical ocean states and variability. We present a reanalysis of the Mediterranean Sea biogeochemistry at a 1/24° resolution developed within the Copernicus Marine Environment Monitoring Service (CMEMS) framework. The reanalysis is based on the Biogeochemical Flux Model (BFM) coupled with a variational data assimilation scheme (3DVarBio) and forced by the Nucleus for European Modeling of the Ocean (NEMO)–OceanVar physical reanalysis and European Centre for medium-range weather forecasts (ECMWF) reanalysis ERA5 atmospheric fields. Covering the 1999–2019 period with daily means of 12 published and validated biogeochemical state variables, the reanalysis assimilates surface chlorophyll data and integrates EMODnet data as initial conditions, in addition to considering World Ocean Atlas data at the Atlantic boundary, CO2 atmospheric observations, and yearly estimates of riverine nutrient inputs. With the use of multiple observation sources (remote, in situ, and BGC-Argo), the quality of the biogeochemical reanalysis is qualitatively and quantitatively assessed at three validation levels including the evaluation of 12 state variables and fluxes and several process-oriented metrics. The results indicate an overall good reanalysis skill in simulating basin-wide values and variability in the biogeochemical variables. The uncertainty in reproducing observations at the mesoscale and weekly temporal scale is satisfactory for chlorophyll, nutrient, oxygen, and carbonate system variables in the epipelagic layers, whereas the uncertainty increases for a few variables (i.e., oxygen and ammonium) in the mesopelagic layers. The vertical dynamics of phytoplankton and nitrate are positively evaluated with specific metrics using BGC-Argo data. As a consequence of the continuous increases in temperature and salinity documented in the Mediterranean Sea over the last 20 years and atmospheric CO2 invasion, we observe basin-wide biogeochemical signals indicating surface deoxygenation, increases in alkalinity, and dissolved inorganic carbon concentrations, and decreases in pH at the surface. The new, high-resolution reanalysis, open and freely available from the Copernicus Marine Service, allows users from different communities to investigate the spatial and temporal variability in 12 biogeochemical variables and fluxes at different scales (from the mesoscale to the basin-wide scale and from daily to multiyear scales) and the interaction between physical and biogeochemical processes shaping Mediterranean marine ecosystem functioning.
Introduction
Optimal integration of physical-biogeochemical observations and models is becoming increasingly urgent to support both scientific and broader environmental communities. This urgency has emerged from the necessity of quantifying the current characteristics and trends of physical and biogeochemical states at global or regional scales (Fennel et al., 2019), including estimates of the carbon cycle, acidification, primary production, and oxygen and nutrient availability. Given their basin-wide, regular, and seamless spatial and temporal coverage, multidecadal reanalyses can constitute a robust basis to compute meaningful and specific environmental indicators that describe the states and trends of key biogeochemical features (e.g., essential climate and ecological variables; Bojinski et al., 2014; Miloslavich et al., 2018), fluxes, and processes that cannot be completely and extensively observed (e.g., the flux of CO2, primary production, and carbon sequestration). These indicators may support environmental state assessment and monitoring of climate change, and its impact on marine ecosystems, following national or international directives [e.g., European Marine Strategy Framework Directive (MSFD), UNEP/MAP]. From this perspective, the EU Copernicus Marine Environment Monitoring Service (CMEMS) has developed ocean monitoring indicators (OMIs), defined as trends and variability indexes of key marine variables computed for the global ocean and European seas (von Schuckmann et al., 2016, 2018, 2020). At the global scale, OMIs for the ocean biogeochemistry presently account for pH, chlorophyll, CO2, nitrate, and oxygen minimum zones, whereas in most regional seas, only the surface chlorophyll OMI extracted from reprocessed satellite ocean color data is available.
As a semienclosed sea with a complex orography, the Mediterranean Sea exhibits high variability in physical (Pinardi and Masetti, 2000; Pinardi et al., 2015), biogeochemical, and biological characteristics (Siokou-Frangou et al., 2010). Additionally, intense anthropogenic pressure (Hulme et al., 1999; Micheli et al., 2013) and effects of climate change (Giorgi, 2006) make the Mediterranean Sea a challenging research area, as multiple signals at different scales interact. While basin-wide physical tendencies have been presented (Escudier et al., 2021 and references therein), biogeochemical tendencies are absent and mostly related to single variables (e.g., chlorophyll). Few long-term basin-scale signals of ecosystem changes have been reported for the Mediterranean Sea considering ocean color and in situ data. For example, using surface chlorophyll concentrations retrieved from satellite data, Colella et al. (2016) analyzed the 1998–2009 period and reported significant positive trends in most of the western Mediterranean and Rhodes gyre areas and negative trends in the northern Adriatic Sea. A slightly contrasting result was reported by Salgado-Hernanz et al. (2019) and by the CMEMS ocean monitoring product (Sathyendranath et al., 2018) that showed a positive (negative) trend in the western (eastern) Mediterranean subbasin based on an extended period of the reprocessed satellite dataset. Interannual variability in the dissolved oxygen concentration and a link between ventilation change signals in eastern and western Mediterranean deep waters and two major subbasin climatic shifts, i.e., the Eastern and Western Mediterranean Transients (EMT between 1995 and 2001, and WMT between 2004 and 2006, respectively), were recently highlighted (Li and Tanhua, 2020; Mavropoulou et al., 2020). Focusing on limited areas and periods (given the length of in situ time series), changes in the deep oxygen concentration have been reported for the Levantine basin (Sisma-Ventura et al., 2021), Gulf of Lions (Coppola et al., 2018), southern Adriatic Sea (Lipizer et al., 2014), and southern Aegean Sea (Velaoras et al., 2019). Additionally, acidification tendency signals have been observed in the western (Gibraltar Strait; Flecha et al., 2015) and eastern Mediterranean Sea (Cretan basin; Wimart-Rousseau et al., 2021), whereas changes in carbonate system variables [e.g., an increase in alkalinity and dissolved inorganic carbon (DIC) concentrations] have been indirectly estimated in relation to climate change and anthropogenic pressure (Schneider et al., 2010; Touratier and Goyet, 2011; Álvarez et al., 2014; Wimart-Rousseau et al., 2021).
Reanalyses can fill observational gaps, providing a three-dimensional, basin-wide, and seamless dataset to investigate temporal and spatial variability on a variety of scales. However, producing a physical–biogeochemical reanalysis is not a trivial task (Park et al., 2018), given the uncertain representativeness of the coupling between physical and biogeochemical processes (particularly vertical transport and consequent effects on the nutricline shape), the limited amount of biogeochemical data (both for assimilation and validation), and the multivariate nature of the biogeochemical state, which includes the complex links between observed (sparse) and simulated (many, in principle) variables. Thus, assessment of the quality of reanalysis products is of paramount importance considering their potential multiple uses (Hernandez et al., 2018). Model validation can be accomplished at different levels (Hipsey et al., 2020), providing uncertainty estimation for modeled variables at different spatial and temporal scales (Stow et al., 2009) and quantifying the modeling capability in terms of the reproduction of ecosystem processes (e.g., Salon et al., 2019; Mignot et al., 2021).
At the Mediterranean basin scale, while long-term simulations with a good performance in reproducing certain specific aspects are available (Lazzari et al., 2012; Macias et al., 2014; Guyennon et al., 2015; Richon et al., 2018; Di Biagio et al., 2019), biogeochemical reanalyses are quite rare. Through the assimilation of ocean color data in a POLCOMS-ERSEM reanalysis at a 1/10° resolution, Ciavatta et al. (2019) derived a specific eco-regionalization based on phytoplankton functional types. Within the CMEMS framework, a reanalysis at a 1/16° horizontal resolution covering the period from 1999 to 2014 and assimilating ocean color chlorophyll data was made available in 2016 (Teruzzi et al., 2016), and annually extended until 2018 (Teruzzi et al., 2019a). This low-resolution reanalysis has been adopted to investigate the surface nutrient trend (von Schuckmann et al., 2018), the positive trend of the CO2 air-sea flux (von Schuckmann et al., 2018), and the multidecadal variation in primary production and its relationship with mixing events in the North–Western Mediterranean Sea (Cossarini et al., 2020).
In the present study, we describe a novel version of the CMEMS biogeochemical reanalysis product covering the 1999–2019 period, with a spatial resolution as high as 1/24° horizontally and 125 vertical levels, based on the most advanced version of the Mediterranean Sea Biogeochemical Flux Model system (MedBFM) operationally employed in CMEMS for short-term prediction purposes (Salon et al., 2019). Additionally, the biogeochemical reanalysis includes the latest update of the assimilation scheme (Teruzzi et al., 2018) of ocean color data (Colella et al., 2021) and off-line coupling with the latest release of a physical reanalysis (Escudier et al., 2021). The reanalysis results are available as daily and monthly 3D fields of 12 biogeochemical variables and fluxes through the CMEMS service.
This study is organized as follows: section “Materials and Methods” describes the MedBFM model setup, the upstream data considered to perform the reanalysis, and the validation framework. Section “Reanalysis Validation” presents the main results in terms of multilevel validation. The temporal tendencies and variability emerging from the reanalysis data are provided in section “Reanalysis Variabilities and Trends.” A discussion on the reanalysis quality and long-term tendency and conclusions are outlined in sections “Discussion” and “Conclusion,” respectively.
Materials and Methods
Modeling Framework
The reanalysis of the Mediterranean Sea biogeochemistry at a horizontal resolution of 1/24° (approximately 4 km; the model domain is shown in Figure 1), covering the period 1999–2019, was produced with an upgraded version of the MedBFM model system, as detailed and assessed with regard to quality in Salon et al. (2019). In summary, MedBFM was built over the coupling between the OGS transport model (OGSTM), the BFM (Lazzari et al., 2010, 2012, 2016; Cossarini et al., 2015a; Vichi et al., 2020, and references therein), and the 3DVarBio variational scheme that assimilates surface chlorophyll concentrations (Teruzzi et al., 2014, 2018, 2019b). The BFM describes the biogeochemical cycles of carbon and macronutrients (nitrogen, phosphorus, and silicon) in terms of dynamic interactions among the dissolved inorganic, living organic, and non-living organic compartments. Recent MedBFM upgrades, including the assimilation of BGC-Argo float data and biooptical components, have been described in Cossarini et al. (2019) and Terzić et al. (2019, 2021), respectively. MedBFM is coupled off-line with the CMEMS Mediterranean Sea physical reanalysis system (Escudier et al., 2021), which has provided the necessary fields at a daily frequency for 21-year integration (currents, temperature, salinity, diffusivity, wind, and solar radiation) to force tracer transport, dependency of biochemical kinetics on the temperature, and air-sea interactions.
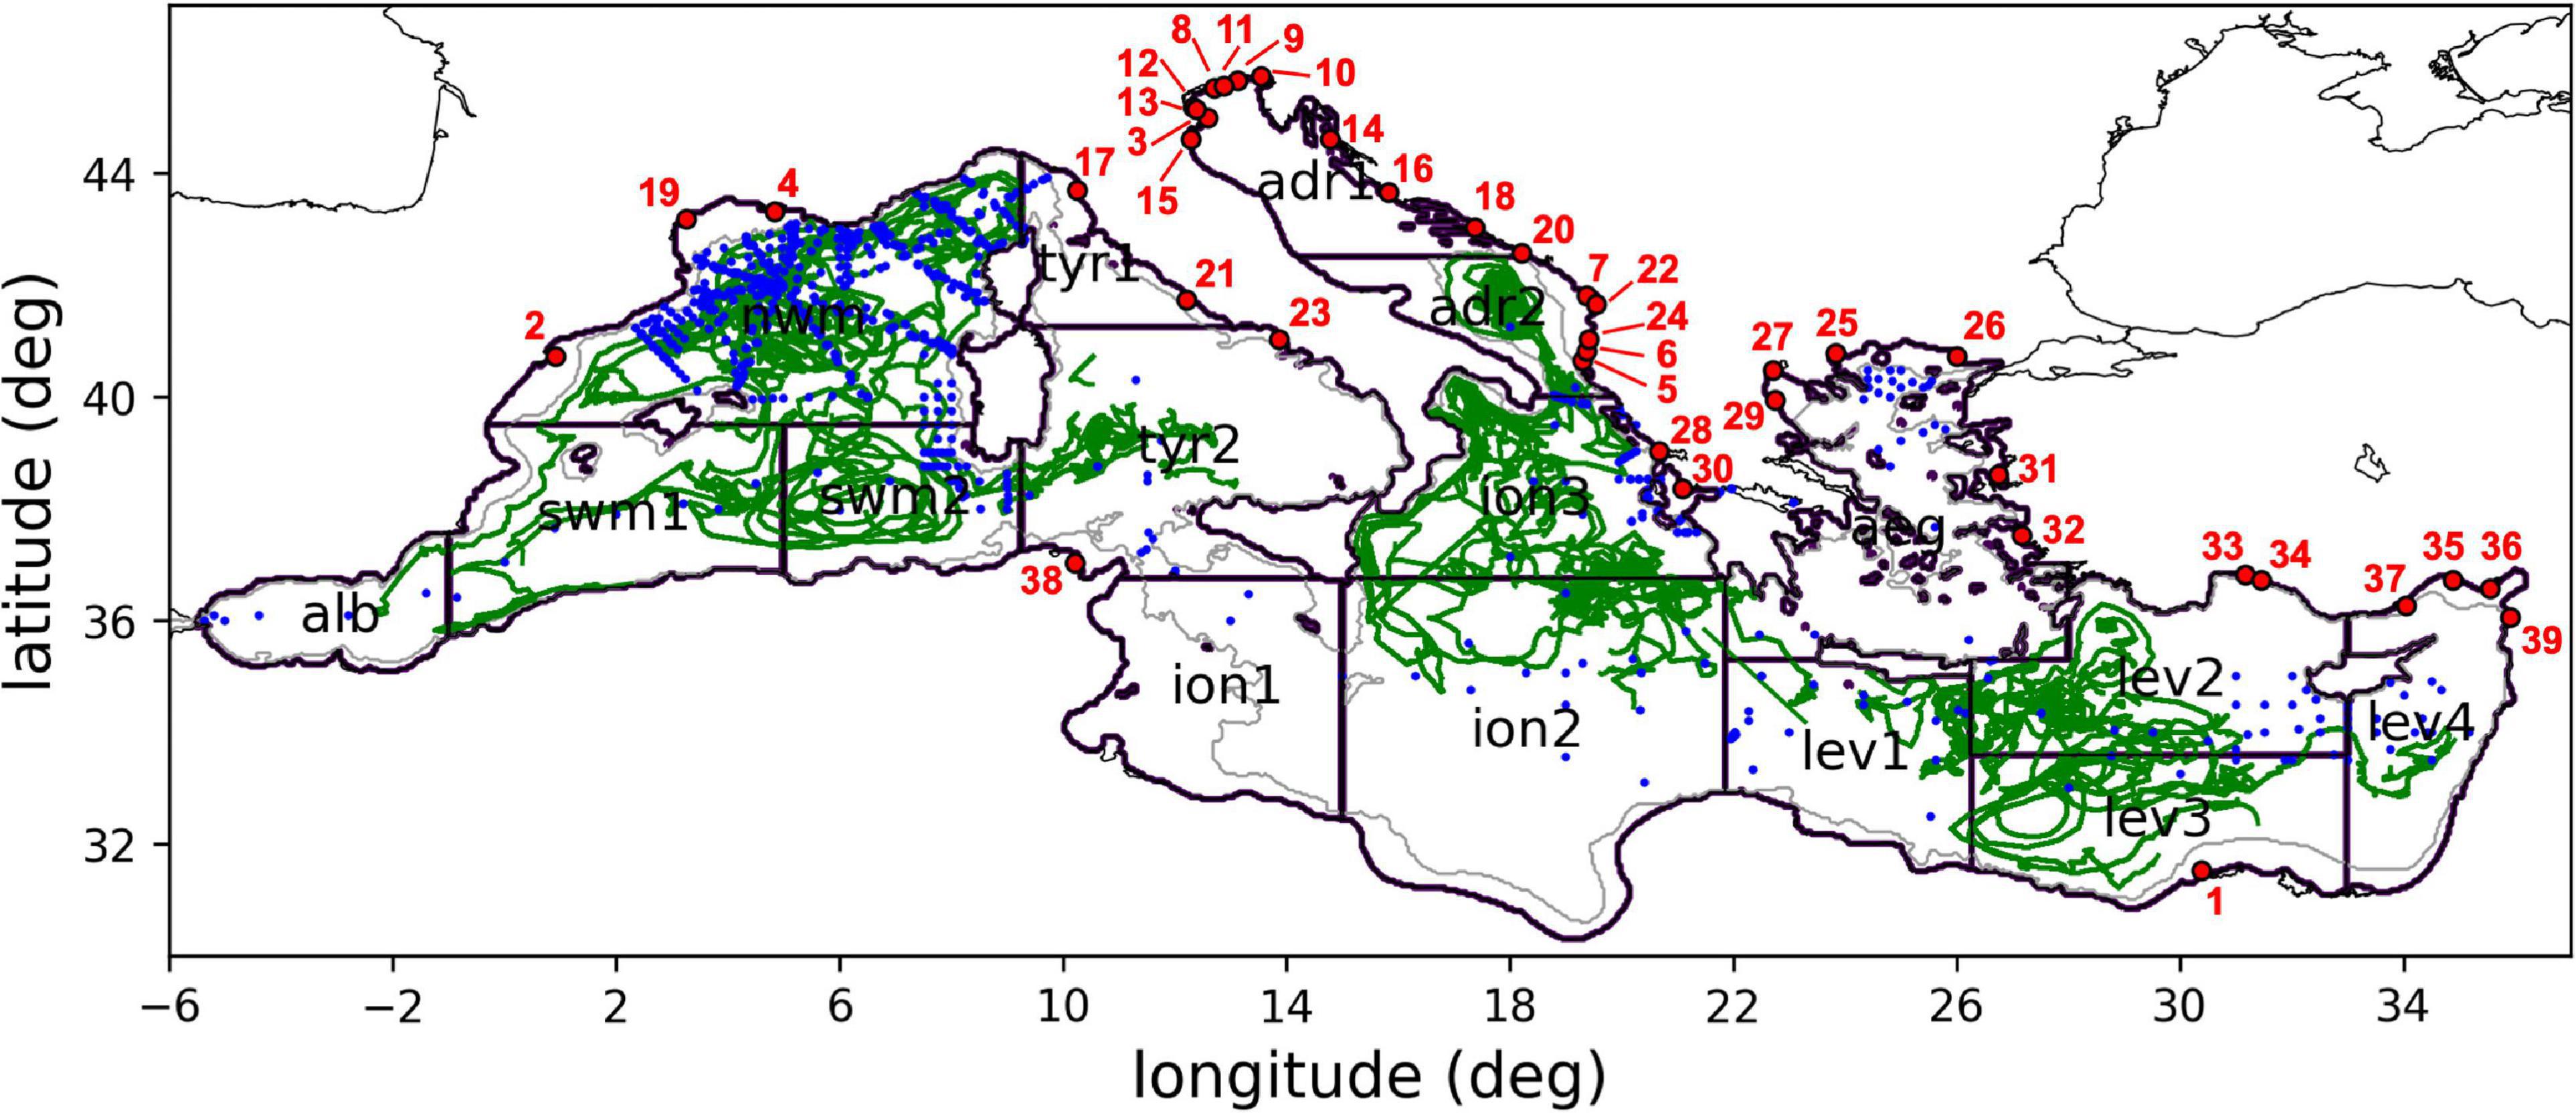
Figure 1. Subdivision of the model domain in sub-basins used for the validation of the reanalysis. According to data availability and to ensure consistency and robustness of the metrics, different subsets of the sub-basins or some combinations among them can be used for the different metrics: lev = lev1 + lev2 + lev3 + lev4; ion = ion1 + ion2 + ion3; tyr = tyr1 + tyr2; adr = adr1 + adr2; swm = swm1 + swm2. The gray line defines the bathymetric contour at 200 m. Blue dots represent open sea observations of nitrate from EMODnet_int data collection (period 1999–2016). Green lines correspond to trajectories of BGC-Argo floats with chlorophyll observations (period 2013–2018). Red dots with numbers correspond to main river mouth positions: Nile (1), Ebro (2), Po (3), Rhone (4), Vjosë (5), Seman (6), Buna/Bojana (7), Piave (8), Tagliamento (9), Soča/Isonzo (10), Livenza (11), Brenta-Bacchiglione (12), Adige (13), Lika (14), Reno (15), Krka (16), Arno (17), Nerveta (18), Aude (19), Trebisjnica (20), Tevere (21), Mati (22), Volturno (23), Shkumbini (24), Struma/Strymonas (25), Meric/Evros/Maritsa (26), Axios/Vadar (27), Arachtos (28), Pinios (29), Acheloos (30), Gediz (31), Buyuk Menderes (32), Kopru (33), Manavgat (34), Seyhan (35), Ceyhan (36), Gosku (37), Medjerda (38), Asi/Orontes (39).
The setup of the biogeochemical component, in addition to that of the physical component, is reported in Table 1. Among the listed elements, a relevant dependency is the atmospheric CO2 partial pressure, which increased almost linearly from 370 ppm in 1999 to 410 ppm in 2019 (data obtained from the ENEA Lampedusa station; Artuso et al., 2009). The nutrient inputs are imbalanced between the two main basins (i.e., the eastern basin receives almost 70% of the loads) and with atmospheric inputs higher than the nutrient discharges originating from rivers. Indeed, the nitrogen inputs into the western and eastern basins reach 41.4 and 39.8 × 10⁹ mol yr–1, respectively stemming from air deposition, and 10.1 and 34.7 × 10⁹ mol yr–1 stemming from rivers, respectively. The western and eastern basin phosphorus inputs are 0.53 and 0.67 × 10⁹ mol yr–1 originating from the atmosphere and 0.16 and 0.69 × 10⁹ mol yr–1 originating from rivers, respectively (Ribera d’Alcalà et al., 2003; van Apeldoorn and Bouwman, 2012).
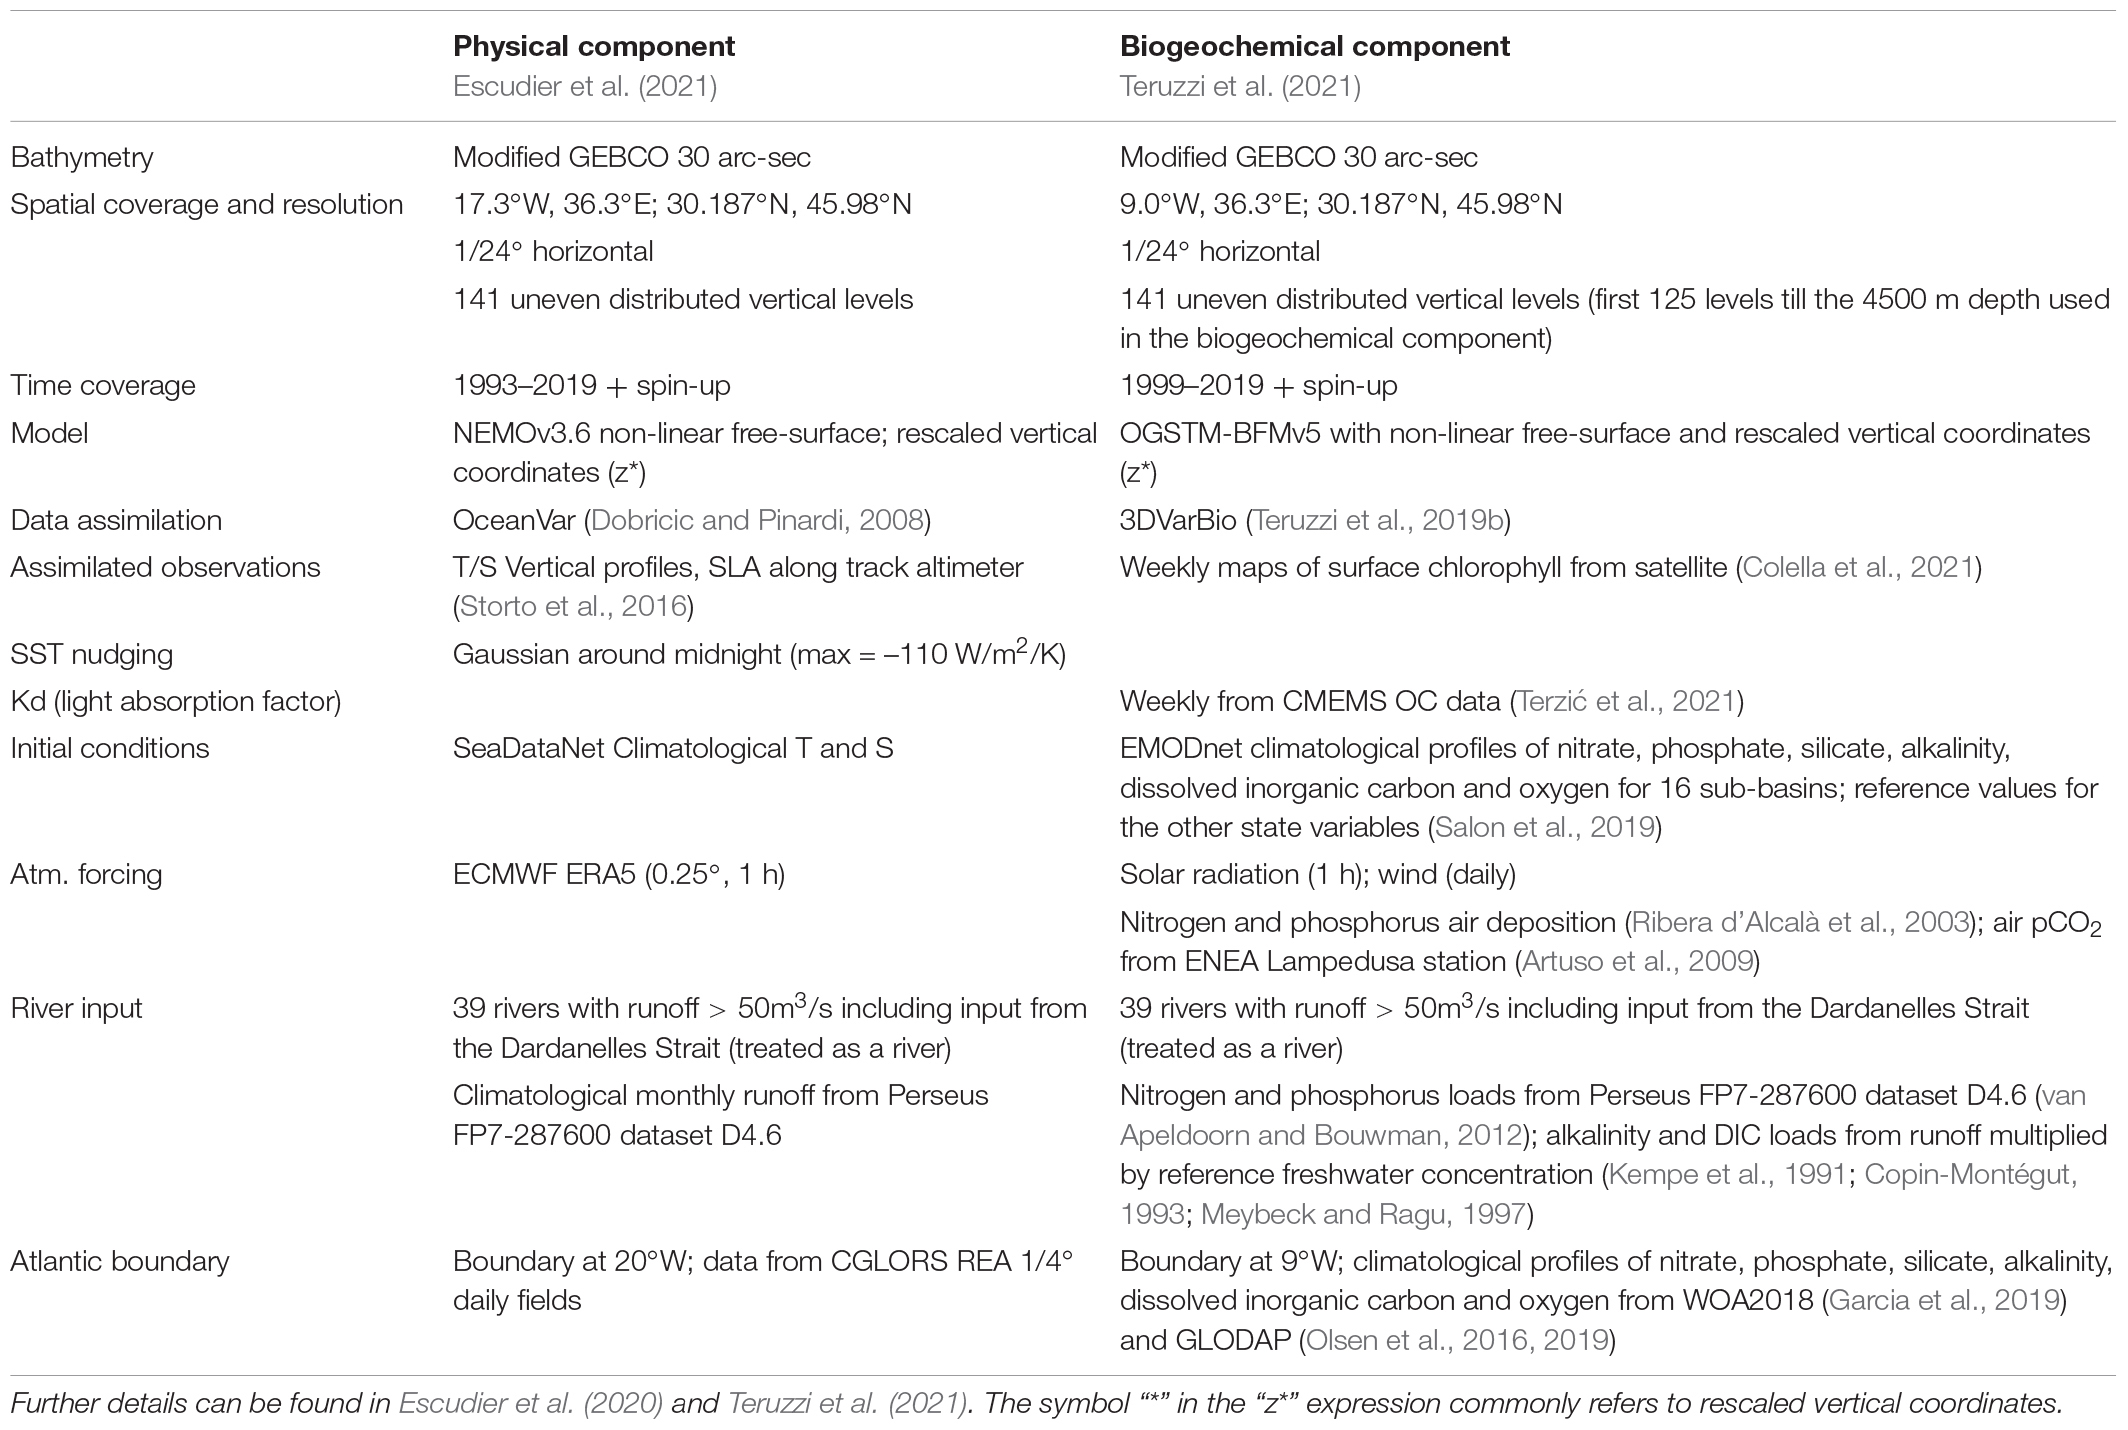
Table 1. Setup of the biogeochemical reanalysis and its off-line coupling with the physical component reanalysis.
Although the boundary conditions data [i.e., Atlantic boundaries retrieved from the World Ocean Atlas and GLobal Ocean Data Analysis Project (GLODAP), and nutrient inputs obtained from Perseus] are climatological, the atmospheric (ERA5 data) and ocean dynamics forcing data (Escudier et al., 2021) are daily data, and the assimilated biogeochemical data (surface chlorophyll; Teruzzi et al., 2018) are weekly data, thus driving the high-frequency dynamics of the 21-year long reanalysis model simulation.
Validation Framework
To assess the reanalysis quality, we extended the CMEMS validation metrics framework (Hernandez et al., 2009, 2015, 2018), which was inspired by the GODAE Ocean View initiative (now OceanPredict), by including a set of ecosystem process-based metrics (Salon et al., 2019). Drawing from the multilevel validation framework proposed by Hipsey et al. (2020), we proposed three levels of skill performance metrics applicable to 12 state variables and model fluxes depending on the availability of observations:
• Level 1: Model outputs are compared with climatological references (observational datasets or literature reviews) to quantify the model capability to reproduce basin-wide spatial gradients and mean annual values and average vertical profiles on a subbasin scale (i.e., based on GODAE Class 1 metrics);
• Level 2: Model outputs are compared with observations at the same time and locations (match-ups) to quantify the model capability to reproduce the observed spatial-temporal variability due to mesoscale and high-temporal dynamics (i.e., based on GODAE Class4 metrics; Hernandez et al., 2018);
• Level 3: The model capability is evaluated to reproduce key biogeochemical emergent properties using specific process-based metrics and BGC-Argo data (Salon et al., 2019; Feudale et al., 2021). The metrics for nutrient vertical dynamics include the nitracline depth computed as the depth at which the nitrate concentration reaches 2 mmol/m3 (NITRCL). The metrics for the system productivity include the chlorophyll concentration and depth of the winter bloom layer (WBL), the maximum chlorophyll concentration, and depth of the deep chlorophyll maximum (DCM), and the depth of the subsurface oxygen maximum (OXYMAX).
Most Level 1 and 2 metrics are spatially evaluated for 16 Mediterranean sea subbasins (Figure 1), in the open sea region (defined as the area with a depth greater than 200 m), and for the full water column in selected layers, i.e., 0–10, 10–30 m (for certain metrics these layers are merged into a single layer, namely, 0–30 m), 30–60, 60–100, 100–150, 150–300, 300–600, and 600–1,000 m. In the coastal areas, the reanalysis accuracy can be assessed only for surface chlorophyll using the CMEMS satellite product and for other variables and a few subbasins according to in situ data availability. The 16 subbasins synthesize the heterogeneity in the Mediterranean Sea into homogeneous areas, considering previous bioregionalization analyses (D’Ortenzio and Ribera d’Alcalà, 2009; Ayata et al., 2018; Di Biagio et al., 2020; El Hourany et al., 2021; Novi et al., 2021).
The skill performance metrics include the bias, root mean square of the differences between the model output and observations (RMSD). Even if other more robust and non-parametric skill metrics and diagrams (Jolliff et al., 2009; Stow et al., 2009) could be preferable for certain variables (e.g., variables not normally distributed), we preferred to adopt the same skill metrics (i.e., applying the CMEMS validation standard; Hernandez et al., 2018) for all variables and validation levels to enhance the comparability and communicability of the results.
The variables and their validation levels are listed in Table 2 along with a list of the reference data used. In particular, the EMODnet data collections (Buga et al., 2018) integrated with additional oceanographic cruises (references in Cossarini et al., 2015a; Lazzari et al., 2016), hereinafter referred to as EMODnet_int, include 12,257 observations for nitrate, 17,323 observations for phosphate, 104,910 observations for dissolved oxygen, and approximately 4,000 observations for the DIC and alkalinity covering the 1999–2016 period. The CMEMS ocean color product (Colella et al., 2021) comprises daily L3 chlorophyll maps from 1999 to 2019, whereas the surface ocean CO2 Atlas Database (SOCAT) dataset (Bakker et al., 2016) includes 6,500 surface pCO2 observations over the 1998–2018 period.
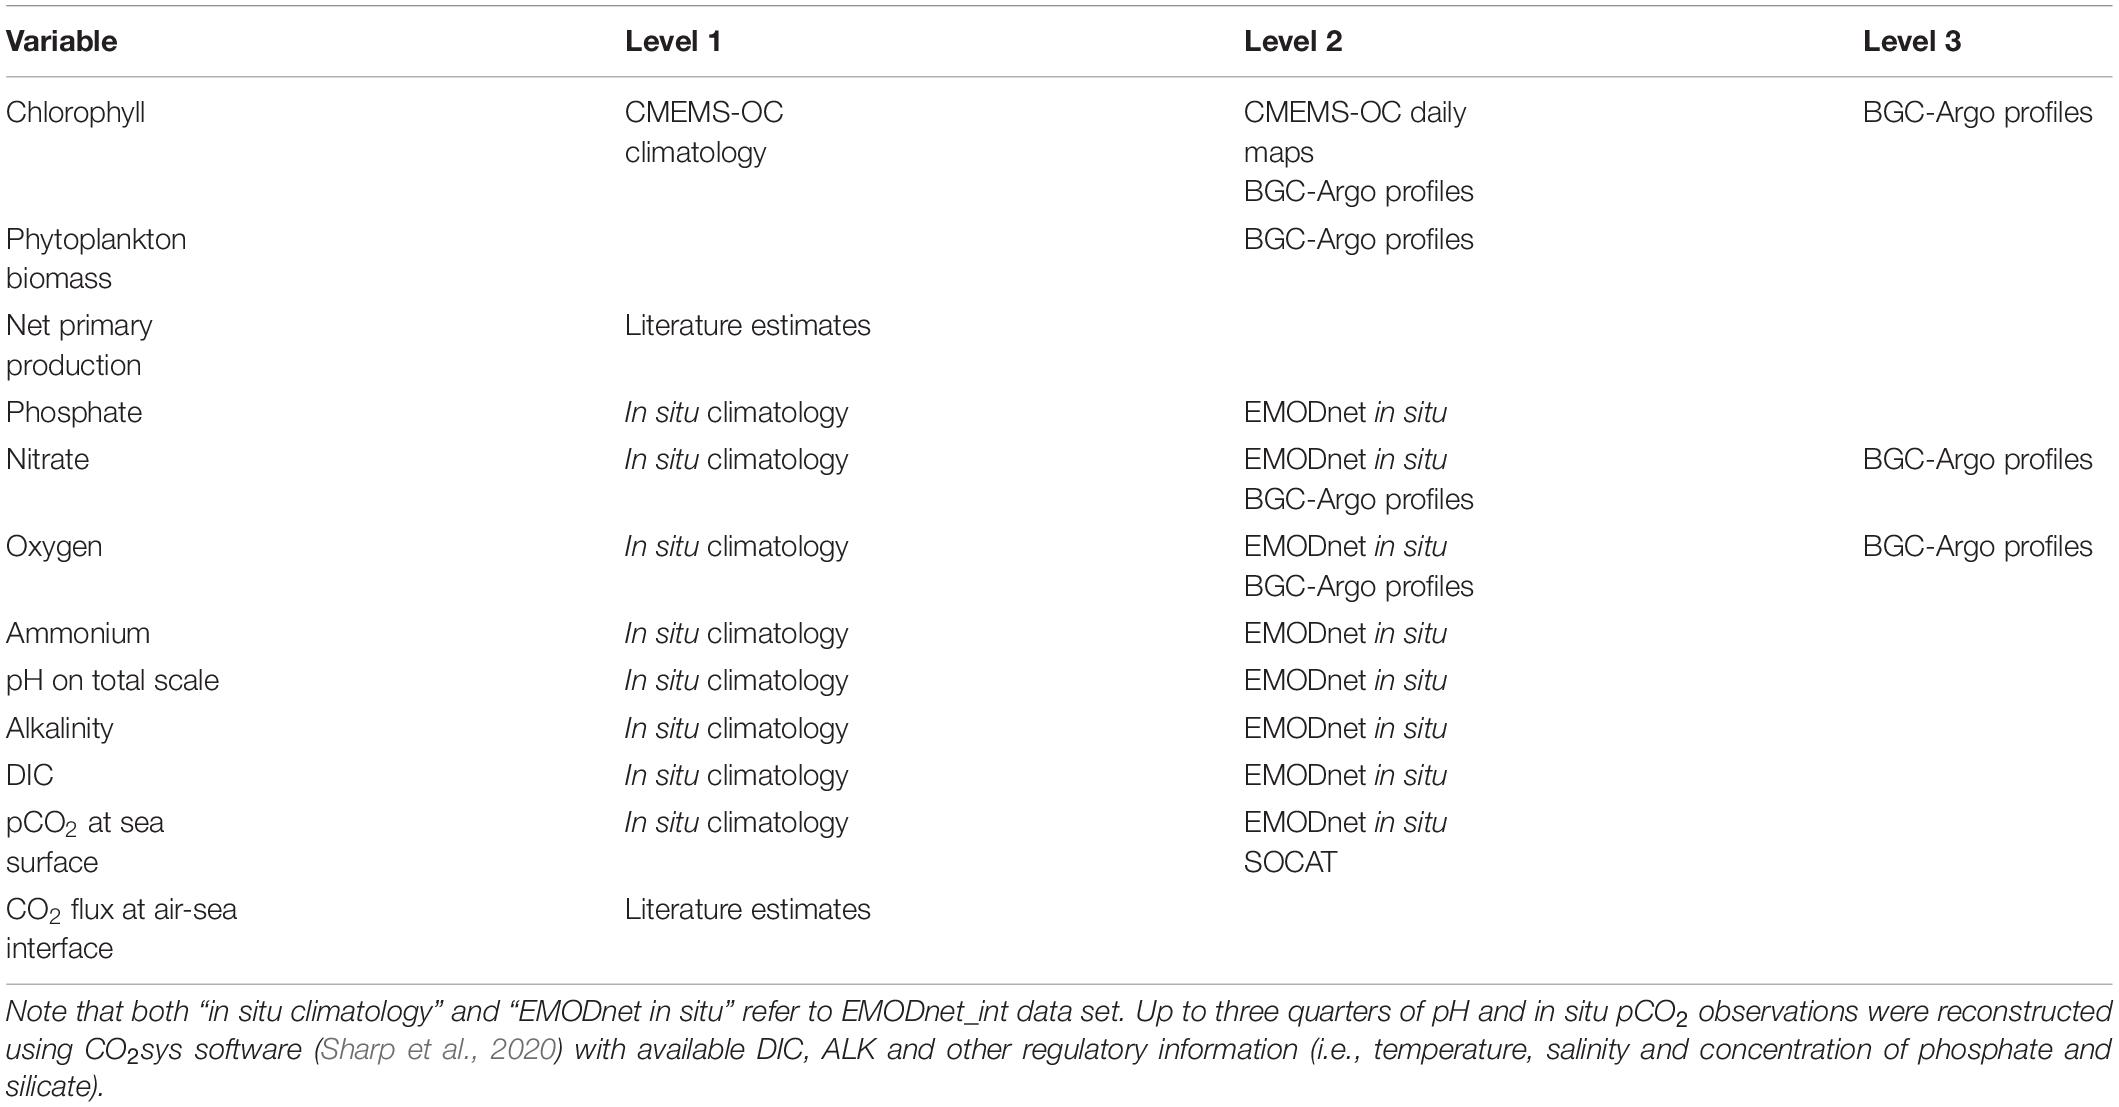
Table 2. Reference datasets used for the 3-level validation.
Regarding the ocean color dataset, since assimilation was performed once a week, the above skill performance computation was performed before the surface chlorophyll maps were assimilated. Hence, this dataset could be considered a quasi-independent dataset.
Finally, a quality-checked dataset of BGC-Argo float profiles obtained from Coriolis/Ifremer (Thierry et al., 2018; Argo, 2021) was provided stemming from a number of chlorophyll (53), bbp700 (54), oxygen (53), and nitrate (23) float sensors for the 2014–2019 period. The bbp700 data were converted into carbon biomass data with the relationship proposed by Bellacicco et al. (2019).
Net primary production (NPP) and flux of CO2 across the air-sea interface validation were based on estimates published in Bosc et al. (2004); Colella (2006), Siokou-Frangou et al. (2010), and Lazzari et al. (2012) in regard to the former process and D’Ortenzio et al. (2008); Melaku Canu et al. (2015), and von Schuckmann et al. (2018) regarding the latter process. In the “Results” section, we present the different validation levels for the selected variables and provide a synthesis of representative normalized skill indicators for all variables, layers, and subbasins. However, to refine uncertainty error estimates at the local scale (e.g., error maps, where available), complementary information is provided in the Quality Information Document contained in the CMEMS catalog (Teruzzi et al., 2021).
Statistical Methods
The reanalysis results were analyzed to estimate different scales of temporal variability, including the overall average, range of the seasonal cycle (difference between the minimum and maximum monthly average values), overall temporal variability (standard deviation of the time series), interannual variability (standard deviation of the annual averages), and trend slope (C-1 method by removing fixed seasonal cycles; Vantrepotte and Mélin, 2009). The significance of the trend slope was assessed with the t-test at a p-level of 0.025.
Results
Reanalysis Validation
The next three sections (Level 1 Validation to Level 3 Validation) illustrate the application of the three validation levels, thereby providing examples of the comparison between the observations and model results. Although these three sections illustrate the accuracy of the model in terms of RMSD and bias, thus revealing the different spatial and temporal comparison scales, section “Synthesis of the Reanalysis Validation” presents an overall synthesis of the accuracy of all variables and levels using normalized metrics, which allows us to assess the reanalysis quality against a common reference (i.e., the observed variability in each variable at the different levels).
Among the 12 variables of the published reanalysis dataset, chlorophyll, nitrate, and oxygen were the only variables covering all three validation levels, basically due to the large amount of data recently made available in BGC-Argo float profiles. BGC-Argo data were also considered to validate the phytoplankton biomass, but only at Level 2. Phosphate, ammonium, and carbonate system variables (pH, alkalinity, DIC, and pCO2) satisfied Levels 1 and 2, basically considering data retrieved from the EMODnet_int and SOCAT repositories, whereas NPP and air-sea CO2 flux were validated at Level 1 only (Table 2).
Level 1 Validation
To illustrate the applicability of Level 1 validation, in this section we provide a quality assessment of surface chlorophyll, NPP, and alkalinity, whereas a global overview of the normalized skill indicators based on the mean annual spatial distribution is provided in section “Synthesis of the Reanalysis Validation” for 10 state variables (thus, excluding NPP and CO2 flux).
In terms of surface chlorophyll, Figure 2 shows a good agreement between the climatological maps extracted from the reanalysis and satellite datasets. The model can correctly reproduce the basin-wide zonal gradient, spatial heterogeneity at the subbasin scale, and coastal-off shore patterns in the areas most affected by terrestrial inputs (Po, Rhone, Ebro, and the Nile), external inflow into straits (Gibraltar and Dardanelles), and shallow eutrophic areas (Gulf of Gabes). The subbasin mean values, annual cycles, and interannual variability are consistent with those provided by satellite observations (not shown; please refer to Teruzzi et al., 2021).
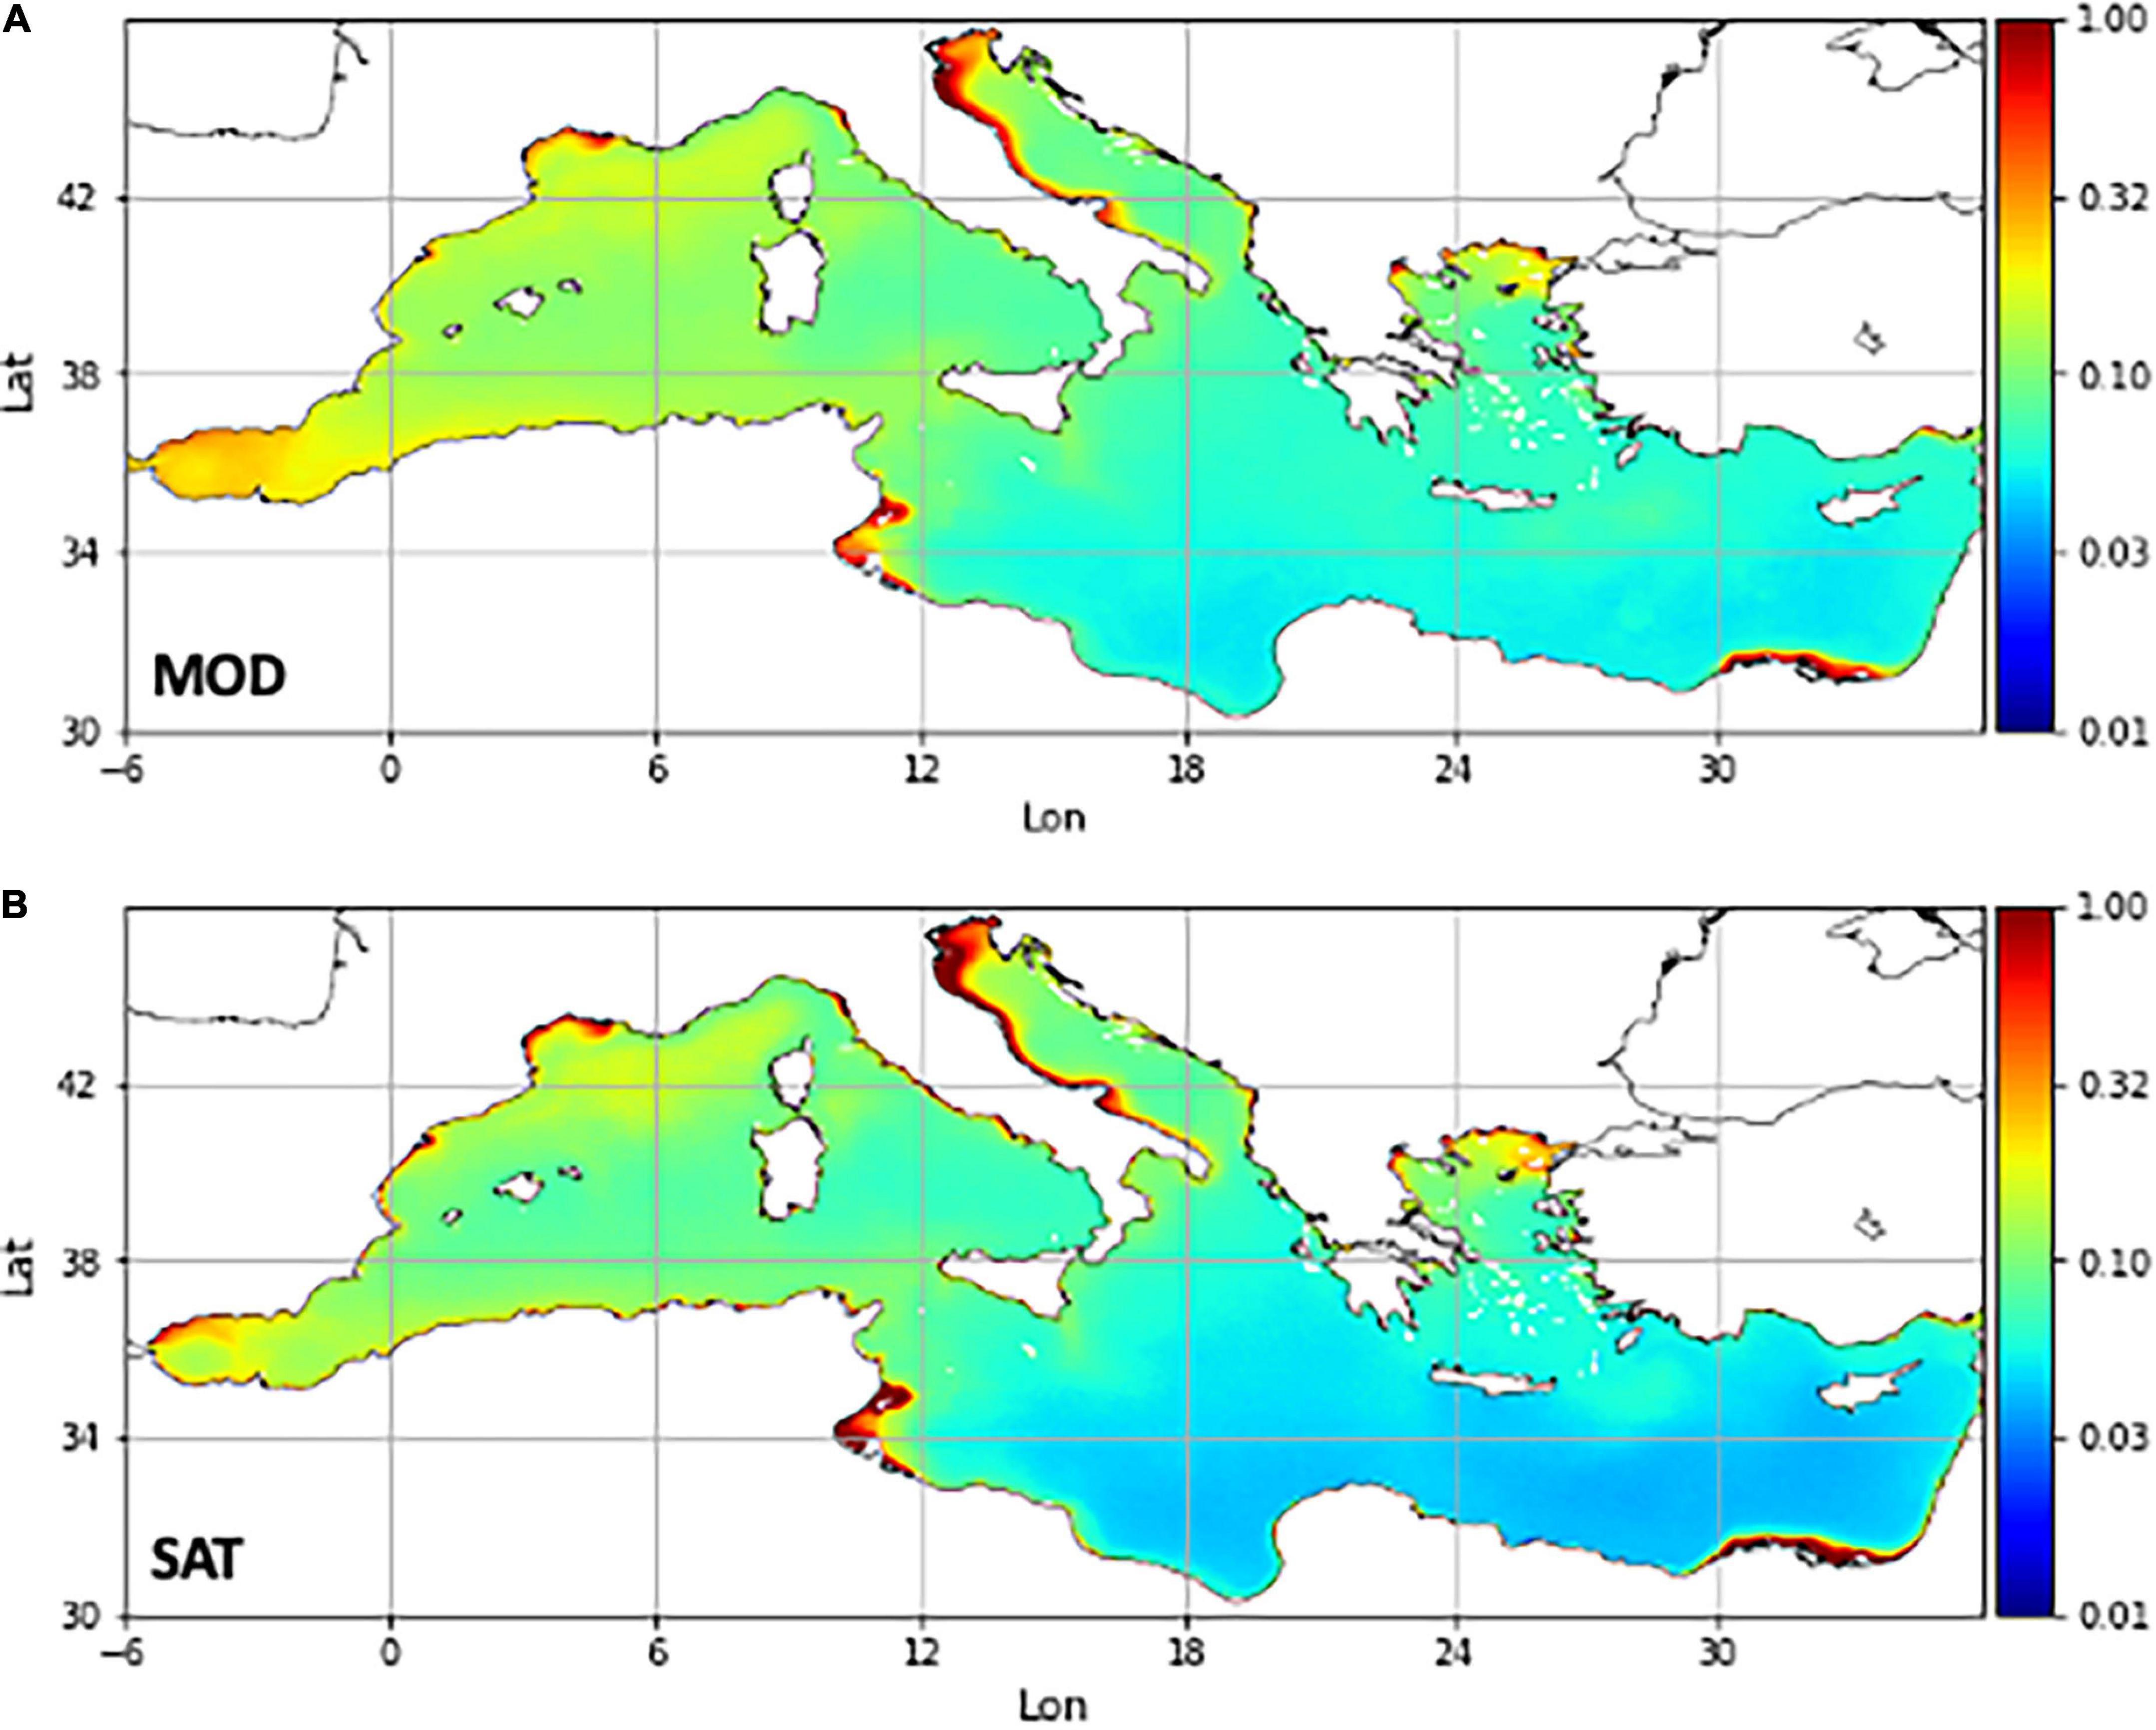
Figure 2. Averaged annual maps of surface chlorophyll (in log-scale) from reanalysis (A) and from the CMEMS-OC multi-sensor satellite data (B). The average is computed considering the period 1999–2019 over the layer 0–10 m for the reanalysis results.
Net primary production is a measure of the net uptake of carbon by phytoplankton groups (the gross primary production minus fast-release processes, e.g., respiration). The lack of extensive datasets of NPP observations constrains its quality assessment to a qualitative evaluation of the reanalysis consistency against previous estimations published in the scientific literature (Supplementary Table 1). We observe that the average NPP estimates (i.e., ranging from 100 to 170 gC/m2/y across the different subbasins, as shown in Figure 3) agree with basin-wide estimations (the maps in Figure 8 in Lazzari et al., 2012 and Figure 13 in Bosc et al., 2004) and with published values for the reference subbasins (Supplementary Table 1). The reanalysis outcomes for the Ionian and Levantine subbasins appear slightly higher than previous estimates (Supplementary Table 1).
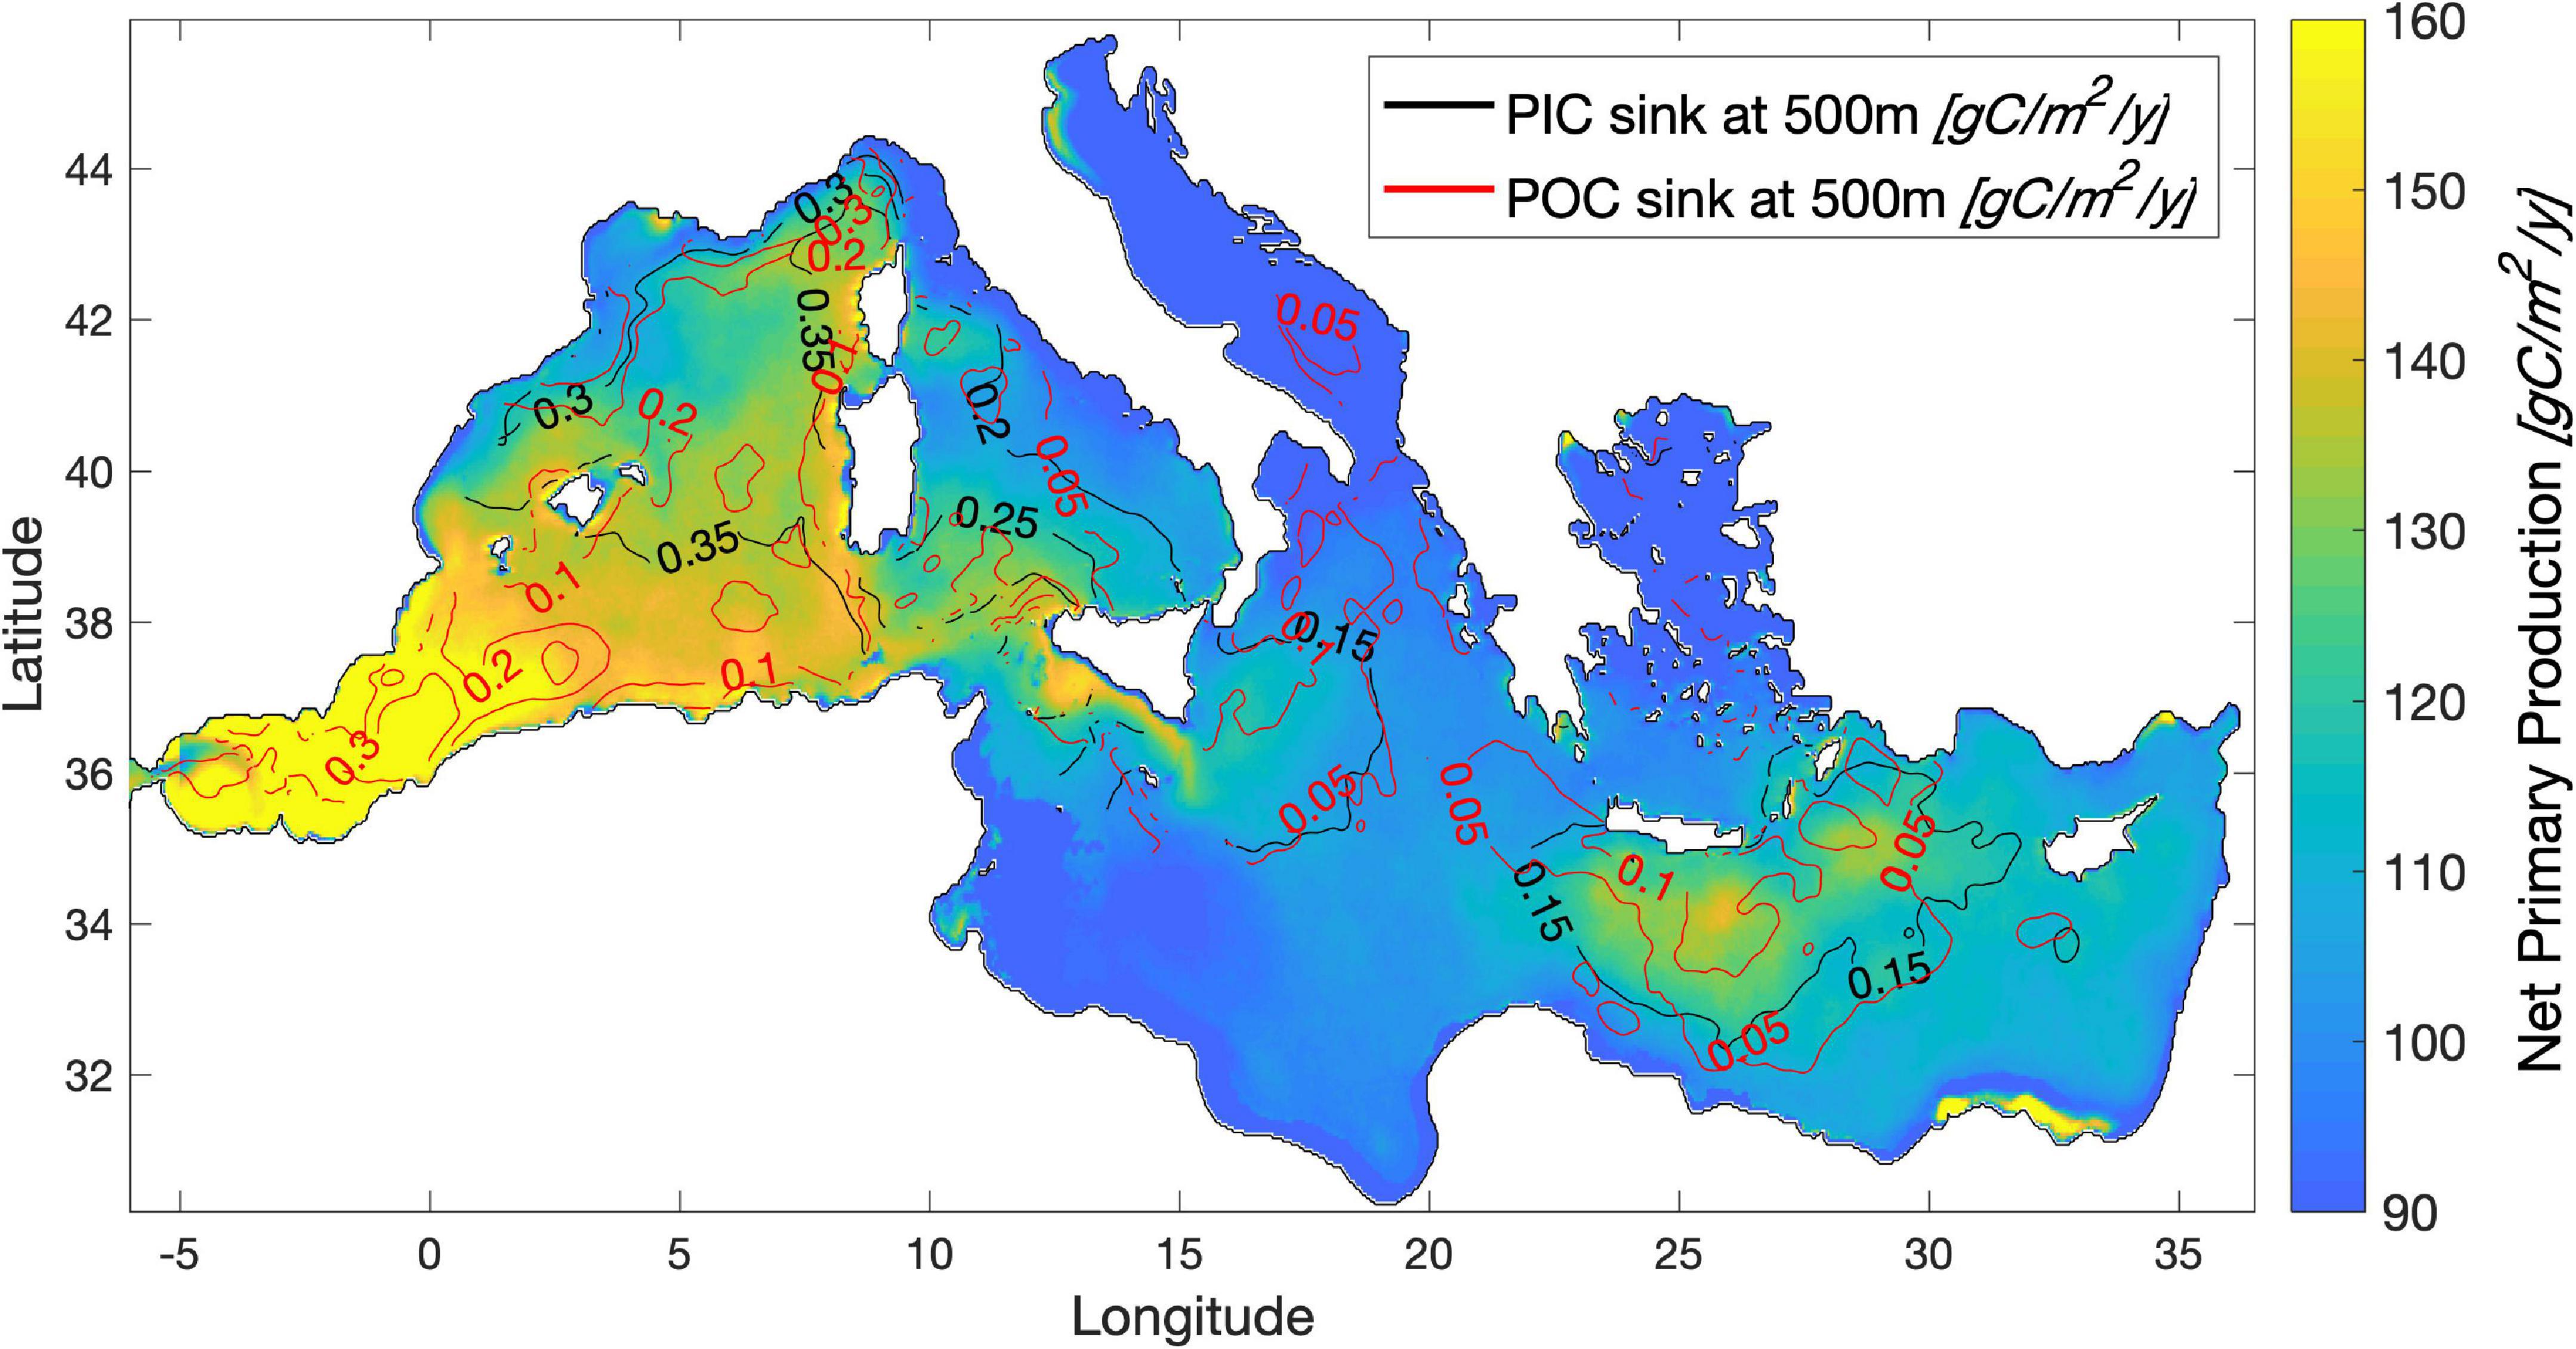
Figure 3. Map of the net primary production vertically integrated and contour of the sink fluxes at 500 m depth of POC (red contour) and PIC (black contour).
Given the sparse and uneven distribution in time and space of the reference in situ EMODnet_int data, the mean surface variables obtained in the reanalysis can be compared with climatological maps, reconstructed following the approach described in Cossarini et al. (2015a). In the case of alkalinity (Figure 4), the surface basin-wide gradient and subbasin-scale spatial variability are consistently reproduced in the reanalysis with a correlation of 0.95. Comparing the reanalysis to the EMODnet_int climatology at the basin scale, an overestimation occurs in the 0–150 m layers (between 20 and 30 μmol/kg), decreasing to less than 10 μmol/kg below 150 m, and an RMSD value of 40 μmol/kg is observed in the surface layer, decreasing to 20–30 μmol/kg below 300 m and maintaining a constant value of approximately 12 μmol/kg in the deeper layers (Supplementary Figure 1; the normalized skill indexes at all levels and subbasins are shown in Supplementary Figure 2, respectively).
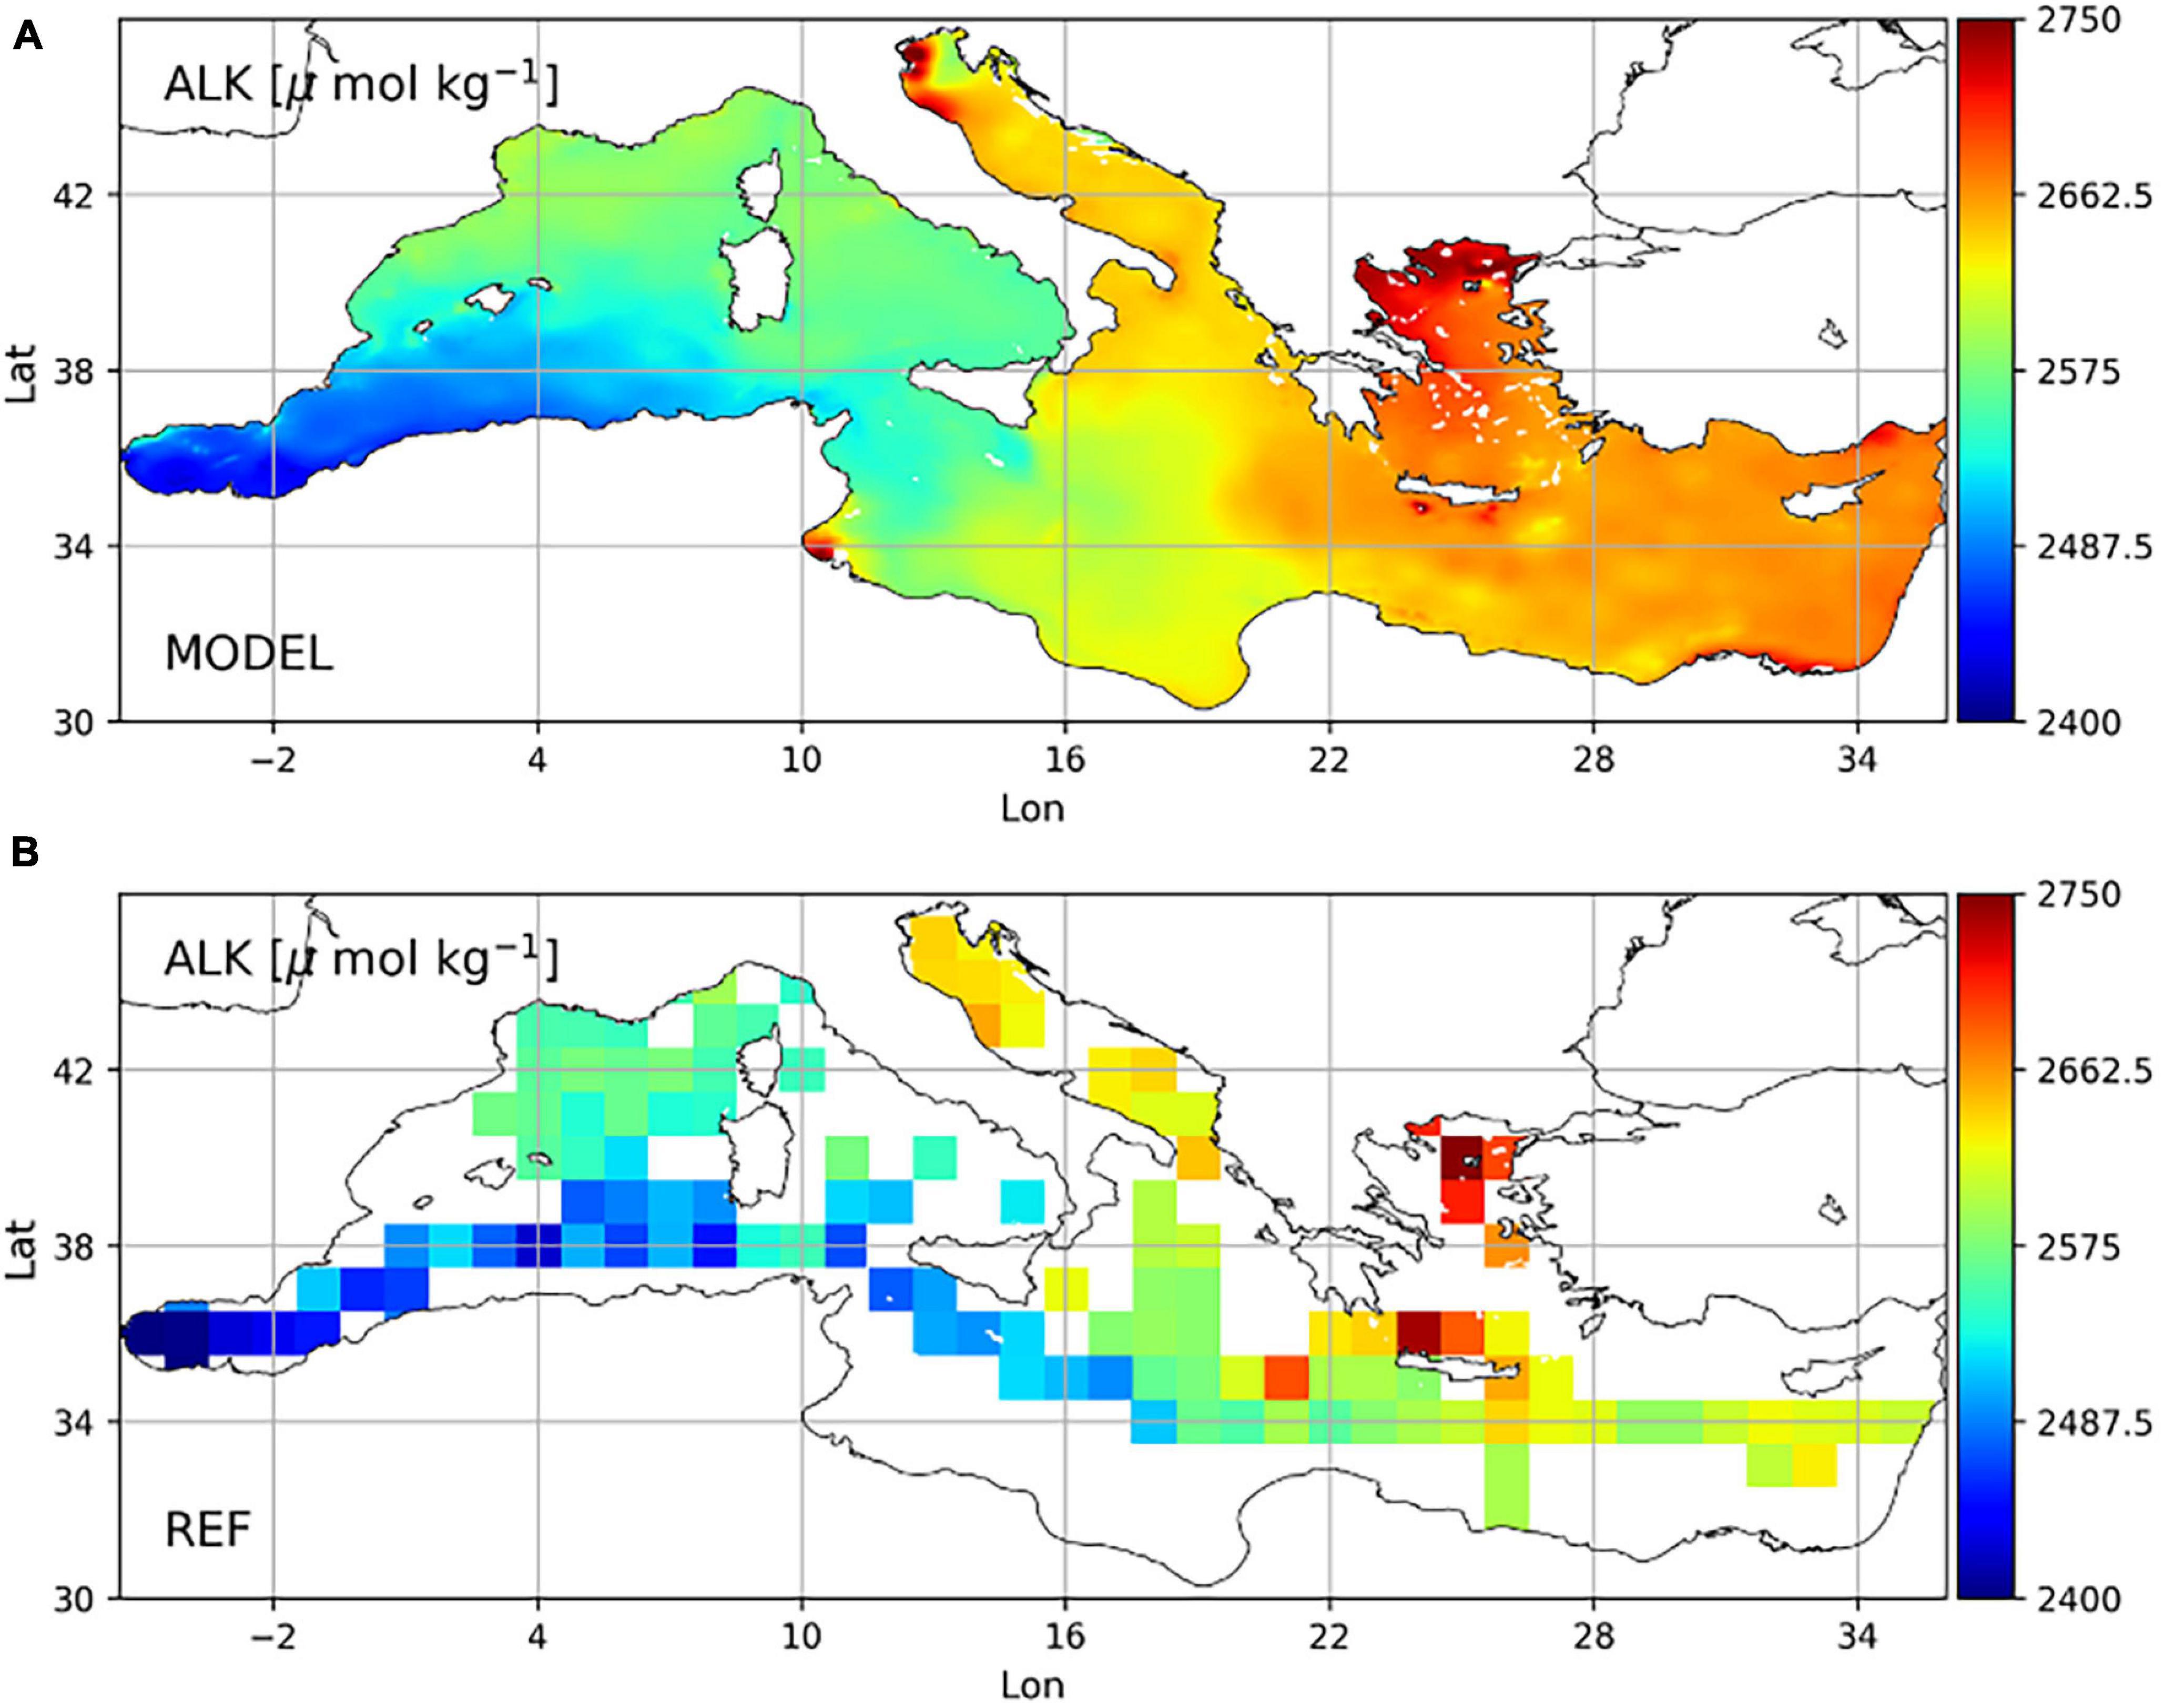
Figure 4. Mean alkalinity maps at surface (layer 0–30 m) in the period 1999–2019 produced by the reanalysis (A) and the climatology from EMODnet dataset at 1° resolution (B).
Level 2 Validation
To illustrate the applicability of Level 2 validation, we provide a quality assessment of selected variables (i.e., phosphate, nitrate, oxygen, and pH) in this section, whereas a summary of Level 2 validation of all variables is provided in section “Synthesis of the Reanalysis Validation.” All these variables were validated by matching model results with collected EMODnet_int data and in terms of nitrate and oxygen, with BGC-Argo float vertical profiles, and the skill scores are comprehensively reported in terms of RMSD at the different layers and subbasins (Figures 5G, 6).
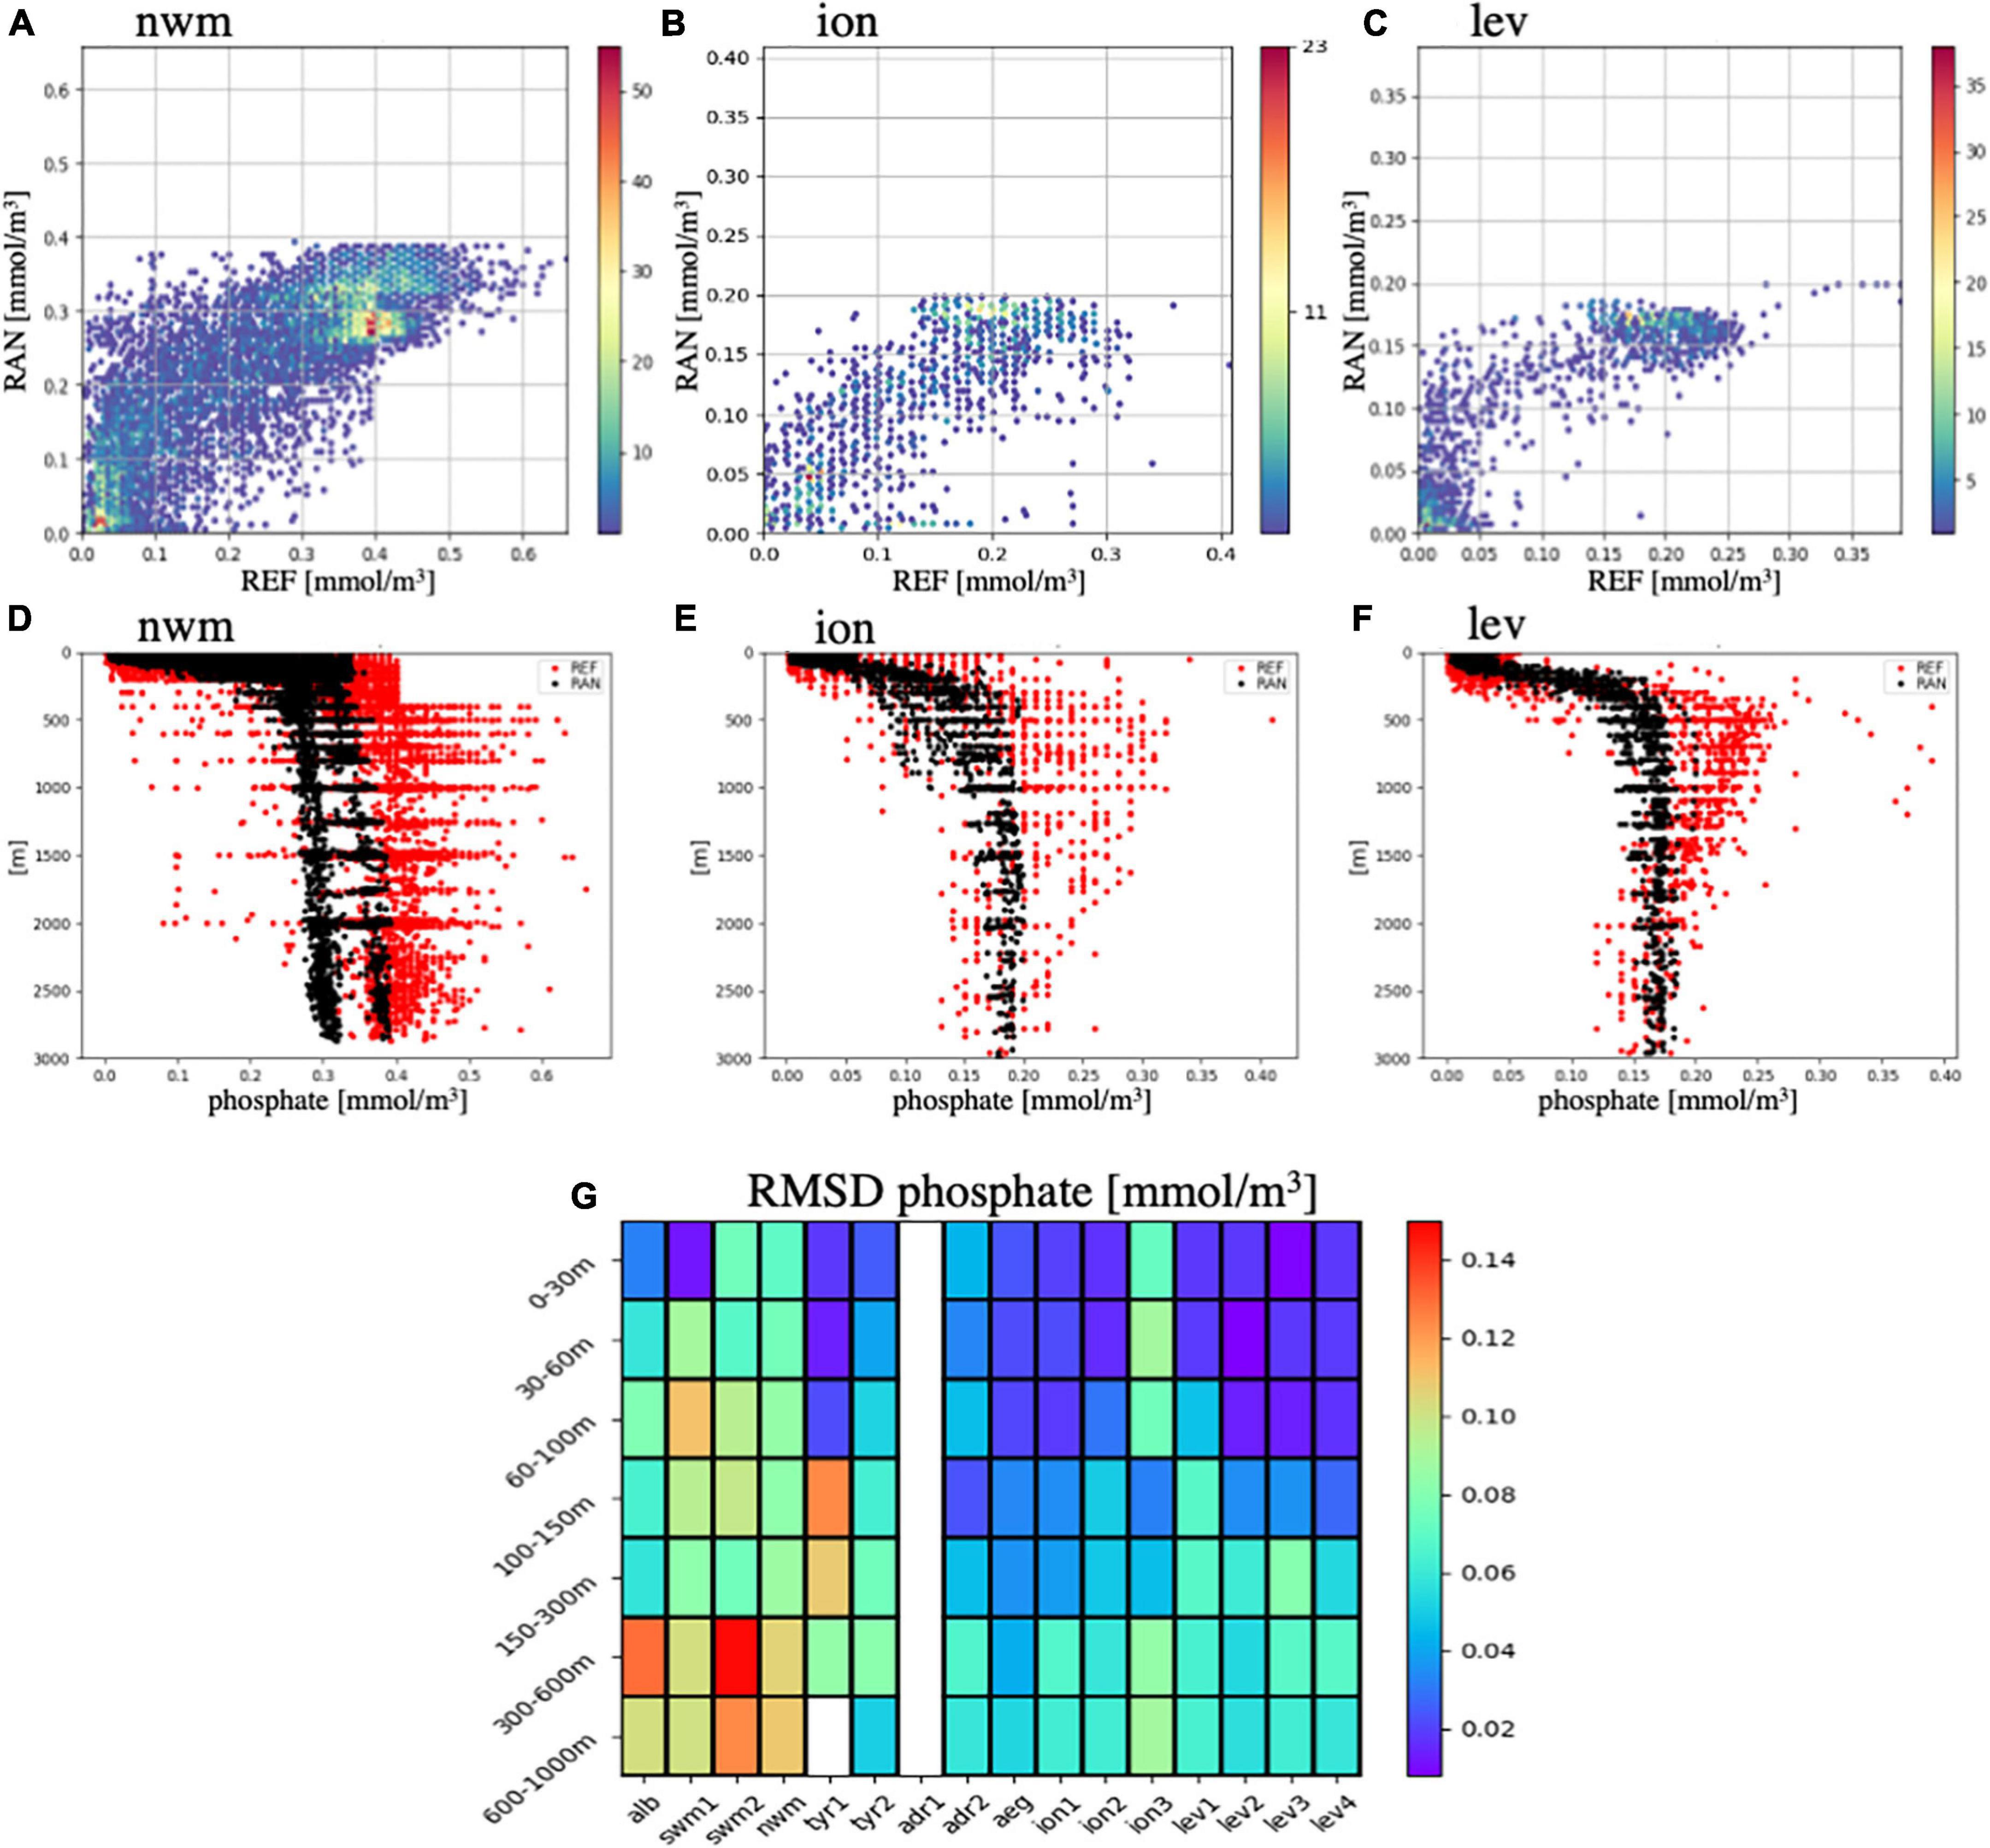
Figure 5. Level 2 validation for phosphate based on the match-ups between model results and reference EMODnet_int dataset for three sub-basins (nwm, ion and lev) in the open sea. (A–C) Density plots of model (RAN) and EMODnet_int (REF) match-ups; (D–F) vertical profiles for reanalysis (RAN, black) and reference dataset (REF, red); n. of match ups are 10,774 (nwm), 1,410 (ion) and 1623 (lev); (G) RMSD (mmol/m3) computed for selected vertical layers and for each sub-basin (white boxes correspond to data unavailability).
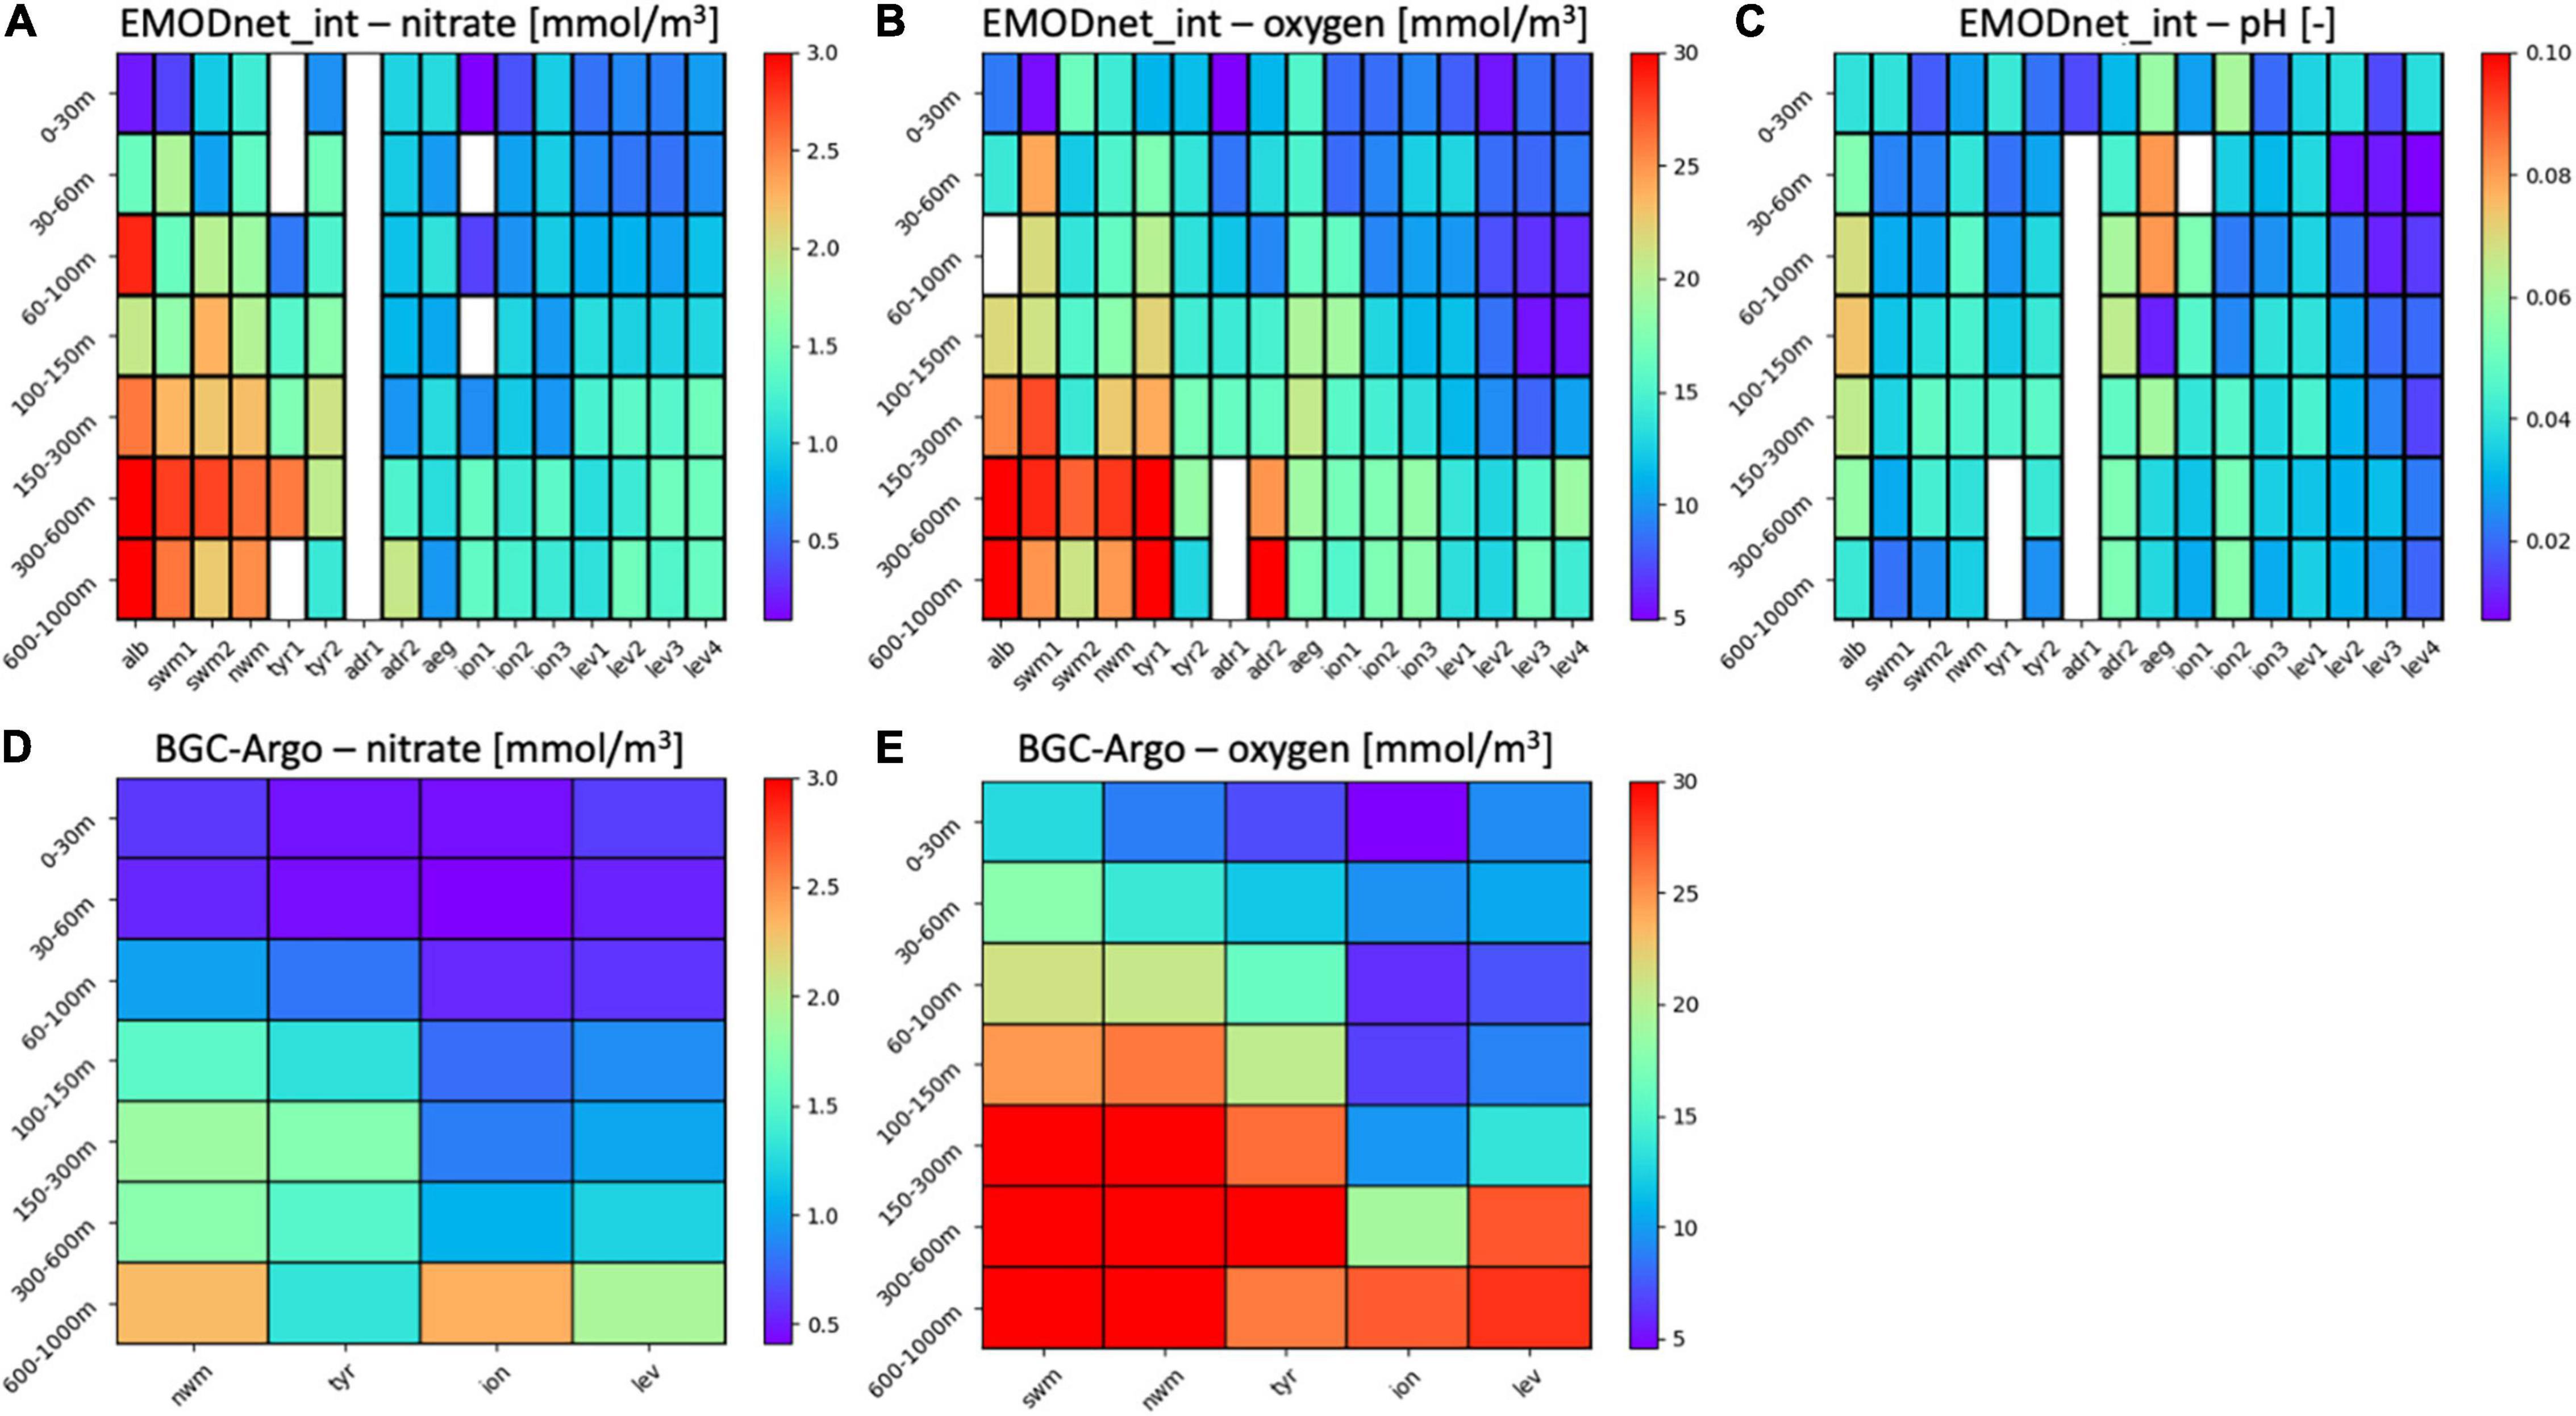
Figure 6. Validation (RMSD metric) for nitrate (A,D), oxygen (B,E), and pH (C) based on the match-ups between model results and reference data sets EMODnet_int (upper panel) and BGC-Argo (lower panel). White boxes correspond to data unavailability.
Good agreement is found both in terms of mean phosphate values and the spread (Figures 5A–C), and variability in the upper layer, whereas the reanalysis tends to underestimate phosphate over EMODnet_int in deep layers (below 500 m), especially in the western subbasins (Figures 5D–F). Quantitatively, the uncertainty, expressed as RMSD computed at the subbasin scale for the different vertical layers, varies, on an average, between 0.03 and 0.06 mmol/m3 in the 0–300 m layer, increasing to 0.08 mmol/m3 below 300 m, and the RMSD is greater in the western subbasins (Figure 5G). Generally, Level 2 uncertainty is higher than that related to the mean annual value (i.e., level 1), which ranges from 0.02 to 0.04 mmol/m3 in the 0–300 m layer and reaches 0.07 mmol/m3 below 300 m.
The nitrate skill in regard to Level 2 validation (Figure 6A) is similar to that of phosphate, namely, a very good performance in the upper layer that decreases with depth, with underestimation in the western subbasins and lower variability than the reference value. The average uncertainty, based on EMODnet_int, varies between 0.7 and 1.5 mmol/m3 in the 0–300 m layer, increasing to 1.7 mmol/m3 below 300 m. While the surface errors are similar among the subbasins, the western subbasins exhibit a higher uncertainty than do the eastern subbasins in the deep layers. Level 2 validation of nitrate was also conducted by matching the reanalysis results with BGC-Argo data, providing a similar picture but with slightly different values, namely the average RMSD value varies between 0.41 and 0.62 mmol/m3 in the upper 60-m layer, increases to 0.73 mmol/m3 in the 60–100 m layer, remains smaller than 2 mmol/m3 in the 100–600 m layer, and increases to 2 mmol/m3 in the 600–1000 m layer (Figure 6D).
The two datasets are self-consistent and robust [the EMODnet_int quality was reported by Buga et al., 2018, and the BGC-Argo quality control (QC) protocol was provided by Bittig et al., 2019] and capture different levels of variability, namely a broader range of values encompassing sparse observations in time and space over two decades in terms of EMODnet_int and a series of profiles closely located in time and space capturing mesoscale and short-term dynamics, but covering only the last 5 years in terms of BGC-Argo. Thus, by separately employing these two validation datasets, we reveal a slightly lower reanalysis uncertainty when matched with the more localized (i.e., capturing mesoscale weekly dynamics within limited areas) BGC-Argo float data than that when matched with the broader-ranging (in value terms) and more dispersed (in terms of its spatial and temporal coverage) EMODnet_int dataset.
The amount of EMODnet_int oxygen data is one order of magnitude larger than that of nutrient data, which supports a more reliable uncertainty estimation. While the surface layer is very well simulated (Figures 6B,E), the reanalysis tends to overestimate the oxygen observations, with a positive bias of approximately 20 mmol/m3 below 300–400 m (Supplementary Figure 1). Small errors in oxygen at the surface (e.g., RMSD values between 5 and 13 mmol/m3; Figure 6E) confirm that the high-temporal resolution temperature dynamics at the mesoscale (Escudier et al., 2021), which drive saturation and biological production, are generally suitably reproduced. In the deep layers, the reanalysis does not fully capture the oxygen dynamics due to the observed bias, and the uncertainty increases in the mesopelagic zone of the water column, specifically in the western subbasins, where it overcomes 30 mmol/m3. The oxygen from BGC-Argo floats indicates a reanalysis skill assessment similar to the EMODnet_int-based metrics (Figure 6B), with the RMSD values generally increasing with depth, particularly in the western subbasins.
Qualitatively, the reanalysis correctly reproduces the observed pH values and the spatial (both horizontal and vertical) variability (Supplementary Figure 1). Quantitatively, the uncertainty in reproducing high-temporal frequency observations, expressed as RMSD, remains relatively constant along the water column, varying between 0.01 and 0.04 pH units, with high RMSD values in the Alboran Sea and marginal seas (Adriatic and Aegean, as shown in Figure 6C). In addition to the model inaccuracy linked to specific and local conditions in marginal seas, the model-observation mismatches are possibly related to the inaccuracy of the reconstruction method of in situ pH observations based on other carbonate system variables, which can reach as high as 0.005 pH units (Álvarez et al., 2014).
Level 3 Validation
The increasing availability of BGC-Argo data has allowed us to design fit-for-purpose metrics that quantify the model skill in reproducing specific emergent properties of biogeochemical dynamics and their seasonal variability (please refer to Salon et al., 2019; Feudale et al., 2021; Mignot et al., 2021).
Given the general quasi-stationary trajectory of BGC-Argo floats in the Mediterranean Sea (e.g., the red points in the upper panel of Figure 7), qualitative comparison of the temporal evolution of model-float vertical profiles of nitrate and oxygen (Figure 7, second and third rows; for chlorophyll, please refer to the example in Salon et al., 2019) provides an outlook capturing seasonal and monthly variations due to local physical (e.g., vertical mixing) and biological (e.g., phytoplankton bloom) dynamics.
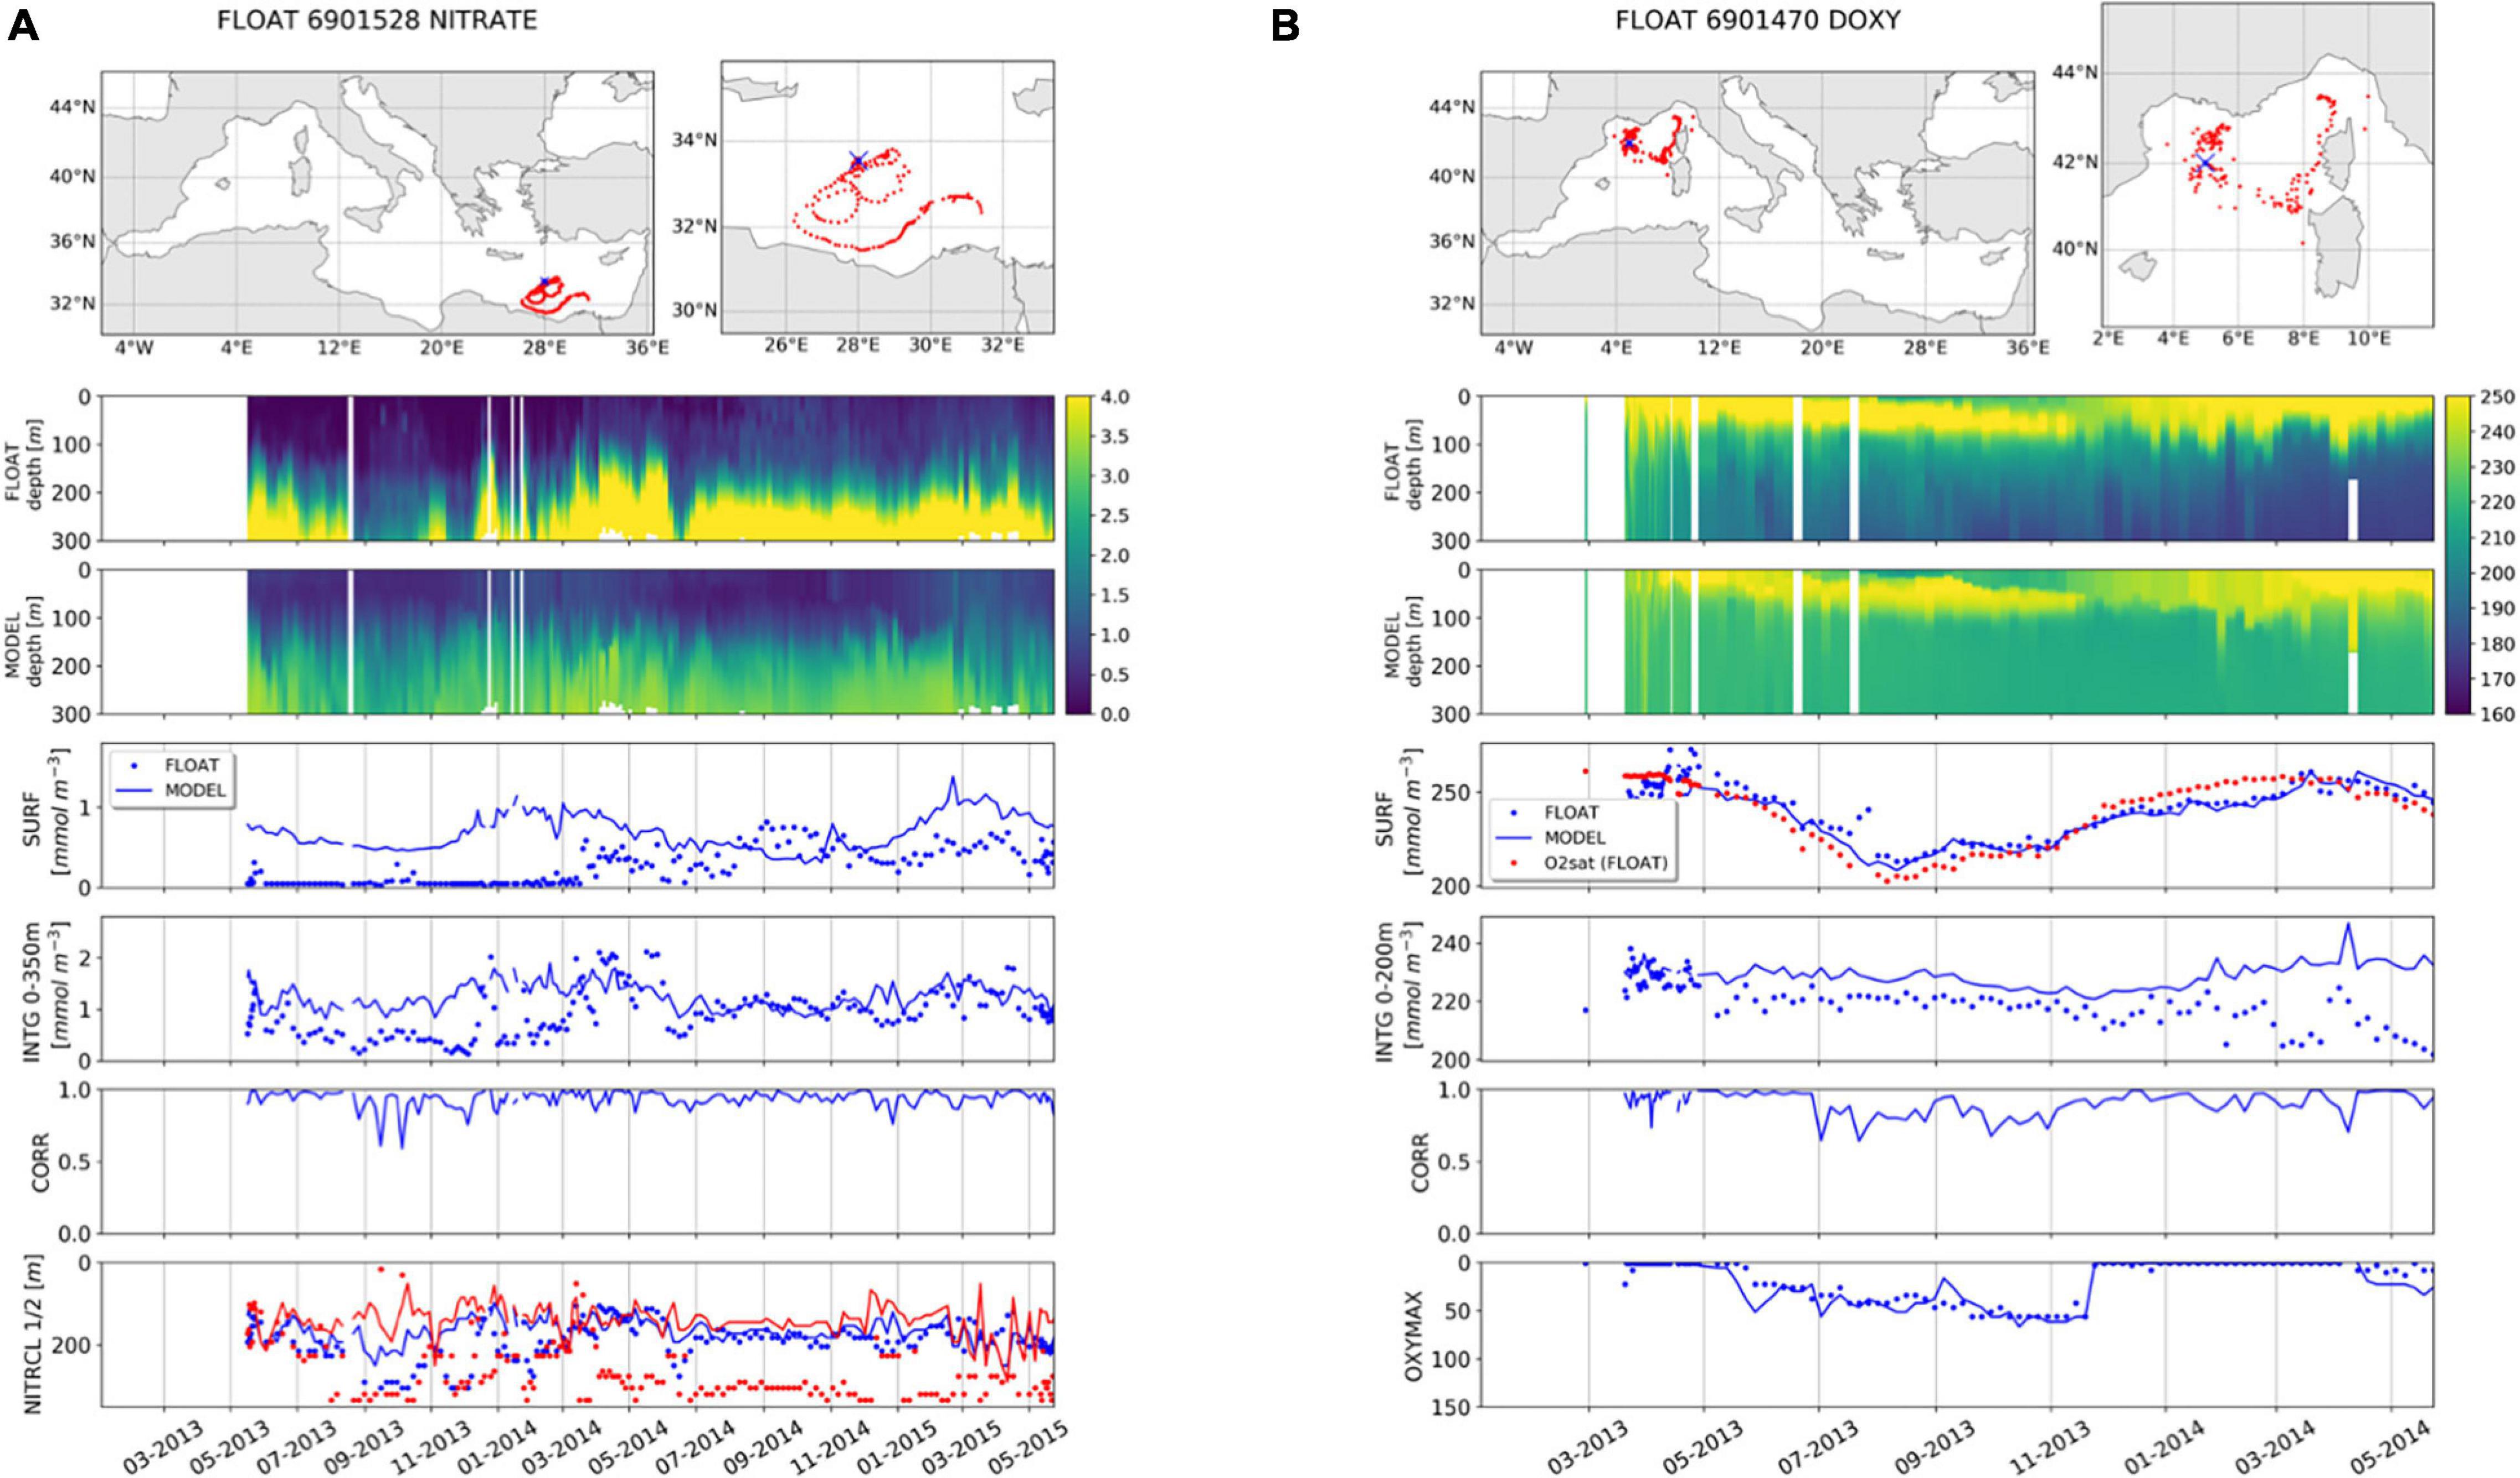
Figure 7. Examples of level-3 validation for nitrate (A) and oxygen (B) based on the comparison between BGC-Argo floats and model. From top to bottom, panels are: trajectory of the BGC-Argo float (red dots) with deployment position (blue cross); Hovmöller diagrams of nitrate (mmol/m3) and oxygen (mmol/m3) concentration from float data (2nd row) and model outputs (3rd row) matched-up with float position for the period of float life; selected skill indexes for model (solid line) and float data (dots): surface nitrate and oxygen (SURF, 4th row; with oxygen saturation, red dots), vertical average of nitrate in the 0–350 m layer and of oxygen in the 0–200 m layer (INTG, 5th row), correlation between vertical profiles (CORR, 6th row), and depth of the nitracline and of the oxygen maximum (NITRCL, blue; OXYMAX, 7th row).
In addition to the quantification of model-observation mismatches with classical metrics, we computed different quality assessment metrics to assess the model capability to reproduce emergent characteristics of the vertical structure, as defined in section “Validation Framework.” Examples of emergent vertical characteristic metrics for nitrate (the nitracline depth; NITRCL) and oxygen (the depth of the oxygen maximum; OXYMAX) are reported in the lower panels of Figures 7A,B. With regard to the specific nitrate float (Figure 7A), we observed that the model tends to generate a lower nitrate vertical gradient (the model surface values are overestimated and the values below 200 m are underestimated; upper panels), whereas the model skill increases after March 2014, as further verified by the improvement in the integrated value and correlation (Figure 7A, middle panels). Despite the surface bias, the model attains a good skill in reproducing the nitracline depth (NITRCL in Figure 7A) during the whole period, indicating how the interaction between vertical physical and biological dynamics, which determines the profile shape separating nutrient-rich deep waters from depleted surface waters, is suitably simulated by the model.
The epipelagic seasonal dynamics of the oxygen profile measured by floats (Figure 7B) are characterized by a spring surface maximum, summer surface deoxygenation and penetration into the euphotic layer, and winter mixing. These dynamics are qualitatively well represented by the model, with a simulated oxygen maximum depth during the penetration period but with systematically overestimated values below the euphotic layer. The model performs very well in reproducing surface values, mostly driven by saturation (the red dots in the third row of Figure 7B), while integrated values are overestimated by approximately 10 mmol/m3 (INTG 0_200m; the fourth row of Figure 7B). Interestingly, the divergent evolution of the 0–200 m integrated oxygen values after January 2014 suggests either a possible model flaw or a drift in BGC-Argo float data considering that quality assessment of BGC-Argo variables is continuously progressing (Bittig et al., 2019).
Once computed for all available BGC-Argo float data and comprehensively captured with RMSD in the selected subbasins, the metrics quantify the model skill in the reproduction of the seasonal dynamics of the emergent properties of biogeochemical processes. The reanalysis reproduces the depth of the DCM (i.e., with an uncertainty of approximately 15–20 m, Table 3), which varies between 60 m (western basins) and 120 m (eastern basins, Lavigne et al., 2015). Slightly higher uncertainty is computed for the modeled depth of the WBL, at approximately 30 m, while the intensity of chlorophyll peak values (CHLMAX and winter maximum values) is reproduced with an uncertainty lower than 0.2 mg/m3. The uncertainty increases to 0.3 and 0.5 mg/m3 in the south-western Mediterranean (swm) and north-western Mediterranean (nwm), respectively, with the latter subbasin already addressed by Salon et al. (2019), which is basically related to the MedBFM limits in reproducing local dynamics under stratified conditions. Then, Table 3 reports that the RMSD value for the nitracline depth (NITRCL) varies between 30 and 40 m, whereas the accuracy of the depth of the oxygen maximum is on average 25 m, which is a reasonably good result considering the dispersion in these ecosystem features (refer to Figure 7 and Supplementary Figure 1) resulting from the interaction between vertical transport and mixing and biological processes.
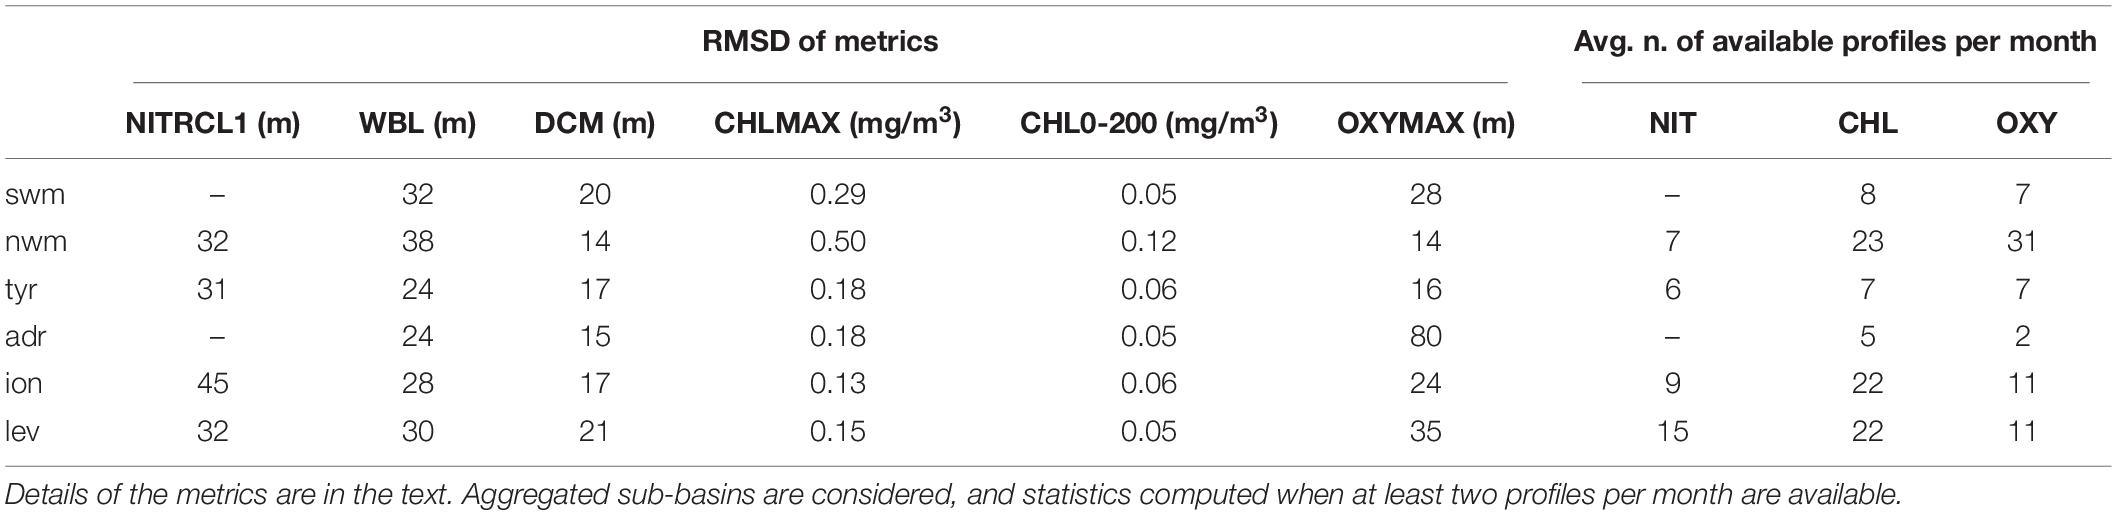
Table 3. Metrics computed for the level-3 validation.
Synthesis of the Reanalysis Validation
To provide an overall view of the reanalysis uncertainty at the different levels of validation, we derived two normalized indicators for the model variables from the metrics presented in the previous sections, including a cost function, defined as the ratio between the absolute bias and the standard deviation of the observations σO (qualified as very good if lower than 1, good if ranging from 1 to 2, reasonable if ranging from 2 to 5, and poor if higher than 5; Moll, 2000), and RMSD normalized with σO, which should ideally be lower than 1 when the model predictions of individual observations are better than the average observation values (i.e., conceptually the model efficiency index defined in Stow et al., 2009).
Figure 8 shows a synthesis of validation Levels 1 and 2, mainly considering the surface layer of the Mediterranean Sea. The indicators extended to all subbasins and vertical layers are shown in Supplementary Figures 2–4. The cost function at Levels 1 and 2 is lower than 1 for all the variables in the upper layer (Figures 8A–C), thus demonstrating an overall very good quality of the reanalysis in reproducing values and variability linked to basin-wide dynamics. The cost function values remain well below 1 in all layers and deteriorate only in the two deepest layers (Supplementary Figure 2, top). Among the subbasins, the Alboran Sea (alb), southwestern Mediterranean Sea (swm1), northern Tyrrhenian Sea (tyr1), and eastern Levantine (lev4) exhibit at least four variables for which the cost function value exceeds 1 in certain layers (Supplementary Figure 3), e.g., the carbonate system variables in the far eastern subbasins and nutrients in the subbasins close to the Atlantic boundary, which are affected by possible systematic biases.
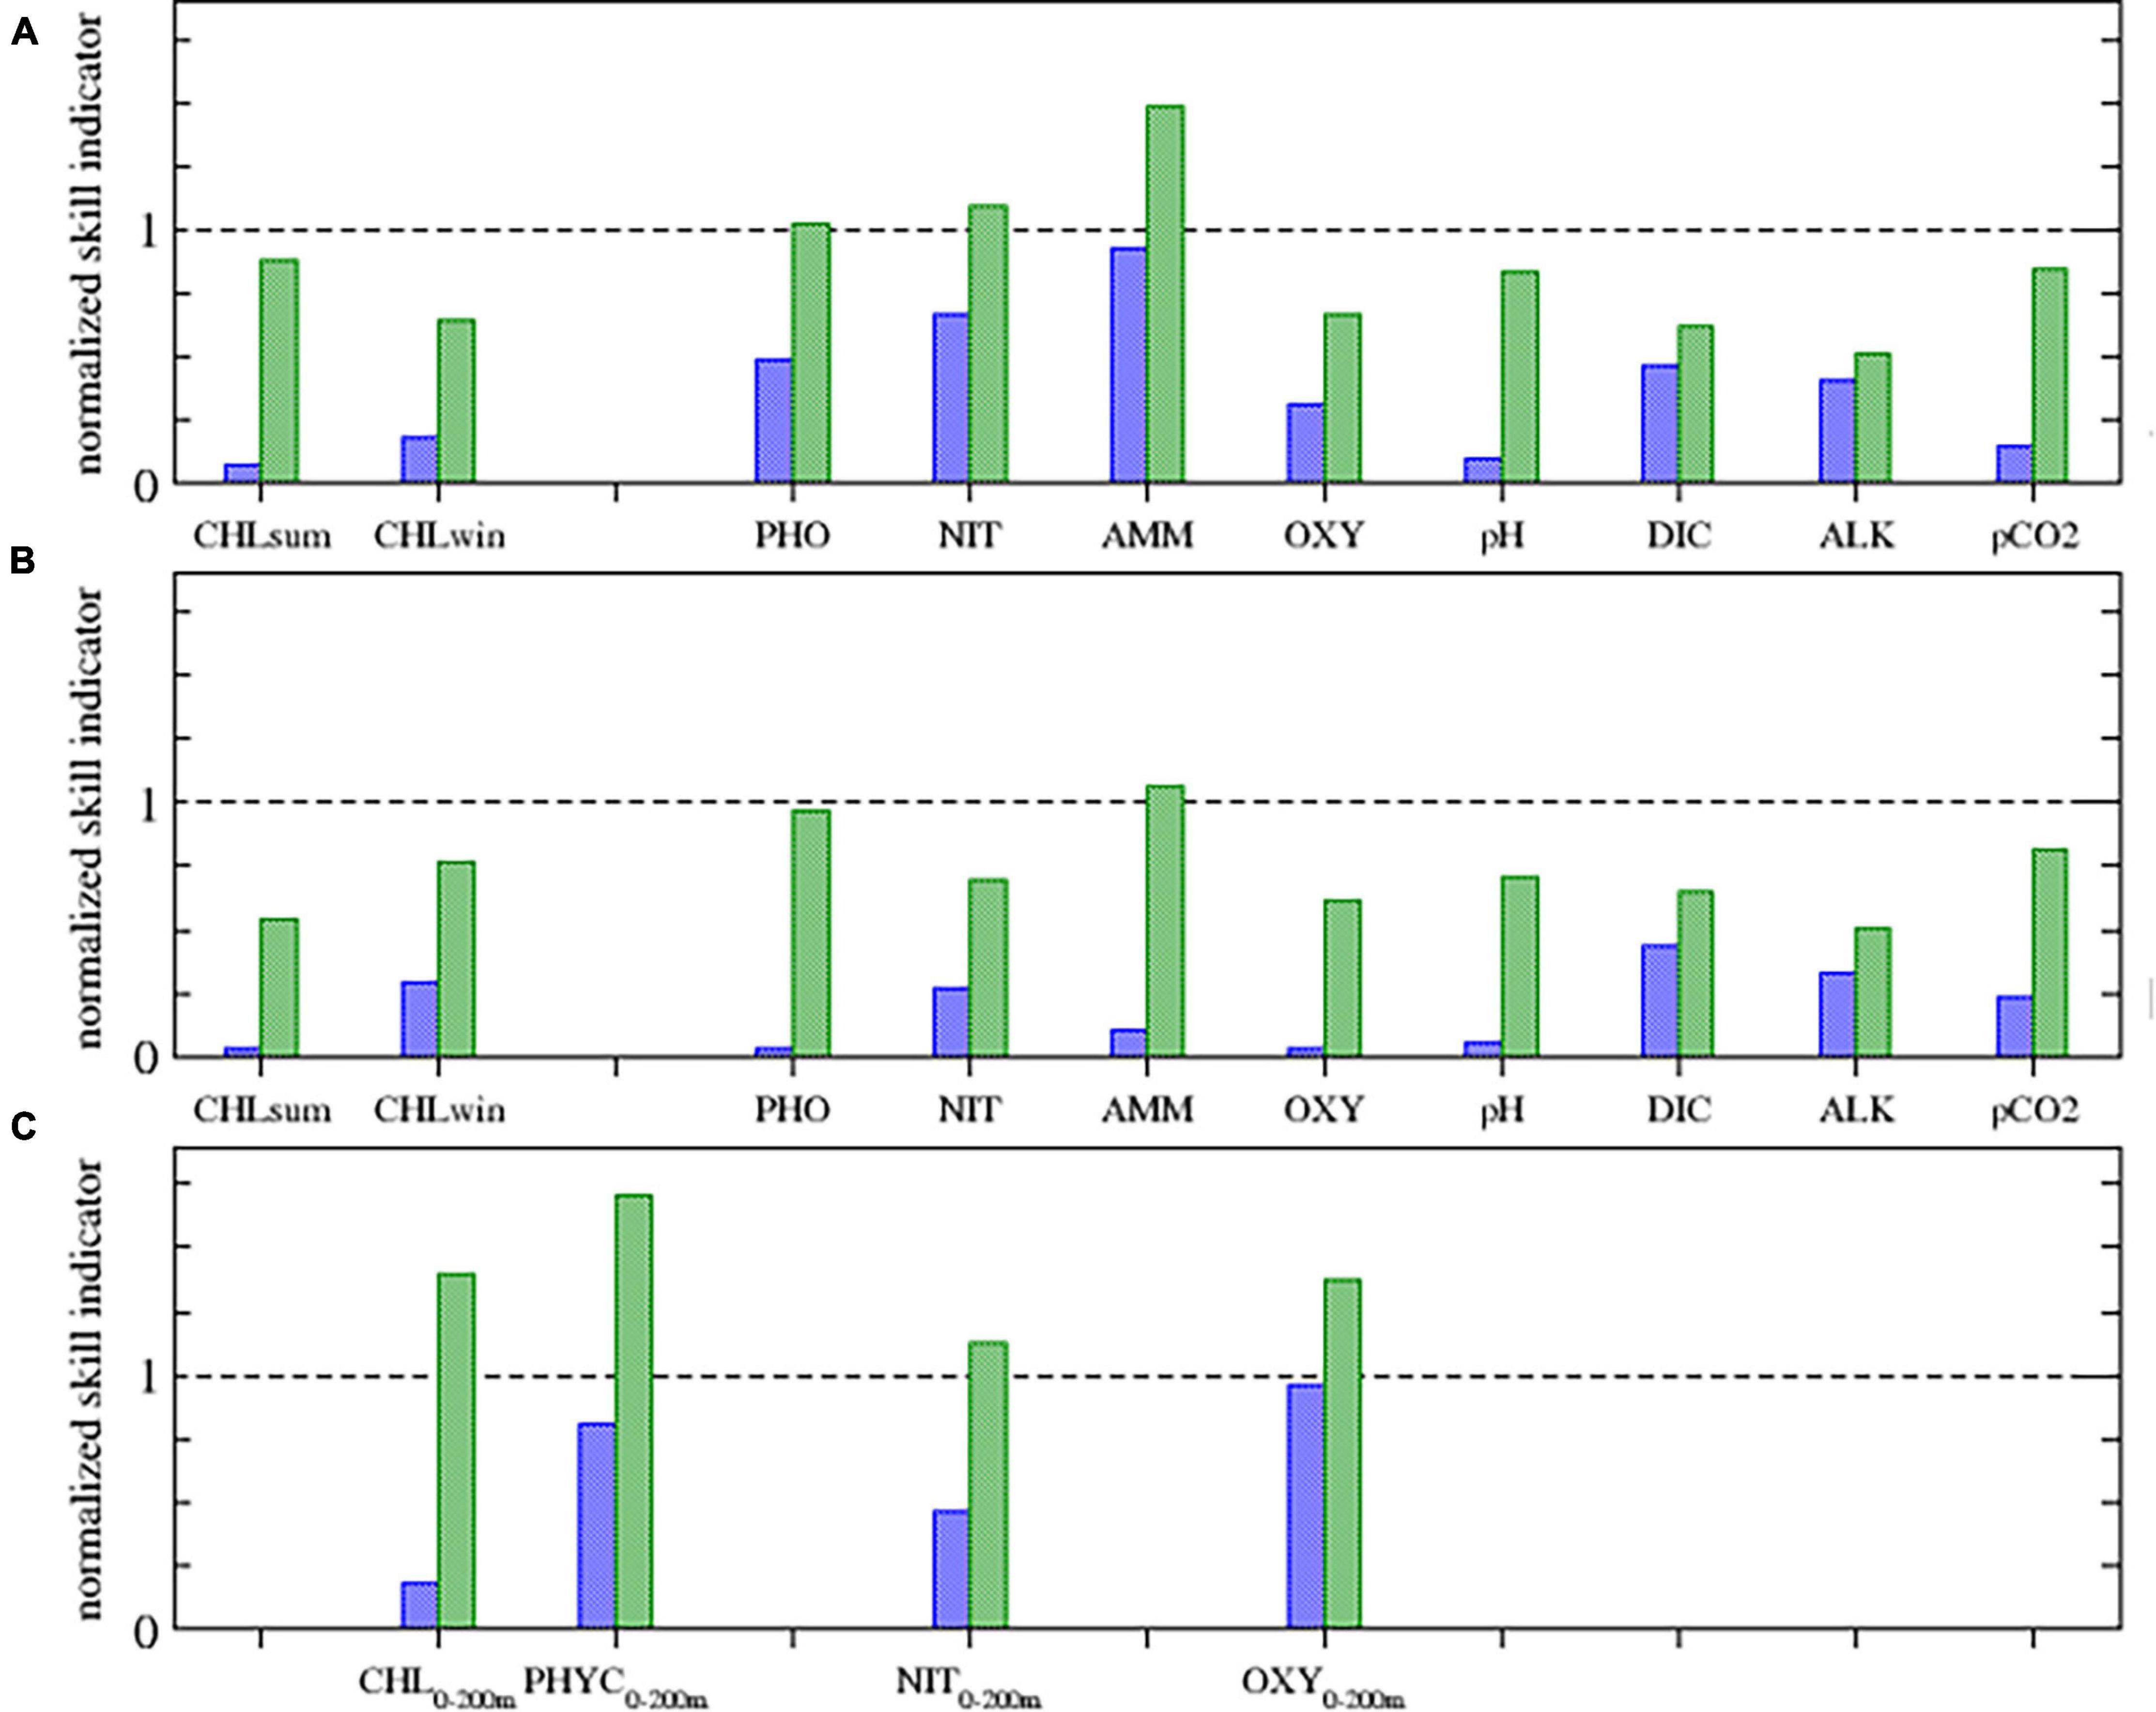
Figure 8. Synthesis of validation Level 1 and 2 for 10 reanalysis variables with related emergent properties metrics in terms of the cost function (blue) and normalized RMSD (green): (A) Level 1 computed for the whole Mediterranean Sea 10–30 m layer (surface for chlorophyll summer and winter values, and for pCO2). Level 2 computed comparing reanalysis with (B) satellite (for surface chlorophyll summer and winter values) and EMODnet_int for the whole Mediterranean Sea 0–30 m layer and with (C) BGC-Argo for chlorophyll, phytoplankton biomass, nitrate and oxygen 0–200 m averaged values.
The model also achieves an overall good skill when quantified with the normalized RMSD at both Levels 1 and 2 in the surface layer, with the exception of ammonium at Levels 1 and 2 and the average values of chlorophyll, phytoplankton biomass, and oxygen in the euphotic layer at Level 2 computed based on BGC-Argo data (Figure 8C). Considering all layers, ammonium and oxygen below 100 m exhibit values higher than 1 in more than three layers (Supplementary Figure 2, bottom). Phosphate in the upper layers and DIC and alkalinity below 150 m attain very low values of the standard deviation of the observations driving normalized RMSD values that are higher than 1 in at least two layers for each variable.
Even if less robust because of the fewer number of available observations, the normalized RMSD computed for the subbasins and layers provide useful indications of possible model flaws (Supplementary Figure 4). Nutrients in the western subbasins in the deepest layers and carbonate system variables in the most eastern subbasins are the most frequent cases with normalized RMSD values above 1. As already mentioned, ammonium is by far the least accurately modeled variable, while oxygen below 300 m attains values higher than 1 in at least 12 subbasins (Supplementary Figure 4).
Among the subbasins, the northern Tyrrhenian Sea (tyr1), which exhibits a high variability and is a transitional area (as reported in several regionalization analyses, e.g., Ayata et al., 2018; Di Biagio et al., 2020), reveals a normalized RMSD value higher than 1 for at least four variables in several layers.
Reanalysis Variabilities and Trends
Mean Spatial and Temporal Variabilities
The reanalysis provides an overall view of the average spatial and temporal variabilities in the biogeochemical state of the Mediterranean Sea over the past two decades. The spatial variability at the basin scale is computed as the range of the average annual subbasin values, whereas the average temporal variability is computed as the mean range (i.e., throughout the 21-year simulated period) between the minimum and maximum subbasin monthly average values (Figure 9 and Supplementary Table 2). The selected subbasins reveal a typical zonal Mediterranean gradient, while the marginal seas (Adriatic and Aegean Seas), which are characterized by important anomalies (Teruzzi et al., 2021), are not shown in Figure 9.
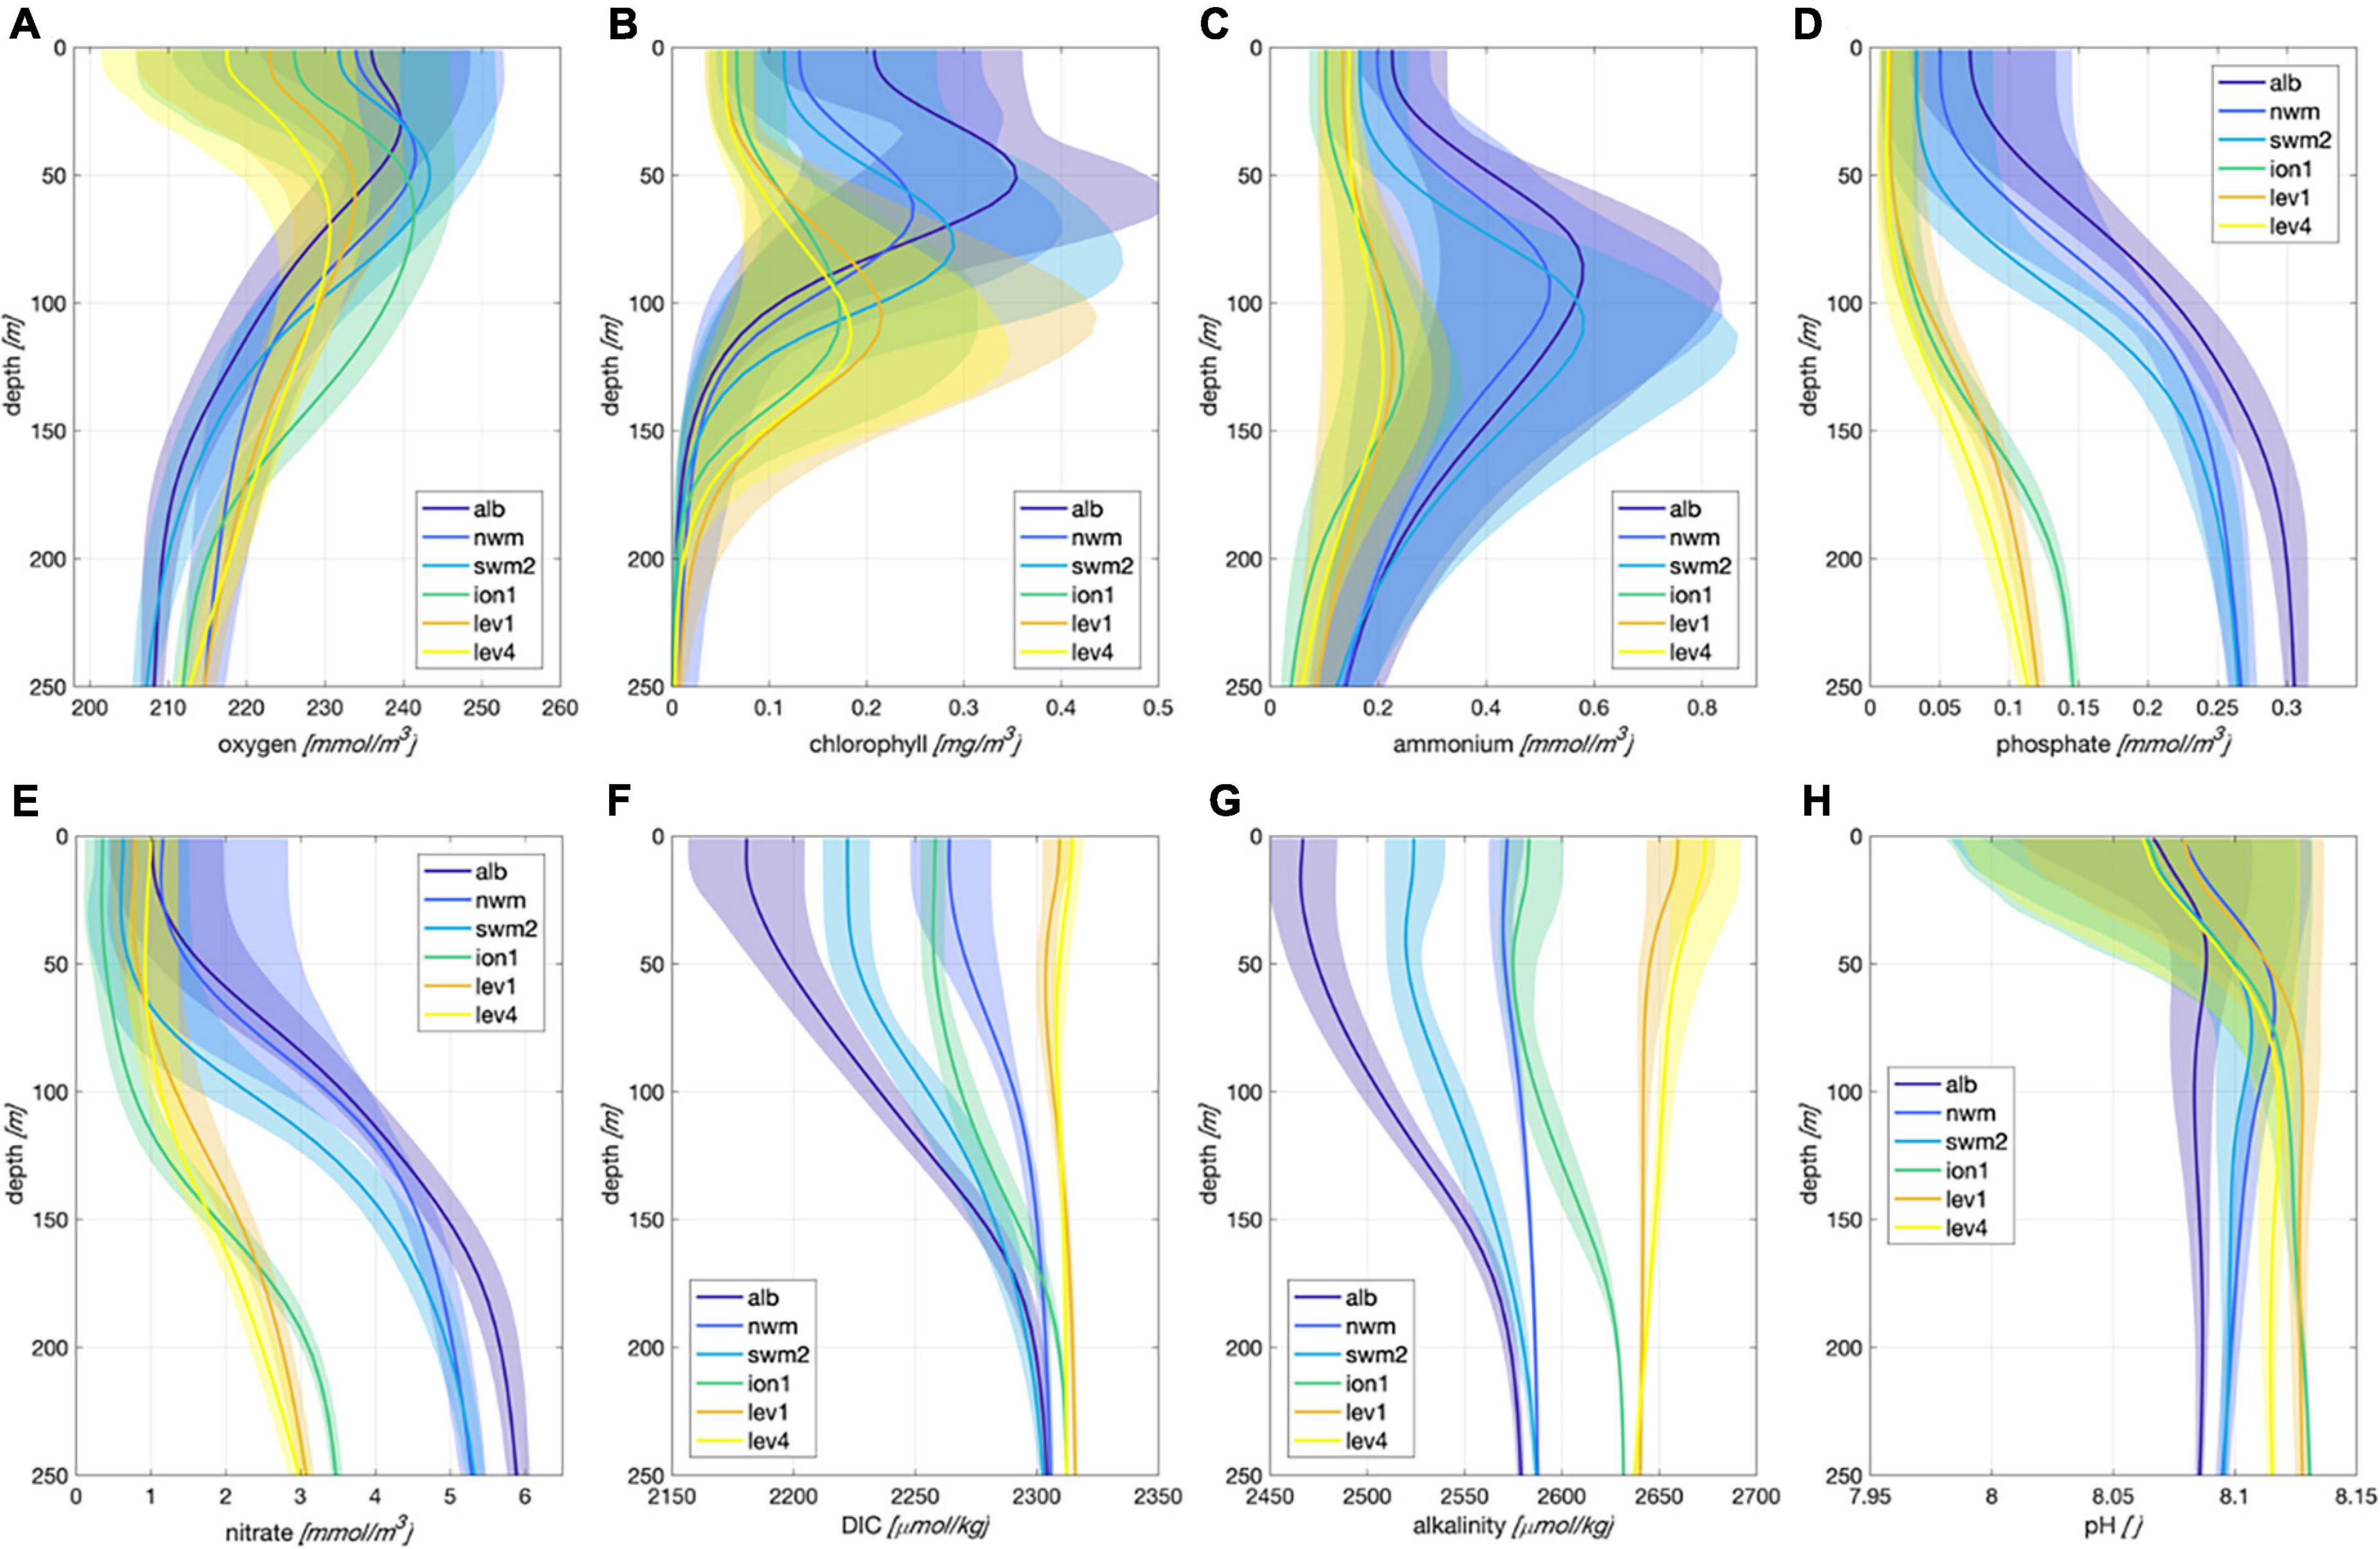
Figure 9. Spatial and temporal variability for selected variables: oxygen (A), chlorophyll (B), ammonium (C), phosphate (D), nitrate (E), DIC (F), alkalinity (G), pH (H). For each variable, mean annual average profiles for sub-basins along the zonal direction (colored solid lines) and mean seasonal cycle within each sub-basin (colored shaded areas) are plotted.
Certain variables (e.g., alkalinity and DIC) are characterized by a higher spatial than temporal variability. In terms of nutrients such as nitrate and phosphate, even when the spatial variability is notable, the variability in the seasonal cycle at the surface in several western subbasins can reach as high as the spatial variability. The spatial variability in nutrients remains a peculiar signature of the subsurface layers (i.e., below 100 m), where the seasonal cycle is narrow and the Mediterranean reveals two distinctive conditions separated by the Sicily channel (Figure 9). In marine ecosystems, ammonium is generally produced by remineralization processes of organic matter and rapidly assimilated by plankton or oxidized into nitrate. Reanalysis ammonium, which exhibits a relatively high level of uncertainty (Figure 8), tends to reach zero below the euphotic layer and indicates a seasonal variability that exceeds the spatial variability.
Chlorophyll simulation achieves a good skill (Figure 8) and captures important spatial and temporal signals, which have already been reported in the literature (Lavigne et al., 2015; Barbieux et al., 2019), the enhanced seasonal cycle in both the surface (i.e., winter/spring blooms, especially in the western regions) and subsurface (50–150 m, with DCM onset from April to October) layers and significant spatial variability both in terms of the zonal gradient and vertical displacement of the subsurface chlorophyll maximum (Figure 9). At the surface, the oxygen temporal variability reaches as high as approximately 50–60 mmol/m3 following the seasonal saturation cycle, with important spatial differences among the subbasins attributed to the spatial gradient of the surface temperature (Escudier et al., 2021). In the subsurface layer, biological activity drives the variability associated with a maximum at a depth from approximately 50–100 m (i.e., just above the DCM), and important spatial differences are associated with the different levels of productivity in the various subbasins, with the western subbasins being more productive and shallower than are the eastern subbasins.
Trends During the 1999–2019 Period
Trends were evaluated considering the simple, fixed-seasonal cycle (as shown in Figure 9) C-1 method (Vantrepotte and Mélin, 2009) based on the monthly time series for the 16 subbasins. Trends were computed for certain important layers (e.g., surface, subsurface, or vertically integrated) and variables to provide a general view of the different scales of variability in the euphotic layer. Figure 10 shows values of the trend slope considering an arbitrary range based on either the seasonal or interannual variability (Supplementary Table 2), and highlights when trends are inferred in addition to the statistical significance.
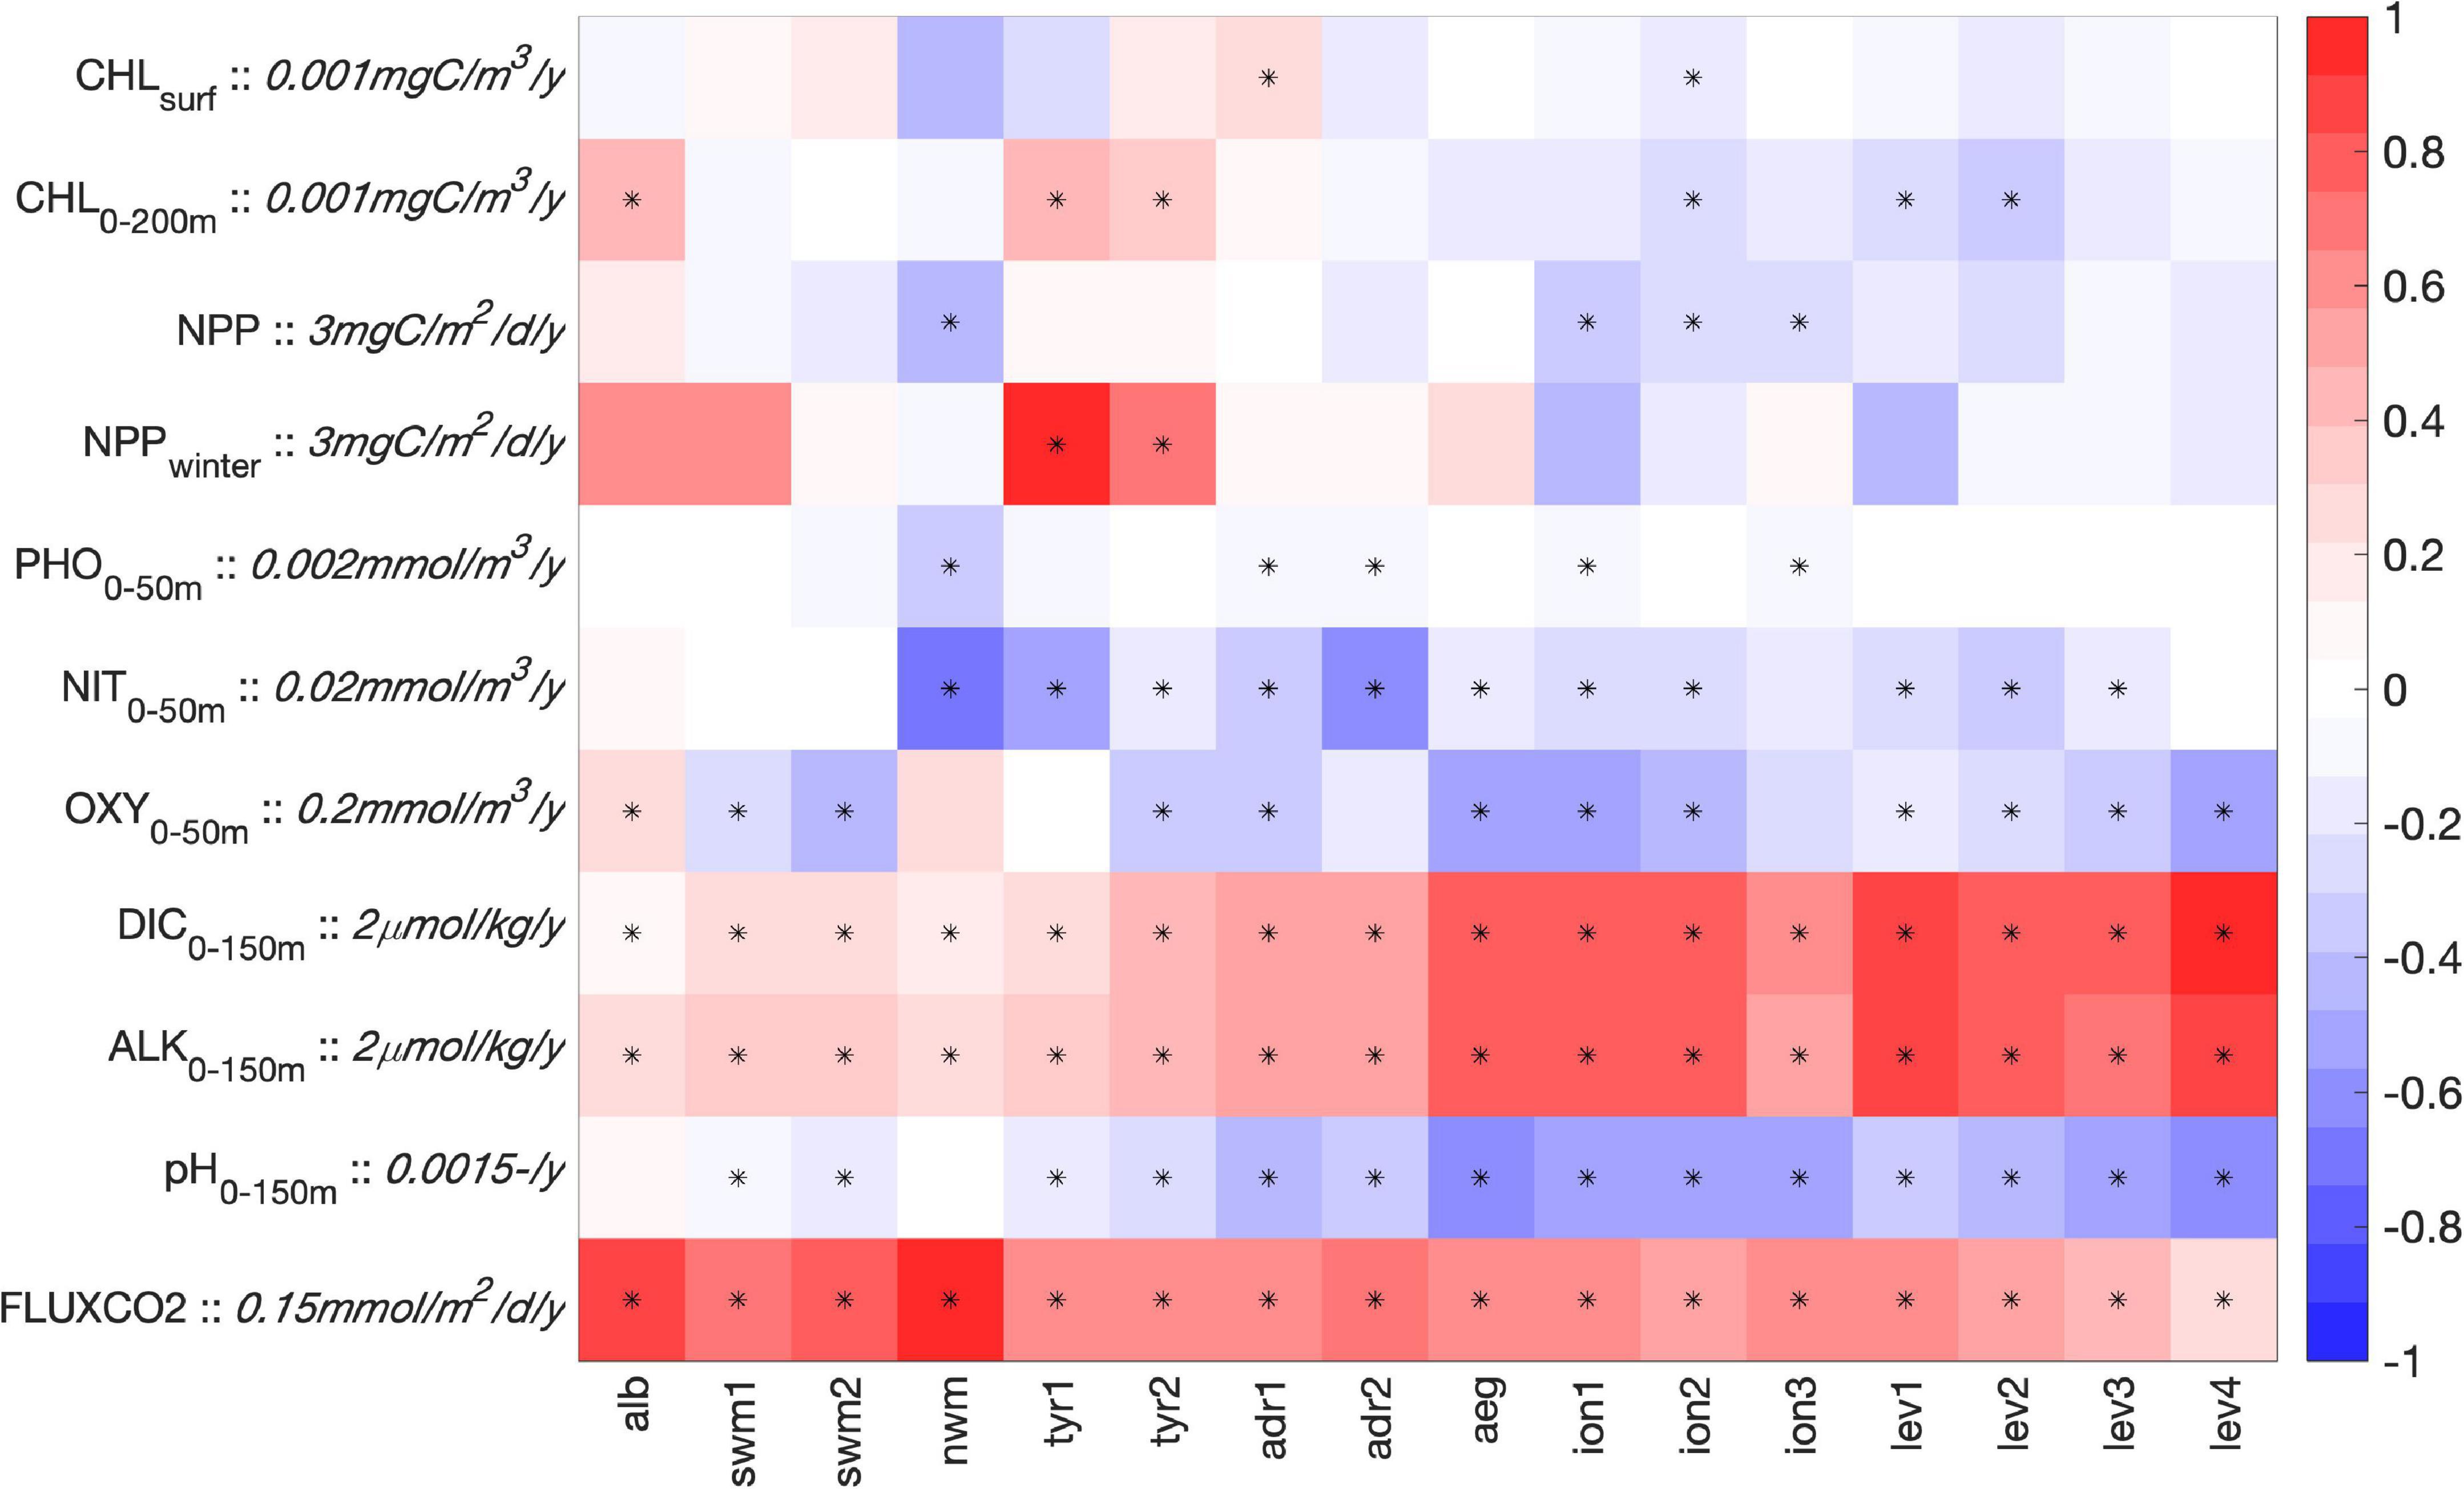
Figure 10. Trend slope values for selected variables in the 16 sub-basins. Color scale range is adapted considering the range of variability or mean values of each variable (scale factor is provided together with the variable unit). The symbol * marks significant trend (t-test at p-level of 0.05).
Chlorophyll generally attained very low trends, either positive or negative, mostly not significant. Indeed, considering the surface (CHLsurf), only the Adriatic Sea (adr1) and southern Ionian (ion2) exhibit positive and negative significant trends, respectively. However, when the trends were computed based on vertically integrated values (CHL0–200 m), a generally positive (negative) trend characterizes the western (eastern) subbasins. Consistent with the negative trend of chlorophyll in the eastern Mediterranean Sea, the annual vertically integrated primary production reveals very small negative values in the eastern subbasins and an absence of long-term signals in the western subbasins, except the north-western Mediterranean (nwm). The negative trend values seem mostly associated with a decrease in the summer productivity, whereas the productivity of the winter bloom (NPPwinter) increases in the western subbasins due to the presence of a larger number of intense winter blooms with enhanced vertical mixing in the second part of the reanalysis with respect to the initial period, as reported in Cossarini et al. (2020). However, the limited length of the reanalysis (i.e., 21 years) might influence the robustness of the above trend analysis when the interannual variability is high (i.e., the trend slope values are generally lower than 10% of the interannual variability, as indicated in Supplementary Table 2). While a negative trend in the surface layer nitrate occurs in most of the subbasins, in the case of phosphate the trend is practically null and not significant. Most of the eastern subbasins and several western subbasins indicate a very small but significant tendency for oxygen [(−0.05, −0.10) mmol/m3/y], which corresponds to a decrease in the oxygen content of approximately 1.0–2.0 mmol/m3 during the simulated period.
Significant trends for all carbonate variables were obtained for the whole Mediterranean Sea. In particular, the two prognostic model variables (alkalinity and DIC) exhibit positive trends in the eastern subbasins that are higher than those in the western subbasins: at 1.5 and 0.7 μmol/kg/y, respectively, for the alkalinity and 2 and 0.6 μmol/kg/y, respectively, for DIC. While the DIC and alkalinity variations impose opposite effects on pH, which is a diagnostic variable of the carbonate system, the overall effect revealed by the reanalysis is a pH decrease at a rate of approximately 0.0006–0.0012 y–1 (higher in the eastern subbasins). Finally, a significant trend of the CO2 air-sea flux is detected, with values ranging from 0.05 to 0.15 (mmol/m2/d)/y, with the highest values in the western subbasins.
Temporal Evolution and Trend of the Carbonate System Variables
One of the most relevant signals in the present reanalysis dataset is the impact of the increase in the atmospheric CO2 partial pressure, which affects the carbon sink in the marine system. Despite the very high seasonal cycle, the Mediterranean Sea exhibits nearly neutral conditions, with a mean annual value of 0.35 (0.24 in open sea areas only) mmol/m2/d in the 2010–2019 period (Figure 11). However, we observe a possible shift in CO2 behavior between a net source and a net sink over the last two decades, at least in the open sea areas, as a consequence of the increase in atmospheric CO2. It should be noted that the dynamics in coastal areas that are simulated as net sinks of atmospheric CO2 are highly uncertain due to the uncertainty in terrestrial inputs and the impact of benthic and coastal biogeochemical dynamics (Borges et al., 2006; Cossarini et al., 2015b). Regarding the spatial variability, the model exhibits strong CO2 uptake (ingassing) in the nwm subbasin, Adriatic, and Aegean Seas and CO2 outgassing in the south-eastern Mediterranean (Figure 11B). Hotspots of CO2 atmospheric uptake occur in areas of dense water formation (Pinardi et al., 2015), fostering the carbon pump mechanism in marginal areas (Cossarini et al., 2017). Considering the marine carbon cycle functioning in the open sea areas, primary production is a key component that, in addition to constituting the base of oceanic food webs, contributes to atmospheric CO2 sequestration through CO2 fixation and subsequent organic carbon sinks (Siegel et al., 2014; Morrow et al., 2018). We provide the mean annual value of the integrated NPP, together with an estimation of the sink of particulate organic carbon (POC) and particulate inorganic carbon (PIC) at a depth of 500 m (Figure 3). According to the BFM formulation (Lazzari et al., 2016; Vichi et al., 2020), NPP is determined as photosynthesized carbon minus respiration and fast-release carbon due to a lack of nutrients for biomass synthesis. While organic carbon is produced through mortality and grazing of all plankton groups, the dynamics of PIC (i.e., calcite) comprise calcite precipitation by coccolithophores (parameterized as the mortality of nano-flagellate functional types multiplied by a PIC:POC ratio factor of 1; Krumhardt et al., 2017) and the dissolution process (Morse and Berner, 1972).
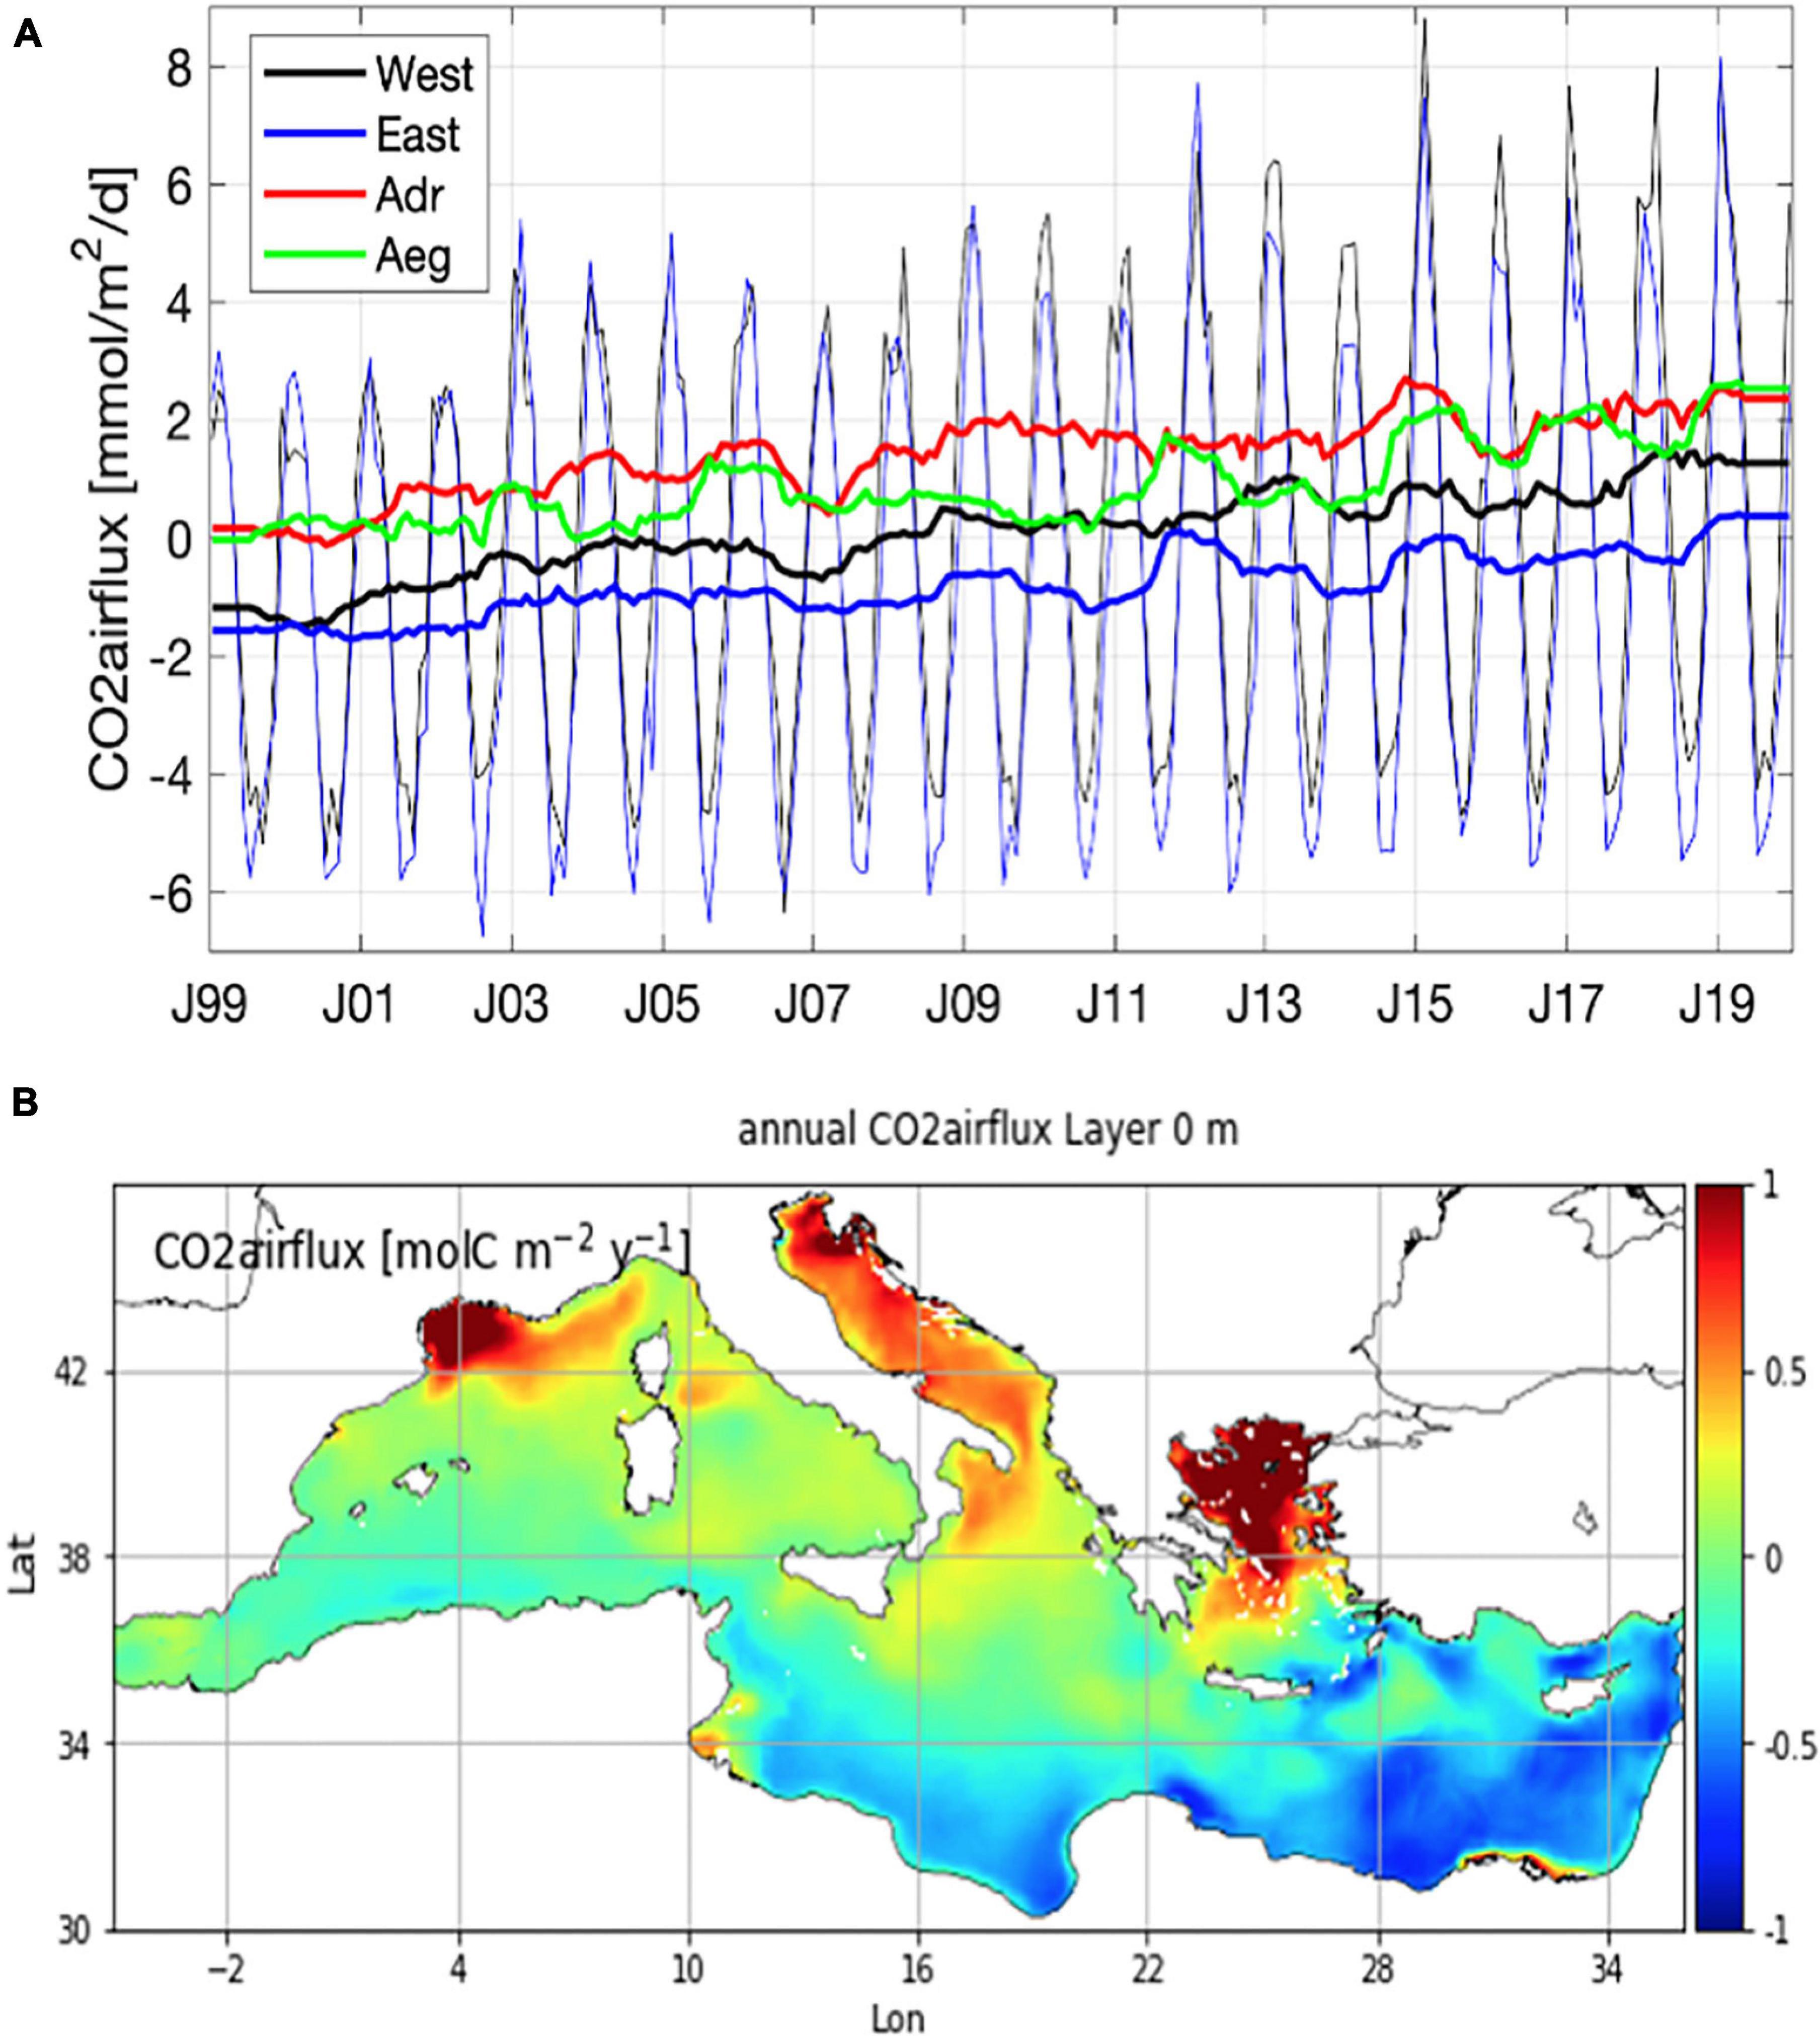
Figure 11. Monthly time evolution (thin lines) and its moving average (thick lines) of CO2 air-sea flux (A) in the western and eastern Mediterranean Sea, Adriatic and Aegean Seas. Map of the mean annual CO2 air-sea flux (B). Positive values indicate sink of atmospheric CO2.
The zonal trophic gradient of primary production reflects a sink of particulate carbon, where the carbon export of the western subbasins was double that of the eastern subbasins. The particulate organic and inorganic carbon exports are similar across the western subbasins, with values of approximately 0.1–0.3 g/m2/y, whereas the PIC sink seems to be the dominant carbon export process in the eastern subbasins, where coccolithophores are recognized to increase eastward in the Mediterranean basin and could be the relevant phytoplankton group (Siokou-Frangou et al., 2010; Oviedo et al., 2015). Carbon sequestration in the deep layers is approximately 10–20% of atmospheric CO2 absorption. No significant temporal tendency was detected in the sinks of POC and PIC, suggesting that the increase in carbon accumulation in the deepest layers (not shown) was mostly related to the downward diffusion/transport of DIC from the surface rather than an alteration in the model internal biogeochemistry.
Discussion
This study describes a 1999--2019 reanalysis of the Mediterranean Sea biogeochemistry produced within the CMEMS framework. Combined with related physical reanalysis (Escudier et al., 2021), biogeochemical 3D daily and monthly fields are open and freely available through the CMEMS web portal.1 A robust and rigorous validation is a critical point to inspire user confidence toward model products (Hernandez et al., 2018; Hipsey et al., 2020). Through the three-level validation framework (section “Reanalysis Validation”), the Mediterranean biogeochemical reanalysis was demonstrated to constitute a valid multiscale product that can be applied to investigate variability at different temporal and spatial scales (refer to the examples in the Ocean State Report, von Schuckmann et al., 2016) and can serve as qualified boundary conditions for subregional high-resolution model systems (refer to the example in Bruschi et al., 2021). To our knowledge, this is the first time that different levels of validation have been achieved in a reanalysis of the Mediterranean Sea biogeochemistry, quantifying the uncertainty in as many as 12 variables: chlorophyll, phytoplankton biomass, NPP, phosphate, nitrate, oxygen, ammonium, pH, alkalinity, DIC, sea surface pCO2, and air-sea CO2 flux.
As thoroughly outlined by Hipsey et al. (2020) and demonstrated in specific cases within the CMEMS regional forecasting system (as an example, Gutknecht et al., 2019; Salon et al., 2019), biogeochemical data availability is an important constraint for model validation since different variables exhibit varying uncertainty levels on the basis of the availability of reference data. Therefore, our proposed framework offers a degree of confirmation (Oreskes et al., 1994) concerning the different spatial-temporal variability scales determined by the availability of observations specific to various datasets.
One caveat regarding the robustness of the present analysis is that surface chlorophyll comparison at Levels 1 and 2 was performed with the same satellite observations previously assimilated, which is a common procedure in skill assessment of assimilative systems (Gregg et al., 2009). Nevertheless, as mentioned, the model is evaluated before the observations are assimilated. Hence, the metrics provide an assessment of the skill performance in regard to short-term temporal dynamics. Among the 10 model variables compared to the EMODnet dataset, three variables were further compared with the BGC-Argo dataset. These two validations were kept separate to ensure consistent accuracy in the calculations, given the relatively different spatial and temporal coverage levels and QC procedures between the EMODnet and BGC-Argo data. Furthermore, the BGC-Argo floats provide observations at high vertical and temporal resolutions, allowing us to compute time series of the vertical properties of oxygen, chlorophyll, and nitrate (in the three-level validation framework).
Generally, our validation results revealed the good model performance and certain flaws in the reanalysis. The impact of the accuracy of the climatological Atlantic boundary, the low spatial variability in the initial conditions (i.e., a single profile for each subbasin), and the possible imbalance between deep ventilation and mesopelagic mineralization processes could be the reason for the model errors in the western subbasins and the deep-layer values for nutrients and oxygen (i.e., nitrate and phosphate underestimation and oxygen overestimation in the mesopelagic layer, with a larger error in ammonia, as shown in Figures 6–8, and Supplementary Figures 2–4). Additionally, a possible excess evaporation effect could be the cause of the alkalinity overestimation in the eastern subbasins, causing a slight overestimation of the pH (Figure 6). However, it should be noted that the alkalinity trend is fairly well aligned with the salinity trend, as described in Escudier et al. (2021), highlighting that the slight alkalinity overestimation could be attributable to a possible error in the initial conditions (stemming from the 1999 to 2016 EMODnet_int climatology, which might already include part of the trends).
Focusing on the epipelagic layer, where the accuracy is higher than that in the mesopelagic layer, the reanalysis reproduces certain long-term tendencies that occur in the Mediterranean Sea as a response to changes in atmospheric forcing. The increase in heat content (Escudier et al., 2021) and the increase in atmospheric CO2 (Artuso et al., 2009) are the main drivers of the detected significant changes in oxygen at the surface and carbonate system variables.
Indeed, the trend of oxygen is compatible with the decrease in oxygen solubility due to the estimated increase of 0.7°C in the sea surface temperature over the last two decades (Escudier et al., 2021). However, it should be noted that the mesopelagic layer (i.e., 300–700 m) instead indicates a positive significant trend of approximately 0.5 mmol/m3/y (not reported), which we hypothesize is caused by a possible missing respiration term in the BFM model formulation, as also reported in Reale et al. (2021). Thus, the reanalysis yields an accumulation of 10 mmol/m3 that affects its quality in the deeper layers (Figure 6 and Supplementary Figure 4).
The positive alkalinity trend could be linked to the long-term change in the water balance (refer to Skliris et al., 2018), which has also caused an increase in the 0–200 m layer salt content of approximately 0.15 PSU over the last 20 years (Escudier et al., 2021).
A constant and spatially homogeneous increase in the atmospheric pCO2 value from 370 to 410 ppm during the 1999–2019 period caused a positive increase in the sink of atmospheric CO2. The simulated values are in line with those already published for the Mediterranean Sea (von Schuckmann et al., 2018) and reveal how the Mediterranean has become a net sink of atmospheric CO2 over the last 20 years. Excess of evaporation over runoff and precipitation combined with the increase in atmospheric CO2 absorption determined the trend of DIC in the upper layer, with values ranging from 0.6 to 2 μmol/kg/y. The use of climatological boundary conditions throughout the entire duration of the simulation might have partially hampered the positive tendency of the long-term evolution of alkalinity and DIC in the southern areas of the western Mediterranean Sea, mostly influenced by Atlantic inflow. Consequently, lower pH trends were simulated in the western subbasins, where conversely, the increase in the CO2 sink is 50% larger, suggesting an increase in the net export of carbon through the Gibraltar Strait.
The simulated trend of acidification (0.0006–0.0012 pH units y–1; higher in the eastern subbasins) agrees with previously estimated global acidification trends (e.g., 0.0016 pH units y–1; Gehlen et al., 2020; Kwiatkowski et al., 2020), and is confirmed by the regional observations reported in Flecha et al. (2015) for the Gibraltar Strait over the 2012–2015 period (i.e., an annual pH variation of −0.0044 ± 0.00006) and in Wimart-Rousseau et al. (2021) for the north-western Levantine basin (i.e., an annual pH variation of −0.0024 ± 0.0004).
We also confirmed specific long-term tendencies already unveiled by satellite and model results for chlorophyll (Salgado-Hernanz et al., 2019) and winter primary production (Cossarini et al., 2020). The consistency in surface chlorophyll tendency should not be surprising since this is an assimilated variable. Even though there is no consensus on significant trends or regime shifts in ventilation (Li and Tanhua, 2020; Mavropoulou et al., 2020), the negative trend in nitrate appears to be linked to the impact of chlorophyll satellite assimilation on non-limiting nutrients (Teruzzi et al., 2014). Indeed, in late winter and early spring, the assimilation of satellite chlorophyll observations mainly acts to correct bloom overestimation, thereby nearly uniformly reducing the phytoplankton concentration in the euphotic layer. The negative trend of nitrate occurs due to the consequent reduction in phytoplankton nitrogen remineralization. Even if this phenomenon might be a spurious tendency, the reduction is much lower than the mean value (i.e., approximately 1% over the two simulated decades) and far below that of the variable error (refer to the previous section).
As a general remark, it should be noted that some of the values of these trends, even if significant in several cases (i.e., in specific subbasins), are very low and affected by the length of the time series of the reanalysis, which cannot be extended toward the past beyond the start of the European Space Agency (ESA)–Climate Change Initiative (CCI) satellite time series.
The reanalysis was produced with the primary focus of providing the best 3D estimate of the biogeochemical state of the Mediterranean Sea, integrating the most recent upstream data made available within CMEMS and other communities, including the assimilation of surface chlorophyll data, the atmospheric and hydrodynamic physical forcing, and the biogeochemical boundary conditions. Robust validation of the 12 variables constituting the reanalysis dataset offers users a measure of the accuracy at different spatial and temporal scales. Our approach highlighted large-scale changes, whereas unveiling specific impacts on the biogeochemical features of changes in water circulation and water mass movements (Malanotte-Rizzoli et al., 2014; Schneider et al., 2014) is left to subsequent papers. In particular, changes and accuracy of the circulation fields are examined in Escudier et al. (2021), and specific analyses can be addressed in the future given the availability of physical and biogeochemical reanalysis data in CMEMS.
Furthermore, our comprehensive validation approach highlighted possible model errors, such as nutrients and oxygen in the mesopelagic-bathypelagic layers, that should be considered before drawing conclusions concerning the analysis of intermediate and deep Mediterranean waters. Thus, important multidecadal signals, such as the presence of a deep dissolved oxygen variability linked to shifts with a multidecadal signal (Mavropoulou et al., 2020) or bathypelagic negative oxygen trends (Sisma-Ventura et al., 2021), when compared with the reanalysis, could help to improve the next generation of reanalysis products, shifting the focus of biogeochemical analysis from the epipelagic layer to the meso and bathypelagic layers.
Conclusion
A new and high-resolution biogeochemical reanalysis of the Mediterranean Sea is presented, and the resultant dataset of daily and monthly 3D fields of 12 variables and ecosystem fluxes is freely available from the CMEMS web portal. In summary:
• The new reanalysis integrates several novel elements: ERA5 atmospheric forcing, coupling with the new 1/24° physical reanalysis, updated versions of the BFM model and biogeochemical variational assimilation scheme, and several updated observational datasets for assimilation and validation purposes.
• As a result of the developed three-level validation framework, robust skill assessment of the 12 considered variables offers CMEMS users a measure of accuracy at different spatial and temporal scales. The estimated accuracy of the reanalysis is high for all variables, except ammonium, and the validation is successfully extended to certain emerging properties describing ecosystem processes (e.g., DCM and the depth of the nitracline and subsurface oxygen maximum) using the BGC-Argo dataset. A certain degradation in the quality of oxygen and nutrient estimates is reported in the deep layers.
• The reanalysis represents a consistent reconstruction of the Mediterranean Sea biogeochemical state and its multiscale variability over the last two decades, quantifying the impact of external and atmospheric forcing on basin-scale tendencies toward surface deoxygenation and acidification, in agreement with previous works.
Data Availability Statement
Publicly available datasets were analyzed in this study. This data can be found here: https://resources.marine.copernicus.eu/?option=com_csw&view=details&product_id=MEDSEA_MULTIYEAR_BGC_006_008.
Author Contributions
GCos, SS, AT, GB, and LF contributed to the design of the system. GCos and SS wrote the first draft of the manuscript. All authors contributed to the computation of the reanalysis and its assessment and contributed to manuscript revision, read, and approved the submitted version.
Funding
This study was supported by CMEMS Med-MFC (Copernicus Marine Environment Monitoring Service Mediterranean Marine Forecasting Centre), Mercator Ocean International Service.
Conflict of Interest
The authors declare that the research was conducted in the absence of any commercial or financial relationships that could be construed as a potential conflict of interest.
Publisher’s Note
All claims expressed in this article are solely those of the authors and do not necessarily represent those of their affiliated organizations, or those of the publisher, the editors and the reviewers. Any product that may be evaluated in this article, or claim that may be made by its manufacturer, is not guaranteed or endorsed by the publisher.
Acknowledgments
We thank Alessandro Marani (Cineca, Bologna, Italy) for his support in HPC management of the reanalysis. The simulation was carried out on the Galileo facility at Cineca. This study has been conducted using E.U. Copernicus Marine Service Information.
Supplementary Material
The Supplementary Material for this article can be found online at: https://www.frontiersin.org/articles/10.3389/fmars.2021.741486/full#supplementary-material
Footnotes
References
Álvarez, M., Sanleón-Bartolomé, H., Tanhua, T., Mintrop, L., Luchetta, A., Cantoni, C., et al. (2014). The CO2 system in the Mediterranean Sea: a basin wide perspective. Ocean Sci. 10, 69–92. doi: 10.5194/os-10-69-2014
Argo. (2021). Argo Float Data and Metadata from Global Data Assembly Centre (Argo GDAC). Brest: Ifremer. doi: 10.17882/42182
Artuso, F., Chamard, P., Piacentino, S., Sferlazzo, D. M., De Silvestri, L., di Sarra, A., et al. (2009). Influence of transport and trends in atmospheric CO2 at Lampedusa. Atmos. Environ. 43, 3044–3051. doi: 10.1016/j.atmosenv.2009.03.027
Ayata, S. D., Irisson, J. O., Aubert, A., Berline, L., Dutay, J. C., Mayot, N., et al. (2018). Regionalisation of the Mediterranean basin, a MERMEX synthesis. Progr. Oceanogr. 163, 7–20.
Bakker, D. C. E., Pfeil, B., Landa, C. S., Metzl, N., O’Brien, K. M., Olsen, A., et al. (2016). A multi-decade record of high-quality fCO2 data in version 3 of the Surface Ocean CO2 Atlas (SOCAT). Earth Syst. Sci. Data 8, 383–413. doi: 10.5194/essd-8-383-2016
Barbieux, M., Uitz, J., Gentili, B., Pasqueron de Fommervault, O., Mignot, A., Poteau, A., et al. (2019). Bio-optical characterization of subsurface chlorophyll maxima in the Mediterranean Sea from a Biogeochemical-Argo float database. Biogeosciences 16, 1321–1342. doi: 10.5194/bg-16-1321-2019
Bellacicco, M., Vellucci, V., Scardi, M., Barbieux, M., Marullo, S., and D’Ortenzio, F. (2019). Quantifying the Impact of Linear Regression Model in Deriving Bio-Optical Relationships: the Implications on Ocean Carbon Estimations. Sensors 19:3032. doi: 10.3390/s19133032
Bittig, H. C., Maurer, T. L., Plant, J. N., Schmechtig, C., Wong, A. P., Claustre, H., et al. (2019). A BGC-Argo guide: planning, deployment, data handling and usage. Front. Mar. Sci. 6:23. doi: 10.3389/fmars.2019.00502
Bojinski, S., Verstraete, M., Peterson, T. C., Richter, C., Simmons, A., and Zemp, M. (2014). The concept of essential climate variables in support of climate research, applications, and policy. Bull. Am. Meteorol. Soc. 95, 1431–1443. doi: 10.1175/BAMS-D-13-00047.1
Borges, A. V., Schiettecatte, L. S., Abril, G., Delille, B., and Gazeau, F. (2006). Carbon dioxide in European coastal waters. Estuar. Coasta. Shelf Sci. 70, 375–387.
Bosc, E., Bricaud, A., and Antoine, D. (2004). Seasonal and inter-annual variability in algal biomass and primary productionin the Mediterranean Sea, as derived from 4 years of Sea-WiFS observations. Glob. Biogeochem. 18:2004. doi: 10.1029/2003GB002034
van Apeldoorn, D., and Bouwman, L. (2012). SES land-based runoff and nutrient load data (1980–2000). PERSEUS Deliv. Nr. 4:6.
Bruschi, A., Lisi, I., De Angelis, R., Querin, S., Cossarini, G., Di Biagio, V., et al. (2021). Indexes for the assessment of bacterial pollution in bathing waters from point sources: the northern Adriatic Sea CADEAU service. J. Environ. Manag. 293:112878. doi: 10.1016/j.jenvman.2021.112878
Buga, L., Sarbu, G., Fryberg, L., Magnus, W., Wesslander, K., Gatti, J., et al. (2018). EMODnet Thematic Lot n? 4/SI2.749773 EMODnet Chemistry Eutrophication and Acidity Aggregated Datasets. doi: 10.6092/EC8207EF-ED81-4EE5-BF48-E26FF16BF02E
Ciavatta, S., Kay, S., Brewin, R. J. W., Cox, R., Di Cicco, A., Nencioli, F., et al. (2019). Ecoregions in the Mediterranean Sea through the reanalysis of phytoplankton functional types and carbon fluxes. J. Geophys. Res. Oceans 124, 6737–6759. doi: 10.1029/2019JC015128
Colella, S. (2006). La produzione primaria nel Mar Mediterraneo da satellite: sviluppo di un modello regionale e sua applicazione ai dati SeaWiFS, MODIS e MERIS. Italy: Università Federico II Napoli. 162.
Colella, S., Brando, V. E., Di Cicco, A., D’Alimonte, D., Forneris, V., and Bracaglia, M. (2021). Quality Information Document for the OCEAN COLOUR PRODUCTION CENTRE - Ocean Colour Mediterranean and Black Sea Observation Product [Data Set]. Copernicus Monitoring Environment Marine Service (CMEMS). Available online at: https://resources.marine.copernicus.eu/?option=com_csw&view=details&product_id=OCEANCOLOUR_MED_CHL_L3_REP_OBSERVATIONS_009_073 (accessed January 15, 2021).
Colella, S., Falcini, F., Rinaldi, E., Sammartino, M., and Santoleri, R. (2016). Mediterranean ocean colour chlorophyll trends. PLoS One 11:e0155756. doi: 10.1371/journal.pone.0155756
Copin-Montégut, C. (1993). Alkalinity and carbon budgets in the Mediterranean Sea. Glob. Biogeochem. Cycles 7, 915–925. doi: 10.1029/93GB01826
Coppola, L., Legendre, L., Lefevre, D., Prieur, L., Taillandier, V., and Riquier, E. D. (2018). Seasonal and inter-annual variations of dissolved oxygen in the northwestern Mediterranean Sea (DYFAMED site). Progr. Oceanogr. 162, 187–201. doi: 10.1016/j.pocean.2018.03.001
Cossarini, G., Bretagnon, M., Di Biagio, V., d’Andon, O., Garnesson, P., Mangin, A., et al. (2020). “Primary Production” in Copernicus Marine Service Ocean State Report. ed. von Schuckmann K., LeTraon P.-Y., Smith N., Pascual A., Djavidnia S., Gattuso J.-P., Grégoire M., Nolan G. Italy: National Institute of Oceanography and Applied Geophysics. 13, S1–S172. doi: 10.1080/1755876X.2020.1785097
Cossarini, G., Lazzari, P., and Solidoro, C. (2015a). Spatiotemporal variability of alkalinity in the Mediterranean Sea. Biogeosciences 12, 1647–1658.
Cossarini, G., Mariotti, L., Feudale, L., Mignot, A., Salon, S., Taillandier, V., et al. (2019). Towards operational 3D-Var assimilation of chlorophyll Biogeochemical-Argo float data into a biogeochemical model of the Mediterranean Sea. Ocean Model. 133, 112–128. doi: 10.1016/j.ocemod.2018.11.005
Cossarini, G., Querin, S., and Solidoro, C. (2015b). The continental shelf carbon pump in the northern Adriatic Sea (Mediterranean Sea): influence of wintertime variability. Ecol. Model. 314, 118–134.
Cossarini, G., Querin, S., Solidoro, C., Sannino, G., Lazzari, P., Biagio, V. D., et al. (2017). Development of BFMCOUPLER (v1. 0), the coupling scheme that links the MITgcm and BFM models for ocean biogeochemistry simulations. Geosci. Model. Dev. 10, 1423–1445.
D’Ortenzio, F., Antoine, D., and Marullo, S. (2008). Satellite-driven modeling of the upper ocean mixed layer and air–sea CO2 flux in the Mediterranean Sea. Deep Sea Research Part I Oceanogr. Res. Papers 55, 405–434. doi: 10.1016/j.dsr.2007.12.008
Di Biagio, V., Cossarini, G., Salon, S., and Solidoro, C. (2020). Extreme event waves in marine ecosystems: an application to Mediterranean Sea surface chlorophyll. Biogeosciences 17, 5967–5988.
Di Biagio, V., Cossarini, G., Salon, S., Lazzari, P., Querin, S., Sannino, G., et al. (2019). Temporal scales of variability in the Mediterranean Sea ecosystem: insight from a coupled model. J. Mar. Syst. 197:103176. doi: 10.1016/j.jmarsys.2019.05.002
Dobricic, S., and Pinardi, N. (2008). An oceanographic three-dimensional variational data assimilation scheme. Ocean Model. 22, 89–105. doi: 10.1016/j.ocemod.2008.01.004
D’Ortenzio, F., and Ribera d’Alcalà, M. (2009). On the trophic regimes of the Mediterranean Sea: a satellite analysis. Biogeosciences 6, 139–148.
El Hourany, R., Mejia, C., Faour, G., Crépon, M., and Thiria, S. (2021). Evidencing the impact of climate change on the phytoplankton community of the Mediterranean Sea through a bioregionalization approach. J. Geophys. Res. Oceans 126:e2020JC016808.
Escudier, R., Clementi, E., Cipollone, A., Pistoia, J., Drudi, M., Grandi, A., et al. (2021). A high resolution reanalysis for the Mediterranean Sea. Front. Earth Sci. 9:702285. doi: 10.3389/feart.2021.702285
Escudier, R., Clementi, E., Omar, M., Cipollone, A., Pistoia, J., Aydogdu, A., et al. (2020). Mediterranean Sea Physical Reanalysis (CMEMS MED-Currents) (Version 1) set. Copernicus Monitoring Environment Marine Service (CMEMS). doi: 10.25423/CMCC/MEDSEA_MULTIYEAR_PHY_006_004_E3R1
Fennel, K., Gehlen, M., Brasseur, P., Brown, C. W., Ciavatta, S., Cossarini, G., et al. (2019). Advancing marine biogeochemical and ecosystem reanalyses and forecasts as tools for monitoring and managing ecosystem health. Front. Mar. Sci. 6:89. doi: 10.3389/fmars.2019.00089
Feudale, L., Cossarini, G., Bolzon, G., Lazzari, P., Solidoro, C., Teruzzi, A., et al. (2021). “Entering in the BGC-Argo era: improvements of the Mediterranean Sea biogeochemical operational system,” in Proceedings of the 9th EuroGOOS conference. (France: EuroGOOS AISBL).
Flecha, S., Pérez, F. F., García-Lafuente, J., Sammartino, S., Ríos, A. F., and Huertas, I. E. (2015). Trends of pH decrease in the Mediterranean Sea through high frequency observational data: indication of ocean acidification in the basin. Sci. Rep. 5, 1–8. doi: 10.1038/srep16770
Garcia, H., Weathers, K., Paver, C., Smolyar, I., Boyer, T., Locarnini, M., et al. (2019). World Ocean Atlas 2018. Volume 4 Dissolved Inorganic Nutrients (phosphate, nitrate and nitrate+nitrite, silicate). United States: National Oceanic and Atmospheric Administration.
Gehlen, G. Trang Chau, T. T., Conchon, A. Denvil-Sommer, A., Chevallier, F., Vrac, M., et al. (2020). “Section 2.10: Ocean acidification,” in Copernicus Marine Service Ocean State Report, Issue 4. Journal of Operational Oceanography, Vol. 13 (Suppl. 1) (Abingdon: Taylor & Francis), S1–S172. doi: 10.1080/1755876X.2020.1785097
Gregg, W. W., Friedrichs, M. A., Robinson, A. R., Rose, K. A., Schlitzer, R., Thompson, K. R., et al. (2009). Skill assessment in ocean biological data assimilation. J. Mar. Syst. 76, 16–33.
Gutknecht, E., Reffray, G., Mignot, A., Dabrowski, T., and Sotillo, M. G. (2019). Modelling the marine ecosystem of Iberia–Biscay–Ireland (IBI) European waters for CMEMS operational applications. Ocean Sci. 15, 1489–1516. doi: 10.5194/os-15-1489-2019
Guyennon, A., Baklouti, M., Diaz, F., Palmieri, J., Beuvier, J., Lebaupin-Brossier, C., et al. (2015). New insights into the organic carbon export in the Mediterranean Sea from 3-D modeling. Biogeosciences 12, 7025–7046.
Hernandez, F., Bertino, L., Brassington, G. B., Chassignet, E. P., Cummings, J. A., Davidson, F., et al. (2009). Validation and intercomparison studies within GODAE. Oceanogr. Magaz. 22, 128–143. doi: 10.5670/oceanog.2009.71
Hernandez, F., Blockley, E., Brassington, G. B., Davidson, F., Divakaran, P., Drévillon, M., et al. (2015). Recent progress in performance evaluations and near real-time assessment of operational ocean products. J. Operat. Oceanogr. 8, s221–s238. doi: 10.1080/1755876X.2015.1050282
Hernandez, F., Smith, G., Baetens, K., Cossarini, G., Garcia-Hermosa, I., Drévillon, M., et al. (2018). “Measuring performances, skill and accuracy in operational oceanography: new challenges and Approaches” in New Frontiers in Operational Oceanography. eds E. Chassignet, A. Pascual, J. Tintoré, and J. Verron (Tallahassee, FL: GODAE OceanView). 759–796. doi: 10.17125/gov2018
Hipsey, M. R., Gal, G., Arhonditsis, G. B., Carey, C. C., Elliott, J. A., Frassl, M. A., et al. (2020). A system of metrics for the assessment and improvement of aquatic ecosystem models. Environ. Model. Softw. 128:104697. doi: 10.1016/j.envsoft.2020.104697
Hulme, M., Mitchell, J., Ingram, W., Lowe, J., Johns, T., New, M., et al. (1999). Climate change scenarios for global impacts studies. Glob. Environ. Change 9, S3–S19. doi: 10.1016/S0959-3780(99)00015-1
Jolliff, J. K., Kindle, J. C., Shulman, I., Penta, B., Friedrichs, M. A., Helber, R., et al. (2009). Summary diagrams for coupled hydrodynamic-ecosystem model skill assessment. J. Mar. Syst. 76, 64–82.
Kempe, S., Pettine, M., and Cauwet, G. (1991). “Biogeochemistry of European rivers” in Biogeochemistry of Major World Rivers, Scope 42. (eds) E. T. Degens, S. Kempe, and J. E. Richey (Chichester: John Wiley). 169–211.
Krumhardt, K. M., Lovenduski, N. S., Iglesias-Rodriguez, M. D., and Kleypas, J. A. (2017). Coccolithophore growth and calcification in a changing ocean. Progr. Oceanogr. 159, 276–295.
Kwiatkowski, L., Torres, O., Bopp, L., Aumont, O., Chamberlain, M., Christian, J. R., et al. (2020). Twenty-first century ocean warming, acidification, deoxygenation, and upper-ocean nutrient and primary production decline from CMIP6 model projections. Biogeosciences 17, 3439–3470. doi: 10.5194/bg-17-3439-2020
Lavigne, H., D’Ortenzio, F., d’Alcalà, M. R., Claustre, H., Sauzède, R., and Gacic, M. (2015). On the vertical distribution of the chlorophyll a concentration in the Mediterranean Sea: a basin-scale and seasonal approach. Biogeosciences 12, 5021–5039. doi: 10.5194/bg-12-5021-2015
Lazzari, P., Solidoro, C., Ibello, V., Salon, S., Teruzzi, A., Béranger, K., et al. (2012). Seasonal and interannual variability of plankton chlorophyll and primary production in the Mediterranean Sea: a modelling approach. Biogeosciences 9, 217–233. doi: 10.5194/bg-9-217-2012
Lazzari, P., Solidoro, C., Salon, S., and Bolzon, G. (2016). Spatial variability of phosphate and nitrate in the Mediterranean Sea: a modelling approach. Deep Sea Res. 108, 39–52. doi: 10.1016/j.dsr.2015.12.006
Lazzari, P., Teruzzi, A., Salon, S., Campagna, S., Calonaci, C., Colella, S., et al. (2010). Pre-operational short-term forecasts for the Mediterranean Sea biogeochemistry. Ocean Sci. 6, 25–39. doi: 10.5194/os-6-25-2010
Li, P., and Tanhua, T. (2020). Recent changes in deep ventilation of the Mediterranean Sea; evidence from long-term transient tracer observations. Front. Mar. Sci. 7:594. doi: 10.3389/fmars.2020.00594
Lipizer, M., Partescano, E., Rabitti, A., Giorgetti, A., and Crise, A. (2014). Qualified temperature, salinity and dissolved oxygen climatologies in a changing Adriatic Sea. Ocean Sci. 10, 771–797. doi: 10.5194/os-10-771-2014
Macias, D., Stips, A., and Garcia-Gorriz, E. (2014). The relevance of deep chlorophyll maximum in the open Mediterranean Sea evaluated through 3d hydrodynamic-biogeochemical coupled simulations. Ecol. Model. 281, 26–37.
Malanotte-Rizzoli, P., Artale, V., Borzelli-Eusebi, G. L., Brenner, S., Crise, A., Gacic, M., et al. (2014). Physical forcing and physical/biochemical variability of the Mediterranean Sea: a review of unresolved issues and directions for future research. Ocean Sci. 10, 281–322.
Mavropoulou, A. M., Vervatis, V., and Sofianos, S. (2020). Dissolved oxygen variability in the Mediterranean Sea. J. Mar. Syst. 208:103348. doi: 10.1016/j.jmarsys.2020.103348
Melaku Canu, D., Ghermandi, A., Nunes, P. A. L. D., Lazzari, P., Cossarini, G., and Solidoro, C. (2015). Estimating the value of carbon sequestration ecosystem services in the Mediterranean Sea: an ecological economics approach. Glob. Environ. Change 32, 87–95. doi: 10.1016/j.gloenvcha.2015.02.008
Meybeck, M., and Ragu, A. (1997). River Discharges to the Oceans: an Assessment of Suspended Solids, Major Ions and Nutrients. Kenya: UNEP.
Micheli, F., Halpern, B. S., Walbridge, S., Ciriaco, S., Ferretti, F., Fraschetti, S., et al. (2013). Cumulative human impacts on Mediterranean and Black Sea marine ecosystems: assessing current pressures and opportunities. PLoS One 8:e79889. doi: 10.1371/journal.pone.0079889
Mignot, A., Claustre, H., Cossarini, G., D’Ortenzio, F., Gutknecht, E., Lamouroux, J., et al. (2021). Defining BGC-Argo-based Metrics of Ocean Health and Biogeochemical Functioning for the Evaluation of Global Ocean Models. Germany: European Geosciences Union. doi: 10.5194/bg-2021-2
Miloslavich, P., Bax, N. J., Simmons, S. E., Klein, E., Appeltans, W., Aburto-Oropeza, O., et al. (2018). Essential ocean variables for global sustained observations of biodiversity and ecosystem changes. Glob. Change Biol. 24, 2416–2433. doi: 10.1111/gcb.14108
Moll, A. (2000). Assessment of three-dimensional physical-biological ECOHAM1 simulations by quantified validation for the North Sea with ICES and ERSEM data. ICES J. Mar. Sci. 57, 1060–1068.
Morrow, R. M., Ohman, M. D., Goericke, R., Kelly, T. B., Stephens, B. M., and Stukel, M. R. (2018). Primary productivity, mesozooplankton grazing, and the biological pump in the california current ecosystem: variability and response to El niño. Deep Sea Res. 140, 52–62. doi: 10.1016/j.dsr.2018.07.012
Morse, J. W., and Berner, R. A. (1972). Dissolution kinetics of calcium carbonate in sea water; I, A kinetic origin for the lysocline. Am. J. Sci. 272, 840–851.
Novi, L., Bracco, A., and Falasca, F. (2021). Uncovering marine connectivity through sea surface temperature. Sci. Rep. 11, 1–9.
Olsen, A., Key, R. M., van Heuven, S., Lauvset, S. K., Velo, A., Lin, X., et al. (2016). The Global Ocean Data Analysis Project version 2 (GLODAPv2) – an internally consistent data product for the world ocean. Earth Syst. Sci. Data 8, 297–323. doi: 10.5194/essd-8-297-2016
Olsen, A., Lange, N., Key, R. M., Tanhua, T., Álvarez, M., Becker, S., et al. (2019). GLODAPv2.2019 – an update of GLODAPv2. Earth Syst. Sci. Data 11, 1437–1461. doi: 10.5194/essd-11-1437-2019
Oreskes, N., Shrader-Frechette, K., and Belitz, K. (1994). Verification, validation, and confirmation of numerical models in the earth sciences. Science 263, 641–645. doi: 10.1126/science.263.5147.641
Oviedo, A., Ziveri, P., Álvarez, M., and Tanhua, T. (2015). Is coccolithophore distribution in the Mediterranean Sea related to seawater carbonate chemistry? Ocean Sci. 11, 13–32.
Park, J. Y., Stock, C. A., Yang, X., Dunne, J. P., Rosati, A., John, J., et al. (2018). Modeling global ocean biogeochemistry with physical data assimilation: a pragmatic solution to the equatorial instability. J. Adv. Model. Earth Syst. 10, 891–906. doi: 10.1002/2017MS001223
Pinardi, N., and Masetti, E. (2000). Variability of the large scale general circulation of the Mediterranean Sea from observations and modelling: a review. Palaeogeogr. Palaeoclimatol. Palaeoecol. 158, 153–173.
Pinardi, N., Zavatarelli, M., Adani, M., Coppini, G., Fratianni, C., Oddo, P., et al. (2015). Mediterranean Sea large-scale low-frequency ocean variability and water mass formation rates from 1987 to 2007: a retrospective analysis. Progr. Oceanogr. 132, 318–332.
Reale, M., Cossarini, G., Lazzari, P., Lovato, T., Bolzon, G., Masina, S., et al. (2021). Acidification, Deoxygenation, and Nutrient Decline in a Warming Mediterranean Sea. (Submitted in Biogeosciences discussion).
Ribera d’Alcalà, M., Civitarese, G., Conversano, F., and Lavezza, R. (2003). Nutrient ratios and fluxes hint at overlooked processes in the Mediterranean Sea. J. Geophys. Res. 108:8106. doi: 10.1029/2002JC001650
Richon, C., Dutay, J. C., Dulac, F., Wang, R., Balkanski, Y., Nabat, P., et al. (2018). Modeling the impacts of atmospheric deposition of nitrogen and desert dust derived phosphorus on nutrients and biological budgets of the Mediterranean Sea. Prog. Oceanogr. 163, 21–39.
Salgado-Hernanz, P. M., Racault, M. F., Font-Muñoz, J. S., and Basterretxea, G. (2019). Trends in phytoplankton phenology in the Mediterranean Sea based on ocean-colour remote sensing. Remote Sens. Environ. 221, 50–64. doi: 10.1016/j.rse.2018.10.036
Salon, S., Cossarini, G., Bolzon, G., Feudale, L., Lazzari, P., Teruzzi, A., et al. (2019). Novel metrics based on Biogeochemical Argo data to improve the model uncertainty evaluation of the CMEMS Mediterranean marine ecosystem forecasts. Ocean Sci. 15, 997–1022. doi: 10.5194/os-15-997-2019
Sathyendranath, S., Pardo, S., Benincasa, M., Brando, V. E., Brewin, R. J. W., Mélin, F., et al. (2018). 1.5. Essential Variables: ocean Colour in Copernicus Marine Service Ocean State Report - Issue 2. J. Operat. Oceanogr. 11, 1–142. doi: 10.1080/1755876X.2018.1489208
Schneider, A., Tanhua, T., Körtzinger, A., and Wallace, D. W. R. (2010). High anthropogenic carbon content in the eastern Mediterranean. J. Geophys. Res. 115:C12050. doi: 10.1029/2010JC006171
Schneider, A., Tanhua, T., Roether, W., and Steinfeldt, R. (2014). Changes in ventilation of the Mediterranean Sea during the past 25 year. Ocean Sci. 10, 1–16. doi: 10.5194/os-10-1-2014
Sharp, J. D., Pierrot, D., Humphreys, M. P., Epitalon, J.-M., Orr, J. C., Lewis, E. R., et al. (2020). CO2SYSv3 for MATLAB (Version v3.2.0). Zenodo. Available online at: (https://zenodo.org/record/4774718#.YWRThxBBw7w
Siegel, D. A., Buesseler, K. O., Doney, S. C., Sailley, S. F., Behrenfeld, M. J., and Boyd, P. W. (2014). Global assessment of ocean carbon export by combining satellite observations and food-web models. Glob. Biogeochem. Cycles 28, 181–196.
Siokou-Frangou, I., Christaki, U., Mazzocchi, M. G., Montresor, M., Ribera d’Alcalá, M., Vaqué, D., et al. (2010). Plankton in the open Mediterranean Sea: a review. Biogeosciences 7, 1543–1586. doi: 10.5194/bg-7-1543-2010
Sisma-Ventura, G., Kress, N., Silverman, J., Gertner, Y., Ozer, T., Biton, E., et al. (2021). Post-eastern Mediterranean transient oxygen decline in the deep waters of the southeast Mediterranean Sea supports weakening of ventilation rate. Front. Mar. Sci. 7:598686. doi: 10.3389/fmars.2020.598686
Skliris, N., Zika, J. D., Herold, L., Josey, S. A., and Marsh, R. (2018). Mediterranean sea water budget long-term trend inferred from salinity observations. Clim. Dyn. 51, 2857–2876. doi: 10.1007/s00382-017-4053-7
Storto, A., Masina, S., and Navarra, A. (2016). Evaluation of the CMCC eddy-permitting global ocean physical reanalysis system (C-GLORS, 1982–2012) and its assimilation components. Q. J. R. Meteorol. Soc. 142, 738–758.
Stow, C. A., Jolliff, J., McGillicuddy, D. J. Jr., Doney, S. C., Allen, J. I., Friedrichs, M. A., et al. (2009). Skill assessment for coupled biological/physical models of marine systems. J. Mar. Syst. 76, 4–15.
Teruzzi, A., Bolzon, G., Cossarini, G., Lazzari, P., Salon, S., Crise, A., et al. (2019a). Mediterranean Sea Biogeochemical Reanalysis (CMEMS MED-Biogeochemistry) Data set. Copernicus Monitoring Environment Marine Service (CMEMS). doi: 10.25423/MEDSEA_REANALYSIS_BIO_006_008
Teruzzi, A., Bolzon, G., Salon, S., Lazzari, P., Solidoro, C., and Cossarini, G. (2018). Assimilation of coastal and open sea biogeochemical data to improve phytoplankton modelling in the Mediterranean Sea. Ocean Model. 132, 46–60. doi: 10.1016/j.ocemod.2018.09.007
Teruzzi, A., Cossarini, G., Lazzari, P., Salon, S., Bolzon, G., Crise, A., et al. (2016). Mediterranean Sea Biogeochemical Reanalysis (CMEMS MED REABiogeochemistry 1999–2015). Copernicus Monitoring Environment Marine Service. Lecce: Centro Euro-Mediterraneo sui Cambiamenti Climatici.
Teruzzi, A., Di Biagio, V., Feudale, L., Bolzon, G., Lazzari, P., Salon, S., et al. (2021). Data from: mediterranean Sea Biogeochemical Reanalysis (CMEMS MED-Biogeochemistry, MedBFM3 system) (Version 1) [Data set]. Copernicus Monitoring Environment Marine Service (CMEMS), doi: 10.25423/CMCC/MEDSEA_MULTIYEAR_BGC_006_008_MEDBFM3
Teruzzi, A., Di Cerbo, P., Cossarini, G., Pascolo, E., and Salon, S. (2019b). Parallel implementation of a data assimilation scheme for operational oceanography: the case of the OGSTM-BFM model system. Comput. Geosci. 124, 103–114. doi: 10.1016/j.cageo.2019.01.003
Teruzzi, A., Dobricic, S., Solidoro, C., and Cossarini, G. (2014). A 3-D variational assimilation scheme in coupled transport biogeochemical models: forecast of Mediterranean biogeochemical properties. J. Geophys. Res. Oceans 119, 200–217. doi: 10.1002/2013JC009277
Terzić, E., Lazzari, P., Organelli, E., Solidoro, C., Salon, S., D’Ortenzio, F., et al. (2019). Merging bio-optical data from Biogeochemical-Argo floats and models in marine biogeochemistry. Biogeosciences 16, 2527–2542. doi: 10.5194/bg-16-2527-2019
Terzić, E., Salon, S., Cossarini, G., Solidoro, C., Teruzzi, A., Miró, A., et al. (2021). Impact of interannually variable diffuse attenuation coefficients for downwelling irradiance on biogeochemical modelling. Ocean Model. 161:101793. doi: 10.1016/j.ocemod.2021.101793
Thierry, V. Bittig, H., and The Argo BGC Team. (2018). Argo Quality Control Manual for Dissolved Oxygen Concentration, Version 2.0. France: October 2018, IFREMER for Argo BGC Group, Villefranche-sur-Mer, France, p. 33. doi: 10.13155/46542
Touratier, F., and Goyet, C. (2011). Impact of the Eastern Mediterranean Transient on the distribution of anthropogenic CO2 and first estimate of acidification for the Mediterranean Sea. Deep Sea Res. 58, 1–15. doi: 10.1016/j.dsr.2010.10.002
Uitz, J., Stramski, D., Gentili, B. D’Ortenzio, F., and Claustre, H. (2012). Estimates of phytoplankton class-specific and total primary production in the Mediterranean Sea from satellite ocean color observations. Glob. Biogeochem. Cycles 26:GB2024. doi: 10.1029/2011GB004055
Vantrepotte, V., and Mélin, F. (2009). Temporal variability of 10-year global SeaWiFS time-series of phytoplankton chlorophyll a concentration. ICES J. Mar. Sci. 66, 1547–1556.
Velaoras, D., Papadopoulos, V. P., Kontoyiannis, H., Cardin, V., and Civitarese, G. (2019). Water masses and hydrography during april and june 2016 in the cretan sea and cretan passage (Eastern Mediterranean Sea). Deep Sea Res. Part II Top. Stud. Oceanogr. 164, 25–40. doi: 10.1016/j.dsr2.2018.09.005
Vichi, M., Lovato, T., Butenschön, M., Tedesco, L., Lazzari, P., Lazzari, P., et al. (2020). The Biogeochemical Flux Model (BFM): equation Description and User Manual in BFM Version 5.2 BFM Report Series N. 1. Release 1.2, BFM Report Series N. 1. Bologna, 87. Available online at: http://bfm-community.eu (accessed November 15, 2020).
von Schuckmann, K., Le Traon, P. Y., Alvarez-Fanjul, E., Axell, L., Balmaseda, M., Breivik, L. A., et al. (2016). The Copernicus Marine Environment Monitoring Service Ocean State Report. J. Operat. Oceanogr. 9, s235–s320. doi: 10.1080/1755876X.2016.1273446
von Schuckmann, K., Le Traon, P. Y., Smith, N., Pascual, A., Brasseur, P., Fennel, K., et al. (2018). Copernicus marine service ocean state report. J. Operat. Oceanogr. 11, S1–S142.
von Schuckmann, K., Le Traon, P.-Y., Smith, N., Pascual, A., Djavidnia, S., Gattuso, J. P., et al. (2020). Copernicus Marine Service Ocean State Report, Issue 4. J. Operat. Oceanogr. 13, S1–S172.
Keywords: Mediterranean Sea, biogeochemistry, reanalysis, data assimilation, multi-level validation, multi-scale variability
Citation: Cossarini G, Feudale L, Teruzzi A, Bolzon G, Coidessa G, Solidoro C, Di Biagio V, Amadio C, Lazzari P, Brosich A and Salon S (2021) High-Resolution Reanalysis of the Mediterranean Sea Biogeochemistry (1999–2019). Front. Mar. Sci. 8:741486. doi: 10.3389/fmars.2021.741486
Received: 14 July 2021; Accepted: 28 September 2021;
Published: 29 November 2021.
Edited by:
Marilaure Gregoire, University of Liège, BelgiumReviewed by:
John Patrick Dunne, Geophysical Fluid Dynamics Laboratory (GFDL), United StatesCristina Sobrino, University of Vigo, Spain
Copyright © 2021 Cossarini, Feudale, Teruzzi, Bolzon, Coidessa, Solidoro, Di Biagio, Amadio, Lazzari, Brosich and Salon. This is an open-access article distributed under the terms of the Creative Commons Attribution License (CC BY). The use, distribution or reproduction in other forums is permitted, provided the original author(s) and the copyright owner(s) are credited and that the original publication in this journal is cited, in accordance with accepted academic practice. No use, distribution or reproduction is permitted which does not comply with these terms.
*Correspondence: Gianpiero Cossarini, Z2Nvc3NhcmluaUBpbm9ncy5pdA==