 Pedro Luis Diaz-Carballido1
 Gabriela Mendoza-González2*
 Carlos Alberto Yañez-Arenas3
 Xavier Chiappa-Carrara3,4*
- 1Posgrado en Ciencias del Mar y Limnología, Universidad Nacional Autónoma de México, Mexico City, Mexico
- 2CONACYT-Facultad de Ciencias, UMDI-Sisal, Universidad Nacional Autónoma de México, Mérida, Mexico
- 3Facultad de Ciencias, Universidad Nacional Autónoma de México, Mexico City, Mexico
- 4Escuela Nacional de Estudios Superiores–Mérida, Universidad Nacional Autónoma de México, Mérida, Mexico
Climate change is currently considered one of the main phenomena affecting marine species through expansion or contraction of their distribution. Being ectothermic organisms, sharks of the family Carcharhinidae could be highly susceptible to the effects of climate change. These sharks are of great ecological importance, which is reflected in their role in the integrity of coastal and oceanic ecosystems as top predators that act to maintain the stability of the food chain, as well as providing economic value through fishing, consumption, and ecotourism. Currently, their populations are threatened by fishing pressure and anthropogenic activities, including meeting the demand for shark fins. Despite the ecological and economical importance of carcharhinid sharks, knowledge regarding how they are impacted by climate change remains scarce. Ecological niche modeling is a tool that allows analysis of future potential distributions under different climate change scenarios and could contribute to future planning activities and improved conservation outcomes for sharks. We generated models in Maxent in order to predict the potential geographic distribution of 25 carcharhinid sharks that inhabit Mexican waters, projecting this onto future climate change scenarios (RCP2.6, RCP4.5, RCP6.0, and RCP8.5) to calculate the potential losses and gains in their distribution areas by the year 2050. The greatest shifts in suitable areas were observed for the sharks Triaenodon obesus (gained area) and Carcharhinus porosus (lost area). Overall, under all four RCP future scenarios, six species presented gains in suitable area and 19 species presented losses. The greatest loss of suitable area for carcharhinid sharks was found with RCP8.5; however, under this high-emissions global warming scenario, seven species actually showed an increase in distribution area. Our results therefore indicate that climate change could reduce suitable areas for most of the species by 2050. Assessment of the distribution of shark species under climate change is urgently required in order to prioritize conservation efforts toward the most vulnerable species and to ensure the natural function of marine ecosystems, thus maintaining the important ecosystem services they provide to human society.
Introduction
Climate change is currently considered one of the main phenomena that influence the phenology and physiology of some marine species, through modification of environmental variables (Parmesan and Yohe, 2003; Jones et al., 2013; Poloczanska et al., 2013). The tropical marine fauna is among the groups of animals most sensitive to climate change, since the members evolved in a relatively stable thermal environment (Rosa et al., 2014) and are expected to respond to environmental change by shifting their distributions to areas more conducive to maintaining a physiological optimum (Hobday, 2010; Tittensor et al., 2010; Cheung et al., 2012, 2015; Hazen et al., 2013; Nakamura et al., 2013; Robinson et al., 2015; Fogarty et al., 2016).
Regarding the modification of environmental variables, the global average sea surface temperature is predicted to rapidly rise by 1–3°C, as a result of the greenhouse effect (IPCC, 2013). Changes in sea surface temperature are often accompanied by variations in salinity, which is another environmental variable that could be modified by climate change. For instance, decreased salinity can be due to the melting of glaciers and ice sheets, while increased salinity can be produced by higher sea surface temperatures and evaporation (Durack et al., 2012). Variations in salinity are also related to large-scale changes in water movement and it has been speculated that increased wind stress due to climate change could lead to increased coastal currents and upwelling (Bakun, 1990).
Recent evaluations of species distribution have assessed the potential impacts of climate change on both terrestrial and marine organisms (Peterson et al., 2011; Jones et al., 2013; Wabnitz et al., 2018). One taxonomic group of marine fishes that has been put at risk by the rapid environmental modification imposed by climate change is Chondrichthyes (sharks, rays, and chimeras) (Field et al., 2009). Some studies of shark species in particular have described potential changes in their distribution in response to projected changes in climate, which are related to the reduced or increased availability of suitable habitat and poleward shifts in their distribution (Hare et al., 2016; Tanaka et al., 2021). Other studies have evaluated the potential distribution of carcharhinid sharks with climate change using species distribution modeling and generally report a reduction or shift in suitable area for future distributions under different climate change scenarios (Jones et al., 2013; Lezama-Ochoa et al., 2016; Gonzalez-Pestana, 2018; Birkmanis et al., 2020; Crear et al., 2020).
In this context, ecological niche models (ENM) can be employed to describe the geographic and ecological aspects of species and are widely used to assess potential future distributions using a correlative approach between species presence records and environmental variables (Jones and Cheung, 2015; Chefaoui et al., 2019). To assess shifts in future species distributions using ecological niche modeling, it is common to use environmental variables from different future scenarios derived from general circulation (GCMs) and atmosphere-ocean general circulation (AOGCMs) models (Wiens et al., 2009; Harris et al., 2014; Peterson et al., 2018). In the Special Report on Emissions Scenarios (SRES), the Intergovernmental Panel on Climate Change (IPCC) published a family of greenhouse gas scenarios (A1, A2, B1, and B2) that comprise storylines of different demographic, societal, economic, and technical change that assume different future increases in greenhouse gas emissions (IPCC, 2000). These initial emission scenarios were recently updated in the IPCC Fifth Assessment Report (AR5) by replacement with Representative Concentration Pathways (RCPs) that refer to radiative forcing (2.6, 4.5, 6.0, and 8.5 W/m2 by 2,100) and represent alternative greenhouse gas concentration trajectories. These RCPs include a mitigation scenario involving an initial increase in temperature followed by a decline (RCP2.6), two intermediate scenarios (RCP4.5 and RCP6.0), and finally an extreme scenario with very high annual greenhouse gas emissions and a very marked temperature increase (RCP8.5) (IPCC, 2013).
The consequences of climate change could also be reflected in the integrity of the ecosystem due to the close inter-dependency between it and the sharks. This relationship signifies that, in coastal and oceanic habitats, the sharks keep the food web healthy, maintain the carbon cycle and comprise one of the largest groups of apex predators. Sharks occupy a high trophic level in marine habitats and play a key role in the structure, function, and health of marine ecosystems (Davidson and Dulvy, 2017). Food webs are essential for the stability, maintenance, and control of the populations of the commercial and non-commercial species that occupy the lower trophic levels, indirectly affecting the economy. Given all of these functions, sharks also help to preserve the stability of ecosystems (such as coral reefs) and thus maintain the provision of their ecosystem services (Motivarash et al., 2020).
In addition to the effects of climate change on sharks, populations of their functionally important species assemblages have declined because of rising fishing pressure, increasing their risk of global extinction (Pacoureau et al., 2021). The depletion of sharks could also be the result of indirect anthropogenic threats, including loss or contamination of their habitat (Worm and Tittensor, 2011; Sguotti et al., 2016). This factor can be added to the disadvantages conferred by their intrinsic low phenotypic plasticity (Rosa et al., 2014) and life history patterns (e.g., slow growth, reduced fecundity, late sexual maturity, and long gestation time) (Cortés, 2000). Carcharhinids are subject to high fishing mortality as a result of intentional and incidental capture in a variety of fisheries (Bond et al., 2012; Dulvy et al., 2014), of which there are high levels in Mexico (Sosa-Nishizaki et al., 2020). Intentional fishing of Carcharhinids is mainly conducted to obtain liver oil, cartilage, meat, or fins, for example, in the case of Carcharhinus falciformis and Prionace glauca (Camhi et al., 2008; Santana-Morales et al., 2020). Furthermore, shark cage diving is currently a prominent feature of ecotourism activities in various parts of the world, including Mexico (Haas et al., 2017; Cisneros-Montemayor et al., 2020).
The members of the Carcharhinidae family include around 12 genera and 50 species, distributed worldwide in both tropical and temperate marine waters. This study focused on 25 carcharhinid sharks that inhabit the waters of Mexico and other areas of the world (Castro, 2011; Saldaña-Ruiz et al., 2019). Of these, 16% are categorized as vulnerable (VU), 52% as near threatened (NT), 16% as data deficient (DD) and 4% as not evaluated (NE) by the International Union for Conservation of Nature (IUCN, 2020).
As the climate continues to warm and change, its effects on vulnerable species should be examined via studies of ecological niche modeling (Hill et al., 2011; Bellard et al., 2012; Lezama-Ochoa et al., 2016; Davidson and Dulvy, 2017). Despite the possible impacts of climate change on shark distribution and their ecological importance and economic value, information on elasmobranch fish remains scarce (Rosa et al., 2014; Davidson and Dulvy, 2017). Knowledge of potential distribution shifts under different scenarios could support scientists and decision makers in the development of appropriate strategies to reduce climate change impacts on biodiversity through actions of early intervention, such as the design of potential protection areas that could become zones of suitable habitat under future climatic conditions (Bellard et al., 2012; Pacifici et al., 2015; Wilkening et al., 2019). The aim of this study was to use ecological niche modeling to evaluate potential changes in the global geographic distribution areas of the 25 carcharhinid sharks that inhabit Mexican waters, considering the climate change scenarios RCP2.6, RCP4.5, RCP6.0, and RCP8.5 for the year 2050. This information could help identify the species that are most vulnerable to climate change and quantify the percentage range of gains/losses over time in order to estimate their risk of extinction and thus inform the creation of a network of protected areas to ensure their persistence.
Materials and Methods
Species distribution modeling through estimation of the ecological niche is a correlative approach that uses species presence records (occurrence data of the entire life stages of species) and environmental variables that describe the climatic features of the area in which the species is distributed (Soberón and Nakamura, 2009). In the following sections, we address the different steps that we used to model the potential geographic distribution of carcharhinid sharks under different climate change scenarios.
Occurrence Data
Occurrence records of the complete known distribution of the species in the coastal and marine areas of the Atlantic, Pacific, and Indian Oceans were obtained from the databases of Global Biodiversity Information Facility (GBIF1), speciesLink2, VertNet3 and the Ocean Biogeographic Information System (OBIS4). We also used occurrences from Del Moral-Flores et al. (2015) and the ichthyological collections of CNPE–IBUNAM5 and CIICMYLP-UNAM6. Most of the occurrence records comprised preserved specimens or human observations recorded from 1960 to 2017.
A thorough inspection of each occurrence record was conducted in R 3.4.4 (R Core Team, 2018) in order to eliminate duplicate records and those with no specified location. We also cross-checked each occurrence record with the information available in the published literature in order to eliminate those that originated outside the known distribution or within the land mask of the Global Self-Consistent, Hierarchical, High resolution Shoreline (GSHHS) database (Wessel and Smith, 1996) in a Geographic Information System (GIS) (ArcMap 10.5). To reduce the effects of sampling bias, we filtered a large number of points grouped into specific areas using the function ‘GridSample’ of the ‘dismo’ package. This function divides the area in which the model is calibrated (see Section “M Area” for definition of calibration area) into different grid cell sizes and selects a number of occurrences in each cell as defined by the user. In this record filtering procedure, we selected a grid cell size of one or two degrees, depending on the lower or higher number of occurrence points (respectively), and one occurrence in each cell to maintain the best visual compromise between the largest possible number of occurrence data and a suitable level of homogeneity, according to Voda et al. (2015). This record thinning procedure eliminates the number of occurrences derived from repeated sampling events in the same area (Hijmans, 2012; Hijmans and Elith, 2013), but was not applied to those species with <100 occurrence points.
Environmental Data
Since the model is correlative, the algorithm obtains the environmental information relative to each point of occurrence (species presence record) that provides an estimate of the general environmental profile of the species. For this analysis, we used the known distribution of each species (at the regional or global scale, see “M Area” Section) (Table 1), current environmental data layers expressed for the entire current period (2000–2014), and future climate projection layers (2040–2050) obtained from the repository Bio-ORACLE (Ocean Rasters for Analysis of Climate and Environment)7. These layers were developed specifically to model marine species distributions (Tyberghein et al., 2011; Assis et al., 2017). The repository contains ocean rasters for analysis of climate and environment derived from both satellite-based and in situ data in regular two- and three-dimensional spatial grids, at a spatial resolution of 5 arcmins (∼9.2 km2). We selected environmental variables based on published information pertaining to species-habitat associations of carcharhinid sharks and their availability in the repository. Under this criterion, we used six different predictors for the variables of temperature, salinity, and current velocity, based on monthly averages for the current period: the long term average (mean); the minimum (min) and maximum (max) records; the long-term average of the minimum (ltmin) and maximum (ltmax) records per year; and range (range), which is the average of the absolute difference between the minimum and maximum records per year (Assis et al., 2017). These provide a total of 18 surface environmental variables, which we used to generate our models (Supplementary Table 1). In addition, we used their future projections based on the four RCP (RCP2.6, RCP4.5, RCP6.0, and RCP8.5) for the year 2050. We calibrated the models of the 25 carcharhinid sharks with two different sets of variables created as potential predictors of niche models (‘set_1’ and ‘set_2’). The former comprised all of the variables and the latter only the non-correlated variables. For ‘set_2,’ collinearity was reduced in order to avoid instability in parameter estimation and bias in the inference statistics (Dormann et al., 2012). In order to reduce collinearity among variables, we used the variance inflation factor (VIF). This factor excludes the highly correlated predictor variables from the set through a stepwise procedure based on the square of the multiple correlation coefficient and produced by regressing one predictor variable against all other predictor variables. Predictor variables greater than 10 VIF in value were removed and used to form ‘set_2.’ A VIF value greater than 10 is a signal that the predictor variables have high collinearity (Montgomery and Peck, 1992). This value statistically indicates a significant multicollinearity and is used in studies of niche modeling (Naimi and Araújo, 2016; Pradhan, 2016). However, the modeling algorithm we used (MaxEnt) compensates for high collinearity of variables using a method for regularization that addresses feature selection in order to assign relative contributions by weighting the variables throughout the analysis (Elith et al., 2011; Mendoza-González et al., 2016). For this reason, we also used ‘set_1.’
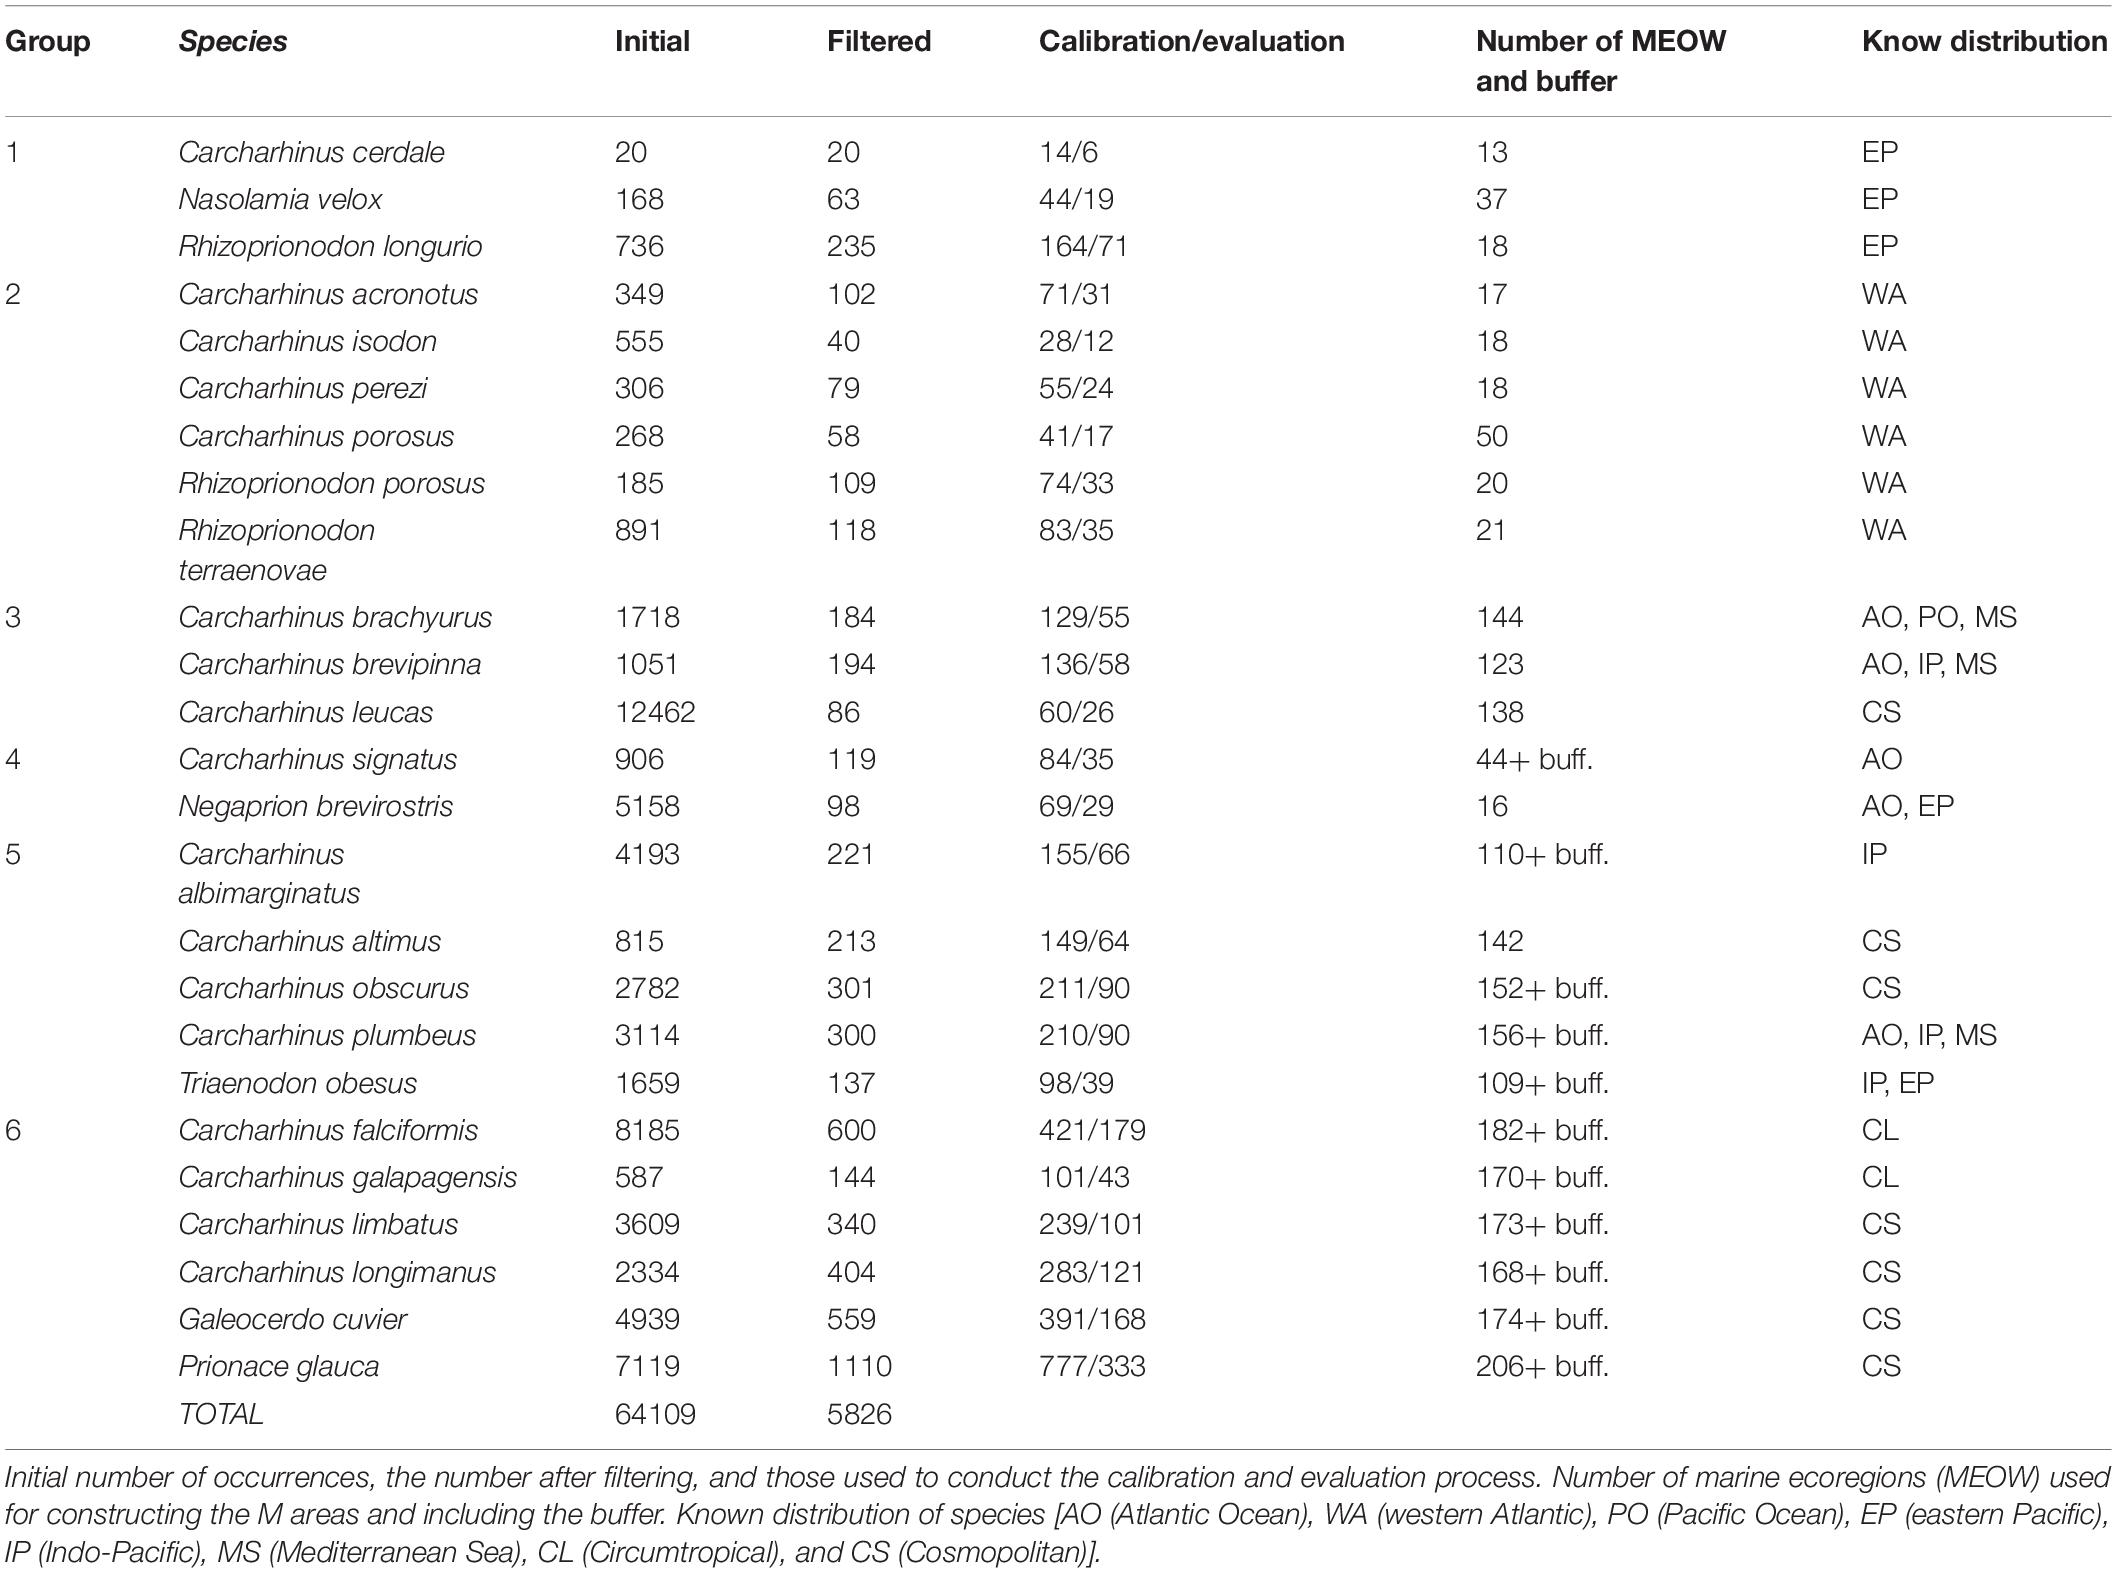
Table 1. List of modeled species, divided into groups according to their M area.
M Area
The M areas represent the geographic regions where the models are calibrated (calibration area) and are accessible to a species or population via dispersal over extended time periods (Peterson and Soberón, 2012; Banks, 2017). The importance of considering the M area when estimating ecological niches has been demonstrated, since it helps when transferring correlative models to other areas and has no effect on the calibration and validation processes (Barve et al., 2011; Peterson et al., 2018). Various different approaches can be adopted in order to calibrate the study area correctly, including the use of polygons, buffers, or distances based on species dispersal ability, among others. However, the question of how to better define the calibration area remains to be addressed (Simões et al., 2020). We developed an M area for each species based on the 232 marine ecoregions for coastal and shelf areas of the world (MEOW) of Spalding et al. (2007). The criterion used to define the extent of the species distribution was based on ecological delimitation and dispersal abilities for two cases. The first case considered only the MEOW for the species that are distributed in the coastal and shelf areas, and which presented specific characteristics such as homogeneous composition of species, upwelling, nutrient inputs, temperature regimes, etc. (Spalding et al., 2007). These MEOW were selected when they contained at least one point of occurrence for each species, and they were then grouped to form the species M area (M areas independent for each species). For some sharks, the known distribution was found in small areas within the MEOW but far from their limits; however, we still considered the complete extension of the MEOW, since they are considered biogeographic units within which the sharks could spread out given their dispersal capacities. In the second case, when the occurrence points were beyond the limits of MEOW, such as for non-coastal sharks, the M area was estimated through a 100 km radius buffer created around each occurrence, based on the dispersal ability of other pelagic and carcharhinid sharks (Speed et al., 2010; Acuña-Marrero et al., 2017; Spaet et al., 2017). Regarding the possible mobility of organisms through this region, we used a sea currents raster mask (Sun, 2018) as a basis for joining the resulting separated buffer areas with the marine ecoregions. In both cases of M area, we considered the total area of accessibility of the species (Barve et al., 2011).
Finally, we identified the following distributions for our study species: AO (Atlantic Ocean), WA (western Atlantic), PO (Pacific Ocean), EP (eastern Pacific), IP (Indo-Pacific), MS (Mediterranean Sea), CL (Circumtropical), and CS (Cosmopolitan). The number of marine ecoregions involved in constructing the M region per species, for which a buffer was applied, is shown in Table 1. The resulting model maps are presented in six groups depending on the M area of the species. The first three correspond to distributions only in MEOW and the second three correspond to distributions in MEOW and the generated buffers: (1) distribution in the eastern Pacific Ocean (EP), (2) distribution in the western Atlantic Ocean (WA), (3) distribution in the Mediterranean Sea and some oceans (AO, PO, MS, and IP), (4) distribution in eastern Pacific and/or Atlantic Ocean (AO, EP), (5) distribution in some ocean regions including the Mediterranean Sea (IP, CS, AO, MS, and EP), and (6) distribution in all ocean regions (Atlantic, Pacific, and Indian) including the Mediterranean Sea (with distributions CL and CS).
Construction of Models
For model calibration, we used MaxEnt 3.4.1 (Phillips et al., 2006), an algorithm based on the maximum entropy approach that is commonly used to estimate the potential distribution of species by correlating presence-only data with sets of environmental variables (Elith et al., 2010). This algorithm is very flexible and has many parameters that can be changed by users; however, the models are often constructed based on simple protocols by using the default parameter settings (i.e., auto-features) in the traditional platform, which could ultimately produce non-optimal (over-complex or over-simplistic) models. This could present a problem, particularly when dealing with a small number of occurrence points, in which case the recommendation is to evaluate the best potential combination of multiple parameterizations that can produce good fits for small data sets (Warren and Seifert, 2011; Radosavljevic and Anderson, 2014; Morales et al., 2017). Given the time-consuming nature of performing this task manually, we ran Maxent in R (R Core Team, 2018) using the kuenm package8 as an automated tool that allows users to generate many Maxent candidate models with varying calibration settings (feature classes, regularization multiplier, and sets of environmental variables) to obtain a species-specific parameterization, thus increasing the robustness of models over a much shorter time (Cobos et al., 2019). Feature classes (FC) are defined as transformations applied to the different covariates used in models to allow modeling of complex relationships. A regularization multiplier (RM) is a parameter that adds new constraints or imposes penalties on the model to prevent over-complexity and/or overfitting (Elith et al., 2010). Prior to the calibration process, the dataset of each species was randomly partitioned into training (70%) and validation (30%) data (Mendoza-González et al., 2016). The calibration process for candidate model creation was performed with a parameter setting using the kuenm-cal function using a combination of 15 feature classes (all potential combinations of four feature classes: linear, quadratic, product, and hinge); nine values of the regularization multiplier (1, 1.5, 2, 2.5, 3, 3.5, 4, 6, and 10) and the two sets of environmental variables (‘set_1’ and ‘set_2’). Two models were created for each parameter setting: one based on the complete filtered and thinned dataset of occurrences, and the other based only on the training data. The former is used to calculate model complexity and the latter to calculate significance and omission rates (Cobos et al., 2019). Likewise, the Jackknife function of Maxent was used to identify the percentage of contribution from each environmental variable (Phillips et al., 2006). Candidate model evaluation and best model selection were developed using the kuenm-ceval function. This function completes the process of calibration by evaluating and selecting models according to the following hierarchical evaluation criteria: (1) statistical significance of the model, using the area under the curve ratio (AUC) of the partial receiver operating characteristic (ROC) tests, with 500 iterations and 50% of the data used for bootstrapping, in which the AUC ranges from 1 to 2 (1 representing a random model, 2 representing a better than random performance); (2) model performance: predictive ability with omission rates (OR) ≤ 5%, which is our level of confidence in the training data; and (3) model complexity: based on the Akaike Information Criterion (AIC), which indicates how well the models fit to the data while penalizing complexity to favor more parsimonious and less overfitted models. Finally, we used the kuenm-mod function, which generated final continuous models of probability (suitability) with the parameter sets selected as best, including one model per species that met the three hierarchical evaluation criteria (AUC, OR, and AIC) and its corresponding environmental set (1 or 2). Once the model that best projected the distributions of the current time period was determined, it was used to transfer the projections to the four RCP scenarios of the future for each species (Cobos et al., 2019).
Projections to Future Scenarios (RCP)
The best final models per species in the current period were projected to the four RCPs (2.6, 4.5, 6.0, and 8.5) for the year 2050 using the kuenm-cal function. These scenarios are based on average data from different Atmosphere-Ocean General Circulation Models (AOGCMs: CCSM4, HadGEM2-ES, and MIROC5) available in Bio-ORACLE (see Text Footnote 7) (Assis et al., 2017).
Three different strategies can be used to extrapolate the models to the future: (1) truncation, which considers all conditions outside the calibration data range as unsuitable; (2) clamping, which extrapolates the marginal values in the calibration area as the prediction for more extreme conditions; and (3) actual extrapolation, which extends the response curve based on trends obtained from the calibration conditions (Qiao et al., 2019). In order to choose the optimum strategy, we calculated the climatic analogy (environmental similarity) between the present and future scenarios through the extrapolation risk in model transfers via mobility-oriented parity (MOP), which calculates the environmental difference between current (calibration region) and future (transfer region) scenarios (Owens et al., 2013). Since the MOP analysis indicated large areas of uncertainty for the projection of models under future scenarios, we used the truncated response, thus strongly reducing the combinations of environmental conditions under which models are calibrated in the present (Owens et al., 2013; Cobos et al., 2019). This step was applied using the kuenm-mop function implemented by kuenm (Cobos et al., 2019).
Current and future binary maps [suitable areas (1) – unsuitable areas (0)] were obtained by thresholding the final continuous models (present and future) using the criterion of 5% of allowed omission in the training presence (Cooper and Soberón, 2018). This cut-off threshold value for generating the binary maps utilizes the suitability values less than or equal to 5% in the presence points (training data) to classify absence (0) and those that exceed this value to classify presence (1). This percentage value was determined based on a fixed allowable omission error rate among the calibration data, assuming that up to 5% of the occurrence data may have included errors that misrepresented the environments used by the species. This value is considered appropriate when input data are heterogeneous and uncontrolled in origin (Anderson et al., 2003; Peterson et al., 2008; Costa et al., 2009) and is also the parameter that measures error associated with the presence localities dataset (Costa et al., 2009). Shifts in suitable areas for the current and different future scenarios were then obtained per species, through spatial analysis in a GIS (ArcMap 10.5), to produce three categories: (i) lost or contraction areas (areas suitable at present but not in the future), (ii) gained or expansion areas (areas unsuitable at present but suitable in the future), and (iii) maintained or stable suitable areas (areas suitable at present and in the future). These areas were then mapped, and percentage values for the gained, lost and maintained suitable areas for each species in each of the four future RCP scenarios calculated as the proportion of each category in relation to the total area of study, which is the M area of each species (area of category/total area * 100). We calculated the total shift of suitable areas by subtracting the loss of suitable area per species from the total percentages of gain, under all four future scenarios.
Results
A total of 64,109 presence records were compiled for the 25 species of carcharhinid sharks, and 5,826 occurrences remained after data cleaning. After filtering, the occurrence records ranged from 20 (Carcharhinus cerdale) to 1,110 (Prionace glauca) (Table 1). The lowest number of marine ecoregions used for constructing the accessible or M area was 13 and the highest was 206, including the buffer (Table 1). Following calibration of the 25 species models with the two different sets of variables, the best qualified according to the metrics described in the previous section were selected to be modeled with ‘set_1’ (18 species: all predicted variables) and ‘set_2’ (seven species: non-correlated variables only, Supplementary Table 2 and Table 2).
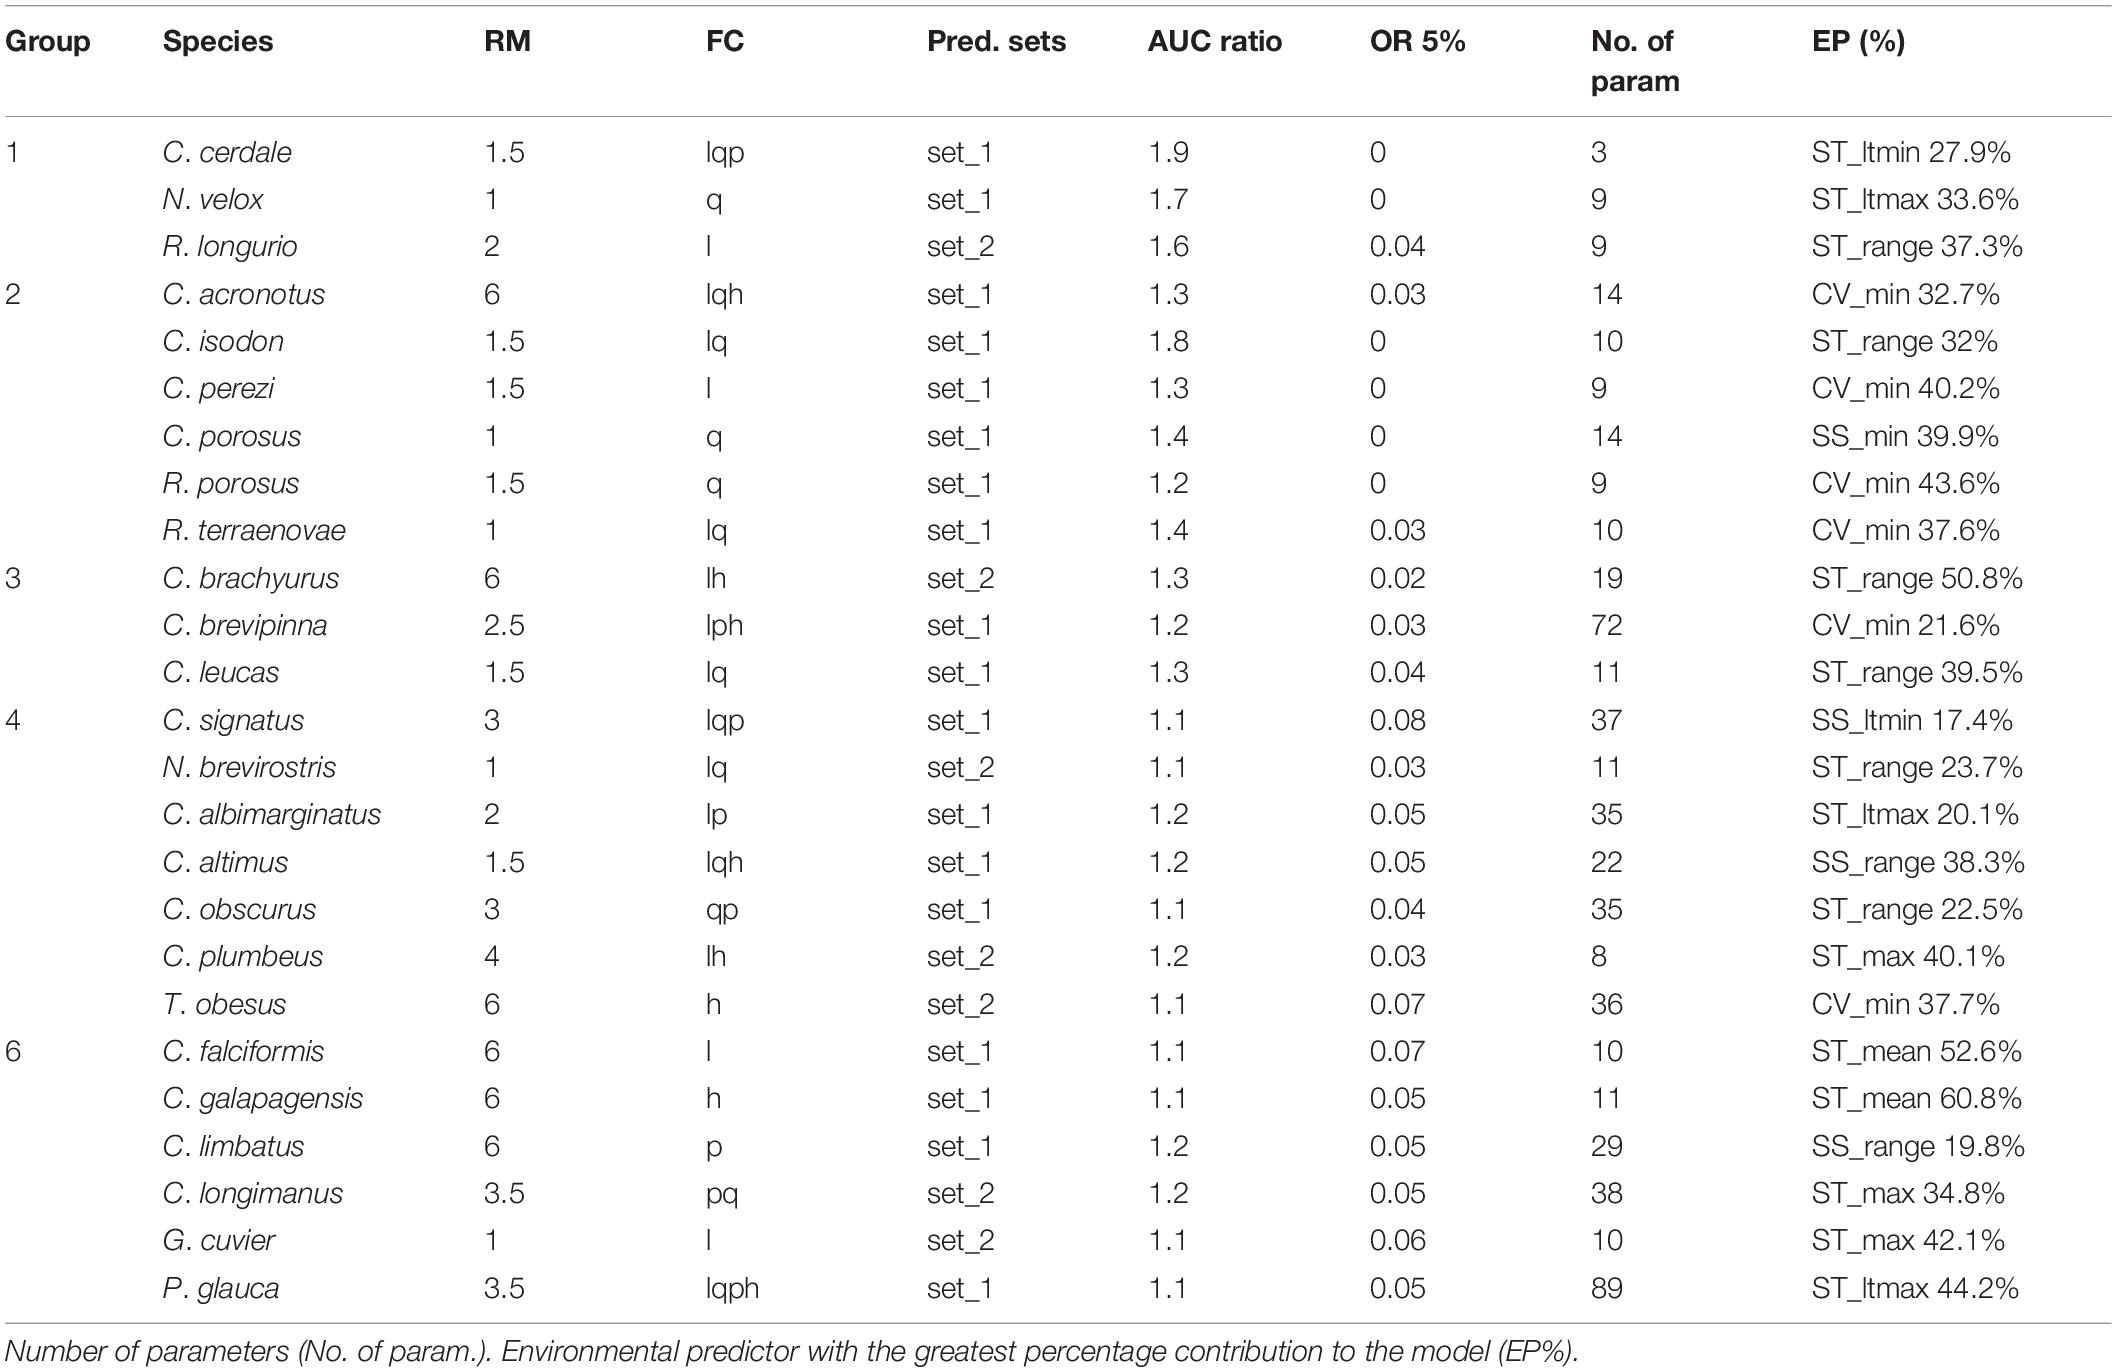
Table 2. Optimal parameters in kuenm models for each species, divided into groups according to their M area: regularization multiplier (RM), feature classes (FC) [linear (l), quadratic (q), product (p), and hinge (h)], set of environmental variables (Pred. Sets), AUC ratio of Partial ROC (AUC), omission rate accepting 5% error in training data (OR ≤ 5%).
A total of 270 candidate models were created per species, considering the combinations of 15 feature classes, nine regularization multipliers and two environmental data sets. The model evaluation presented statistical significance (P < 0.05), with the AUC ratios of partial ROC > 1 and some close to 2, indicating good model performance. Indeed, the performance in most of our models met the defined permissible omission rate threshold or better than random expectation (omission rates ≤ 5%), except for C. falciformis (0.07), Carcharhinus signatus (0.08), Galeocerdo cuvier (0.06), and T. obesus (0.07) (Table 2). According to the jackknife test results, there were differences among the species in terms of the relative importance of the environmental predictors (EP) used to construct the models. For example, the relative importance values of “Range surface temperature” (ST_range) and “Minimum surface current velocity” (CV_min) were highest in six species, “Maximum surface temperature” (ST_max) and “Average of the maximum records of temperature per year” (ST_ltmax) presented their highest values in three species, and “Mean surface temperature” (ST_mean) and “Range surface salinity” (SS_range) had their highest values in two species (Table 2). The final continuous models for the 25 species with the optimal parameterizations and the occurrences used for calibration were mapped (Supplementary Figures 1–25).
The mobility-oriented parity (MOP) analyses revealed areas with strict extrapolation risk or non-analogous environmental combinations for all species. For this reason, we decided to employ truncated estimates to create the future scenario maps (for all RCP scenarios) for each species. In this paper, we present the suitable areas gained, lost, and maintained, relative to the current species distribution, using binary maps only for the two most contrasting scenarios of low (RCP2.6) and high (RCP8.5) greenhouse gas emissions (Figures 1–6). Binary maps that present this information for all four RCP scenarios (2.6; 4.5; 6; and 8.5) are provided in 100 future maps for all species (Supplementary Figures 26–50).
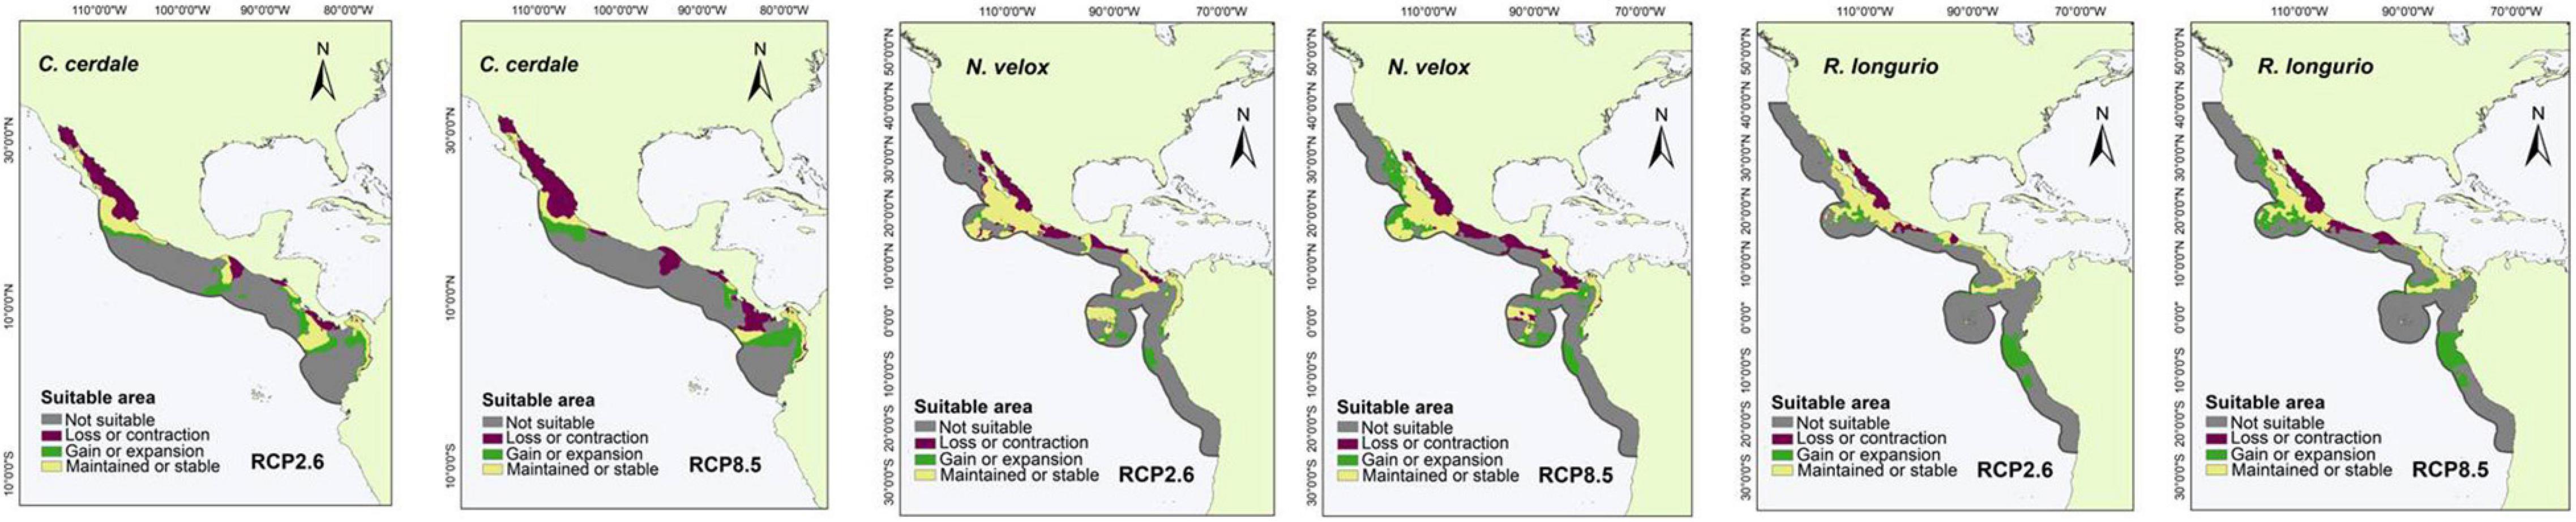
Figure 1. Suitable areas maintained, gained, and lost by the year 2050 under low (RCP2.6) and high (RCP8.5) greenhouse gas emission scenarios in species with an M area in the eastern Pacific Ocean: Carcharhinus cerdale, Nasolamia velox, and Rhizoprionodon longurio.
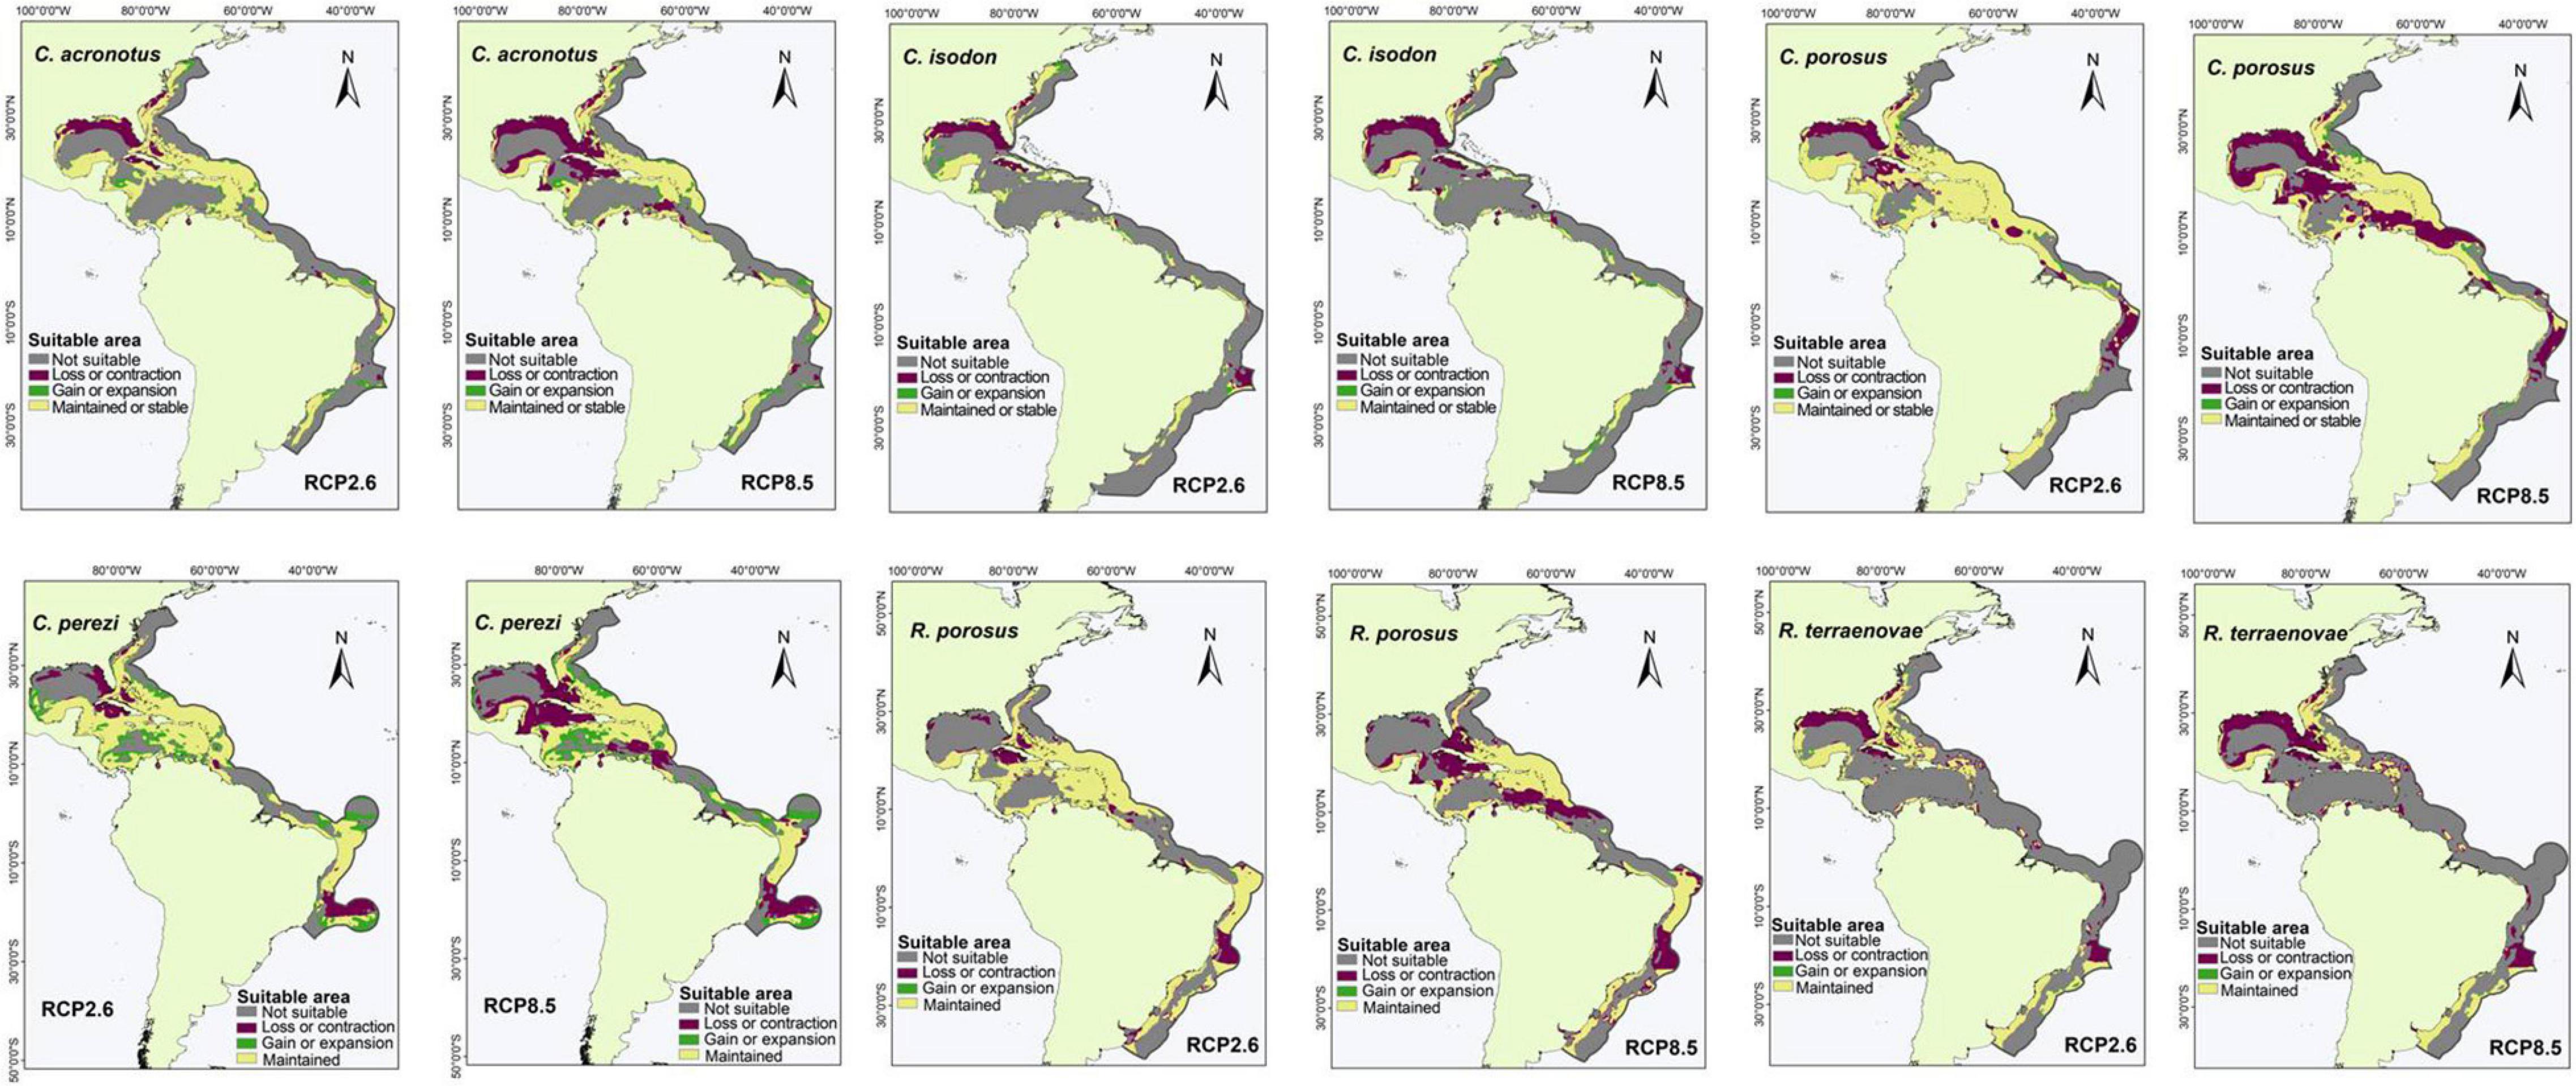
Figure 2. Suitable areas maintained, gained, and lost by the year 2050 under low (RCP2.6) and high (RCP8.5) greenhouse gas emission scenarios in species with an M area in the western Atlantic Ocean: Carcharhinus acronotus, Carcharhinus isodon, Carcharhinus porosus, Carcharhinus perezi, Rhizoprionodon porosus, and Rhizoprionodon terraenovae.
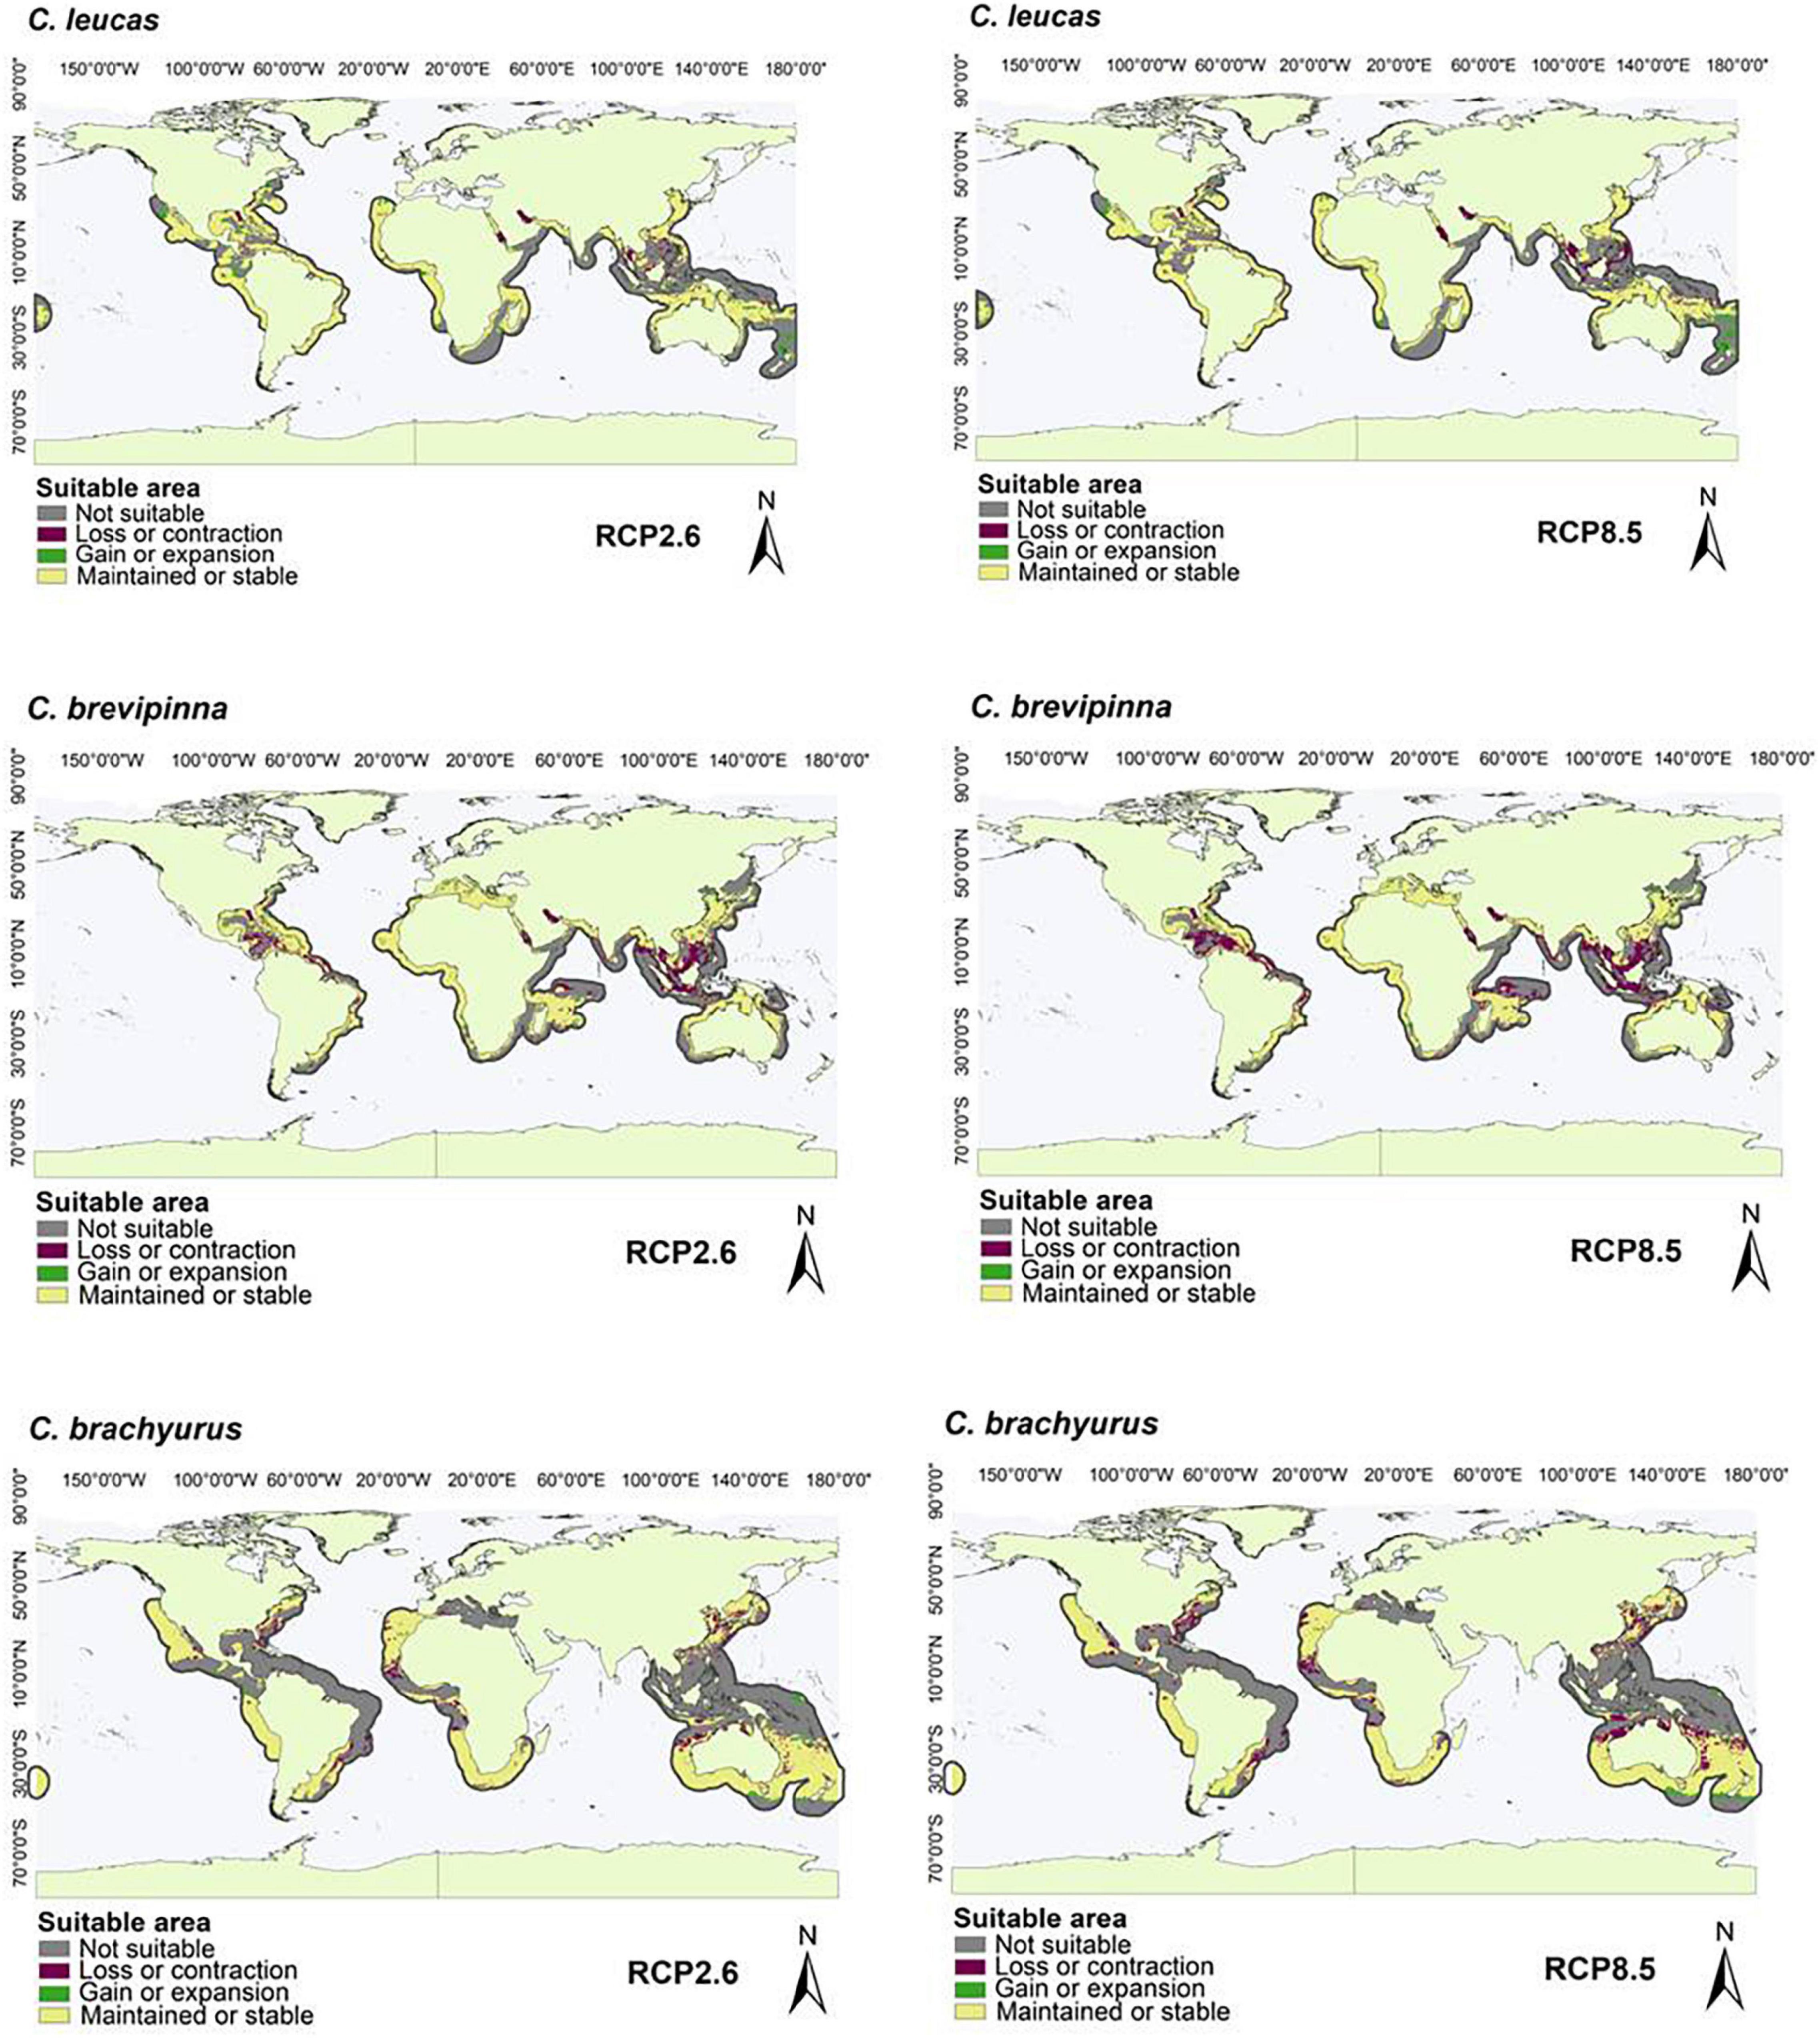
Figure 3. Suitable areas maintained, gained, and lost by the year 2050 under low (RCP2.6) and high (RCP8.5) greenhouse gas emission scenarios in species with an M area in the Mediterranean Sea and some Oceans (Atlantic, Pacific, and Indian): Carcharhinus leucas, Carcharhinus brevipinna, and Carcharhinus brachyurus.
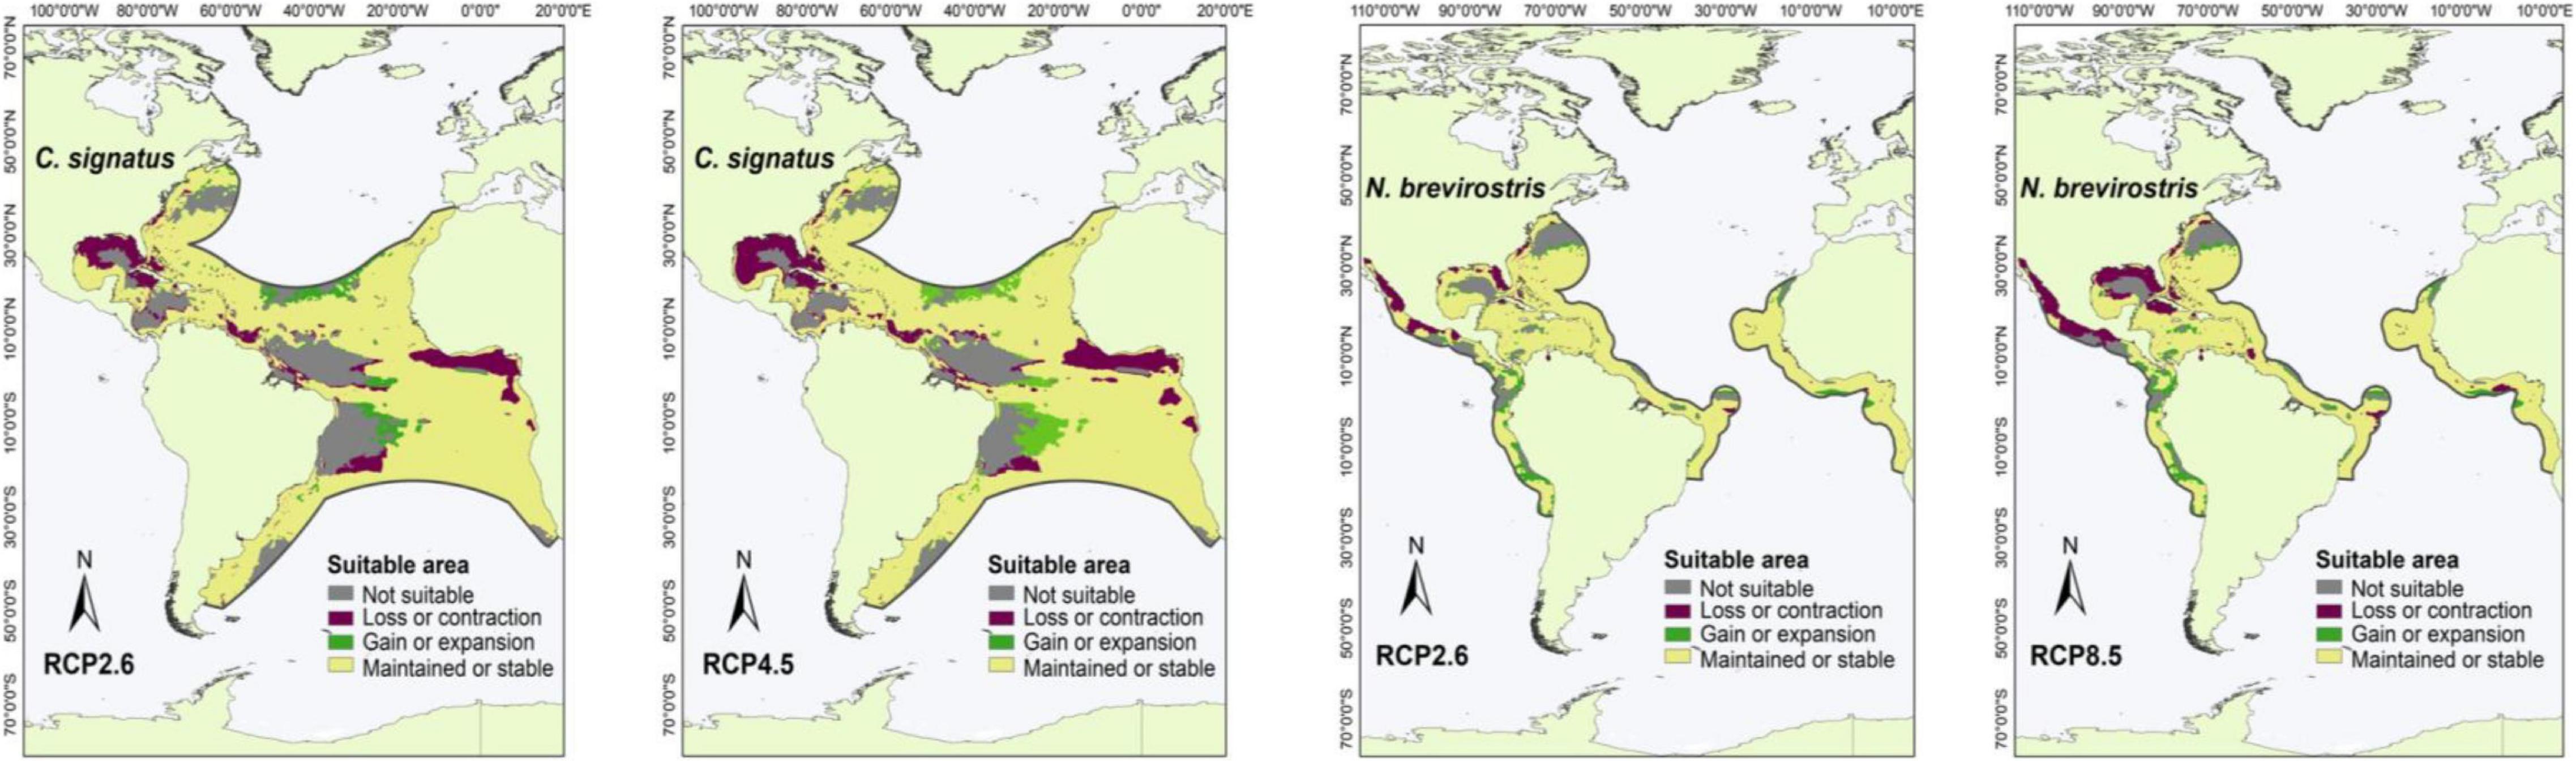
Figure 4. Suitable areas maintained, gained, and lost by the year 2050 under low (RCP2.6) and high (RCP8.5) greenhouse gas emission scenarios in species with occurrence points outside of marine ecoregions and M areas in the Pacific and/or Atlantic Ocean: C. signatus and N. brevirostris.
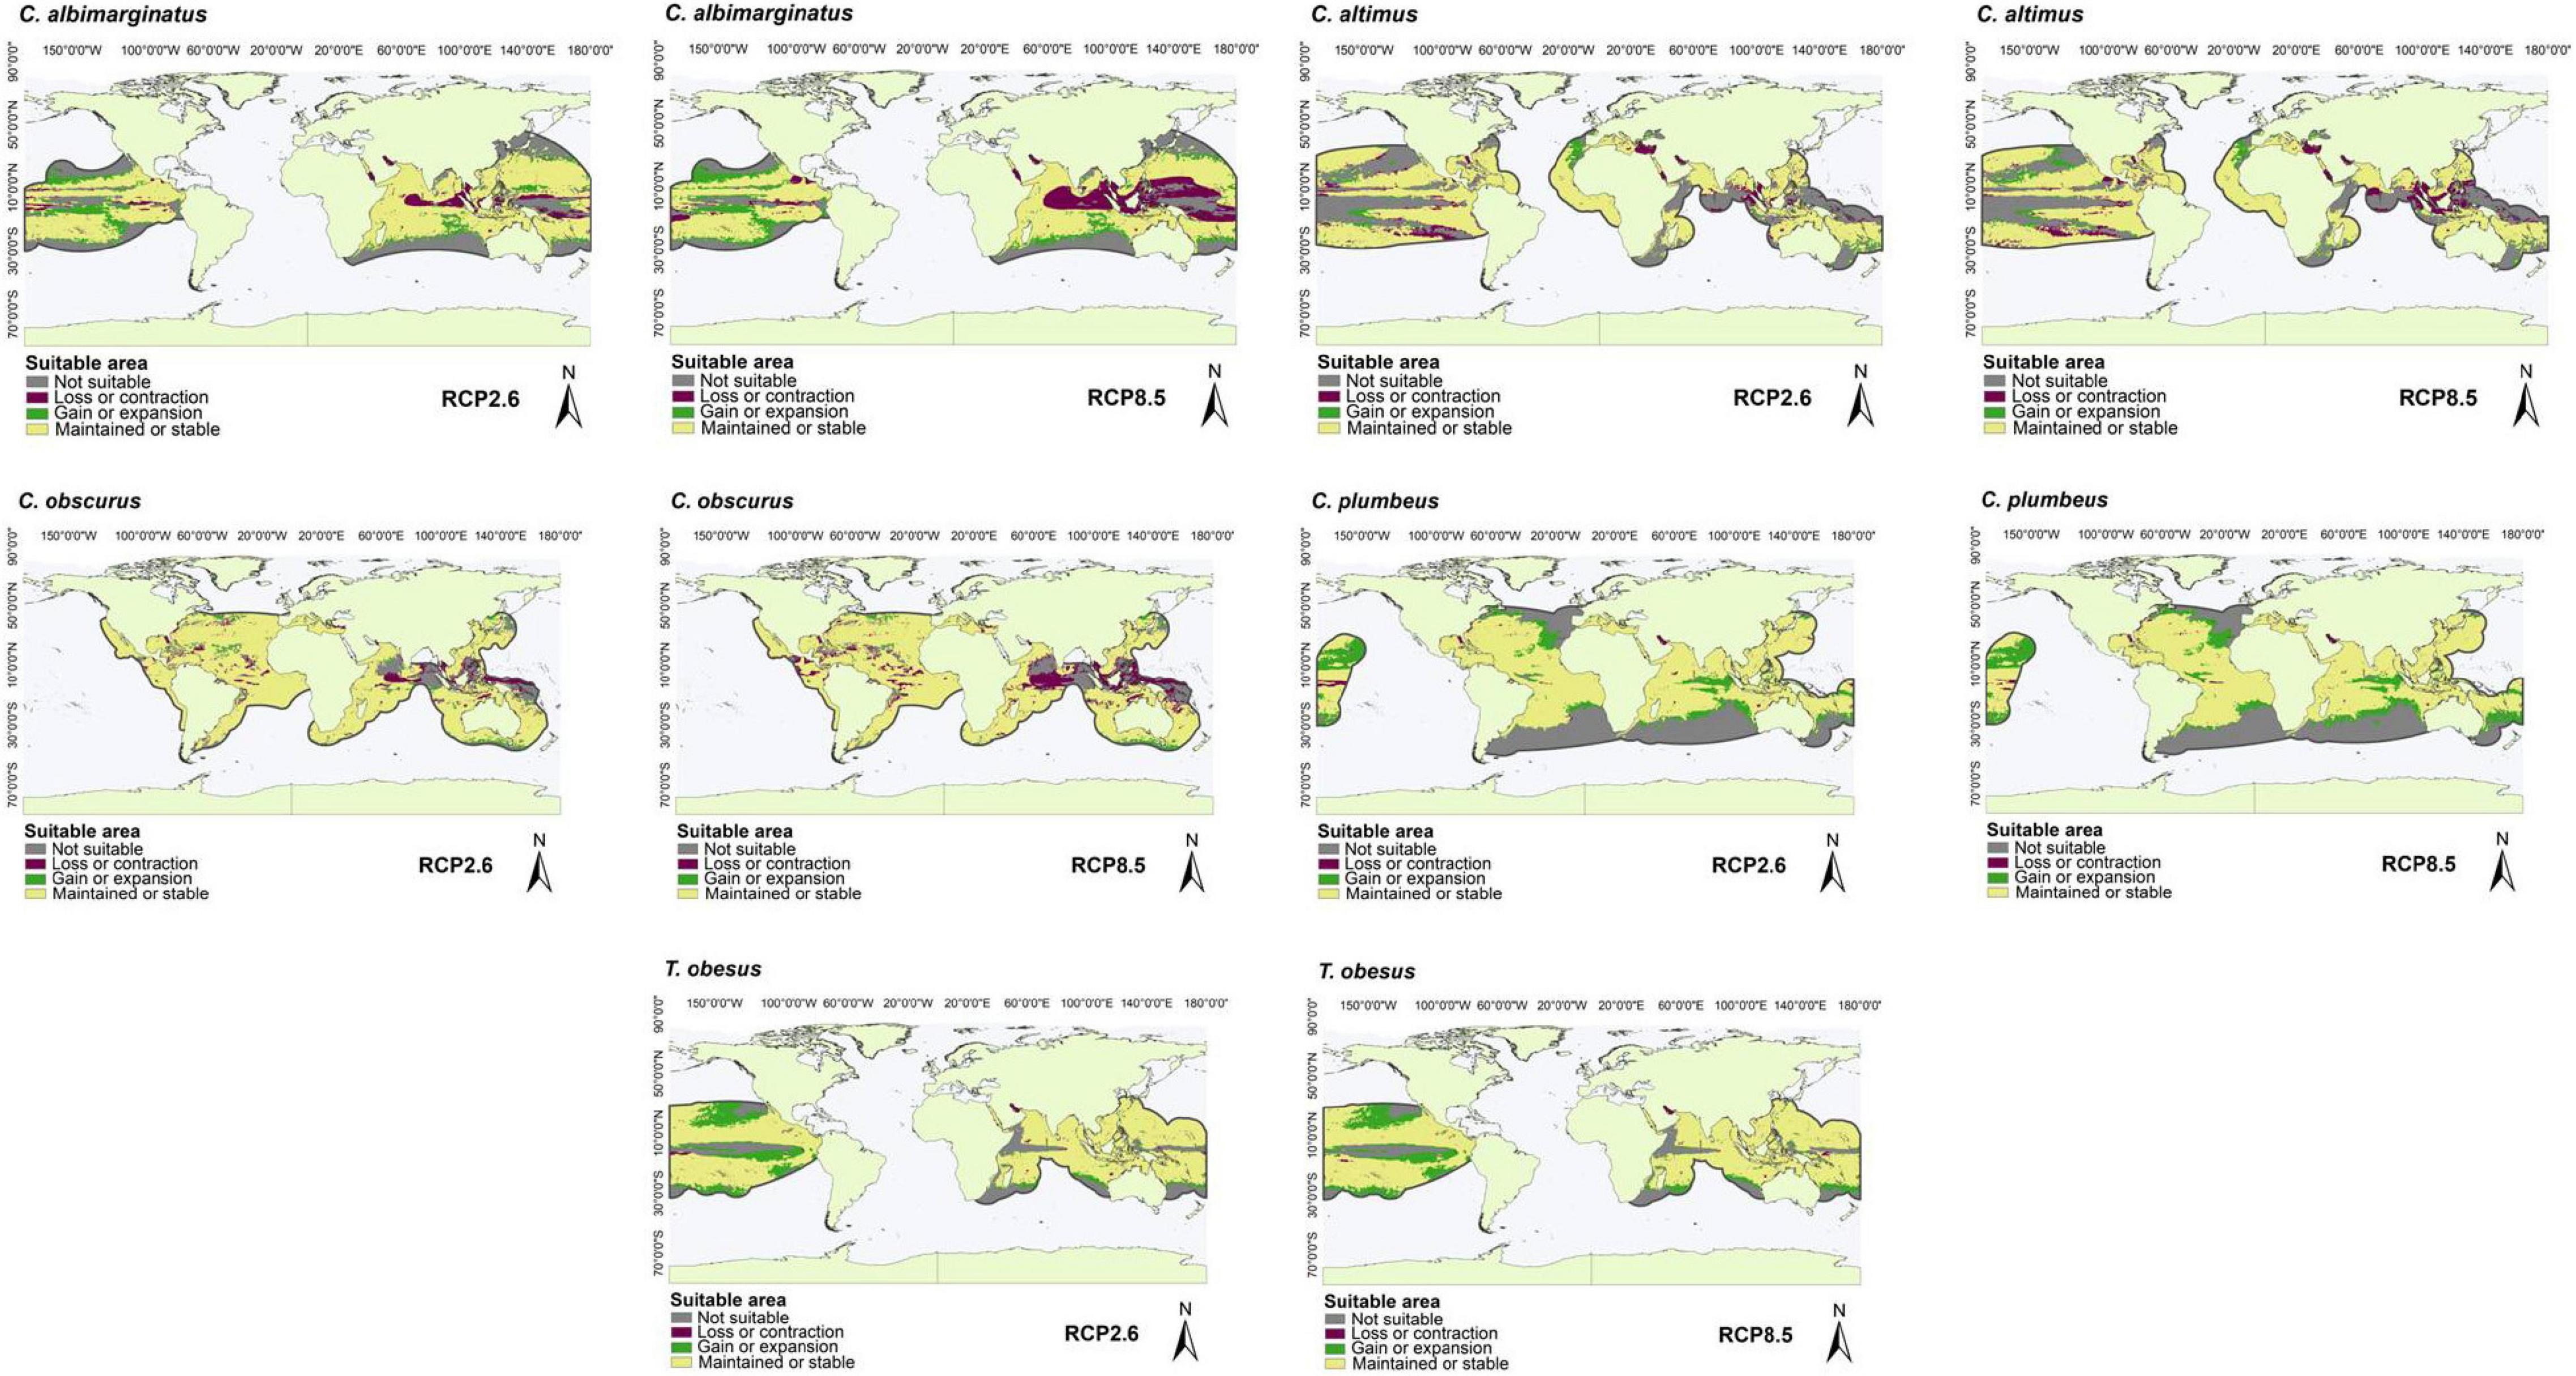
Figure 5. Suitable areas maintained, gained, and lost by the year 2050 under low (RCP2.6) and high (RCP8.5) greenhouse gas emission scenarios in species with occurrence points outside of marine ecoregions and M areas in some regions of the Oceans (Atlantic, Pacific, and Indian), including the Mediterranean Sea: C. albimarginatus, C. altimus, C. obscurus, C. plumbeus, and T. obesus.
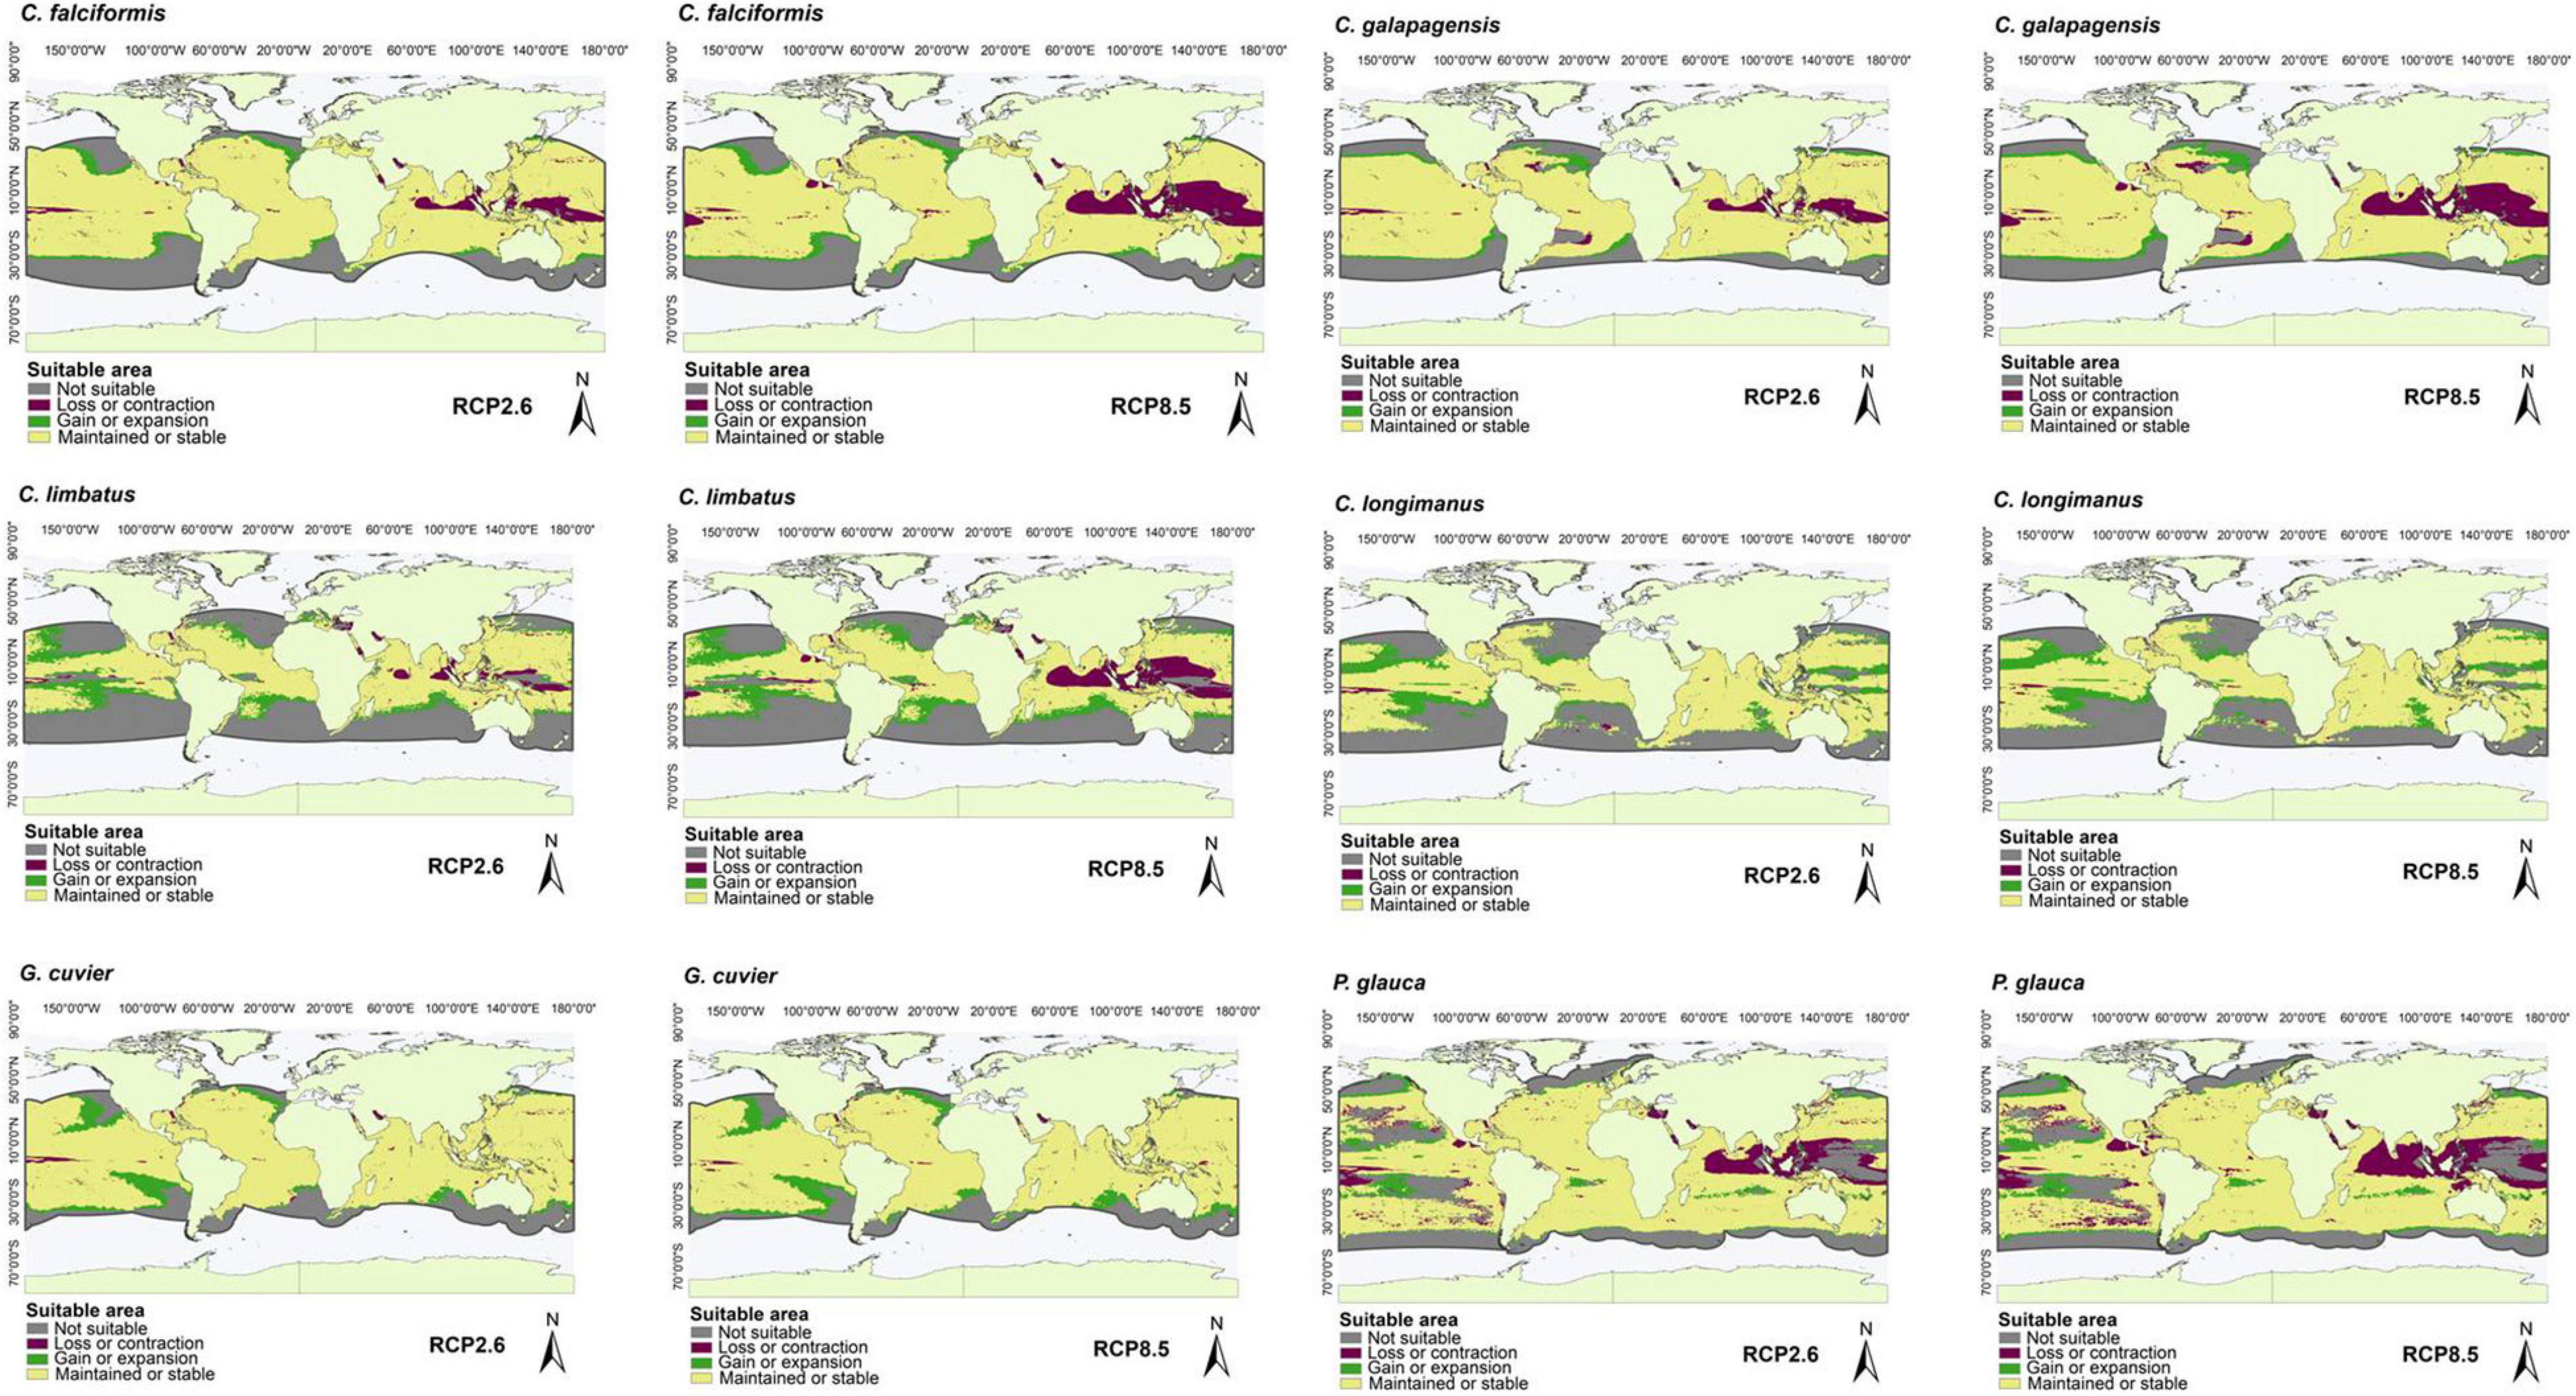
Figure 6. Suitable areas maintained, gained, and lost by the year 2050 under low (RCP2.6) and high (RCP8.5) greenhouse gas emission scenarios with occurrence points outside of marine ecoregions and M areas in all regions of the oceans (Atlantic, Pacific, and Indian), including the Mediterranean Sea: C. falciformis, Carcharhinus galapagensis, C. limbatus, C. longimanus, G. cuvier, and P. glauca.
For the species with distribution in the eastern Pacific Ocean (EP, group one), the area of greatest loss for the three species corresponded to the Gulf of California, while those of greatest gain were closer to the equator (Figure 1). For the species with distribution in the western Atlantic Ocean (WA, group two), the areas of greatest loss generally occurred in the northern Gulf of Mexico, with only Carcharhinus perezi showing areas of considerable gain in both scenarios. For the three species with distribution in the Mediterranean Sea and some oceans (AO, PO, MS, IP, and group three), there was a very wide area of maintenance or stability. In comparison, the areas of contraction or loss were very small, and corresponded to Southeast Asia (Figure 3). For the species with distribution in eastern Pacific and/or Atlantic Ocean (AO, EP, and group four), the areas of greatest loss generally occurred in the northern Gulf of Mexico for both species, while C. signatus and Negaprion brevirostris presented areas of loss in west Africa and in the Gulf of California, respectively (Figure 4). For the species with distribution in some ocean regions including the Mediterranean Sea (IP, CS, AO, MS, EP, and group five), the areas of loss for Carcharhinus albimarginatus, Carcharhinus altimus, and Carcharhinus obscurus were regionalized in South Asia. This is in contrast to Carcharhinus plumbeus and T. obesus, which generally presented maintained and gained areas across almost all of their distribution (Figure 5). Similar to the previous group, for the species with distribution in all ocean regions (Atlantic, Pacific, and Indian), including the Mediterranean Sea (with distributions CL, CS, group six), the unsuitable areas were found in South Asia, except for the species Carcharhinus longimanus and G. cuvier, which presented large maintained areas. The six species in this group presented gained areas in the extreme north and south of their respective M areas (Figure 6).
For all of the species in general, considering the four RCP scenarios, the highest gain in suitable area was found for T. obesus, while the highest loss in suitable area was for C. porosus and the highest maintained suitable area was for G. cuvier (Table 3). Under all four RCP future scenarios, the total shifts (gain – loss) presented losses in suitable areas for 13 species but gains for six species. However, under at least one RCP future scenario, 19 species showed losses while 11 presented gains. In most species, the main future losses of suitable area were observed under the extreme scenario RCP8.5 (Figure 7). For sharks in group one, C. cerdale showed a loss of suitable area under all climate change scenarios. In group two, all of the species presented losses in suitable area, except C. perezi, which showed small gains in all RCP except for RCP8.5. For groups three and four, the species showed loss of suitable area, except for Carcharhinus leucas and N. brevirostris, respectively, which showed low percentages of gain in suitable areas. Groups five and six presented the species with highest percentages of gain (Figure 7). On average, under all four RCP future scenarios, Carcharhinus porosus (in group two) was the species that presented the highest losses, while T. obesus (in group five) presented the highest gains (Figure 7).
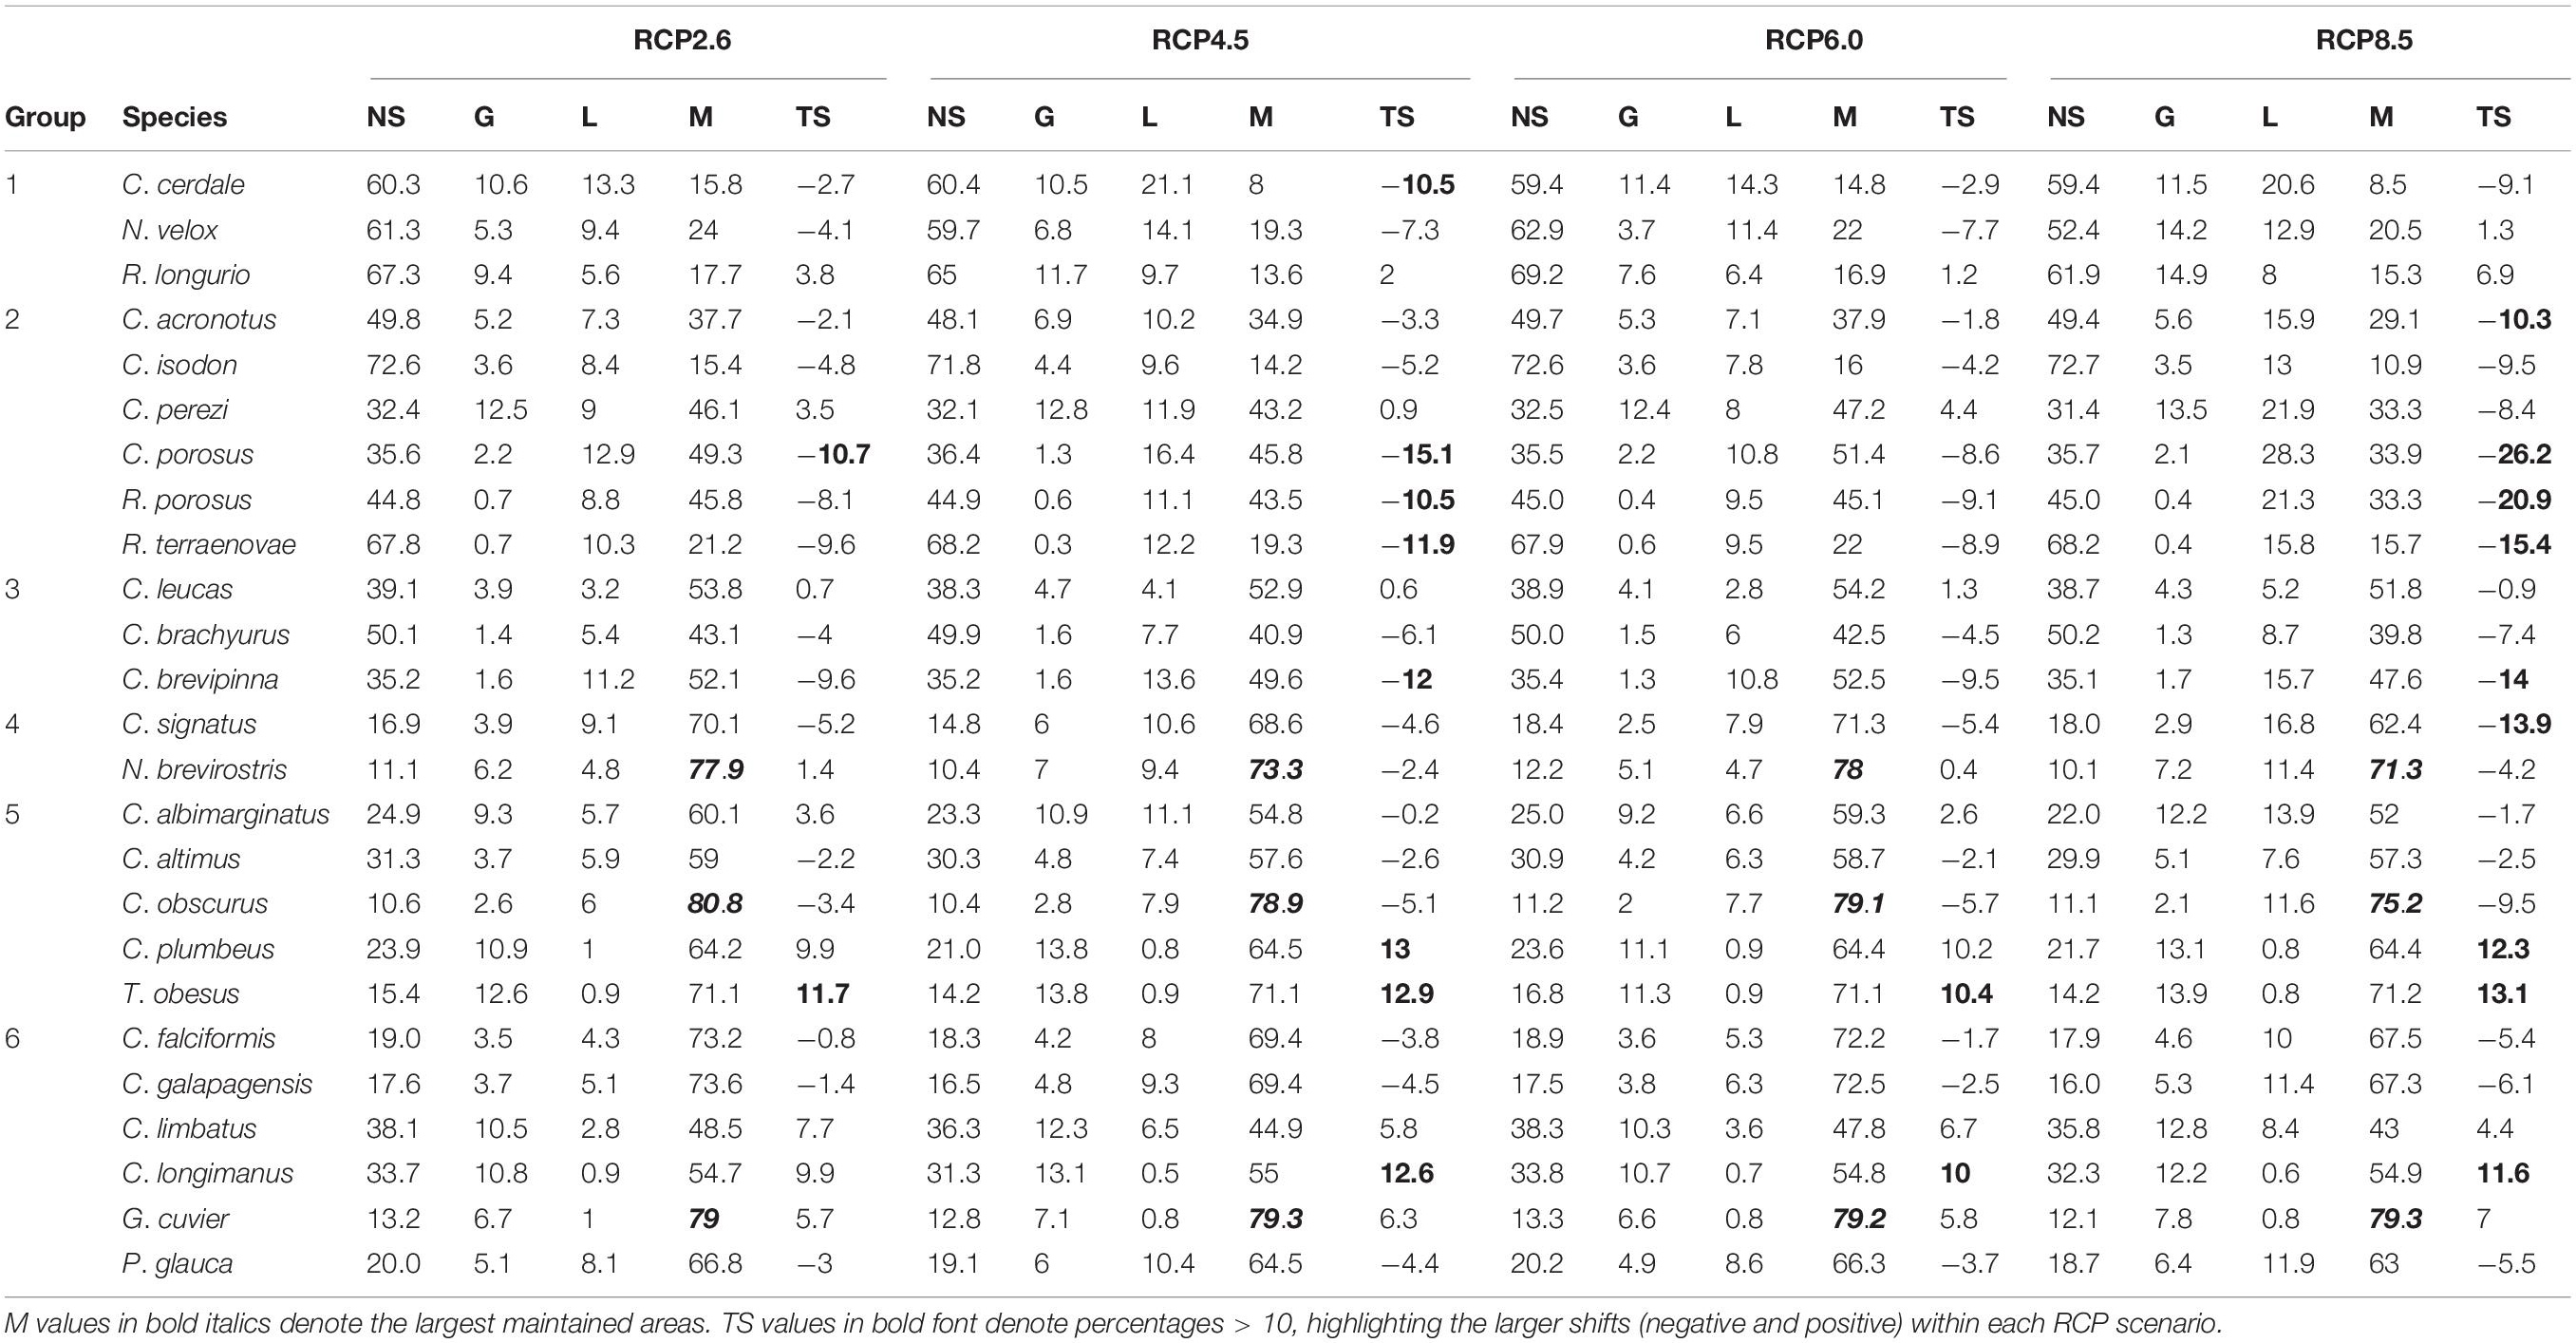
Table 3. Percentage of not suitable (NS), gained (G), lost (L), and maintained (M) areas, and total shift (TS) in the potential geographic distribution of each species under the RCP future scenarios, divided into groups according to their M area.
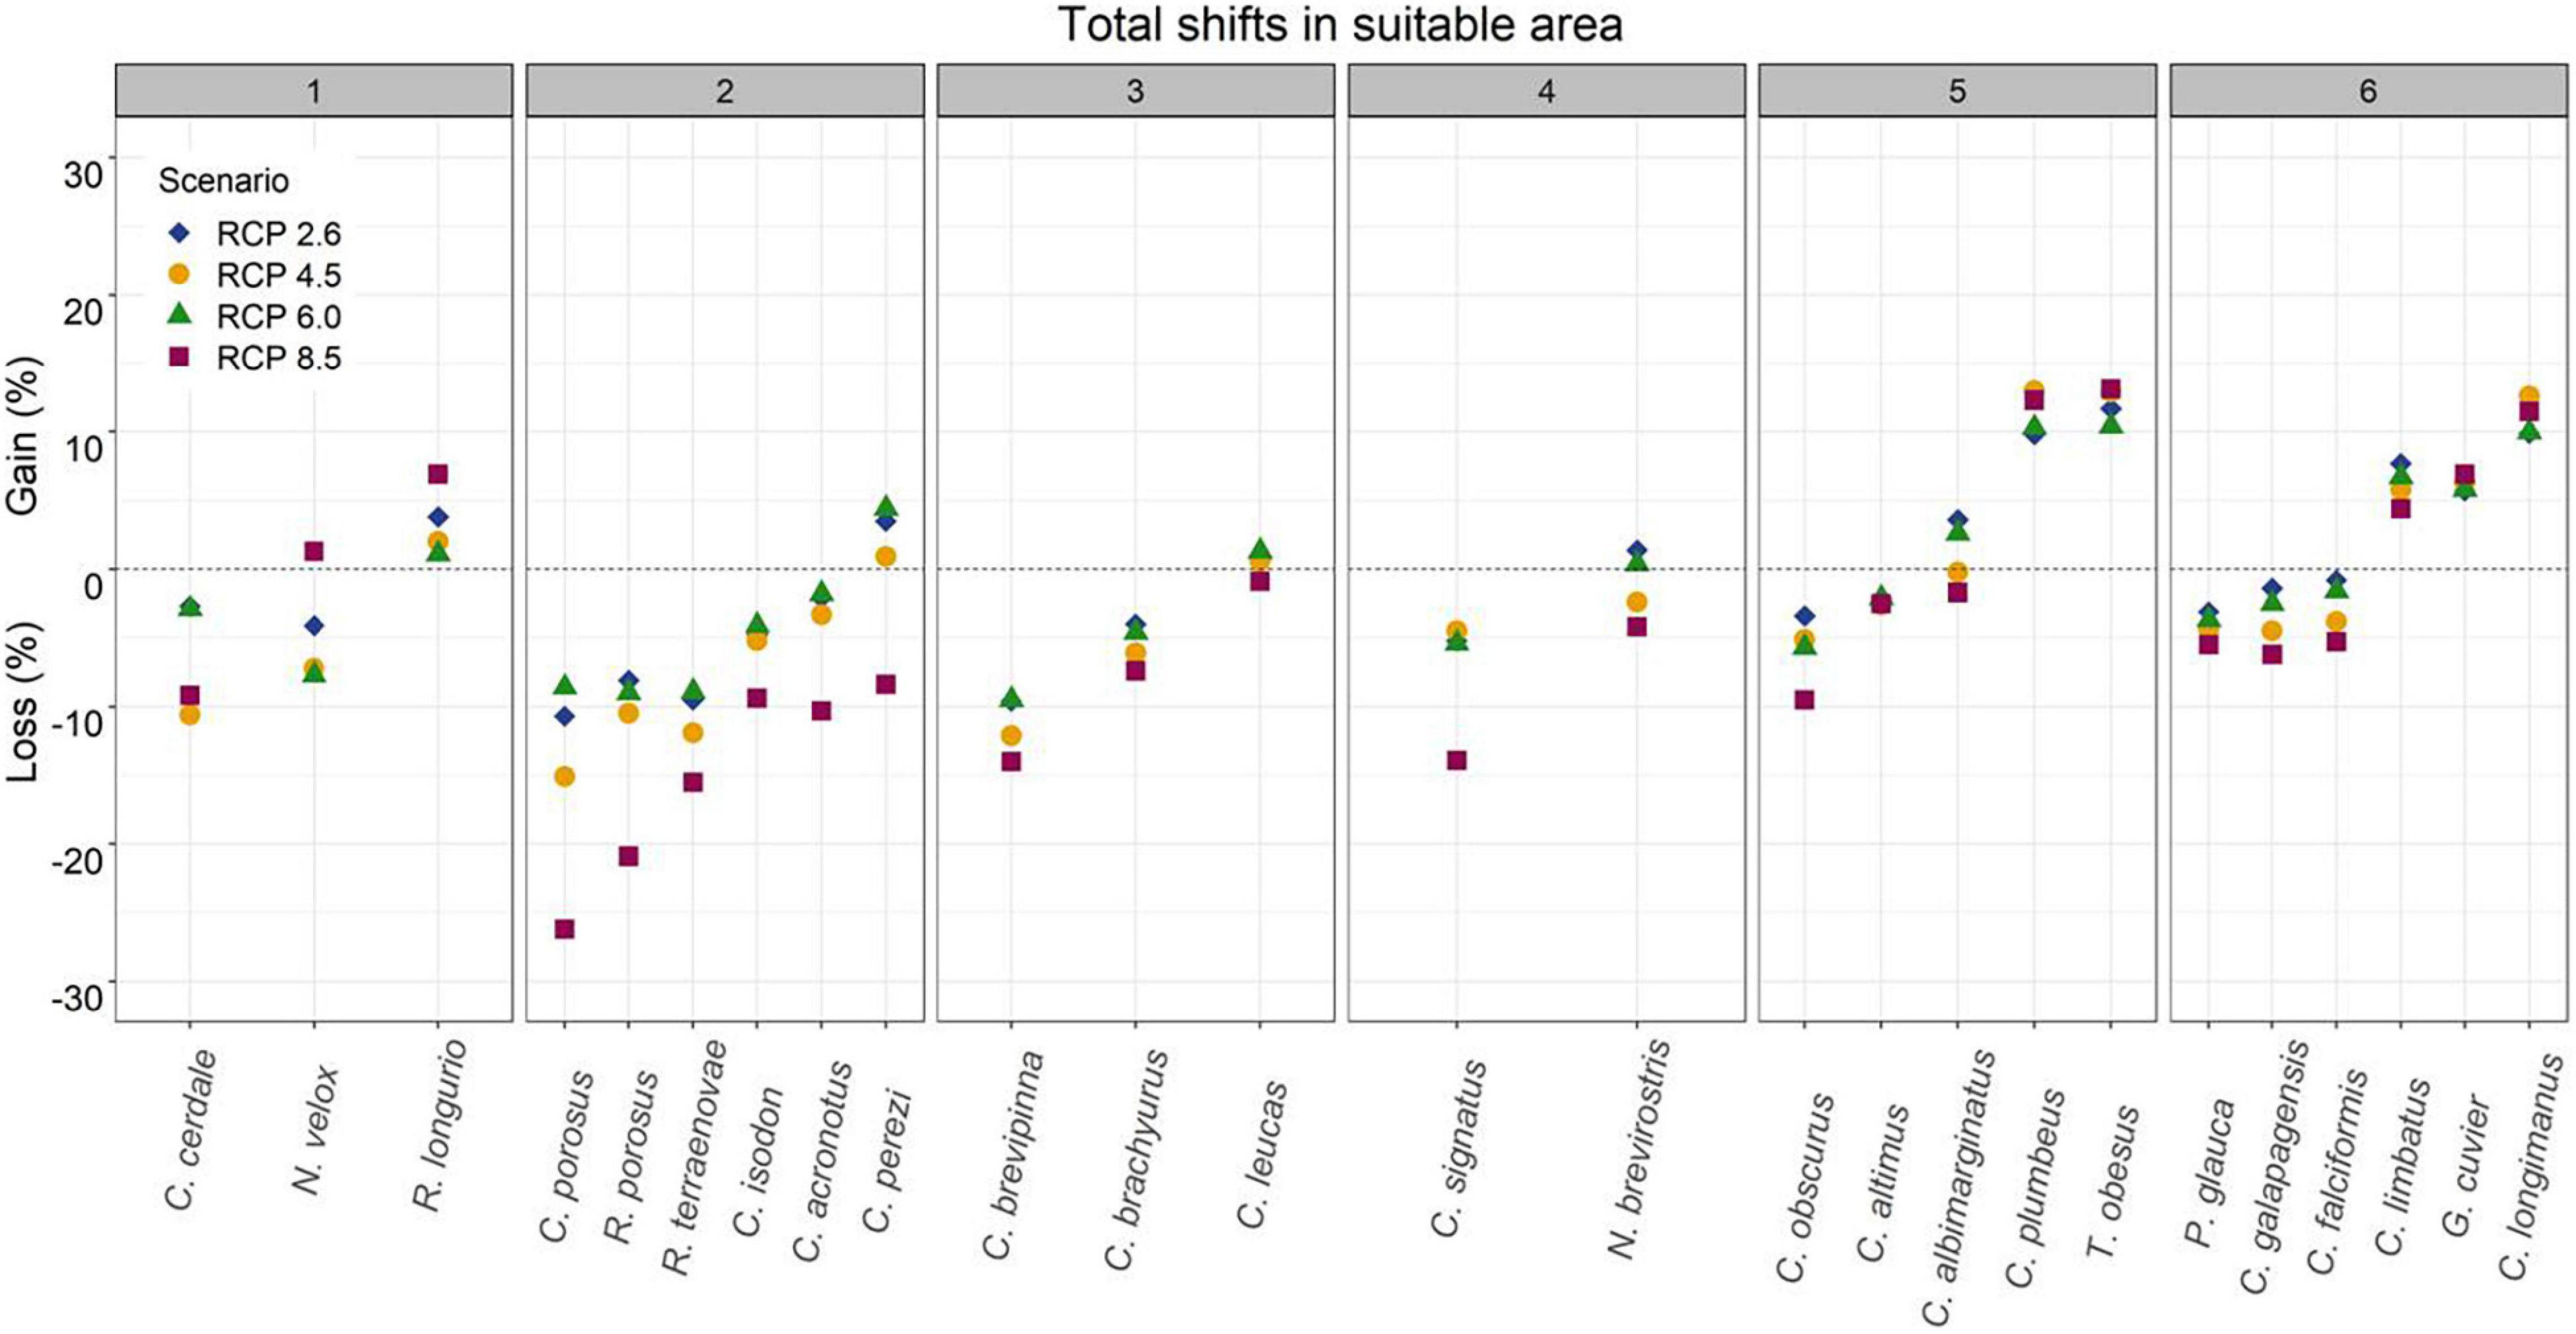
Figure 7. Total shifts in suitable areas for 25 carcharhinid shark species under future climate change scenarios (RCP2.6, RCP4.5, RCP6.0, and RCP8.5) for 2050, divided into groups according to their M area.
Discussion
The results of this study show that most of the species presented a shift in their distribution in response to the projected changes in climate. The suitable area for carcharhinid sharks showed a general trend of decline in the future for most species, although the suitable area of some species is expected to increase. In general, the loss of suitable area is predominantly found around the equatorial band, the Gulf of Mexico, and the Indian Ocean; in contrast, the areas that present gains in suitability are predominantly on the periphery of the M areas.
Regarding changes in environmental variables and shifts in range, in our study, temperature range, and other variables related to temperature, made the highest contributions to the niche models. This supports the findings of other studies on shark distributions (Lezama-Ochoa et al., 2016; Birkmanis et al., 2020). Being ectothermic organisms, in common with other teleost fishes, the physiological functions of many sharks are controlled and determined by temperature and their thermal tolerance limits. This makes them susceptible to negative impacts as a result of climate change (Rosa et al., 2014; Schlaff et al., 2014). Unlike bony fish, the k-selected life strategy of the Chondrichthyans, characterized by long generation times and low fecundity, impedes their adaptation to rapid environmental change imposed upon them as a result of human activities (Wheeler et al., 2021). In addition, the projected negative future change (loss of suitable area) in our modeled species could be related to some theoretical expectations, in which the physiology and behavior of ectothermic and tropical species are strongly affected by temperature gradients (Chin et al., 2010; Feary et al., 2013; Rosa et al., 2014; Schlaff et al., 2014). This could be because tropical species live close to their thermal limits, and have a lower capacity for acclimation compared to temperate species, implying their possible vulnerability to even slight increases in habitat temperature (Cheung et al., 2009; Comte and Olden, 2017). However, vulnerability to rising temperatures will depend mostly on the thermal tolerance and acclimation capacity of the organism in question (Rodriguez-Dominguez et al., 2019), and these are parameters that remain unknown for most species. With regard to shifts in shark distributions related to changes in salinity, the long-term impacts on sharks are not well understood. However, these impacts are known to depend on the duration of exposure. For instance, some sharks can tolerate decreased salinity, although this implies increased energy costs to maintain osmotic balance, and they tolerate increases in salinity by retaining more salts such as urea in their blood (Yates et al., 2015; Dwyer et al., 2019; Vedor et al., 2021). Such exposure to salinity levels beyond the preferred range of the sharks could affect their physiology, as well as their abundance and distribution (Drymon et al., 2013). The range of a marine fish is also influenced by ocean currents, although this aspect has received scant attention in the context of climate change (Feary et al., 2013). Distribution shifts could also be related to the oceanographic conditions of each ocean, since climate change can impact the strength, direction, and behavior of the main currents (Hoegh-Guldberg and Bruno, 2010). Ocean currents have also been described as an oceanographic predictor for certain species of sharks, given their active behavior and use of these currents in the search for food (Bradie and Leung, 2017; Ranintyari et al., 2018; Báez et al., 2019).
A few attempts have been made to estimate the potential current or future distribution areas of carcharhinid sharks using Maxent, or other modeling approaches, in which the decrease of suitable area has also been reported. Jones et al. (2013) applied three species distribution models projected to one climate change scenario (SRES A2 to 2050), with two sets of variables to determine the potential impacts on commercial fish in the North Sea, finding a contraction in total suitable area of 11.6% for Angel sharks (Squatina squatina) and other elasmobranchs, such as rays. Gonzalez-Pestana (2018) predicted habitat suitability for smooth hammerheads (Sphyrna zygaena) under current and future climate change scenarios for the period 2040–2050, indicating that the suitable habitat for this species will shift to a more coastal distribution in the future. For carcharhinid sharks, Lezama-Ochoa et al. (2016) found that Carcharhinus falciformis presents losses in suitable area, under SRES A2 climate change scenarios for 2100, of 15.5% in the Atlantic Ocean, 9.9% in the Pacific Ocean, and a minimum change of 1.4% in the Indian Ocean. Our results for C. falciformis showed that the maximum loss in suitable area was 10% under RCP8.5 and the minimum was 4.3% under RCP2.6. Although the effects of RCP8.5 could be compared to the SRES A2 scenario of the IPCC (2013), we did not evaluate the shift in potential distribution for each ocean separately. Birkmanis et al. (2020) predicted a decrease in suitable areas for C. falciformis under the RCP4.5 and RCP8.5 scenarios (2050–2099) on the coast of Australia, and reported the same in this region for C. obscurus, C. longimanus, and P. glauca. In contrast to these results, our study found a general increase in suitable area for C. longimanus under all RCP scenarios. This discrepancy could be due to the fact that our study considered the known worldwide distribution, which is the same distribution that was used as the calibration and projection area. However, distribution shifts can be observed at the regional level, showing a reduction in the distribution area of this species within the Australian EEZ, which coincides with that reported by Birkmanis et al. (2020).
The projected expansions of suitable areas for some species under the RCP8.5 and RCP4.5 scenarios may contrast with previous studies that suggest a greater contraction of suitable areas under severe future climate scenarios (Perry et al., 2005; Dulvy et al., 2008). Such differences in the predictions may be due to the thermal tolerance of the species coupled with their high capacity for movement, which provides the opportunity to move to higher latitudes and avoid the increase in water temperature. In this regard, Sunday et al. (2015) state that the high movement capacity and the latitudinal range of the species have positive relationships with their distribution area under climate change. Other studies conducted with carcharhinid sharks (Lezama-Ochoa et al., 2016; Birkmanis et al., 2020), in which no gain area was reported, contrast with our results, possibly due to the difference in the geographic regions for which modeling was conducted, the diverse size of the study areas (M area from Birkmanis et al., 2020) or the specific future scenarios used [for example, SRES A2 from Jones et al. (2013) and Lezama-Ochoa et al. (2016)]. Nevertheless, our results are congruent with some bioclimatic theories that predict an overall expansion of niches with climate change in some tropical fish (Genner et al., 2004), and also support the general trend of gain in areas as a result of climate change-induced temperature rises (i.e., poleward shifts) (Booth et al., 2011). In addition, Coro et al. (2016) found that endangered and near threatened species of some wide-range elasmobranchs, such as Alopias vulpinus and Alopias pelagicus, showed positive trend variation and gains in suitable area under future distribution projections in the niche models of AquaMaps for 20509. This agrees with our study, in which species of wide distribution presented gains in suitable area, although one of the species of narrow distribution also showed such gains. On the other hand, large marine organisms are constrained not only by their physiological limits but also by their mobility and the accessibility of thermal refuges. This could be the reason why Carcharhinus limbatus, a shark with a preference for deeper waters during daylight hours, showed gains in suitable area probably through the requirement of the species to avoid the increased water temperatures (Barnes et al., 2016).
Regarding the losses and gains of suitable area found for carcharhinid sharks, the relationship between species niche properties as indicators of species sensitivity and climate change has been proved (Thuiller et al., 2005), as well as some hypotheses regarding which species will be more sensitive. For example, Rosa et al. (2014) indicated that the more active pelagic sharks would experience greater negative physiological impacts from increasing ocean temperatures than their benthic counterparts. This could be because more active pelagic lifestyles correlate with higher metabolic rates (which are temperature dependent) compared to those of the less active benthic or bathyal species. For instance, we found percentages of suitable area loss for Rhizoprionodon terraenovae, an obligate-ram ventilator that must move by swimming at speed or finding a swift current in which to linger in order to continually force water through its gills to breathe (Parsons and Hoffmayer, 2005), and for Carcharhinus isodon, which is described as an active shark (Kells and Carpenter, 2011). Nevertheless, C. plumbeus is an obligate ram-ventilating apex predator that, in our study, presented gains in suitable area under all RCP scenarios (Crear et al., 2019). In contrast, we found a low percentage of loss in suitable areas presented by the sedentary species T. obesus (Whitney et al., 2012). There is also evidence that suggests negative effects on suitable area in species that are restricted to a single habitat throughout their life cycle, such as in the case of sharks strictly associated with coral reefs (Kibria et al., 2017; Heupel et al., 2019). This was consistent with the reef shark C. perezi under scenario RCP8.5, but disagrees with that found for the other scenarios and for the other reef shark T. obesus, which presented gains under all RCPs. With respect to these gains in suitable area, Heupel et al. (2019) state that there is a need to focus on reef sharks in order to better predict consequences for their populations, given that coral reefs are the habitats most threatened by climate change. It should also be considered that species present complex and dynamic geographical structures that are difficult to model (Coro et al., 2016).
In addition to the effect of climate change due to the physiological and biological characteristics of the species, their shifts in distribution could be related to their biological interactions with other organisms (Gervais et al., 2020), since the first response of species to altered environmental conditions is to adjust their behavior (Wong and Candolin, 2015). One such adjustment is distribution shifts in apex predators such as the large sharks (Heard et al., 2017) because novel combinations of prey species could generate reorganization of species, even among the trophic webs (Lurgi et al., 2012; Cameron et al., 2019). It has also been observed that expansion of the distribution range is dominated by dietary generalist species (Evans and Moustakas, 2018; Bartley et al., 2019). In our results, G. cuvier and C. longimanus (which presented the greatest gain in suitable area) have been defined as generalist predators or species that exploit abundant food resources (Matich et al., 2011). In contrast, the shark C. leucas presents more specialized dietary profiles (Matich et al., 2011) and, according to our results, has presented few changes in its distribution.
The occurrence of a shift in species distribution can lead to pervasive and often unexpected consequences for both biological communities and human society (Pecl et al., 2017). A change generated by the distribution or extinction of sharks, as top predators that regulate the populations of other species, could significantly affect the health of seagrass beds, coral reefs, and other vital marine habitats, with a consequently impact on the fishery and ecotourism industries and economy in some regions (Motivarash et al., 2020). Hammerschlag et al. (2019) state that researching ecosystem services and their relationship to top predators is challenging, but is nevertheless important in order to determine how changes associated with climate change in aquatic systems will affect the ecological functions and ecosystem services provided by predators.
Knowledge of the future potential distribution of vulnerable and key species such as sharks could be of value to the design of conservation programs that focus on sites that present the ecological features required by these species in order to face climate change. Niche and distribution modeling offer useful information for incorporation into strategies of environmental management, especially with regard to marine conservation and planning (Marshall et al., 2014). It is therefore important to investigate the impact of climatic change in shark distribution shifts in order to adequately assess their future management in Marine Protected Areas. This is important in terms of the protection of mobile marine species, such as chondrichthyan fishes, among others, especially if such changes require a reassessment of their interactions with fisheries (Carlisle et al., 2019).
Methodological Caveats
Predicting and mapping the contractions and expansions of suitable areas for threatened and endangered species is critical for monitoring and restoring their natural populations (De Oliveira et al., 2019). Several studies have modeled the potential future distribution of species; however, there are multiple sources of variation and uncertainty in the geographic predictions and their interpretation that are associated with the methodology (Peterson et al., 2018; Alkishe et al., 2020). To avoid this, in this study, we modeled the potential distribution of the study species based on different sets of environmental variables, a more robust metric of statistical significance such as the partial ROC, and the mobility-oriented parity (MOP) (Peterson et al., 2008; Owens et al., 2013; Cobos et al., 2019). Moreover, although there were many areas of strict extrapolation of risk conditions in the future that show a non-analog environment (MOP results), the truncated response used in our models acts to strongly reduce the combinations of environmental conditions under which models are calibrated in the present (Owens et al., 2013) and projected to future RCP scenarios, in order to reduce uncertainty (Thuiller et al., 2004). As a consequence, this study improves the general understanding of the ecological niche and potential distribution of carcharhinid sharks and estimates their distribution under the reliable climate change scenarios featured in recent literature. According to our evaluation results and expert knowledge on this group of sharks, and by modeling presence-only data, the models obtained are informative and adequately describe the current potential distributions (Cobos et al., 2019), which indicates their utility in terms of making further projections and predicting shifts in habitat suitability (Warren and Seifert, 2011).
Another caveat is related to the small sample sizes for some species of sharks used to create the niche models. In this regard, Pearson et al. (2007) emphasize that these models should only be interpreted as regions that have environmental conditions similar to those in which the species is known to occur. However, this kind of model created in Maxent has previously generated good results, even with small sample sizes (<10) (Phillips et al., 2006) such as some of those used in our study. The integration of ecologically relevant predictors and variables in a 3-dimensional space (e.g., primary productivity, dissolved oxygen throughout the water column) significantly affects shark distributions with climate change (Deutsch et al., 2015; Feitosa et al., 2020; Vedor et al., 2021). Where this information is available, it could therefore be considered to significantly increase the performance and transferability of the niche models (Regos et al., 2019). However, despite the fact that remotely sensed data has recently become more available, environmental predictors remain limited for the marine environment and therefore probably lack important ecological factors (Werkowska et al., 2016). This is a general problem for marine ecological niche modeling in contrast to 2-dimensional modeling for terrestrial species, since most oceanographic layers are only representative of the uppermost layers of the water column (Whittock et al., 2016; Assis et al., 2017; Melo-Merino et al., 2020). In addition, some studies that model future species distributions recommend the use of other variables, such as dispersal capacity, genetic adaptation, species behavioral plasticity, and biotic interactions (Robinson et al., 2011; Bentlage et al., 2013; Sirois-Delisle and Kerr, 2018; Brodie et al., 2019; Gómez-Ruiz and Lacher, 2019). Certain studies have attempted to solve this problem by using oceanographic variables at multiple depths in the current distribution (Bentlage et al., 2013; Duffy and Chown, 2017) and applying future scenarios evenly throughout the entire water column (Crear et al., 2020). However, these environmental layers are still not available in all areas and under different climate change scenarios and were therefore excluded from this study. Despite this limitation, the environmental variables that were used in this study (temperature, salinity, and current velocity) have been described as important factors that affect current marine habitats and thus future shark distributions (Rosa et al., 2014; Ranintyari et al., 2018; Vedor et al., 2021).
Conclusion
Our results show the usefulness of correlative models based on the ecological niche theory in terms of modeling the future potential distribution of carcharhinid sharks through presence records and environmental variables. We conclude that climate change will have important effects on the distribution of carcharhinid sharks by the year 2050, highlighting losses of suitable area for most species. The carcharhinid sharks presented the greatest loss of suitable area under the severe future climate scenario RCP8.5. The shark species with the greatest loss of suitable area was C. porosus and the shark with the highest gain in suitable area was T. obesus. Species distribution modeling approaches, such as that utilized in this study, represent an attempt to identify changes in the distribution patterns of carcharhinid sharks and can provide basic primary information of potential value to the improvement of decision-making processes in biodiversity conservation. The preservation of sharks as key elements in the present and future is important to the maintenance of ecosystem services of great value to human society, as well as to conserve the natural function of the marine ecosystems.
Data Availability Statement
The original contributions presented in the study are included in the article/Supplementary Material, further inquiries can be directed to the corresponding author/s.
Ethics Statement
Ethical review and approval was not required for the animal study because we work with databases. At no time do we work with living organisms.
Author Contributions
PLD-C, GM-G, CY-A, and XC-C contributed to the conception and design of the study. PLD-C organized the database and performed the statistical analysis. PLD-C and GM-G wrote the drafts of the manuscript. All authors contributed to manuscript revision, read, and approved the submitted version.
Funding
This study was supporded by CEMIE-Océano (Mexican Centre for Innovation in Ocean Energy), project FSE-2014-06-249795 financed by CONACYT SENER Sustentabilidad Energética.
Conflict of Interest
The authors declare that the research was conducted in the absence of any commercial or financial relationships that could be construed as a potential conflict of interest.
Publisher’s Note
All claims expressed in this article are solely those of the authors and do not necessarily represent those of their affiliated organizations, or those of the publisher, the editors and the reviewers. Any product that may be evaluated in this article, or claim that may be made by its manufacturer, is not guaranteed or endorsed by the publisher.
Acknowledgments
We thank the Postgraduate Program in Marine Sciences and Limnology, UNAM, the Mexican National Council of Science and Technology (CONACyT), which granted a fellowship to PLD-C, and the Mexican Centre for Innovation in Ocean Energy (CEMIE-Océano, CONACYT project 249795). We also thank Felipe Galván, Andrés Lira, and the referees for their valuable and careful suggestions that greatly contributed to improving this work. Finally, we would like to express our gratitude to Keith MacMillan for correcting the English style of the manuscript.
Supplementary Material
The Supplementary Material for this article can be found online at: https://www.frontiersin.org/articles/10.3389/fmars.2021.745501/full#supplementary-material
Footnotes
- ^ http://www.gbif.org
- ^ www.splink.org.br
- ^ www.vertnet.org
- ^ www.iobis.org
- ^ www.unibio.unam.mx
- ^ www.icmyl.unam.mx
- ^ https://www.bio-oracle.org/
- ^ https://github.com/marlonecobos/kuenm
- ^ www.aquamaps.org
References
Acuña-Marrero, D., Smith, A. N. H., Hammerschlag, N., Hearn, A., Anderson, M. J., Calich, H., et al. (2017). Residency and movement patterns of an apex predatory shark (Galeocerdo cuvier) at the Galapagos Marine Reserve. PLoS One 12:e0183669. doi: 10.1371/journal.pone.0183669
Alkishe, A., Cobos, M. E., Peterson, A. T., and Samy, A. M. (2020). Recognizing sources of uncertainty in disease vector ecological niche models: an example with the tick. Rhipicephalus sanguineus sensu lato. Perspect. Ecol. Conserv. 18, 91–102. doi: 10.1016/j.pecon.2020.03.002
Anderson, R. P., Lew, D., and Peterson, A. T. (2003). Evaluating predictive models of species’ distributions: criteria for selecting optimal models. Ecol. Model. 162, 211–232. doi: 10.1016/S0304-3800(02)00349-6
Assis, J., Tyberghein, L., Bosch, S., Verbruggen, H., Serrao, E. A., and De Clerck, O. (2017). Bio-ORACLE v2.0: extending marine data layers for bioclimatic modelling. Glob. Ecol. Biogeogr. 27, 277–284. doi: 10.1111/geb.12693
Báez, J. C., Barbosa, A. M., Pascual, P., Ramos, M. L., and Abascal, F. (2019). Ensemble modeling of the potential distribution of the whale shark in the Atlantic Ocean. Ecol. Evol. 10, 175–184. doi: 10.1002/ece3.5884
Bakun, A. (1990). Global climate change and intensification of coastal ocean upwelling. Science 247, 198–201. doi: 10.1126/science.247.4939.198
Banks, W. E. (2017). The application of ecological niche modeling methods to archaeological data in order to examine culture-environment relationships and cultural trajectories. Quaternaire 28, 271–276. doi: 10.4000/quaternaire.7966
Barnes, C. J., Butcher, P. A., Macbeth, W. G., Mandelman, J. W., Smith, S. D. A., and Peddemors, V. M. (2016). Movements and mortality of two commercially exploited carcharhinid sharks following longline capture and release off eastern Australia. Endanger. Species Res. 30, 193–208. doi: 10.3354/esr00730
Bartley, T. J., McCann, K. S., Bieg, C., Cazelles, K., Granados, M., Guzzo, M. M., et al. (2019). Food web rewiring in a changing world. Nat. Ecol. Evol. 3, 345–354. doi: 10.5281/zenodo.1158733
Barve, N., Barve, V., Jiménez-Valverde, A., Lira-Noriega, A., Maher, S. P., Peterson, A. T., et al. (2011). The crucial role of the accessible area in ecological niche modeling and species distribution modeling. Ecol. Model. 222, 1810–1819. doi: 10.1016/j.ecolmodel.2011.02.011
Bellard, C., Bertelsmeier, C., Leadley, P., Thuiller, W., and Courchamp, F. (2012). Impacts of climate change on the future of biodiversity. Ecol. Lett. 15, 365–377. doi: 10.1111/j.1461-0248.2011.01736.x
Bentlage, B., Peterson, A. T., Barve, N., and Cartwright, P. (2013). Plumbing the depths: extending ecological niche modelling and species distribution modelling in three dimensions. Glob. Ecol. Biogeogr. 22, 952–961. doi: 10.1111/geb.12049
Birkmanis, C. A., Freer, J. J., Simmons, L. W., Partridge, J. C., and Sequeira, A. M. M. (2020). Future distribution of suitable habitat for pelagic sharks in Australia under climate change Models. Front. Mar. Sci. 7:570. doi: 10.3389/fmars.2020.00570
Bond, M. E., Babcock, E. A., Pikitch, E. K., Abercrombie, D. L., Lamb, N. F., and Chapman, D. D. (2012). Reef sharks exhibit site-fidelity and higher relative abundance in marine reserves on the Mesoamerican Barrier Reef. PLoS One 7:e32983. doi: 10.1371/journal.pone.0032983
Booth, D. J., Bond, N., and Macreadie, P. (2011). Detecting range shifts among Australian fishes in response to climate change. Mar. Freshw. Res. 62, 1027–1042. doi: 10.1071/mf10270
Brodie, S. J., Thorson, J. T., Carroll, G., Hazen, E. L., Bograd, S. J., Haltuch, M. A., et al. (2019). Trade-offs in covariate selection for species distribution models: a methodological comparison. Ecography 42, 1–14. doi: 10.1111/ecog.04707
Bradie, J., and Leung, B. (2017). A quantitative synthesis of the importance of variables used in MaxEnt species distribution models. J. Biogeogr. 44, 1344–1361. doi: 10.1111/jbi.12894
Cameron, E. K., Sundqvist, M. K., Keith, S. A., CaraDonna, P. J., Mousing, E. A., Nilsson, K. A., et al. (2019). Uneven global distribution of food web studies under climate change. Ecosphere 10:e02645. doi: 10.1002/ecs2.2645
Camhi, M. D., Pikitch, E. K., and Babcock, E. A. (2008). Sharks of the Open Ocean: Biology, Fisheries and Conservation. Oxford: Blackwell Publishing, 536.
Carlisle, A. B., Tickler, D., Dale, J. J., Ferretti, F., Curnick, D. J., Chapple, T. K., et al. (2019). Estimating space use of mobile fishes in a large marine protected area with methodological considerations in acoustic array design. Front. Mar. Sci. 6:256. doi: 10.3389/fmars.2019.00256
Chefaoui, R. M., Serebryakova, A., Engelen, A. H., Viard, F., and Serrão, E. (2019). Integrating reproductive phenology in ecological niche models changed the predicted future ranges of a marine invader. Divers. Distrib. 25, 688–700. doi: 10.1111/ddi.12910
Cheung, W. W. L., Brodeur, R. D., Okey, T. A., and Pauly, D. (2015). Projecting future changes in distributions of pelagic fish species of Northeast Pacific shelf seas. Prog. Oceanogr. 130, 19–31. doi: 10.1016/j.pocean.2014.09.003
Cheung, W. W. L., Meeuwig, J. J., Feng, M., Euan, H., Lam, V. W. H., Langlois, T., et al. (2012). Climate-change induced tropicalisation of marine communities in Western Australia. Mar. Freshw. Res. 63, 415–427. doi: 10.1071/MF11205
Cheung, W. W. L., Sarmiento, J. L., Kearney, K., Watson, R., and Pauly, D. (2009). Projecting global marine biodiversity impacts under climate change scenarios. Fish Fish. 10, 235–251. doi: 10.1111/j.1467-2979.2008.00315.x
Chin, A., Kyne, P. M., Walkers, T. I., and McAuley, R. B. (2010). An integrated risk assessment for climate change: analysing the vulnerability of sharks and rays on Australia’s Great Barrier Reef. Glob. Change Biol. 16, 1936–1953. doi: 10.1111/j.1365-2486.2009.02128.x
Cisneros-Montemayor, A. M., Becerril-García, E. E., Berdeja-Zavala, O., and Bocos, A. (2020). Shark ecotourism in Mexico: scientific research, conservation, and contribution to a Blue Economy. Adv. Mar. Biol. 85, 71–92. doi: 10.1016/bs.amb.2019.08.003
Cobos, M. E., Peterson, A. T., Barve, N., and Osorio-Olvera, L. (2019). kuenm: an R package for detailed development of ecological niche models using Maxent. PeerJ 7:e6281. doi: 10.7717/peerj.6281
Comte, L., and Olden, J. D. (2017). Climatic vulnerability of the world’s freshwater and marine fishes. Nat. Clim. Change 7, 718–722. doi: 10.1038/NCLIMATE3382
Cooper, J. C., and Soberón, J. (2018). Creating individual accessible area hypotheses improves stacked species distribution models performance. Glob. Ecol. Biogeogr. 27, 156–165. doi: 10.1111/geb.12678
Coro, G., Magliozzi, C., Ellenbroek, A., Kaschner, K., and Pagano, P. (2016). Automatic classification of climate change effects on marine species distributions in 2050 using the AquaMaps model. Environ. Ecol. Stat. 23, 155–180. doi: 10.1007/s10651-015-0333-8
Cortés, E. (2000). Life history patterns, correlations in sharks. Rev. Fish. Sci. Aquac. 8, 299–344. doi: 10.1080/10408340308951115
Costa, G. C., Nogueira, C., Machado, R. B., and Colli, G. R. (2009). Sampling bias and the use of ecological niche modeling in conservation planning: a field evaluation in a biodiversity hotspot. Biodivers. Conserv. 19, 883–899. doi: 10.1007/s10531-009-9746-8
Crear, D. P., Brill, R. W., Bushnell, P. G., Latour, R. J., Schwieterman, G. D., Steffen, R. M., et al. (2019). The impacts of warming and hypoxia on the performance of an obligate ram ventilator. Conserv. Physiol. 7:coz026. doi: 10.1093/conphys/coz026
Crear, D. P., Latour, R. J., Friedrichs, M. A. M., St-Laurent, P., and Weng, K. C. (2020). Sensitivity of a shark nursery habitat to a changing climate. Mar. Ecol. Prog. Ser. 652, 123–136. doi: 10.3354/meps13483
Davidson, L. N. K., and Dulvy, N. K. (2017). Global marine protected areas to prevent extinctions. Nat. Ecol. Evol. 1:0040. doi: 10.1038/s41559-016-0040
De Oliveira, U. D. R., Gomes, P. B., Silva Cordeiro, R. T., De Lima, G. V., and Pérez, C. D. (2019). Modeling impacts of climate change on the potential habitat of an endangered Brazilian endemic coral: discussion about deep sea refugia. PLoS One 14:e0211171. doi: 10.1371/journal.pone.0211171
Del Moral-Flores, L. F., Morrone, J. J., Alcocer-Durand, J., Espinosa-Pérez, H., and Pérez-Ponce de León, G. (2015). Lista patrón de los tiburones, rayas y quimeras (Chondrichthyes, Elasmobranchii, Holocephali) de México. Arx. Misc. Zool. 13, 47–163. doi: 10.32800/amz.2015.13.0047
Deutsch, C., Ferrel, A., Seibel, B., Portner, H. O., and Huey, R. B. (2015). Climate change tightens a metabolic constraint on marine habitats. Science 348, 1132–1136. doi: 10.1126/science.aaa1605
Dormann, C. F., Schymanski, S. J., Cabral, J., Chuine, I., Graham, C., Hartig, F., et al. (2012). Correlation and process in species distribution models: bridging a dichotomy. J. Biogeogr. 39, 2119–2131. doi: 10.1111/j.1365-2699.2011.02659.x
Drymon, J. M., Carassou, L., Powers, S. P., Grace, M., Dindo, J., and Dzwonkowski, B. (2013). Multiscale analysis of factors that affect the distribution of sharks throughout the northern Gulf of Mexico. Fish. Bull. 111, 370–380. doi: 10.7755/FB.111.4.6
Duffy, G. A., and Chown, S. L. (2017). Explicitly integrating a third dimension in marine species distribution modelling. Mar. Ecol. Prog. Ser. 564, 1–8. doi: 10.3354/meps12011
Dulvy, N. K., Fowler, S. L., Musick, J. A., Cavanagh, R. D., Kyne, P. M., Harrison, L. R., et al. (2014). Extinction risk and conservation of the world’s sharks and rays. Elife 3:e00590. doi: 10.7554/eLife.00590
Dulvy, N. K., Rogers, S. I., Jennings, S., Stelzenmüller, V., Dye, S., and Skjoldal, H. R. (2008). Climate change and deepening of the North Sea fish assemblage: a biotic indicator of warming seas. J. Appl. Ecol. 45, 1029–1039. doi: 10.1111/j.1365-2664.2008.01488.x
Durack, P. J., Wijffels, S. E., and Matear, R. J. (2012). Ocean salinities reveal strong global water cycle intensification during 1950 to 2000. Science 336, 455–458. doi: 10.1126/science.1212222
Dwyer, R. G., Campbell, H. A., Cramp, R. L., Burk, C. L., Micheli-Campbell, M. A., Pillans, R. D., et al. (2019). Niche partitioning between river shark species is driven by seasonal fluctuations in environmental salinity. Funct. Ecol. 34, 2170–2185. doi: 10.1111/1365-2435.13626
Elith, J., Kearney, M., and Phillips, S. (2010). The art of modelling range-shifting species. Methods Ecol. Evol. 1, 330–342. doi: 10.1111/j.2041-210X.2010.00036.x
Elith, J., Phillips, S. J., Hastie, T., Dudik, M., Chee, Y. E., and Yates, C. J. (2011). A statistical explanation of Maxent for ecologist. Divers. Distrib. 17, 43–57. doi: 10.1111/j.1472-4642.2010.00725.x
Evans, M. R., and Moustakas, A. (2018). Plasticity in foraging behaviour as a possible response to climate change. Ecol. Informatics. 47, 61–66. doi: 10.1016/j.ecoinf.2017.08.001
Feary, D. A., Pratchett, M. S., Emslie, M. J., Fowler, A. M., Figueira, W. F., and Luiz, O. J. (2013). Latitudinal shifts in coral reef fishes: why some species do and others do not shift. Fish Fish. 15, 593–615. doi: 10.1111/faf.12036
Feitosa, L. M., Martins, L. P., Junior, L. A. S., and Lessa, R. P. (2020). Potential distribution and population trends of the smalltail shark Carcharhinus porosus inferred from species distribution models and historical catch data. Aquat. Conserv. 30, 882–891. doi: 10.1002/aqc.3293
Field, I. C., Meekan, M. G., Buckworth, R. C., and Bradshaw, C. J. A. (2009). Susceptibility of sharks, rays and chimaeras to global extinction. Adv. Mar. Biol. 56, 275–363. doi: 10.1016/S0065-2881(09)56004-X
Fogarty, H. E., Buroows, M. T., Pecl, G. T., Robinson, L. M., and Poloczanska, E. S. (2016). Are fish outside their usual ranges early indicators of climate-driven range shifts? Glob. Change Biol. 23, 2047–2057. doi: 10.1111/gcb.13635
Genner, M. J., Sims, D. W., Wearmouth, V. J., Southall, E. J., Southward, A. J., Henderson, P. A., et al. (2004). Regional climatic warming drives long-term community changes of British marine fish. Proc. R. Soc. Lond. B Biol. Sci. 271, 655–661. doi: 10.1098/rspb.2003.2651
Gervais, C. R., Huveneers, C., Rummer, J. L., and Brown, C. (2020). Population variation in thermal response to climate change reveals differing sensitivity in a benthic shark. Glob. Change Biol. 27, 108–120. doi: 10.1111/GCB.15422
Gómez-Ruiz, E. P., and Lacher, T. E. Jr. (2019). Climate change, range shifts, and the disruption of a pollinator-plant complex. Sci. Rep. 9:14048. doi: 10.1038/s41598-019-50059-6
Gonzalez-Pestana, A. (2018). Habitat Suitability of Juvenile Smooth Hammerhead Shark (Sphyrna zygaena) off Northern Peru. Ph.D. thesis, Douglas, QLD: James Cook University.
Haas, A. R., Fedler, T., and Brooks, E. J. (2017). The contemporary economic value of elasmobranchs in The Bahamas: reaping the rewards of 25 years of stewardship and conservation. Biol. Conserv. 207, 55–63. doi: 10.1016/j.biocon.2017.01.007
Hammerschlag, N., Schmitz, O. J., Flecker, A. S., Lafferty, K. D., Sih, A., Atwood, T. B., et al. (2019). Ecosystem function and services of aquatic predators in the Anthropocene. Trends Ecol. Evol. 34, 369–383. doi: 10.1016/j.tree.2019.01.005
Hare, J. A., Morrison, W. E., Nelson, M. W., Stachura, M. M., Teeters, E. J., Griffis, R. B., et al. (2016). A vulnerability assessment of fish and invertebrates to climate change on the Northeast U.S. continental shelf. PLoS One 11:e0146756. doi: 10.1371/journal.pone.0146756
Harris, R. M. B., Grose, M. R., Lee, G., Bindoff, N. L., Porfirio, L. L., and Fox-Hughes, P. (2014). Climate projections for ecologist. Wires Clim. Change 5, 621–637. doi: 10.1002/wcc.291
Hazen, E. L., Jorgensen, S., Rykaczewski, R. R., Bograd, S. J., Foley, D. G., Jonsen, I. D., et al. (2013). Predicted habitat shifts of Pacific top predators in a changing climate. Nat. Clim. Chang. 3, 234–238. doi: 10.1038/nclimate1686
Heard, M., Rogers, P. J., Bruce, B. D., Humphries, N. E., and Huveneers, C. (2017). Plasticity in the diel vertical movement of two pelagic predators (Prionace glauca and Alopias vulpinus) in the southeastern Indian Ocean. Fish. Oceanogr. 27, 199–211. doi: 10.1111/fog.12245
Heupel, M. R., Papastamatiou, Y. P., Espinoza, M., Green, M. E., Simpfendorfer, C. A., Hays, G. C., et al. (2019). Reef shark science–key questions and future directions. Front. Mar. Sci. 6:12. doi: 10.3389/fmars.2019.00012
Hijmans, R. J. (2012). Cross-validation of species distribution models: removing spatial sorting bias and calibration with a null model. Ecology 93, 679–688. doi: 10.2307/23143954
Hijmans, R. J., and Elith, J. (2013). Dismo: Species Distribution Modeling. R package version 1.3-3. Available online at https://CRAN.R-project.org/package=dismo. (Accessed 25 September 2019)
Hill, J. K., Griffiths, H. M., and Thomas, C. D. (2011). Climate change and evolutionary adaptations at species’ range margins. Annu. Rev. Entomol. 56, 143–159. doi: 10.1146/annurev-ento-120709-144746
Hobday, A. J. (2010). Ensemble analysis of the future distribution of large pelagic fishes off Australia. Prog. Oceanogr. 86, 291–301. doi: 10.1016/j.pocean.2010.04.023
Hoegh-Guldberg, O., and Bruno, J. F. (2010). The impact of climate change on the world’s marine ecosystems. Science 328, 1523–1528. doi: 10.1126/science.1189930
IPCC (2000). Special Report on Emissions Scenarios: A Special Report of Working Group III of the Intergovernmental Panel on Climate Change, eds N. Nakićenović and R. Swart (Cambridge: University Press).
IPCC (2013). “2013: Technical Summary,” in Climate Change 2013: The Physical Science Basis. Contribution of Working Group I to the Fifth Assessment Report of the Intergovernmental Panel on Climate Change, eds T. F. Stocker, Q. Dahe, G.-K. Plattner, L. V. Alexander, S. K. Allen, N. L. Bindoff, et al. (Cambridge: Cambridge University Press), 33–115. doi: 10.1017/BO9781107415324.005
IUCN (2020). The IUCN Red List of Threatened Species. Available online at: www.iucnredlist.org (accessed September 25, 2020).
Jones, M. C., and Cheung, W. W. L. (2015). Multi-model ensemble projections of climate change effects on global marine biodiversity. ICES J. Mar. Sci. 72, 741–752. doi: 10.1093/icesjms/fsu172
Jones, M. C., Dye, S. R., Fernandes, J. A., Frolicher, T. L., Pinnegar, J. K., Warren, R., et al. (2013). Predicting the impact of climate change on threatened species in UK waters. PLoS One 8:e54216. doi: 10.1371/journal.pone.0054216
Kells, V. A., and Carpenter, E. (2011). A Field Guide to Coastal Fishes. Baltimore, MD: The John Hopkins University Press.
Kibria, G., Haroon, A. K. Y., and Nugegoda, D. (2017). Climate Change and its Effects on Global Shark Fisheries. doi: 10.13140/RG.2.2.15363.81441
Lezama-Ochoa, N., Murua, H., Chust, G., Van Loon, E., Ruiz, J., Hall, M., et al. (2016). Present and future potential habitat distribution of Carcharhinus falciformis and Canthidermis maculata by-catch species in the tropical tuna purse-seine fishery under climate change. Front. Mar. Sci. 3:34. doi: 10.3389/fmars.2016.00034
Lurgi, M., Bernat, C. L., and Montoya, J. M. (2012). Novel communities from climate change. Philos. Trans. R. Soc. B 367, 2913–2922. doi: 10.1098/rstb.2012.0238
Marshall, C. E., Glegg, G. A., and Howell, K. L. (2014). Species distribution modelling to support marine conservation planning: the next steps. Mar. Policy 45, 330–332.
Matich, P., Heithaus, M. R., and Layman, C. A. (2011). Contrasting patterns of individual specialization and trophic coupling in two marine apex predators. J. Anim. Ecol. 80, 294–305. doi: 10.1111/j.1365-2656.2010.01753.x
Melo-Merino, S. M., Reyes-Bonilla, H., and Lira-Noriega, A. (2020). Ecological niche models and species distribution models in marine environments: a literature review and spatial analysis of evidence. Ecol. Model. 415:108837. doi: 10.1016/j.ecolmodel
Mendoza-González, G., Martínez, M. L., Rojas-Soto, O., Téllez-Valdés, O., and Arias-Del Razo, I. (2016). Priority areas for conservation of beach and dune vegetation of the Mexican Atlantic coast. J. Nat. Conserv. 33, 25–34. doi: 10.1016/j.jnc.2016.04.007
Montgomery, D. C., and Peck, E. A. (1992). Introduction to Linear Regression Analysis. New York, NY: Wiley.
Morales, N. S., Fernández, I. C., and Baca-González, V. (2017). MaxEnt’s parameter configuration and small samples: are we paying attention to recommendations? A systematic review. PeerJ 5:e3093. doi: 10.7717/peerj.3093
Motivarash, Y. B., Fofandi, D. C., Dabhi, R. M., Makrani, R. A., and Tanna, P. D. (2020). Importance of sharks in ocean ecosystem. J. Entomol. Zool. Stud. 8, 611–613.
Naimi, B., and Araújo, M. B. (2016). sdm: a reproducible and extensible R platform for species distribution modelling. Ecography 39, 368–375. doi: 10.1111/ecog.01881
Nakamura, Y., Feary, D. A., Kanda, M., and Yamaoka, K. (2013). Tropical fishes dominate temperate reef fish communities within western Japan. PLoS One 8:e81107. doi: 10.1371/journal.pone.0081107
Owens, H. L., Campbell, L. P., Dornak, L. L., Saupe, E. E., Barve, N., Soberón, J., et al. (2013). Constraints on interpretation of ecological niche models by limited environmental ranges on calibration areas. Ecol. Model. 263, 10–18. doi: 10.1016/j.ecolmodel.2013.04.011
Pacifici, M., Foden, W. B., Visconti, P., Watson, J. E. M., Butchart, S. H. M., Kovacs, K. M., et al. (2015). Assessing species vulnerability to climate change. Nat. Clim. Change 5, 215–224. doi: 10.1038/NCLIMATE2448
Pacoureau, N., Rigby, C. L., Kyne, P. M., Sherley, R. B., Winker, H., Carlson, J. K., et al. (2021). Half a century of global decline in oceanic sharks and rays. Nature 589, 567–571. doi: 10.5281/zenodo.4135325
Parmesan, C., and Yohe, G. (2003). A globally coherent fingerprint of climate change impacts across natural systems. Nature 421, 37–42. doi: 10.1038/nature01286
Parsons, G. R., and Hoffmayer, E. R. (2005). Seasonal changes in the distribution and relative abundance of the atlantic sharpnose shark Rhizoprionodon terraenovae in the North Central Gulf of Mexico. Copeia 4, 914–920.
Pearson, G. R., Raxworthy, C. J., Nakamura, M., and Peterson, A. T. (2007). Predicting species distributions from small numbers of occurrence records: a test case using cryptic geckos in Madagascar. J. Biogeogr. 34, 102–117. doi: 10.1111/j.1365-2699.2006.01594.x
Pecl, G. T., Araujo, M. B., Bell, J., Blanchard, J., Bonebrake, T. C., Chen, I., et al. (2017). Biodiversity redistribution under climate change: impacts on ecosystems and human well-being. Science 355:eaai9214. doi: 10.1126/science.aai9214
Perry, A., Low, P. J., Ellis, J. R., and Reynolds, J. D. (2005). Climate change and distribution shifts in marine fishes. Science 308:5730. doi: 10.1126/science.1111322
Peterson, A. T., Papes, M., and Soberón, J. (2008). Rethinking receiver operating characteristic analysis applications in ecological niche modeling. Ecol. Model. 213, 63–72. doi: 10.1016/j.ecolmodel.2007.11.008
Peterson, A. T., and Soberón, J. (2012). Species distribution modeling and ecological niche modeling: getting the concepts right. Nat. Conserv. 10, 102–107. doi: 10.4322/natcon.2012.019
Peterson, A. T., Sóberon, J., Pearson, R. G., Anderson, R. P., Martínez-Meyer, E., Nakamura, M., et al. (2011). Ecological Niches and Geographic Distributions. Princeton, NJ: Princeton University Press.
Peterson, T. A., Cobos, M. E., and Jiménez-García, D. (2018). Major challenges for correlational ecological niche model projections to future climate conditions. Ann. N. Y. Acad. Sci. 1429, 66–77. doi: 10.1111/nyas.13873
Phillips, S. J., Anderson, R. P., and Schapire, R. E. (2006). Maximum entropy modeling of species geographic distributions. Ecol. Model. 190, 231–259. doi: 10.1016/j.ecolmodel.2005.03.026
Poloczanska, E. S., Brown, C. J., Sydeman, W. J., Kiessling, W., Schoeman, D. S., Moore, P. J., et al. (2013). Global imprint of climate change on marine life. Nat. Clim. Change 3, 919–925. doi: 10.1038/nclimate1958
Pradhan, P. (2016). Strengthening MaxEnt modelling through screening of redundant explanatory bioclimatic variables with variance inflation factor analysis. Researcher 8, 29–34. doi: 10.7537/marsrsj080516.05
Qiao, H., Feng, X., Escobar, L. E., Peterson, A. T., Soberón, J., Zhu, G., et al. (2019). An evaluation of transferability of ecological niche models. Ecography 42, 521–534.
R Core Team (2018). R: A Language and Environment for Statistical Computing. Vienna: The R Foundation for Statistical Computing.
Radosavljevic, A., and Anderson, R. P. (2014). Making better MAXENT models of species distributions: complexity, overfitting and evaluation. J. Biogeogr. 41, 629–643. doi: 10.1111/jbi.12227
Ranintyari, M., Sunarto, M., Syamsuddin, L., and Astuty, S. (2018). Effects of oceanographic factors on spatial distribution of whale shark in Cendrawasih Bay National Park, West Papua. Environ. Earth Sci. 149:012050. doi: 10.1088/1755-1315/149/1/012050
Regos, A., Gangne, L., Alcaraz-Segura, D., Honrado, J. P., and Domínguez, J. (2019). Effects of species traits and environmental predictors on performance and transferability of ecological niche models. Sci. Rep. 9:4221. doi: 10.1038/s41598-019-40766-5
Robinson, L. M., Elith, J., Hobday, A. J., Pearson, R. G., Kendall, B. E., Possingham, H. P., et al. (2011). Pushing the limits in marine species distribution modelling: lessons from the land present challenges and opportunities. Glob. Ecol. Biogeogr. 20, 789–802.
Robinson, L. M., Hobday, A. J., Possingham, H. P., and Richardson, A. J. (2015). Trailing edges projected to move faster than leading edges for large pelagic fish habitats under climate change. Deep. Res. Part II Top. Stud. Oceanogr. 113, 225–234. doi: 10.1016/j.dsr2.2014.04.007
Rodriguez-Dominguez, A., Connell, S. D., Leung, J. Y. S., and Nagelkerken, I. (2019). Adaptive responses of fishes to climate change: feedback between physiology and behaviour. Sci. Total Environ. 692, 1242–1249. doi: 10.1016/j.scitotenv.2019.07.226
Rosa, R., Baptista, M., Lopes, V. M., Pegado, M. R., Paula, R., Trübenbach, K., et al. (2014). Early-life exposure to climate change impairs tropical shark survival. Proc. R. Soc. Lond. B Biol. Sci. 281:1738. doi: 10.1098/rspb.2014.1738
Saldaña-Ruiz, L. E., García-Rodríguez, E., Pérez-Jiménez, J. C., Tovar-Ávila, J., and Rivera-Téllez, E. (2019). Biodiversity and conservation of sharks in Pacific Mexico. Adv. Mar. Biol. 83, 11–60. doi: 10.1016/bs.amb.2019.08.001
Santana-Morales, O., Cartamil, D., Sosa-Nishizaki, O., Zertuche-Chanes, R., Hernández-Gutiérrez, E., and Graham, J. B. (2020). Artisanal elasmobranch fisheries of northwestern Baja California, Mexico. Cienc. Mar. 46, 1–18. doi: 10.7773/cm.v46i1.3023
Schlaff, A. M., Heupel, M. R., and Simpfendorfer, C. A. (2014). Influence of environmental factors on shark and ray movement, behaviour and habitat use: a review. Rev. Fish Biol. Fish. 24, 1089–1103. doi: 10.1007/s11160-014-9364-8
Sguotti, C., Lynam, C. P., García-Barreras, B., Ellis, J. R., and Engelhard, G. H. (2016). Distribution of skates and sharks in the North Sea: 112 years of change. Glob. Change Biol. 22, 2729–2743. doi: 10.1111/gcb.13316
Simões, M., Romero-Alvarez, D., Nuñez-Penichet, C., Jiménez, L., and Cobos, M. E. (2020). General theory and good practices in ecological niche modeling: a basic guide. Biodivers. Informatics 15, 67–68. doi: 10.17161/bi.v15i2.13376
Sirois-Delisle, C., and Kerr, J. T. (2018). Climate change-driven range losses among bumblebee species are poised to accelerate. Sci. Rep. 8:14464. doi: 10.1038/s41598-018-32665-y
Soberón, J., and Nakamura, M. (2009). Niches and distributional areas: concepts, methods, and assumptions. Proc. Natl. Acad. Sci. U.S.A. 106, 19644–19650.
Sosa-Nishizaki, O., García-Rodríguez, E., Morales-Portillo, C., Pérez-Jiménez, J. C., Rodríguez-Medrano, M. C., Bizzarro, J. J., et al. (2020). Fisheries interactions and the challenges for target and nontargeted take on shark conservation in the Mexican Pacific. Adv. Mar. Biol. 85, 39–69. doi: 10.1016/bs.amb.2020.03.001
Spaet, J. L. Y., Lam, C. H., Braun, C. D., and Berumen, M. L. (2017). Extensive use of mesopelagic waters by a Scalloped hammerhead shark (Sphyrna lewini) in the Red Sea. Anim. Biotelemetry 5:20. doi: 10.1186/s40317-017-0135-x
Spalding, M. D., Fox, H. E., Allen, G. R., Davidson, N., Ferdaña, Z. A., Finlayson, M., et al. (2007). Marine ecoregions of the world: a bioregionalization of coastal and shelf areas. Bioscience 57, 573–583. doi: 10.1641/B570707
Speed, C. W., Field, I. C., Meekan, M. G., and Bradshaw, C. J. A. (2010). Complexities of coastal shark movements and their implications for management. Mar. Ecol. Prog. Ser. 408, 275–293. doi: 10.3354/meps08581
Sun, C. (2018). US DOC/NOAA/NESDIS National Centers for Environmental Information NCEI Standard Product: Global Ocean Currents Database (GOCD). Silver Spring, MD: NOAA.
Sunday, J. M., Pecl, G. T., Frusher, S., Hobday, A. J., Hill, N., Holbrook, N. J., et al. (2015). Species traits and climate velocity explain geographic range shifts in an ocean-warming hotspot. Ecol. Lett. 18, 944–953. doi: 10.1111/ele.12474
Tanaka, K. R., Van Houtan, K. S., Mailander, E., Dias, B. S., Galginaitis, C., O’Sullivan, J., et al. (2021). North Pacific warming shifts the juvenile range of a marine apex predator. Sci. Rep. 11:3373. doi: 10.1038/s41598-021-82424-9
Thuiller, W., Brotons, L., Araújo, M. B., and Lavorel, S. (2004). Effects of restricting environmental range of data to project current and future species distributions. Ecography 27, 165–172. doi: 10.1111/j.0906-7590.2004.03673.x
Thuiller, W., Lavorel, S., and Araújo, M. B. (2005). Niche properties and geographical extent as predictors of species sensitivity to climate change. Glob. Ecol. Biogeogr. 14, 347–357. doi: 10.1111/j.1466-822x.2005.00162.x
Tittensor, D. P., Mora, C., Jetz, W., Lotze, H. K., Ricard, D., Vanden, B. E., et al. (2010). Global patterns and predictors of marine biodiversity across taxa. Nature 466, 1098–1101. doi: 10.1038/nature09329
Tyberghein, L., Verbruggen, H., Pauly, K., Troupin, C., Mineur, F., and Clerck, O. D. (2011). Bio-ORACLE: a global environmental dataset for marine species. Glob. Ecol. Biogeogr. 21, 272–281. doi: 10.1111/j.1466-8238.2011.00656.x
Vedor, M., Queiroz, N., Mucientes, G., Couto, A., Da Costa, I., Dos Santos, A., et al. (2021). Climate-driven deoxygenation elevates fishing vulnerability for the ocean’s widest ranging shak. Elife 10:e62508. doi: 10.7554/eLife.62508
Voda, R., Dapporto, L., Dinca, V., and Vila, R. (2015). Why do cryptic species tend not to co-occur? A Case study on two cryptic pairs of butterflies. PLoS One 10:e0117802. doi: 10.1371/journal.pone.0117802
Wabnitz, C. C. C., Lam, V. W. Y., Reygondeau, G., The, L. C. L., Al-Abdulrazzak, D., Khalfallah, M., et al. (2018). Climate change impacts on marine biodiversity, fisheries and society in the Arabian Gulf. PLoS One 13:e0194537. doi: 10.5061/dryad.mt588k1
Warren, D. L., and Seifert, S. N. (2011). Ecological niche modeling in Maxent: the importance of model complexity and the performance of model selection criteria. Ecol. Appl. 21, 335–342. doi: 10.1890/10-1171.1
Werkowska, W., Márquez, A. L., Real, R., and Acevedo, P. (2016). A practical overview of transferability in species distribution modelling. Environ. Rev. 25, 127–133. doi: 10.1139/er-2016-0045
Wessel, P., and Smith, W. H. F. (1996). A global, self-consistent, hierarchical, high-resolution shoreline database. J. Geophys. Res. Atmos. 101, 8741–8743. doi: 10.1029/96JB00104
Wheeler, C. R., Rummer, J. L., Bailey, B., Lockwood, J., Vance, S., and Mandelman, J. W. (2021). Future thermal regimes for epaulette sharks (Hemiscyllium ocellatum): growth and metabolic performance cease to be optimal. Sci. Rep. 11:454. doi: 10.1038/s41598-020-79953-0
Whitney, N. M., Robbins, W. D., Schultz, J. K., Bowen, B. W., and Holland, K. N. (2012). Oceanic dispersal in a sedentary reef shark (Triaenodon obesus): genetic evidence for extensive connectivity without a pelagic larval stage. J. Biogeogr. 39, 1144–1156. doi: 10.1111/j.1365-2699.2011.02660.x
Whittock, P. A., Pendoley, K. L., and Hamann, M. (2016). Using habitat suitability models in an industrial setting: the case for internesting flatback turtles. Ecosphere 7, 1–19. doi: 10.1002/ecs2.1551
Wiens, J. A., Stralberg, D., Jongsomjit, D., Howell, C. A., and Snyder, M. A. (2009). Niches, models, and climate change: assessing the assumptions and uncertainties. Proc. Natl. Acad. Sci. U.S.A. 106, 19729–19736. doi: 10.1073/pnas.0901639106
Wilkening, J., Pearson-Prestera, W., Mungi, N. A., and Bhattacharyya, S. (2019). Endangered species management and climate change: when habitat conservation becomes a moving target. Wildl. Soc. Bull. 43, 11–20. doi: 10.1002/wsb.944
Wong, B. B. M., and Candolin, U. (2015). Behavioral responses to changing environments. Behav. Ecol. 26, 665–673. doi: 10.1093/beheco/aru183
Worm, B., and Tittensor, D. P. (2011). Range contraction in large pelagic predators. Proc. Natl. Acad. Sci. U.S.A. 108, 11942–11947. doi: 10.1073/pnas.1102353108
Keywords: ecological niche modeling (ENM), suitable area, sharks, RCP, carcharhinid, climate change
Citation: Diaz-Carballido PL, Mendoza-González G, Yañez-Arenas CA and Chiappa-Carrara X (2022) Evaluation of Shifts in the Potential Future Distributions of Carcharhinid Sharks Under Different Climate Change Scenarios. Front. Mar. Sci. 8:745501. doi: 10.3389/fmars.2021.745501
Received: 22 July 2021; Accepted: 16 December 2021;
Published: 27 January 2022.
Edited by:
Nobuhito Mori, Kyoto University, JapanReviewed by:
Oscar Sosa-Nishizaki, Center for Scientific Research and Higher Education at Ensenada (CICESE), MexicoDaniel Philip Crear, National Marine Fisheries Service (NOAA), United States
Copyright © 2022 Diaz-Carballido, Mendoza-González, Yañez-Arenas and Chiappa-Carrara. This is an open-access article distributed under the terms of the Creative Commons Attribution License (CC BY). The use, distribution or reproduction in other forums is permitted, provided the original author(s) and the copyright owner(s) are credited and that the original publication in this journal is cited, in accordance with accepted academic practice. No use, distribution or reproduction is permitted which does not comply with these terms.
*Correspondence: Gabriela Mendoza-González, Z2FicmllbGEubWVuZG96YUBjaWVuY2lhcy51bmFtLm14; Xavier Chiappa-Carrara, Y2hpYXBwYUB1bmFtLm14