 Shipeng Dong1,2
 Fang Wang
- 1Key Laboratory of Mariculture, Ministry of Education, Ocean University of China, Qingdao, China
- 2Function Laboratory for Marine Fisheries Science and Food Production Processes, Qingdao National Laboratory for Marine Science and Technology, Qingdao, China
- 3Zhejiang Marine Fisheries Research Institute, Zhoushan, China
In recent years, integrated pond aquaculture under controlled management has been crucial in improving the supply of aquatic products and ensuring food security. This study constructed two trophic models of integrated pond aquaculture ecosystems of Portunus trituberculatus–Penaeus japonicus (PP) and P. trituberculatus–P. japonicus–Sinonovacula constricta (PPS) using Ecopath with Ecosim software. The energy flows, ecosystem properties, and carrying capacities of the two ecosystems were analyzed and evaluated. The results showed that the ecotrophic efficiency values in the PP and PPS ecosystems were 0.962 and 0.954 for P. trituberculatus and P. japonicus and 0.952 for S. constricta. The effective trophic levels of P. trituberculatus and P. japonicus were 2.065 and 2.027 in the PP system, and those of P. trituberculatus, P. japonicus, and S. constricta were 2.057, 2.018, and 2.010 in the PPS system. The primary productivities of the PP and PPS ecosystems were 2623.79 and 2781.48 g/m2/240 days, with 2.13 and 37.83% of the energy flowing to trophic level II and 97.87 and 62.17% flowing to the detritus, respectively. The total energy of the detritus group was 2900.89 and 2372.98 g/m2/240 days, with 931.02 and 1505.35 g/m2/240 days flowing to trophic level II, respectively. The total primary production/total respiration ratio of the PPS ecosystem (1.632) was lower than that of the PP ecosystem (4.824), indicating that the former had a greater degree of exploitation. At the current feeding level, the carrying capacities of P. trituberculatus and P. japonicus were 65.15 and 47.62 g/m2 in the PP ecosystem, and those of P. trituberculatus, P. japonicus, and S. constricta were 64.96, 48.06, and 100.79 g/m2 in the PPS ecosystem, respectively. At adequate feeding levels, the carrying capacities of P. trituberculatus and P. japonicus were 83.76 and 48.52 g/m2 in the PP ecosystem and 81.82 and 53.44 g/m2 in the PPS ecosystem. The ecotrophic efficiency values and energy flow parameters of the two integrated pond aquaculture ecosystems indicated that S. constricta was a suitable collocation culture species for P. trituberculatus and P. japonicus, and there is room for further improvement in yields of this integrated aquaculture ecosystem.
Introduction
Due to the ongoing depletion of fishery resources, the control of the global marine catch, and an increase in fishing bans in China’s inland waters, an increase in aquatic products will mainly rely on the development of aquaculture. However, against the background of the ocean’s negative carbon emissions and strict environmental protection policy, the aquaculture area decreased from 8.465 million hectares in 2015 to 7.108 million hectares in 2019 (China Fishery Statistics Yearbook, 2016, 2020). The mariculture area decreased from 2.318 million hectares to 1.992 million hectares, showing a decreasing trend in the aquaculture area year-by-year in China (Jiao et al., 2018; China Fishery Statistics Yearbook, 2020). In this context, aquaculture pattern optimization and carrying capacity assessments have become the main focus to ensure sustainable aquaculture development.
Carrying capacity can be defined as the maximum biomass maintained by an ecosystem in a given period (Bacher et al., 1997). It has become a fundamental concept in aquaculture management and is considered the basis and a tool for sustainable development (Stigebrandt, 2011; Weitzman and Filgueira, 2020). Since carrying capacity was first applied in fish pond research in 1963, it has gradually developed from the individual level to the ecosystem level (Yashouv, 1963). In recent years, carrying capacity assessments based on ecosystem models have become a research hotspot in aquaculture. Currently, the most applied ecosystem models are the Ecopath model, farm model, and spatial model (Filgueira et al., 2015). The Ecopath model is based on trophic dynamics, focusing on energy transfer between trophic levels and assessing carrying capacity from the perspective of ecosystem food webs (Jiang and Gibbs, 2005; Byron et al., 2011a,b). The farm model restricts the model domain to the farm extent, combines a hydrodynamic model and individual growth model, and focuses on bivalve-phytoplankton interaction to assess the carrying capacity (Pilditch et al., 2001; Ferreira et al., 2007; Duarte et al., 2008; Rosland et al., 2011). The spatial model is classified into two main classes according to the spatial resolution, i.e., the box model and the full spatial model. The box model typically divides the sea area into several homogenized boxes according to different factors, such as the geographic environment and the population, whereas the full spatial model is typically based on the grid of a hydrodynamic model (Raillard and Ménesguen, 1994; Duarte et al., 2003; Filgueira et al., 2010, 2014). Ecosystem model studies have focused on bivalve culture systems (Ferreira et al., 2008; Silva et al., 2011; Gao et al., 2020). To date, no other ecosystem models have been developed for the carrying capacity assessment of pond aquaculture, except for two preliminary models to assess the carrying capacity of shrimp pond culture with integrated bioremediation techniques and intertidal mangrove planting-aquaulture (Xu et al., 2011; Song et al., 2020).
The Ecopath model was created by Polovina (1984) and was supplemented and refined by Christensen and Pauly (1992a, b). The model was developed into computer software based on the analysis of the ecosystem characteristics and has been applied to investigate energy flows, ecosystem properties, and ecosystem carrying capacities. Currently, more than 500 models have been developed worldwide and were used to study a wide range of ecosystems, including marine, freshwater, and terrestrial systems (Colléter et al., 2015). In recent years, the model has also been gradually applied to high-density culture ponds and integrated pond aquaculture (Zhang, 2011; Zhou et al., 2015; Feng et al., 2018; Gamito et al., 2020; Hu, 2020). However, due to the limited use of highly anthropogenic control conditions, most of those studies focused on the energy flow and structural characteristics of ecosystems and lacked carrying capacity assessments.
Portunus trituberculatus is the first of the three major crab aquaculture species in China, with production reaching 113,810 tons in 2019 (China Fishery Statistics Yearbook, 2020). In order to improve various ecological and economic benefits of P. trituberculatus aquaculture pond, crabs are usually polyculture with kuruma shrimp Penaeus japonicus, Pacific white shrimp Litopenaeus Vannamei, razor clams Sinonovacula constricta, and Manila clams Ruditapes philippinarum (Wang, 2011). Therefore, we constructed two Ecopath models of integrated pond aquaculture ecosystems of P. trituberculatus–Penaeus japonicus (PP) and P. trituberculatus–P. japonicus–S. constricta (PPS) using data from a field survey and the literature. We analyzed and assessed energy flows, ecosystem properties, and carrying capacities of the two ecosystems. This study is important for the optimization of the pond culture pattern and the improvement of culture management techniques. It also provides a reference for carrying capacity assessments of integrated aquaculture systems.
Materials and Methods
Study Areas
The experimental ponds used in the present study were located in Zhoushan City, Zhejiang Province, China (24°35′N, 112°7′E). The size of the two polyculture ponds was 1.33 ha, with an average water depth of 1.2 m during the study period. The stocking density of P. trituberculatus, P. japonicus, and S. constricta is shown in Table 1. The experiment lasted 240 days from June 2020 to January 2021.
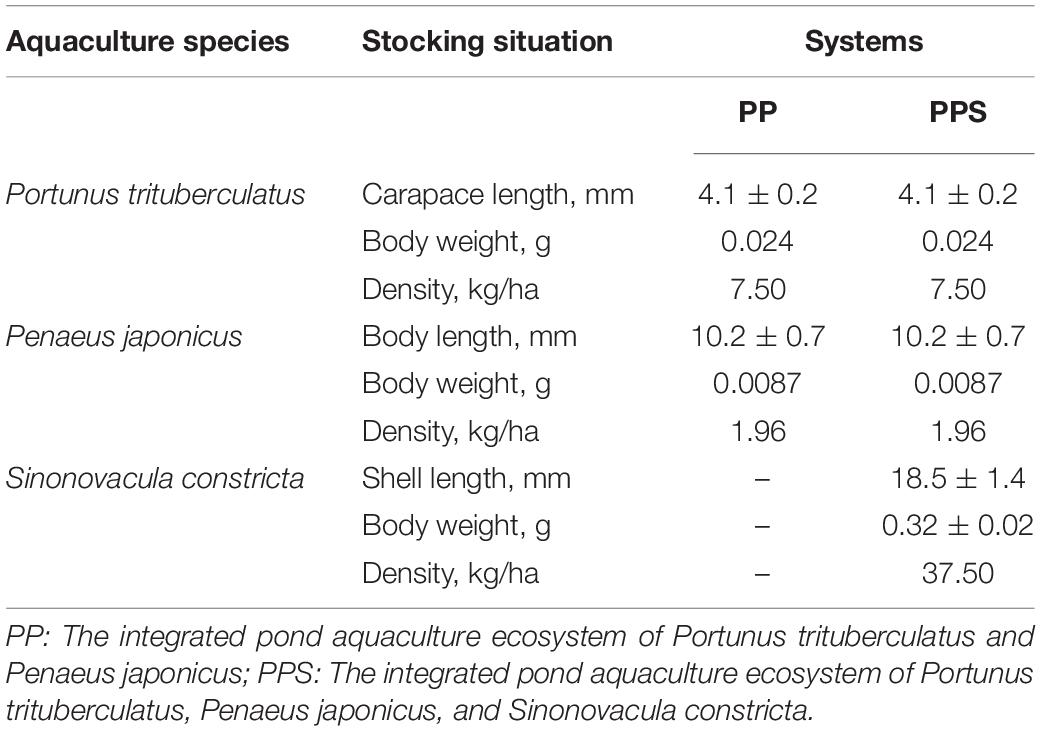
Table 1. Stocking density of Portunus trituberculatus, Penaeus japonicus, and Sinonovacula constricta in two integrated pond aquaculture ecosystems.
Ecopath Modeling Approach
An ecosystem consists of several interrelated functional groups in the Ecopath model, each consisting of a species or many related species. During model construction, all functional groups should cover the energy flow of the ecosystem. The energy of each functional group needs to be balanced between the input and output, i.e., production – predation mortality – harvesting – net migration – biomass accumulation = 0.
The complete ecosystem model is represented by a linear system of joint cubic equations describing n biological functional groups:
where, Bn is the biomass of group n, is the production biomass ratio of group n, EEn is the ecotrophic efficiency of group n, Bn is the biomass of predator n, is the consumption biomass ratio of predator n, DCnn is the contribution of prey n in the diet of predator n, Yn is the yield of fisheries, En is the migration of group n, and BAn is the biomass accumulation of n during the study period.
Ecopath Model Parameterization and Data Collection
The PP and PPS integrated pond aquaculture ecosystems comprised 14 and 15 functional groups, respectively. In addition to aquaculture animals, both ecosystems contained 12 identical functional groups: benthos, macrozooplankton, microzooplankton, benthic bacteria, bacterioplankton, micro-phytoplankton, nano-phytoplankton, pico-phytoplankton, crab feed, shrimp feed, detritus in the sediment, and detritus in water.
The two main inputs to the Ecopath model were biomass (B), production/biomass (P/B), and consumption/biomass (Q/B) (Table 2). Three replicate ponds were set up for both types of aquaculture ponds, and the survey data was compared to ensure the credibility of the model input data, and finally one of the replicate ponds was randomly selected to construct the ecosystem model. The biomass of all functional groups was determined by performing measurements every month, except for the biomass of P. trituberculatu, P. japonicus, and S. constricta, which was calculated from initial and harvesting weights. The P/B values of the aquaculture animals were calculated as the average value of the initial and harvesting weights. The P/B value of each phytoplankton group was obtained from experiments using the light and dark bottle oxygen method (Diana et al., 1991). The production of bacterioplankton was obtained according to Schwaerter et al. (1988). The P/B value of benthic bacteria was calculated from the measured respiration and P/Q value, which was 0.30 (Winberg, 1972). The Q/B values of P. trituberculatu, P. japonicus, and S. constricta were calculated from the feeding rates (Qi et al., 2010; Yang et al., 2010; He et al., 2017). The Q/B value of bacterioplankton was calculated based on field experiments (Williams, 1981). The Q/B value of benthic bacteria was calculated by measuring sediment respiration (Hagrave, 1972). The P/B and Q/B values of zooplankton were obtained from reported references (Feng et al., 2017). The amounts of crab and shrimp feed were recorded and entered into the system as the “detritus” group (Zhou et al., 2015).
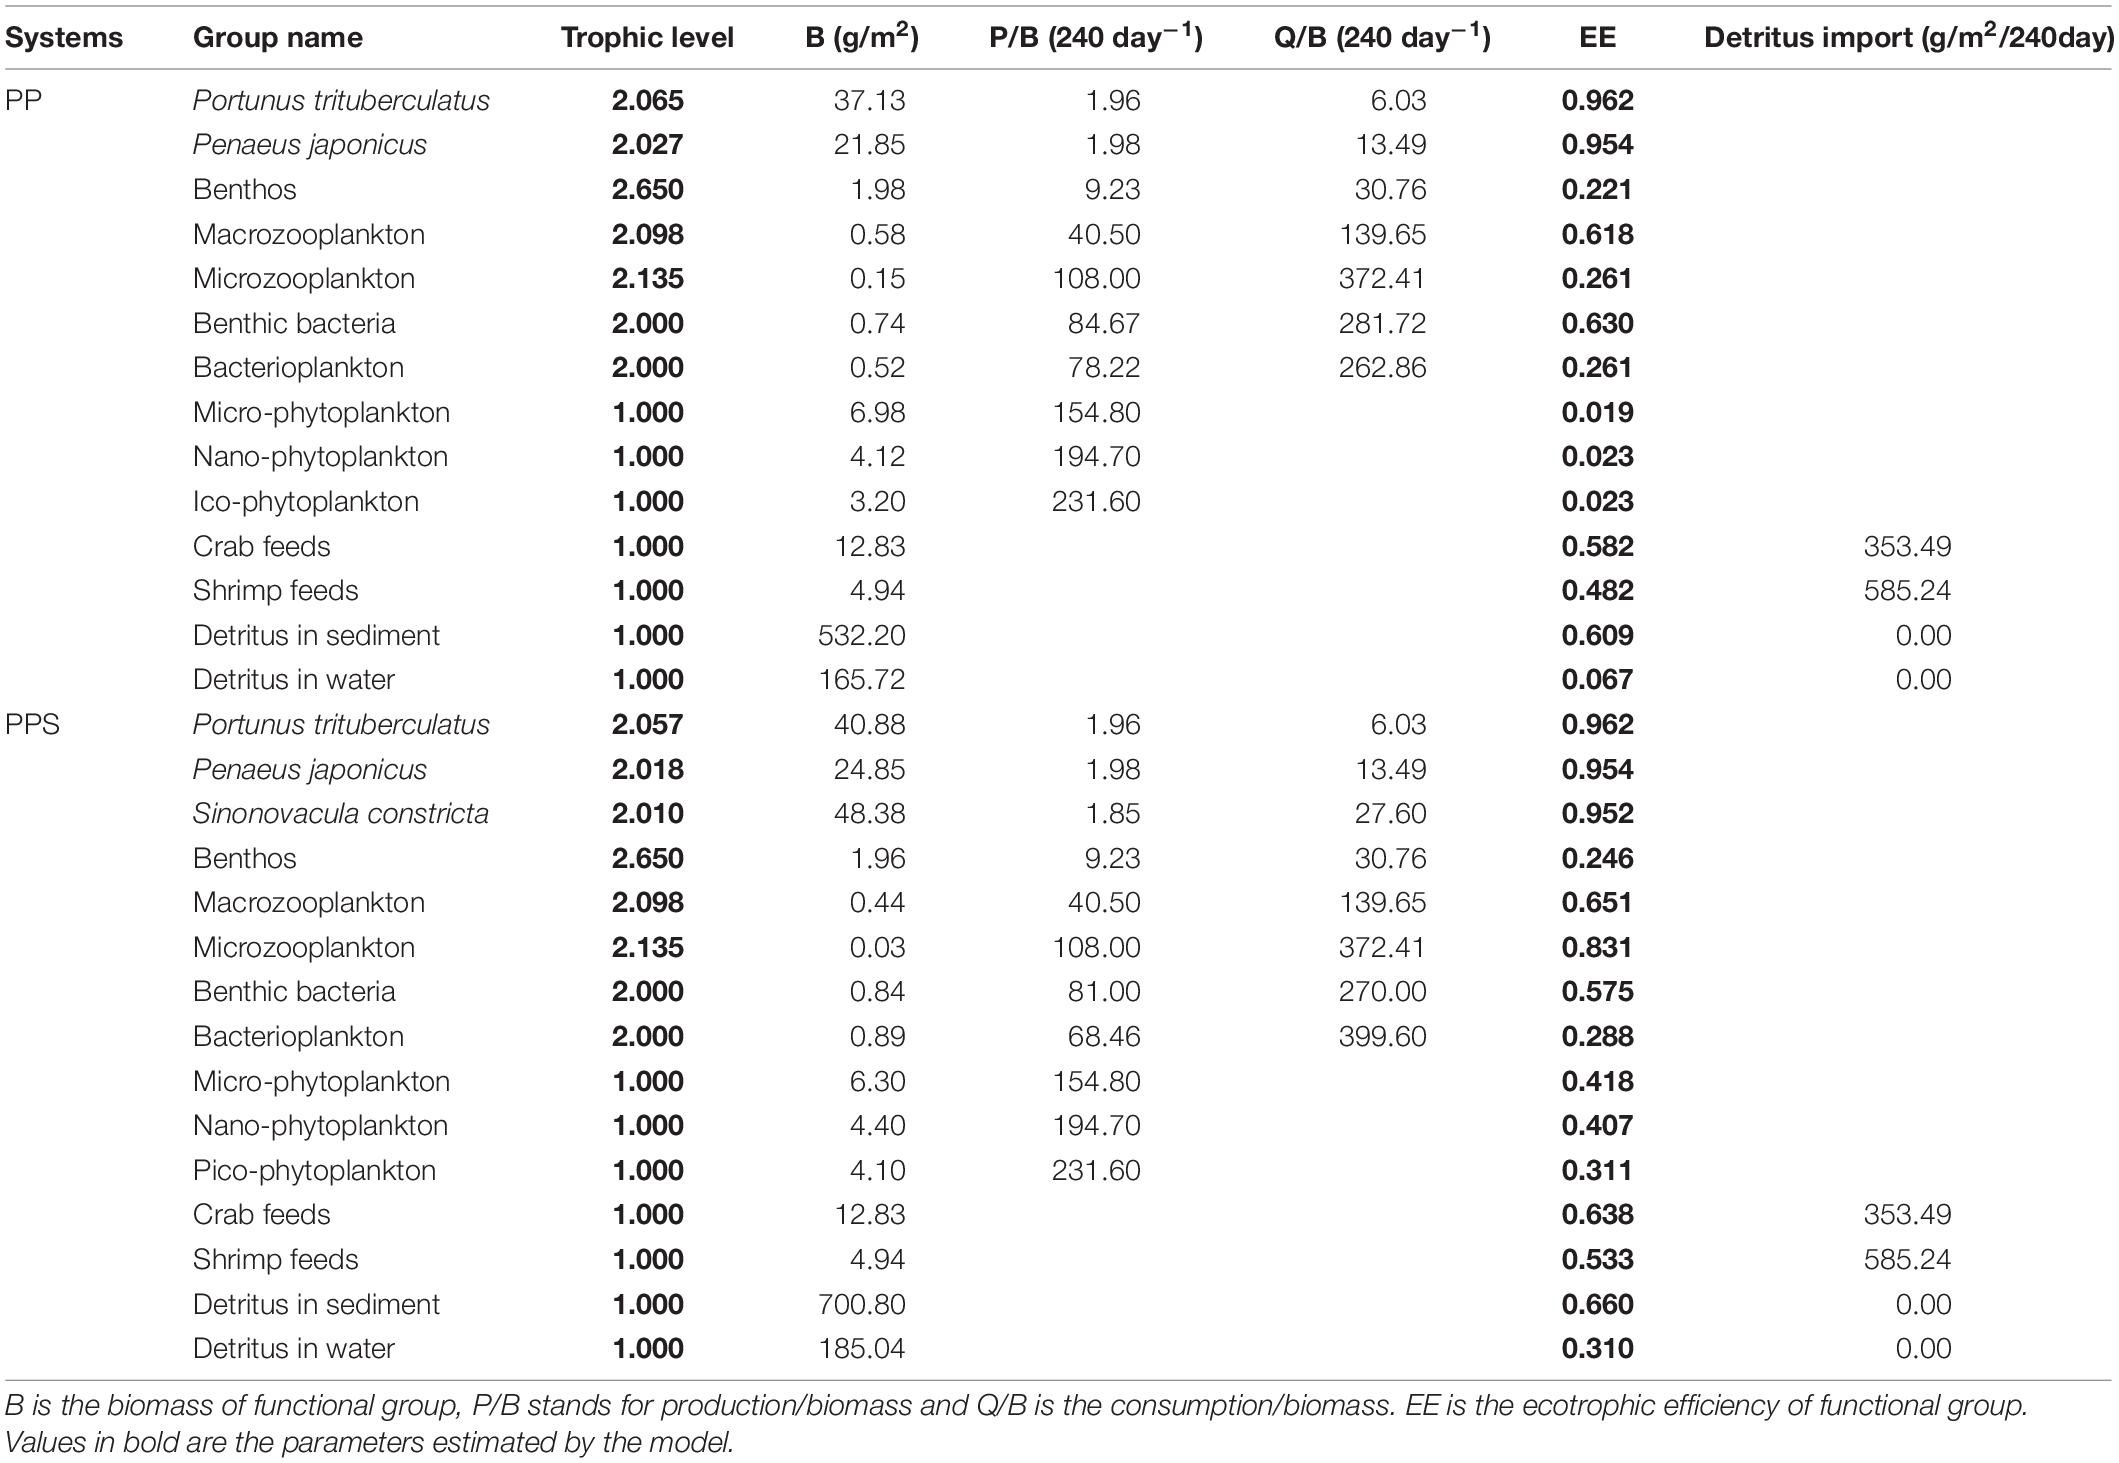
Table 2. Basic input data and output parameters of Ecopath model for the two integrated pond aquaculture ecosystems.
The food composition of the consumers in the two integrated pond aquaculture ecosystems is shown in Table 3. The diets of P. trituberculatus, P. japonicus, S. constricta, benthos (Jin, 2010), macrozooplankton, and microzooplankton (Li and Lin, 1995) were analyzed using carbon stable-isotope analysis based on the related references (Craig, 1957; Anderson et al., 2007). The food composition of bacterioplankton and benthic bacteria was derived from available results of previous studies on shrimp ponds (Zhou, 2015).
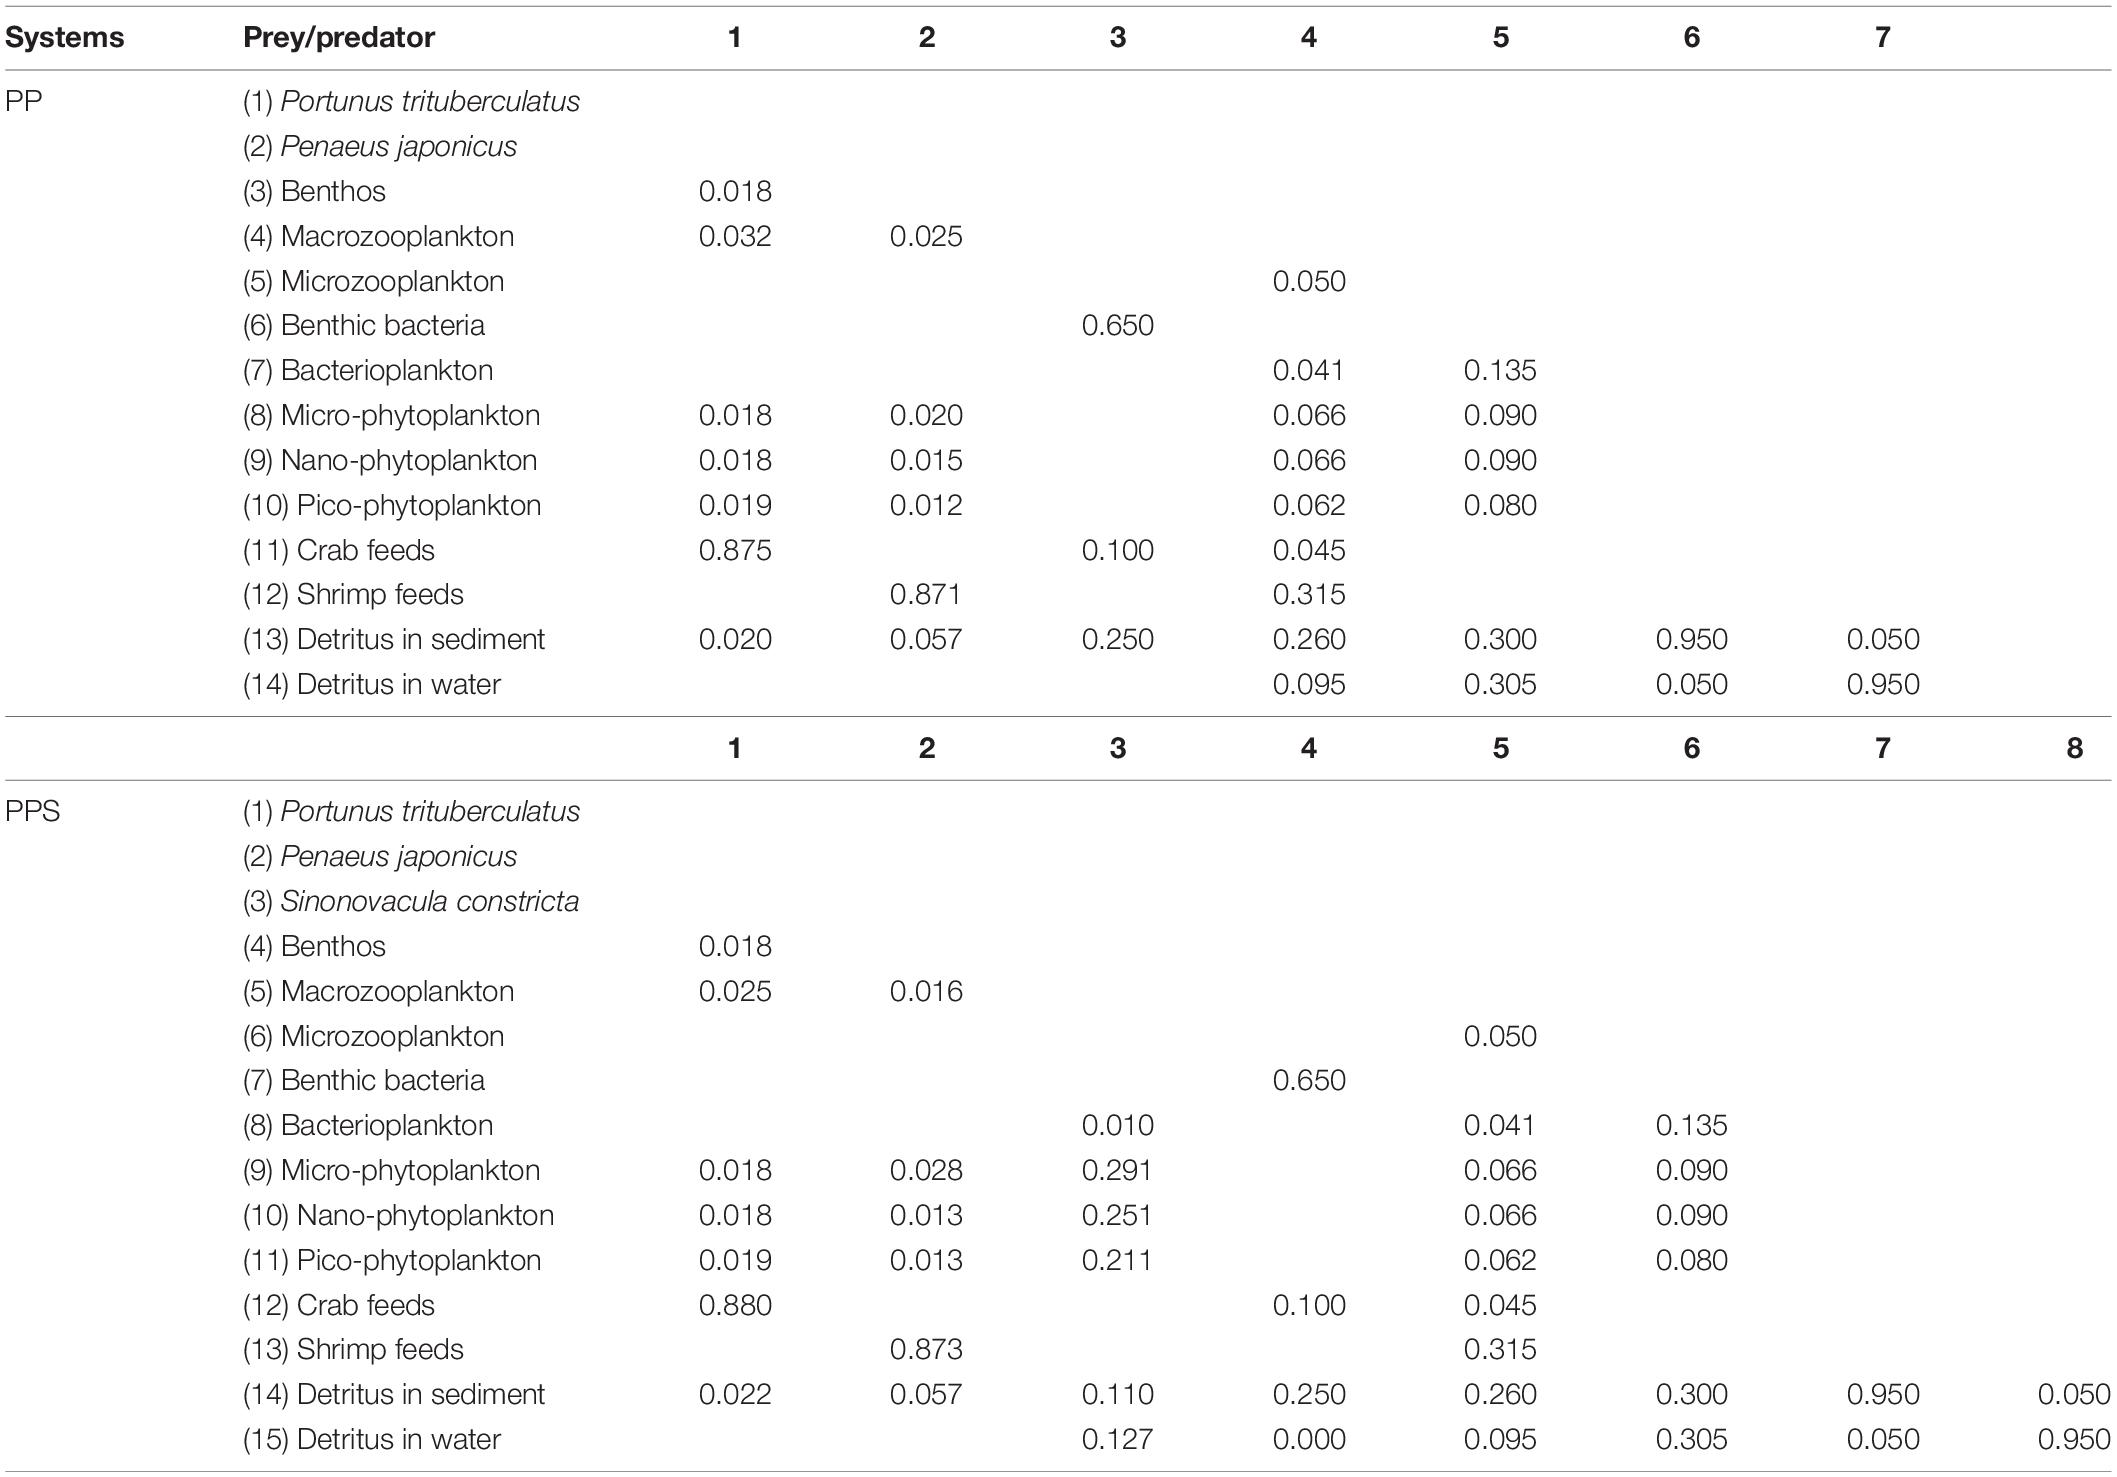
Table 3. Diet matrix of the two integrated pond aquaculture ecosystems.
The assimilation efficiency (AE) of consumers is highly variable (Blanchard et al., 2002). Here the proportion of unassimilated food (1 - AE) was 0.4 for zooplankton and 0.2 for most of other consumers (Feng et al., 2018).
Model Balancing and Uncertainty
Since the Ecopath model has to ensure the conservation of matter and energy among the functional groups, ecotrophic efficiency (EE) ≤ 1 is primarily used as the basic constraint during model debugging (Christensen and Pauly, 1992a). If the EE of a functional group in the output parameters is greater than 1, the food composition, P/B, or Q/B values need to be adjusted repeatedly until the output parameters are in a reasonable range. The P/Q value was maintained in the range of 0.1–0.3 to ensure that EE ≤ 1 (the P/Q value of some fast-growing animals may be greater than 0.3). The reliability and accuracy of the basic input data are the main factors affecting the quality of Ecopath models. Ecopath models are typically evaluated using the pedigree index (P), which refers to the quality and uncertainty of the input parameters. The higher the P value, the more credible the model is and the closer it is to actual ecosystem conditions. The Ecopath model balancing and the P are described in detail by Christensen et al. (2005).
Carrying Capacity Estimation
The carrying capacity assessment of the integrated pond aquaculture ecosystems was established according to existing studies on the carrying capacity assessment of bivalve aquaculture ecosystems based on the Ecopath model (Jiang and Gibbs, 2005; Byron et al., 2011a; Kluger et al., 2016). In this study, P. trituberculatus and P. japonicus were the artificial feeding animals, and thus the carrying capacity was estimated for both current and adequate feeding levels. The carrying capacity estimation of the integrated pond aquaculture ecosystems was similar to that of bivalve aquaculture ecosystems. We continuously increased the biomass of one of the three species (P. trituberculatus, P. japonicus, and S. constricta) (0.01 g/m2 each time) until any of the functional groups in the system was unbalanced. The resulting biomass of the cultured organism was recorded as the carrying capacity at current feeding levels. Since the biomass of cultured organisms eventually reaches the carrying capacity, the amount of crab and shrimp feed may be the limiting factor. Therefore, as the biomass of cultured organisms increased, the amount of feed was also increased until any of the functional groups was unbalanced (EE > 1), except for the feed functional group. The resulting biomass of cultured organisms was recorded at adequate feeding levels. The ratio of the biomass and the carrying capacity of cultured organisms is multiplied by current stocking density to obain the stocking density at which the biomass reach the carrying capacity.
Results
Ecotrophic Efficiency and Effective Trophic Level
The EE values and effective trophic level of the functional groups in the two integrated pond aquaculture ecosystems are listed in Table 2. Ecotrophic efficiency refers to the efficiency of production transfer from one trophic level of the food web to the next (a range of 0–1) affected by fishing and predation pressures. The P. trituberculatus, P. japonicus, and S. constricta showed high EE values in their respective systems. The EE values of P. trituberculatus and P. japonicus were 0.962 and 0.954 in both systems, and that of S. constricta was 0.952 in the PPS system. The EE values of micro-phytoplankton, nano-phytoplankton, pico-phytoplankton, and bacterioplankton were 0.019, 0.023, 0.023, and 0.067 in the PP system and 0.418, 0.407, 0.311, and 0.310 in the PPS system, respectively. The EE value of the microzooplankton in the PP system (0.261) was lower than that in the PPS system (0.831). The EE values of crab feed in the PP and PPS systems were 0.582 and 0.638, respectively, and those of the shrimp feed were 0.482 and 0.533. The EE values of benthic bacteria in the two systems were 0.630 and 0.575, and those of bacterioplankton were 0.261 and 0.288, respectively. The EE values for each functional group were less than 1, which was within the range required by the Ecopath model. The effective trophic level is the trophic level at which each organism feeds in proportion to the predator’s food composition (Odum, 1971). In the two integrated pond aquaculture ecosystems, the highest effective trophic level was benthos with 2.650. The effective trophic levels of P. trituberculatus and P. japonicus were 2.065 and 2.027 in the PP system, and those of P. trituberculatus, P. japonicus, and S. constricta were 2.057, 2.018, and 2.010 in the PPS system. The effective trophic levels of the other functional groups were equal in the two systems.
Energy Flows Between Trophic Levels
The energy flows between the trophic levels in the two integrated pond aquaculture ecosystems are shown in Figure 1. The energy flows occurred mainly within four trophic levels. The total biomass of the primary producers in the PP system was 14.30 g/m2, and the primary production was 2623.79 g/m2/240 days, of which 55.95 g/m2/240 days flowed to trophic level II and 2568.84 g/m2/240 days flowed to detritus, with 2.13 and 97.87% of the energy flowing to trophic level II and the detritus. The total biomass of the primary producers in the PPS system was 14.80 g/m2, and the primary production was 2781.48 g/m2/240 days, of which 1052.16 g/m2/240 days flowed to trophic level II, and 1729.32 g/m2/240 days flowed to detritus, with 37.83 and 62.17% of the energy flowing to trophic level II and detritus. The total energy of the detritus group was 2900.89 and 2372.98 g/m2/240 days, with 931.02 and 1505.35 g/m2/240 days flowing to trophic level II, respectively. In the two integrated pond aquaculture ecosystems, the system energy circulation was mainly distributed in trophic levels I and II. In addition, the transfer efficiency of trophic level II was 17.16% from primary producers and 17.63% from detritus in the PP system and 7.02 and 13.41% in the PPS system, respectively.
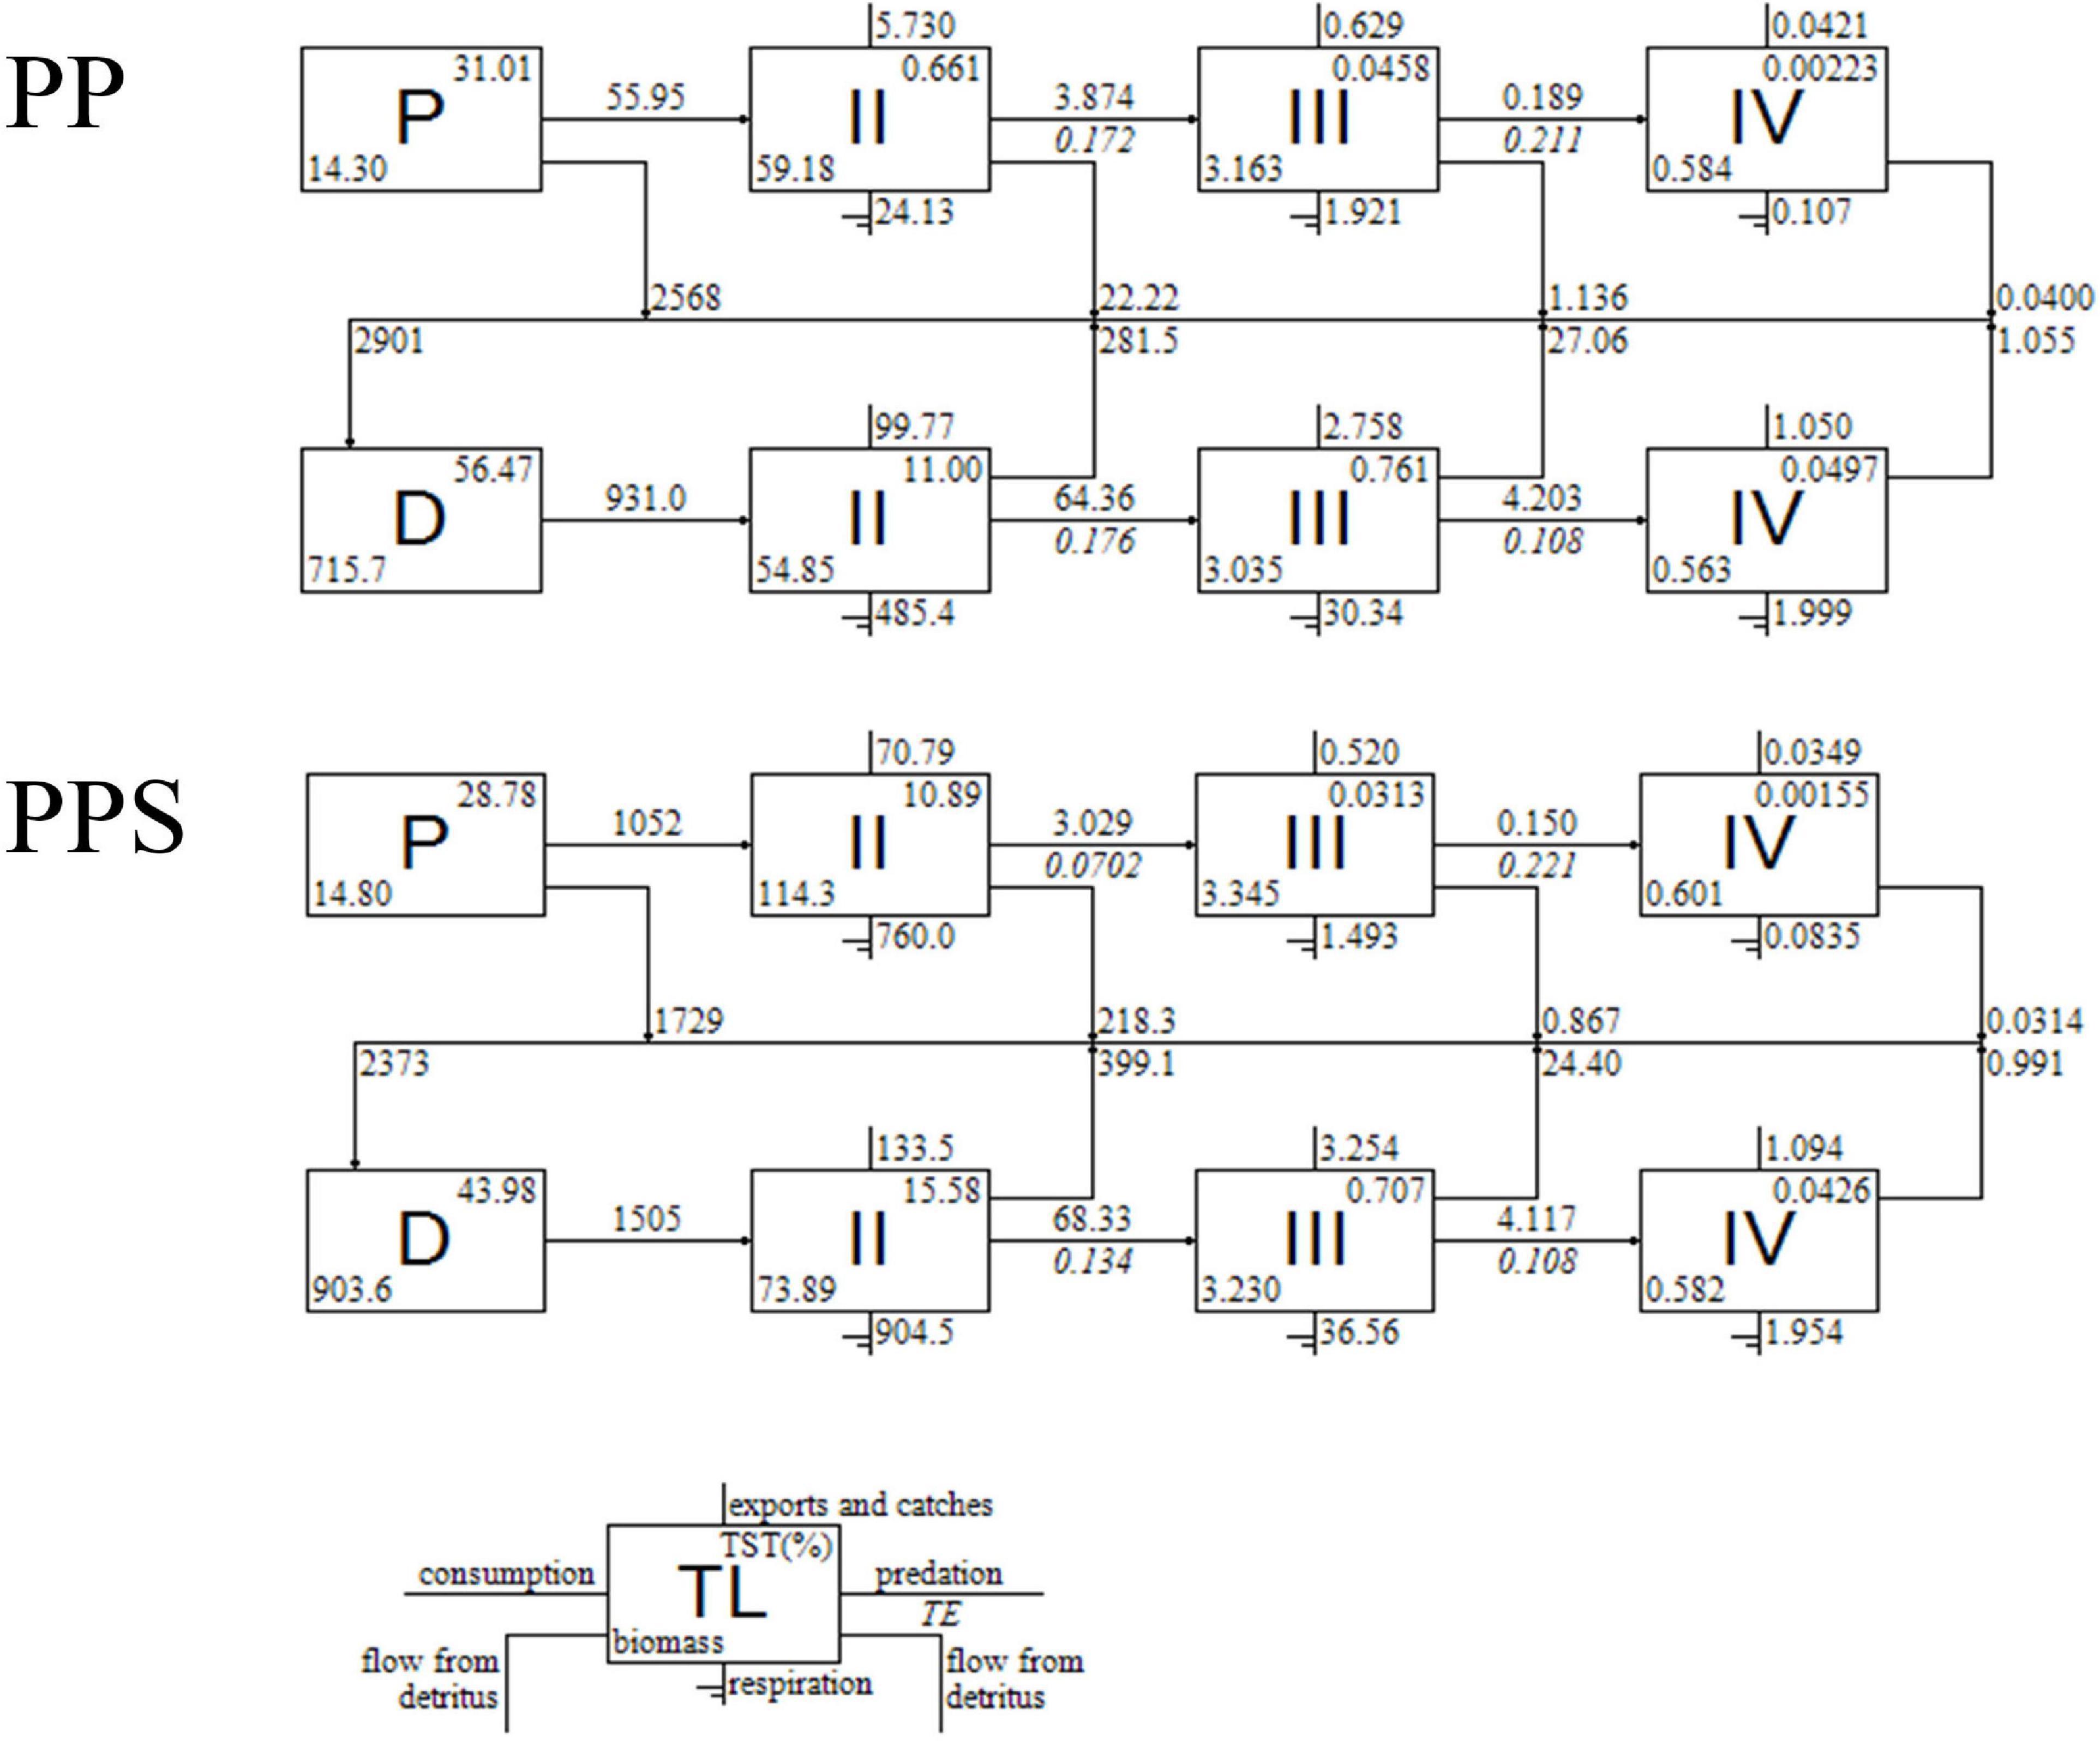
Figure 1. Energy flows among different trophic levels in the two integrated pond aquaculture ecosystems. PP, the integrated pond aquaculture ecosystem of Portunus trituberculatus–Penaeus japonicus; PPS, the integrated pond aquaculture ecosystem of Portunus trituberculatus–Penaeus japonicus–Sinonovacula constricta; D, detritus; P, primary producers; TL, trophic level; TE, transfer efficiency, TST, total system throughput.
Ecosystem Properties
The values of the main energy flow parameters and characteristic parameters of the Ecopath model for the two integrated pond aquaculture ecosystems are shown in Table 4. The total system throughput (TST) was 8461.70 g/m2/240 days and 9665.06 g/m2/240 days in the PP and PPS systems, respectively. In the PP and PPS systems, total consumption accounted for 12.52 and 27.24%, total respiration (TR) accounted for 6.43 and 17.64%, total output accounted for 34.28 and 32.78%, and total flow to detritus accounted for 45.38 and 34.26% of the TST, respectively. The values of the energy flow parameters, such as total system flow, total consumption, TR, total productivity, and total primary production (TPP), were higher in the PPS system than the PP system, and the value of total flow to detritus was higher in the PP system than the PPS system. The TPP/TB and TPP/TR ratios describe the activity, extent, and potential of ecosystem development. The TPP/TB values of the PP and PPS systems were 33.969 and 20.903, respectively. The TPP/TR value of the PP system (4.824) was higher than that of the PPS system (1.632). The connectance index (CI) and system omnivory index (SOI) are correlated with ecosystem complexity, indicating whether the food chain is web-like or linear (Odum, 1971; Christensen et al., 2000). The CI values of the PP and PPS systems were 0.350 and 0.339, and the SOI values were 0.040 and 0.041, respectively. Finn’s cycling index (FCI) is the ratio of the amount of material or energy flowing into the debris in the system required to re-enter the system circulation to the total system flow. It characterizes the maturity, stability, and degree of external disturbance of the system. Finn’s mean path length (FML) is the average length of each cycle flowing through the food chain in the system. The FCI values of the PP and PPS systems were 27.217 and 3.933%, and the FML were 2.375 and 2.598, respectively.
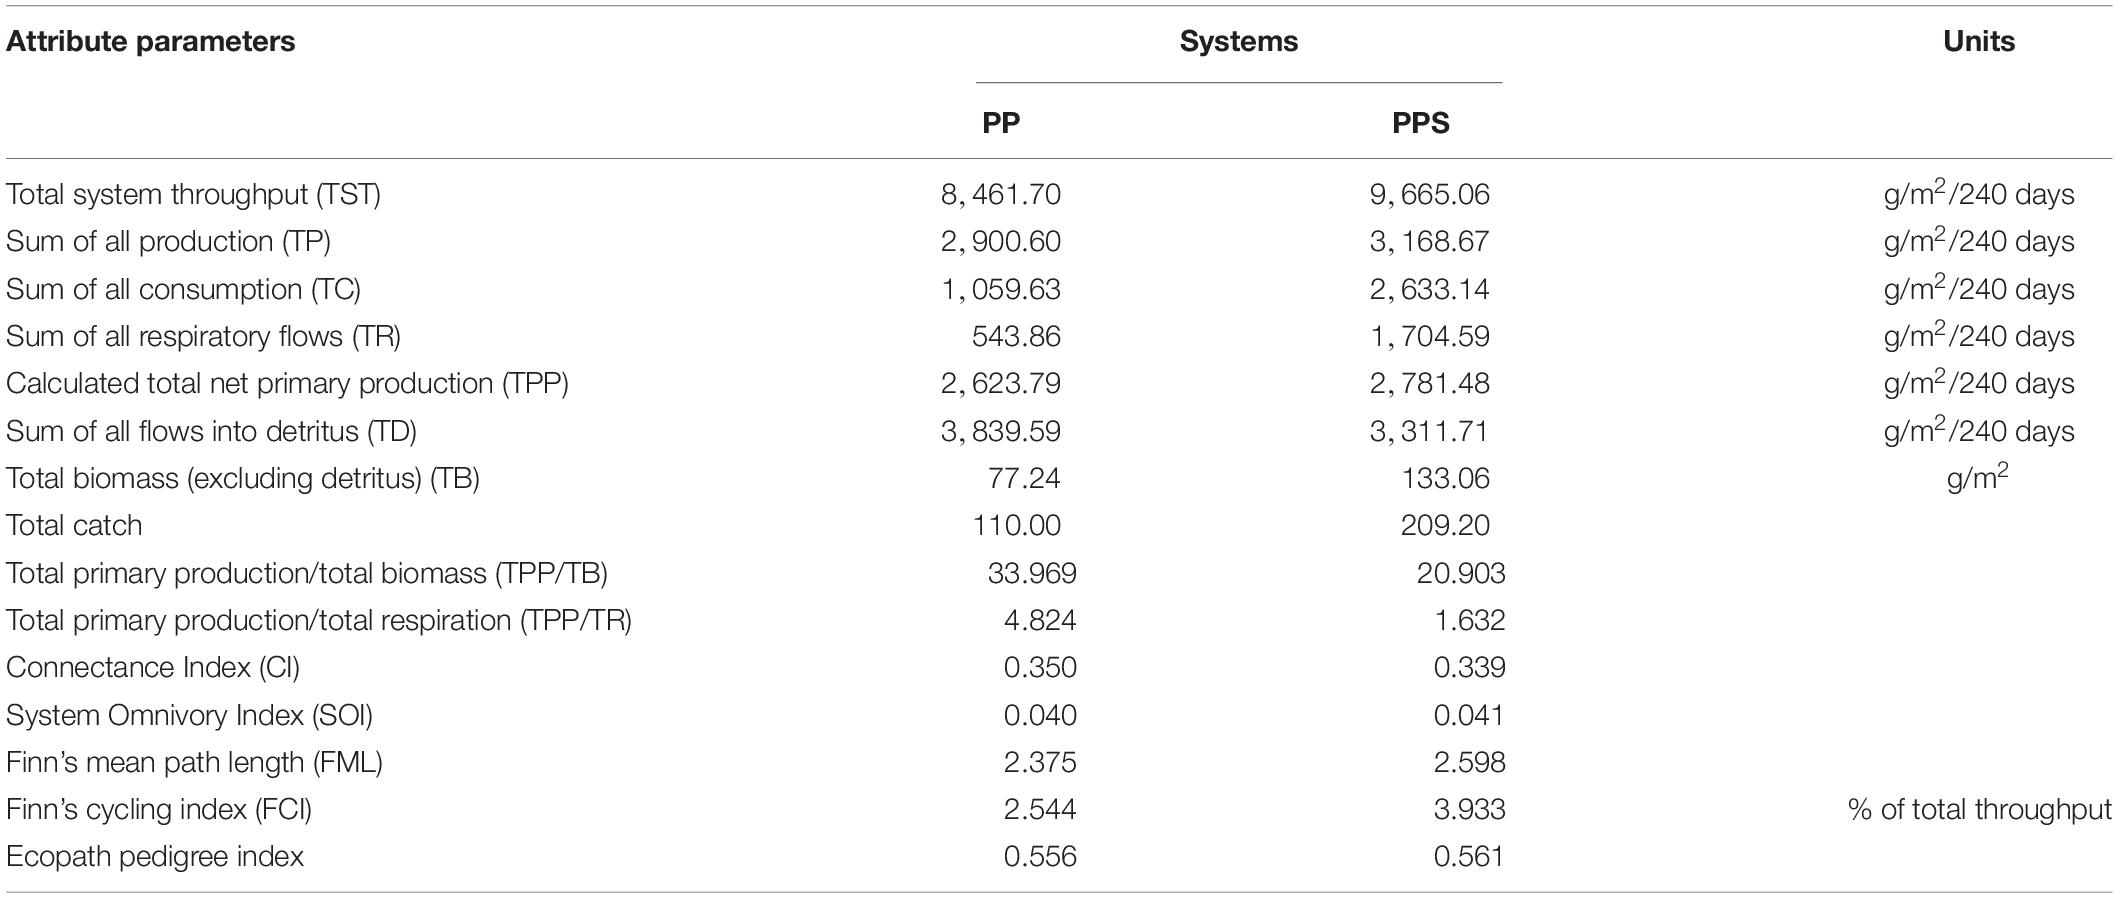
Table 4. Comparison of energy flow parameters and characteristic parameters of the two integrated pond aquaculture ecosystems.
Carrying Capacity Estimation
The estimation results of the carrying capacity of P. trituberculatus, P. japonicus, and S. constricta in the two integrated pond aquaculture ecosystems are shown in Figure 2. At the current feeding level, the carrying capacities of P. trituberculatus and P. japonicus were 65.15 and 47.62 g/m2 in the PP ecosystem, and those of P. trituberculatus, P. japonicus, and S. constricta were 64.96, 48.06, and 100.79 g/m2 in the PPS ecosystem, respectively. After the biomass of P. trituberculatus and P. japonicus in the two ecosystems exceeded the carrying capacity, the first imbalanced functional group was the feed group, indicating that the biomass of crab and shrimp could be increased by increasing the amount of aquatic animal feed. At adequate feeding levels, the carrying capacities of P. trituberculatus and P. japonicus were 83.76 and 48.52 g/m2 in the PP ecosystem and 81.82 and 53.44 g/m2 in the PPS ecosystem, respectively. After the biomass of each aquaculture animal in the two ecosystems exceeded the carrying capacity, the first imbalanced functional group was the microzooplankton. When the biomass of the cultured organisms reached the carrying capacity at adequate feeding levels, the minimum amounts of crab and shrimp feed were 451.67 and 595.66 g/m2/240 days in the PP system and 442.94 and 648.58 g/m2/240 days in the PPS system. The results showed that when the biomass of the cultured organisms reached the carrying capacity, the stocking density of P. trituberculatus and P. japonicus in the PP system was increased to 13.16 and 4.21 kg/ha, and the stocking density of P. trituberculatus, P. japonicus, and S. constricta in the PPS system was increased to 11.92, 3.73, and 78.13 kg/ha in the current aquaculture environment with artificial feeding. After increasing the feeding amount to ensure that the feed was not a limiting factor, the stocking densities of P. trituberculatus and P. japonicus in the PP system were increased to 16.92 and 4.29 kg/ha and those were increased to 15.01 and 4.15 kg/ha in the PPS system, respectively.
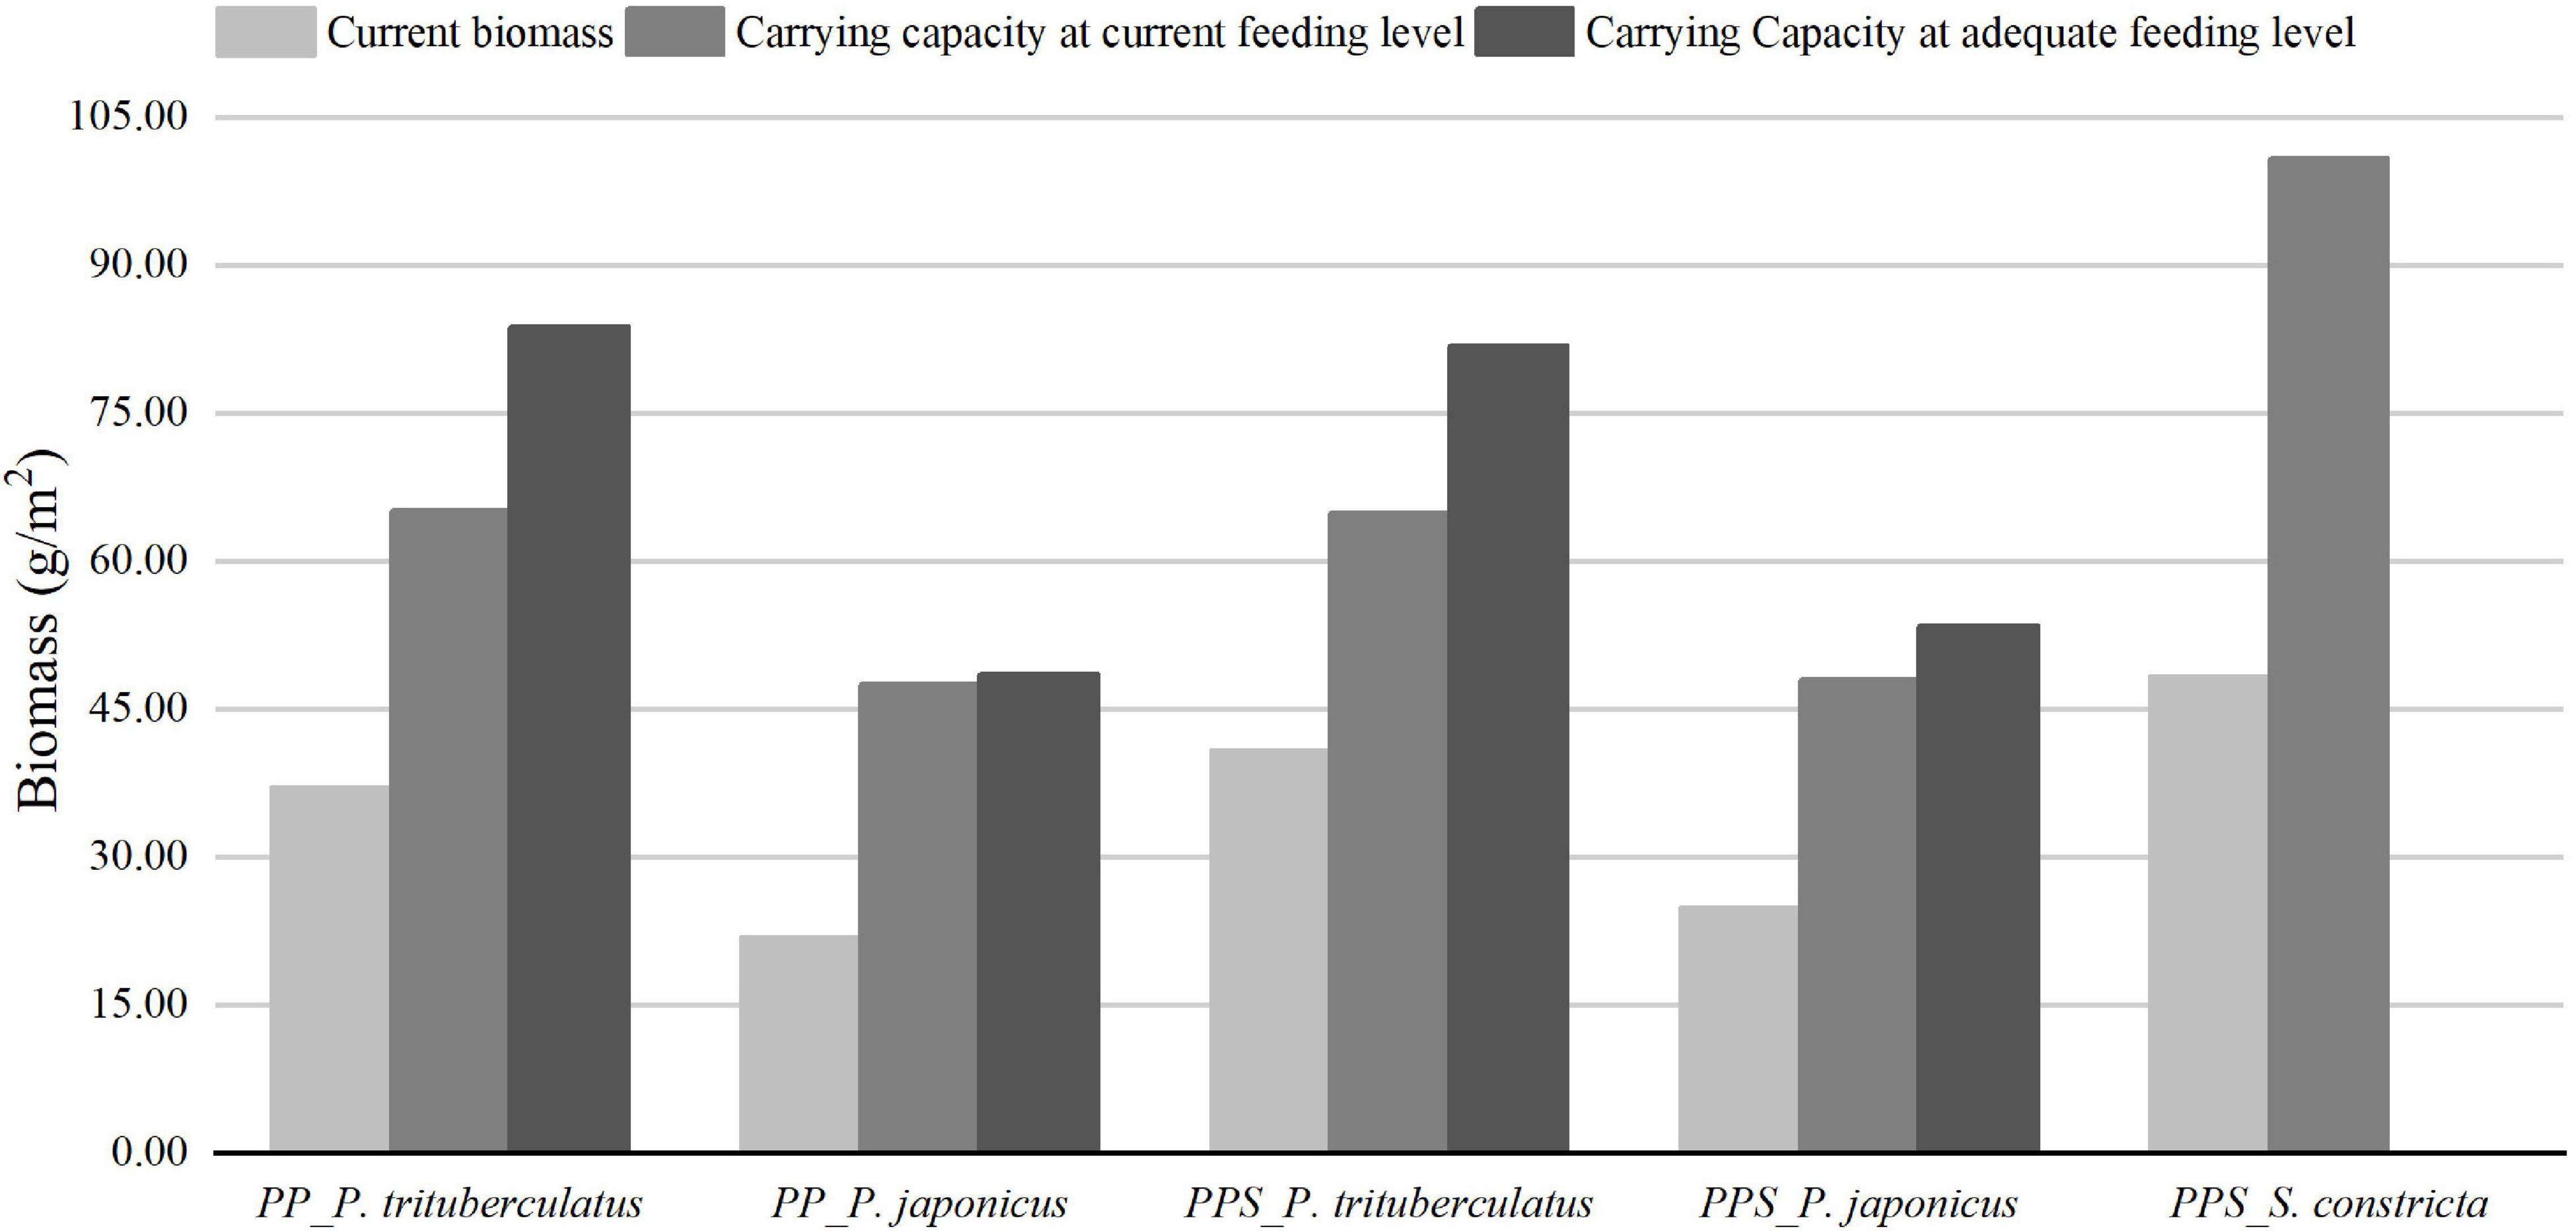
Figure 2. Current biomass and carrying capacity of Portunus trituberculatus and Penaeus japonicus in the integrated pond aquaculture ecosystem of Portunus trituberculatus–Penaeus japonicus (PP), and current biomass and carrying capacity of Portunus trituberculatus, Penaeus japonicus, and Sinonovacula constricta in the integrated pond aquaculture ecosystem of Portunus trituberculatus–Penaeus japonicus– Sinonovacula constricta (PPS).
Ecosystem Pedigree Index
The Ecopath pedigree indices of the PP and PPS systems were 0.556 and 0.561, respectively. The indices were in the upper levels compared to those of 50 ecosystems and 393 Ecopath models evaluated by Morissette et al. (2006) (0.164–0.676).
Discussion
The Ecopath model has been mostly used in studies of large water bodies but has also been increasingly used for analyzing pond culture ecosystems in China. Unlike large water body ecosystems, pond ecosystems are relatively small water bodies, have short food chains, and contain a relatively homogeneous number of species; thus, the biological populations in the functional groups have a finer classification. In this study, zooplankton was classified into macrozooplankton and microzooplankton according to size; phytoplankton was classified into micro-, nano-, and pico-phytoplankton according to the particle size. Bacteria were classified into detritus in the sediment and the water according to the habitat. In terms of system material flow, a higher degree of refinement of each functional group allows for a more accurate description of the model results, facilitating precise regulation in a relatively semi-closed pond system. Ecopath model construction requires a large number of parameters, and the parameters in this study were mainly obtained from pond sampling surveys and field experiments. The P/B values and Q/B values of some parameters were difficult to obtain from the experiment; thus, the research data of similar ecosystems were used as input parameters for the two food web models. Ecopath pedigree indice of the Ecopath model shows the uncertainty of the input data. Based on Ecopath pedigree indices of other Ecopath models, the parameter values of the two models were reliable, and the results of the two models in this study were acceptable (Christensen and Walters, 2004; Christensen et al., 2005).
In ecosystems, species and biomass differences and food composition changes are the main reasons for differences in ecosystem properties, such as trophic structure and energy flow (Christensen and Walters, 2004). In the two integrated pond aquaculture ecosystems, P. trituberculatus, P. japonicus, and S. constricta showed higher EE values owing to greater harvesting pressure. The EE values of phytoplankton (micro-, nano-, and pico-) and detritus in water in the PPS system were significantly higher than those in the PP system; the main reason for this difference in EE values was the feeding pressure of S. constricta. The EE values of microzooplankton in the PPS system were significantly lower than that in the PP system due to the lower biomass of microzooplankton in the PPS system, which may be related to feeding competition between S. constricta and microzooplankton due to the similar food composition (Table 3). In this study, the effective trophic levels of P. trituberculatus and P. japonicus in the PPS system were slightly lower than those in the PP system due to differences in the biomass of the natural food at higher trophic levels (benthos and macrozooplankton). Another reason may be spatial and food competition pressures between S. constricta and the biological feed. Unlike the higher EE values of the “feed group” in previous studies of the pond Ecopath model, the EE values of the crab feed and shrimp feed in this study were between 0.4 and 0.7, indicating that the feed amount in both systems was sufficient, and the utilization of artificial feed requires improvements (Feng et al., 2017, 2018). In addition, the microbial environment is an important reason for the outbreak of biological diseases (Ren et al., 2013). In the two ecosystems, the EE values of detritus in the sediment and in water were not significantly different, indicating that the current stocking density of S. constricta culture did not significantly impact the microbial environment.
Unlike natural ecosystems, the integrated pond aquaculture ecosystem is a closed or semi-closed ecosystem under highly artificial control. Artificial feeding and mechanical oxygen enrichment significantly affect the internal structure of the ecosystem and the relationship between organisms (Zhang, 2011). In previous ecosystem studies based on the Ecopath model, researchers tended to focus on the system characteristics, such as ecosystem complexity, maturity, and stability (Cruz-Escalona et al., 2007; Anh et al., 2015; Rehren et al., 2018). However, research on artificial culture systems should focus on improving the energy utilization and output of the aquatic animals while ensuring the stability of the system (Hu, 2020). The results of the ecosystem energy flow analysis showed that the proportion of primary productivity flow to trophic level II was 2.13 and 37.83% in the PP and PPS systems, and the proportion of total energy flow to trophic level II was 32.09 and 63.44% in the detritus group, respectively, indicating that S. constricta could improve the utilization of primary productivity and detritus in the PPS system. In addition, the transfer efficiency of trophic level II from the primary producers and the detritus in the PPS system was significantly smaller than that in the PP system, suggesting that the energy used by S. constricta was left in trophic level II, ensuring that this part of the energy flowed directly to the output. According to the theory of ecosystem balance, when the production of an ecosystem is higher than the respiration (TPP/TR > 1), the development potential of the ecosystem is greater, and the develoment degree is lower (Odum, 1969; Dong et al., 2021). Therefore, the development degree of the PPS ecosystem was greater than that of the PP ecosystem. It is important to note that this variation in TPP/TR values was not found in the Ecopath model of four other integrated pond aquaculture ecosystems with P. trituberculatus because the “feed group” was a producer in the ecosystem (Feng et al., 2018). Thus, S. constricta, as an economically relevant shellfish that is commonly farmed, is a good species for integrated pond aquaculture of P. trituberculatus and P. japonicus.
There is no uniform indicator of carrying capacity. In this study, carrying capacity was evaluated using Ecopath models of two integrated pond aquaculture ecosystems based on ecosystem stability (EE ≤ 1) combined with artificial feeding. In existing pond carrying capacity assessment studies, the individual biological parameters, the water environment, and economic profit are the main indicators of carrying capacity (Dai et al., 2019; Song et al., 2020). In integrated pond aquaculture ecosystems with small water bodies, the carrying capacity is related to various factors, such as the aquaculture animal species, pond facilities, and aquaculture technology. The consideration of multiple limiting indicators represents a problem in carrying capacity assessments. In future studies, we plan to combine the carbon-nitrogen-phosphorus cycle with a food web model to optimize the assessment indicators and improve the accuracy and universality of carrying capacity assessments of integrated pond aquaculture ecosystems. The evaluation results can assist farm operators with possible management strategies for high-yield aquaculture and government with some practical policy for environmental protection.
Data Availability Statement
The original contributions presented in the study are included in the article/supplementary material, further inquiries can be directed to the corresponding author.
Author Contributions
SD, DZ, and FW designed the experiments and wrote the manuscript. LY, WP, and XX performed the experiments. FW supervised and validated the manuscript. All authors contributed to the article and approved the submitted version.
Funding
This study was funded by the National Key Research and Development Program of China (2019YFD0900402).
Conflict of Interest
The authors declare that the research was conducted in the absence of any commercial or financial relationships that could be construed as a potential conflict of interest.
Publisher’s Note
All claims expressed in this article are solely those of the authors and do not necessarily represent those of their affiliated organizations, or those of the publisher, the editors and the reviewers. Any product that may be evaluated in this article, or claim that may be made by its manufacturer, is not guaranteed or endorsed by the publisher.
References
Anderson, R. K., Parker, P. L., and Lawrence, A. (2007). A 13C/12C tracer study of the utilization of presented feed by a commercially important shrimp penaeus vannamei in a pond growout system. J. World Aquacult. Soc. 18, 148–155. doi: 10.1111/j.1749-7345.1987.tb00433.x
Anh, V. P., Everaert, G., Goethals, P., Vinh, T. C., and Laender, D. F. (2015). Production and food web efficiency decrease as fishing activity increases in a coastal ecosystem. Estuar. Coast. Shelf. Sci. 65, 226–236. doi: 10.1016/j.ecss.2015.05.019
Bacher, C., Duarte, P., Ferreira, J. G., Heral, M., and Raillard, O. (1997). Assessment and comparison of the Marennes Oléron Bay (France) and Carlingford Lough (Ireland) carrying capacity with ecosystem models. Aquat. Ecol. 31, 379–394. doi: 10.1023/a:1009925228308
Blanchard, J. L., Pinnegar, J. K., and Mackinson, S. (2002). Exploring marine mammal-fishery interactions using ‘Ecopath with Ecosim’: modelling the Barents Sea ecosystem. Sci. Ser. Tech. Rep. 117:52.
Byron, C., Link, J., Costa-Pierce, B., and Bengtson, D. (2011b). Modeling ecological carrying capacity of shellfish aquaculture in highly flushed temperate lagoons. Aquaculture 314, 87–99. doi: 10.1016/j.aquaculture.2011.02.019
Byron, C., Link, J., Costa-Pierce, B., and Bengtson, D. (2011a). Calculating ecological carrying capacity of shellfish aquaculture using mass–balance modeling: narragansett Bay, Rhode Island. Ecol. Model 222, 1743–1755. doi: 10.1016/j.ecolmodel.2011.03.010
China Fishery Statistics Yearbook (2016). Department of Agriculture, Fisheries Bureau. China Fishery Statistics Yearbook. Beijing: China Agricultural Press.
China Fishery Statistics Yearbook (2020). Department of Agriculture, Fisheries Bureau. China Fishery Statistics Yearbook. Beijing: China Agricultural Press.
Christensen, V., and Pauly, D. (1992a). A Guide to the Ecopath ii Software System (Version 2.1). Penang: International Center for Living Aquatic Resources Management.
Christensen, V., and Pauly, D. (1992b). Ecopath ii — a software for balancing steady–state ecosystem models and calculating network characteristics. Ecol. Model 61, 169–185. doi: 10.1016/0304-3800(92)90016-8
Christensen, V., and Walters, C. J. (2004). Ecopath with ecosim: methods, capabilities and limitations. Ecol. Model 172, 109–139. doi: 10.1016/j.ecolmodel.2003.09.003
Christensen, V., Walters, C. J., and Pauly, D. (2000). Ecopath with Ecosim, Version 5, Help system©. Vancouver, BC: University of British Columbia.
Christensen, V., Walters, C. J., and Pauly, D. (2005). Ecopath with Ecosim: A User’s Guide. Vancouver, BC: University of British Columbia.
Colléter, M., Valls, A., Guitton, J., Pauly, D., and Christensen, V. (2015). Global overview of the applications of the ecopath with ecosim modeling approach using the EcoBase models repository. Ecol. Model 302, 42–53. doi: 10.1016/j.ecolmodel.2015.01.025
Craig, H. (1957). Isotopic standards for carbon and oxygen and correction factors for mass–spectrometric analysis of carbon dioxide. Geochim. Cosmochim. Acta 12, 133–149. doi: 10.1016/0016-7037(57)90024-8
Cruz-Escalona, V. H., Arreguin-Sanchez, F., and Zetina-Rejon, M. (2007). Analysis of the ecosystem structure of Laguna Alvarado, western Gulf of Mexico, by means of a mass balance model. Estuar. Coast. Shelf. Sci. 72, 155–167. doi: 10.1016/j.ecss.2006.10.013
Dai, D. C., Ma, X. Z., Zhang, Y., and Zhou, Z. (2019). Impact of Eriocheir sinesis ecological culture ponds on water environment in Gehu Lake area of Yixing City. Environ. Chem. 38, 2573–2582. doi: 10.7524/j.issn.0254-6108.2018122004
Diana, J. S., Lin, C. K., and Schneeberger, P. J. (1991). Relationships among nutrient inputs, water nutrient concentrations, primary production, and yield of Oreochromis niloticus in ponds. Aquaculture 92, 323–341. doi: 10.1016/0044-8486(91)90038-9
Dong, S. P., Gao, Y. F., Gao, Y. P., He, M. D., Liu, F., Yan, F. J., et al. (2021). Evaluation of the trophic structure and energy flow of a rice–crayfish integrated farming ecosystem based on the ecopath model. Aquaculture 539:736626. doi: 10.1016/j.aquaculture.2021.736626
Duarte, P., Labarta, U., and Fernández-Reiriz, M. J. (2008). Modelling local food depletion effects in mussel rafts of Galician Rias. Aquaculture 274, 300–312. doi: 10.1016/j.aquaculture.2007.11.025
Duarte, P., Meneses, R., Hawkins, A. J. S., Zhu, M., Fang, J., and Grant, J. (2003). Mathematical modelling to assess the carrying capacity for multi–species culture within coastal waters. Ecol. Model. 168, 109–143. doi: 10.1016/S0304-3800(03)00205-9
Feng, J., Tian, X. L., Dong, S. L., He, R. P., Zhang, K., Zhang, D. X., et al. (2018). Comparative analysis of the energy fluxes and trophic structure of polyculture ecosystems of Portunus trituberculatus based on ecopath model. Aquaculture 496, 185–196. doi: 10.1016/j.aquaculture.2018.07.020
Feng, J., Tian, X. L., Dong, S. L., He, R. P., and Zhang, Q. Q. (2017). Model–based analysis of the energy fluxes and trophic structure of a Portunus trituberculatus polyculture ecosystem. Aquacult. Environ. Interact. 9, 479–490. doi: 10.3354/aei00247
Ferreira, J. G., Hawkins, A. J. S., and Bricker, S. B. (2007). Management of productivity, environmental effects and profitability of shellfish aquaculture – the farm aquaculture resource management (FARM) model. Aquaculture 264, 160–174. doi: 10.1016/j.aquaculture.2006.12.017
Ferreira, J. G., Hawkins, A. J. S., Monteiro, P., Moore, H., Service, M., Pascoe, P. L., et al. (2008). Integrated assessment of ecosystem scale carrying capacity in shellfish growing areas. Aquaculture 275, 138–151. doi: 10.1016/j.aquaculture.2007.12.018
Filgueira, R., Comeau, L. A., Guyondet, T., Mckindsey, C. W., and Byron, C. J. (2015). Modelling Carrying Capacity of Bivalve Aquaculture: A Review of Definitions and Methods. New York, NY: Springer.
Filgueira, R., Grant, J., Strand, O., Asplin, L., and Aure, J. (2010). A simulation model of carrying capacity for mussel culture in a Norwegian fjord: role of induced upwelling. Aquaculture 308, 20–27. doi: 10.1016/j.aquaculture.2010.08.005
Filgueira, R., Guyondet, T., Comeau, L. A., and Grant, J. (2014). A fully–spatial ecosystem–DEB model of oyster (Crassostrea virginica) carrying capacity in the Richibucto Estuary, Eastern Canada. J. Mar. Syst. 136, 42–54. doi: 10.1016/j.jmarsys.2014.03.015
Gamito, S., Ferreira, H. Q., Parejo, A., Aubin, J., and Cunha, E. (2020). Integrated multi–trophic aquaculture systems: energy transfers and food web organization in coastal earthen ponds. Aquac. Environ. Interact. 12, 457–470. doi: 10.3354/aei00375
Gao, Y. P., Fang, J. G., Lin, F., Li, F. X., Li, W. H., Wang, X. Q., et al. (2020). Simulation of oyster ecological carrying capacity in Sanggou Bay in the ecosystem context. Aquac. Int. 285, 2059–2079. doi: 10.1007/s10499-020-00576-3
Hagrave, B. T. (1972). Aerobic decomposition of sediment and detritus as a function of particle surface area and organic content. Limnol. Oceanogr. 17, 583–586. doi: 10.4319/lo.1972.17.4.0583
He, M., Lai, Q. F., Me, Z. L., Sui, Y. M., Lu, J. X., Gao, P. C., et al. (2017). Effects of pH and temperature on carbon budget of Sinonovacula constricta. Chin. J. Plant Ecol 36, 1014–1019.
Hu, G. Y. (2020). Research on Integrated Aquaculture Mode of Shrimp and Shellfish Pond Based on Ecopath mode. Ph.D. Dissertation. Shanghai: Shanghai Ocean University.
Jiang, W., and Gibbs, M. T. (2005). Predicting the carrying capacity of bivalve shellfish culture using a steady, linear food web model. Aquaculture 244, 171–185. doi: 10.1016/j.aquaculture.2004.11.050
Jiao, N. Z., Wang, H., Xu, G. H., and Aricò, S. (2018). Blue carbon on the rise: challenges and opportunities. Natl. Sci. Rev. 5, 464–468. doi: 10.1093/nsr/nwy030
Jin, B. C. (2010). Using Stable Isotope to Evaluate Food Sources of Pond–Cultured Sea Cucumber (Apostichopus japonicus). Ph.D. Dissertation. Qingdao: Ocean University of China.
Kluger, L., Taylor, M., Mendo, J., Tam, J., and Wolff, M. (2016). Carrying capacity simulations as a tool for ecosystem–based management of a scallop aquaculture system. Ecol. Model. 331, 45–55. doi: 10.1016/j.ecolmodel.2015.09.002
Li, C. H., and Lin, W. L. (1995). Grazing rate of zooplankton on bacterioplankton in Donghu Wuhan. Acta Ecol. Sin. 15, 142–147.
Morissette, L., Hammill, M. O., and Savenkoff, C. (2006). The trophic role of marine mammals in the northern Gulf of St. Lawrence. Mar. Mammal Sci. 22, 74–103. doi: 10.1111/j.1748-7692.2006.00007.x
Odum, E. P. (1969). The strategy of ecosystem development. Science 164, 262–270. doi: 10.1126/science.164.3877.262
Pilditch, C. A., Grant, J., and Bryan, K. R. (2001). Seston supply to sea scallops (Placopecten magellanicus) in suspended culture. Can. J. Fish. Aquat. Sci. 58, 214–253. doi: 10.1139/cjfas-58-2-241
Qi, M., Shen, Y. H., and Zhu, C. H. (2010). A primary study on conversion efficiency of Litopenaeus vannamei feed on artificial diets. Fish. Modern. 37, 34–37.
Raillard, O., and Ménesguen, A. (1994). An ecosystem box model for estimating the carrying capacity of a macrotidal shellfish system. Mar. Ecol. Prog. Ser. 115, 117–130. doi: 10.3354/meps115117
Rehren, J., Wolff, M., and Jiddawi, N. (2018). Holistic assessment of Chwaka Bay’s multi–gear fishery – using a trophic modeling approach. J. Mar. Syst 180, 265–278. doi: 10.1016/j.jmarsys.2018.01.002
Ren, C. H., Hu, C. Q., Jiang, X., Sun, H. Y., Zhao, Z., Chen, C., et al. (2013). Distribution and pathogenic relationship of virulence associated genes among Vibrio alginolyticus from the mariculture systems. Mol. Cell. Probe. 27, 164–168. doi: 10.1016/j.mcp.2013.01.004
Rosland, R., Bacher, C., Strand, Ø, Aure, J., and Strohmeier, T. (2011). Modelling growth variability in longline mussel farms as a function of stocking density and farm design. J. Sea Res. 66, 318–330. doi: 10.1016/j.seares.2011.04.009
Schwaerter, S., Søndergaard, M., Bo, R., and Jensen, L. M. (1988). Respiration in eutrophic lakes: the contribution of bacterioplankton and bacterial growth yield. J. Plankton. Res. 10, 515–531. doi: 10.1093/plankt/10.3.515
Silva, C., Ferreira, J. G., Bricker, S. B., DelValls, T. A., Martín-Díaz, M. L., and Yanez, E. (2011). Site selection for shellfish aquaculture by means of GIS and farm–scale models, with an emphasis on data–poor environments. Aquaculture 318, 444–457. doi: 10.1016/j.aquaculture.2011.05.033
Song, X. L., Pang, S. N., Guo, P. P., and Sun, Y. (2020). Evaluation of carrying capacity for shrimp pond culture with integrated bioremediation techniques. Aquac. Res. 51, 761–769. doi: 10.1111/are.14426
Stigebrandt, A. (2011). Carrying capacity: general principles of model construction. Aquac. Res. 42, 41–50. doi: 10.1111/j.1365-2109.2010.02674.x
Weitzman, J., and Filgueira, R. (2020). The evolution and application of carrying capacity in aquaculture: towards a research agenda. Rev. Aquacult. 3, 1297–1322. doi: 10.1111/raq.12383
Williams, P. J. L. B. (1981). Microbial contribution to overall marine plankton metabolism: direct measurements of respiration. Oceanol. Acta 4, 359–364.
Winberg, G. G. (1972). “Some interim results of soviet IBP investigations on lakes,” in Proceedings of the Productivity Problems of Freshwaters, (Poland), 363–381.
Xu, S. N., Chen, Z. Z., Li, C. H., Huang, X. P., and Li, S. Y. (2011). Assessing the carrying capacity of tilapia in an intertidal mangrove-based polyculture system of Pearl River Delta, China. Ecol. Model 222, 846–856. doi: 10.1016/j.ecolmodel.2010.11.014
Yang, H., Ma, S., and Su, Y. P. (2010). Differences of food consumption, metabolism and growth of the crab (Portunus trituberculatus) fed fresh, frozen and oven–dried clam (Ruditapes philippinarum) meat. J. Ocean Univ. China 40, 65–70.
Yashouv, A. (1963). Increasing fish production in ponds. Transc. Am. Fish. Soc. 92, 292–297. doi: 10.1577/1548-8659(1963)92[292:ifpip]2.0.co;2
Zhang, T. W. (2011). The Model of Carbon Flux in Intensive Penaeid Shrimp Culture and Ecological Cultivation. Ph.D. Dissertation. Qingdao: Ocean University of China.
Zhou, B. (2015). Research on Grass Carp (Ctenopharyngodon idella) Integrated Aquaculture Pond Ecosystem: Based on EwE Model. Ph.D. Dissertation. Qingdao: Ocean University of China.
Keywords: carrying capacity, energy flow, ecopath model, integrated pond aquaculture, trophic structure
Citation: Dong S, Wang F, Zhang D, Yu L, Pu W, Xu X and Xie Y (2021) Assessment of the Carrying Capacity of Integrated Pond Aquaculture of Portunus trituberculatus at the Ecosystem Level. Front. Mar. Sci. 8:747891. doi: 10.3389/fmars.2021.747891
Received: 27 July 2021; Accepted: 22 September 2021;
Published: 11 October 2021.
Edited by:
Michael Phillips, WorldFish, MalaysiaReviewed by:
Ricardo Calado, University of Aveiro, PortugalNor Azman Kasan, University of Malaysia Terengganu, Malaysia
Copyright © 2021 Dong, Wang, Zhang, Yu, Pu, Xu and Xie. This is an open-access article distributed under the terms of the Creative Commons Attribution License (CC BY). The use, distribution or reproduction in other forums is permitted, provided the original author(s) and the copyright owner(s) are credited and that the original publication in this journal is cited, in accordance with accepted academic practice. No use, distribution or reproduction is permitted which does not comply with these terms.
*Correspondence: Fang Wang, d2FuZ2ZhbmcyNDlAb3VjLmVkdS5jbg==