 Mélissa Hanafi-Portier1,2*
 Sarah Samadi2†
 Laure Corbari2†
 Tin-Yam Chan3
 Wei-Jen Chen4
 Jhen-Nien Chen4
 Mao-Ying Lee5
 Christopher Mah6
 Thomas Saucède7
 Catherine Borremans1
 Karine Olu1†
- 1Laboratoire Environnement Profond, IFREMER, REM/EEP, Centre de Bretagne, Plouzané, France
- 2UMR 7205 ISYEB, Équipe “Explorations, Espèces et Spéciations”, Muséum National d’Histoire Naturelle, Paris, France
- 3Institute of Marine Biology and Center of Excellence for the Oceans, National Taiwan Ocean University, Keelung, Taiwan
- 4Institute of Oceanography, National Taiwan University, Taipei, Taiwan
- 5Marine Fisheries Division, Fisheries Research Institute, Council of Agriculture, Keelung, Taiwan
- 6Department of Invertebrate Zoology, National Museum of Natural History, Smithsonian Institution, Washington, DC, United States
- 7Biogéosciences, UMR 6282, CNRS, Université Bourgogne Franche-Comté, Dijon, France
Imagery has become a key tool for assessing deep-sea megafaunal biodiversity, historically based on physical sampling using fishing gears. Image datasets provide quantitative and repeatable estimates, small-scale spatial patterns and habitat descriptions. However, taxon identification from images is challenging and often relies on morphotypes without considering a taxonomic framework. Taxon identification is particularly challenging in regions where the fauna is poorly known and/or highly diverse. Furthermore, the efficiency of imagery and physical sampling may vary among habitat types. Here, we compared biodiversity metrics (alpha and gamma diversity, composition) based on physical sampling (dredging and trawling) and towed-camera still images (1) along the upper continental slope of Papua New Guinea (sedimented slope with wood-falls, a canyon and cold seeps), and (2) on the outer slopes of the volcanic islands of Mayotte, dominated by hard bottoms. The comparison was done on selected taxa (Pisces, Crustacea, Echinoidea, and Asteroidea), which are good candidates for identification from images. Taxonomic identification ranks obtained for the images varied among these taxa (e.g., family/order for fishes, genus for echinoderms). At these ranks, imagery provided a higher taxonomic richness for hard-bottom and complex habitats, partially explained by the poor performance of trawling on these rough substrates. For the same reason, the gamma diversity of Pisces and Crustacea was also higher from images, but no difference was observed for echinoderms. On soft bottoms, physical sampling provided higher alpha and gamma diversity for fishes and crustaceans, but these differences tended to decrease for crustaceans identified to the species/morphospecies level from images. Physical sampling and imagery were selective against some taxa (e.g., according to size or behavior), therefore providing different facets of biodiversity. In addition, specimens collected at a larger scale facilitated megafauna identification from images. Based on this complementary approach, we propose a robust methodology for image-based faunal identification relying on a taxonomic framework, from collaborative work with taxonomists. An original outcome of this collaborative work is the creation of identification keys dedicated specifically to in situ images and which take into account the state of the taxonomic knowledge for the explored sites.
Introduction
The deep ocean (depths below 200 m) faces increasing threats, ranging from climate change to direct anthropogenic activities, such as fisheries, mining and physical/chemical pollution (Ramirez-Llodra et al., 2011; Levin and Sibuet, 2012; Levin and Le Bris, 2015). Continental margin habitats (e.g., upper sedimentary slopes, seeps and wood-fall-related environments, cold-water corals, canyons, seamounts) are especially at risk to be affected by human activities (Levin and Sibuet, 2012). Such habitats, especially those of the bathyal zone, often display biological or energy/mineral resources; their proximity to the coast and relatively shallow depth compared to abyssal ones, makes them vulnerable to terrestrial pollution and human activities. However, despite the acceleration of technological developments to prospect deep-sea resources through fisheries and mining, their impact on benthic communities is still poorly documented (Bowden et al., 2016). It is therefore urgent to develop conservation and restoration planning for marine biodiversity and habitats, first with an understanding of natural ecosystem variability, at regional and local scales (Da Ros et al., 2019).
Megafauna, which is usually defined as fauna of sufficient size to be seen by eyes from the images (Grassle et al., 1975) or that can be caught by fishing gears such as sledges, dredges and trawls (Clark et al., 2016), plays many key roles in deep-sea habitats. For instance, they can add structural complexity to the habitat, thereby promoting the diversity of associated fauna (Buhl-Mortensen et al., 2010) and/or, through their activity, modify the local environment of other species (Levin, 2005).
However, reliable assessment of the megafauna biodiversity in the deep sea and of the factors contributing to its spatial structuring is challenging. Historically, the megafauna from the deep sea were explored using fishing gears such as sledges, trawls, or dredges. Paradigms depicting the deep ocean as a species-poor and homogeneous environment have been progressively revised with technological developments (Tyler, 2003), revealing multi-scale heterogeneity of the deep-sea floor (Ramirez-Llodra et al., 2011; Danovaro et al., 2014).
Physical sampling is indeed needed for assessing the biodiversity of the fauna because accurate taxonomic identification can only be carried out upon morphological and/or molecular examination of the collected specimens. Biodiversity surveys from image data do not need the collection of physical samples; however, taxonomic identification from images still relies on the current state of knowledge, which is based on physical sampling. The same situation is encountered for biodiversity surveys based on environmental DNA/metabarcoding approach that also requires well-documented genetic reference libraries based on voucher specimens to be fully interpreted (Vieira et al., 2021). Studies comparing diversity metrics obtained via images and collected samples have shown that the latter provide a higher estimation of species richness (Williams et al., 2015; Beisiegel et al., 2017).
Furthermore, occurrence data derived from the identification of physical samples enable large-scale analyses of community structure and have revealed, for example, a temperate-tropical water transition of megafaunal assemblages along a uniform horizontal abiotic gradient (O’Hara et al., 2020) or significant geographical structure of coral species assemblages with longitude and along bathymetric gradients at the scale of the Azores Exclusive Economic Zone (Braga-Henriques et al., 2013). These data also help to answer phylogenetic (Mah, 2007; Kroh and Smith, 2010; O’Hara et al., 2019) and biogeographic studies (McClain et al., 2009) and subsequent conservation questions.
However, finer scale (meter) characterization of species distribution patterns, and structuring factors such as substrate heterogeneity, cannot be straightforward prospected with classical sampling, and require in situ habitat observation. In complex topographic habitats particularly, fishing gears alone provide mainly qualitative data and only poor quantitative estimates as reported by Williams et al. (2015) from epibenthic sled and also by Nybakken et al. (1998) in the context of soft bottoms from trawling operations. Moreover, fishing gear performance or capture efficiency can vary according to the type of organism, bottom, or fishing gear (e.g., trawl vs. dredge) and therefore therefore also only provide estimates of true abundance. Although endofauna is well captured by trawling in soft bottoms, fishing gears have been shown to be selective against species attached to hard substrates, such as corals or sponges from an epibenthic sled (Williams et al., 2015) or against some attached soft-bottom cnidarians, such as pennatulids or cerianthids from a trawl (Nybakken et al., 1998) or from an epibenthic sledge (Rice et al., 1982). Recently, a comparative study between imagery tools (ROV and towed camera) and trawling in soft bottoms, also highlighted a selectivity of trawling against some small-sized pennatulids, as well as a higher capture efficiency of mobile fauna, due to the light avoidance of mobile forms toward camera systems (de Mendonça and Metaxas, 2021). In addition, all these fishing gears can be less effective if their nets become clogged by sediment or biogenic debris before the end of the transect (Rice et al., 1982; Williams et al., 2015).
Since the end of the 1970s and with the advent of submersibles, the growing use of imagery has made it possible to document the biological and abiotic components of the seafloor quantitatively and in situ (Durden et al., 2016b). Although imagery only allows the observation of epifauna of sufficient size to be detected from images (Rice et al., 1982; Nybakken et al., 1998; Williams et al., 2015; Beisiegel et al., 2017), it has become a common scientific tool used for documenting seafloor heterogeneity, diversity and spatial patterns of benthic megafauna communities, even at sub-meter scales (Danovaro et al., 2014). Image-based studies in various environments have revealed that benthic communities are spatially heterogeneous, especially through the presence of habitat-building species that promote beta diversity (variation in species composition among sites, Legendre, 2014). For instance, in cold-water coral gardens (Buhl-Mortensen et al., 2010), or in deep-sea sponge grounds (Beazley et al., 2013). The spatial heterogeneity of benthic communities can also be related to substrate heterogeneity assessed at the scale of meters using sediment size characterization from images (Robert et al., 2014). In the case of marine protected areas, or vulnerable ecosystems—as well as for long-term temporal monitoring—imagery is desirable as a minimal disturbance approach (Beisiegel et al., 2017). However, this study also pointed out the necessity of having good prior knowledge of the species composition in the region by collecting the organisms to be identified from images. This is particularly necessary in poorly explored environments for which knowledge of the fauna is very poor.
The examination of morphological characters that allows accurate taxonomic identification of organisms is often limited from images, especially if the aim is to identify organisms at the species level (Henry and Roberts, 2014; Howell et al., 2014). A common approach used in ecology is to delineate morphospecies (or parataxonomic units) to define community assemblages and approximate taxonomic diversity (Krell, 2004). This morphospecies delineation consists in dividing the organisms into biological units based on external morphology without assigning them to scientific names that requires the observation of diagnostic characters generally not visible from images. In poorly known environments, this morphospecies approach may be biased due to an erroneous interpretation of the significance of any morphological polymorphism (i.e., undetected sexual dimorphism, intraspecific polymorphism, ontogenetic change, cryptic species, etc.). Therefore, this approach likely leads to a biased approximation of taxonomic diversity (Krell, 2004).
The taxonomic literature alone hardly allows the identification of organisms from images because illustrative in situ images of organisms are lacking and, when taxonomic-identification keys are available, the diagnostic characters used are often not observable from images. Image-based identification thus requires the use of other resources such as the often sparse literature on the species biology/ecology which give complementary information (depth range, associated species, etc.), or handbooks dedicated to some specific environments (e.g., deep-sea hydrothermal vent fauna) or online catalogs (e.g., NOAA, Atlantic Deep Sea Catalog). However, these resources do not provide taxonomic identification keys applicable for images, and accurate identification remains at relatively high taxonomic level. The construction of identification keys dedicated to image-based identification relies on having a detailed knowledge of the organisms present in the targeted areas. Such taxonomic identification guides have only been recently developed for example for the Antarctic area (Saucède et al., 2020), or for the Northwest Atlantic (Wudrick et al., 2020), two areas where the environment and fauna are well explored.
Deep-sea habitat explorations remain disparate, and have mainly been focused on the Northern Hemisphere while the Southern Hemisphere has remained underexplored (Cunha et al., 2017). Papua New Guinea and Mayotte (northern Mozambique Channel) are two southern regions where high faunal diversity has been reported (Obura, 2012; Pante et al., 2012). However, to date, the diversity of the deep-sea fauna is still poorly documented. An exploration program, Tropical Deep-Sea Benthos (TDSB), led by the French National Natural History Museum (Muséum national d’Histoire naturelle; MNHN) and the French National Research Institute for Sustainable Development (Institut de Recherche pour le Développement; IRD) established a geographically and taxonomically non-exhaustive inventory in progress, of benthic species in these areas. In 2014, images have been acquired to provide additional information on deep-sea habitats and the structure of biodiversity at small spatial scales. The challenge is therefore to propose an integrative method relying on robust taxonomic data to analyze the structure of communities at local scales in little-known areas with high faunal diversity.
In this context, we first compared the patterns of biodiversity for the megafauna obtained from physical sampling (dredges and trawls) with those based on still images taken by a towed camera, in various bathyal environments: along the sedimentary continental slopes of Papua New Guinea including a cold-seep area and a bay with wood-falls and a canyon, as well as along the outer slopes of Mayotte dominated by a hard-bottom substrate. We addressed the following questions: (1) What is the lowest taxonomic rank of identification reached for different taxa from images? (2) What biodiversity metrics (alpha and “gamma” diversities, faunistic composition) do these two approaches provide? (3) How physical sampling improve image-based identification, especially in areas where the fauna is poorly known and how to use it to formalize photo-taxa identification from images?
Materials and Methods
Study Areas and Field Collection
Papua New Guinea: Upper Sedimented Slopes and Cold Seeps
Papua New Guinea (PNG) lies in the Coral Triangle in the southwest Pacific Ocean, and shows exceptional biological diversity, especially of zooxanthellate coral, accounting for up to 76% of the species known worldwide (Veron et al., 2009). The region is characterized by geological complexity and dynamics (Tregoning et al., 2000), which have resulted in a diversity of habitats, such as vents (Collins et al., 2012; Van Dover, 2012), seeps (Tappin et al., 2001), seamounts, canyons, sedimentary plains, wood-falls and other plant remains (Pante et al., 2012; Samadi et al., 2015).
Several expeditions, as part of the TDSB program (MNHN/IRD; 2010–2014), explored and discovered new environments in this area, down to about 1,000 m depth. Two of these expeditions [BioPapua (Samadi and Corbari, 2010); Papua Niugini (Payri et al., 2012)] revealed in particular two chemosynthetic habitats linked to cold seeps off the Sepik River mouth and in the Basamuk Canyon where impact of nickel factory release was evidenced (Pante et al., 2012; Samadi et al., 2015). High abundance of wood-falls and other plant debris in Astrolabe Bay were revealed as well from samples. The physical sampling of the benthic fauna provided a first glimpse of the species occurring in these areas.
All dredging and trawling operations undertaken respectively in Astrolabe Bay and in the Sepik area during the BioPapua and Papua Niugini expeditions were integrated in this study to help with the taxonomic identification from images by providing a baseline of species occurring in the whole Astrolabe Bay or Sepik area. These samples are referred to as surrounding area samples (called “Cl-around”). A total of 25 sites were sampled (Table 1). We use the term “sedimented slopes habitats” to refer to the habitats explored in PNG area.
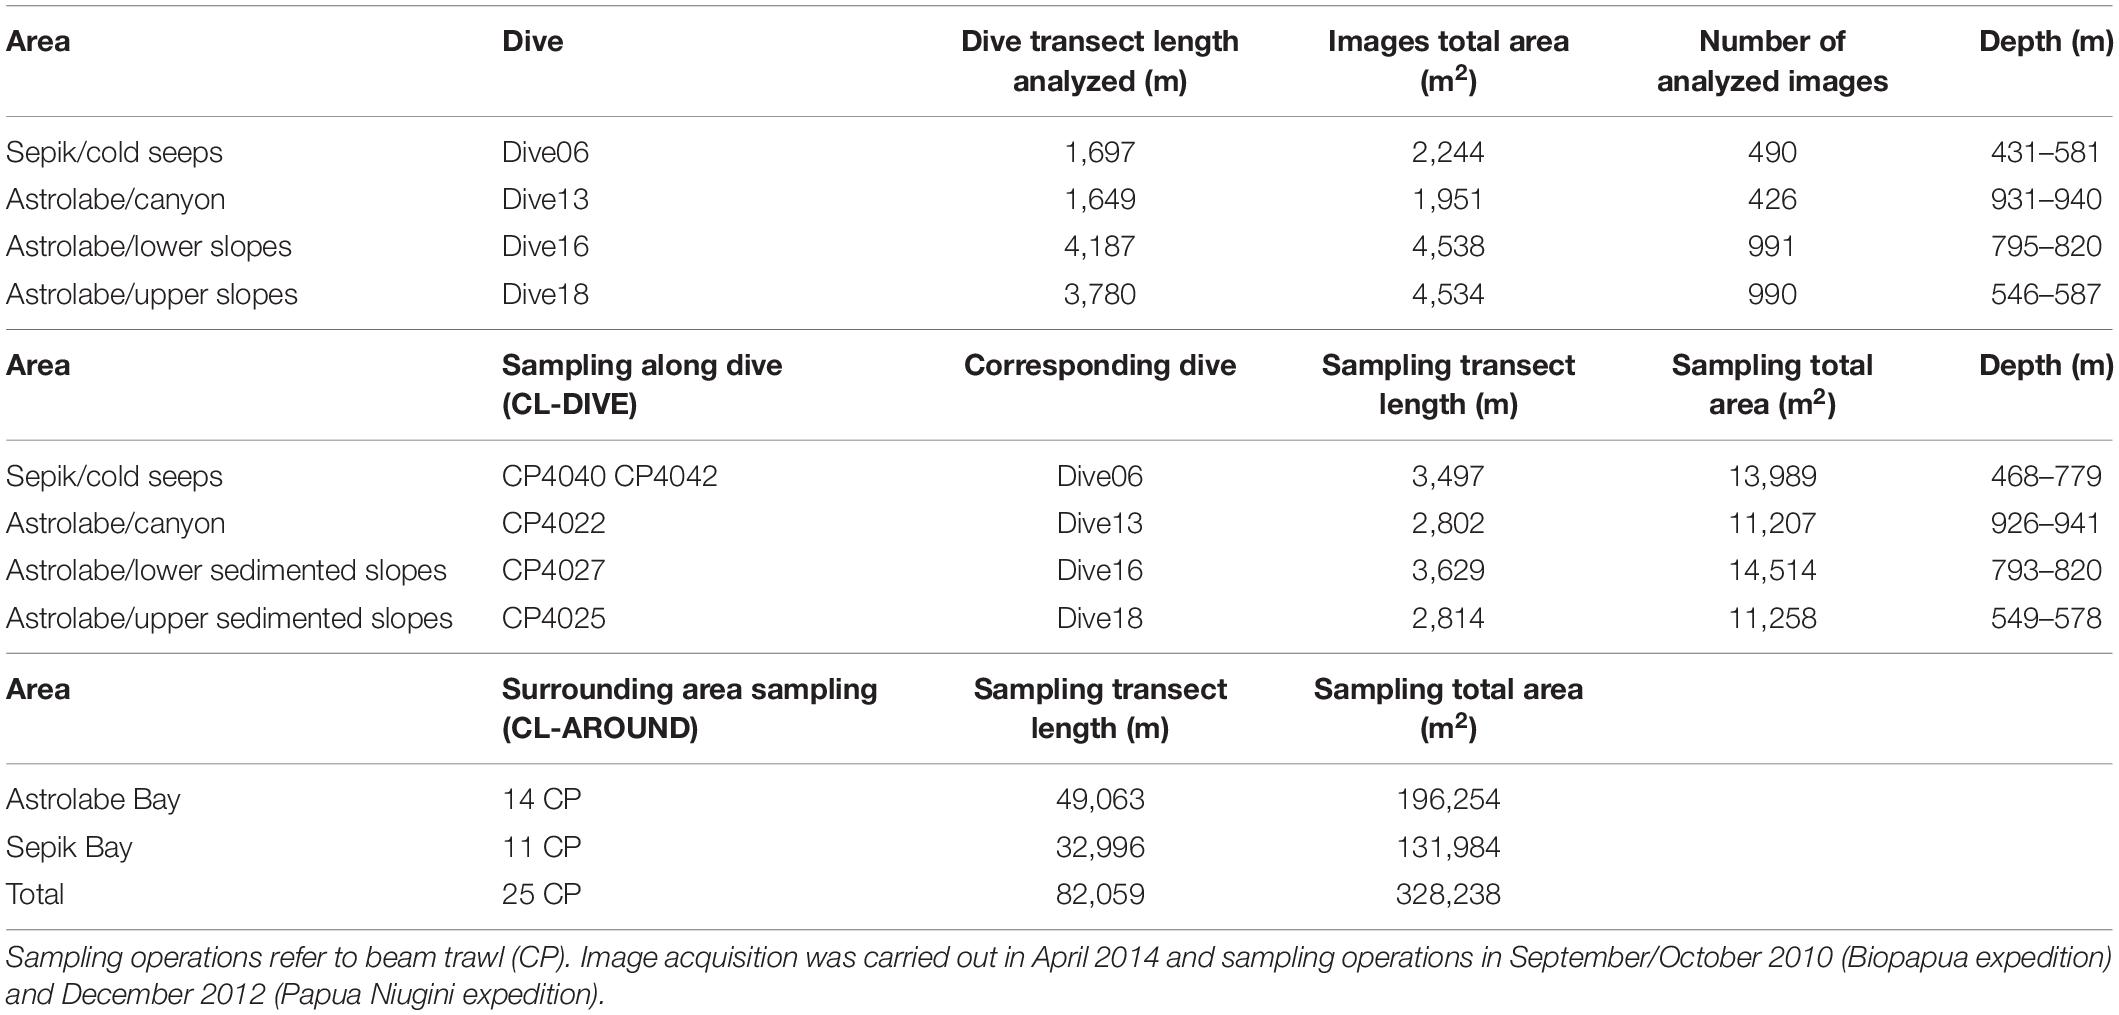
Table 1. Summary of image acquisition and physical sampling efforts with sites information for the dive, sampling along dive (cl-dive) and in the surrounding area (cl-around) in the Astrolabe Bay and Sepik River area (Papua New Guinea).
Image acquisition was undertaken during the Madeep expedition (Corbari et al., 2014), on board the R/V Alis on 05 May 2014. Images were acquired along a selection of dredge and trawl transects carried out during past TDSB expeditions (BioPapua, Papua Niugini). Two sites were visited by camera. The first site is Astrolabe Bay, covering an area of about 514 km2, and showing topographic gradients from the upper slope (∼300 m depth) down to ∼1,000 m depth. The bay is divided by a canyon, which is 100–600 m deeper than the adjacent slope. A total of eight camera transects (called “Dives”) were carried out in Astrolabe Bay along previous trawl or dredge transects (called “Cl-dives”) and three were selected for this study: Dive18, Dive16 and Dive13 because they are representative of each habitat (upper slope, intermediate slope and canyon) (Figure 1 and Table 1). Each transect was about 4 km. From image observations, Dive18 and Dive16 were mainly composed of soft sediment and wood-falls or plant debris, and Dive13 showed a mix between soft sediment and the presence of large cobbles. The second site is Broken Bay, off the Sepik River mouth, where cold-seep fauna, Bathymodiolinae mussels and Siboglinidae tubeworms had previously been sampled at 450 m depth (Samadi et al., 2015). Here, we call this area the Sepik area. Dive06 was located along two trawl transects in this area (Figure 1 and Table 1).
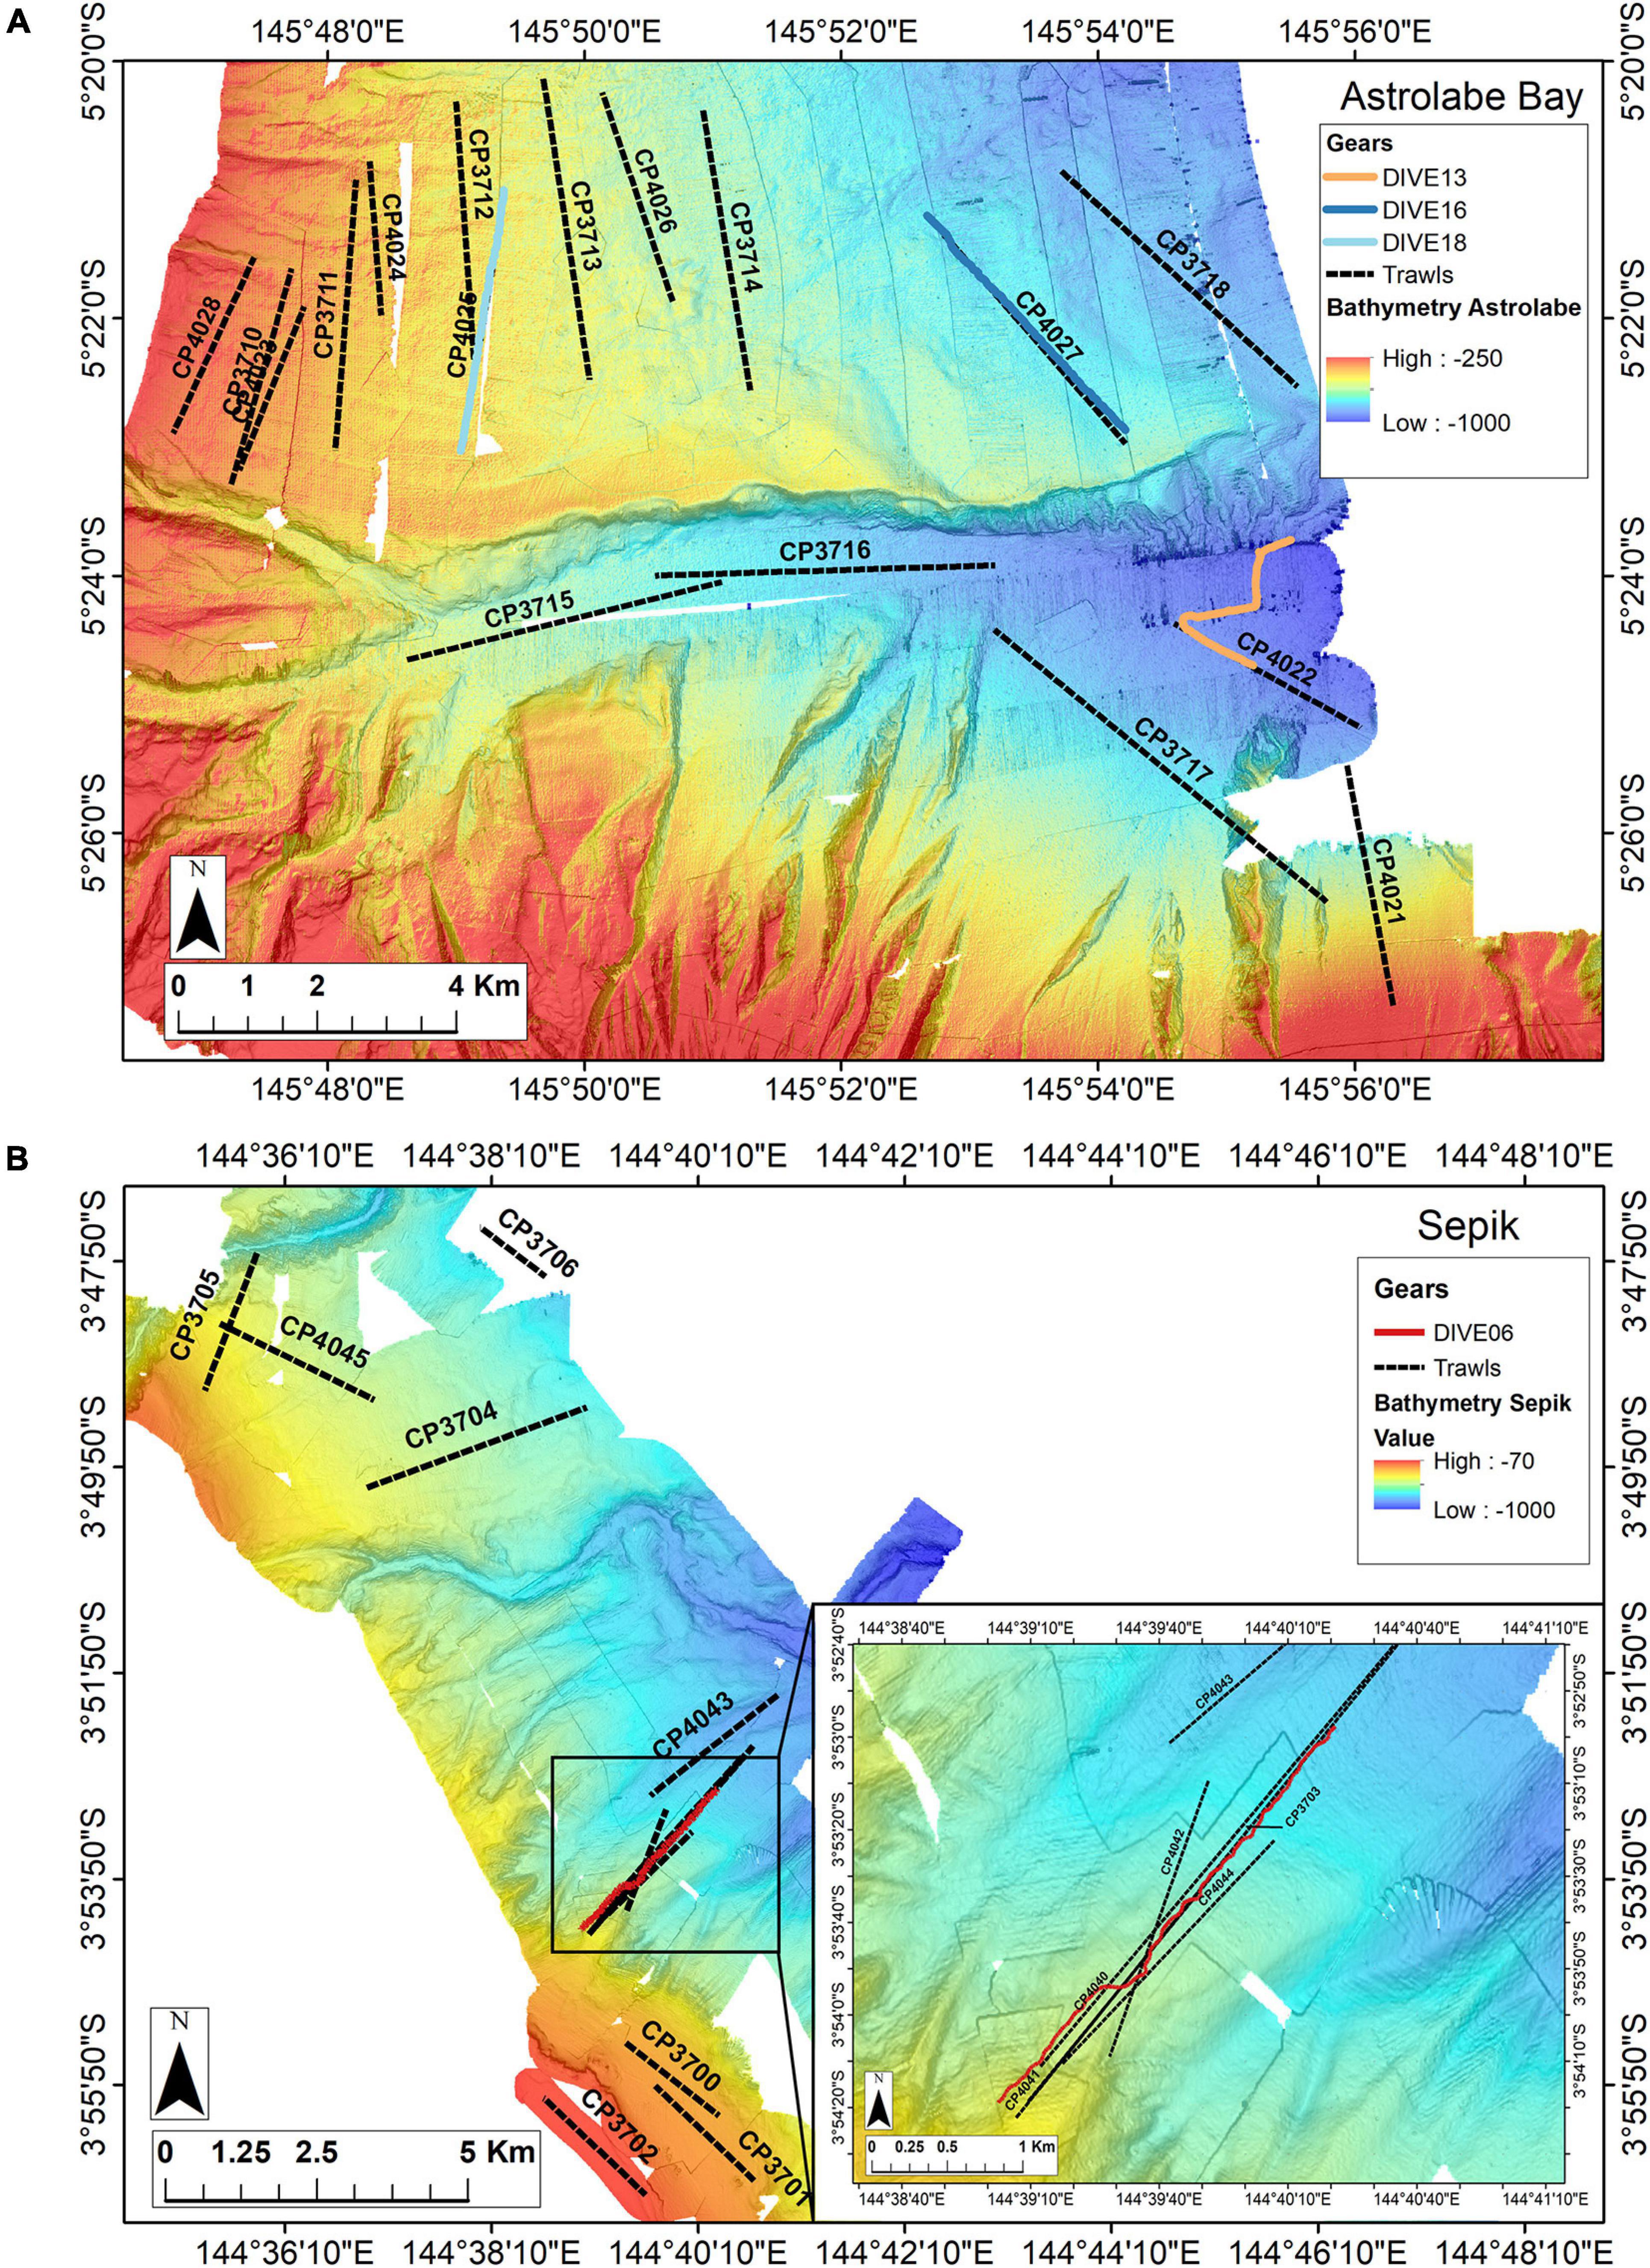
Figure 1. Locationof the camera transects and dredge/trawl transects operations (dive, sampling along dive and in the surrounding area): Panel (A) in the Astrolabe Bay and panel (B) in the Sepik River area (Broken Water Bay). Colored lines represent camera transects, black dotted lines represent dredging (DW) and trawling (CP) operations.
Mayotte: Volcanic Island Outer Slopes Dominated by Hard Bottoms
Mayotte is located in the northern Mozambique Channel, between Madagascar and the Mozambique coast in the West Indian Ocean. It is part of the Comoros archipelago, and is surrounded by a barrier reef that hosts a large lagoon (1,100 km2) (Audru et al., 2006), which is part of the Mayotte Marine Natural Park.
Mayotte islands are crisscrossed by numerous faults, due to post-eruptive volcanic activities (Audru et al., 2006). The outer slopes range from 4 to 20° in inclination (up to 88° on some western flanks) and extend to 1,000 m depth from the barrier reef in the north and east and connect to the abyssal plain through two plateaus in the south and west. The slopes are characterized by geomorphological and substrate complexity, composed of a network of canyons surrounding the all islands, plateaus, cliffs, volcanic cones and of rugged areas (Audru et al., 2006) and provide a supplementary interesting study case for our comparison.
The northern part of the Mozambique Channel is also considered as a hotspot of biodiversity, after the Coral Triangle in the southwest Pacific Ocean, from its exceptional coral reef diversity (Obura et al., 2012). However, little is known regarding the non-reef environments, especially the deep-sea habitats.
Past expeditions of the TDSB program have provided knowledge of the species occurring in the region, with sampling carried out along the Mozambique Coast (MAINBAZA, Bouchet and Ramos, 2009), the Northwest and South Madagascar coast (MIRIKY, Bouchet, 2009 and ATIMO VATAE, Bouchet et al., 2010, respectively). IFREMER expeditions provided additional data on the central part of the Mozambique Channel (PAMELA-MOZ01, Olu, 2014; PAMELA-MOZ04, Jouet and Deville, 2015). However, biodiversity data on the Comoros archipelago are scarce, with only one dedicated expedition in this area (BENTHEDI, Thomassin, 1977) and with sampling gears deployed down to 3,700 m. Details of the MNHN and BENTHEDI expeditions can be found on BaseExp database (Muséum national d’Histoire naturelle, 2019)1.
Images were acquired during the BioMaGlo expedition (Corbari et al., 2017), on board the R/V Antea on 21 January 2017 in the Mayotte-Gloriosos area. Three slope orientations were explored by camera: (1) the northwestern slopes characterized by a plateau at 600 m depth and covering 100 km2 then surrounded by deeper crater-like or volcanoes network features; (2) the southwestern slopes with a deeper and larger plateau at 750 m covering 250 km2 and (3) the eastern slopes, extending continuously down to 1,000 m depth and characterized by shallower volcanic cones (Audru et al., 2006).
A total of five camera transects were carried out and three were selected for this study (Dive01, Dive03, Dive05) (Figure 2), as they provide similar sampling and image acquisition effort, and include a substrate gradient from dive01 (soft bottom) to dive05 (hard and heterogeneous bottom), to assess the influence of bottom type.
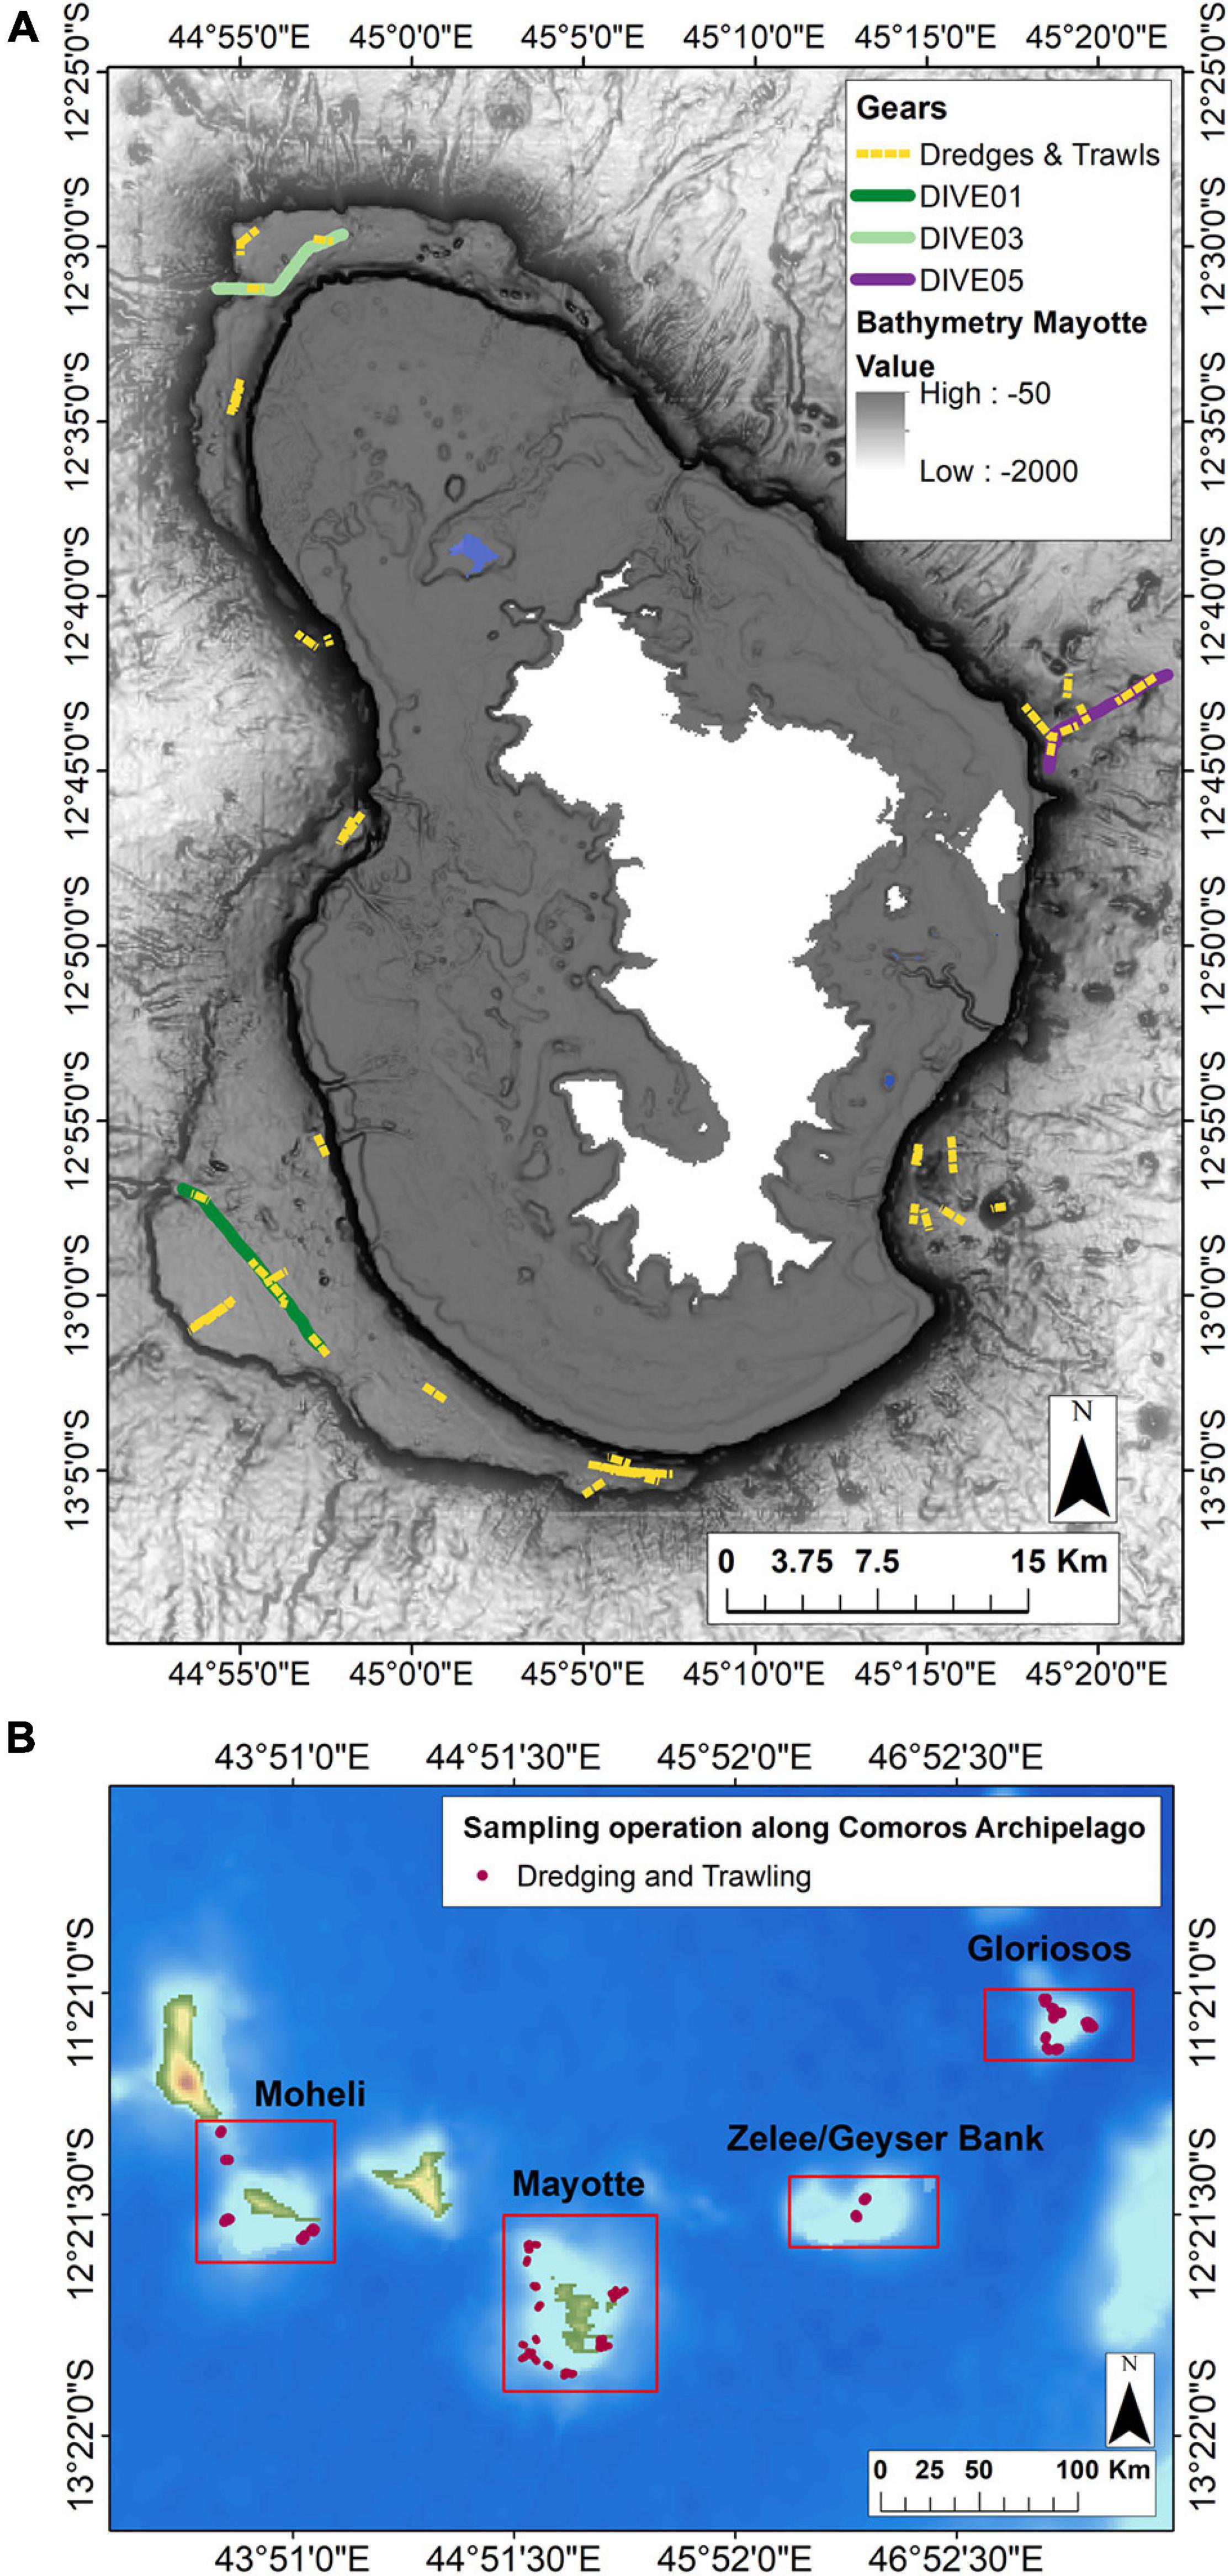
Figure 2. (A) Location of the camera transects and dredge/trawl transects operations (dive, sampling along dive and in the surrounding area) undertaken along the outer slopes of Mayotte. (B) Location of the sampling in the surrounding area undertaken in the Comores Archipelago (Moheli, Geyzer Bank, Gloriosos). Solid lines represent camera transects and yellow dotted lines represent dredging (DW) and trawling (CP) operations.
Dive01 and Dive03 cross a relatively homogeneous bathymetric gradient around 600–700 m and 450–500 m depth, respectively, along the plateaus, and both ending at the mouth of a deeper channel (880 and 1,100 m respectively). Dive01 is mainly composed of soft substrate with sparse blocks or peaks and Dive03 shows an intermediate area of soft sediment and others with large rocky blocks (∼1 m size). Dive05 presents a larger and continuous bathymetric gradient from 500 m down to 1,130 m depth, ending with a passage on a volcanic cone. The area is mainly composed of carbonate and volcanic hard bottoms and is characterized by a very heterogeneous seafloor (gravel, pebbles, cobbles, boulders, blocks, and rugged areas, etc.).
Images were acquired before undertaking co-located dredge and trawl transects (Cl-dives). Each dive included more than one co-located sampling; thus, the different dredge and trawl transects undertaken along each of the three camera transect positions were pooled for comparisons of diversity. A total of three dives and 10 dredge/trawl transects were analyzed (Table 2). Each transect was about 9 km long. Similar to the PNG area, all the 73 sampling catches undertaken during the BioMaGlo expedition (i.e., all around Mayotte area and the other explored Comoros islands including Gloriosos islands, Moheli, Geyzer Bank) were included in the comparison and referred to as surrounding area samples (Cl-around) (Table 2). These samplings helped the identification from images by providing a baseline of species occurring in the area. Moreover, we also used species baseline knowledge provided by past expeditions undertaken along the Mozambique Channel to help with the identification.
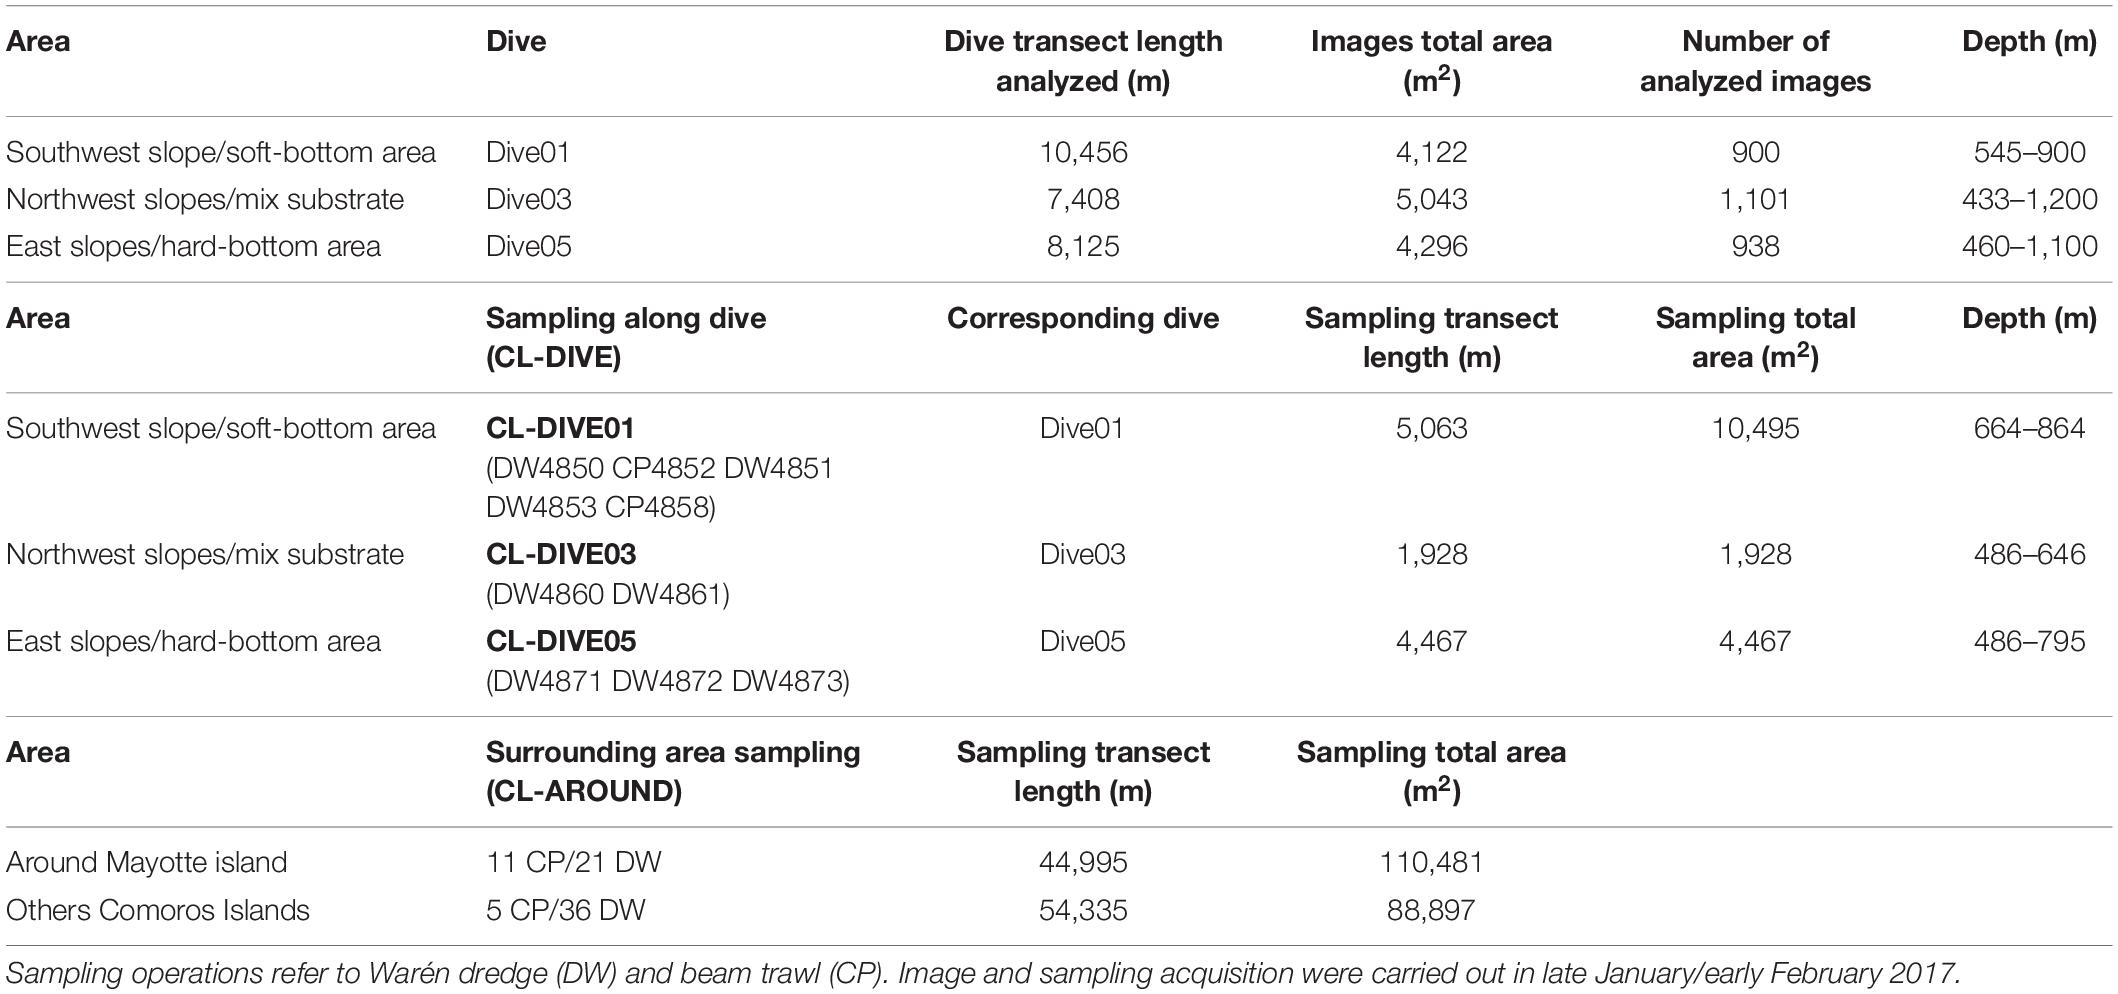
Table 2. Summary of image acquisition and physical sampling efforts with sites information for the dive, sampling along dive (cl-dive) and in the surrounding area (cl-around) along volcanic island slopes of Mayotte.
Physical Sampling Gears and Towed Camera
Physical sampling was carried out along 1–2 km transects using a Warén dredge of 1 m width with a fine 3–5 mm mesh size and a large and more robust 20–50 mm mesh size, deployed for hard substrate; and using a beam trawl of 4 m width, with a fine mesh (15–12 mm) deployed for soft sediment. On board, the sampling strategy aimed to maximize the number of taxa sampled. These two fishing gears have different selectivity for the different fauna components (for example, mobile and epibenthic fauna are generally better sampled with trawls than dredges). However, the topography does not always allow deploying both sampling gears.
Camera transects were carried out with a towed camera (SCAMPI, French Oceanographic Fleet), at 2.5–3 m above seafloor at 0.5 m/s. Images were acquired at 10 s intervals (PNG) and 30 s intervals (Mayotte) with an HD Camera (NIXON D700, focal length 18 mm, resolution 4,256 × 2,832 pixels) and geo-referenced using the ship positioning system processed with Adelie tools (French Oceanographic Fleet) developed at IFREMER and implemented using ArcGiS software V10.3.
The detection of organisms either from the observation in images or from capture by the fishing gears, reflects the respective efficiency of the cameras and the gears rather than the exact occurrence of the organisms at a given place. Indeed, some organisms may have been missed because the images are not overlapping. Similarly the probability of capture by the fishing gears may vary according to the topography and/or the nature of the substrate.
Taxonomic Processing
Specimen Identification
On board, all dredge and trawl catches were sorted at high taxonomic level and some taxa were photographed to record color patterns before being preserved in ethanol. Photographs were also obtained of preserved specimens stored in the MNHN collections2. These photos were used to build catalogs of taxa sampled in the area. Faunal samples were sent to an international network of taxonomists for processing and taxon identification. Taxon identification workshop sessions organized with taxonomists to study these collections stimulated discussions to determine the limits of identification from images for each taxonomic group.
Identifications From Images
A total of 7,674 images were analyzed and annotated (i.e., organism delineation in images and labeling of taxonomic ranks) using the web platform BIIGLE 2.0 (Benthic Image Indexing and Graphical Labelling Environment) (Langenkämper et al., 2017). BIIGLE 2.0 was chosen because it provides effective methods (1) allowing collaborative and interactive work with taxonomists who can actively contribute to the identification of organisms from images and (2) allowing easy comparisons and revisions of annotations with the LARGO tool. The platform allows the export of a database with observation records of each faunal annotation. We then summed up these observations to obtain an abundance matrix for each georeferenced image.
Megafaunal identification from images consisted of five steps divided into three main processes that involve different levels of expertise: non-expert annotation, objective identification and contextual identification, the last two performed in collaboration with taxonomists (Figure 3 and corresponding details on the working steps in Supplementary Material 1). Finally, identification keys adapted to images were produced for Decapoda, Asteroidea (Supplementary Materials 2, 3) and Echinoidea3.
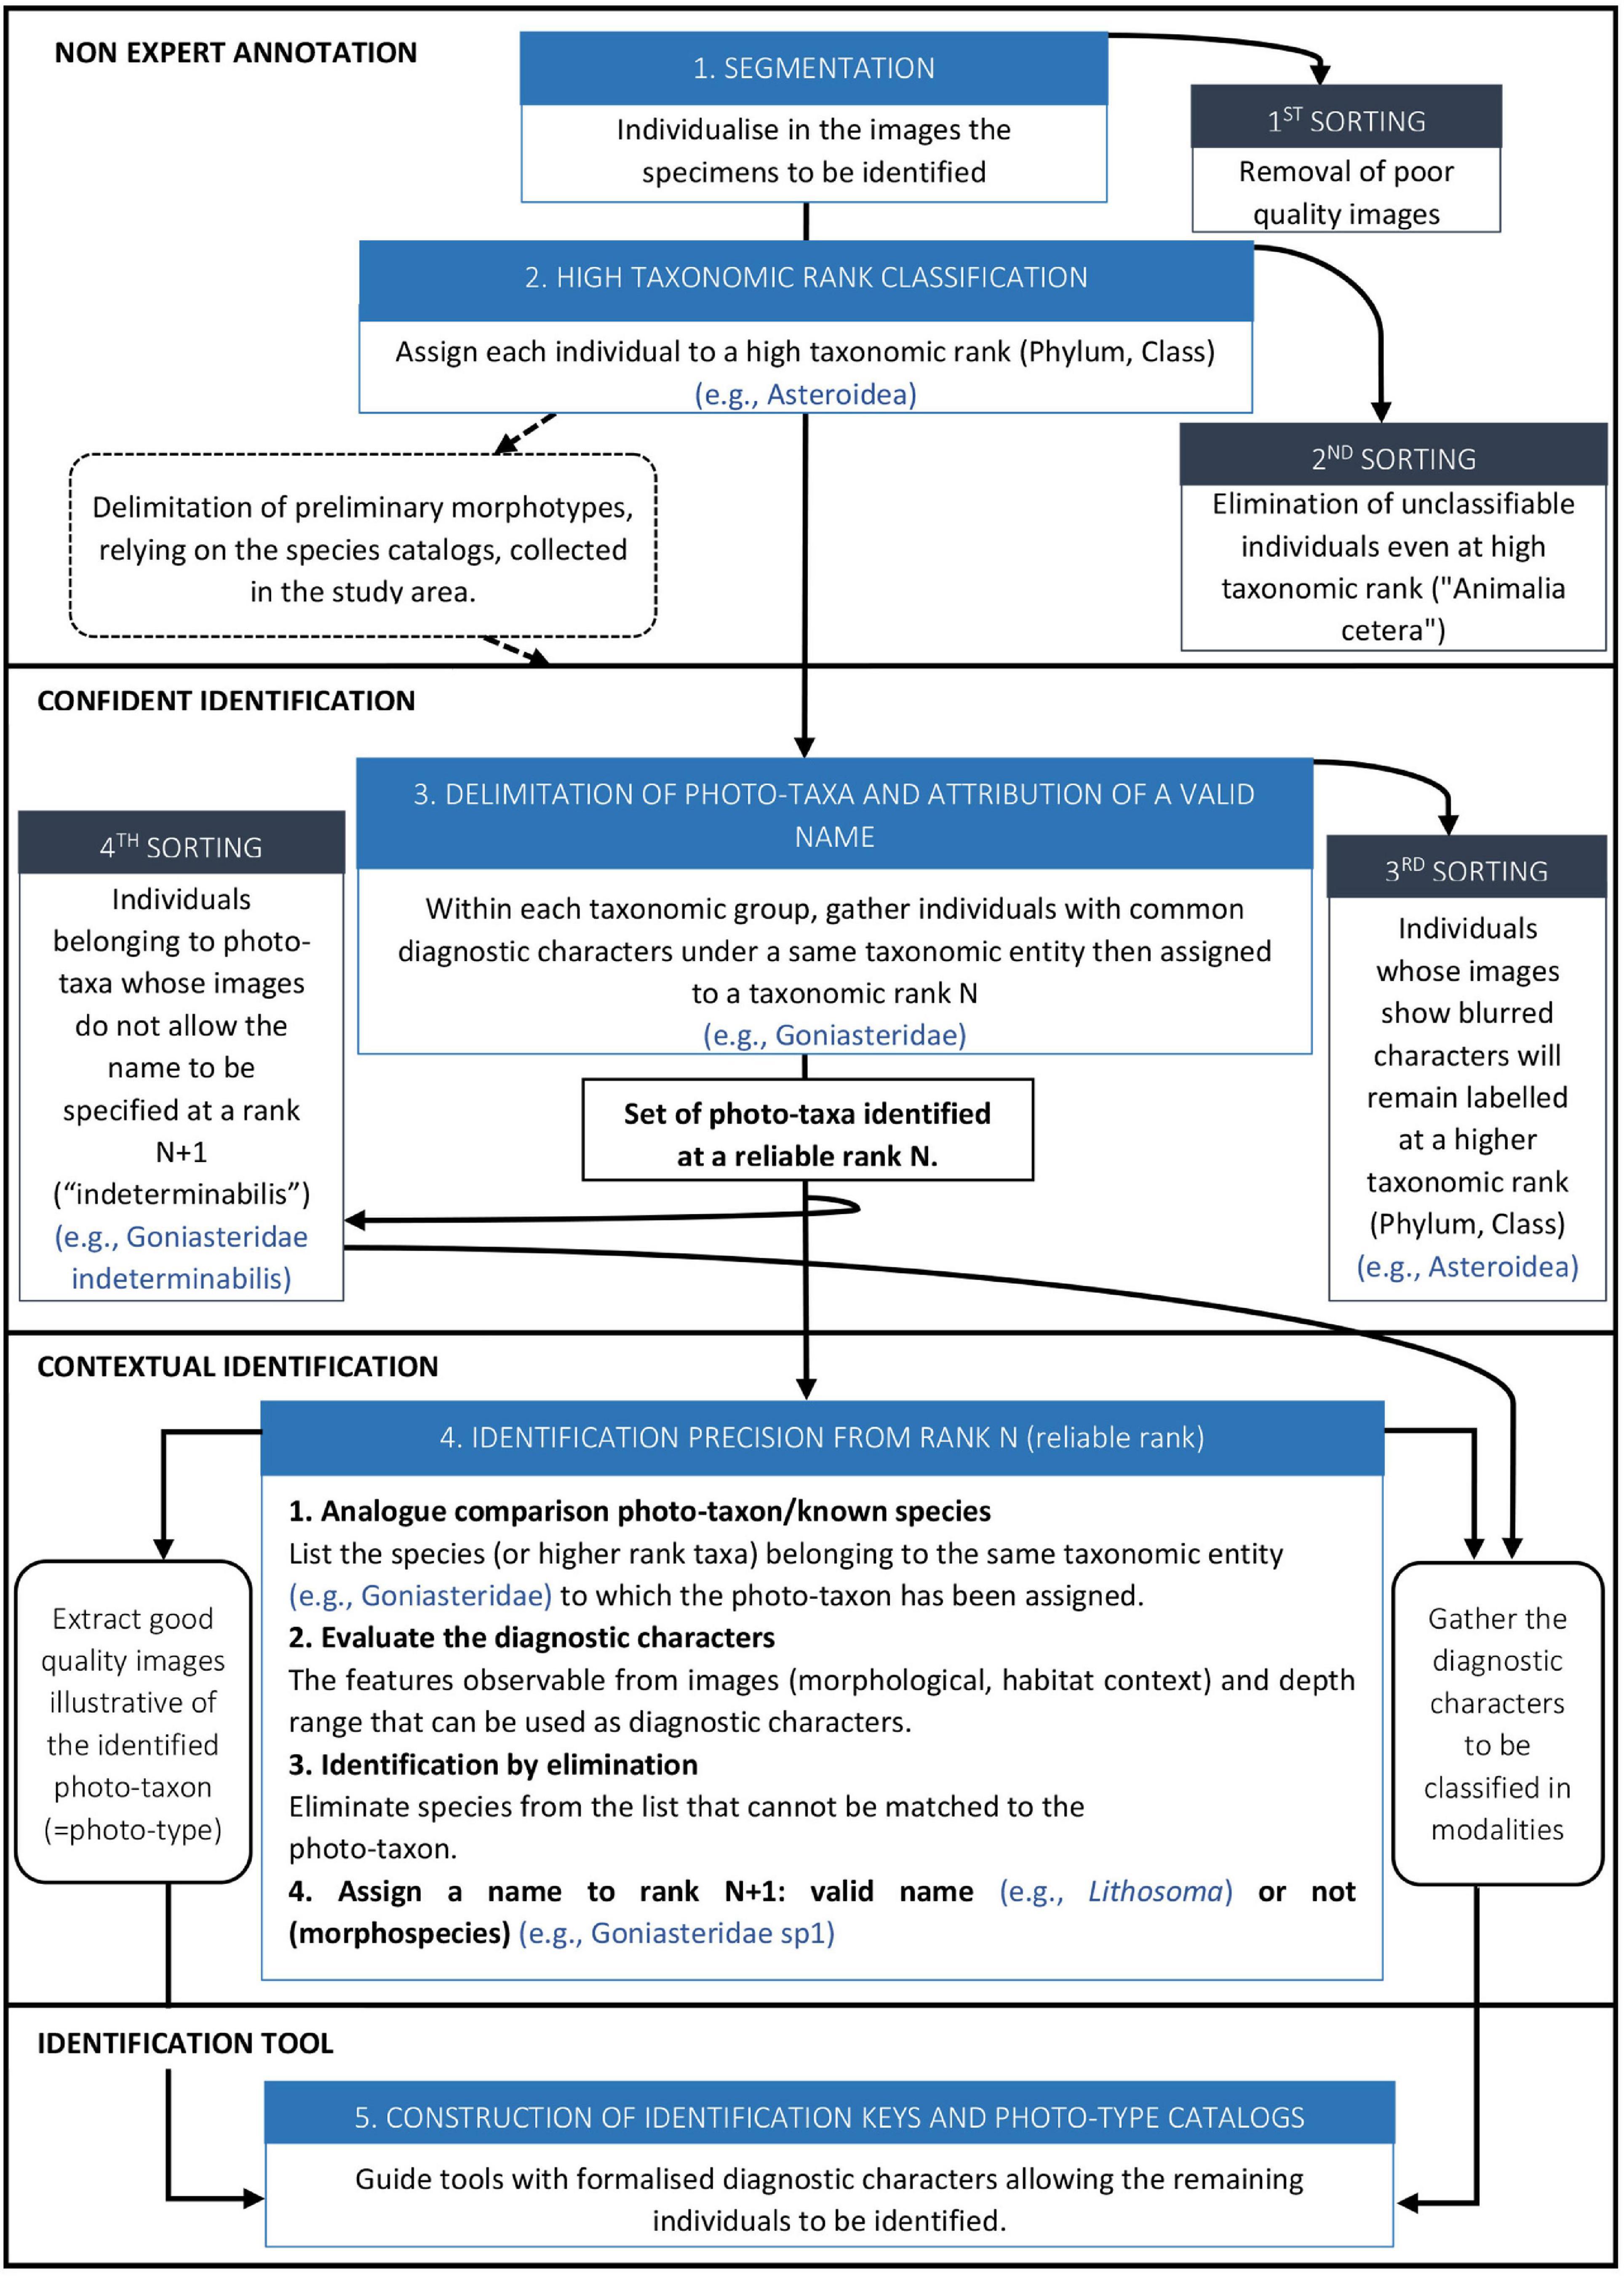
Figure 3. Flowchart of faunal identification steps from images. Five steps – from image annotation to construction of identification keys – divided into three main processes that involve different levels of expertise: non-expert annotation, confident identification and contextual identification.
Final Dataset Processing
After exporting the matrix of specimen observations from each georeferenced image of the BIIGLE platform, hierarchical taxonomic labels were homogenized between physical sample and image datasets according to the taxonomic hierarchy provided by the Worlds Register of Marine Species (WoRMS) database. Contrary to physical sampling, images can provide abundance data. Thus, to compare biodiversity patterns between images and physical samples along dives and in the surrounding area, we transformed the abundance data from image analysis into presence/absence data for each image. For easier naming convention, we will refer to the term Pisces for Osteichthyes/Chondrichthyes groups.
Diversity metrics were used: alpha diversity corresponding to the intra-transect diversity that was analyzed at the different levels of identification reached in the images, which were generally not the species level. Thus, for images, alpha diversity generally does not represent the species diversity and is represented by taxonomic richness. Beta diversity cannot be compared between images and physical samples because we could not assess this diversity from trawls or dredges (data integrated across the whole transect). For the sedimented slopes area, the regional scale (“gamma” diversity) corresponds to the pooling of the four dives and the four co-located trawl transects, respectively, of Astrolabe Bay and the Sepik area. For the Mayotte slopes area, the “gamma” diversity corresponds to the pooling of the three dives and the 10 co-located dredge/trawl transects, respectively.
Statistical Analyses
All analyses were performed using the R environment (V3.6.3) (R Core Team, 2020). Taxonomic richness comparison between camera transects and co-located sampling was assessed at different taxonomic levels using sample-based rarefaction curves with 999 random permutations on presence/absence data using the vegan package (speceaccum function) (Oksanen et al., 2019).
Differences in assemblage composition between camera transects and co-located sampling were assessed using principal component analysis (PCA) on Hellinger-transformed presence/absence data with the ade4 package (dudi.pca function) (Dray and Dufour, 2007). This transformation allows the species presence/absence dataset to be represented in a Euclidean space (Legendre and Gallagher, 2001). For crustaceans, PCA and Venn analyses were performed at the genus rank only, to consider comparative taxonomic names between image and sampling datasets (i.e., at a specific rank of comparison, morphospecies names in the image dataset do not match the species name in the sampling dataset).
Similarities and dissimilarities in taxonomic composition between images and physical samples and according to the image acquisition and physical sampling efforts (camera transects, co-located dredge/trawl transects and surrounding area transects) were represented in Venn diagram using the gplots package (venn function) (Warnes et al., 2020).
Results
Biodiversity Pattern Compared Between Images and Physical Samples
Taxonomic Levels and Community Composition
For sedimented slopes we were able to reach an identification level above class for both images and physical samples mainly for Pisces (Chordata) and Crustacea (Arthropoda). The taxonomic ranks we reached ranged from order to family for fishes, and from genus to species/morphospecies for crustaceans (Table 3A). These two taxonomic groups were also well represented both in the images and physical samples along volcanic island slopes, at the same taxonomic ranks respectively (Table 3B). The high proportion of Annelida (93%) and Mollusca (49%) we identified to the family level in the images of the Sepik cold-seep area reflect respectively the dominance of Siboglinidae and Bathymodiolinae. Along the volcanic island slopes, the proportion of mollusks we identified to the class level (97%) reflects the dominance of Gastropoda, abundantly observed in images. However, the small individual size did not allow us to identify them beyond the rank of class from images, whereas we identified the collected specimens to the genus rank (27%). Animalia cetera identifications, fauna observed in images that were unclassifiable into phyla, represent 17% (1669 ind.) of the total fauna in the PNG area and 5% (783 ind.) in Mayotte.
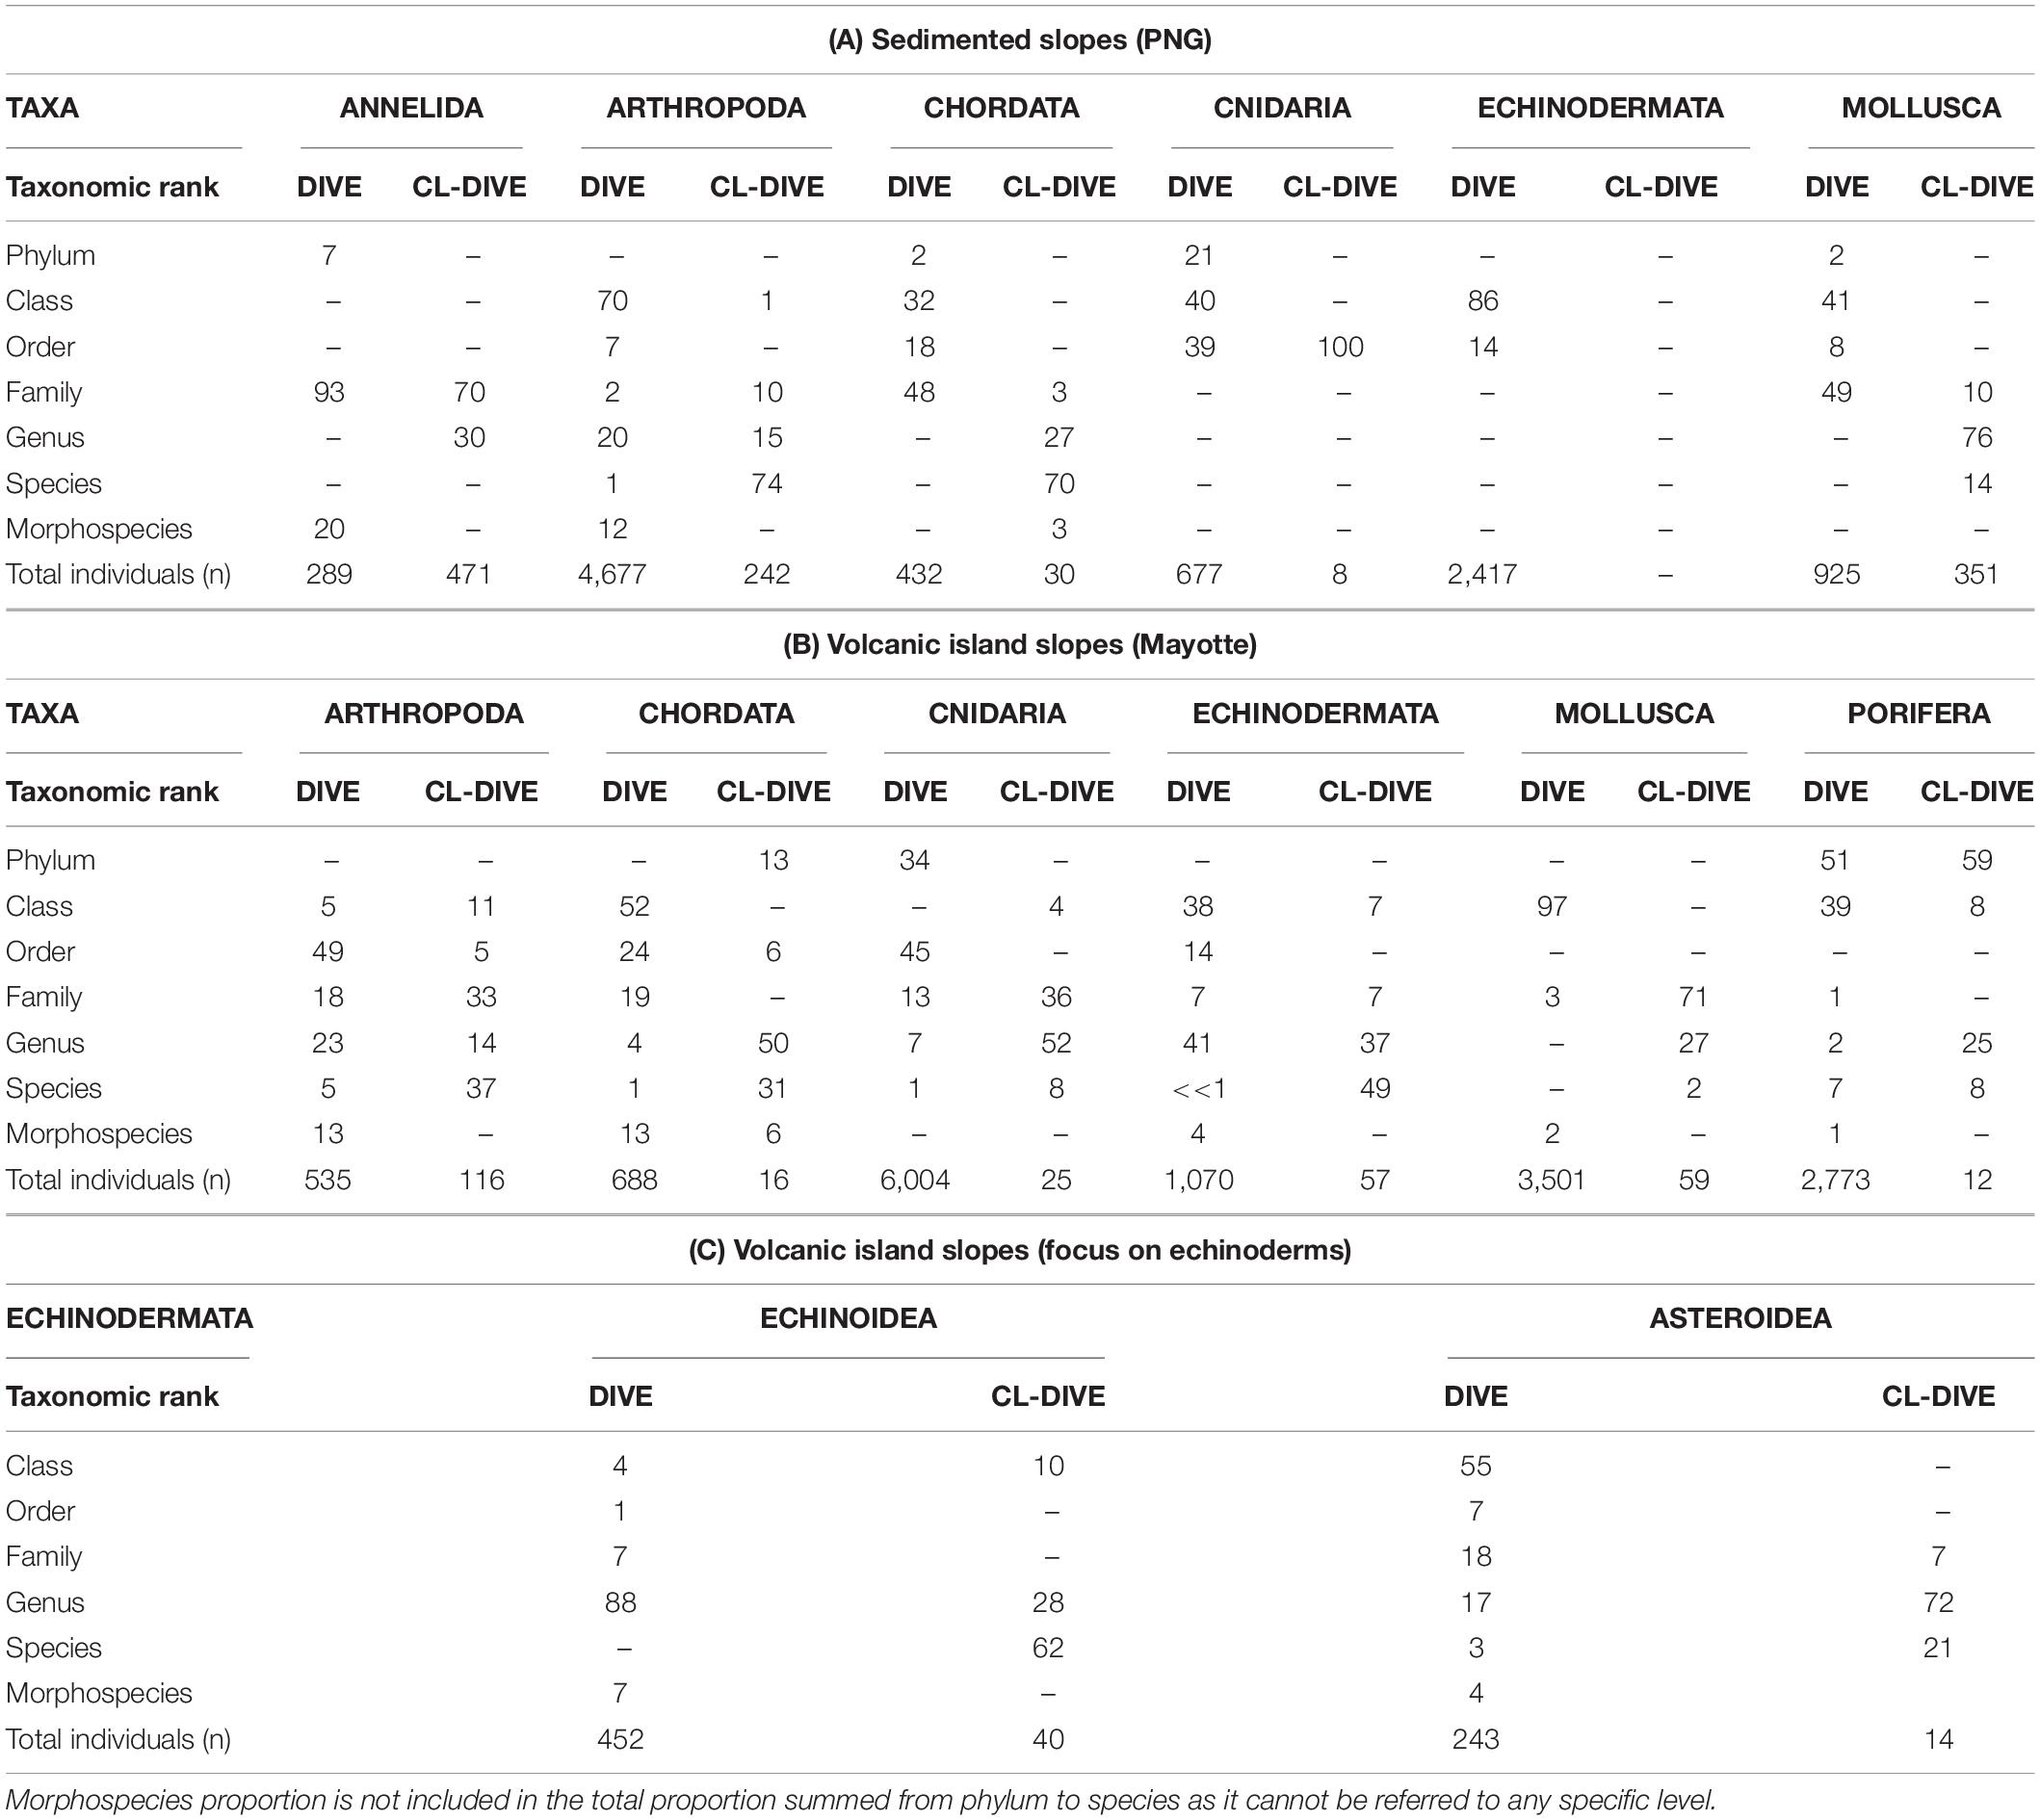
Table 3. Percentages of individuals identified by taxonomic rank and by method (images = dive, sampling along dive = cl-dive), (A) along sedimented slopes (PNG) and (B) along volcanic island slopes dominated by hard bottom (Mayotte) with (C) a focus on echinoids and asteroids.
On the sedimented slopes, we abundantly observed cnidarians (mainly composed of actinids, cerianthids and pennatulids) in images; however, our identifications remained limited to the class level (40%) and never exceeded the order (39%). In the physical samples, we collected few cnidarian individuals, mainly identified as pennatulids. In the time of this study we were only able to identify them to the order (Table 3A).
Along the volcanic island slopes, we observed many cnidarians and poriferans in images. However, we reached identification only to high taxonomic ranks (i.e., phylum and class for Porifera and order for Cnidaria). The diversity of these two groups was thus underestimated. For individuals sampled using dredges or trawls the specialists involved in the study generally identified them to the genus rank. Consequently, compared with images, diversity appeared higher for physical captures (Table 3B). For these taxonomic groups, the morphological characters required for identification are mainly microscopic and therefore cannot be observed from images.
We observed few asteroids along the sedimented slopes habitat, and the total of 2,417 observed Echinodermata individuals reflected the dominance of only one morphotype of semi-burying spatangoid echinoid, considering most of them were visible (Table 3A). Along the volcanic island slopes, we identified a higher number of echinoderm taxa either from specimens observed in images or from specimens collected by the sampling gears. For asteroids and echinoids identification from images, we reached the genus rank for most individuals (Table 3C).
For comparing the level of diversity estimated from images and from physical samples, in sedimented slopes and volcanic island slopes datasets, we selected the order and family ranks for fishes, and the genus and species/morphospecies ranks for crustaceans. We made the comparisons at the genus rank in hard-bottom environments for asteroids and echinoids, because we generally reached these levels of identification both for specimens observed in images and for specimens collected by the sampling gears. The inventory for each targeted taxon and taxonomic level, in the images and physical samples, are listed in Supplementary Material 4 and raw databases used for analyses are available in Supplementary Materials 5 (PNG) and 6 (Mayotte). For each percentage of individuals in Table 3, the corresponding number of taxa identified at each taxonomic rank are available in Supplementary Material 7.
Pisces
We evaluated the richness of Pisces orders in the sedimented slopes habitats of PNG, as two-fold higher in images than in physical samples while we estimated it as equivalent at the family level (Figure 4A). Conversely, for the canyon site (Dive13), we estimated that the richness of orders and families was lower from images than from physical samples.
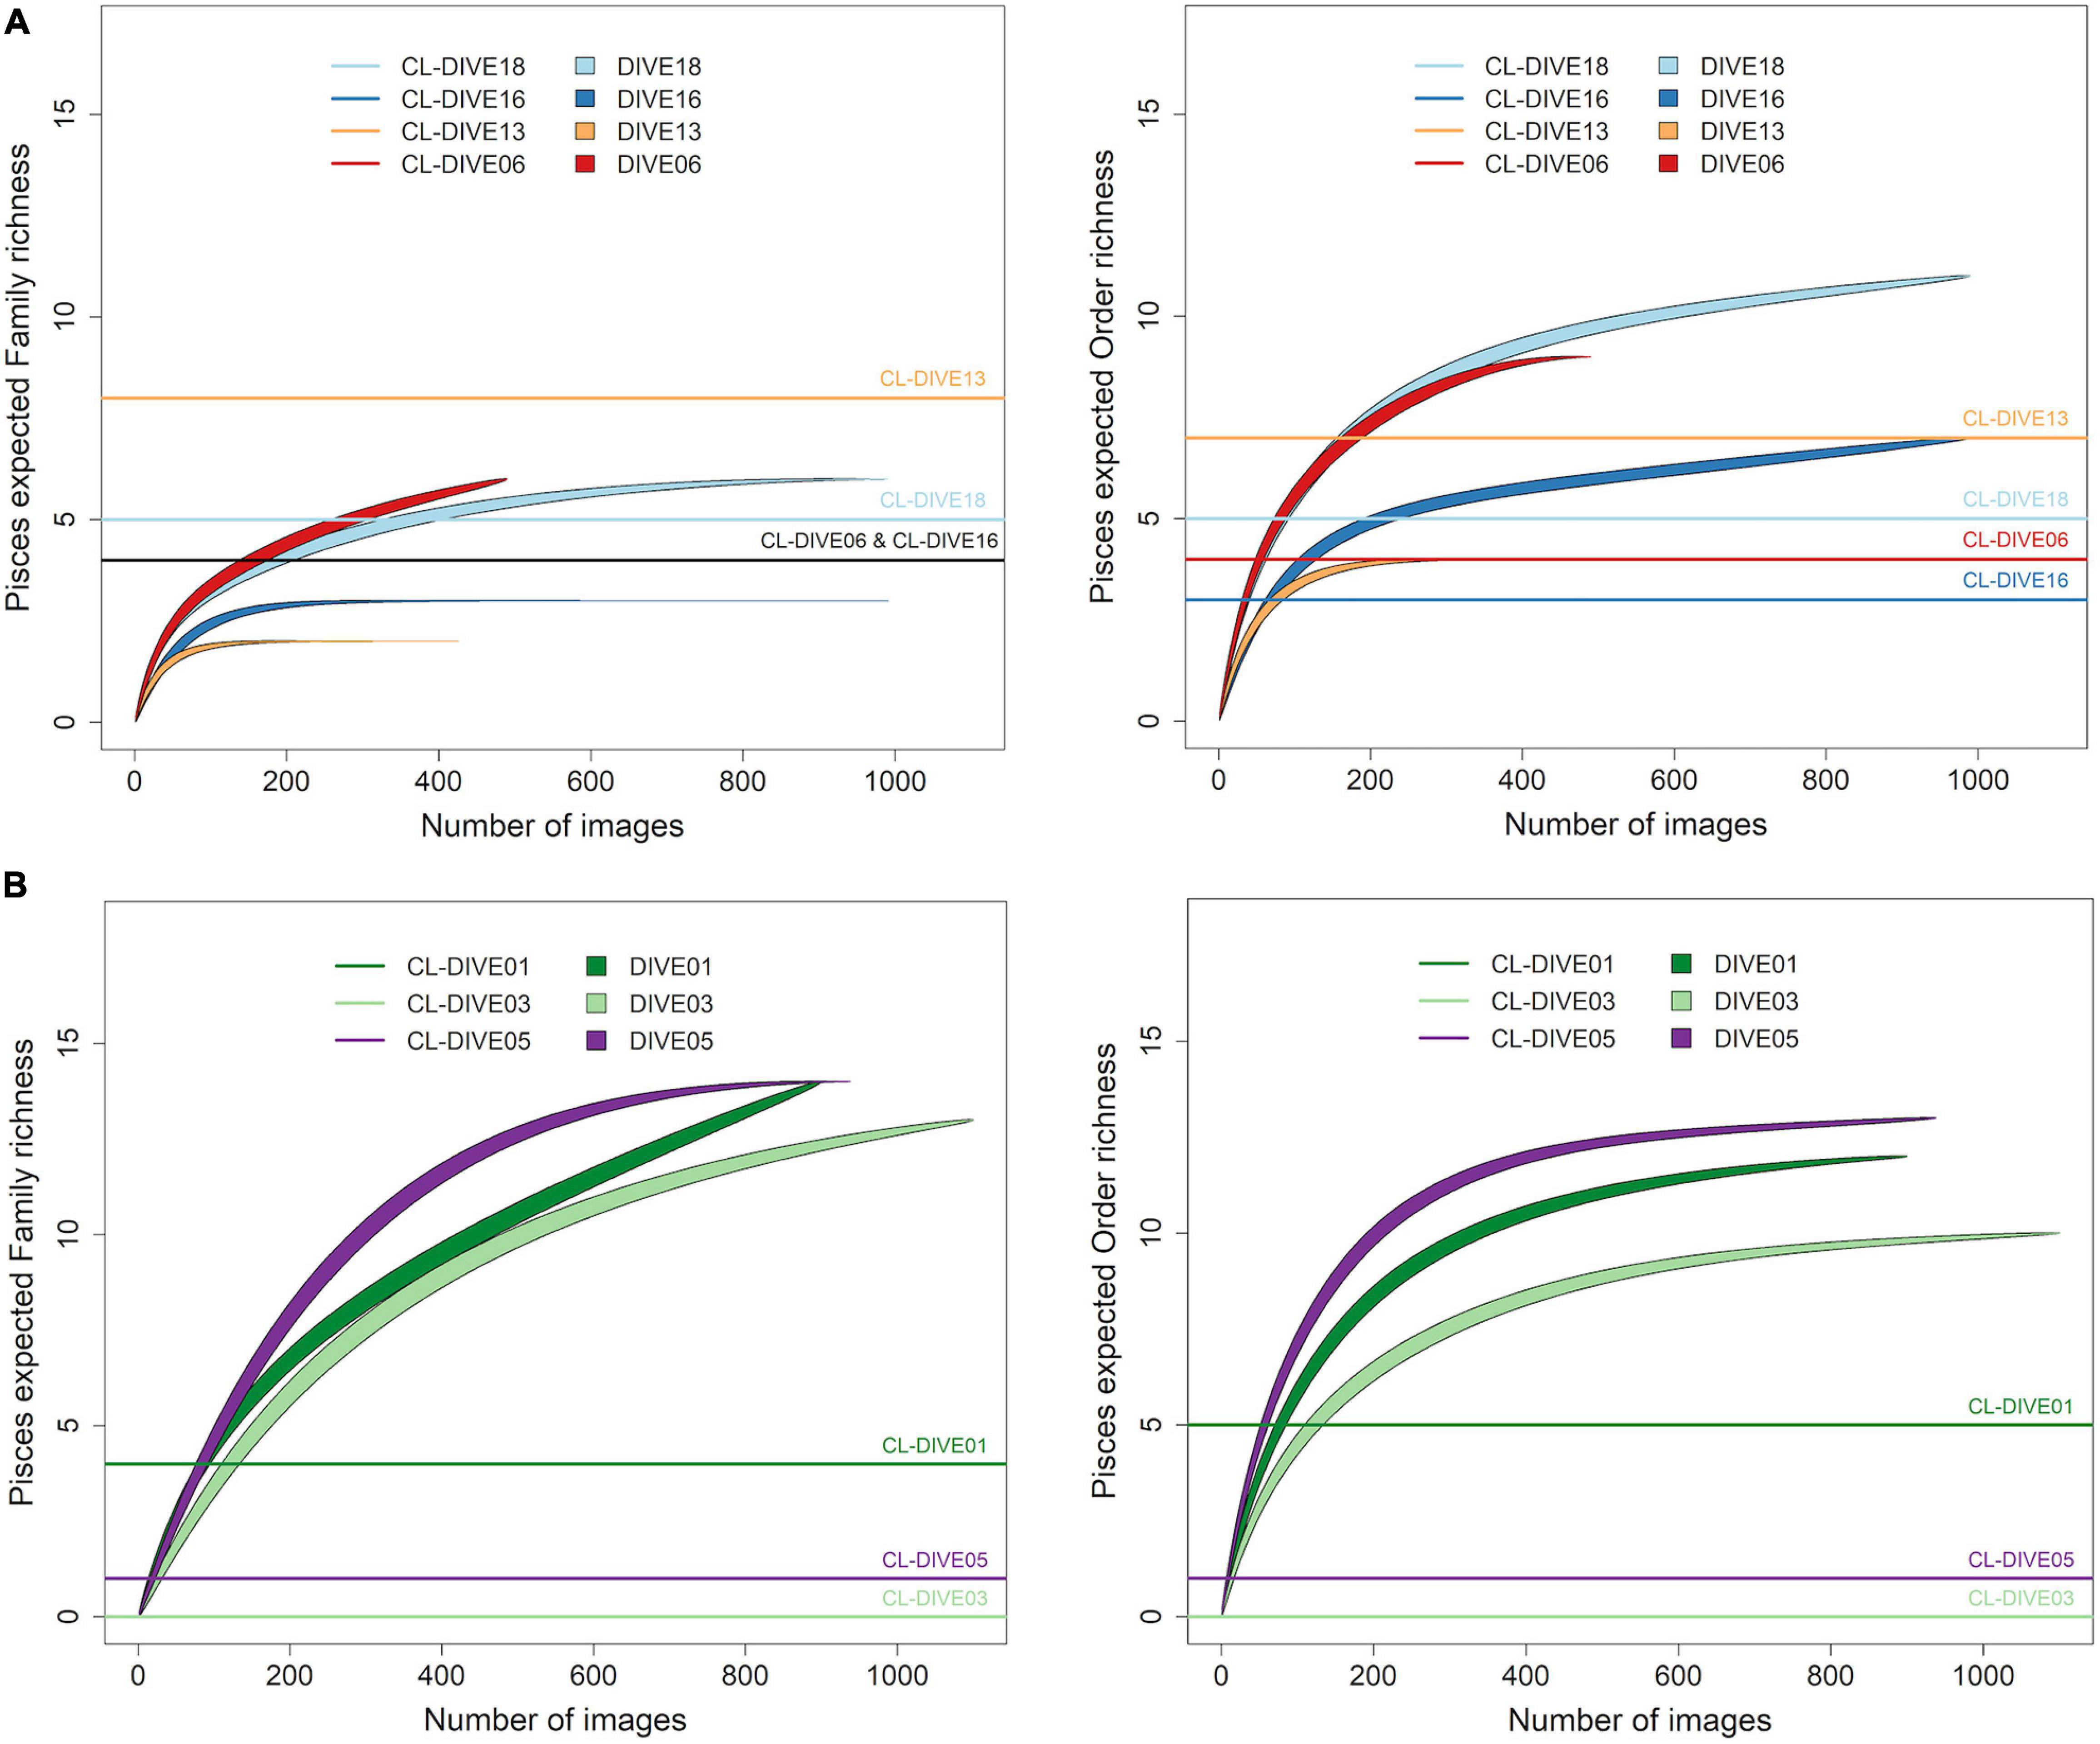
Figure 4. Expected richness from rarefaction curves for Pisces at order and family ranks (exact method, n = 999 permutations), along (A) sedimented slope habitats (PNG) and (B) volcanic island slopes (Mayotte). Comparison between imagery (dive) and sampling along dive (cl-dive).
In volcanic island habitats of Mayotte, we estimated the Pisces order richness at least two-fold higher in images than in physical samples for both families and orders levels (Figure 4B).
In the sedimented slopes habitats, we found the compositions of fish families in the physical samples and in the images similar for two sites (Dive06, Dive16), but unalike for the two others (Figure 5A), with some families only sampled by trawls within the canyon and sedimented slope sites (Cl-dive13, Cl-dive18).
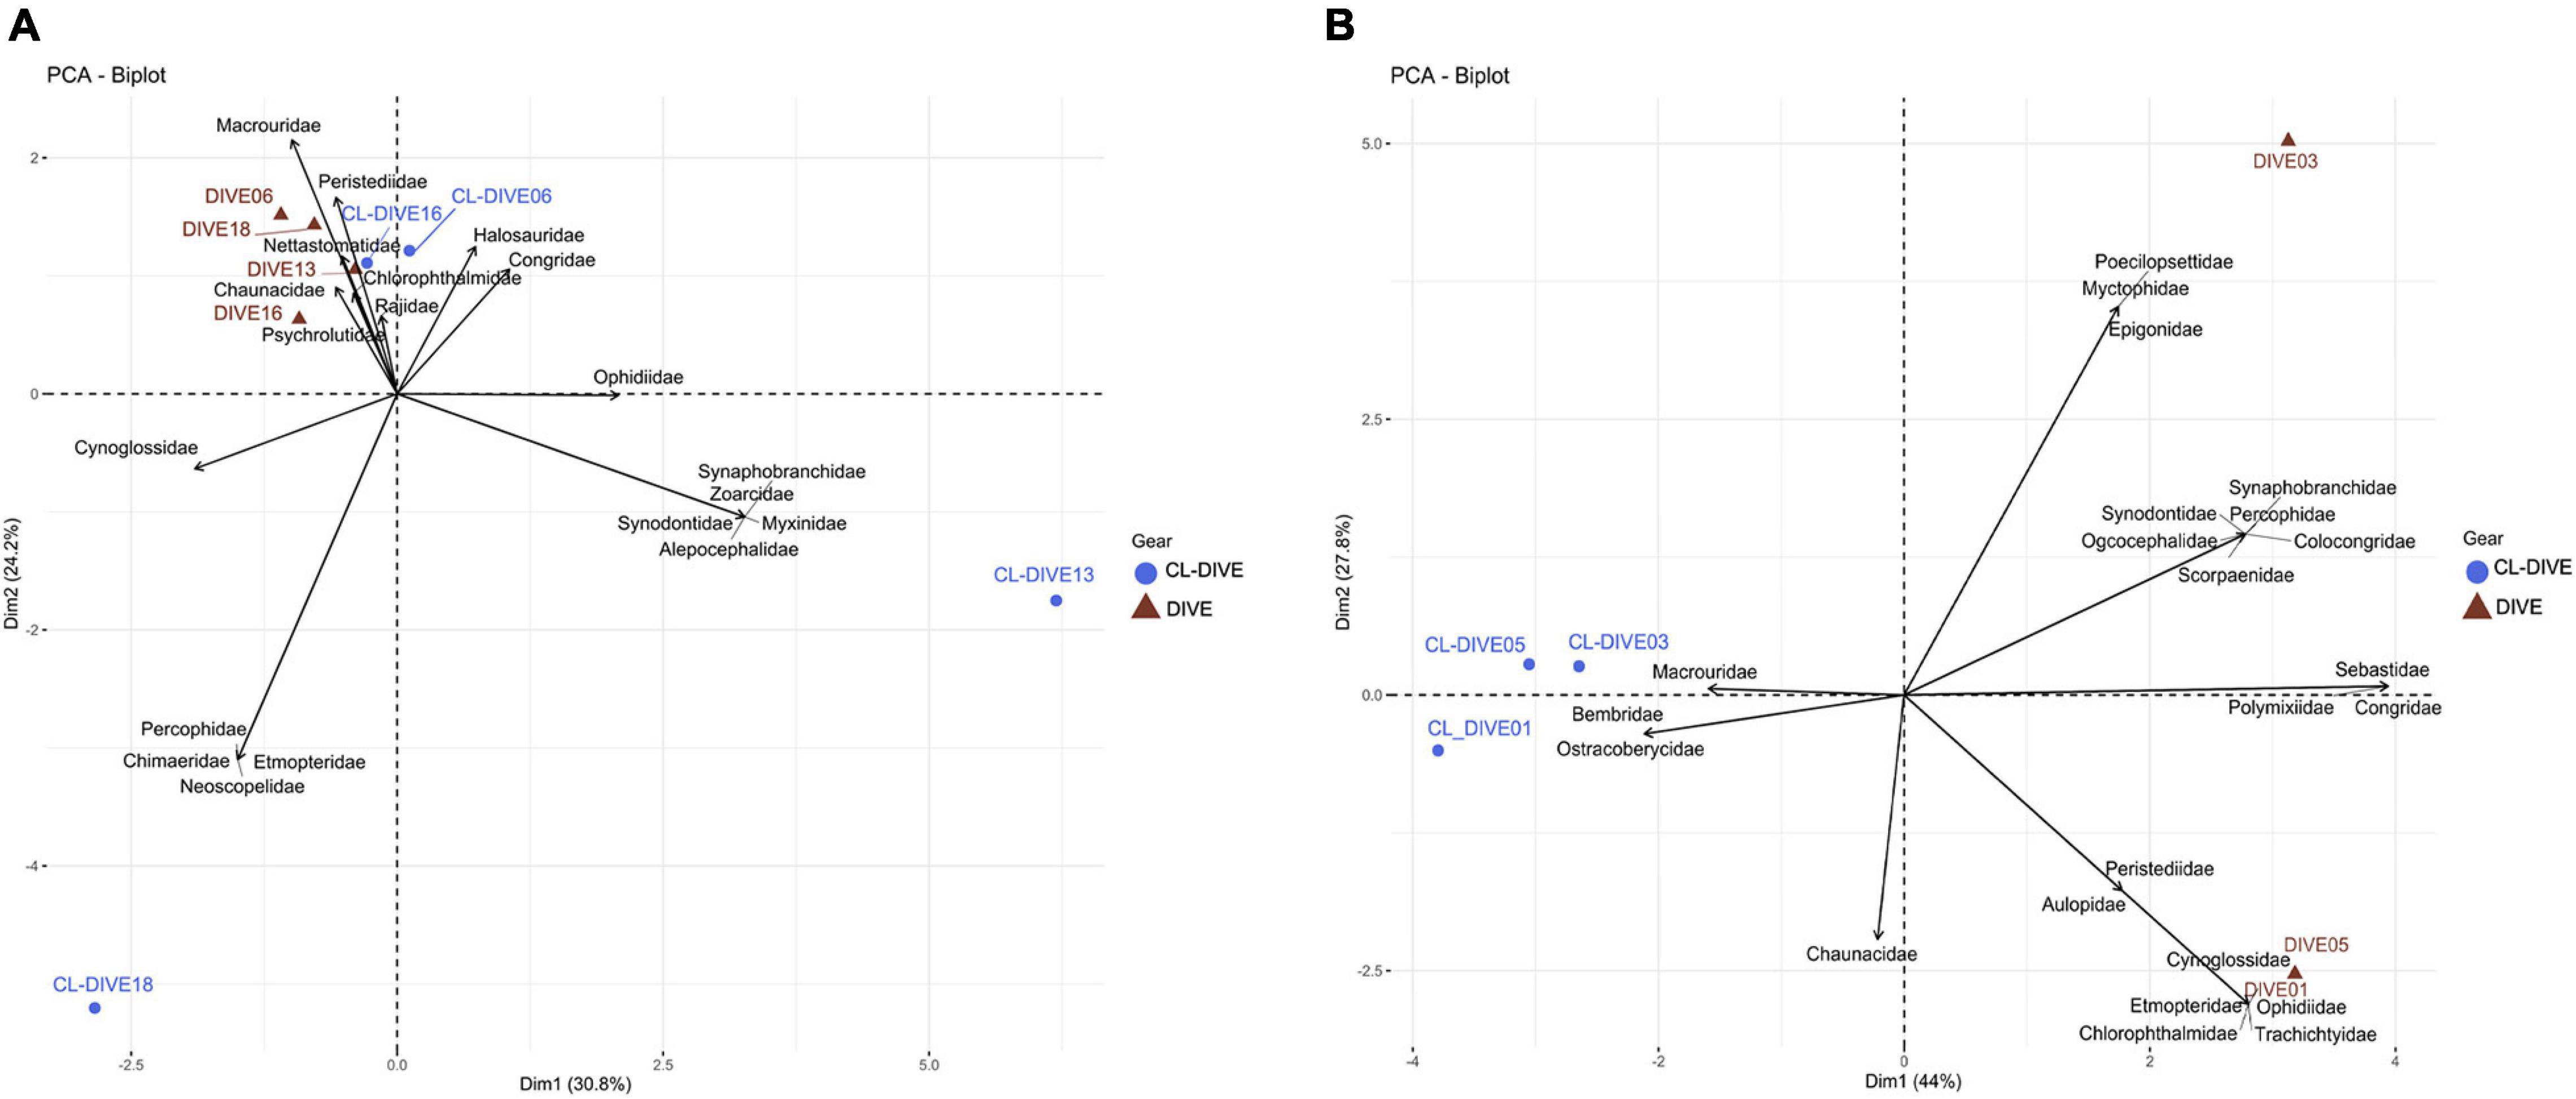
Figure 5. Comparison of fish assemblages between imagery (dive) and sampling along dive (cl-dive) along (A) sedimented slope habitats (PNG) (55% of variance on first two PCs) and (B) volcanic island slopes (Mayotte) (71.8% of variance on first two PCs). Principal Component Analysis (PCA) of Hellinger-transformed presence/absence fish data at family rank.
On the contrary, in volcanic island areas, the dredges and trawls sampled a few families not, or poorly observed in images (Macrouridae) (Figure 5B). In the case of Bembridae and Ostracoberycidae (Perciformes), identification of specimens observed in images was possible only to the order level. However, images allowed us to observe many families that were not sampled by the fishing gears.
In sedimented slopes habitats, by pooling the four camera transects (dives) and the four trawl transects (cl-dives) respectively, we confirmed that the estimated diversity of fish families was higher from physical sampling than from observation in images (Figure 6A). Moreover, taking into account the surrounding area samples (cl-around) we considerably increased the family richness, and also added a few orders. These samples helped us to identify one additional order and two families from the images, which were not collected in the co-located samples. Inversely, on volcanic island slopes, the family diversity and the order diversity, estimated from the observations in images pooled from the camera transects was higher than from the pool of specimens from the trawl transects (Figure 6B). The benefit of the surrounding area samples for taxon identification using images was more pronounced on volcanic island slopes, with 13 additional families and 6 additional orders identified from images (Figure 6B).
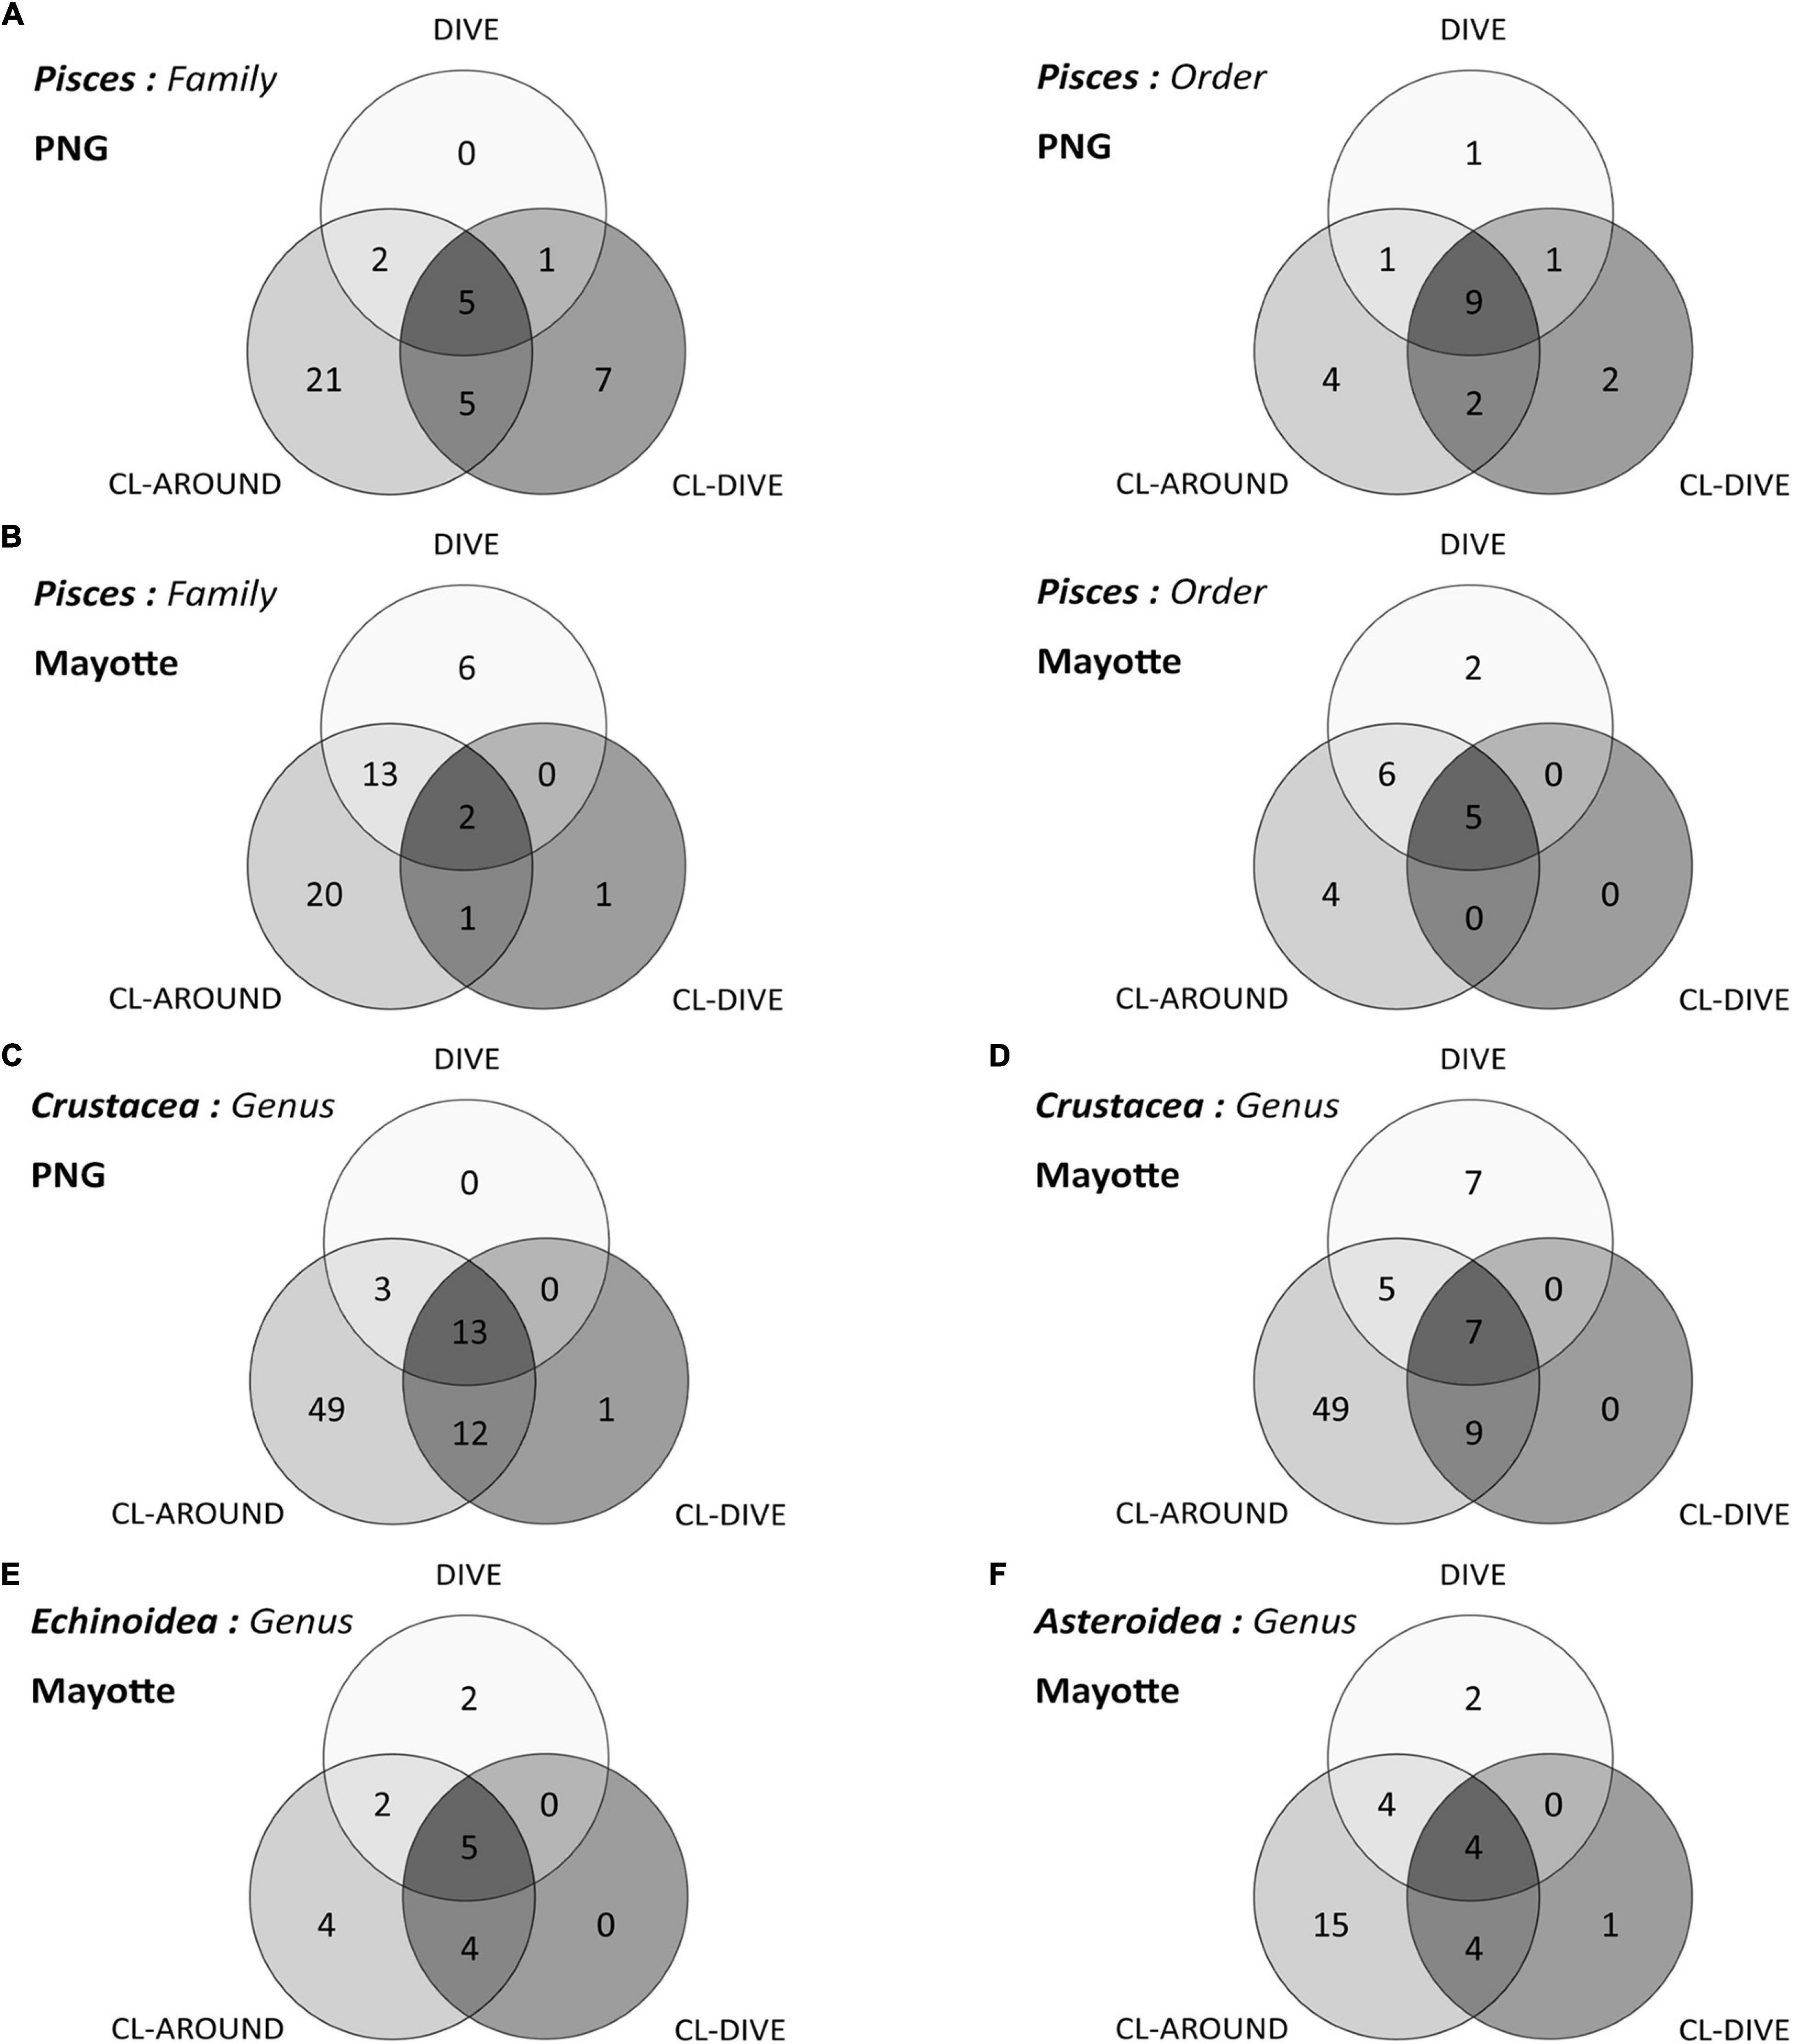
Figure 6. Venn diagrams of taxonomic richness captured and identified from images (dive), sampling along dive (cl-dive) and in the surrounding area (cl-around): (A) Pisces at order and family ranks along sedimented slope habitats (PNG) and (B) along volcanic island slopes (Mayotte); (C) Crustacea at genus rank in PNG and (D) in Mayotte; (E) Echinoidea at genus rank in Mayotte; (F) Asteroidea at genus rank in Mayotte. In each circle the sum of numbers represents a taxonomic rank captured (e.g., number of order or family, etc.).
Crustacea
In the sedimented slopes habitats of PNG, we estimated the genus richness of crustaceans higher in physical sampling than in images (Dive18, Dive13) or equivalent (Dive06, Dive16). At the species level (including morphospecies), we estimated the same richness patterns except for two sites (Dive18, Dive06), where we estimated the richness higher from images than sampling (Figure 7A). In volcanic island habitats of Mayotte, we estimated the genus richness as higher in the physical sampling than in the images and the species richness as equivalent, in the soft-bottom-dominated site (Dive01). Inversely, in the two hard-bottom-dominated sites (Dive03, dive05) and at both taxonomic levels, we estimated the richness higher from images (Figure 7B).
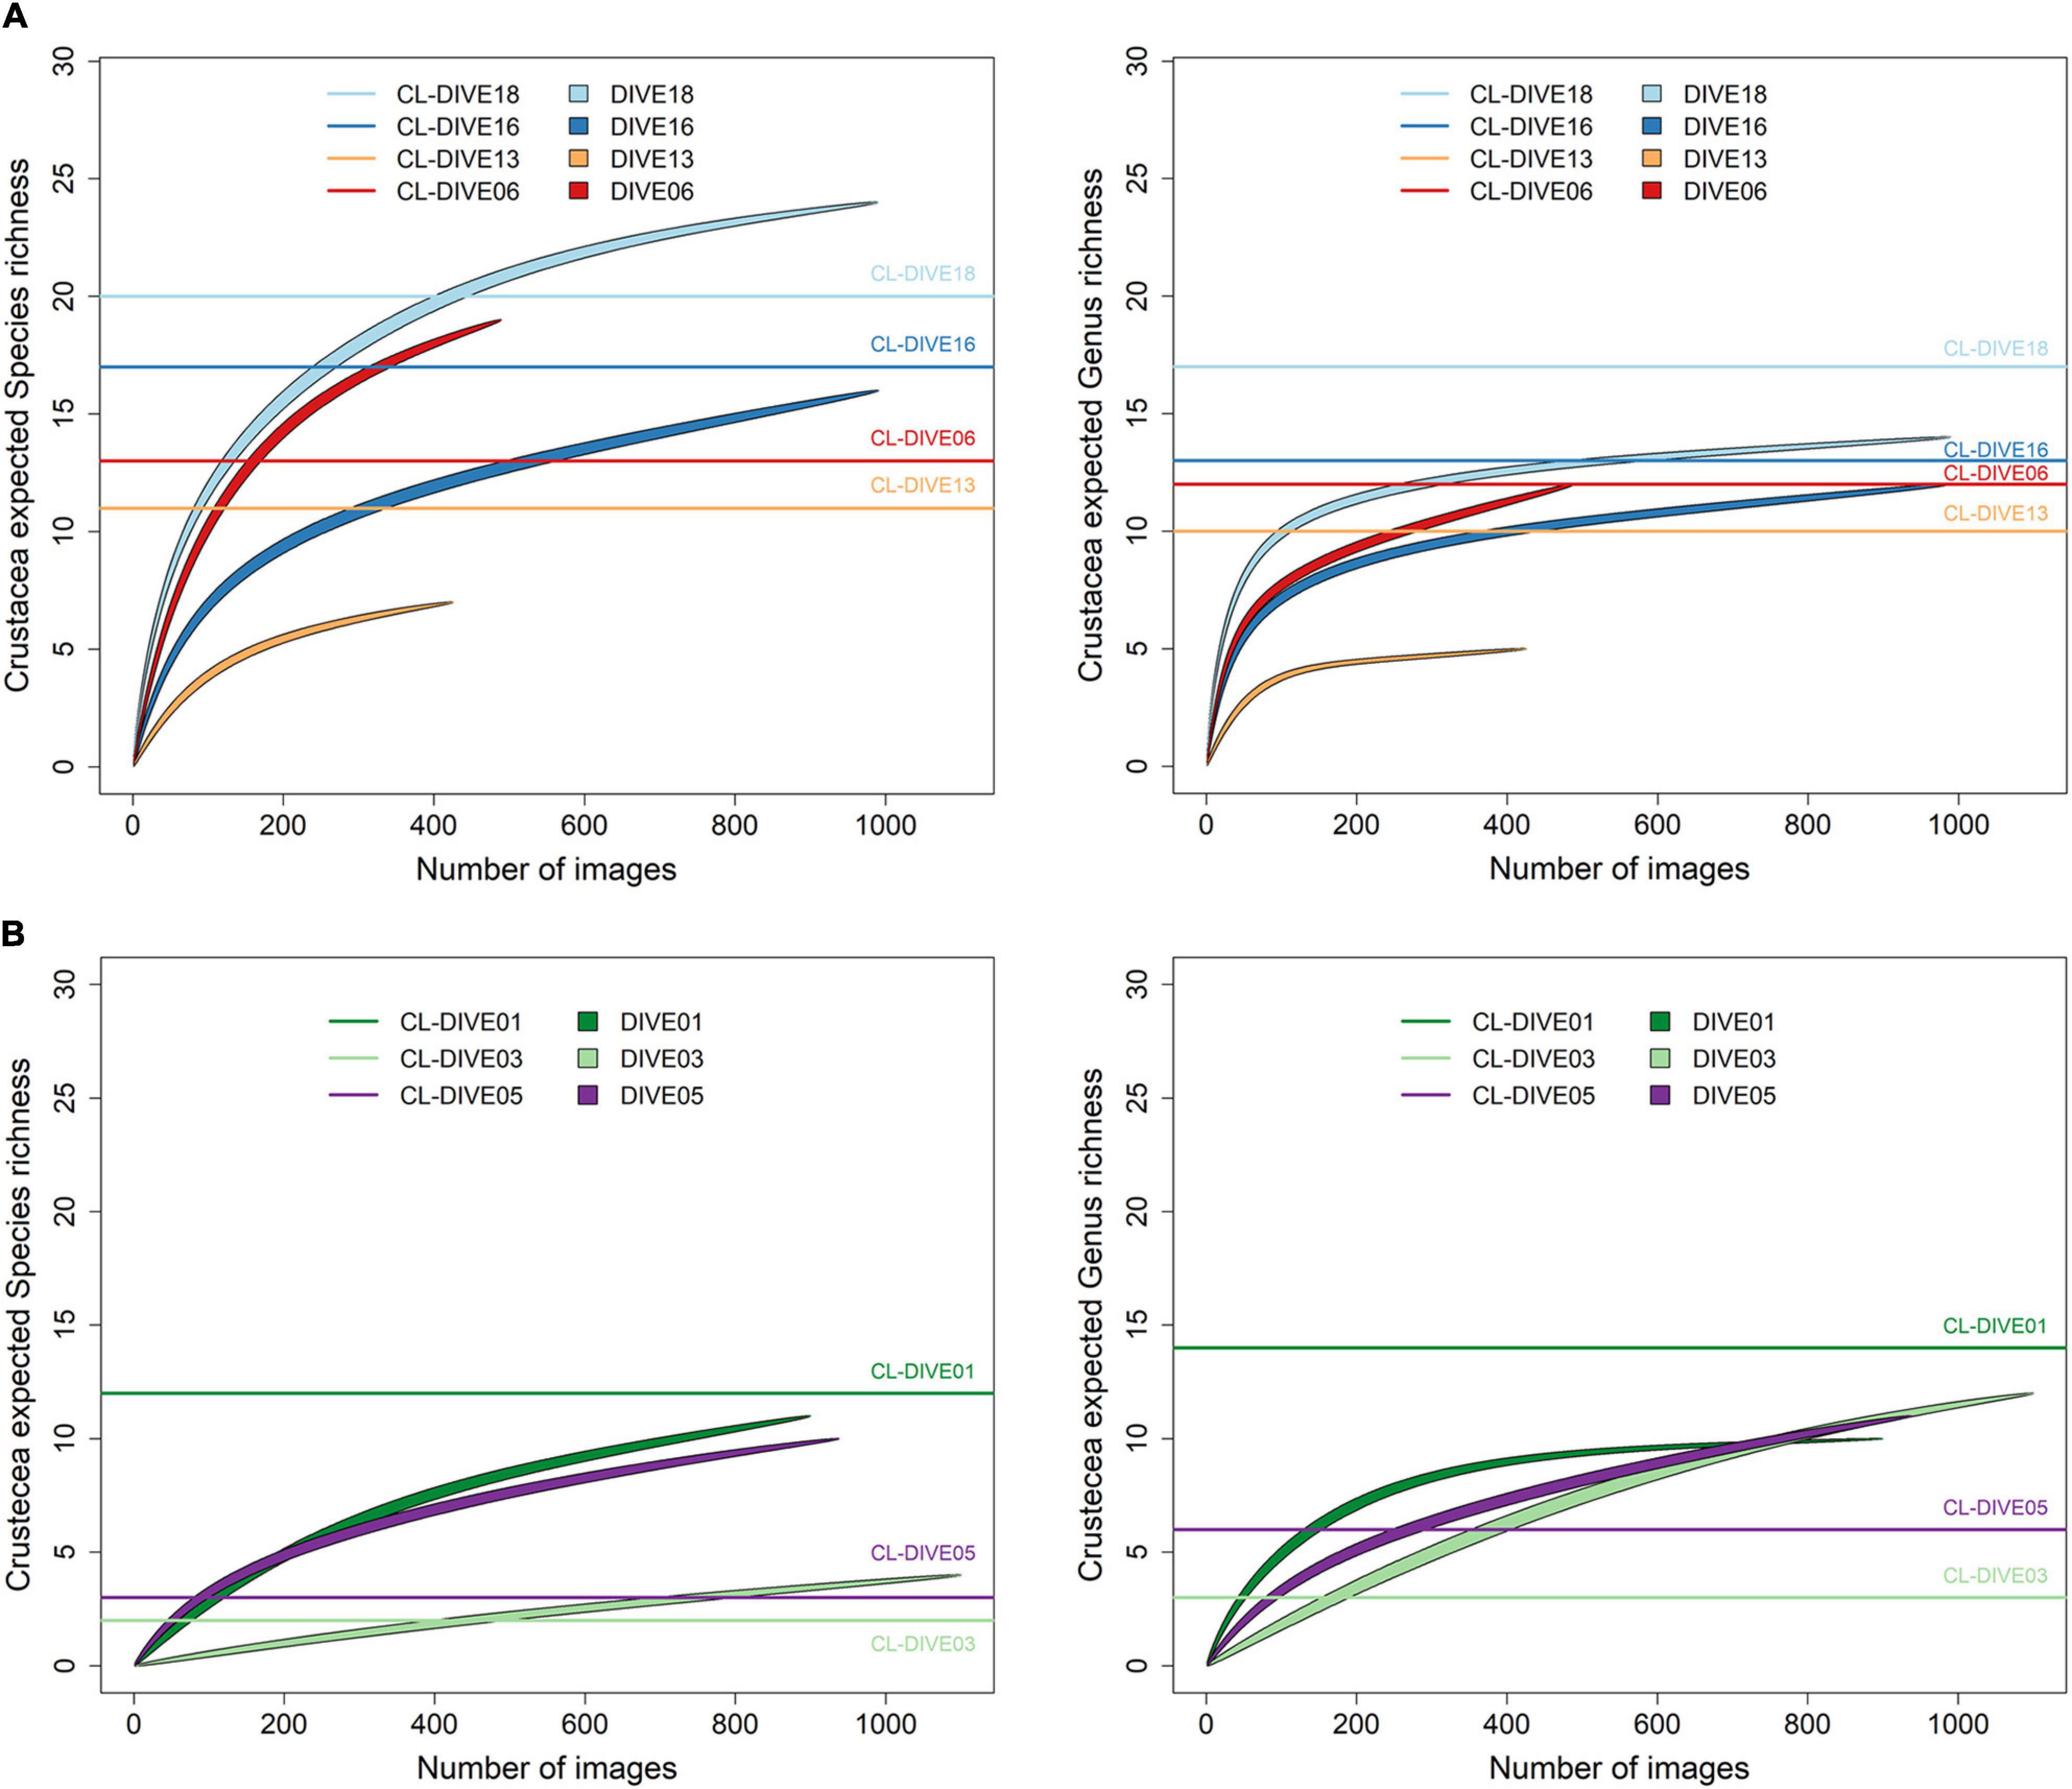
Figure 7. Expected richness from rarefaction curves on Crustacea at genus and species ranks (exact method, n = 999 permutations), along (A) sedimented slope habitats (PNG) and (B) volcanic island slopes (Mayotte). Comparison between imagery (dive) and sampling along dive (cl-dive).
Small-sized and endogenous crustacean genera were captured more easily with trawls than observed in images (e.g., Ethusa, Lepas, Bathycheles, Stereomastis) along the sedimented slopes of PNG (Figure 8A). Inversely, we repeatedly observed four genera in images that were poorly sampled with trawls (e.g., Xylocheles, Haliporoides, Agononida, Galacantha) (Figure 8A). We observed common genera in images (Nematocarcinus, Glyphocrangon, Haliporoides, Hymenopenaeus), whereas we identified a higher diversity of genera from trawl samples. Selectivity appeared more pronounced between the camera and trawl transects along the volcanic island slopes of Mayotte (Figure 8B). We identified galatheids of small-size or associated with biogenic habitat and woods exclusively from specimens captured by trawls (Uroptychus, Munidopsis, Paramunida), whereas we identified large-sized crabs (Brachyura) exclusively from observation of the images from the Dive03 (e.g., Beuroisia, Cyrtomaia, Gornodopsis). The images allowed us to identify more genera while dredge/trawl transects showed more similar genus compositions (Figure 8B). Therefore, we estimated a higher gamma diversity of crustacean genera from physical samples than from observation in images on sedimented slopes habitats, and conversely in hard-bottom habitats.
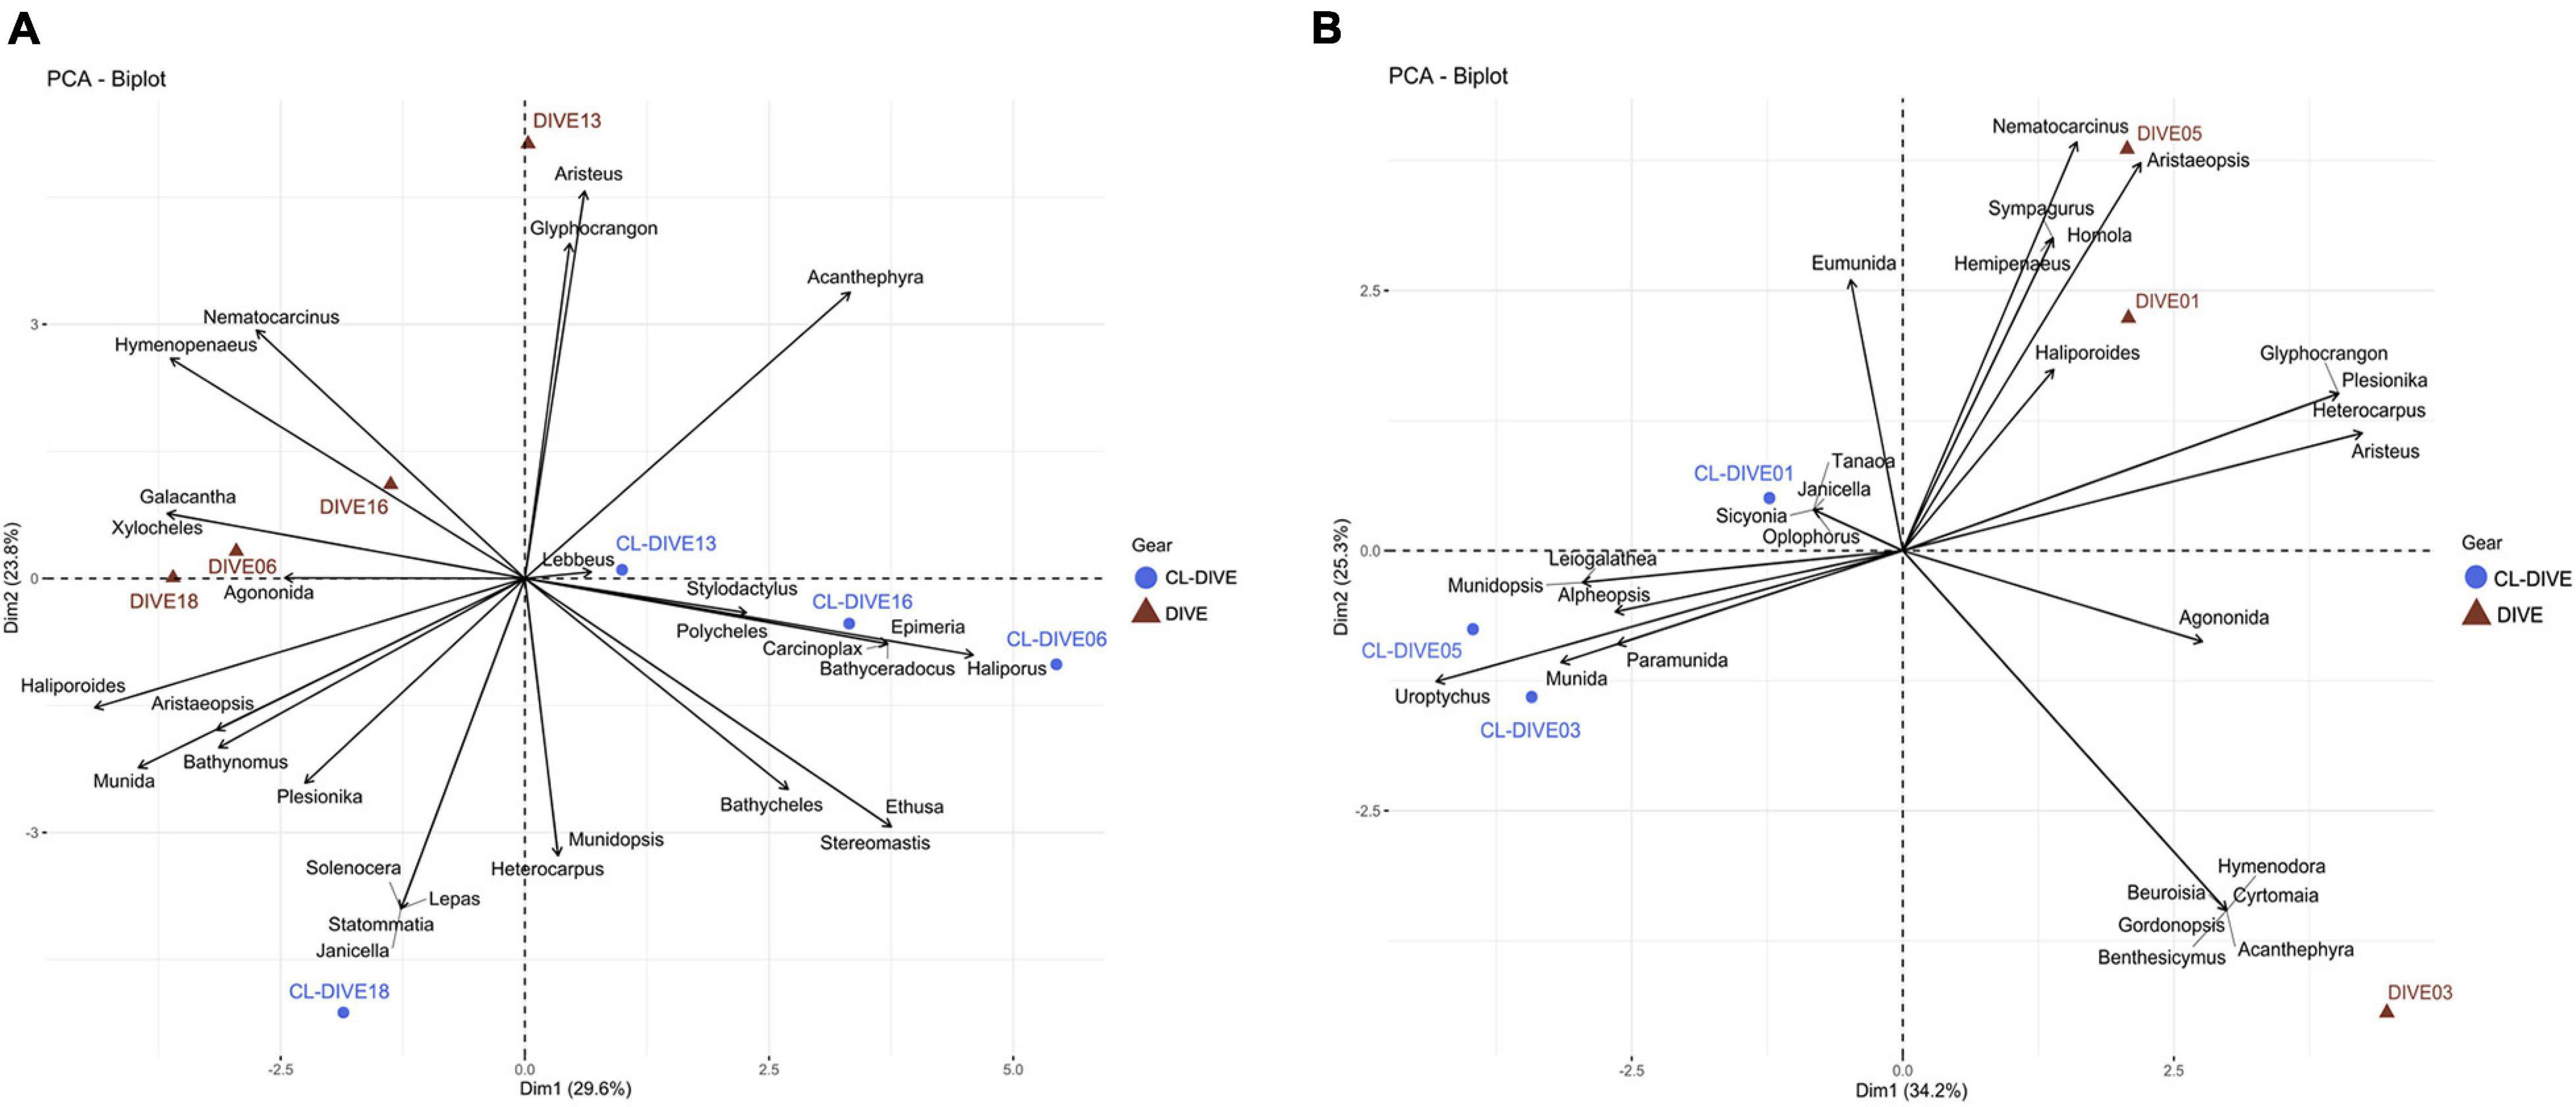
Figure 8. Comparison of crustacean assemblages between imagery (dive) and sampling along dive (cl-dive) along (A) sedimented slope habitats (PNG) (53.4% of variance on first two PCs) and (B) volcanic island slopes (Mayotte) (59.5% of variance on first two PCs). Principal Component Analysis (PCA) of Hellinger-transformed presence/absence crustacean data at genus rank.
The sampling from the surrounding area (cl-around) allowed us to identify 49 additional genera in both habitats (Figures 6C,D); supplementing the regional diversity inventory, insufficiently described with the camera transect and co-located sampling. These surrounding samples enabled the identification of three and five additional crustacean genera in images respectively on soft sediment slopes and volcanic island slopes.
Echinoidea
We estimated the Echinoid genus richness (from rarefaction curves not shown) as equivalent from images and physical sampling in the soft-bottom-dominated site (Dive01) but higher from images than from physical sampling in the two hard-bottom-dominated sites (Dive03, dive05).
Some genera were well sampled in physical samples, particularly the small-sized echinoids (Echinocyamus and Podocidaris) and some cidarid genera (Stereocidaris, Goniocidaris, Histocidaris). In contrast, we better observed and identified from images spatangoid echinoids (Spatangus and Echinolampas) and the very fragile, regular echinoid Aspidodiadema. We estimated a higher diversity of Cidaridae genera from physical sampling than from observation in images (Figure 9), but we observed the genera Stereocidaris and Stylocidaris (Cidaridae) only from images.
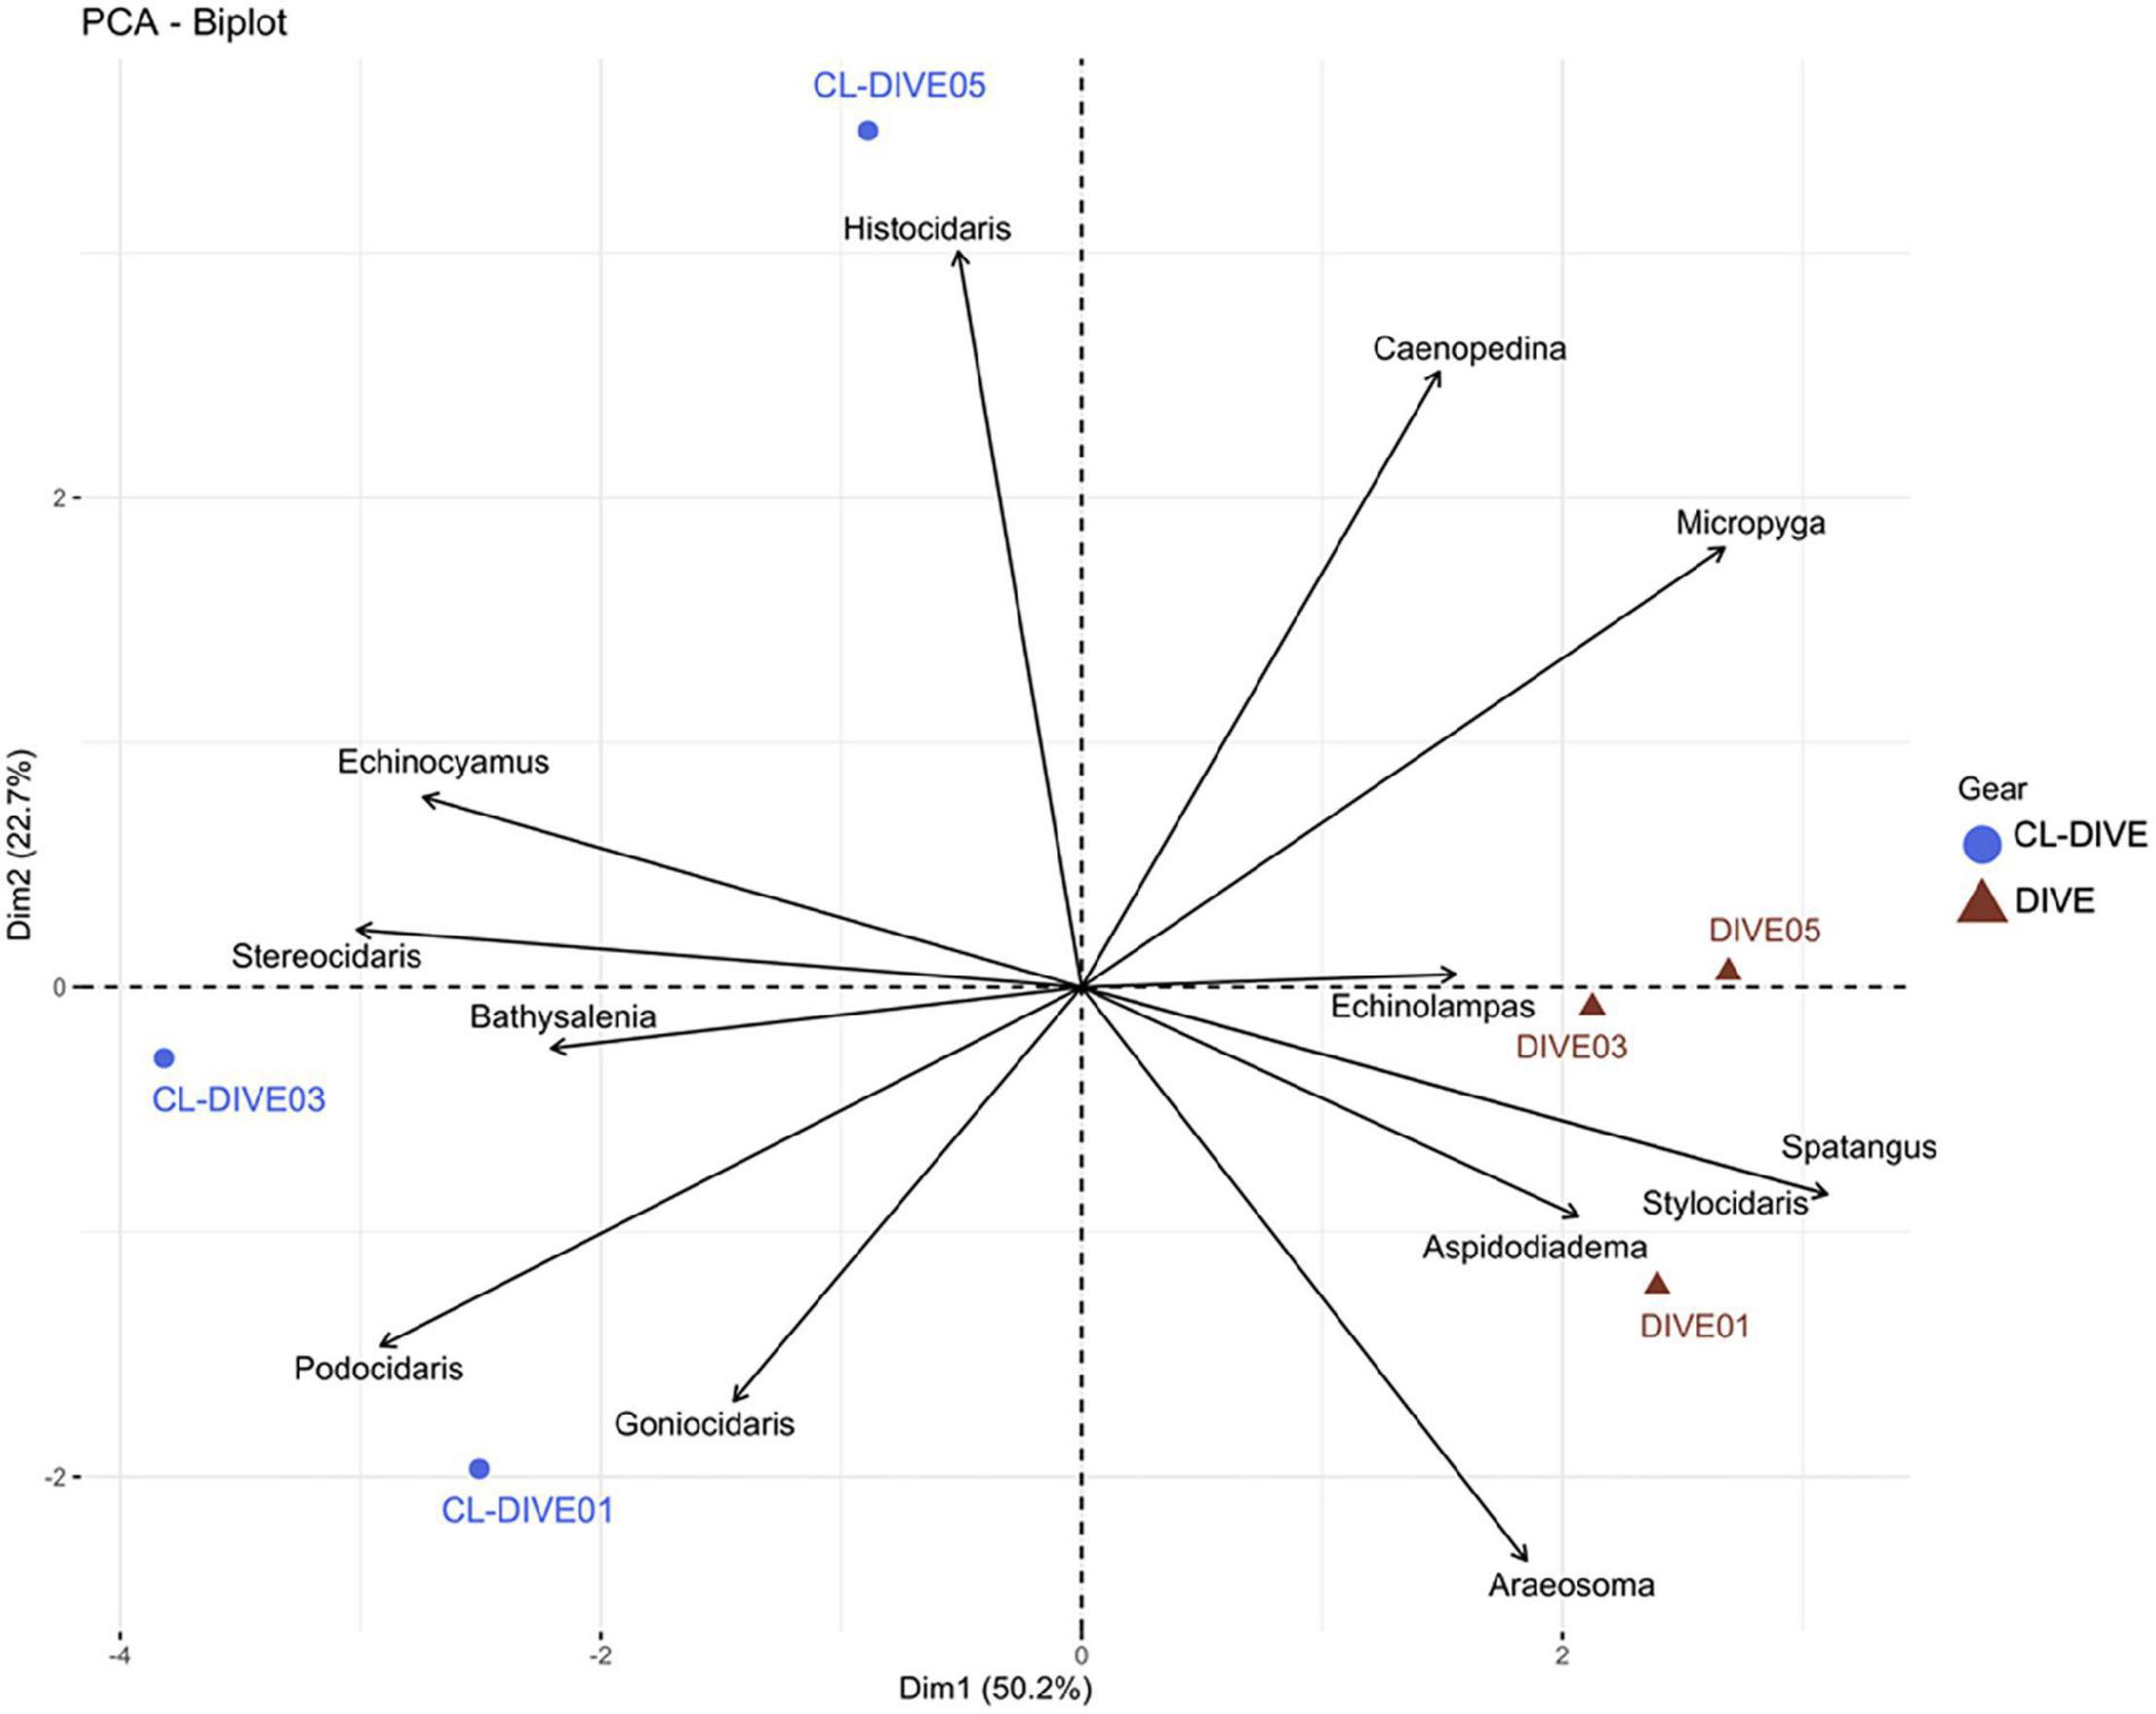
Figure 9. Comparison of echinoid assemblages between imagery (dive) and sampling along dive (cl-dive) along volcanic island slopes (Mayotte) (72.9% of variance on first two PCs). Principal Component Analysis (PCA) of Hellinger-transformed presence/absence echinoid data at genus rank.
From the pooled camera transect (dives) and the pooled co-located sampling (cl-dives), respectively, we observed equal values of genus diversity between the two methods (9 genera) (Figure 6E). The surrounding area sampling allowed us to identify four additional genera (Figure 6E) that in turn allowed the identification of two additional genera from images (Stylocidaris, Aspidodiadema).
Asteroidea
As for echinoids, we estimated (from rarefaction curves not shown) a higher richness of asteroid genera from physical sampling than from observation in images in the soft-bottom-dominated site (Dive01) and conversely in the two hard-bottom-dominated sites. Besides, no asteroid was recovered from the sampling operations along the Dive03.
Asteroids genus composition between images and physical samples were different. We identified six genera exclusively from observation in images (Lithosoma, Paranepanthia, Tremaster, Anthenoides, Sphaeriodiscus, Astroceramus), and five genera exclusively in the physical samples (Allostichaster, Tamaria, Mediaster, Persephonaster and Tritonaster). However, we observed a more similar genus composition between images and physical samples in the soft-bottom-dominated slope (Dive01) (i.e., Plinthaster, Henricia, Cheiraster) than for the other two hard-bottom-dominated volcanic slopes (Figure 10). Furthermore, we also observed Henricia and Cheiraster in images of the Dive03 and Dive05, but these genera were not captured in their co-located sampling operations (Cl-dive03 and Cl-dive05).
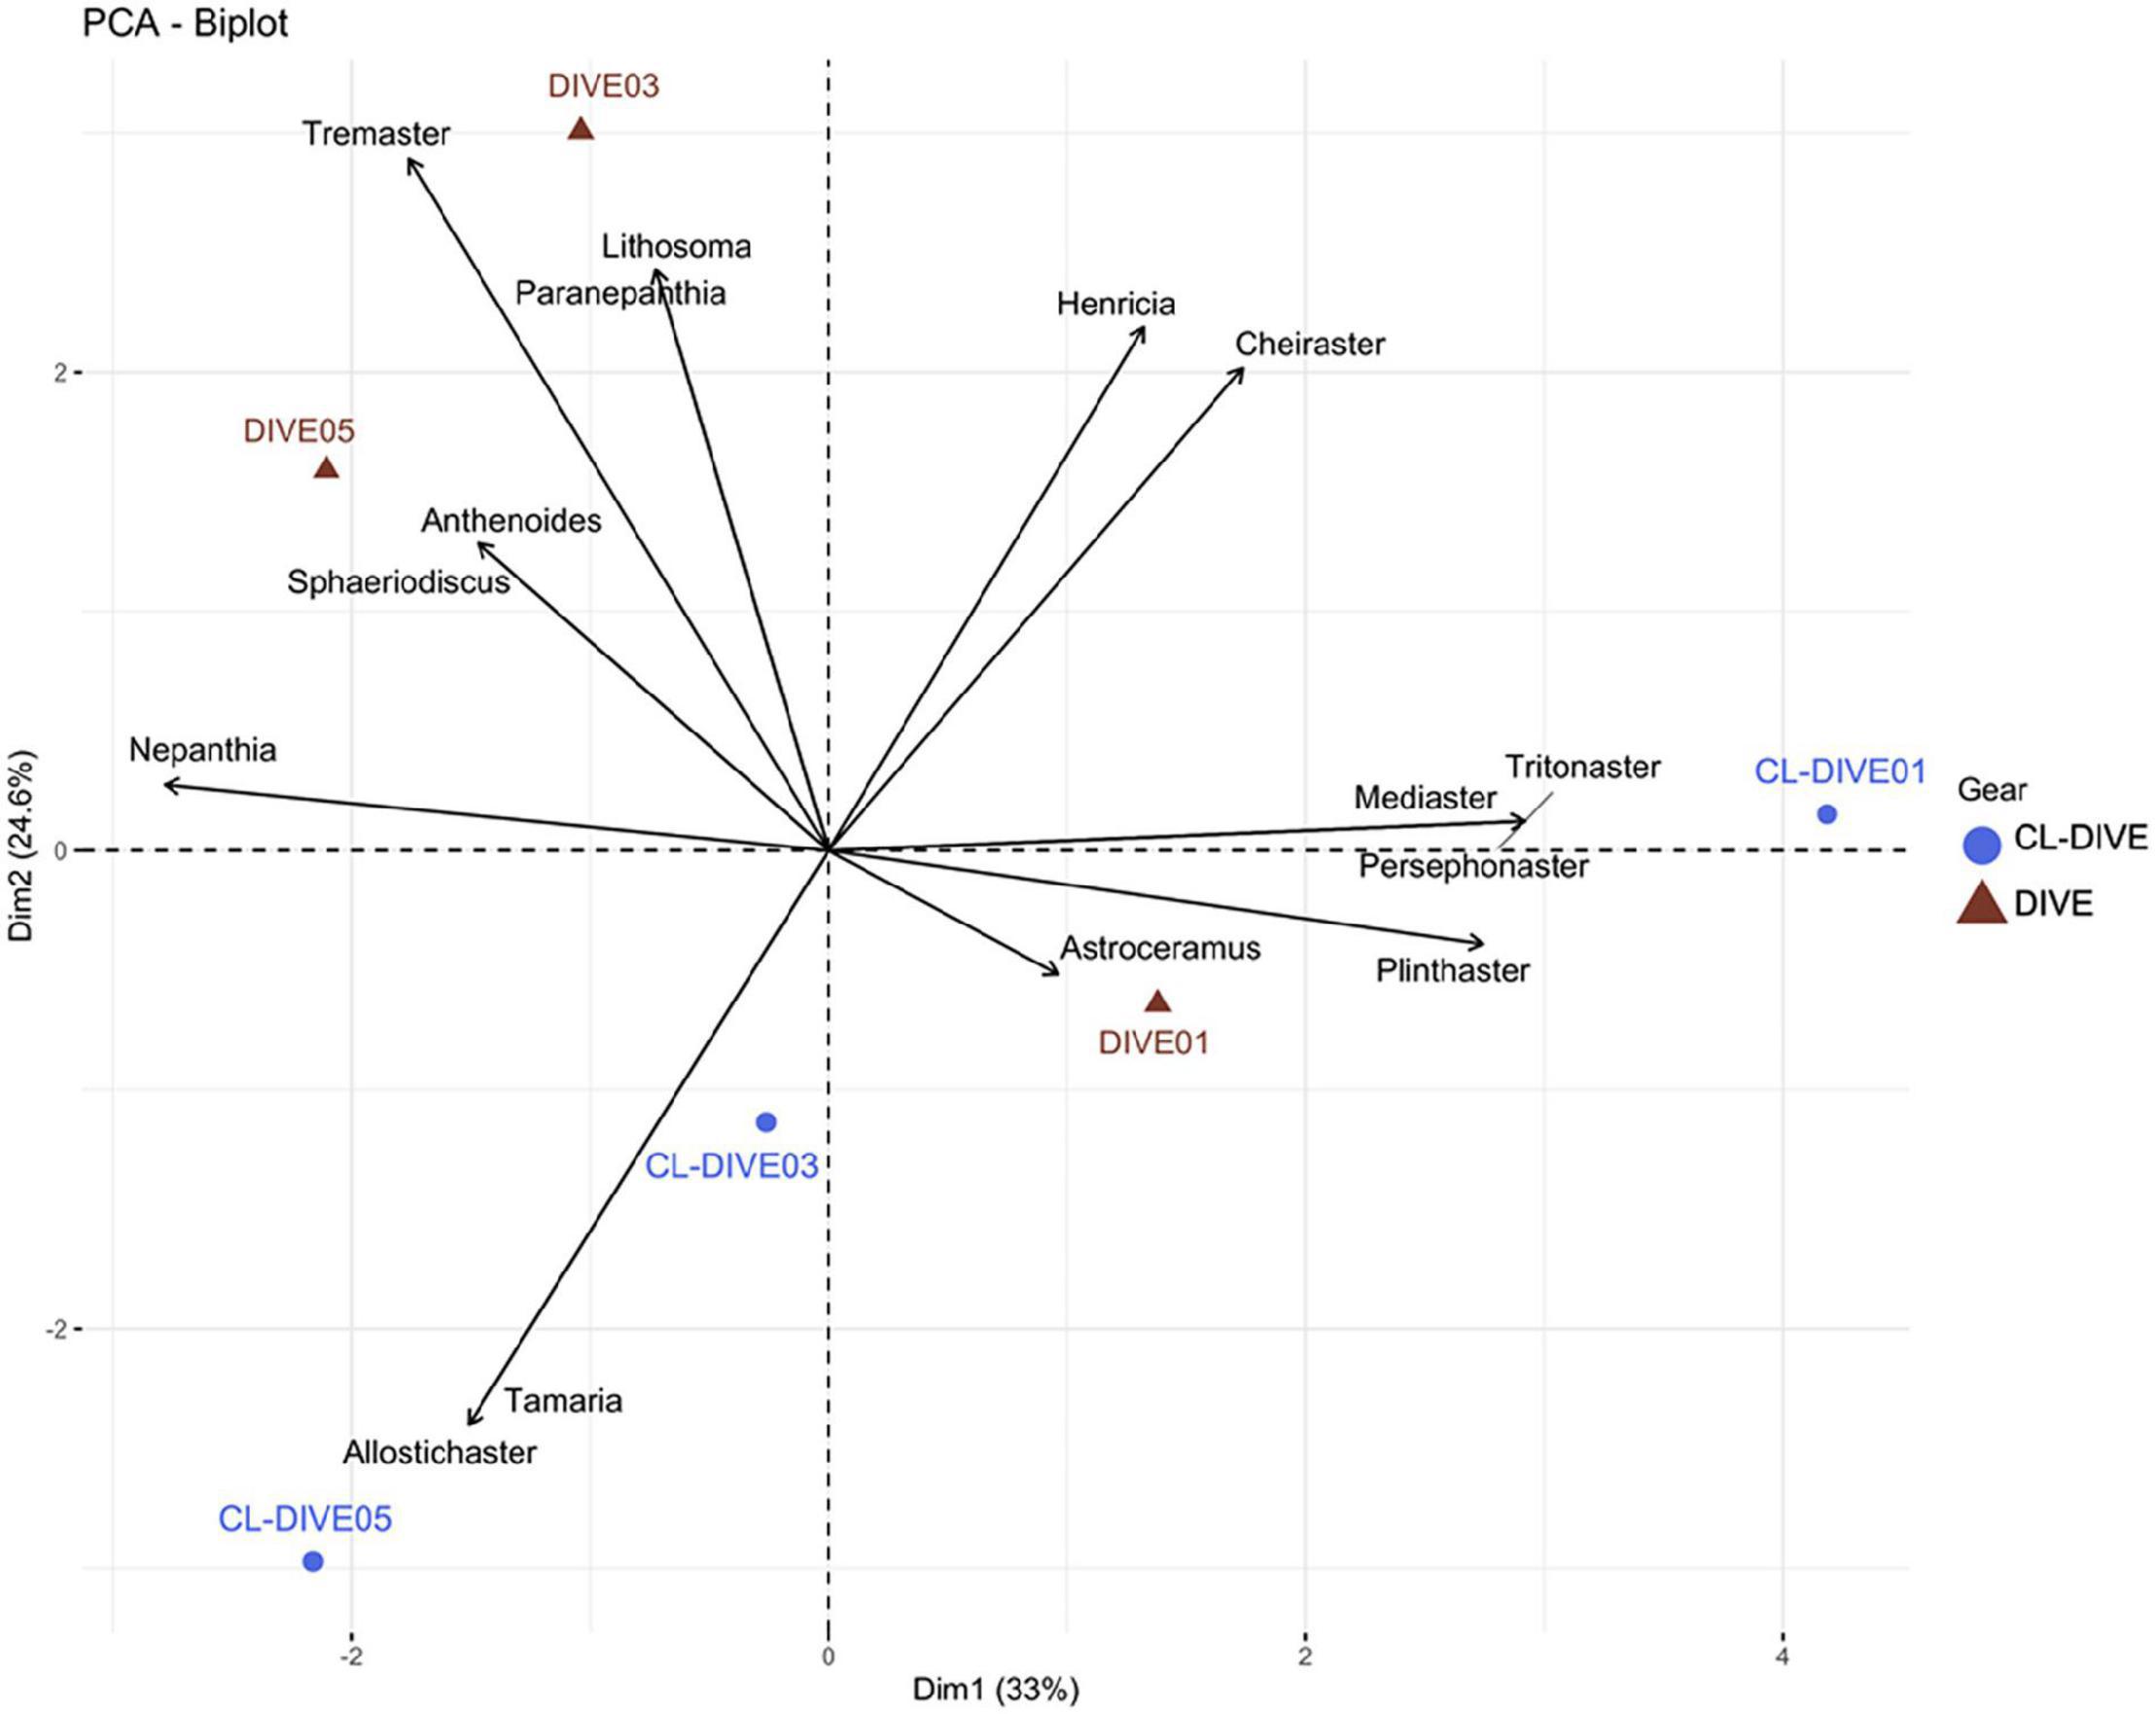
Figure 10. Comparison of asteroid assemblages between imagery (dive) and sampling along dive (cl-dive) along volcanic island slopes (Mayotte) (57.6% of variance on first two PCs). Principal Component Analysis (PCA) of Hellinger-transformed presence/absence asteroid data at genus rank.
When pooling respectively camera transects (dives) and dredge/trawls transects (cl-dives), we estimated an equivalent diversity at the genus rank from observation in images and from identification of specimens from physical samples (Figure 6F). However, we identified two families only from images (Myxasteridae and Solastereidae), but because of the lack of diagnostic characters visible in images we were not able to identify them at the genus level. Consequently we underestimated the genus diversity from images. The surrounding area sampling (cl-around) allowed us to identify 15 supplementary genera, that in turn allowed the identification of four additional genera from images.
Ilustration of the Proposed Integrative Methodology for the Photo-Taxa Identification of Crustaceans (Caridea and Galatheoidea): Construction of Photo-Type Catalogs and Identification Keys
Specimens collected in the co-located sampling and in the surrounding area in Astrolabe Bay and the Sepik area (PNG), and in the Comoros archipelago (for Mayotte), provide additional knowledge of the species occurring in these areas, and directly aid the identification of photo-taxa. Here we use the Caridea, observed on three dives along Mayotte volcanic island slopes, to illustrate our method of identification from images. This example illustrates the identification steps, from the photo-taxon identification to the construction of the identification key. We provide another illustration of the methodology in Supplementary Material 8 for galatheid identification at the morphospecies level along the four PNG sedimented slopes.
We considered four groups of Caridea specimens observed in images as belonging to different genera and thus delimited them into four different photo-taxa attributed to a reliable genus rank. We identified these four genera primarily based on observable morphological characters from images. In the physical samples (data from the BioMaGlo expeditions as well as from previous expeditions), we identified species attributed to these four genera that thus constitute a pool of species potentially present in the analyzed images (Table 4). For each of these four genera, we compared the morphological characters observable on the photo-taxa by using the characters of potential species. From this comparison, we were able to determine the individuals to the species or morphospecies ranks, whereas for some photo-taxa, identification did not go beyond the genus rank.
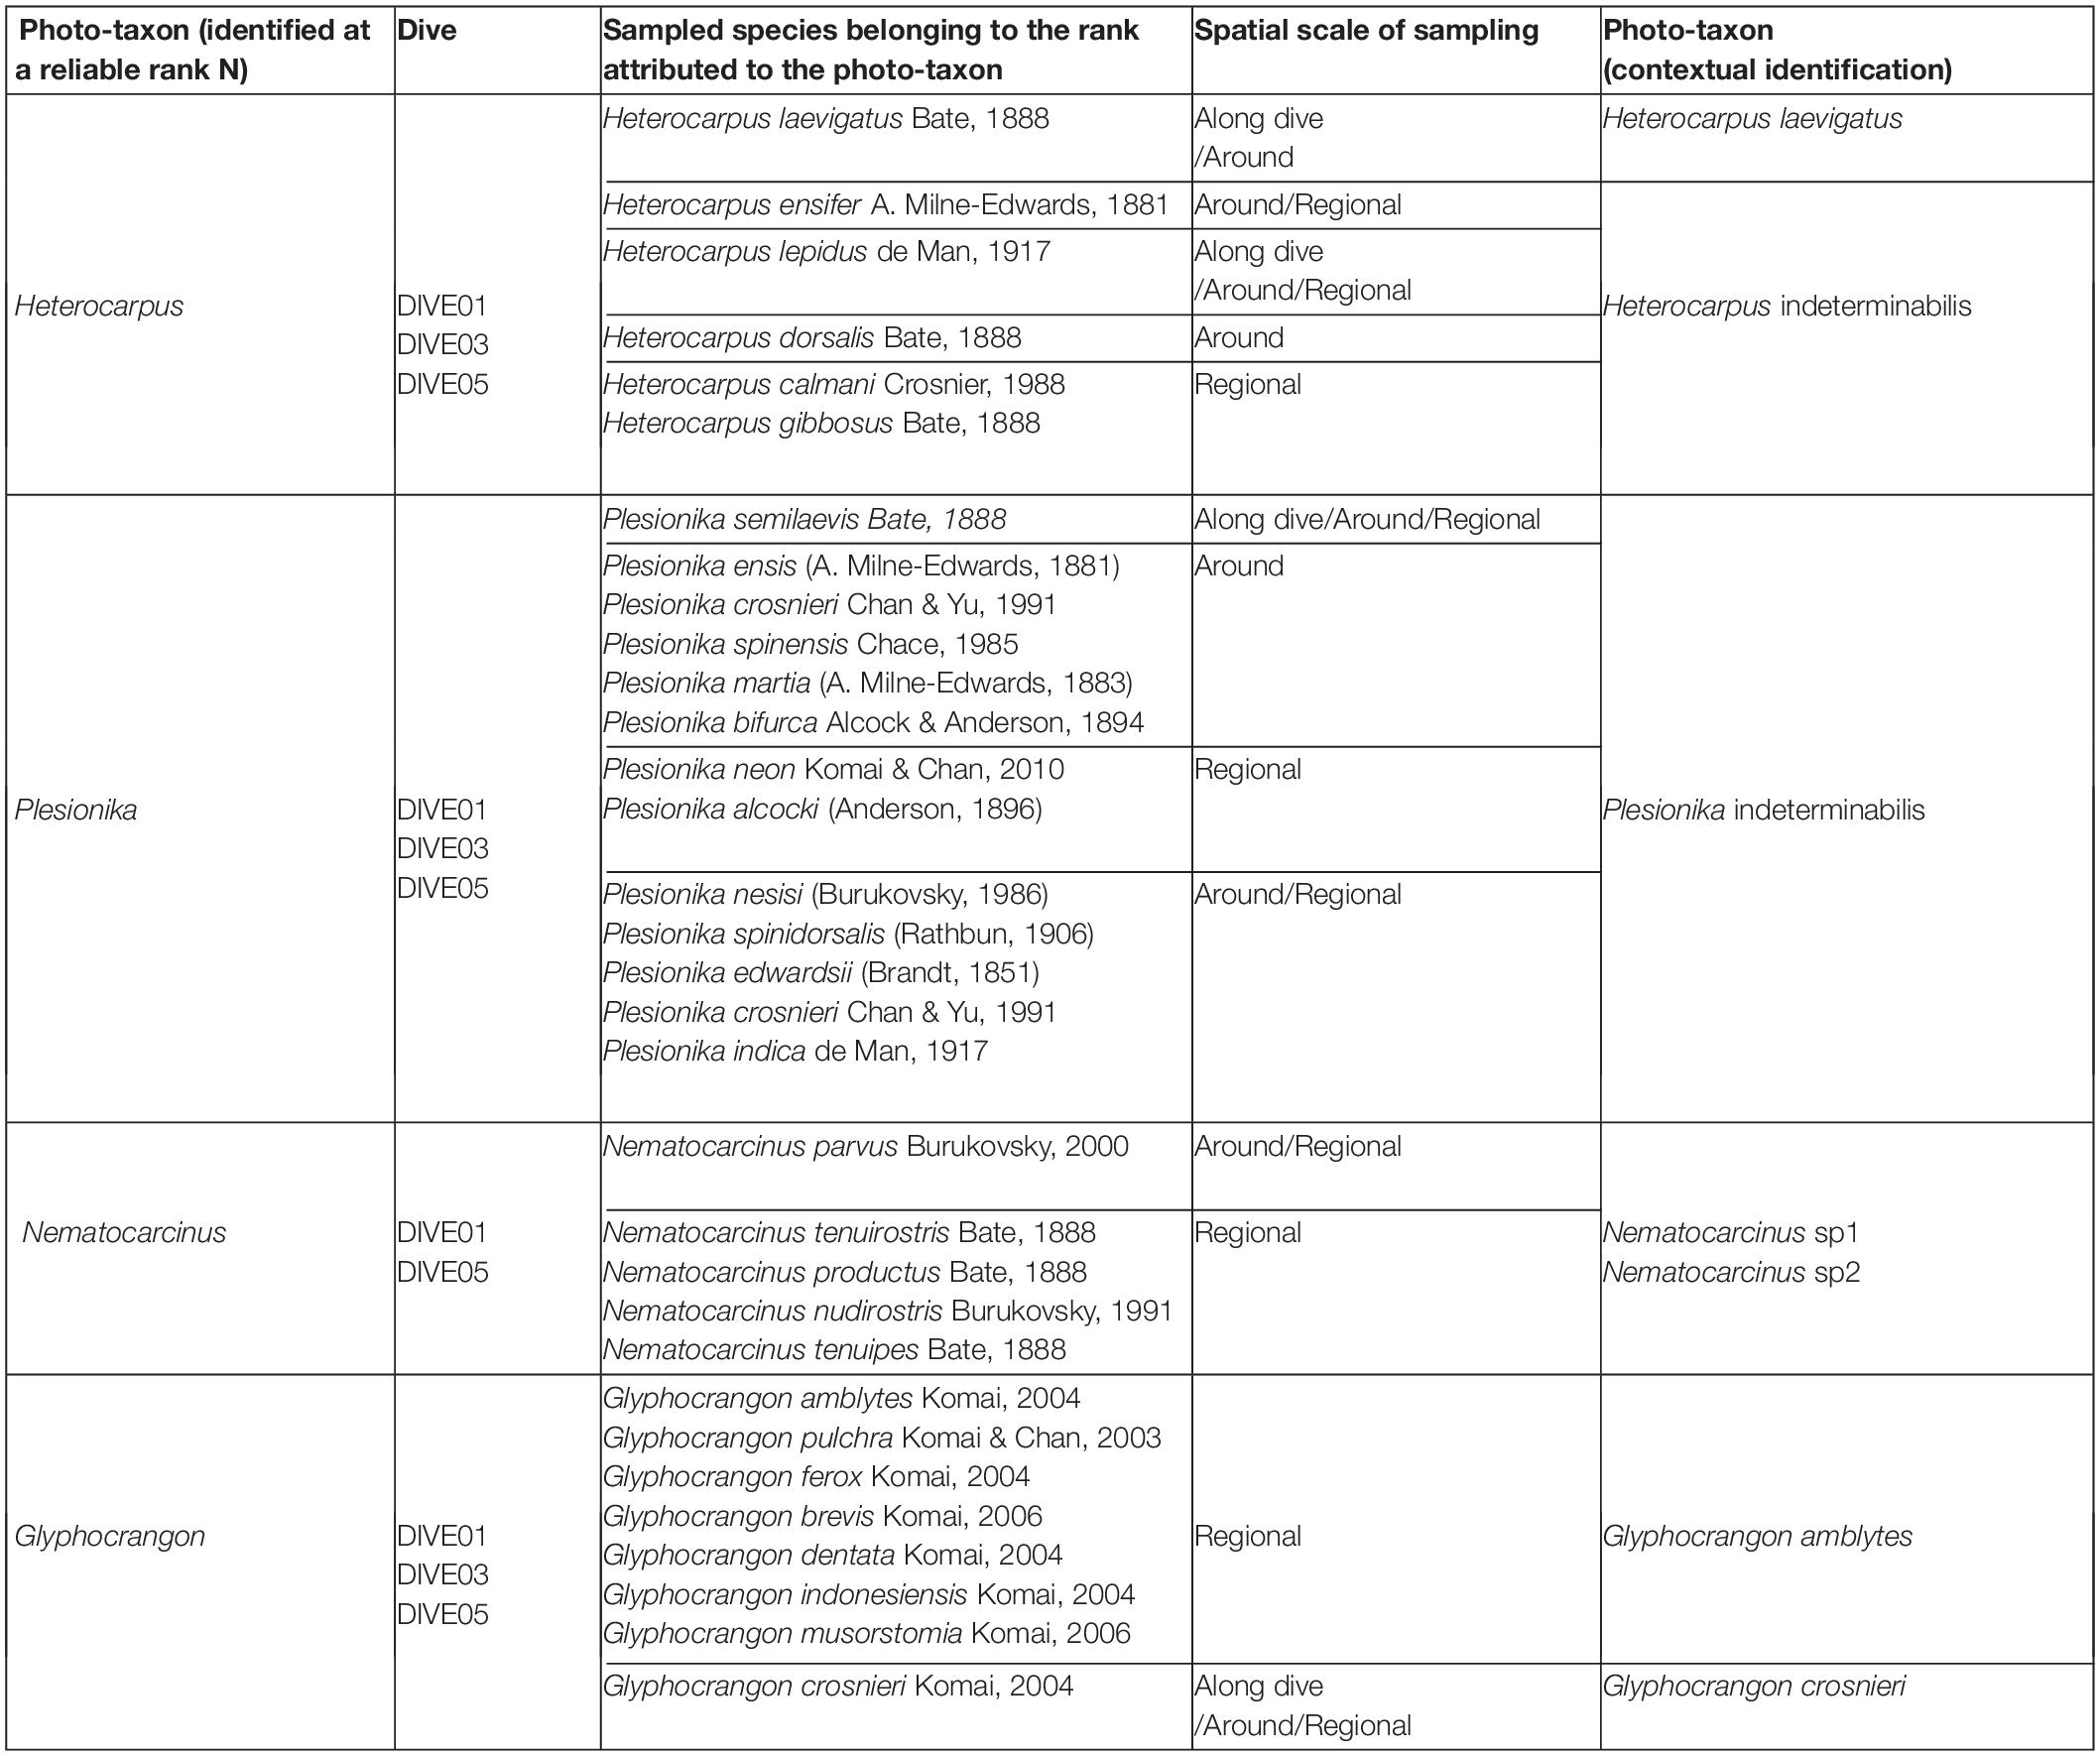
Table 4. Examples of Caridea photo-taxa identified from images in relation with Caridea species collected either from sampling along dive, or from sampling in the surrounding area from Mayotte, Moheli, Geyzer Bank and Gloriosos (BioMaGlo expedition), or from regional sampling from past expeditions undertaken along the Mozambique Channel.
For the photo-taxon assigned to the genus Heterocarpus, comparisons made it possible to differentiate individuals belonging to this photo-taxon with morphological characters attributed to the species Heterocapus laevigatus (i.e., dorsal rostrum without tooth in most length, no dorsal spine on the abdomen, with a body red to orange, with red vertical stripes on abdomen between somites). Thus, for these individuals, we delimited a new photo-taxon assigned to the species H. laevigatus. For the other Heterocarpus individuals, the quality of the images was insufficient to establish a difference at the species rank. Thus, these individuals remained assigned to the genus Heterocarpus with the qualifier status “indeterminabilis”.
For the photo-taxon assigned to the genus Plesionika, although several potential species corresponding to this genus were collected and are known in the study area, the quality of the images and the observable characters were insufficient to differentiate several subsets at the species level. Many of these observable characters (e.g., white spots on the abdomen) are shared between several species, or highly variable within species (e.g., specimens color variation according to the background substrates). Therefore, we limited our identification to the genus level with the qualifier status “indeterminabilis”.
For the photo-taxon assigned to the genus Nematocarcinus, five species are known in the area (Burukovsky, 2011). However, the characters observable from images were not sufficient to identify them at the species rank with a valid species name. Nevertheless, we were able to differentiate two groups of individuals within this photo-taxon: individuals with a banded abdomen and individuals with homogeneous orange abdomen. These two patterns indubitably correspond to at least two different species, as the eight species of Nematocarcinus have their colorations illustrated in Burukovsky (2013) all lacking bands on the abdomen. We thus assigned them to two distinct morphospecies.
Finally, for the photo-taxon assigned to the genus Glyphocrangon, we distinguished two potential species on a distinct morphological character (i.e., post-antennal spines widely directed outward or not from the front carapace). Using the list of the eight Glyphocrangon species present in the region, the state of this observable character from images allowed us to assign each of these two groups of individuals respectively to Glyphocrangon amblytes or Glyphocrangon crosnieri [also according to their white body coloration with black eyes and orange bands on the abdomen amongst the species reported in the region (Komai and Chan, 2013)].
After having delimited Caridea photo-taxa and attributed each one to at least a genus rank (taxonomic rank illustrated for this example), we selected the best-quality images to compile the photo-type catalogs for use in identifying the remaining photo-taxa. We then compiled all the diagnostic characters we identified as relevant for the identification of these photo-taxa.
Therefore, resulting from this methodology of identification, we developed identification keys for three target taxa based respectively on the expertise of Pr. Tin-Yam Chan and Dr. Laure Corbari for Crustacea (mainly Dendrobranchiata and Caridea), Dr. Thomas Saucède for Echinoidea and Dr. Christopher Mah for Asteroidea. The keys for shrimps and asteroids are dichotomous while the key for echinoids is an online multiple-entry interactive key. We built these keys based on the identification of specimens observed in the images from the Mayotte volcanic island slopes, and from other seamounts in the Mozambique Channel. The taxonomic rank reached in these keys represents the identification rank achieved from the images. Therefore, these keys are yet incomplete. First, for some taxonomic group the characters needed to differentiate the taxa at lower level might be not observable in images. Second, we do not have images of all the species known in the Mozambique Channel. These keys must thus be completed with additional data.
Discussion
Efficiency of Images and Physical Samples in Different Habitat Types
Taxonomic Coverage and Resolution
We reached a level of identification lower than the class level for Pisces (order/family), Asteroidea and Echinoidea (down to genus) and Crustacea (down to species/morphospecies). Assignment to these taxonomic ranks reflects both their recurrence on the images, the available literature and the involvement and availability of taxonomy experts in the identification of specimens both from images and from collected samples. Furthermore, for these groups, a sufficient number of diagnostic characters can be examined from images (e.g., test shape and spine thickness for echinoids, antennular length and color or rostral teeth for shrimps).
Identification of other phyla in images is of lower resolution, from phyla/class for Porifera, order for Cnidaria, and class to family for Mollusca. It is worth noting that the mollusks, as well as the annelids identified at the family level were specialized fauna associated with cold seeps where the low diversity and the large size of individuals (e.g., Sibuet and Olu, 1998) make the identification of these groups easier. On the contrary, in other habitats, annelids and bivalves are usually of small-size and inconspicuous (i.e., buried in the sediments or hidden in habitat-forming organisms such as corals or sponges). For instance, we observed a high proportion of gastropods along the Mayotte island volcanic slopes but whose identification from images of the shells only never exceeded the class rank. We expected such limitation, which was previously observed on hard bottoms (Williams et al., 2015; Beisiegel et al., 2017).
We also obtained incomplete identification from physical samples for mollusks and annelids and for other groups as well (e.g., actinids and echinoderms from the upper PNG sedimented slopes area). This reflects the time-consuming practice of taxonomy (e.g., fieldwork, species delimitation, description and naming, curation of collections, etc.). Moreover, this scientific field suffers from poor funding, decreasing numbers of experts and lack of employment opportunities (Agnarsson and Kuntner, 2007). These hindrances further increase the time between the discovery and the description of new species (Fontaine et al., 2012). Furthermore, in areas where the fauna is poorly known and very diversified such as in PNG—where more than 300 new species have been described by the TDSB Program—and in the north Mozambique Channel—with 85 species described from one expedition (Benthedi)—the identification effort needed from taxonomists is all the more important.
Lastly, from images, we annotated many cnidarians and poriferans, whose identification beyond the class or order ranks was difficult and uncertain. These taxonomic groups have complex taxonomy and show high morphological plasticity or convergence from the high to intraspecific levels (Barnes and Bell, 2002; Todd, 2008). Moreover, diagnostic characters required for identification at the species rank are mainly microscopic or internal (e.g., Chrysogorgia species) (Pante and Watling, 2012), and thus cannot be observed from images. In addition, we observed that the erect 3D structure of these habitat-forming species was not efficiently captured in dredges and trawls on the hard bottoms of the Mayotte volcanic island slopes; similarly for penatulids and actinarians which have been observed only in images along sedimented slopes of PNG. This fishing gear selectivity has already been mentioned for hard bottoms (Williams et al., 2015) and for soft bottoms (e.g., pennatulids, actinids) (Rice et al., 1982; Nybakken et al., 1998; de Mendonça and Metaxas, 2021). However, cnidarians and poriferans represent key groups in the benthic ecosystem functioning, because they can host a large diversity of associated fauna (Buhl-Mortensen et al., 2010; Beazley et al., 2013). They are also highly vulnerable to anthropogenic impacts due to their low resilience (Schlacher et al., 2010) and thus provide a good vulnerable marine ecosystem (VME) indicator (Food and Agriculture Organization of the United Nations [FAO], 2009). For these groups, the use of ROVs can help identification by coupling high-resolution imagery with the collection of targeted specimens and establish a robust baseline catalog. However, the cost by using ROVs is much higher than using the towed cameras, and have still their limitation to survey the whole diversity. This underlines the necessity for developing alternative approaches to assess the diversity of habitat-forming taxa, which is an ongoing work of M. Hanafi-Portier’ Ph.D. by developing a classification of observable characters based on their morphology and their function (e.g., size, 3D structure) independently of their taxonomy. Such characters have been reported to be good proxies for the role of these habitat-forming species on associated fauna and how they could respond to abiotic constraints (Schonberg and Fromont, 2014; Denis et al., 2017; Zawada et al., 2019; Schonberg, 2021).
Our study underlines the need to put the research efforts on targeted taxonomic groups that fulfill at least three conditions: (1) an extensive record of both physical specimens and identifications in collections, (2) the ability to identify diagnostic morphological characters from images and (3) the availability and active involvement of taxonomists to identify them from images. For those unidentifiable from images and/or not efficiently collected, biodiversity quantification must then be assessed using other approaches (e.g., morpho-functional).
Biodiversity Metrics for the Targeted Taxonomic Groups
For each targeted taxonomic group, we have compared the diversity and composition metrics at the taxonomic rank reached for images. For a given sampling area, these metrics differ when estimated based on physical samples or from observations made in images.
In areas dominated by hard bottoms or showing high habitat heterogeneity such as cold seeps, we observed higher taxonomic richness in images than in physical samples, for all the targeted taxa in this study, and at variable taxonomic ranks of comparison. This reflects mainly the difficulties for the dredges in these environments, with for example, large boulders (∼1 m in size) along the Mayotte slopes. In the cold-seep area, abundant large siboglinid tubeworm bushes and mussel beds clogging the trawl nets seems to have limited the sampling of other taxa.
In areas dominated by soft sediment, including the sedimented slopes of Astrolabe Bay in PNG and the soft-bottom areas of the Mayotte island slopes (Dive01), we expected a better sampling efficiency than in hard bottoms. However, at the transect scale we did not detect consistent differences in taxonomic richness estimated from observation from images and from identification of physical samples. This low richness of the very mobile fauna in fishing gears—as observed for Pisces—highlight the need to widen the sampling area. The physical sampling alone captured only part of the faunal diversity, probably because of gear selectivity and insufficient sampling effort with respect to the diversity of the different groups in the studied regions. Assessment by environmental DNA/metabarcoding approach could be an interesting complement to improve the biodiversity exploration at the local scale. However, this approach requires DNA-barcoding reference databases which are yet far from completed for the deep-sea fauna. Crustaceans are better sampled by fishing gears if comparing the metrics at the genus rank. However, when considering the identification of morphospecies in images and the identification of species for physical samples, we obtained similar metrics. The metrics estimated at the species level for images might have overestimated the real richness. Indeed, several morphospecies can represent a single species with intraspecific polymorphism. Such issues can be solved only when DNA barcoding analysis is conducted on the collected specimens. Nevertheless, underestimation of diversity is also possible, because one morphospecies can potentially gather several species (Williams et al., 2015). This could explain the lower richness observed in images compared to physical samples in this study (190 species identified from sleds, vs 57 photo-taxa) which contrasts with our results. The use of taxonomic levels, or thresholds, defined for each taxonomic group, could be a more cautious and robust way to assess the biodiversity from image datasets, even if these levels are heterogeneous.
Images alone give a partial estimation of the diversity notably due to identification limitations, particularly for the mobile species that appeared blurry in images (e.g., Malacostraca indeterminabilis dominated in the canyon site) or for small-sized taxa (e.g., genus Echinocyamus for echinoids, genus Lepas for crustaceans). In soft bottoms, endogenous fauna cannot be detected in images (Rice et al., 1982); this also applies to some crustacean genera (e.g., Stereomastis) and burrowing fish families which camouflage themselves (Synodontidae, Myxinidae). Also, some diagnostic characters cannot be observed in images for some taxa (e.g., the Myxasteridae family for Asteroidea, the Perciformes order for Pisces). For echinoids the diversity of some families was better represented from sampling (e.g., Cidaridae) mainly due to the difficulty in identifying characters from images. Thus, imagery tends to smooth the gamma diversity for this family.
Nevertheless, selectivity of fishing gears was also deduced from this comparison, especially in complex seabed habitats for very mobile taxa, but also due to the living habits or fragility of some species. For instance, the fragile genus Aspidodiadema (Echinoidea), which lives with its test raised above the seafloor by its long spines, was not collected. Interestingly, images revealed the occurrence of this genus in hard-bottom areas making evident the misconceptions about the soft-bottom living habits of the genus. Similarly, the half-buried spatangoid genera and the burrowing ones (e.g., Eupatagus) were identified in images but not in samples, likely because of their fragility.
In summary, we conclude that neither imagery nor physical sampling at the transect scale can give a complete view of megafauna diversity and composition. Imagery is advantageous in hard-bottom and heterogeneous habitats, where the topography and the nature of the substrate limit the efficiency of fishing gears. In contrast, in soft-bottom habitats, the benefit of physical sampling is more pronounced, because endogenous and small-sized fauna cannot be detected in images. Gamma diversity is better estimated from sampling in soft-bottom habitats. The use of imagery in these environments can provide complementary information on habitats (e.g., wood distribution, cold seeps) at the transect scale, or among transects, revealing their potential role in structuring megafauna biodiversity. In hard-bottom environments, due to sampling difficulties, sampling effort should cover a larger spatial scale to catch the regional species pool and allow identification from images.
Increase the Robustness of Photo-Taxa Identification by an Integrative Methodology
The sampling undertaken in the surrounding areas (up to 400 km) contributed to a significant increase in the knowledge of species occurring in the area. In return, this knowledge helped the identification of individuals from images. For Pisces, the contribution of the knowledge of the surrounding fauna is the highest for the volcanic island slopes, with an increase up to nine-fold of family richness. For echinoids, specimens sampled in the surrounding areas increased the genus richness to a lesser extent than for the very mobile fauna (∼1.7×), probably because of a higher probability of capture and a lower gamma diversity, leading to capture much of the diversity from the “local” samples along the dives. It seems that the contribution increases with fauna mobility and with gamma diversity.
The case study of decapods illustrates the methodological approach we developed based on a taxonomic framework. It shows in particular that photo-taxon identification relies on observation of morphological characters relative to one or several potential analogous species/taxa collected in the area. If morphological characters cannot be sufficiently differentiated between or within one photo-taxon to proceed to a lower identification level, we suggest identification at the lowest robustly determined taxonomic rank.
Although morphological characters cannot be sufficiently observed to assign a species name to a specimen in images, we suggest morphospecies delimitation from knowledge of the taxa occurring in the area at regional and also local scales (specimens exclusively sampled along dive). This approach can be applied to any rank higher than genus (e.g., morphospecies delimited at the family level) according to the lowest resolved identification level. However, when the distinction between morphological characters does not allow the clear delimitation between individuals, identification remains at the lowest robustly resolved taxonomic rank designated with an identification status qualifier “indeterminabilis” (e.g., Plesionika indeterminabilis).
In some cases, species-level identification is possible, as illustrated with H. laevigatus, because this species was the only one of the Heterocarpus genus collected in the surrounding area that showed diagnostic characters corresponding to those observed in the photo-taxon.
We also tried to supplement and enhance the robustness in identification with an integrative approach, by also considering the species habitat, feeding preferences, substrate, living habits or position relative to seafloor. Habitat context was not an informative diagnostic character for the identification of decapods, because most specimens observed in images belonged to genera characteristic of soft- or mixed-bottom types and with a wide depth range. However, for some other taxa, habitat provided useful information. For instance, the knowledge of the preference of some Munidopsis species for sunken wood (Hoyoux et al., 2012) that were sampled in the area was a helping criterion to increase confidence in the identification of this genus from images. Similarly, the knowledge of feeding preference of some asteroid species belonging to the genus Henricia, that predate on sponges (Mah, 2020), increased confidence in image-based identification of this genus. At the species/morphospecies rank of identification, to weight potentially diagnostic features and increase confidence in the distinction among the potential species, it may be useful to add additional criteria relative to the environment, as discussed above for genus-level identification.
Finally, we developed photo-type catalogs to help in the identification of the remaining photo-taxa to be identified. However, catalogs alone are subject to interpretation according to observers and can lead to erroneous identifications or variable identifications between observers (Henry and Roberts, 2014; Howell et al., 2014; Durden et al., 2016a). Therefore, catalogs of marine taxa need to be fed by formalized diagnostic criteria required for consistent and robust identification.
Formalization of Image-Based Taxonomic Identification From Keys Adapted for Imagery
We observed that images and physical samples provide differential and complementary views of the structure of the benthic megafauna, and uncovered the need for and the contribution of physical sampling at local scales and beyond to help in the identification of photo-taxa. Our formalization of the process of identification of the organisms observed in images gives a taxonomic framework to photo-taxon identification, to refine the taxonomic rank of determination, and for morphospecies delimitation.
From this complementarity, and for three target taxa (Echinoidea, Asteroidea, Decapoda), the diagnostic characters observed in images, the satisfactory level of identification, the collaboration and involvement of taxonomists all enabled the development of identification keys adapted to the images acquired from the Mayotte slopes, and by extension adapted to the Mozambique Channel area. This is a first step for these keys, which can be adapted to other areas in the future (Indo-West Pacific area).
We tested the identification keys for asteroid and decapod identification on a set of four naive observers, as recommended in Walter and Winterton (2007). Results indicated some limitations for the two dichotomous keys, including misinterpretation or low image resolution leading to inefficient or inadequate observation of diagnostic characters. Obviously, the identification of photo-taxa using keys is easier for specialists than for non-experts. We then integrated photo-type images and illustrations of characters to make the keys more user-friendly. However, inherent to their structure, dichotomous keys can be difficult to use due to pathway problems. Misinterpretation or unanswerable couplets of characters can lead to a dead-end, and thus require going back to the starting entry points (Walter and Winterton, 2007; Hagedorn et al., 2010). Unanswerable couplets can be particularly limiting in the case of image analyses (characters not visible from image), leading us to focus on the development of a multiple-access key such that the user can choose any character according its availability (observable from images) or familiarity (doubt regarding some characters), and also recommended by Howell et al. (2019) in the case of image-based identification.
This type of key is available for echinoid identification at the genus rank. It can be easily updated and quickly provides the information sought to end-users on a web platform. It also facilitates the documentation of environmental settings and of main abiotic and biotic elements of habitats along with their implementation in datasets (e.g., taxon depth range, substrate type, associated living communities, etc.).
The development of image-based keys for fish identification holds promise, but the limited image resolution and top-view acquisition were not suitable to build such keys. Indeed, the morphological characters observable in the images, especially when images were taken with a towed camera, are poorly informative for taxonomic identification. We consequently recommend to systematically supplement top views with a profile view, especially for the identification of Pisces (e.g., number of dorsal fins, profile shape, etc.) and Decapoda (e.g., rostrum shape and armature, abdominal armature etc.), or to use stereo cameras which can provide 3D views. Video sequences can provide informative supplementary diagnostic characters, allowing observation of behavior, flexibility and movement. Advances in biomimicking robotics such as fish-like robots could help encompassing such limitations by offering side-view observations and the exploration of behaviors (Katzschmann et al., 2018; Laschi and Calisti, 2021).
Furthermore, from a non-expert point of view, we noticed different complex methodological choices and questions in terms of photo-taxon identification and morphospecies delimitation. For instance, regarding the choice of whether or not to delimit different morphospecies for a given photo-taxon, the confidence we placed in the species identification level or the choice to maintain the taxon at an indeterminabilis level of identification. We combined these questions in an integrative scheme, considering in particular new recommendations for a standardized, open nomenclature for image-based identification (Horton et al., 2021; Figure 11).
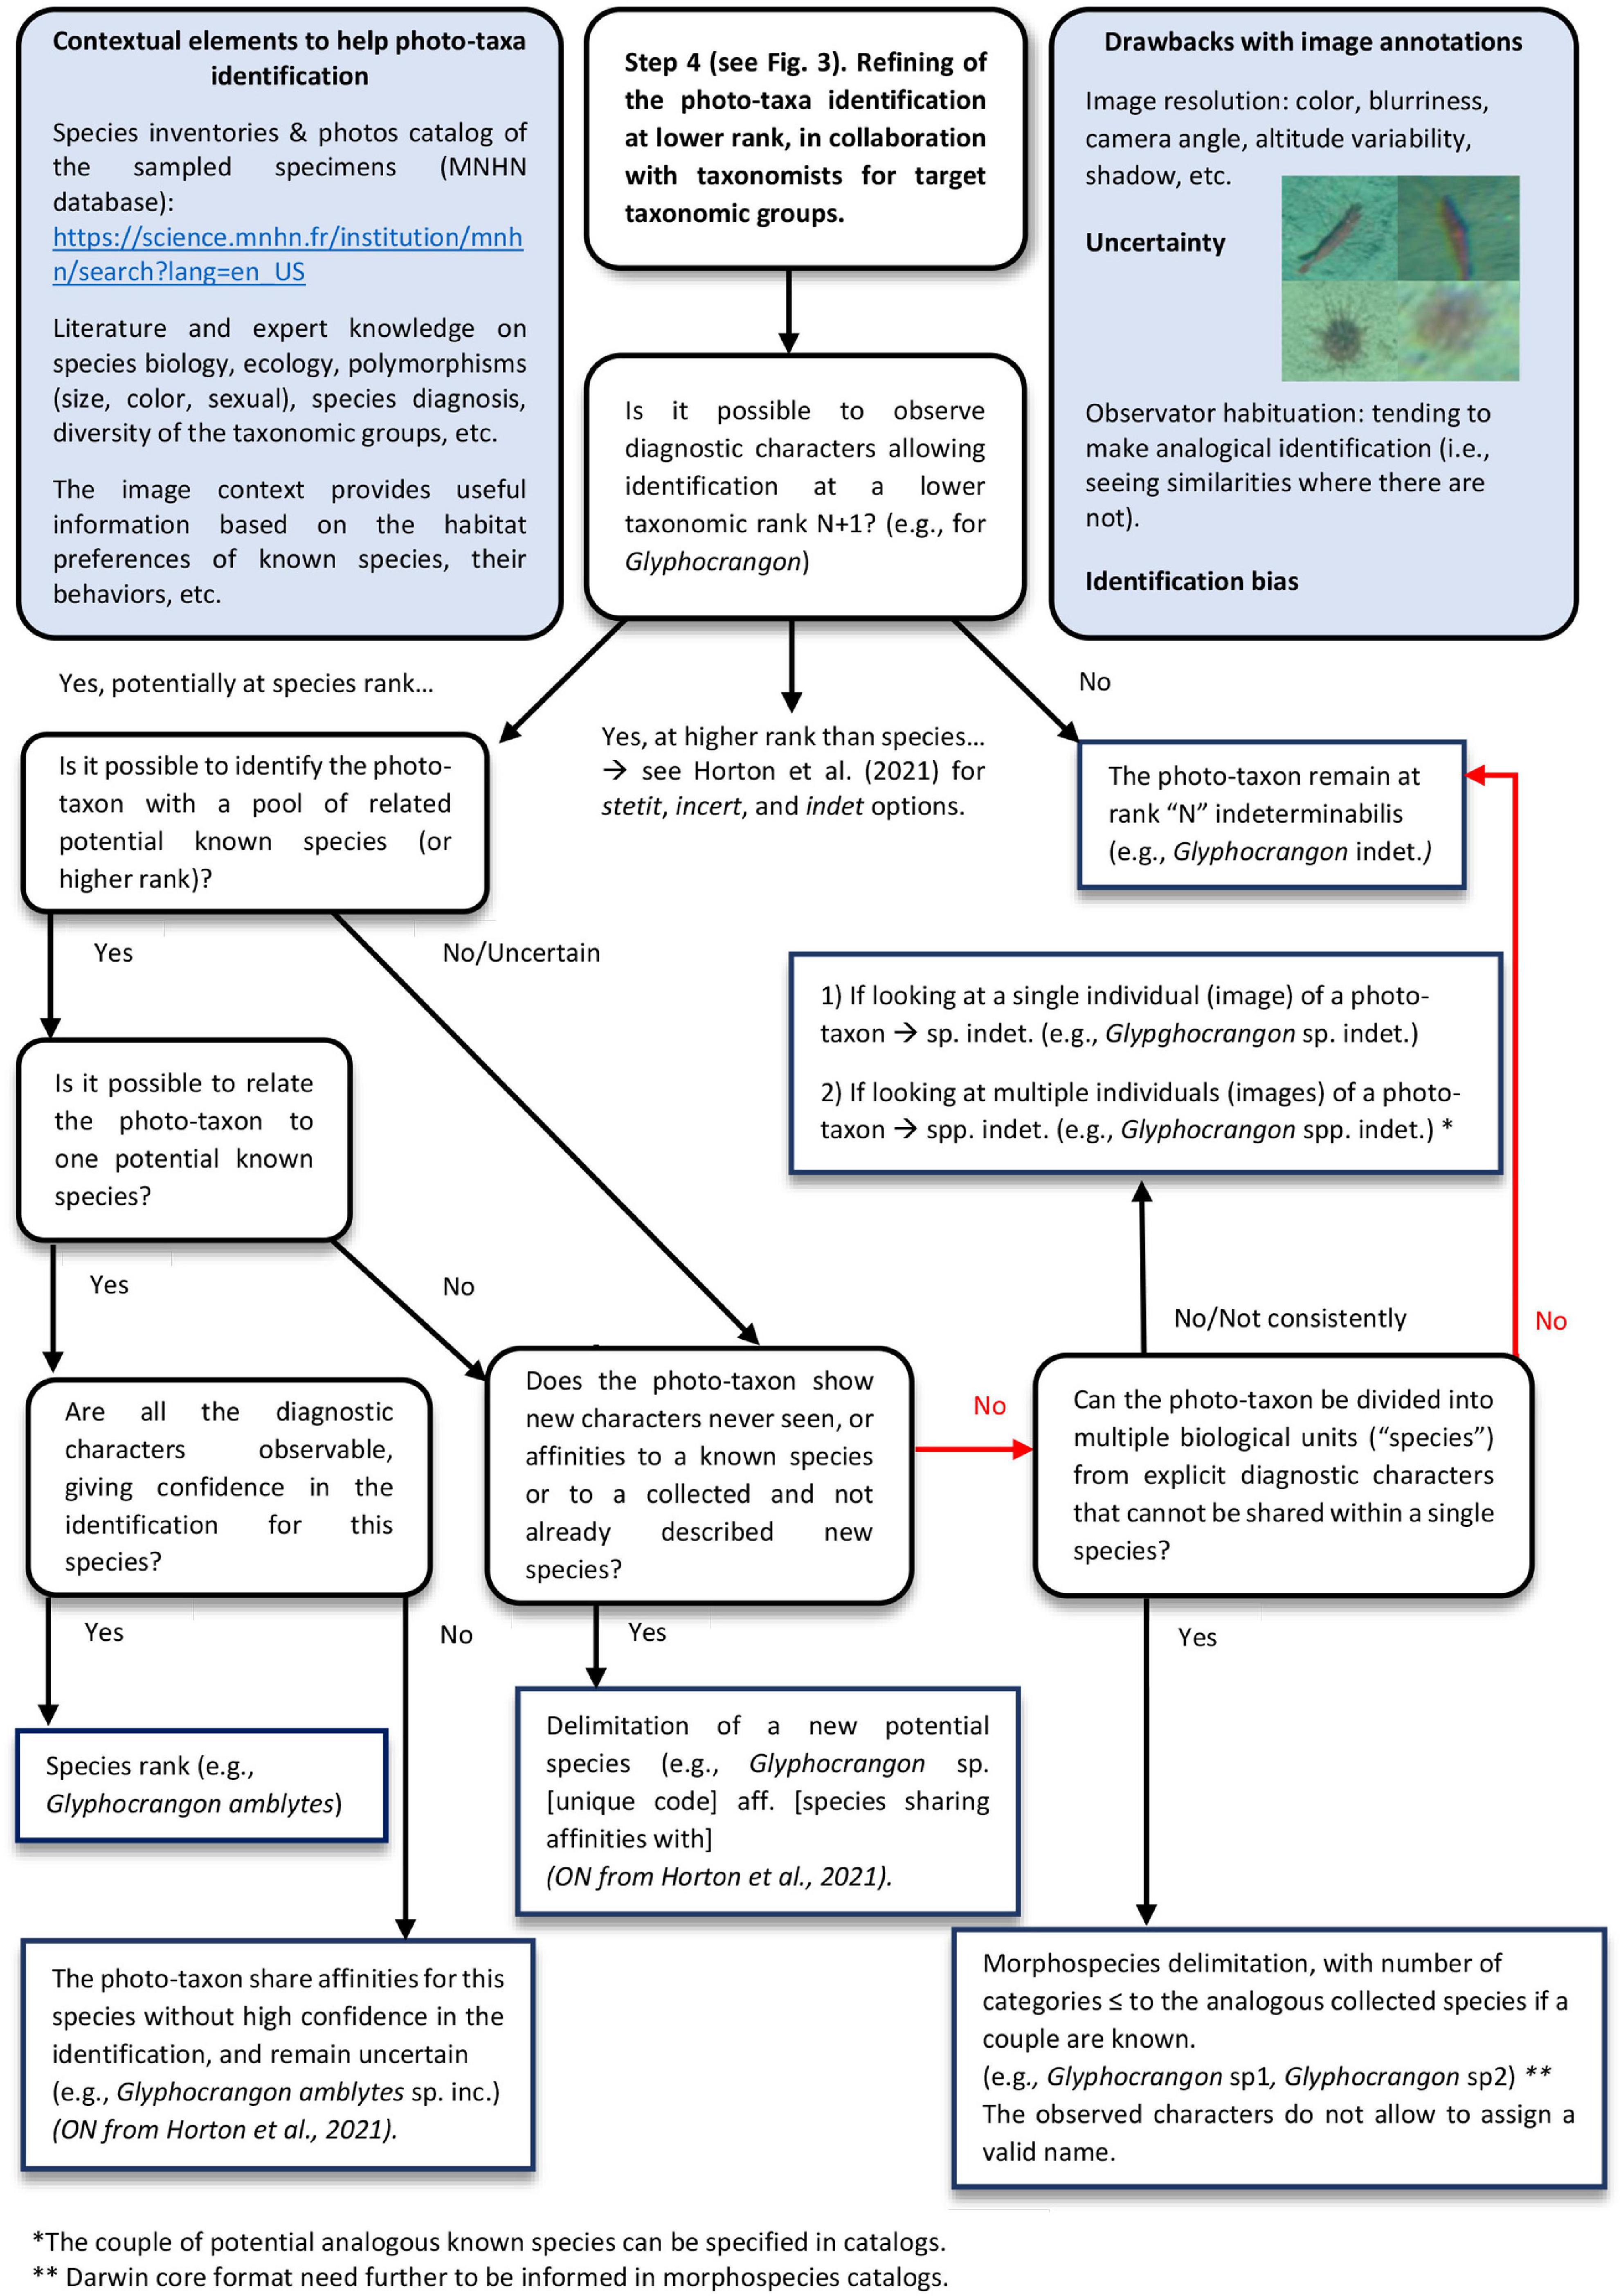
Figure 11. Integrative scheme for photo-taxa identification and nomenclature from images.
Open nomenclature (ON) provides a set of terms and their abbreviation (signs) to inform on the provisional uncertainty status of an identification (Sigovini et al., 2016).
However, the use of Sigovini et al. (2016) ON adapted to physical specimens, as recommended by Horton et al. for image identifications, requires the sampling of the specimens observed in images, which is possible using ROV but not using a towed camera. We can only make hypotheses of known analogous species to link the photo-taxa observed from images with the pool of species collected in the area and sharing similar diagnostic morphological or other characters. Although systematic collection by ROV of specimens observed in images is hardly feasible in highly diverse areas, and onerous, targeted sampling appears to be an efficient option to calibrate photo-taxa identification from images.
Furthermore, as mentioned by Horton et al. (2021), the choice of which ON signs to use will depend on the intended application (analyses, taxon catalogs, etc.) and in the case of community matrix/ecological analyses, that a taxonomic roll-up (merge taxa to higher taxonomic rank) to the most confident identification should be processed. We therefore recommend setting, for each taxonomic group to be analyzed, a threshold taxonomic identification rank enabling to avoid the use of “incertae” ON signs. Using such threshold for the identification rank, the community structure analyses can be robustly conducted. The robustness of this community analysis will rest on the consistency of the taxonomic rank reached within a given taxonomic group. The selection of this threshold depends on the taxonomic group considered, the level of knowledge of the taxa occurring in the area and on the morphological criteria detectable from images. The morphospecies rank can be considered in these analyses if they are confidently delimited and validated by a taxonomy expert.
However, in some cases, we determined the photo-taxa to the species rank, and based on affinities to collected specimens, we assigned them to a species name using “cf” or “aff” ON signs for the analogous species. We corrected the use of these ON signs for “sp incertae” following recommendation of Horton et al. (2021). For analysis, the lack of distinction between uncertainty in the identifications at a given rank and uncertainty of the species name at the species rank can lead to a loss of information if roll-up every photo-taxon assigned to “incertae” ON sign. Therefore, these species, despite uncertain identification, can be included in species rank analyses.
Finally, the keys help mainly for identification at the family or the genus levels. Sometimes morphospecies level delimitations are suggested or, at least, a set of observable morphological characters of the morphospecies are listed in the key. Such indications should help the delimitation of morphospecies in future studies. However, the naming convention for certain morphospecies in this study will certainly not be the same in another study. There is a need for future studies to develop identification keys in other oceanic regions, systematically accompanied by a morphospecies catalog—if morphospecies are delimited—and by listing the corresponding, potentially analogous known species in the area. The identification keys and the morphospecies catalog should both relied on the standardized database of marine taxa image catalog developed by Howell et al. (2019) in the Atlantic region, and using a Darwin Core format.
Conclusion
Imagery and physical sampling have benefits and biases that influence the estimated patterns of biodiversity. The taxonomic level of identification, the studied taxonomic groups and habitat type are important elements to be considered. Each of these choices needs to be carefully considered according to the questions addressed by the study but also by the costs and the environmental issues.
In poorly explored areas with poorly known fauna, processing taxon identification from images is very difficult and could lead to potential important misidentifications. Our study shows that deploying imagery-based studies require prior extensive physical sampling to establish a baseline knowledge of the species occurences in the area. To assess the pattern of benthic megafauna communities, in homogeneous or soft-bottom habitats, dredges and trawls seem to be more suitable options than towed camera. In such environments, image acquisition is a supplementary approach to check for the absence of more complex structures formed by engineer species. In more heterogeneous habitats, such as cold seeps or hard-substrate environments composed of fragile biotic habitats (corals, sponges), imagery should be favored and supplemented with limited physical sampling effort. Ideally, targeted sampling by ROV should be preferred, including new robotic hands or “needle-biopsy” samplers for a minimally invasive sampling (Pomponi, 2016), but this recommendation cannot be generalized due to its implementation cost.
Imagery and physical sampling are complementary methods and using both together will improve assessments of benthic megafauna community patterns. These elements are important to consider for establishing policy management in environments increasingly threatened by anthropic activities, such as Astrolabe Bay, where the Ramu refinery activity could lead to potentially destructive impacts (Samadi et al., 2015) or in the context of the Mayotte Natural Marine Park. From these complementary methods, we propose an integrative methodological approach to process faunal identification from images, based on contextual tools and supported by a taxonomical framework.
Above all, the difficulty of carrying out identification from images raises the necessity of collaborative work with taxonomists. Their expertise is essential for assessing the quality and the validity of the identification, at the lowest taxonomic level possible. This complexity reveals the need to focus on specific taxonomic groups that present observable morphological characters from images and the need to set a reasonable and robust level of identification. Such considerations require the involvement in the study of taxonomists to identify collected specimens and photo-taxa (specimens in images). This methodology has led to the development of identification keys adapted for imagery data, for target taxonomic groups (echinoids, asteroids and shrimps). Improvement of image resolution and different camera angles could offer interesting perspective to improve megafauna’ identification from images, and for instance, to develop identification keys for fish. The combination of image acquisition with targeted sampling is also a crucial way for the calibration of the identification. Finally, these identification keys were developed from the Mozambique Channel seamount fauna dataset and could be extended to other areas of the Indo-West Pacific region, through further international collaborative effort.
Data Availability Statement
The original contributions presented in the study are included in the article/Supplementary Material, further inquiries can be directed to the corresponding author/s.
Author Contributions
KO, LC, and SS designed the sampling and led the data acquisition. MH-P, KO, and LC analyzed the data. MH-P, KO, and CB processed the images. T-YC, LC, TS, W-JC, M-YL, J-NC, CM, and MH-P identified taxa in the images and constructed the identification keys. MH-P, KO, and SS wrote the manuscript. KO, SS, LC, T-YC, TS, W-JC, and M-YL contributed to the critical revision of the manuscript. KO and SS are Ph.D. supervisors. All authors contributed to the article and approved the submitted version.
Funding
The BioMaGlo cruise and project was supported by funding from the Xth European Development Fund (Fonds Européen de Développement; FED) “sustainable management of the natural heritage of Mayotte and the Eparses Islands” program led by the French Southern and Antarctic Lands (Terres australes et antarctiques françaises; TAAF) with the support of the Mayotte Departmental Council (Conseil Départemental de Mayotte), the French Development Agency (Agence Française de Développement; AFD) and the European Union. Collaboration with Taiwan was supported by funding from the Ministry of Science and Technology, Taiwan (MOST 102-2923-B-002-001-MY3, MOST 107-2611-M-002-007- and MOST 108-2611-M-002-012-MY2 to W-JC) and the French National Research Agency (ANR 12-ISV7-0005-01 to SS) and the Center of Excellence for the Oceans, National Taiwan Ocean University to T-YC. The thesis of MH-P is co-funded by TOTAL and IFREMER as part of the PAMELA (Passive Margin Exploration Laboratories) scientific project.
Conflict of Interest
The authors declare that the research was conducted in the absence of any commercial or financial relationships that could be construed as a potential conflict of interest.
Publisher’s Note
All claims expressed in this article are solely those of the authors and do not necessarily represent those of their affiliated organizations, or those of the publisher, the editors and the reviewers. Any product that may be evaluated in this article, or claim that may be made by its manufacturer, is not guaranteed or endorsed by the publisher.
Acknowledgments
We would like to thank the officers and crews of RV’s ANTEA and ALIS as well as the SCAMPI towed-camera team for their contribution and assistance with data acquisition. We are grateful to the chief scientists of the Madeep, BioMaGlo, BioPapua, and Papua Niugini cruises as well as the entire scientific team. Moreover, we would like to thank J. Tourolle for the helping and assisting in the analysis of GIS data, EJ. Pernet for the processing of the fauna samples, L. Keszler for the primary annotation of the BioMaGlo campaign images. We are grateful to T. Nattkemper and D. Langenkämper for allowing the loading of the image data and their annotation with Biigle 2.0 and for their technical support. We are particularly grateful to all the taxonomists who have contributed to the identification of the fauna in the images and in the collections: N. Puillandre (gastropods), P. Maestratti (bivalves), E. Pante and D. Pica (cnidarians), P. Cardenas and C. Debitus (poriferans), P. Giannassi (fishes), E. Macpherson (galatheids). This paper has been professionally edited for the English language by C. Engel-Gautier (CHRYSALIDE). Finally, we would like to thank the two reviewers for their critical comments that have contributed to improve the manuscript quality.
Supplementary Material
The Supplementary Material for this article can be found online at: https://www.frontiersin.org/articles/10.3389/fmars.2021.749078/full#supplementary-material
Supplementary Material 1 | Details of the working steps followed in the process of fauna identification from images.
Supplementary Material 2 | Decapoda identification key adapted for deep-sea images.
Supplementary Material 3 | Asteroidea identification key adapted for deep-sea images.
Supplementary Material 4 | Inventory of photo-taxa identified from images (dive) and of species collected along dive according to the target taxa and taxonomic rank: (A) along the PNG sedimented slopes and (B) along Mayotte volcanic outer slopes.
Supplementary Material 5 | Datasets of sampled (from fishing gears) versus observed (from images) specimens in Papua New Guinea areas.
Supplementary Material 6 | Datasets of sampled (from fishing gears) versus observed (from images) specimens in Mayotte areas.
Supplementary Material 7 | Number of distinct taxa remained identified at each taxonomic rank according to the method (images = dive, sampling along dive = cl-dive), (A) along sedimented slopes (PNG) and (B) along volcanic island slopes dominated by hard bottom (Mayotte) with (C) a focus on echinoids and asteroids.
Supplementary Material 8 | Illustration of the integrative methodology for the galatheids identification from images at morphospecies rank, along the upper sedimented slopes of the Papua New Guinea.
Footnotes
- ^ https://expeditions.mnhn.fr/?lang=en_US
- ^ https://science.mnhn.fr/institution/mnhn/item/search/form?expedition=BIOMAGLO&image=on&lang=en_US
- ^ https://mozechinoids-deepsea-scampi.identificationkey.org
References
Agnarsson, I., and Kuntner, M. (2007). Taxonomy in a Changing World: seeking Solutions for a Science in Crisis. Syst. Biol. 56, 531–539. doi: 10.1080/10635150701424546
Althaus, F., Williams, A., Schlacher, T., Kloser, R., Green, M., Barker, B., et al. (2009). Impacts of bottom trawling on deep-coral ecosystems of seamounts are long-lasting. Mar. Ecol. Prog. Ser. 397, 279–294. doi: 10.3354/meps08248
Audru, J.-C., Guennoc, P., Thinon, I., and Abellard, O. (2006). Bathymay?: la structure sous-marine de Mayotte révélée par l’imagerie multifaisceaux. C. R. Geosci. 338, 1240–1249. doi: 10.1016/j.crte.2006.07.010
Barnes, D. K. A., and Bell, J. J. (2002). Coastal sponge communities of the West Indian Ocean: morphological richness and diversity. Afr. J. Ecol. 40, 350–359. doi: 10.1046/j.1365-2028.2002.00388.x
Beazley, L. I., Kenchington, E. L., Murillo, F. J., Sacau, M., and del, M. (2013). Deep-sea sponge grounds enhance diversity and abundance of epibenthic megafauna in the Northwest Atlantic. ICES J. Mar. Sci. 70, 1471–1490. doi: 10.1093/icesjms/fst124
Beisiegel, K., Darr, A., Gogina, M., and Zettler, M. L. (2017). Benefits and shortcomings of non-destructive benthic imagery for monitoring hard-bottom habitats. Mar. Pollut. Bull. 121, 5–15. doi: 10.1016/j.marpolbul.2017.04.009
Bouchet, P. (2009). MIRIKY Cruise, RV MIRIKY. Available online at: https://expeditions.mnhn.fr/campaign/miriky?lang=en_US (accessed October 19, 2021).
Bouchet, P., and Ramos, A. (2009). MAINBAZA Cruise, RV Vizcondede Eza. Available online at: https://expeditions.mnhn.fr/campaign/mainbaza?lang=en_US (accessed October 19, 2021).
Bouchet, P., Perez, T., and Le Gall, L. (2010). ATIMO VATAE cruise, RV Antea. doi: 10.17600/10110040
Bowden, D. A., Rowden, A. A., Leduc, D., Beaumont, J., and Clark, M. R. (2016). Deep-sea seabed habitats: do they support distinct mega-epifaunal communities that have different vulnerabilities to anthropogenic disturbance? Deep Sea Res. I Oceanogr. Res. Pap. 107, 31–47. doi: 10.1016/j.dsr.2015.10.011
Braga-Henriques, A., Porteiro, F. M., Ribeiro, P. A., de Matos, V., Sampaio, I., Ocaña, O., et al. (2013). Diversity, distribution and spatial structure of the cold-water coral fauna of the Azores (NE Atlantic). Biogeosciences 10, 4009–4036. doi: 10.5194/bg-10-4009-2013
Buhl-Mortensen, L., Vanreusel, A., Gooday, A. J., Levin, L. A., Priede, I. G., Buhl-Mortensen, P., et al. (2010). Biological structures as a source of habitat heterogeneity and biodiversity on the deep ocean margins: biological structures and biodiversity. Mar. Ecol. 31, 21–50. doi: 10.1111/j.1439-0485.2010.00359.x
Burukovsky, R. N. (2011). Geographic distribution of nematocarcinidae shrimps (Crustacea. Decapoda). Zool. Zh. 90, 293–301.
Burukovsky, R. N. (2013). “Shrimps of the family Nematocarcinidae Smith, 1884 (Crustacea, Decapoda, Caridea) from Taiwan and the Philippines collected by the TAIWAN, PANGLAO 2005 and AURORA expeditions in the western Pacific,” in Tropical Deep-Sea Benthos 27, eds S. T. Ahyong, T.-Y. Chan, L. Corbari, and P. K. L. Ng (New York: Mémoires du Muséum national d’Histoire naturelle), 154–189.
Clark, M. R., Consalvey, M., and Rowden, A. A. (eds) (2016). Biological Sampling In The Deep Sea. New Jersey: Wiley-Blackwell.
Collins, P., Kennedy, R., and Van Dover, C. (2012). A biological survey method applied to seafloor massive sulphides (SMS) with contagiously distributed hydrothermal-vent fauna. Mar. Ecol. Prog. Ser. 452, 89–107. doi: 10.3354/meps09646
R Core Team (2020). R: A language and environment for statistical computing. Vienna: R Foundation for Statistical Computing.
Cunha, M. R., Hilário, A., and Santos, R. S. (2017). Advances in deep-sea biology: biodiversity, ecosystem functioning and conservation. An introduction and overview. Deep Sea Res. II Top. Stud. Oceanogr. 137, 1–5. doi: 10.1016/j.dsr2.2017.02.003
Da Ros, Z., Dell’Anno, A., Morato, T., Sweetman, A. K., Carreiro-Silva, M., Smith, C. J., et al. (2019). The deep sea: the new frontier for ecological restoration. Mar. Policy 108:103642. doi: 10.1016/j.marpol.2019.103642
Danovaro, R., Snelgrove, P. V. R., and Tyler, P. (2014). Challenging the paradigms of deep-sea ecology. Trends Ecol. Evol. 29, 465–475. doi: 10.1016/j.tree.2014.06.002
de Mendonça, S. N., and Metaxas, A. (2021). Comparing the Performance of a Remotely Operated Vehicle, a Drop Camera, and a Trawl in Capturing Deep-Sea Epifaunal Abundance and Diversity. Front. Mar. Sci. 8:631354. doi: 10.3389/fmars.2021.631354
Denis, V., Ribas-Deulofeu, L., Sturaro, N., Kuo, C.-Y., and Chen, C. A. (2017). A functional approach to the structural complexity of coral assemblages based on colony morphological features. Sci. Rep. 7:9849. doi: 10.1038/s41598-017-10334-w
Dray, S., and Dufour, A. (2007). The ade4 Package: implementing the Duality Diagram for Ecologists. J. Stat. Softw. 22, 1–20. doi: 10.18637/jss.v022.i04
Durden, J. M., Schoening, T., Althaus, F., Friedman, A., Garcia, R., Glover, A. G., et al. (2016b). Perspectives in visual imaging for marine biology and ecology: from acquisition to understanding. Oceanogr. Mar. Biol. 54, 1–72. doi: 10.1201/9781315368597
Durden, J. M., Bett, B., Schoening, T., Morris, K., Nattkemper, T., and Ruhl, H. (2016a). Comparison of image annotation data generated by multiple investigators for benthic ecology. Mar. Ecol. Prog. Ser. 552, 61–70. doi: 10.3354/meps11775
Fontaine, B., Perrard, A., and Bouchet, P. (2012). 21 years of shelf life between discovery and description of new species. Curr. Biol. 22, R943–R944. doi: 10.1016/j.cub.2012.10.029
Food and Agriculture Organization of the United Nations [FAO] (2009). International guidelines for the management of deep-sea fisheries in the high seas: Directives internationales sur la gestion de la pêche profonde en haute mer. Rome: Food and Agriculture Organization of the United Nations.
Grassle, J. F., Sanders, H. L., Hessler, R. R., Rowe, G. T., and McLellan, T. (1975). Pattern and zonation: a study of the bathyal megafauna using the research submersible Alvin. Deep Sea Res. Oceanogr. Abstr. 22, 457–481. doi: 10.1016/0011-7471(75)90020-0
Hagedorn, G., Rambold, G., and Martellos, S. (2010). “Types of identification keys,” in Proceedings of Bioidentify eu: Tools for Identifying Biodiversity: Progress and Problems, eds P. L. Nimis and R. Vignes Lebbe (Trieste: Edizioni Università di Trieste), 59–64.
Henry, L.-A., and Roberts, J. M. (2014). Recommendations for best practice in deep-sea habitat classification: Bullimore et al. as a case study. ICES J. Mar. Sci. 71, 895–898. doi: 10.1093/icesjms/fst175
Horton, T., Marsh, L., Bett, B. J., Gates, A. R., Jones, D. O. B., Benoist, N. M. A., et al. (2021). Recommendations for the Standardisation of Open Taxonomic Nomenclature for Image-Based Identifications. Front. Mar. Sci. 8:620702. doi: 10.3389/fmars.2021.620702
Howell, K. L., Bullimore, R. D., and Foster, N. L. (2014). Quality assurance in the identification of deep-sea taxa from video and image analysis: response to Henry and Roberts. ICES J. Mar. Sci. 71, 899–906. doi: 10.1093/icesjms/fsu052
Howell, K. L., Davies, J. S., Allcock, A. L., Braga-Henriques, A., Buhl-Mortensen, P., Carreiro-Silva, M., et al. (2019). A framework for the development of a global standardised marine taxon reference image database (SMarTaR-ID) to support image-based analyses. PLoS One 14:e0218904. doi: 10.1371/journal.pone.0218904
Hoyoux, C., Zbinden, M., Samadi, S., Gaill, F., and Compère, P. (2012). Diet and gut microorganisms of Munidopsis squat lobsters associated with natural woods and mesh-enclosed substrates in the deep South Pacific. Mar. Biol. Res. 8, 28–47. doi: 10.1080/17451000.2011.605144
Katzschmann, R. K., DelPreto, J., MacCurdy, R., and Rus, D. (2018). Exploration of underwater life with an acoustically controlled soft robotic fish. Sci. Robot. 3:eaar3449. doi: 10.1126/scirobotics.aar3449
Komai, T., and Chan, T.-Y. (2013). “New records of Glyphocrangon A. Milne-Edwards, 1881 (Crustacea, Decapoda, Caridea, Glyphocrangonidae) from recent French expeditions off the Mozambique Channel and Papua New Guinea, with description of one new species,” in Tropical Deep-Sea Benthos 27, eds S. T. AHYONG, T.-Y. CHAN, L. CORBARI, and P. K. L. NG (New York: Mémoires du Muséum national d’Histoire naturelle), 107–128.
Krell, F.-T. (2004). Parataxonomy vs. taxonomy in biodiversity studies – pitfalls and applicability of ‘morphospecies’ sorting. Biodivers. Conserv. 13, 795–812. doi: 10.1023/B:BIOC.0000011727.53780.63
Kroh, A., and Smith, A. B. (2010). The phylogeny and classification of post-Palaeozoic echinoids. J. Syst. Palaeontol. 8, 147–212. doi: 10.1080/14772011003603556
Langenkämper, D., Zurowietz, M., Schoening, T., and Nattkemper, T. W. (2017). BIIGLE 2.0 - Browsing and Annotating Large Marine Image Collections. Front. Mar. Sci. 4:83. doi: 10.3389/fmars.2017.00083
Laschi, C., and Calisti, M. (2021). Soft robot reached the deepest part of the ocean. Nature 591, 35–36. doi: 10.1038/d41586-021-00297-4
Legendre, P. (2014). Interpreting the replacement and richness difference components of beta diversity: replacement and richness difference components. Glob. Ecol. Biogeogr. 23, 1324–1334. doi: 10.1111/geb.12207
Legendre, P., and Gallagher, E. D. (2001). Ecologically meaningful transformations for ordination of species data. Oecologia 129, 271–280. doi: 10.1007/s004420100716
Levin, L. A. (2005). Ecology of cold seep sediments: interactions of fauna with flow, chemistry and microbes. Oceanogr. Mar. Biol. Annu. Rev. 43, 1–46.
Levin, L. A., and Le Bris, N. (2015). The deep ocean under climate change. Science 350, 766–768. doi: 10.1126/science.aad0126
Levin, L. A., and Sibuet, M. (2012). Understanding Continental Margin Biodiversity: a New Imperative. Annu. Rev. Mar. Sci. 4, 79–112. doi: 10.1146/annurev-marine-120709-142714
Mah, C. L. (2007). Phylogeny of the Zoroasteridae (Zorocallina; Forcipulatida): evolutionary events in deep-sea Asteroidea displaying Palaeozoic features. Zool. J. Linn. Soc. 150, 177–210. doi: 10.1111/j.1096-3642.2007.00291.x
Mah, C. L. (2020). New species, occurrence records and observations of predation by deep-sea Asteroidea (Echinodermata) from the North Atlantic by NOAA ship Okeanos Explorer. Zootaxa 4766, 201–260. doi: 10.11646/zootaxa.4766.2.1
McClain, C. R., Lundsten, L., Ream, M., Barry, J., and DeVogelaere, A. (2009). Endemicity, Biogeography, Composition, and Community Structure On a Northeast Pacific Seamount. PLoS One 4:e4141. doi: 10.1371/journal.pone.0004141
Muséum national d’Histoire naturelle (2019). Repository of collection surveys. Available online at: http://expeditions.mnhn.fr. - V 2.22.0 (accessed April 15, 2021).
Nybakken, J., Craig, S., Smith-Beasley, L., Moreno, G., Summers, A., and Weetman, L. (1998). Distribution density and relative abundance of benthic invertebrate megafauna from three sites at the base of the continental slope off central California as determined by camera sled and beam trawl. Deep Sea Res. II Top. Stud. Oceanogr. 45, 1753–1780. doi: 10.1016/S0967-0645(98)80016-7
Obura, D. (2012). The Diversity and Biogeography of Western Indian Ocean Reef-Building Corals. PLoS One 7:e45013. doi: 10.1371/journal.pone.0045013
Obura, D., Church, J., Gabrié, C., and Macharia, D. (2012). Assessing Marine World Heritage from an Ecosystem Perspective: the Western Indian Ocean. Paris: United Nations Education, Science and Cultural Organization (UNESCO), 125.
O’Hara, T. D., Hugall, G., Andrew, F., Woolley, S. N. C., Bribiesca-Contreras, G., and Bax, N. J. (2019). Contrasting processes drive ophiuroid phylodiversity across shallow and deep seafloors. Nature 565, 636–639.
O’Hara, T. D., Williams, A., Woolley, S. N. C., Nau, A. W., and Bax, N. J. (2020). Deep-sea temperate-tropical faunal transition across uniform environmental gradients. Deep Sea Res. I Oceanogr. Res. Pap. 161:103283. doi: 10.1016/j.dsr.2020.103283
Oksanen, J., Blanchet, F. G., Friendly, M., Kindt, R., Legendre, P., and McGlinn, D. (2019). vegan: Community Ecology Package. R package version 2.5-6.
Pante, E., Corbari, L., Thubaut, J., Chan, T.-Y., Mana, R., Boisselier, M.-C., et al. (2012). Exploration of the Deep-Sea Fauna of Papua New Guinea. Oceanography 25, 214–225. doi: 10.5670/oceanog.2012.65
Pante, E., and Watling, L. (2012). Chrysogorgia from the New England and Corner Seamounts: atlantic–pacific connections. J. Mar. Biol. Assoc. U. K. 92, 911–927. doi: 10.1017/S0025315411001354
Payri, C., Archambault, P., and Samadi, S. (2012). MADANG 2012 cruise, RV Alis. doi: 10.17600/18000841
Pomponi, A. S. (2016). Emerging Technologies for Biological Sampling in the Ocean. National Ocean Exploration Forum 2016. Available online at: https://oceanexplorer.noaa.gov/national-forum/media/noef-2016-pomponi.pdf (accessed September 30, 2021).
Ramirez-Llodra, E., Tyler, P. A., Baker, M. C., Bergstad, O. A., Clark, M. R., Escobar, E., et al. (2011). Man and the Last Great Wilderness: human Impact on the Deep Sea. PLoS One 6:e22588. doi: 10.1371/journal.pone.0022588
Rice, A., Aldred, R., Darlington, E., and Wild, R. (1982). The quantitative estimation of the deep-sea megabenthos - a new approach to an old problem. Oceanol. Acta 5, 63–72.
Robert, K., Jones, D., and Huvenne, V. (2014). Megafaunal distribution and biodiversity in a heterogeneous landscape: the iceberg-scoured Rockall Bank, NE Atlantic. Mar. Ecol. Prog. Ser. 501, 67–88. doi: 10.3354/meps10677
Samadi, S., Puillandre, N., Pante, E., Boisselier, M.-C., Corbari, L., Chen, W.-J., et al. (2015). Patchiness of deep-sea communities in Papua New Guinea and potential susceptibility to anthropogenic disturbances illustrated by seep organisms. Mar. Ecol. 36, 109–132. doi: 10.1111/maec.12204
Saucède, T., Eléaume, M., Jossart, Q., Moreau, C., Downey, R., Bax, N., et al. (2020). Taxonomy 2.0: computer-aided identification tools to assist Antarctic biologists in the field and in the laboratory. Antarct. Sci. 33, 39–51. doi: 10.1017/S0954102020000462
Schlacher, T. A., Williams, A., Althaus, F., and Schlacher-Hoenlinger, M. A. (2010). High-resolution seabed imagery as a tool for biodiversity conservation planning on continental margins: submarine canyon megabenthos and conservation planning. Mar. Ecol. 31, 200–221. doi: 10.1111/j.1439-0485.2009.00286.x
Schonberg, C. H. L. (2021). No taxonomy needed: sponge functional morphologies inform about environmental conditions. Ecol. Indic. 129:107806. doi: 10.1016/j.ecolind.2021.107806
Schonberg, C. H. L., and Fromont, J. (2014). Sponge functional growth forms as a means for classifying sponges without taxonomy. Available online at: https://www.researchgate.net/publication/278627643_Sponge_functional_growth_forms_as_a_means_for_classifying_sponges_without_taxonomy (accessed June 22, 2020).
Sibuet, M., and Olu, K. (1998). Biogeography, biodiversity and fluid dependence of deep-sea cold-seep communities at active and passive margins. Deep Sea Res. II Top. Stud. Oceanogr. 45, 517–567. doi: 10.1016/S0967-0645(97)00074-X
Sigovini, M., Keppel, E., and Tagliapietra, D. (2016). Open Nomenclature in the biodiversity era. Methods Ecol. Evol. 7, 1217–1225. doi: 10.1111/2041-210X.12594
Tappin, D. R., Watts, P., McMurtry, G. M., Lafoy, Y., and Matsumoto, T. (2001). The Sissano, Papua New Guinea tsunami of July 1998 − offshore evidence on the source mechanism. Mar. Geol. 175, 1–23.
Todd, P. A. (2008). Morphological plasticity in scleractinian corals. Biol. Rev. 83, 315–337. doi: 10.1111/j.1469-185X.2008.00045.x
Tregoning, P., McQueen, H., Lambeck, K., Jackson, R., Little, R., Saunders, S., et al. (2000). Present-day crustal motion in Papua New Guinea. Earth Planet Sp. 52, 727–730. doi: 10.1186/BF03352272
Tyler, P. A. (2003). “Introduction: Ecosystems of the world,” in Ecosystems of the Deep Oceans, ed. P. A. Tyler (Amsterdam: Elsevier), 1–5.
Van Dover, C. (2012). Hydrothermal Vent Ecosystems and Conservation. Oceanog 25, 313–316. doi: 10.5670/oceanog.2012.36
Veron, J. E. N., Devantier, L. M., Turak, E., Green, A. L., Kininmonth, S., Stafford-Smith, M., et al. (2009). Delineating the Coral Triangle. Galaxea. J. Coral Reef Stud. 11, 91–100. doi: 10.3755/galaxea.11.91
Vieira, P. E., Lavrador, A. S., Parente, M. I., Parretti, P., Costa, A. C., Costa, F. O., et al. (2021). Gaps in DNA sequence libraries for Macaronesian marine macroinvertebrates imply decades till completion and robust monitoring. Divers. Distrib. 27, 2003–2015. doi: 10.1111/ddi.13305
Walter, D. E., and Winterton, S. (2007). Keys and the Crisis in Taxonomy: extinction or Reinvention? Annu. Rev. Entomol. 52, 193–208. doi: 10.1146/annurev.ento.51.110104.151054
Warnes, R. G., Bolker, B., Bonebakker, L., Gentleman, R., Huber, W., and Liaw, A. (2020). gplots: Various R Programming Tools for Plotting Data. R package version 3.1.0.
Williams, A., Althaus, F., and Schlacher, T. A. (2015). Towed camera imagery and benthic sled catches provide different views of seamount benthic diversity: gear selectivity for seamount benthos. Limnol. Oceanogr. Methods 13:e10007. doi: 10.1002/lom3.10007
Wudrick, A., Beazley, L., Culwick, T., Goodwin, C., Cárdenas, P., Xavier, J., et al. (2020). A pictorial guide to the epibenthic megafauna of Orphan Knoll (northwest Atlantic) identified from in situ benthic video footage. Can. Tech. Rep. Fish. Aquat. Sci. 3375:154.
Keywords: deep-sea megafauna, image-based identification, biodiversity assessment, identification keys, integrative methodology, towed camera, physical sampling
Citation: Hanafi-Portier M, Samadi S, Corbari L, Chan T-Y, Chen W-J, Chen J-N, Lee M-Y, Mah C, Saucède T, Borremans C and Olu K (2021) When Imagery and Physical Sampling Work Together: Toward an Integrative Methodology of Deep-Sea Image-Based Megafauna Identification. Front. Mar. Sci. 8:749078. doi: 10.3389/fmars.2021.749078
Received: 28 July 2021; Accepted: 11 October 2021;
Published: 19 November 2021.
Edited by:
Ashley Alun Rowden, National Institute of Water and Atmospheric Research (NIWA), New ZealandReviewed by:
Franziska Althaus, Commonwealth Scientific and Industrial Research Organisation (CSIRO), AustraliaDamianos Chatzievangelou, Jacobs University Bremen, Germany
Copyright © 2021 This work 2021 by Hanafi-Portier, Samadi, Corbari, Chan, Chen, Chen, Lee, Mah, Saucède, Borremans and Olu is licensed under CC BY 4.0. To view a copy of this license, visit http://creativecommons.org/licenses/by/4.0/. This is an open-access article distributed under the terms of the Creative Commons Attribution License (CC BY). The use, distribution or reproduction in other forums is permitted, provided the original author(s) and the copyright owner(s) are credited and that the original publication in this journal is cited, in accordance with accepted academic practice. No use, distribution or reproduction is permitted which does not comply with these terms.
*Correspondence: Mélissa Hanafi-Portier, TWVsaXNzYS5IYW5hZmkuUG9ydGllckBpZnJlbWVyLmZy; aGFuYWZpbWVsaXNzYUBnbWFpbC5jb20=
†These authors have contributed equally to this work