 Eurico J. D’Sa
 Hyun-Cheol Kim
 Sun-Yong Ha
 Ishan Joshi
- 1Department of Oceanography and Coastal Sciences, Louisiana State University, Baton Rouge, LA, United States
- 2Korea Polar Research Institute, Incheon, South Korea
- 3Marine Physical Laboratory, Scripps Institution of Oceanography, University of California, San Diego, San Diego, CA, United States
The Ross Sea, one of the most productive regions in the Southern Ocean, plays a significant role in deep water formation and carbon cycling. Dissolved organic carbon (DOC) concentrations and chromophoric dissolved organic matter (CDOM) absorption and fluorescence (FDOM) properties were studied in conjunction with biophysical properties during austral summer. Elevated values of both DOC (mean 47.82 ± 5.70 μM) and CDOM (absorption coefficient at 325 nm, acdom325: mean 0.31 ± 0.18 m–1) observed in the upper shelf waters in the southwest (SW), north of the Ross Ice Shelf (RIS), the northwest and along a transect inward of the shelf break, suggested in situ production and accumulation linked to the productive spring/summer season. However, regional differences were observed in CDOM with acdom325 higher (0.63 ± 0.19 m–1) and its spectral slope S275–295 lower (24.06 ± 2.93 μm–1) in the SW compared to other regions (0.25 ± 0.08 m–1 and 28.92 ± 2.67 μm–1, respectively). Similarly, the specific UV absorption coefficient or SUVA254 determined at 254 nm was greater (1.85 ± 0.55 m2 mg–1 C) compared to other regions (1.07 ± 0.24 m2 mg–1 C), indicating CDOM of greater molecular weight and aromaticity in the SW. Phytoplankton absorption spectra indicated the shallow mixed layer of SW Ross Sea to be dominated by diatoms (e.g., Fragilariopsis spp.), a preferential food source for grazers such as the Antarctic krill, which in large numbers have been shown to enhance CDOM absorption, a likely source in the SW. Excitation-emission matrix (EEM) fluorescence combined with parallel factor analysis (PARAFAC) retrieved one protein-like and two humic-like FDOM fractions commonly observed in the global ocean. In contrast to acdom325 which was uncorrelated to DOC, we observed weak but significant positive correlations between the humic-like FDOM with salinity and DOC, high value of the biological index parameter BIX and an instance of increasing FDOM with depth at a location with sinking organic matter, suggesting autochthonous production of FDOM. The absorption budget showed a relatively higher contribution by CDOM (70.7 ± 18.3%) compared to phytoplankton (22.5 ± 15.2%) absorption coefficients at 443 nm with implications to ocean color remote sensing. This first study of DOM optical properties provides additional insights on carbon cycling in the Ross Sea.
Introduction
The Ross Sea, a highly productive region of the Southern Ocean, accounts for 25–30% of the annual Southern Ocean primary production and ∼25% of bottom waters formed globally (Orsi et al., 2002; Arrigo et al., 2008; Smith et al., 2014), thus playing an important role in the marine carbon cycle (DiTullio and Smith, 1996; Arrigo et al., 1999, 2008). Located north of the largest ice shelf in the world, the Ross Ice Shelf (RIS), is the largest polynya (a region of open water surrounded by sea ice), the Ross Sea polynya, associated with the formation of the high salinity and cold shelf water or the dense shelf water (DSW) owing to extensive brine release in the polynya during winter (Jacobs et al., 1970; Jacobs and Giulivi, 1998). The DSW sinks and eventually flows off the shelf contributing to the Antarctic Bottom Water (AABW), deep ocean circulation and carbon cycling (Budillon et al., 2003; Orsi and Wiederwohl, 2009; Bercovici et al., 2017). During austral spring and summer as the Ross Sea polynya expands due to increasing solar insolation and warming, extensive algal blooms occur that are dominated by the haptophyte Phaeocystis antarctica followed by increased phytoplankton growth of diatoms, mainly the Fragilariopsis species (Asper and Smith, 1999; Arrigo et al., 1999; Smith et al., 2014). Many insights into these bloom dynamics, which are often spatially and temporally distinct, have been obtained from numerous field (DiTullio and Smith, 1996; Smith et al., 1996; DiTullio et al., 2000; Sweeney et al., 2000) and satellite ocean color remote sensing studies (Arrigo et al., 1998a, 1999, 2000; Arrigo and Van Dijken, 2003; Park et al., 2019). These studies reported on two regions within the Ross Sea that exhibit physical and biogeochemical differences: (i) the weakly stratified and deeply mixed central Ross Sea polynya surface waters generally dominated by Phaeocystis antarctica, and (ii) the southwest (SW) marginal ice zone with intense surface stratification and shallow mixed layer depths dominated by diatoms. These recurrent and spatially variable distributions of phytoplankton biomass and taxa have important implications to food-web dynamics (Ainley et al., 2006; Davis et al., 2017), and the fate of dissolved (DOM) and particulate organic matter in the Ross Sea (Asper and Smith, 1999; Carlson et al., 2000; DiTullio et al., 2000; Carlson, 2002; Smith et al., 2011; Smith and Jones, 2015).
Phytoplankton production contributes to significant accumulation of newly produced dissolved (DOC) and particulate organic carbon (POC) in the surface ocean and its subsequent export to the deep ocean (Hansell and Carlson, 2001; Carlson, 2002). DOC derived from primary production may originate from several biological processes including direct phytoplankton exudation, grazing interactions and viral lysis, while DOM removal processes include microbial mineralization and photodegradation (Carlson, 2002; Jiao et al., 2010; Ruiz-Halpern et al., 2011; Carlson and Hansell, 2015). In the Ross Sea, DOC and POC concentrations in late winter have been observed to be at background levels of ∼42 and 3 μM, respectively (Carlson et al., 2000). An increase by as much as 30 and 107 μM of DOC and POC in excess of that observed in late winter has been linked to the high Ross Sea spring/summer production. However, the fraction of carbon fixed as DOC was found to be qualitatively more labile and enriched with nitrogen compared to the deeper refractory DOM (Carlson et al., 1998, 2000). In addition to the bulk analysis of DOC and dissolved organic nitrogen, other DOM constituents such as dissolved combined neutral sugars have been found to play an important role during the summer phytoplankton bloom in the Ross Sea (Kirchman et al., 2001). Although studies have hypothesized on the role of plankton community structure on DOC production and accumulation, the absence of large DOC accumulation within the Ross Sea has been attributed to low bacterial activity (Ducklow et al., 2001). More recently, Bercovici et al. (2017) showed that DOC produced in the Ross Sea enriches the dense shelf water (DSW) by ∼7 μM and contributes to the export of ∼4 Tg C yr–1 of DOC off the Ross Sea and into the abyssal Southern Ocean.
Chromophoric dissolved organic matter (CDOM), an optically active constituent of the DOM pool with absorption and fluorescent properties, could provide additional insights into DOM composition, source and dynamics in the Ross Sea. CDOM, a fraction of the DOM pool that absorbs UV and visible light, influences light penetration and primary productivity in aquatic ecosystems, plays a key role in photochemically induced transformations in surface waters, and acts as a ‘sunscreen’ protecting organisms from UV damage (Mopper and Kieber, 2002; Coble, 2007). Further, its absorption in the visible spectrum, especially in the blue band, tends to interfere with satellite ocean color estimates of chlorophyll a (D’Sa and Miller, 2003; D’Sa et al., 2006; Liu et al., 2021). CDOM is produced by a variety of autotrophic and heterotrophic organisms, influenced by physical processes such as circulation, upwelling and mixing and removed by photochemical degradation and microbial consumption (Blough and Del Vecchio, 2002; Nelson et al., 2004; Steinberg et al., 2004; Ortega-Retuerta et al., 2009; Romera-Castillo et al., 2010). CDOM absorption properties such as absorption coefficients at a specific wavelength and the slopes across specific regions of the optical absorption spectrum have been widely used to infer DOM sources and composition (Blough and Del Vecchio, 2002; D’Sa, 2008; Helms et al., 2008; D’Sa and DiMarco, 2009; Stedmon and Nelson, 2015; Hansen et al., 2016). CDOM abundance represented by absorption coefficient at 325 nm (acdom325) has been used to identify CDOM sources (Nelson et al., 2004), as a tracer of biochemical processes in the global ocean (Nelson et al., 2010; Catala et al., 2015) and to study its distribution and reactivity in the Southern Ocean (Ortega-Retuerta et al., 2010a; D’Sa and Kim, 2017). Absorption spectral indices such as the spectral slope S over narrow wavelength intervals (e.g., 275–295 nm; 350–400 nm) or their ratio (SR) provide information on CDOM photo-oxidative state, molecular size distribution, and microbial activity (Helms et al., 2008, 2013). The specific UV absorbance (SUVA) or the DOC normalized absorbance at 254 nm (SUVA254) is a useful parameter for estimating the dissolved aromatic content in aquatic systems (Weishaar et al., 2003). Although CDOM optical properties have been widely used to characterize DOM in aquatic systems, only a few studies have been reported for the Southern Ocean, including regions in the Antarctic Peninsula and Australasian sector (Clementson et al., 2001; Ortega-Retuerta et al., 2009, 2010a; Del Castillo and Miller, 2010) with limited measurements in the Ross Sea (Kieber et al., 2009; D’Sa and Kim, 2017). Experimental studies in the Southern Ocean waters around the Antarctic Peninsula have documented the photoreactive nature (photobleaching and photohumification) of CDOM (Ortega-Retuerta et al., 2010a), and contribution by bacterioplankton and Antarctic krill to CDOM and DOC (Ortega-Retuerta et al., 2009; Ruiz-Halpern et al., 2011), suggesting the important role of these processes in carbon cycling. Insights on the role of seasonal sea ice dynamics and related growth of different biological communities in regulating CDOM and particulate matter or CDM in waters around the Antarctic Peninsula have also been obtained at larger spatiotemporal scales using satellite ocean color (Ortega-Retuerta et al., 2010b). However, only limited information on the absorption characteristics of CDOM, phytoplankton and non-algal particles and their relative contributions to the total light absorption budget that determines the optical variability of oceanic waters and thus ocean color have been reported for the Southern Ocean (Arrigo et al., 1998b; Reynolds et al., 2001; Ortega-Retuerta et al., 2010b; Hirawake et al., 2011; Lee et al., 2011; D’Sa and Kim, 2017). Knowledge of absorption properties of CDOM and other absorbing constituents could enhance understanding of DOM composition and improve ocean color algorithms for the Ross Sea.
Fluorescent DOM (FDOM), a fraction of CDOM that fluoresces, has also provided insights into DOM composition (Coble, 1996, 2007; Stedmon and Nelson, 2015). Excitation-emission matrix spectroscopy (EEMs), wherein three-dimensional fluorescence measurements are performed across a range of excitation and emission wavelengths, are characterized by fluorescence in the UVA and visible spectral regions that have been associated with protein-like and humic-like fluorescent material (Coble, 2007; Stedmon and Nelson, 2015). Visible fluorescence is ubiquitous in all aquatic environments and spectral peaks observed in the EEMs spectra have been commonly referred to as A, C, and M (Murphy et al., 2018). Fluorescence observed with narrower peaks in the UVA spectral region has been associated with protein-like fluorescent material with characteristics similar to tryptophan- or T- and tyrosine-like amino acids likely derived from marine planktonic organisms or bacterial activity (Yamashita and Tanoue, 2003; Coble, 2007; Romera-Castillo et al., 2011). FDOM has also been investigated through molecular characterization of size fractions that suggest that DOM fluorescence characteristics may be controlled by molecular assemblies with similar optical properties and distributed along the molecular weight continuum (Romera-Castillo et al., 2014). The application of a multivariate tool such as parallel factor analysis (PARAFAC) to decompose a large EEM dataset into least-squares sum of several mathematically independent components allows for the efficient resolution and identification of different classes of fluorophores in an environment (Stedmon et al., 2003; Stedmon and Bro, 2008). Other fluorescent DOM compositional indicators obtained from the EEM spectra such as biological index (BIX) can also provide insights into the nature of the DOM pool (Huguet et al., 2009; Hansen et al., 2016). Although DOM fluorescence studies have been conducted in various regions of the Southern Ocean (Wedborg et al., 2007; Yamashita et al., 2007; D’Sa and Kim, 2017; Chen et al., 2019; Jeon et al., 2021), no such study has been reported for the Ross Sea. Thus, DOM fluorescence properties could further aid the characterization of the DOM pool in the Ross Sea.
In this study, we examine water column DOC concentrations, CDOM absorption (abundance, spectral slopes and ratios, UV specific absorption coefficient) and fluorescence (EEMs, PARAFAC components, BIX) properties in conjunction with biophysical (e.g., salinity, temperature, and chlorophyll) properties obtained during a field campaign in the Ross Sea conducted onboard the Korean ice breaker and research vessel Araon in the austral summer of 2014–2015. Spectral absorption properties of phytoplankton were also used to examine phytoplankton characteristics and to assess CDOM contribution to the total absorption budget, an important factor that influences ocean color algorithms. In addition, satellite-derived sea ice and chlorophyll estimates were used to assess synoptic large scale features to aid the interpretation of DOM optical data in the Ross Sea.
Materials and Methods
Study Area, Water Masses and Sampling
The Ross Sea lying to the north of the RIS in the Antarctic continental shelf has an average depth of ∼500 m with an irregular bottom topography characterized by several banks and troughs and a shelf break running NW-SE that corresponds to the 700 m isobath (Figure 1A). The hydrographic structure of the Ross Sea has been described in great detail in earlier studies (Budillon et al., 2003; Orsi and Wiederwohl, 2009). Briefly, meridional overturning brings the Circumpolar Deep Water (CDW: a relatively warm, salty and oxygen-poor layer within the Antarctic Circumpolar Current) poleward between the much colder Antarctic Surface Water (AASW) above and the AABW below (Orsi and Wiederwohl, 2009). The intrusion of CDW onto the Ross continental shelf (a source of heat and nutrients) and its interactions with the shelf waters results in the modified CDW (MCDW) which is characterized by a subsurface maximum temperature and minimum dissolved oxygen (Jacobs et al., 1985; Budillon et al., 2003). Sea-ice formation in the shelf transforms upper waters (either the near-freezing AASW or the shoaling MCDW) into cold, saltier and denser shelf water (DSW) which fills the bottom layer of the Ross Sea including under the RIS (Orsi and Wiederwohl, 2009).
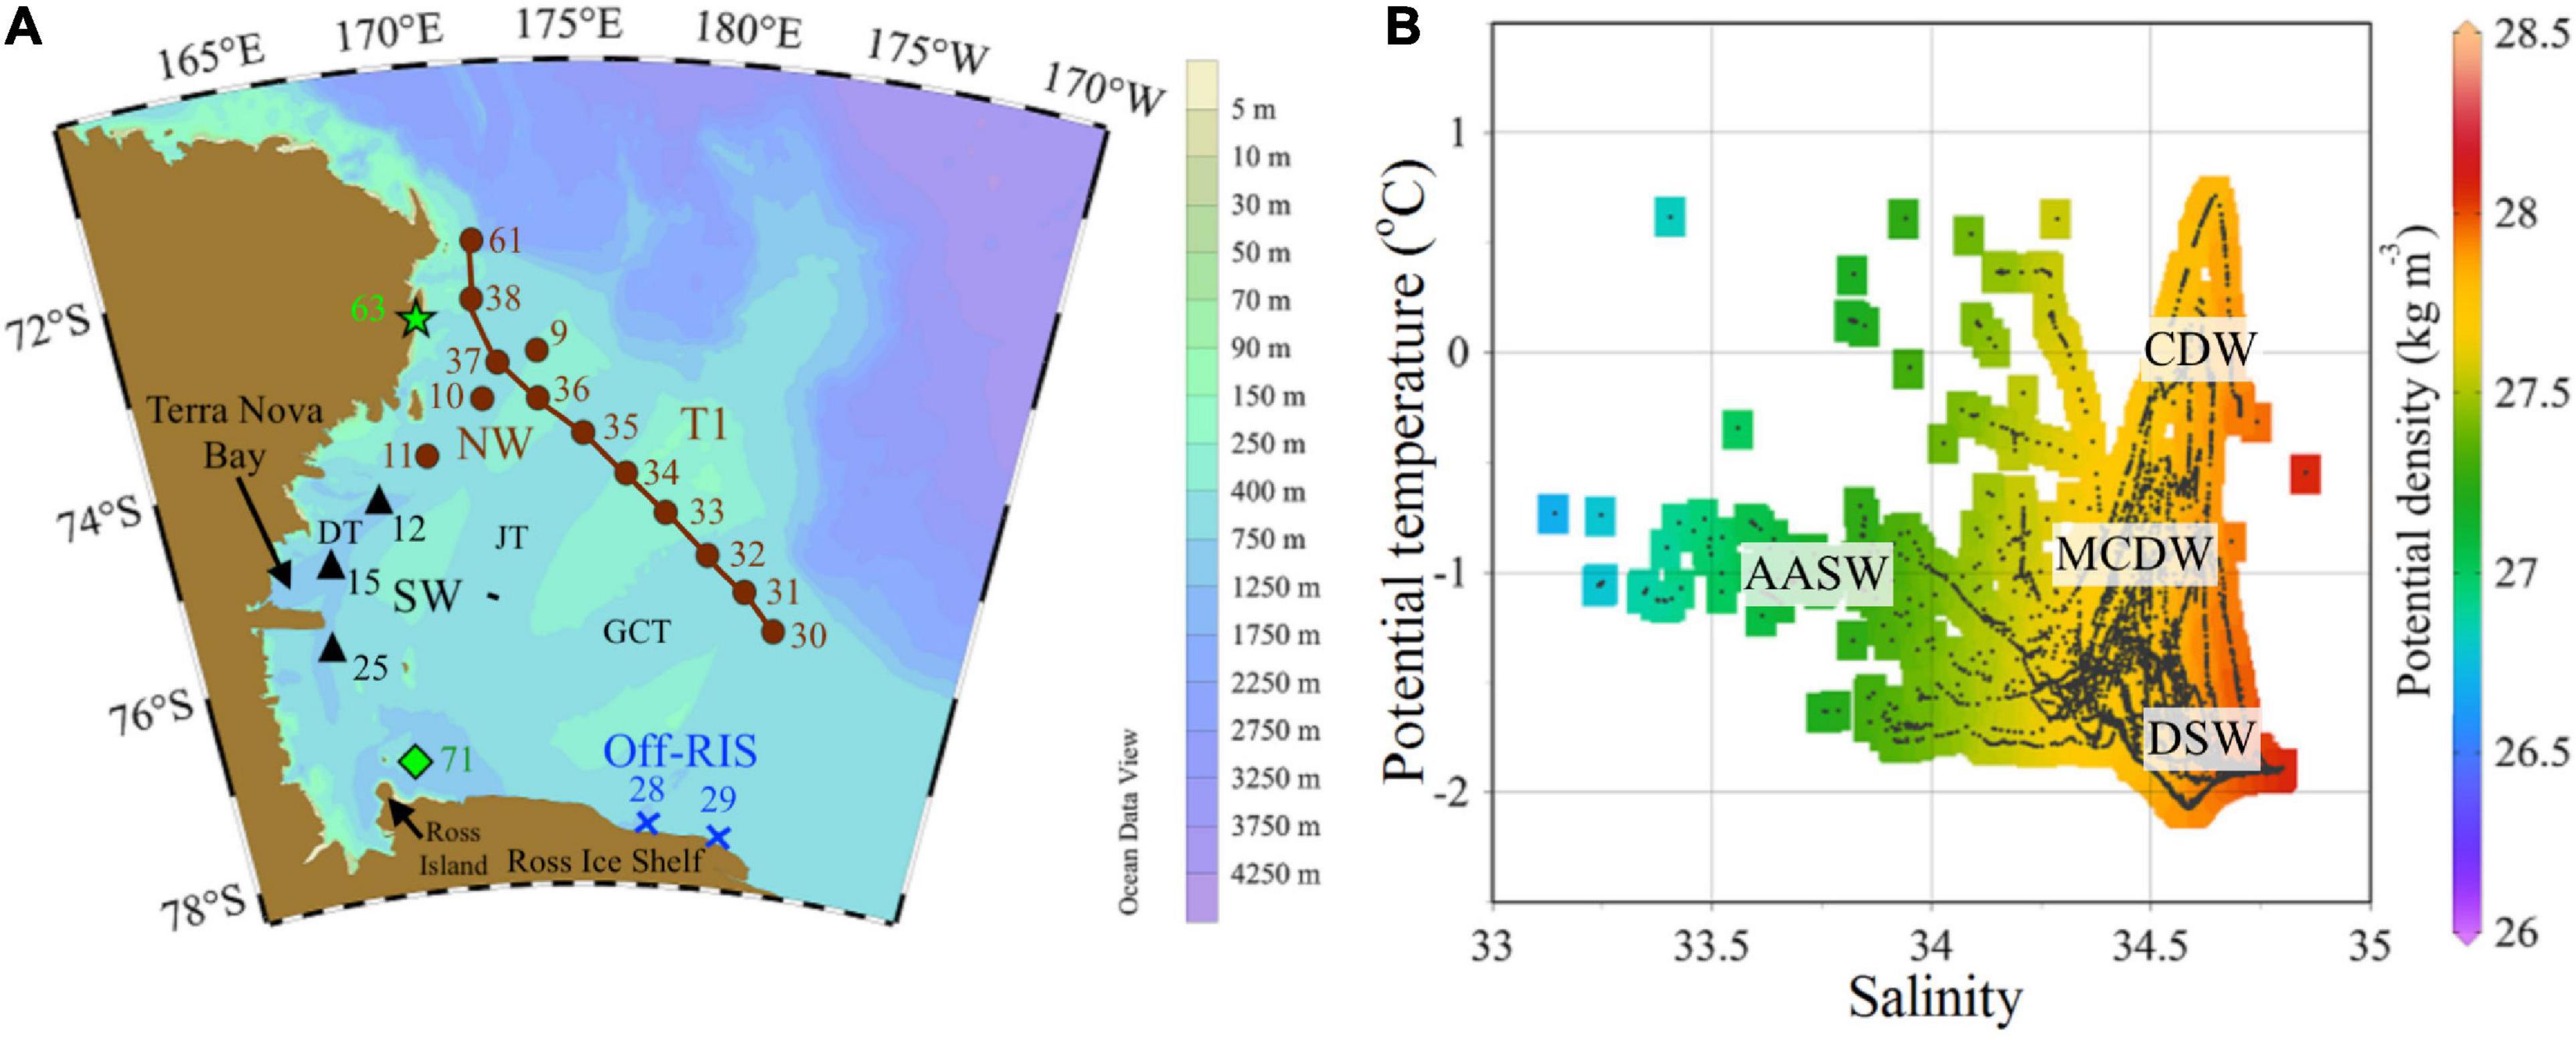
Figure 1. Study area. (A) The Ross Sea study area north of the Ross Ice Shelf (RIS) and east of Victoria Land showing sampling locations with stations labeled as: T1 (sts 30 to 38), northwest – NW (sts 9, 10, and 11), southwest – SW (sts 12, 15, and 25), north of Ross Ice Shelf – off-RIS (sts 28 and 29) and north of Ross Island (st 71). TNB–Terra Nova Bay; bathymetry shows the banks and three main troughs: Drygalski (DT), Joides (JT) and Glomar Challenger (GCT) Troughs. (B) Potential temperature–salinity diagram with isopycnals (σθ) obtained from CTD profiles at the sampling stations. Water masses CDW, MCDW, AASW and DSW as defined by Jacobs et al. (1985) and Orsi and Wiederwohl (2009).
Stations were occupied onboard the ice breaker RV Araon in the Ross Sea (Figure 1A) from January 11 to February 04, 2015 (austral summer). Transect stations (sts) were sampled east of Victoria Land from the northwest (NW: sts 9, 10, and 11) to southwest (SW: sts 12, 15, and 25), north of the Ross Ice Shelf (hereafter denoted as off-RIS: sts 28 and 29) and a transect T1 (sts 30–38) inshore of the shelf break. Two additional stations (st 63 in the NW and st 71 north of the Ross Island and RIS) were also sampled toward the end of the cruise. Physical data plotted from the CTD casts obtained during the approximately month-long field campaign show the presence of the main water masses (CDW, MCDW, DSW and AASW) at our sampling stations (Figure 1B).
Hydrography Data
Conductivity-temperature-depth (CTD) measurements in the water column were recorded using a CTD-Rosette system (Sea-Bird SBE-911plus). An oxygen sensor (SBE 43) and a chlorophyll fluorescence sensor (WET Labs ECO-AFL/FL) were connected to the CTD system for dissolved oxygen and chlorophyll fluorescence measurements. The WET labs fluorescence sensor was factory calibrated for chlorophyll a. All data were averaged into 1-m depth intervals to reduce noise. For measurements of DOC concentrations and optical measurements (CDOM absorption and fluorescence; particulate absorption) samples were collected at multiple depths in the water column (usually at surface, 10/20, 50, 100, and 150 m; and few stations up to 200 m) using CTD-mounted Niskin water samplers. All samples were processed in the laboratory within ∼4 months of sample collection. However, due to the long duration of the field campaign, samples for CDOM absorption and fluorescence were processed in the laboratory between 3.0 to 3.6 months after sampling. While this strategy ensured any bio-alteration of the optical signals to be consistent across the samples, it could likely cause preferential removal of the bio-labile components.
Dissolved Organic Carbon Measurements
Samples for DOC were filtered through pre-rinsed Whatman GF/F filters and stored in acid cleaned, pre-combusted amber bottles with Teflon-lined caps. Laboratory measurements of DOC were made on a Shimadzu TOC 5000A (with ASI-5000A autosampler) using a high temperature combustion method to convert carbon compounds to carbon dioxide, including using the Consensus Reference Material (CRM) for QA/QC (Benner and Strom, 1993; Hansell and Carlson, 2001).
Chromophoric Dissolved Organic Matter Absorption Measurements and Analysis
For CDOM spectral absorption measurements, water samples were filtered through 0.2 μm pre-rinsed Nuclepore filters on the same day and stored in acid cleaned, pre-combusted amber bottles with Teflon-lined caps at 4°C in the dark and processed for CDOM spectral absorption using a 10 cm quartz cuvette on a dual beam Perkin-Elmer Lambda 850 spectrophotometer equipped with a 150 mm integrating sphere. We note that while effects of storage times (∼21 days) on CDOM absorbance have been reported in wastewater effluents (Sgroi et al., 2020), a longer hold time of 6 months of filtered seawater kept at 4°C indicated no change in absorption (Mannino et al., 2019). Details on the measurements and calculations of the absorption coefficient (acdom, m–1) and spectral slopes S275–295 and S350–400 (μm–1) are given in D’Sa et al. (2014) and Joshi et al. (2017). Absorption coefficients at various wavelengths (e.g., 254, 300, 325, 355, and 443 nm) were obtained and used for comparisons to other study regions. Spectral slope ratio (SR) was calculated as S275–295 divided by S350–400 (Helms et al., 2008). SUVA254 (m2 mg–1 C) was calculated by dividing the absorbance at 254 nm in inverse meters (m–1) by the DOC concentrations.
Phytoplankton and Non-algal Matter Absorption Measurements
For determination of light absorption by phytoplankton and non-algal matter, generally 500 ml volume of water were collected from the Niskin bottles and filtered onto 25 mm Whatman GF/F filters with nominal pore size of 0.7 μm. The filters were immediately stored in a freezer (−80°C) during the cruise and later transferred to liquid nitrogen before laboratory spectroscopic measurements. Particulate (total – ap and non-algal – anap) absorption were measured inside the integrating sphere on a Perkin-Elmer Lambda 850 spectrophotometer (details in Naik and D’Sa, 2012; Roesler et al., 2018; Liu et al., 2021). Phytoplankton spectral absorption coefficient aphy were then determined as the difference between ap and anap. Chlorophyll specific phytoplankton absorption at 443 nm, a∗phy443 (m2 (mg chl)–1) was obtained by dividing phytoplankton absorption at 443 nm, aphy443 by chlorophyll.
Excitation-Emission Matrix Spectroscopy Fluorescence Measurements and PARAFAC Analysis
Filtered seawater samples used for CDOM absorption measurements were also used to record EEMs using a FluoroMax-4 (Jobin Yvon Horiba) fluorometer. EEMs were recorded on the fluorometer by scanning the emission spectra from 290–550 nm at 5 nm intervals over excitation wavelengths between 250–450 nm at 5 nm increments. The EEMs spectra were obtained after correction of the fluorescence spectra for instrument bias, and the water Raman normalization of the fluorescence intensity (Singh et al., 2010; D’Sa et al., 2014). Due to low absorbance of the samples (0.004 to 0.015 cm–1 at 254 nm), there was no requirement for inner filter correction of the fluorescence data. The final EEMs fluorescence values are reported in equivalent Raman units (RU). The resulting EEM fluorescence observations were evaluated by PARAFAC analysis using the DOM-Fluor toolbox (Stedmon and Bro, 2008) with the model constrained by non-negativity, and run with three to seven components. Model validation was carried out using split-half analysis, residual analysis and random starts (Stedmon et al., 2003; Stedmon and Bro, 2008; D’Sa et al., 2016). A few samples were not used (e.g., Supplementary Figure 2) due to the high leverage (sample deviation from average distribution; Stedmon and Bro, 2008) and large residual EEMs (difference between sample and model derived EEMs) that improved the results of split-half analysis in the final model construction. Residual EEMs also indicated the presence of small signals in the UV corresponding to the tyrosine fluorescence but were not resolved by PARAFAC analysis due to the relatively strong tryptophan-like fluorescent signature; we note that the effects of sample hold time on the tyrosine-like FDOM cannot be ruled out due to its very labile nature (Chen and Jaffé, 2014). A fluorescence index BIX (index of recent autochthonous contribution) was calculated at 310 nm excitation, as the ratio of emission intensities at 380 nm divided by 430 nm (Huguet et al., 2009).
Satellite Data
Satellite sea ice concentration maps of the Ross Sea for the months of December 2014 and January 2015 were generated from data downloaded from the NOAA National Snow and Ice Data Center Climate Data Record of Passive Microwave Sea Ice Concentration, Version 41. The monthly average of chlorophyll imagery was downloaded from NASA2. MODIS-Aqua level-2 products for the Ross Sea region (e.g., chlorophyll a concentration estimated by the standard OCx empirical algorithm and the phytoplankton absorption coefficient aphy443 from the NASA GIOP semi-analytical algorithm) were downloaded for the month of January 2015 from the NASA website for comparisons to field data.
Results
Ross Sea Polynya and Surface Chlorophyll Conditions in Summer
The Ross Sea polynya which is maintained during winter by strong katabatic winds blowing offshore off the RIS, starts expanding during spring and into summer with increasing solar insolation and warming (Park et al., 2018). For the summer of 2014–2015, we observe the polynya extent for December and its northwards expansion in January (Figures 2A,B), along with a marginal ice zone to the west and east of the polynya. A large phytoplankton bloom was observed in December north of the RIS and the SW, and a smaller bloom in the Terra Nova Bay polynya located off Victoria Land (Figure 2C). By January, surface chlorophyll decreased considerably, but remained elevated in the SW and TNB, with lower concentrations in the central and northern part of the shelf (Figure 2D).
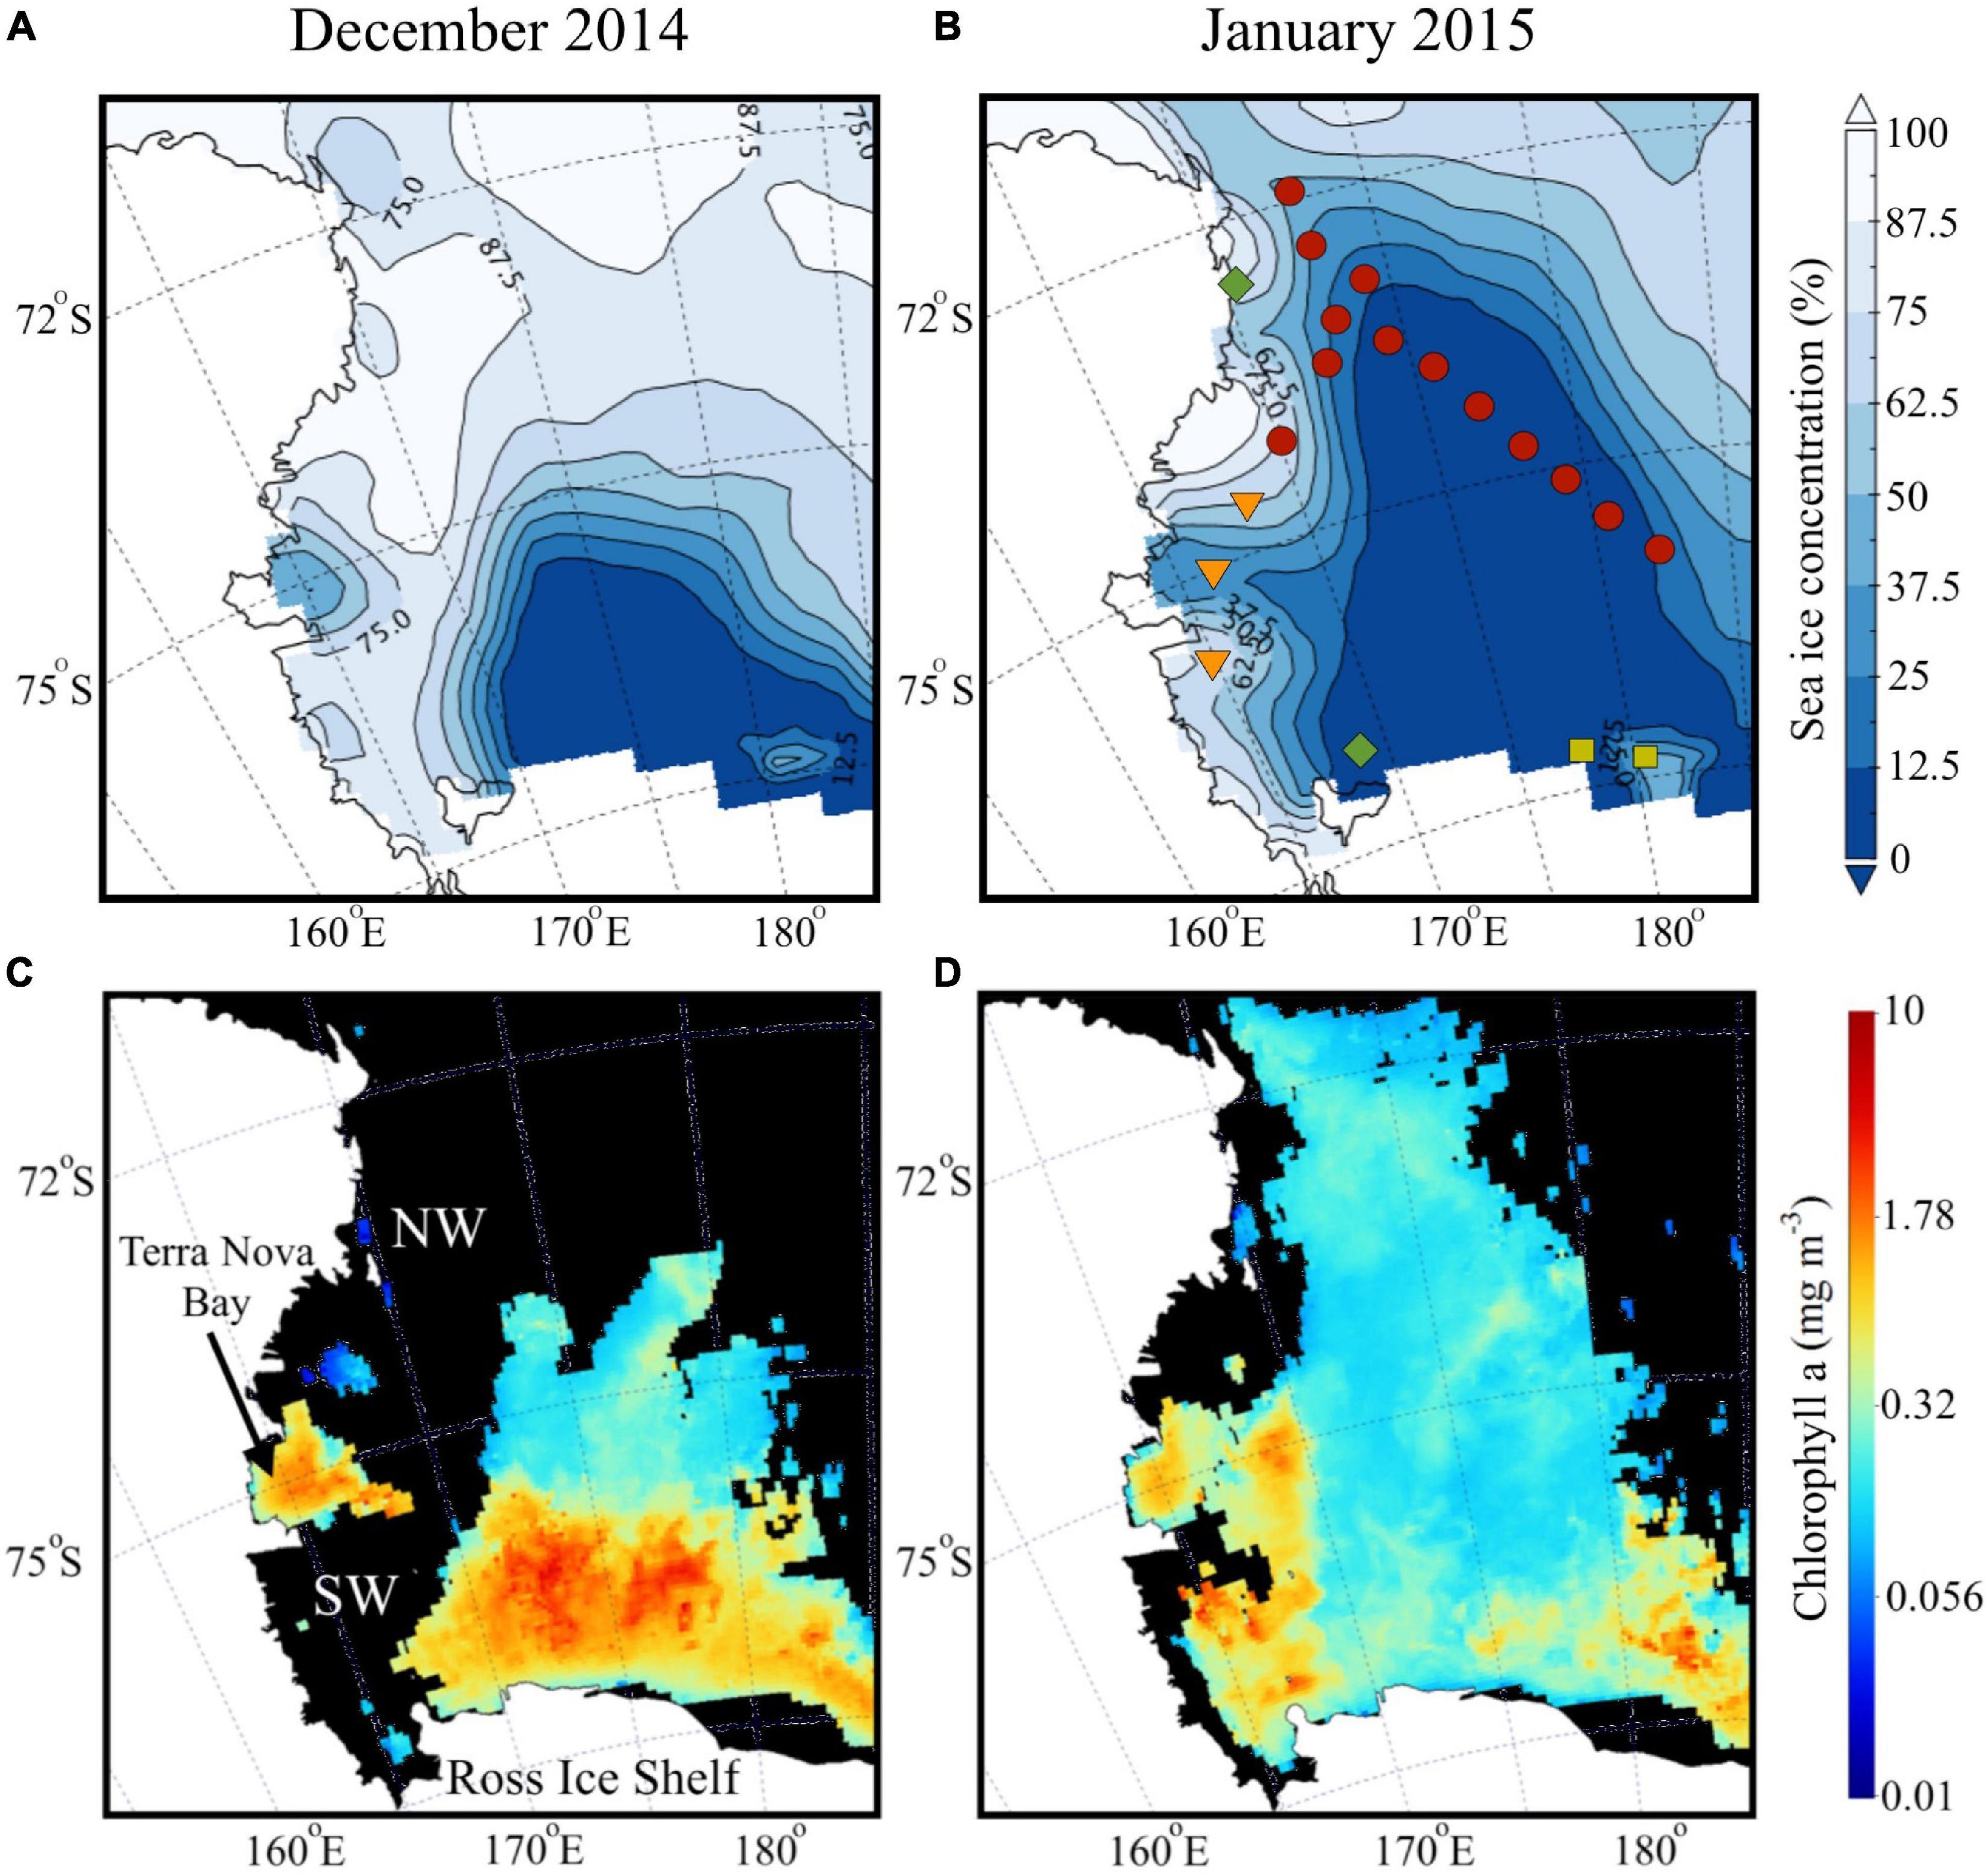
Figure 2. Satellite imagery during austral summer. Average surface distribution of satellite-derived (A,B) sea ice concentration (%) and (C,D) chlorophyll a (mg m– 3) during austral summer (December 2014 and January 2015).
Water Column Characteristics
Water column properties (temperature, salinity and chlorophyll fluorescence) and mean values in the upper water column (∼150 m) at discrete sampling depths are shown for the different regions of the Ross Sea (Figure 3 and Table 1). Transect T1 (Figures 1A, 3A,B) reveals typical water masses and its characteristics just inshore of the shelf break. The AASW with its low salinity is observed within the upper 100 m. The transect plot includes st 61 (Figure 1A; no water sampling) at the northwestern end of the transect located just inshore of the shelf break, to demonstrate the subsurface intrusion of the warm, high salinity and low oxygen (Supplementary Figure 1A) CDW waters. However, along the main T1 transect, inflow of the MCDW (warm and low oxygen waters) into the shelf is observed at several locations generally below the low salinity AASW and above the cold and high salinity DSW, with DSW dominating over the troughs and the MCDW over the banks. Greater mixing of the MCDW with surface waters and increased depth of the surface mixed layer eastward appear to contribute to elevated subsurface phytoplankton biomass (Figures 3A–C).
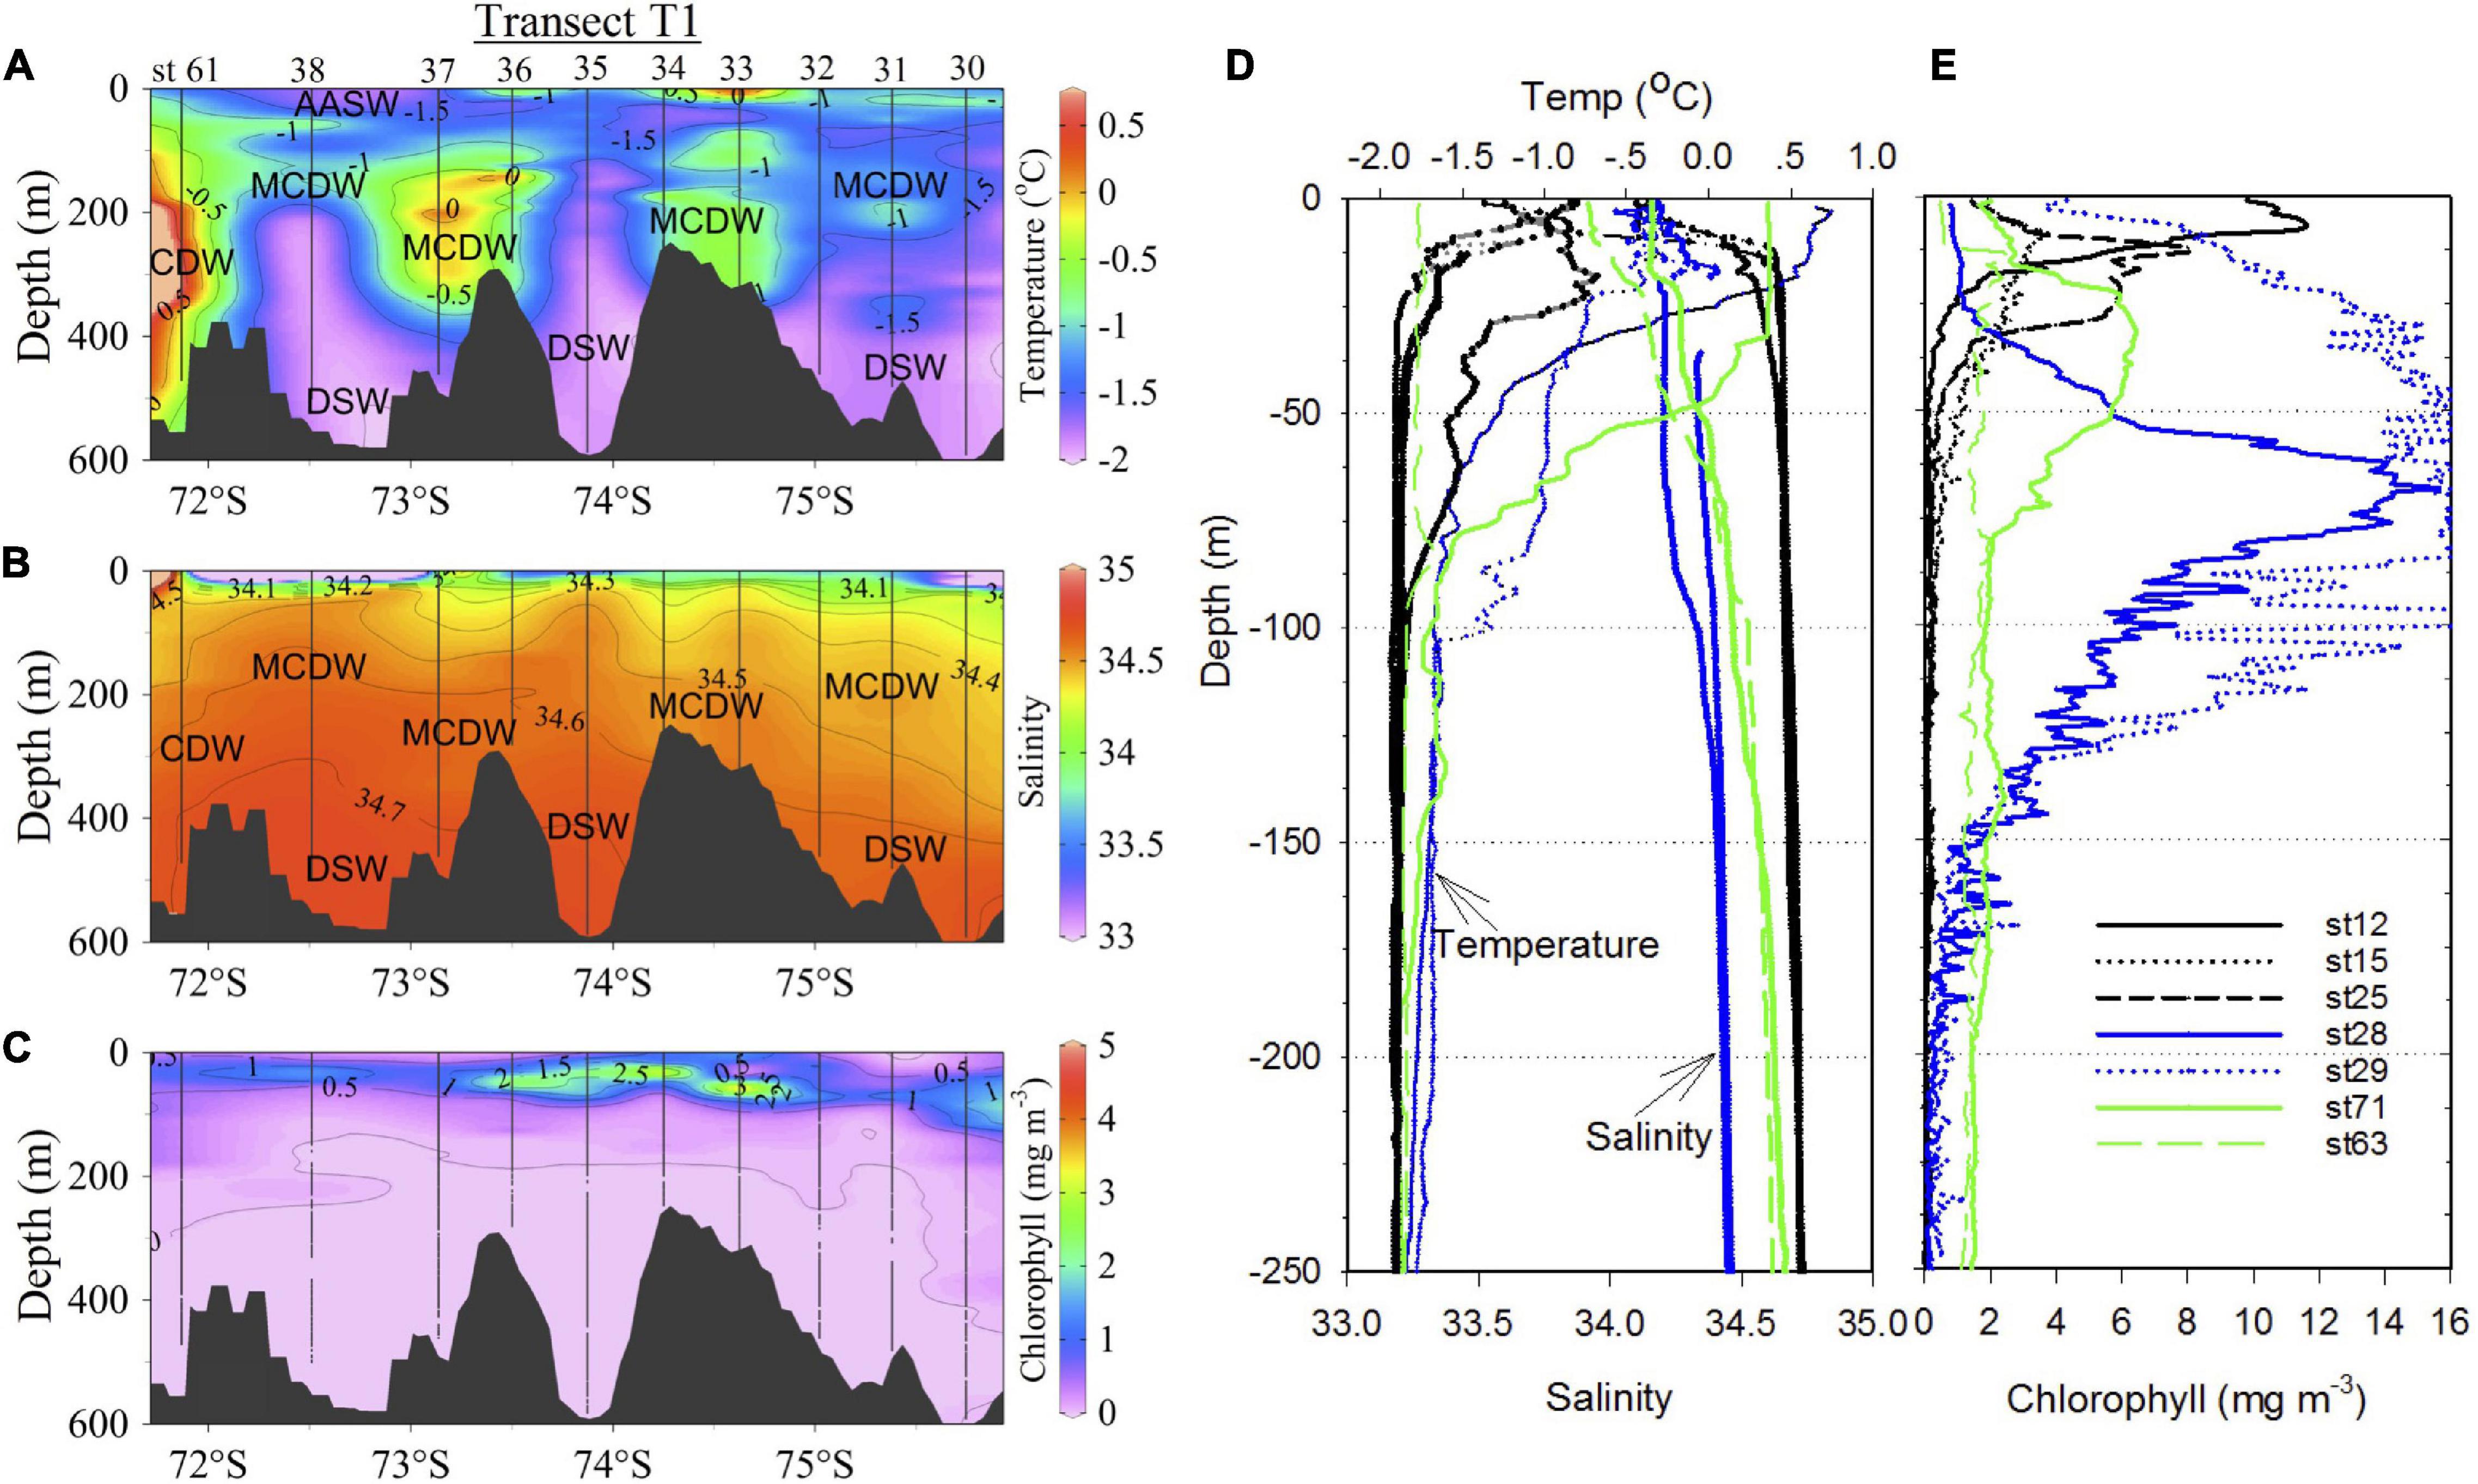
Figure 3. Water column properties. Distribution of water properties (A) temperature (°C), (B) salinity and (C) chlorophyll (mg m–3) along transect T1 which runs NW to SE (Figure 1) and is shown as a function of latitude. (D,E) Vertical profiles of same water properties in the SW (sts 12, 15, and 25; black), off-RIS (sts 28 and 29; blue) and off Victoria Land in NW and north of the Ross Island (sts 63 and 71; green).
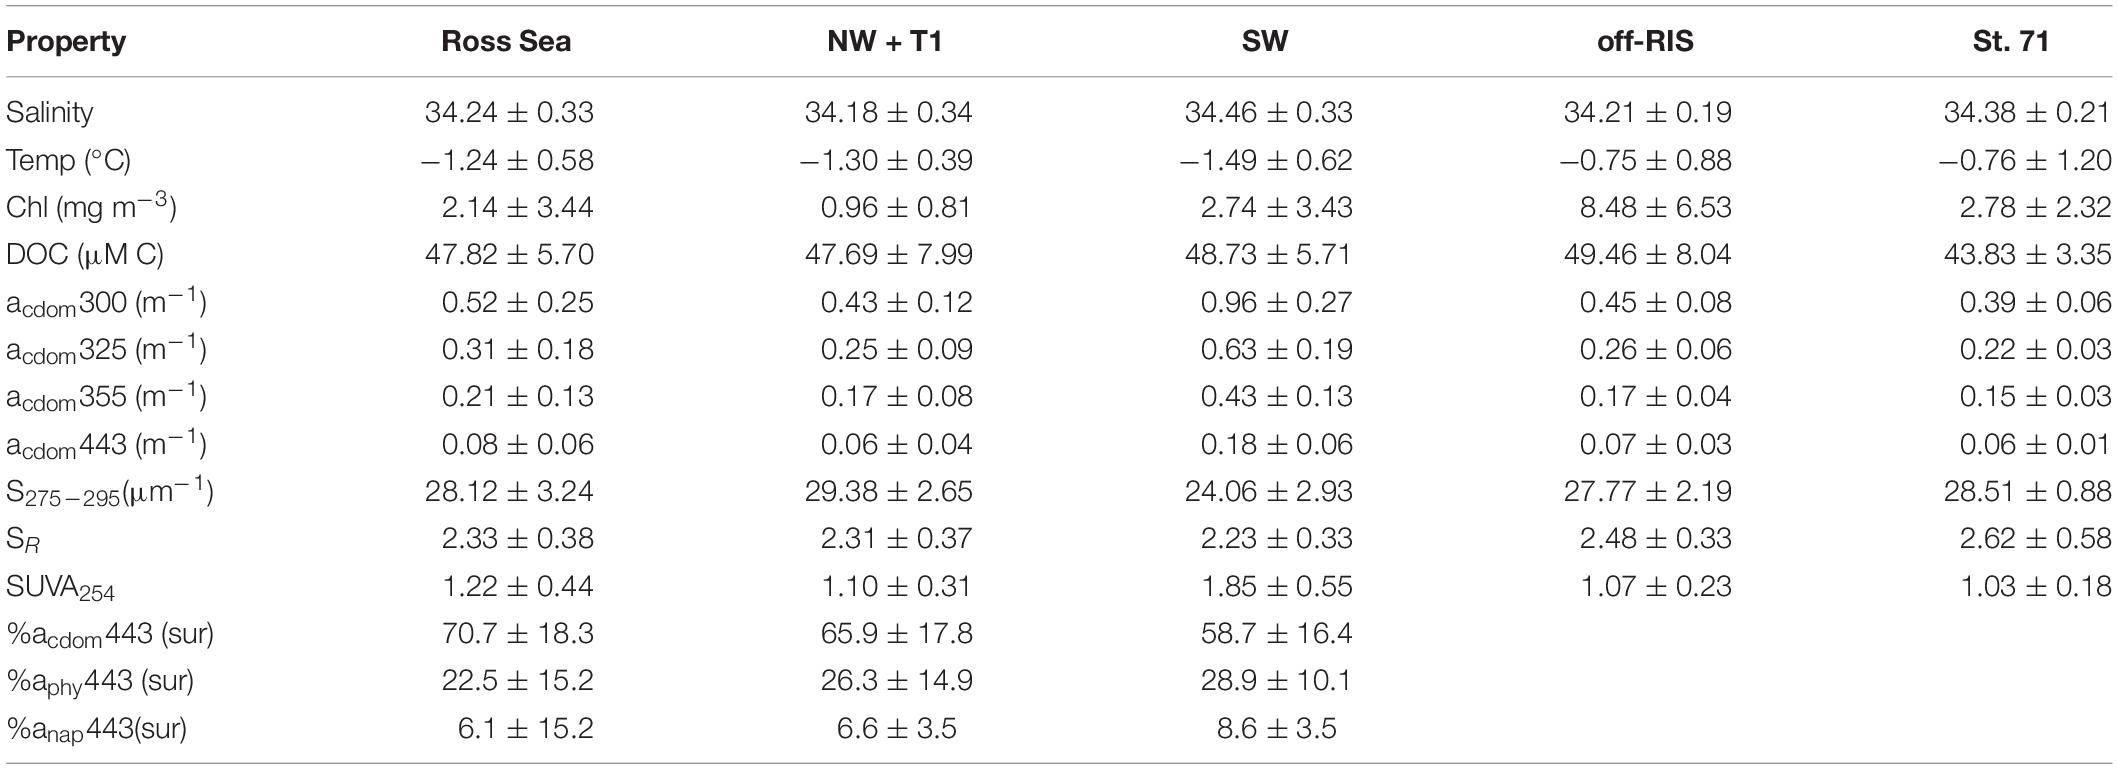
Table 1. Mean salinity, temperature, chlorophyll, DOC concentration, CDOM absorption at 300 (e.g., acdom300), 325, 355, and 443 nm, spectral slope S275–295, slope ratio SR, SUVA254,% of total absorption coefficients at 443 nm of CDOM acdom443, phytoplankton aphy443, and non-algal particles anap443 measured within the upper ∼150 m of the Ross Sea (n = 66), that includes: the northwest and a transect inshore of the shelf break NW + T1 (n = 45), the southwest SW (n = 11), north of the Ross Ice shelf or off-RIS (n = 66) and at station 71 (n = 4); where n is the number of samples used for CDOM.
Vertical profiles of the same properties at stations in the SW (sts 12, 15, and 25), off-RIS (sts 28 and 29) and station 71 reveal differences in biophysical properties (Figures 3D,E). A shallow mixed-layer depth is observed at the SW stations with strong thermocline/halocline within the upper 30 m, with sub-thermocline temperatures (< −1.85°C) and salinity (> 34.65) at > 50 m associated with the cold, high salinity shelf waters (DSW). Shallow subsurface peaks in chlorophyll of 11.6, 3.8, and 8.0 mg m–3 were recorded at stations 12, 15, and 25, respectively. However, at the nearshore station north of the Ross Island in the SW (st 71, Figure 1A) water column temperature, salinity, chlorophyll and dissolved oxygen differed from stations in the SW and off-RIS (Figures 3D,E; Supplementary Figure 1B). At this station, a broad chlorophyll peak of ∼6 mg m–3 present at ∼30 m depth decreased to levels of ∼1.8 mg m–3 at 100 m depth, and thereafter remained elevated albeit decreasing with depth. A similar elevated chlorophyll profile with depth was also observed in the NW nearshore station 63 (Figure 3E). At the two RIS stations (sts 28 and 29) with deeper mixed layers, surface temperatures were relatively warmer (0.65 and −0.35°C) and waters fresher (34.27 and 34.18). Chlorophyll increased from a low of 0.76 and 4.3 mg m–3 at the surface, to peak values of 15.6 mg m–3 at a depth of 68 m for station 28 and a broad subsurface bloom of ∼16 mg m–3 extending down to a depth of ∼120 m at station 29 (Figure 3E).
Dissolved Organic Carbon Concentrations and Chromophoric Dissolved Organic Matter Absorption Properties
Distribution of DOC in the upper water column (depth range: 0 to ∼150 m) at each of the sampling stations corresponding to the three regions of the shelf are shown in Figure 4A. DOC concentrations over the whole shelf (mean: 47.82 ± 5.70 μM) ranged between 38.75–67.58 μM (Figure 4A), with means of 47.69 ± 7.99, 48.73 ±.0.5.71, and 49.46 ± 8.04 μM, respectively, in the NW + T1, SW and off-RIS (Figure 1A and Table 1). Corresponding upper water column distribution of CDOM absorption coefficient acdom325 in the shelf ranged from 0.11 to 0.81 m–1 (Figure 4B) with a mean of 0.31 ± 0.18 m–1, while spectral slope S275–295 ranged from 21.20 to 33.72 μm–1 (Figure 4C), with a mean of 28.12 ± 3.24 μm–1, respectively. The highest acdom325 and lowest S275–295 was in the SW region (Figures 4B,C), with mean values of 0.63 ± 0.19 m–1 and 24.06 ± 2.93 μm–1, respectively (Table 1). With the exception of the high values in the SW, acdom325 for the other regions (i.e., NW + T1, off-RIS, sts 71 + 63) ranged between 0.11 – 0.47 m–1, with a mean of 0.25 ± 0.08 m–1. Mean CDOM absorption coefficients at 300, 355, and 443 nm are also shown (Table 1) for comparisons to other regions.
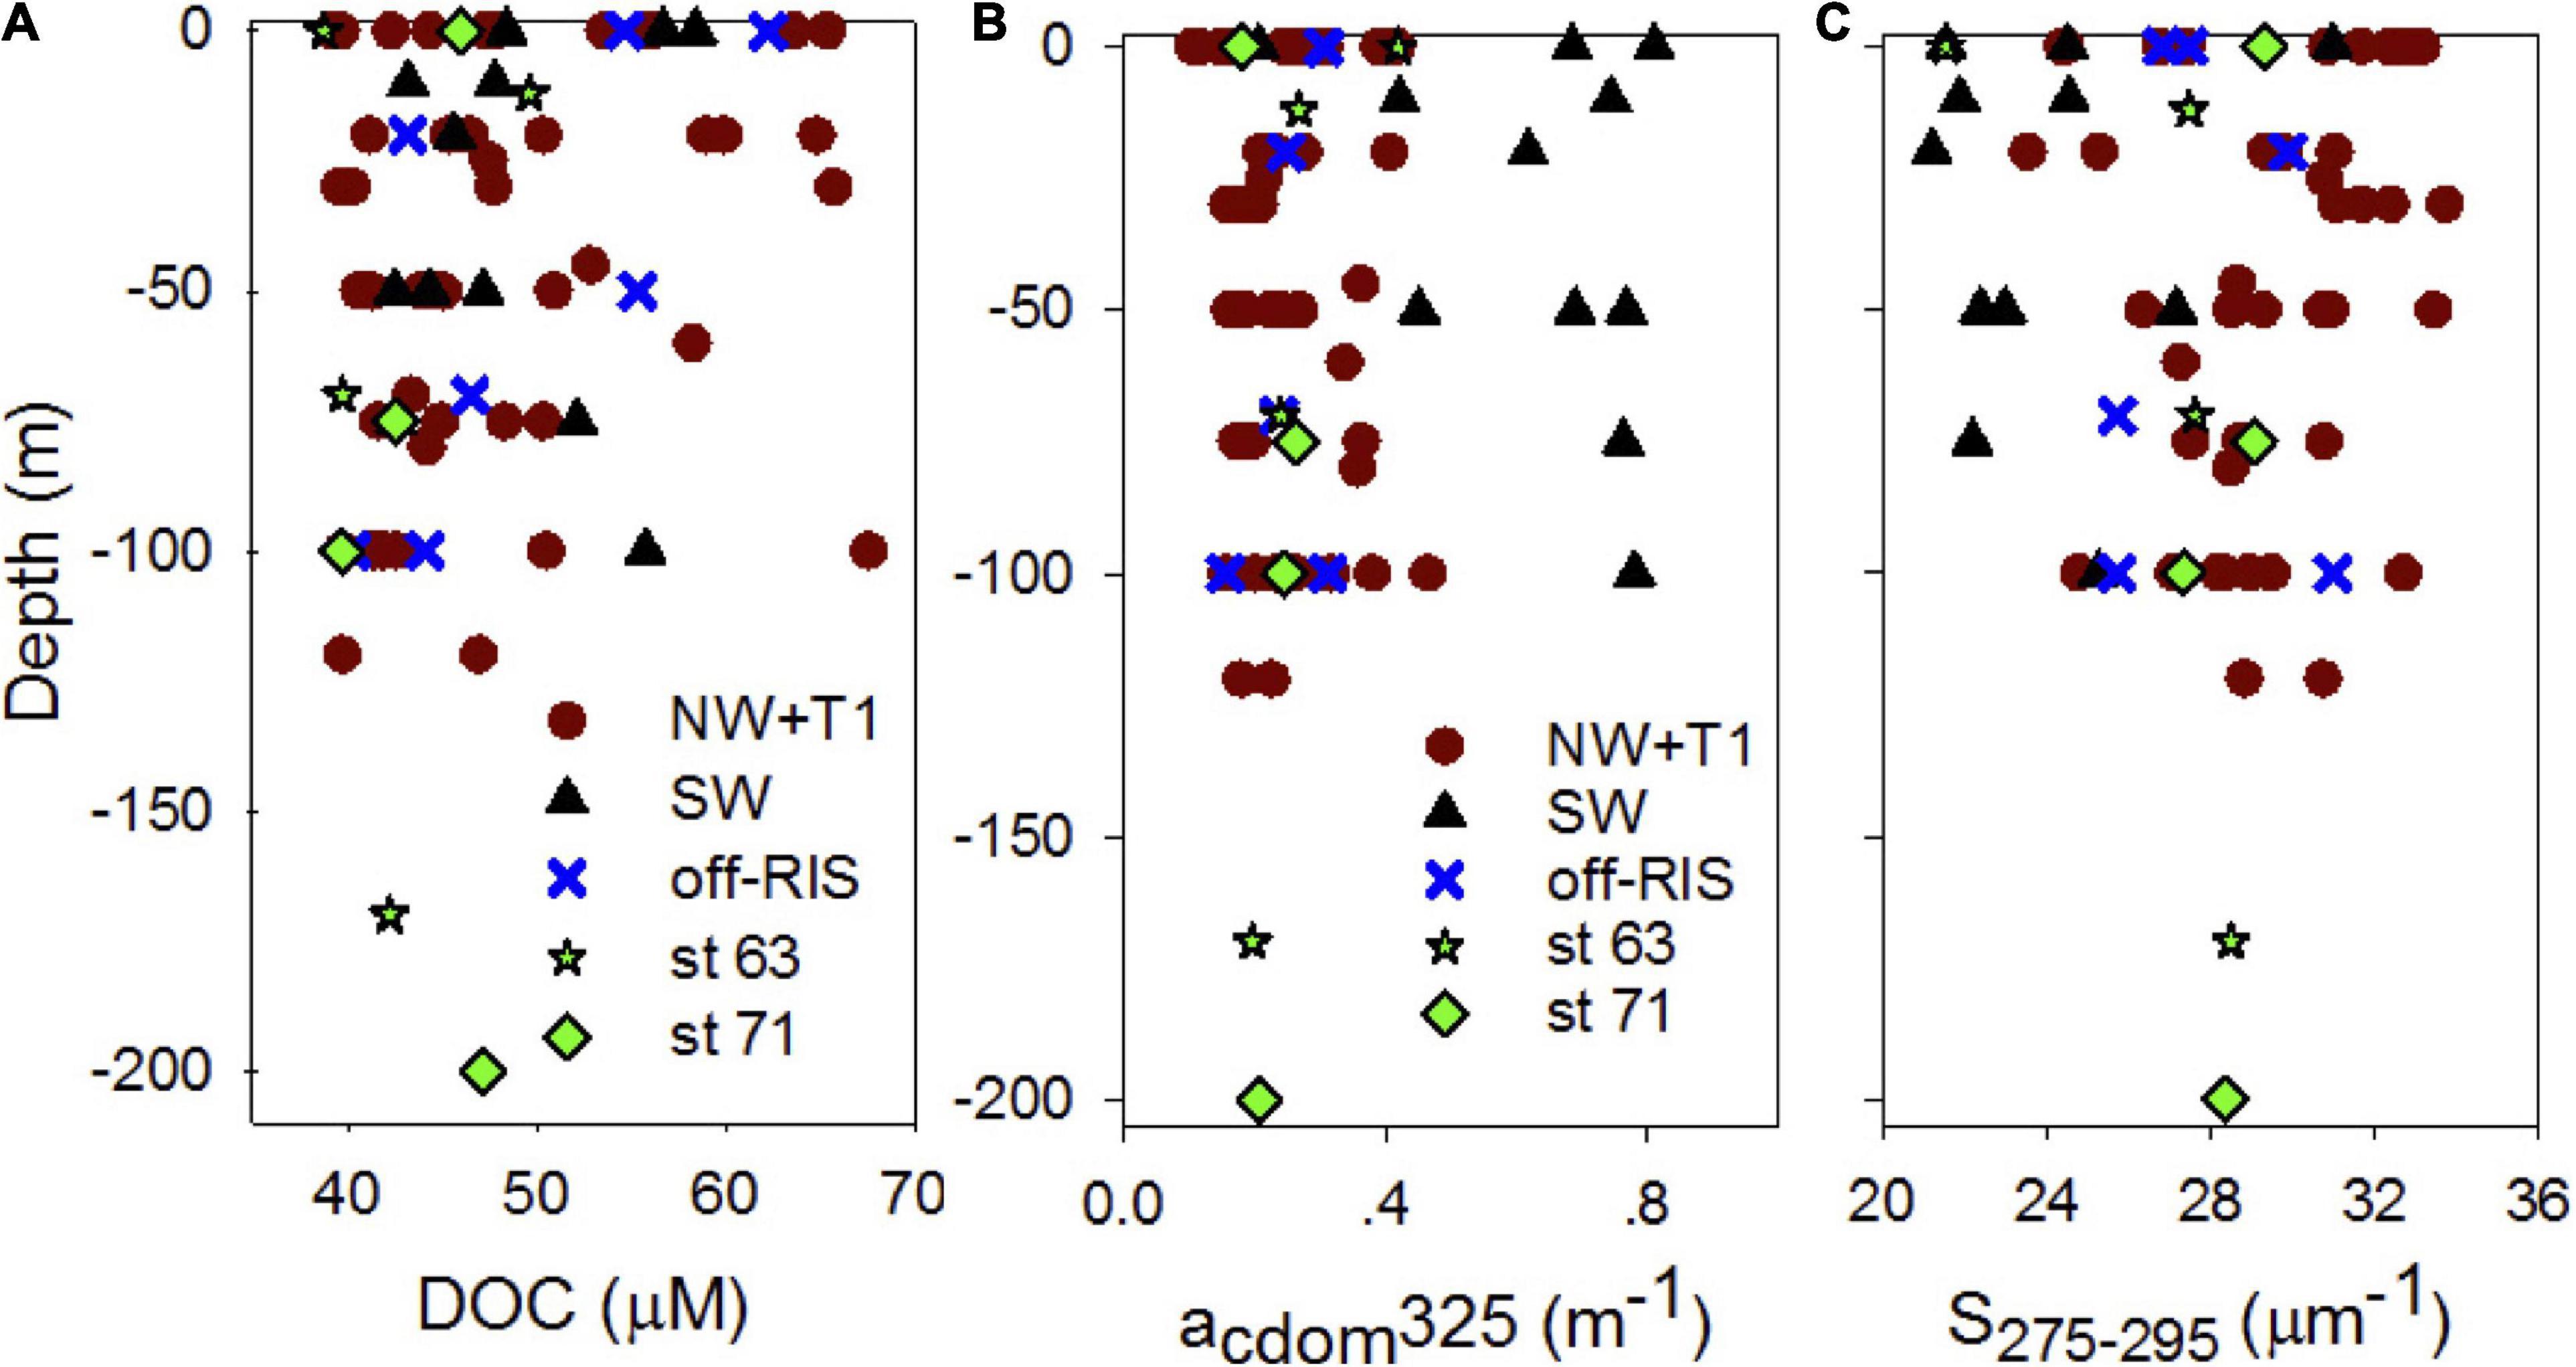
Figure 4. Upper water column DOC and CDOM. Vertical profiles of (A) DOC (μM C), (B) CDOM absorption coefficients acdom325 (m–1) and (C) spectral slope S or S275–295 (μm–1) at different sampling locations (NW + T1, SW, off-RIS, and sts 63 and 71) in the Ross Sea.
Mean SR for the shelf was 2.33 ± 0.38 and did not vary significantly across the different shelf regions (Table 1). SUVA254 for all the sampling locations in the shelf show a mean value of 1.22 ± 0.44 m2 g–1 C, with highest value in the SW region (1.85 ± 0.55 m2 g–1 C). Example acdom spectra at station 33 (NW + T1) and stations 15 and 25 (SW) are shown in Figure 5. Relationships between acdom325 and salinity, chlorophyll and DOC were also examined. acdom325 showed a slight positive trend with salinity, but was uncorrelated to chlorophyll or to DOC (Figures 6A–C). The relationship between acdom325 and spectral slope S275–295 showed a general decreasing trend with increasing acdom325 (Figure 6D).
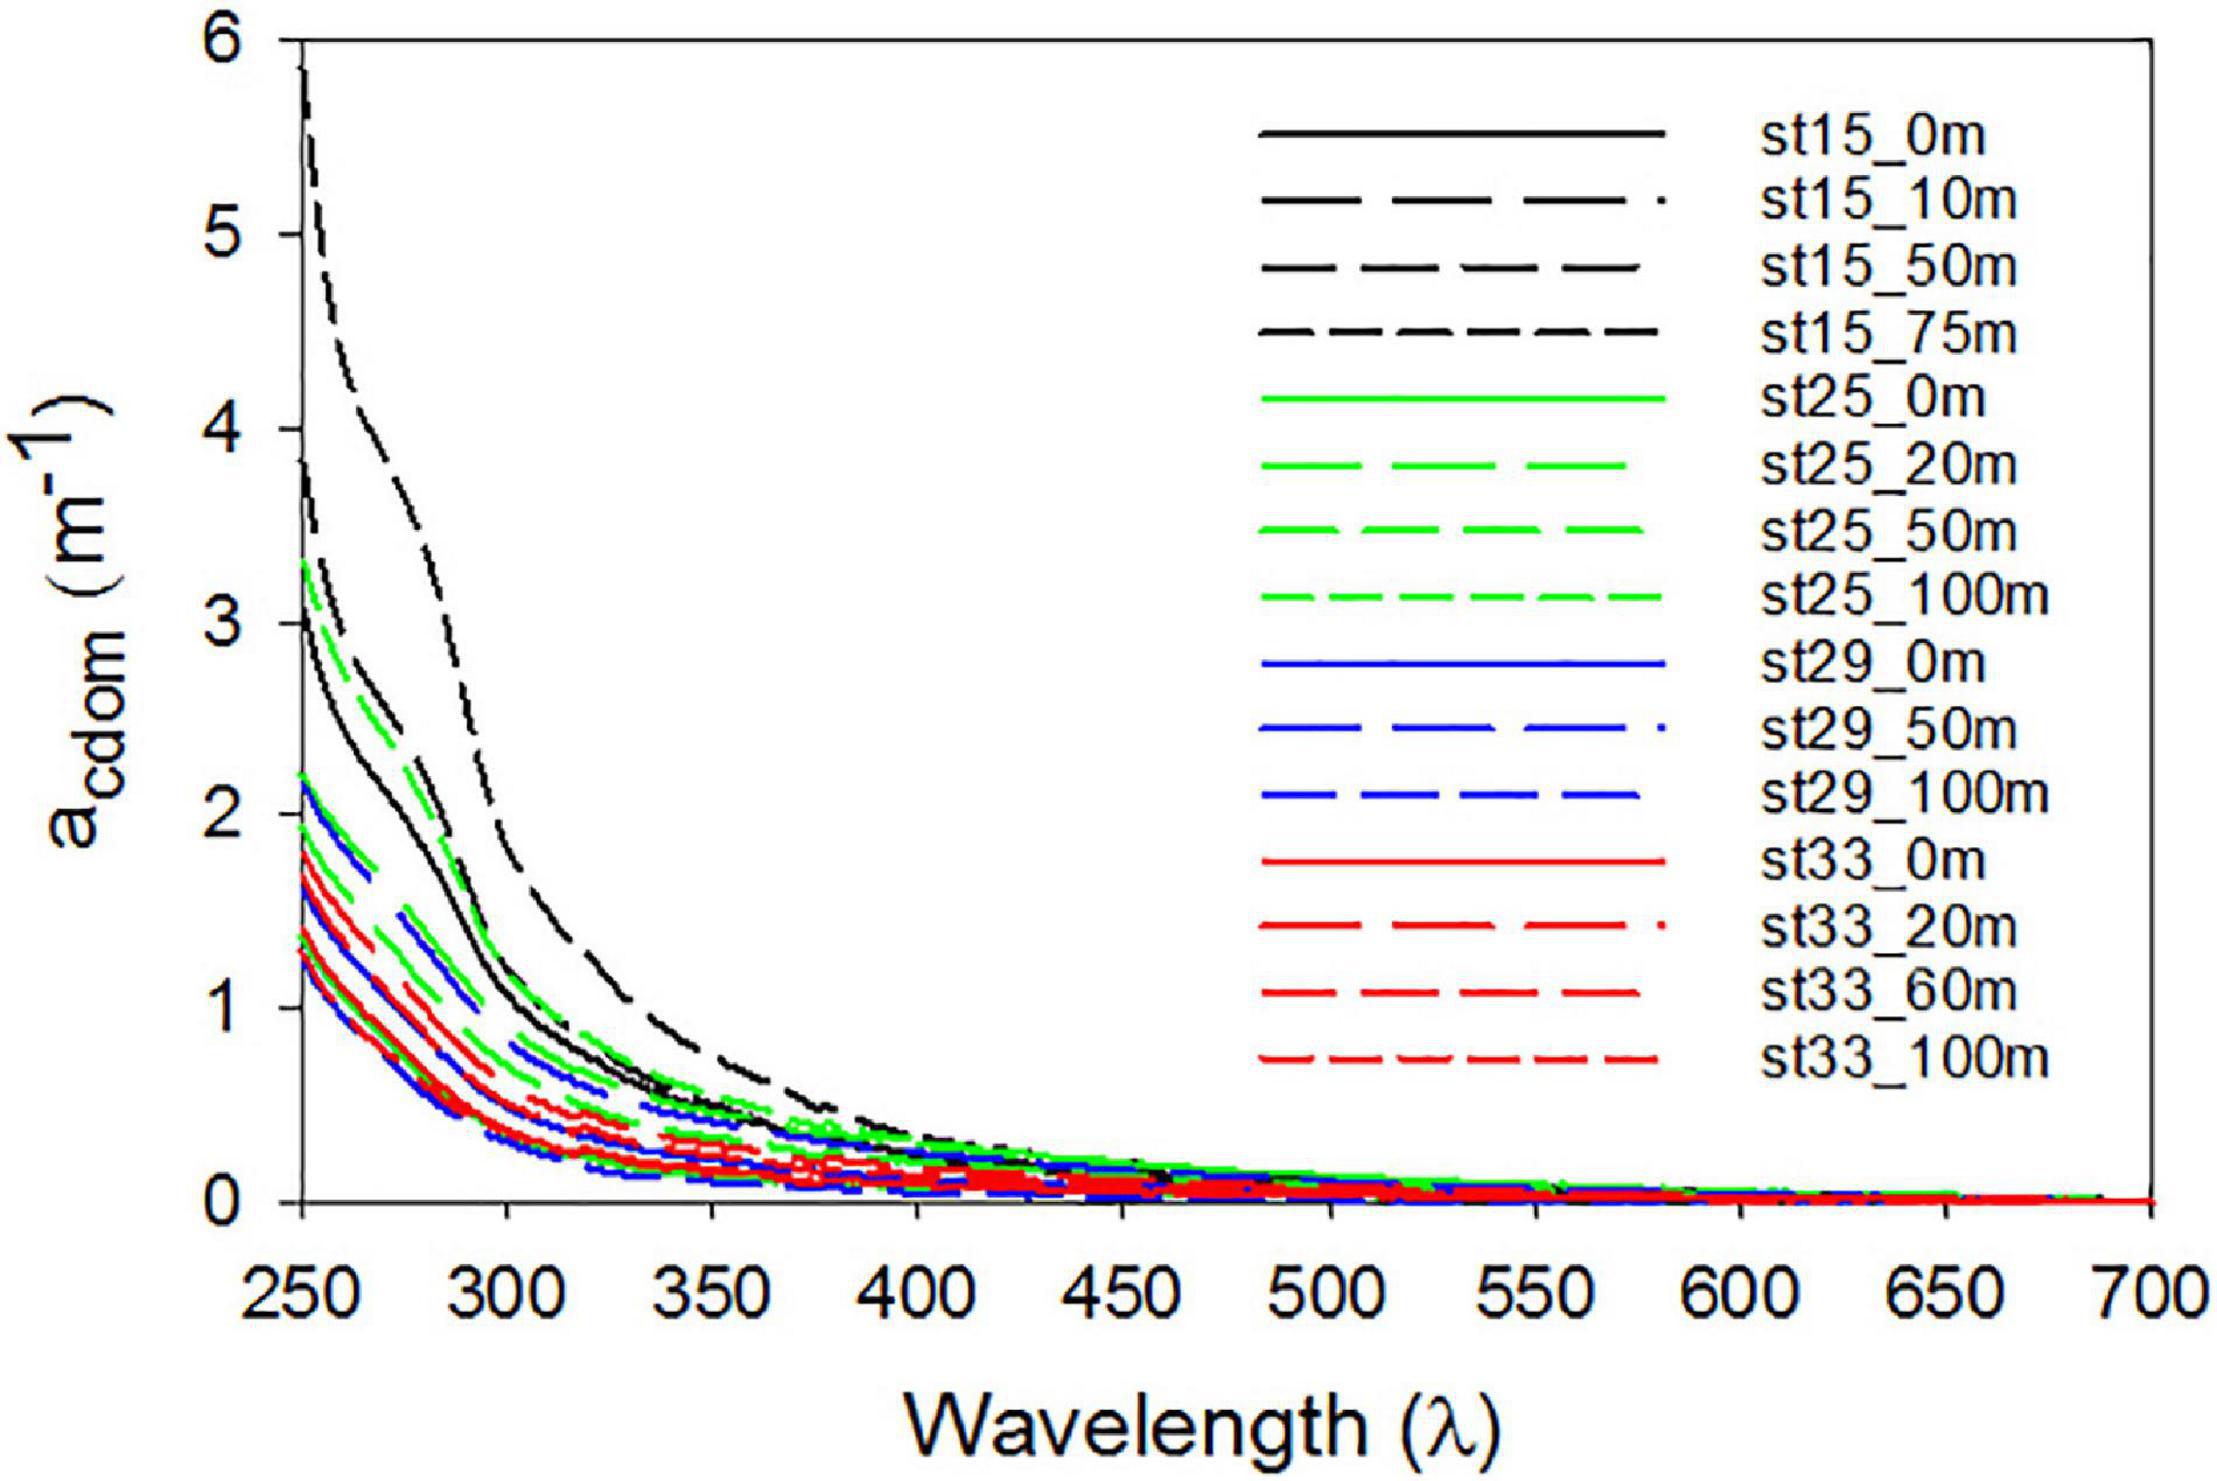
Figure 5. Chromophoric dissolved organic matter (CDOM) spectra. CDOM spectral absorption coefficients between 250–700 nm of samples collected at selected depths for typical stations located along transect T1 (station 33), the SW (sts 15 and 25) and off-RIS (station 29).
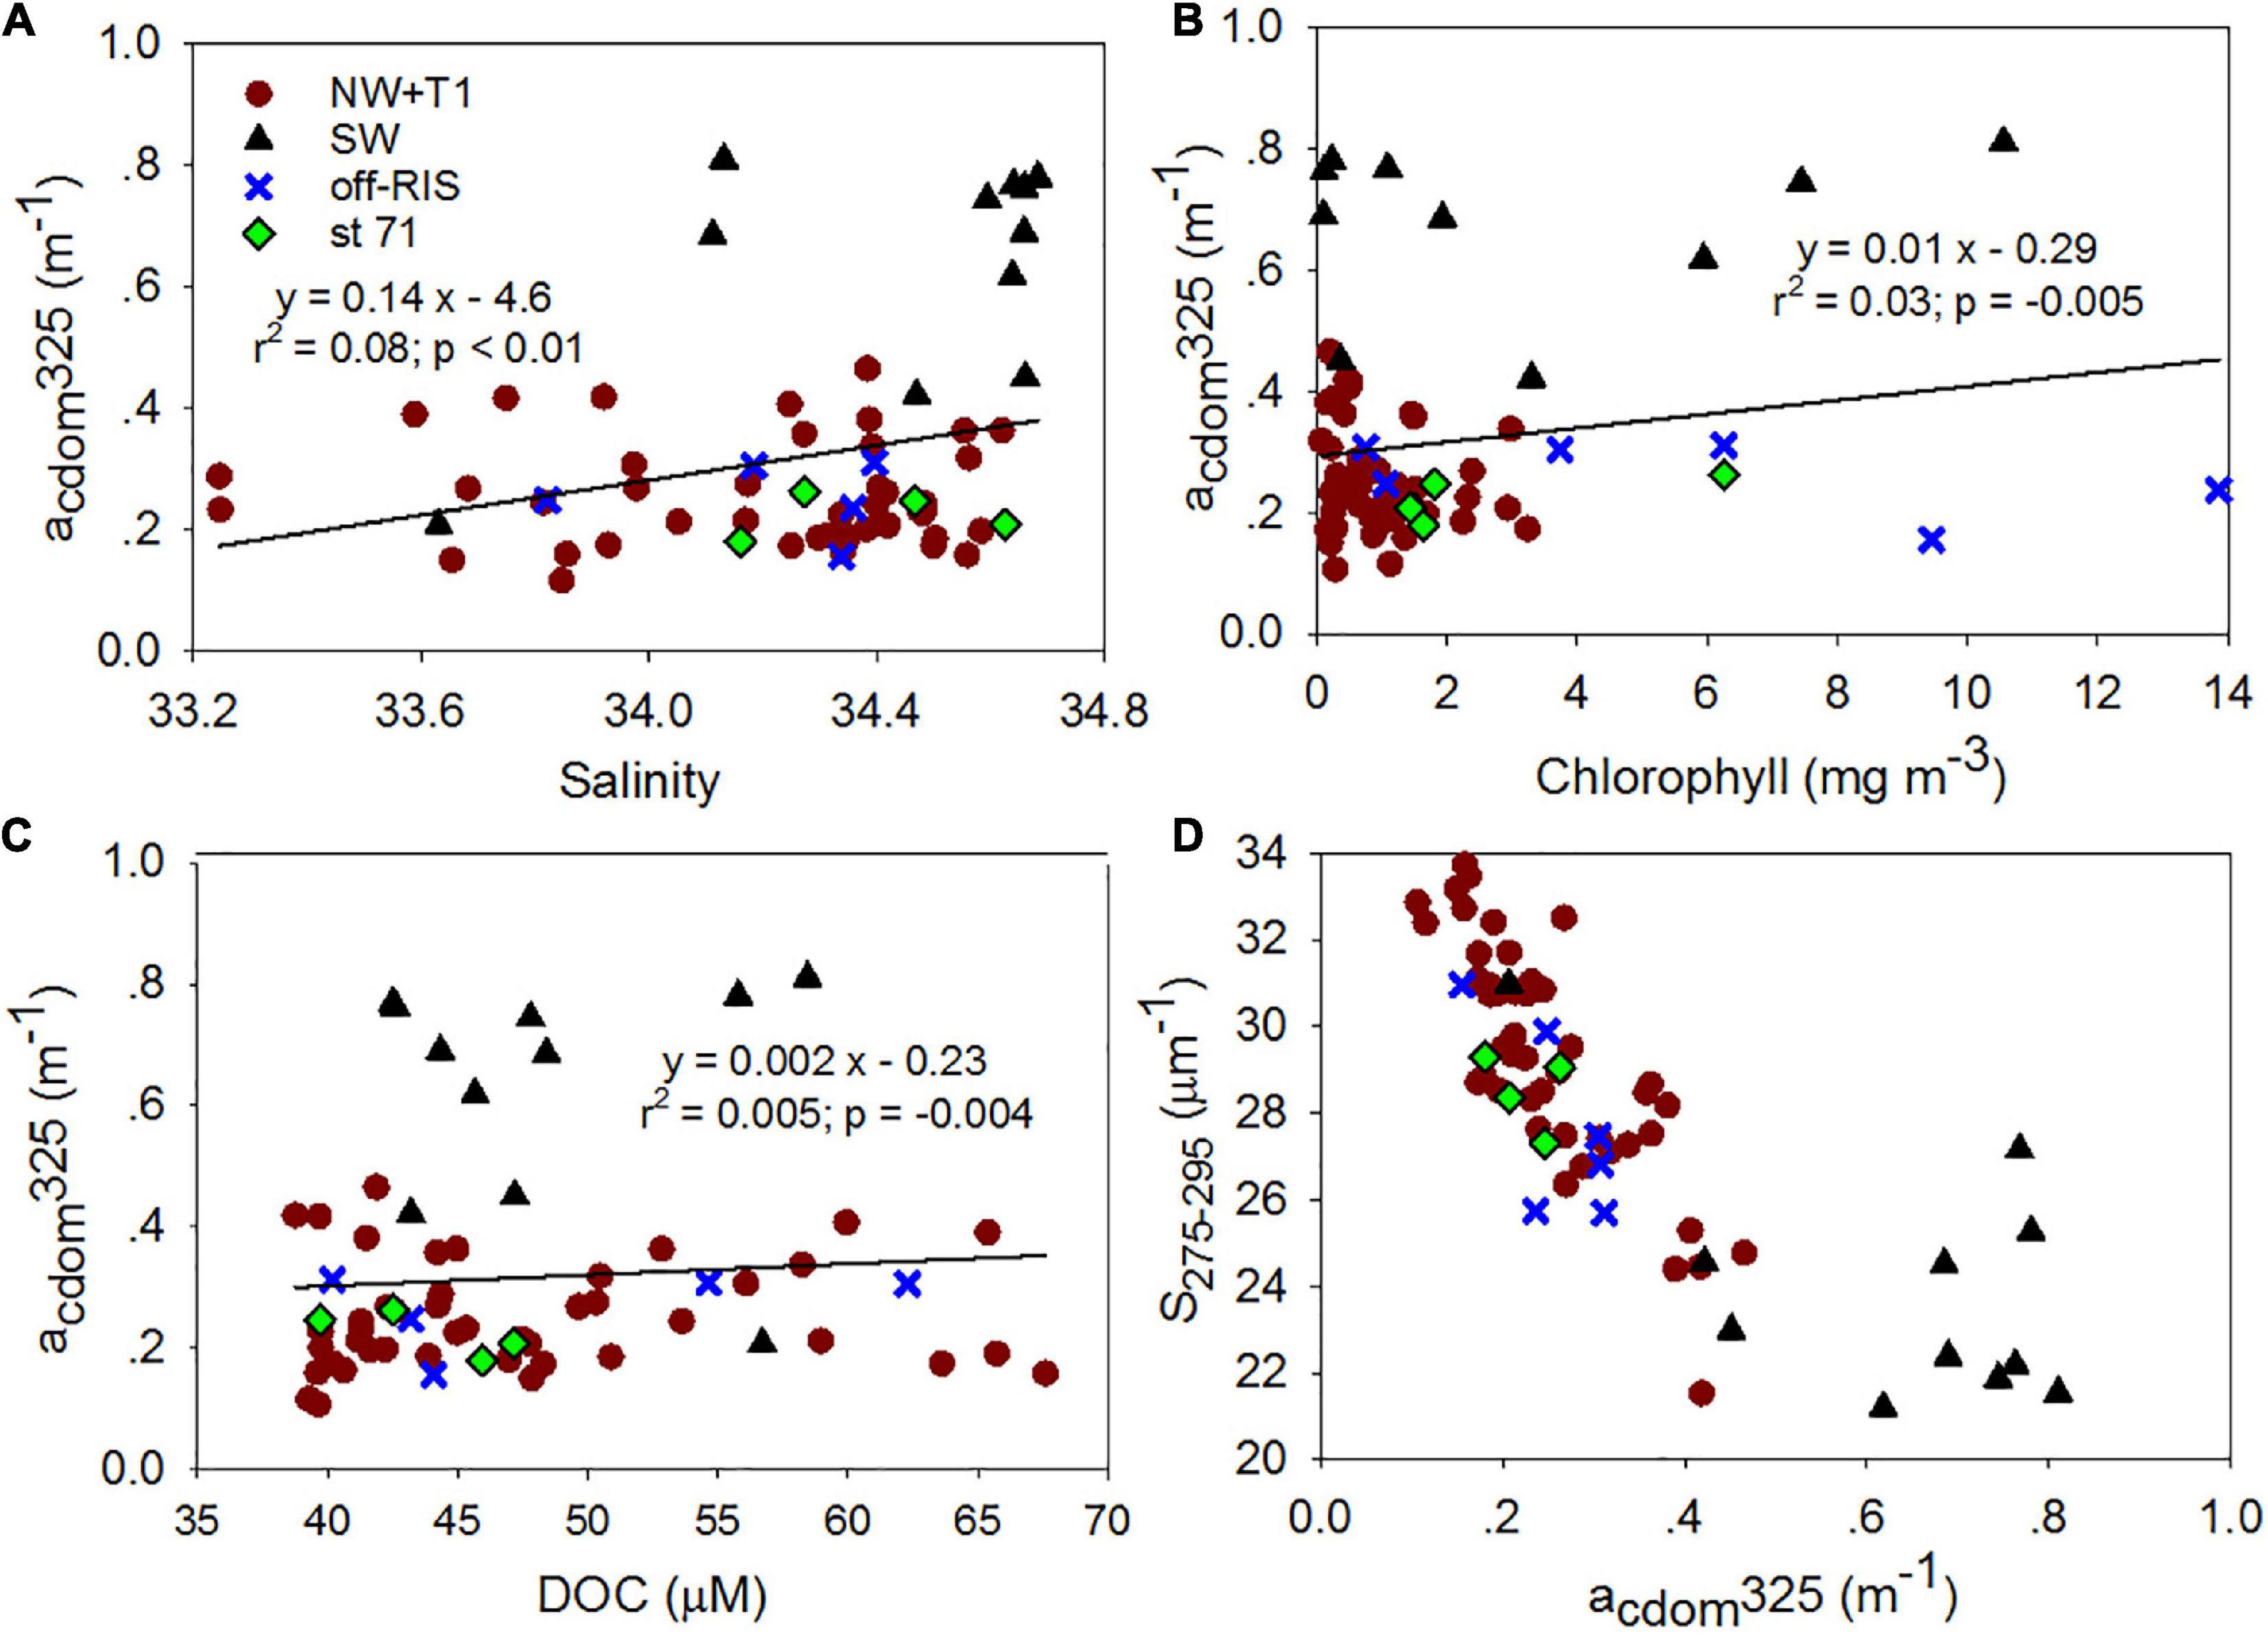
Figure 6. Chromophoric dissolved organic matter (CDOM) relationships. Relationships between (A) salinity, (B) chlorophyll and (C) DOC and acdom325; (D) acdom325 vs S275–295.
Fluorescence Dissolved Organic Matter Properties
An example of EEMs spectra obtained at three depths (surface, 100 m and 200 m) at station 71 is shown in Figures 7A–C. In the visible, the humic-like peaks were similar to the A and C peaks (Coble, 1996) at excitation/emission (ex/em) of ∼ < 260/480 nm and 370/480 nm, while a blue-shifted peak was observed at ∼305/400 nm corresponding to the M-peak. In the UVA, peaks were observed at ∼275/335 nm that have been associated with tryptophan (or T-peak; Coble, 1996); although the T-peak was the main signal observed in most samples (Figure 7), comparatively weaker emission signals were also observed at shorter wavelengths that suggest the presence of other fluorophores such as the tyrosine protein-like fluorophore (e.g., Figure 7C). However, since tyrosine and tryptophan do not typically occur as pure dissolved amino acids in the environment (Yamashita and Tanoue, 2003), the broad protein-like fluorescence with peak ex/em similar to T-peak can be considered as likely derived from a mixture of dissolved amino acids and other organic materials with similar fluorescence characteristics (Murphy et al., 2018).
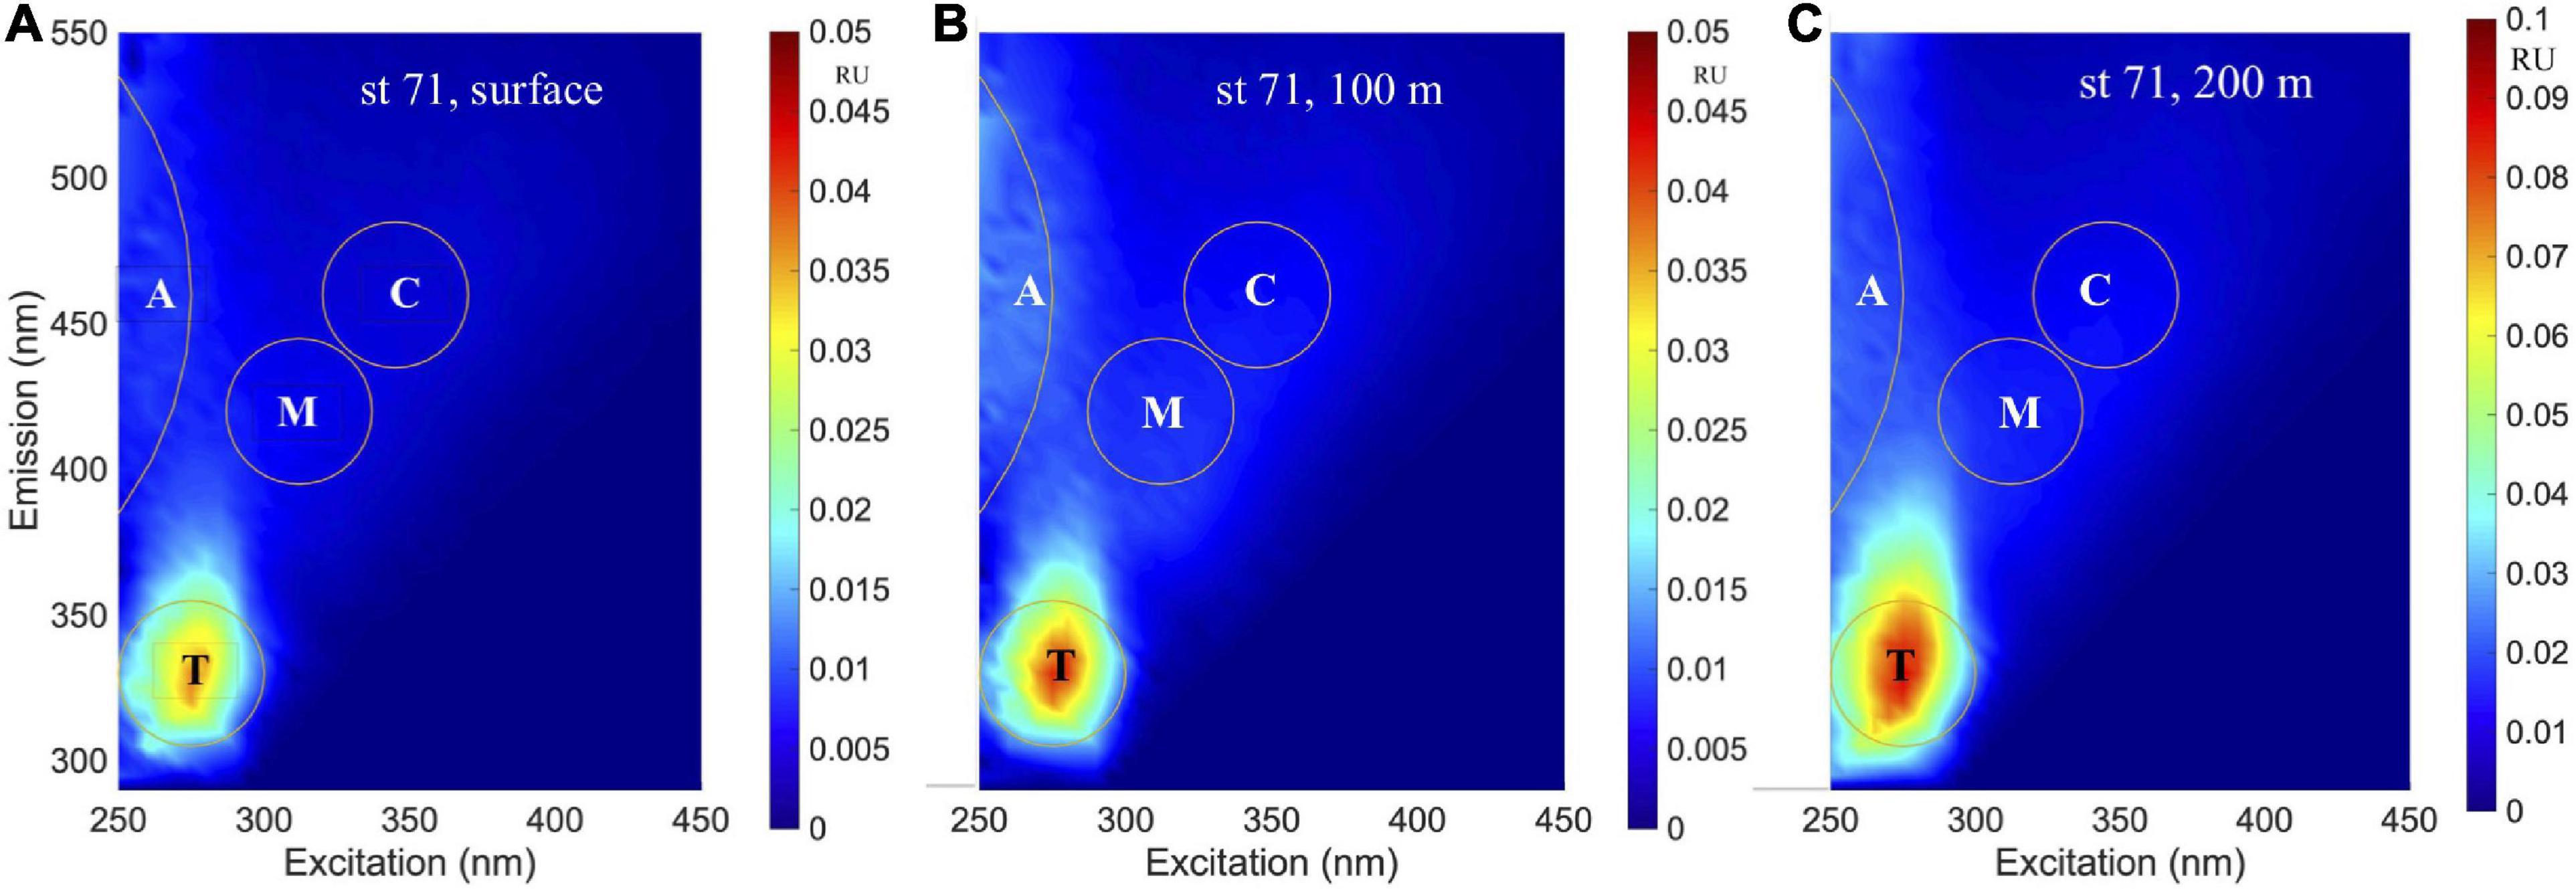
Figure 7. Excitation-emission matrix spectroscopy (EEMs) spectra. EEMs of station 71 north of the Ross Island from samples obtained at (A) surface, (B) 100 m, and (C) 200 m depths.
The PARAFAC analysis of DOM excitation-emission scans identified three major fluorescent fractions (C1, C2 and C3) and are shown along with their excitation and emission loadings (Figure 8). C1 with ex/em of 275/335 nm is associated with tryptophan-like fluorophore (Yamashita and Tanoue, 2003; Romera-Castillo et al., 2011). The C2 component with ex/em peaks at < 260(370)/480 nm corresponds to previously noted A/C humic-like material generally ubiquitous in the marine environment (Murphy et al., 2018). The C3 component with ex/em peak at 305/400 nm is similar to the “M” or marine-humic like material of biological and/or microbial origin (Coble, 1996; Stedmon et al., 2003; Romera-Castillo et al., 2011). The humic-like C2 was on average greater than the C3 component, while the protein-like C3 component showed greatest variability (Table 2). The DOC normalized C2 and C3 components showed weak but significant positive correlations to salinity (Figure 9A), while the sum of the two humic-like components (C2 + C3) also showed weak but significant correlation to DOC concentrations (Figure 9B). The average biological index BIX was 1.0 ± 0.1 for the whole study region with little variability between the different sampled regions (Table 2).
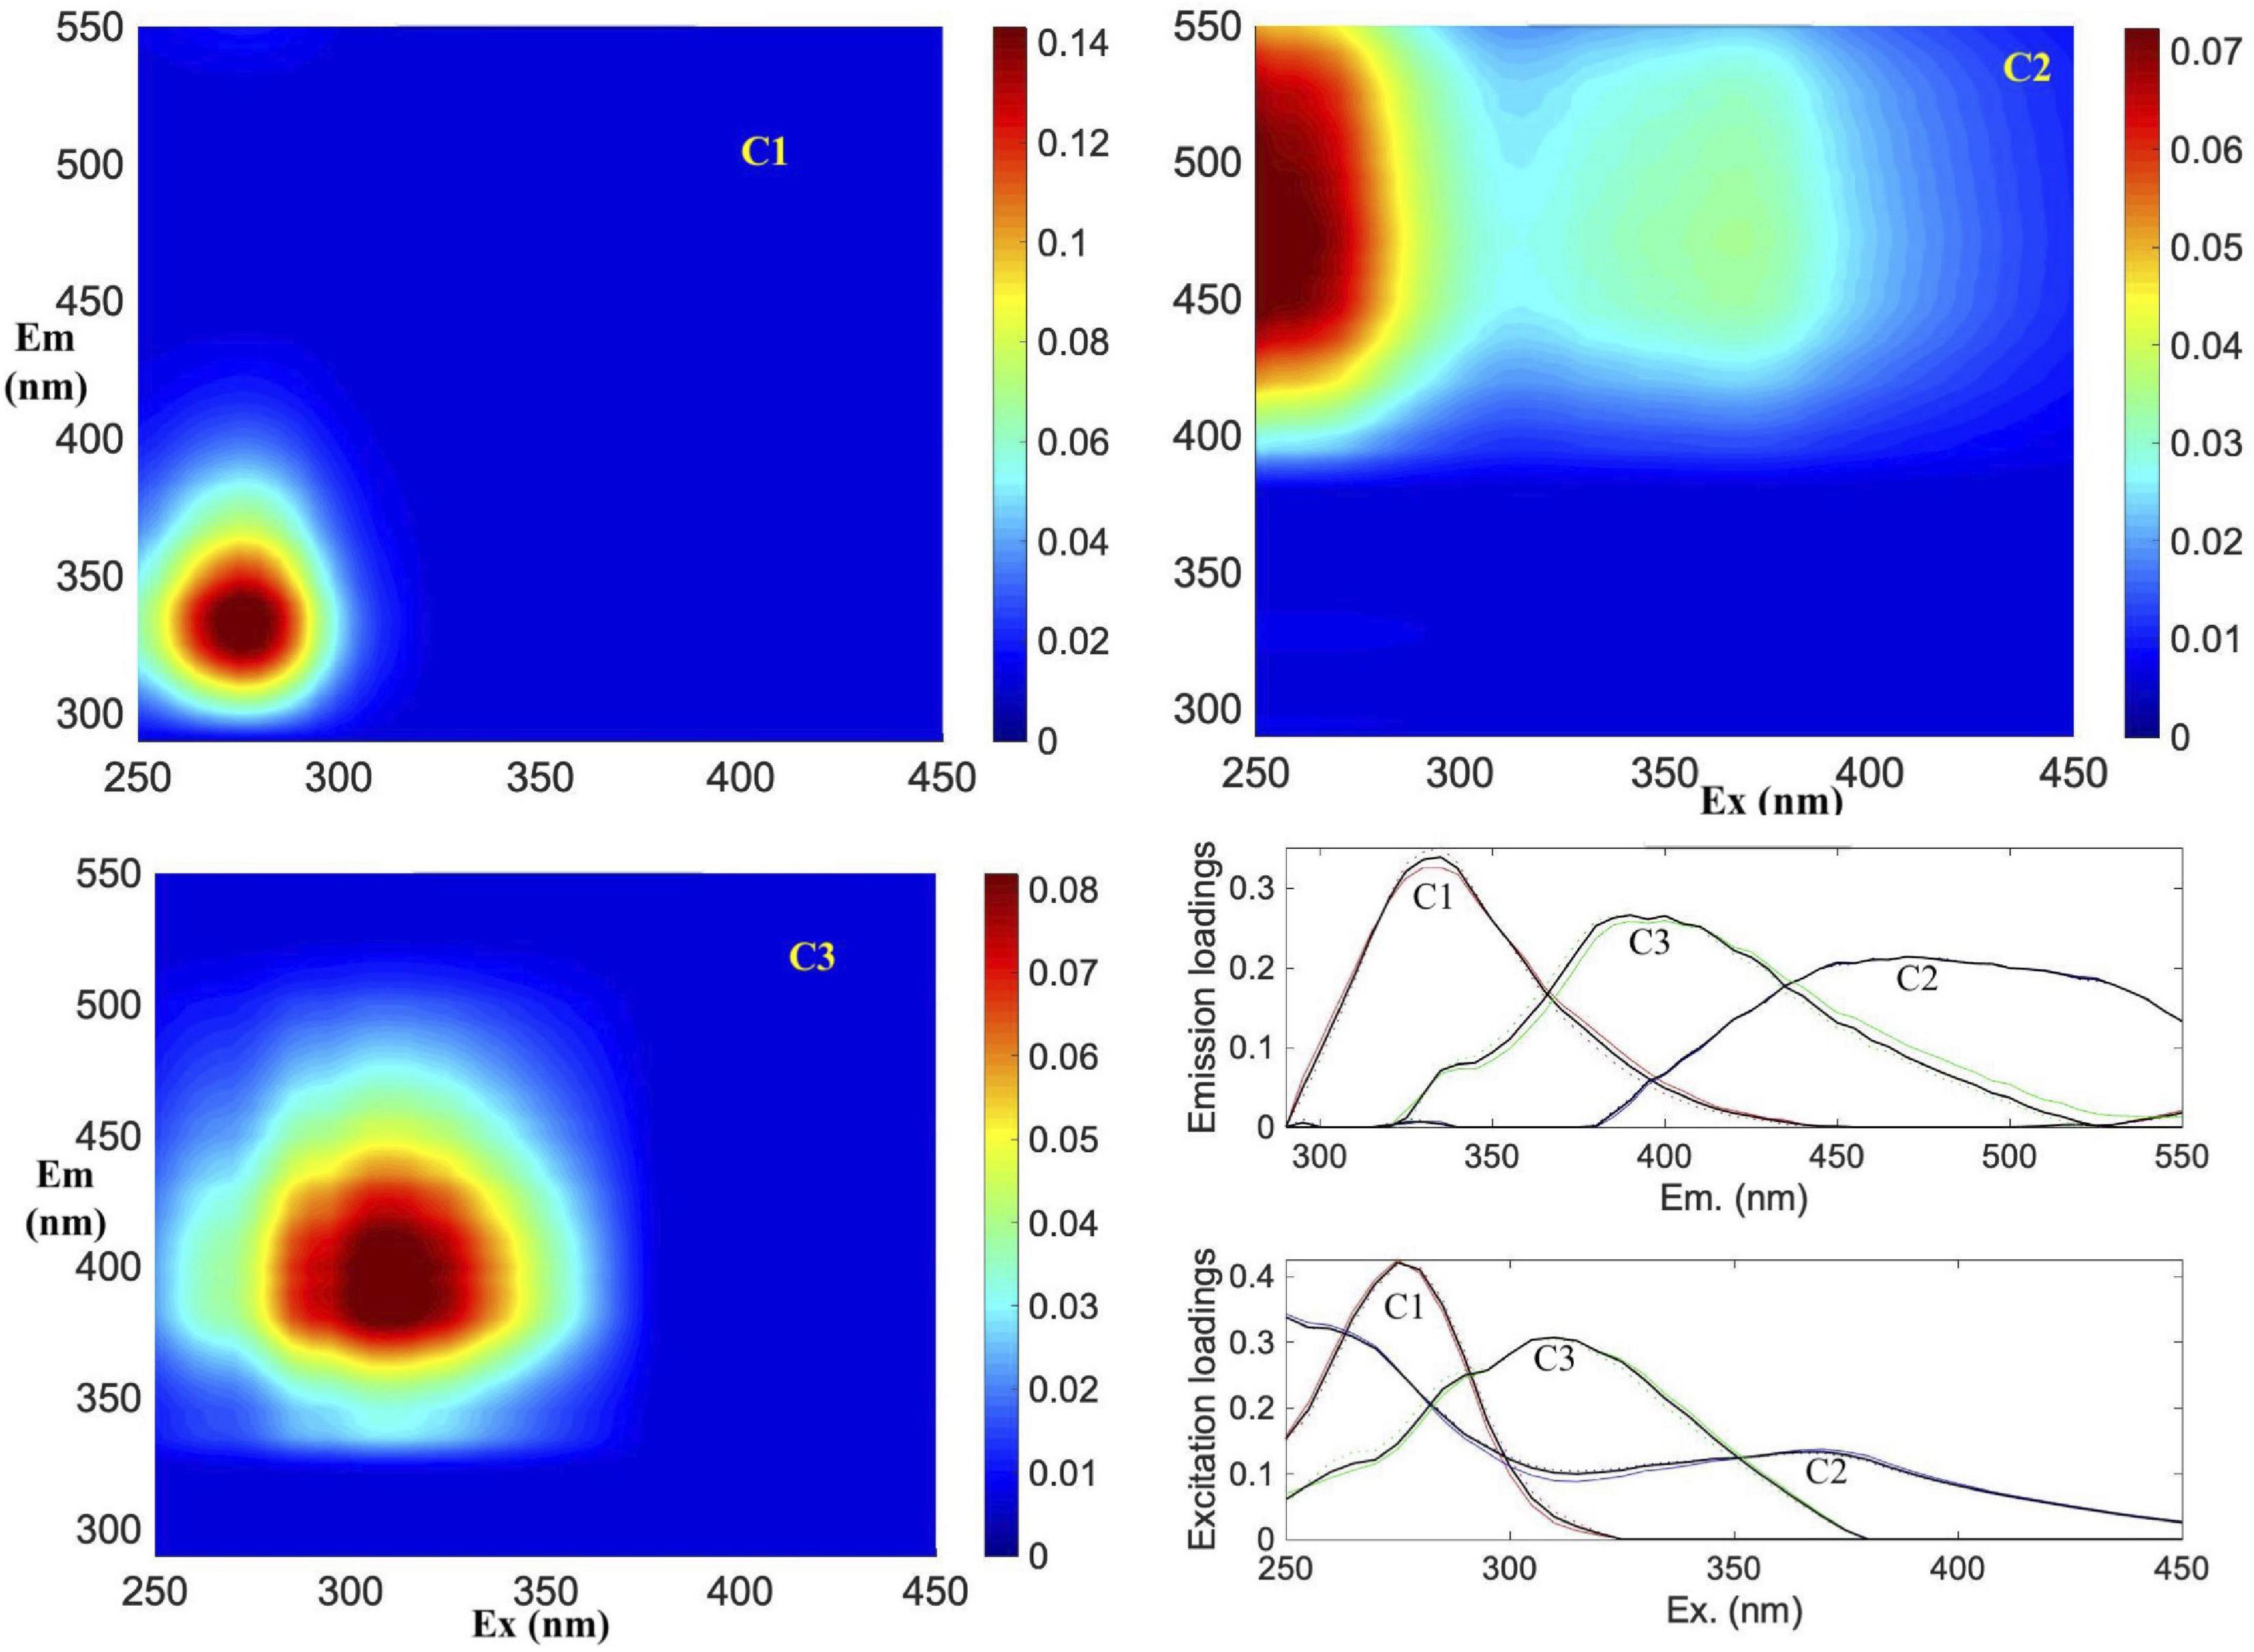
Figure 8. Parallel factor analysis (PARAFAC) components. Spectral characteristics of three fluorescent components (C1, C2, and C3) identified by PARAFAC analysis. Figures show the EEMs plots of individual components in Raman Units (RU) of intensity. Excitation and emission loadings derived from the three-component PARAFAC model using split-half validation technique (bottom right). Positions of their excitation/emission maxima wavelengths are: C1 (275/335 nm), C2 (< 260(370)/480 nm) and C3 (305/400 nm), respectively.
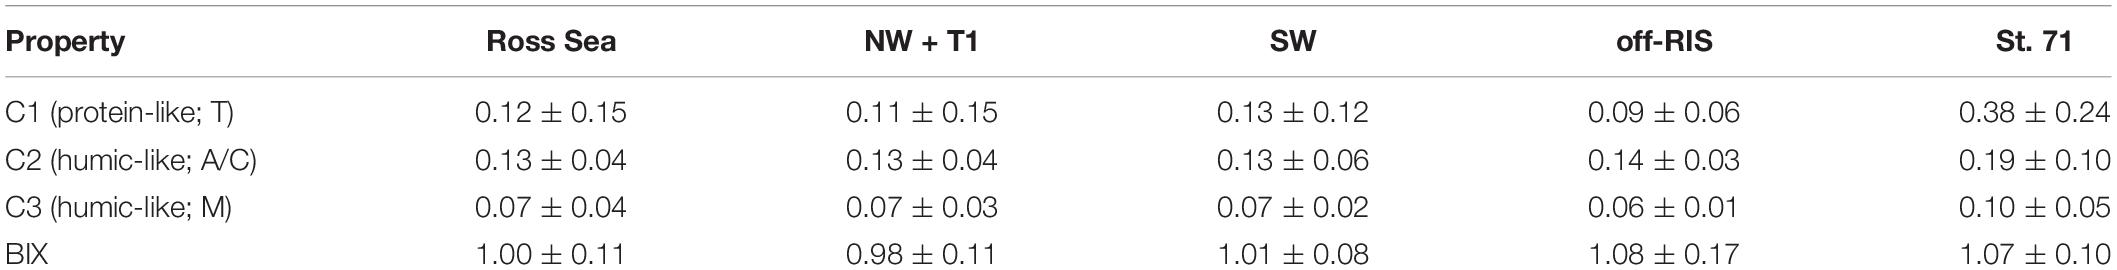
Table 2. Mean of the three fluorescence components (RU) identified by the PARAFAC model and the biological index BIX in the Ross Sea and the three regions (NW + T1, SW, off-RIS) and station 71 located north of the Ross Island.
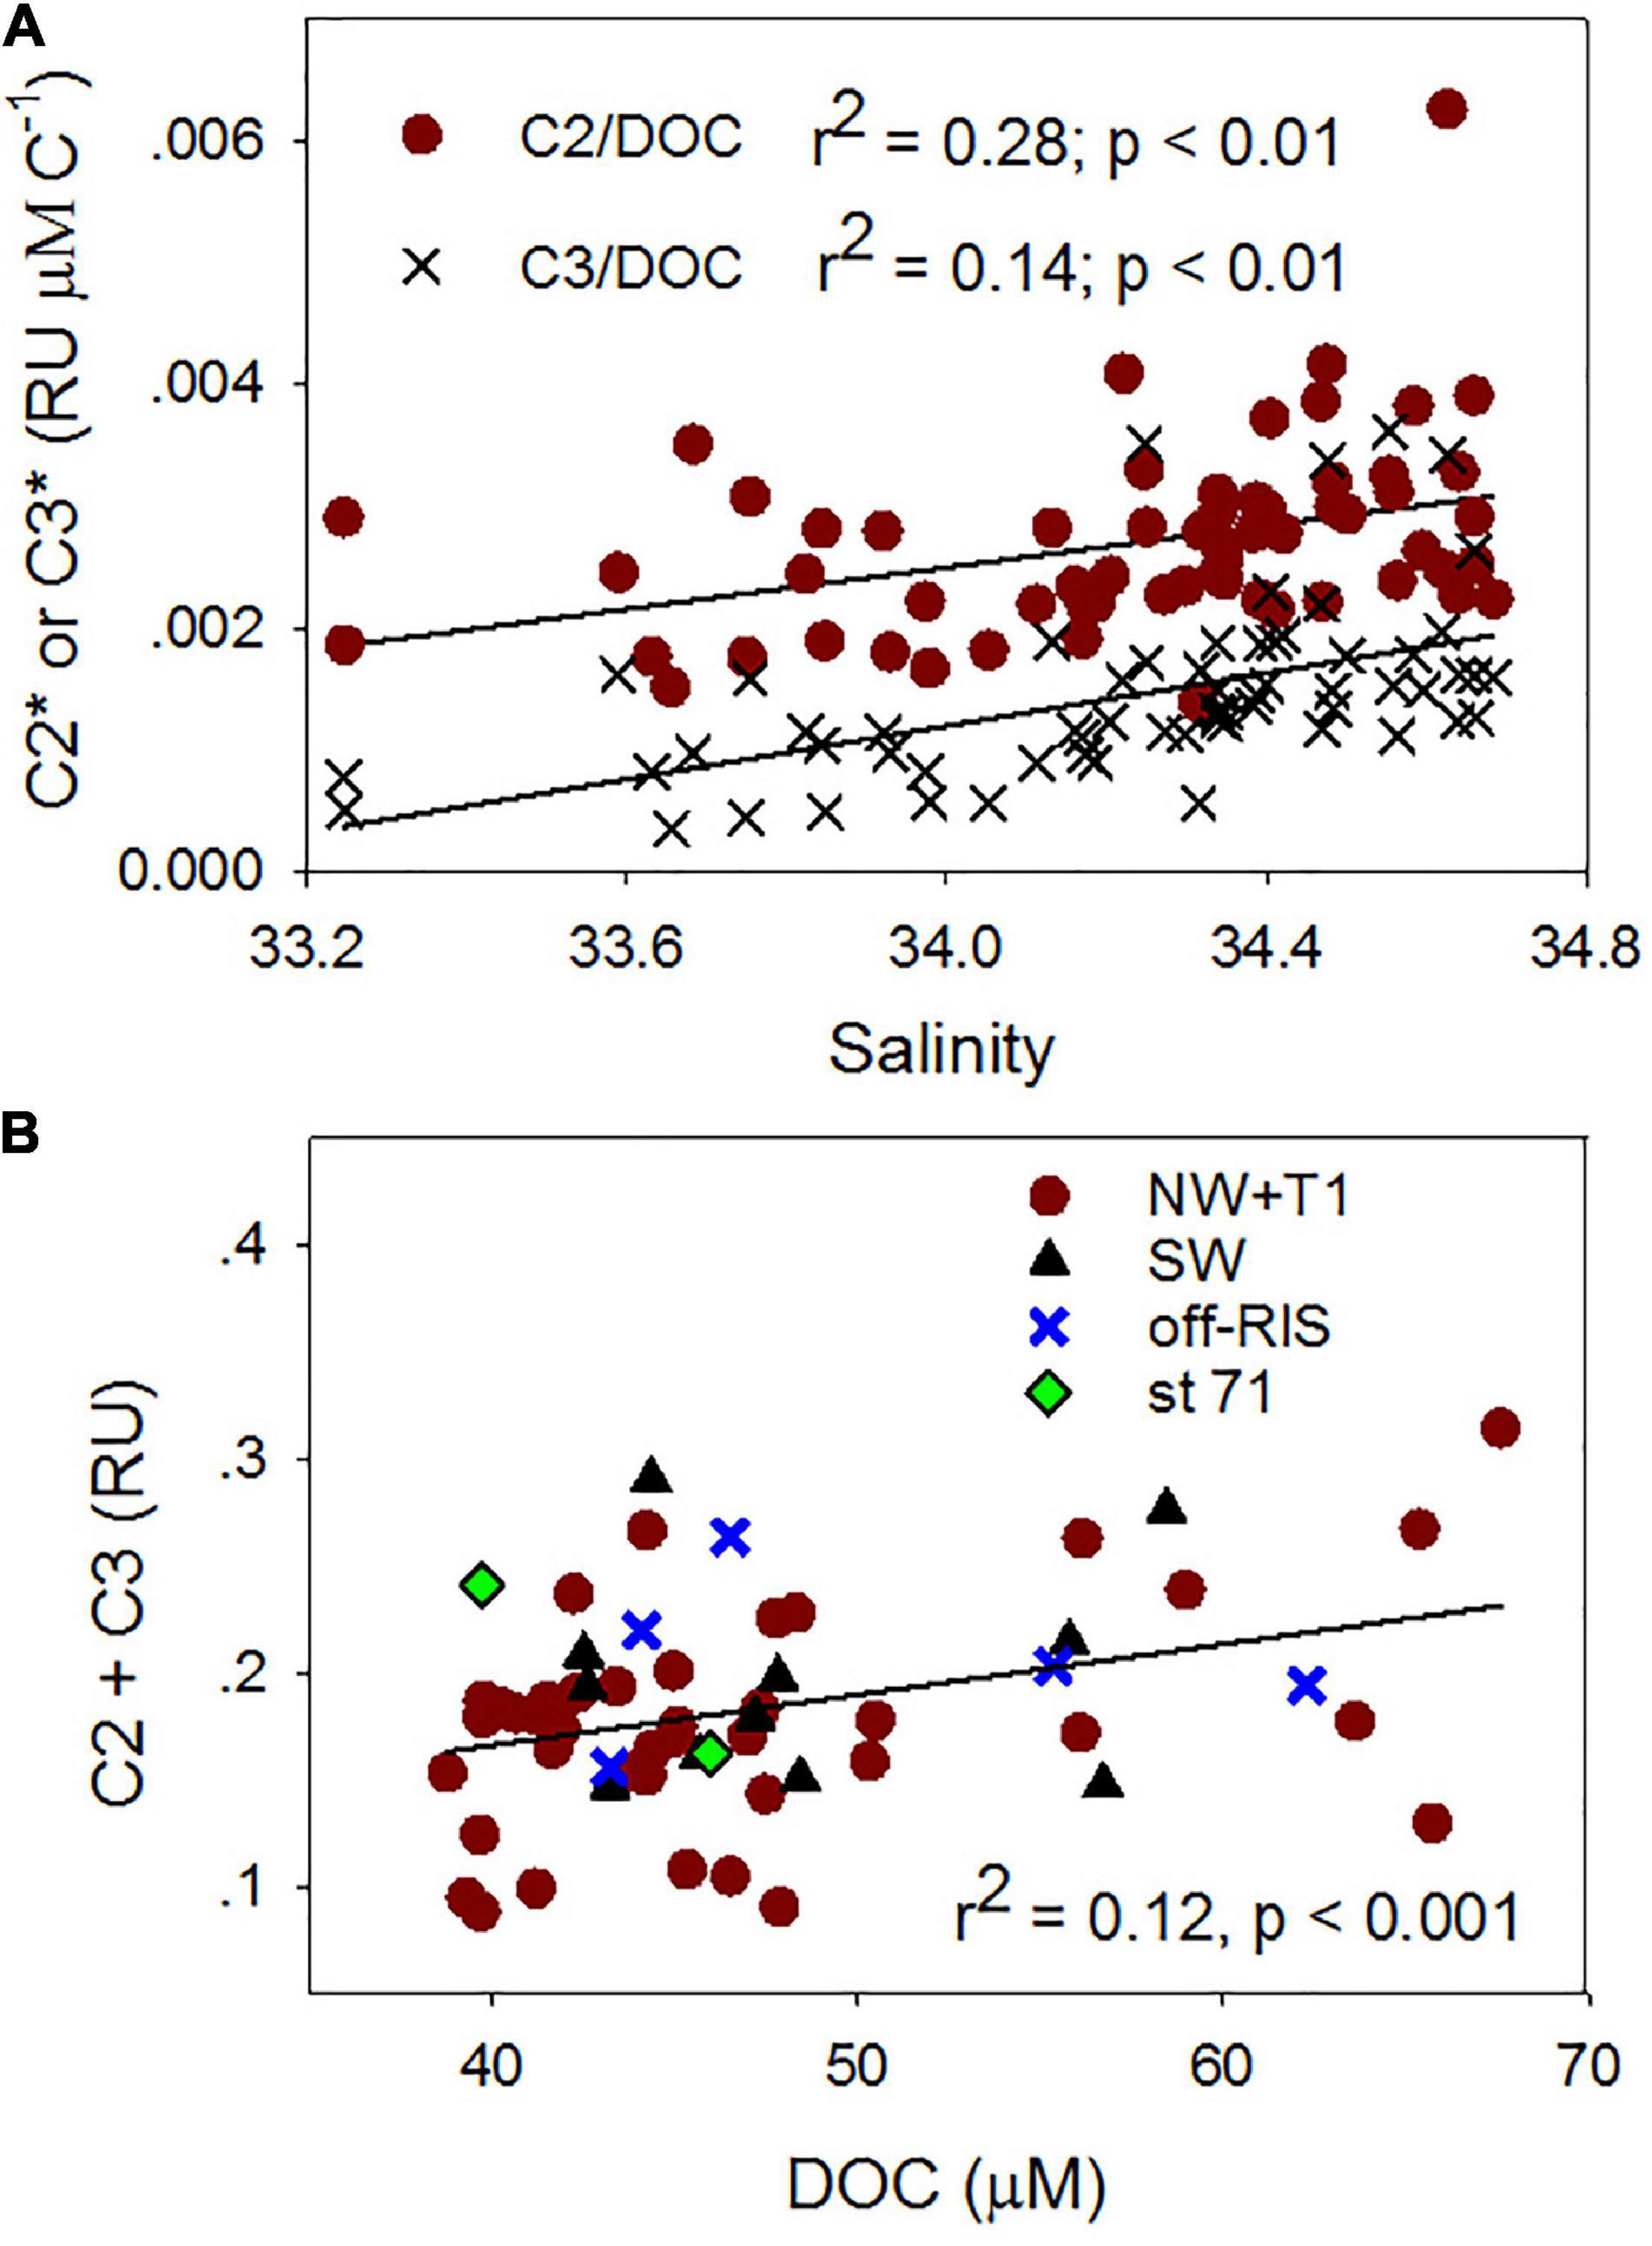
Figure 9. Fluorescent dissolved organic matter (FDOM) relationships. Relationships between (A) salinity and DOC normalized C2 (C2*) and C3 (C3*), (B) DOC and C2 + C3 fluorescent components for samples obtained in the upper water column (e.g., Figure 4).
Phytoplankton Absorption and Absorption Budget
The spectral characteristics of phytoplankton absorption coefficient aphy show differences in both magnitude and spectral shape in the Ross Sea (Figure 10). In the UV region, a peak at 320 nm attributed to photoprotective pigments was observed for most surface samples with the largest signal observed for the waters in the SW (Figure 10A). These peaks were mostly low or absent in subsurface samples, but remained elevated at stations 28 and 29 off the RIS (Figure 10B). In the visible (400–700 nm), absorption spectra exhibited a clear absorption peak at 443 nm associated with chlorophyll a pigment. Absorption spectra of surface samples (Figure 10A) were highest for the SW (sts 12, 15, 25 and 71) and lowest along the transect T1, and intermediate for the NW (sts 9, 10, and 11) and off the RIS (sts 28 and 29). Absorption spectra in the upper water column (4 depth intervals, generally up to 100 m or greater at a few at stations) show clear spectral differences (Figure 10B) that can be attributed to differences in phytoplankton taxa. Stations in the SW exhibit spectra with a single peak at 443 nm that show similarity to the diatom Fragilariopsis cylindrus (Arrigo et al., 2010), while at the two off-RIS stations (sts 28 and 29), a strong secondary absorption peak between 450–470 nm is observed for all the sampled depths that show similarity to the haptophyte Phaeocystis antarctica (Arrigo et al., 2010). At station 71, a chlorophyll spectral signature is clearly observed even at deeper depths (100 and 200 m). It is important to note, this species identification is based on visual comparisons of phytoplankton absorption spectra and is not confirmed by any explicit biological characterization.
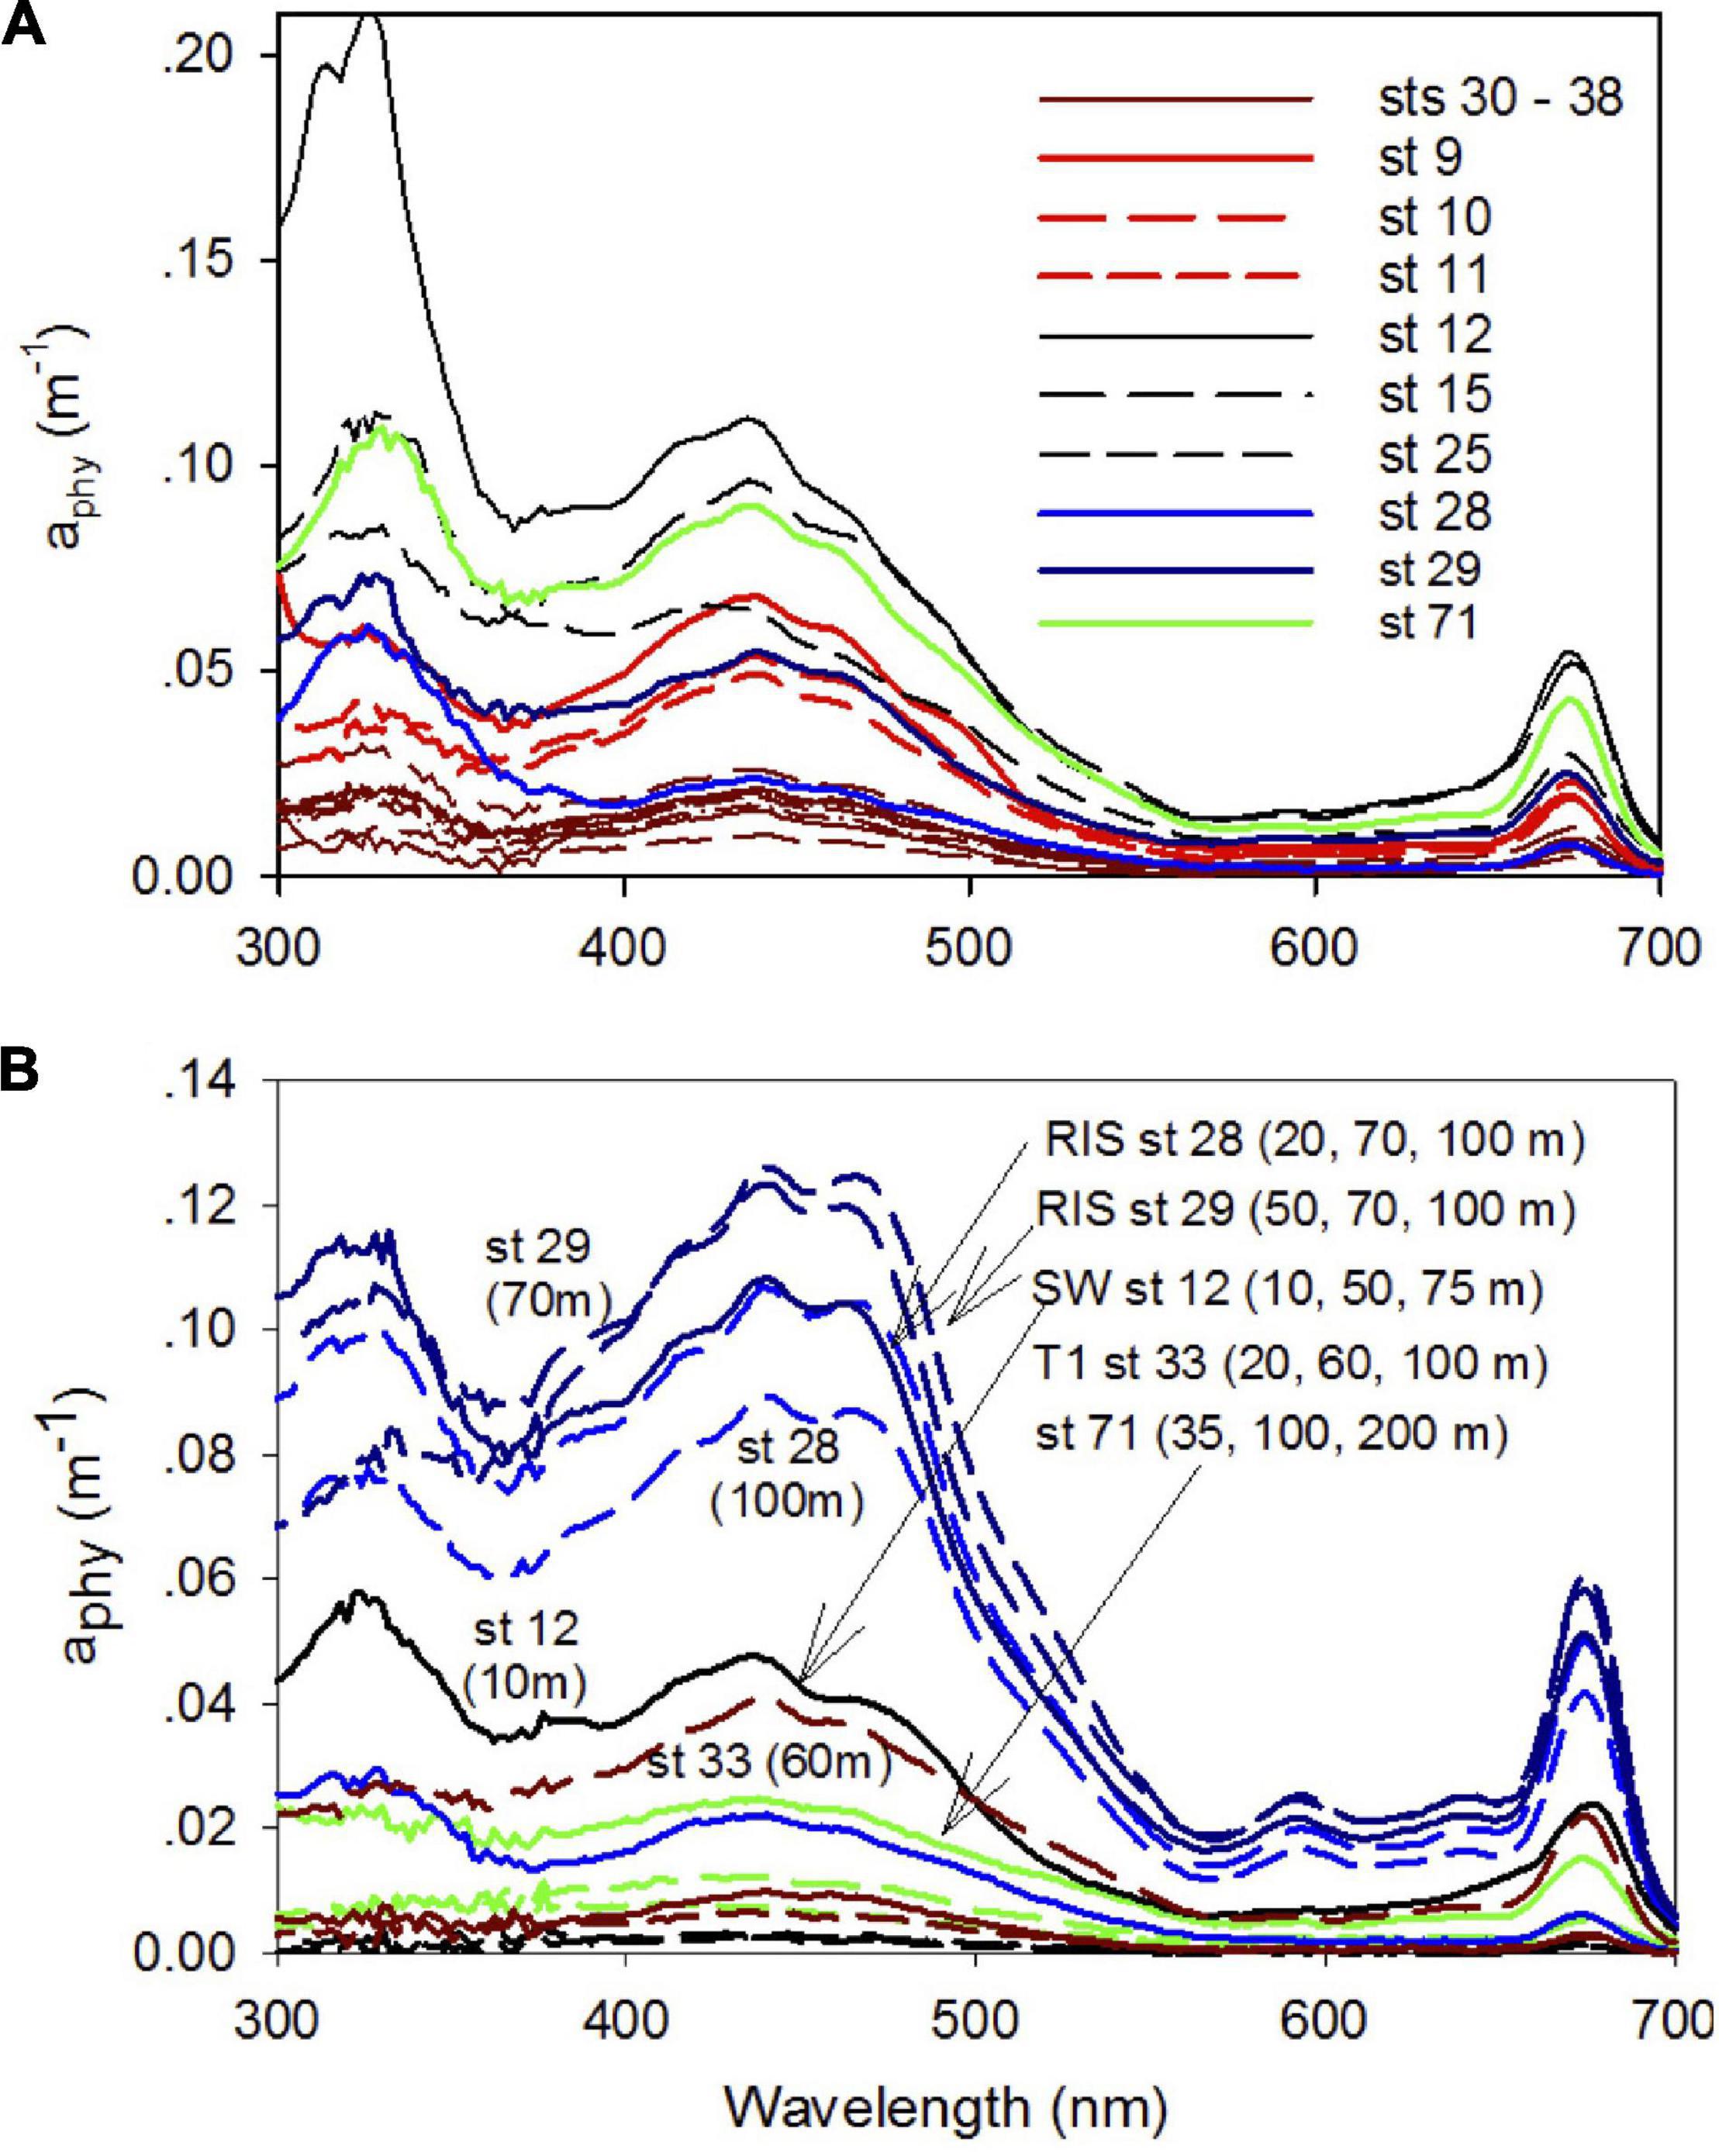
Figure 10. Phytoplankton absorption spectra. Phytoplankton spectral absorption coefficients between 300 and 700 nm at (A) surface in different regions of the shelf (NW + T1 – brown, SW – black, and off-RIS – blue) and (B) at different depths for typical stations in the SW (st 12), transect T1 (st 33), off-RIS (sts 28 and 29) and station 71.
Chromophoric dissolved organic matter absorption along with particulate matter absorption which includes phytoplankton aphy and non-algal particles anap are examined at 443 nm as it influences the light field and ocean color. anap443 showed good correlation to aphy443 (r2 = 0.72) (Figure 11A), while acdom443 was uncorrelated to both aphy443 and anap443. We examined the relative contribution of aphy443, anap443 and acdom443 to total non-water absorption at 443 nm (atnw443 = aphy443 + anap443 + acdom443) on a ternary plot (Figure 11B). The ternary plot shows the relatively strong contribution by CDOM in the visible with acdom443 contributing between 40–90% (mean 70.7 ± 18.3%), aphy443 about 22.5 ± 15.2% and anap443 only 6.1 ± 15.2% to the absorption budget; a caveat in this analysis is the unaccounted absorbance for particles between 0.2 μm and 0.7 μm due to filters used for CDOM and particulates, respectively.
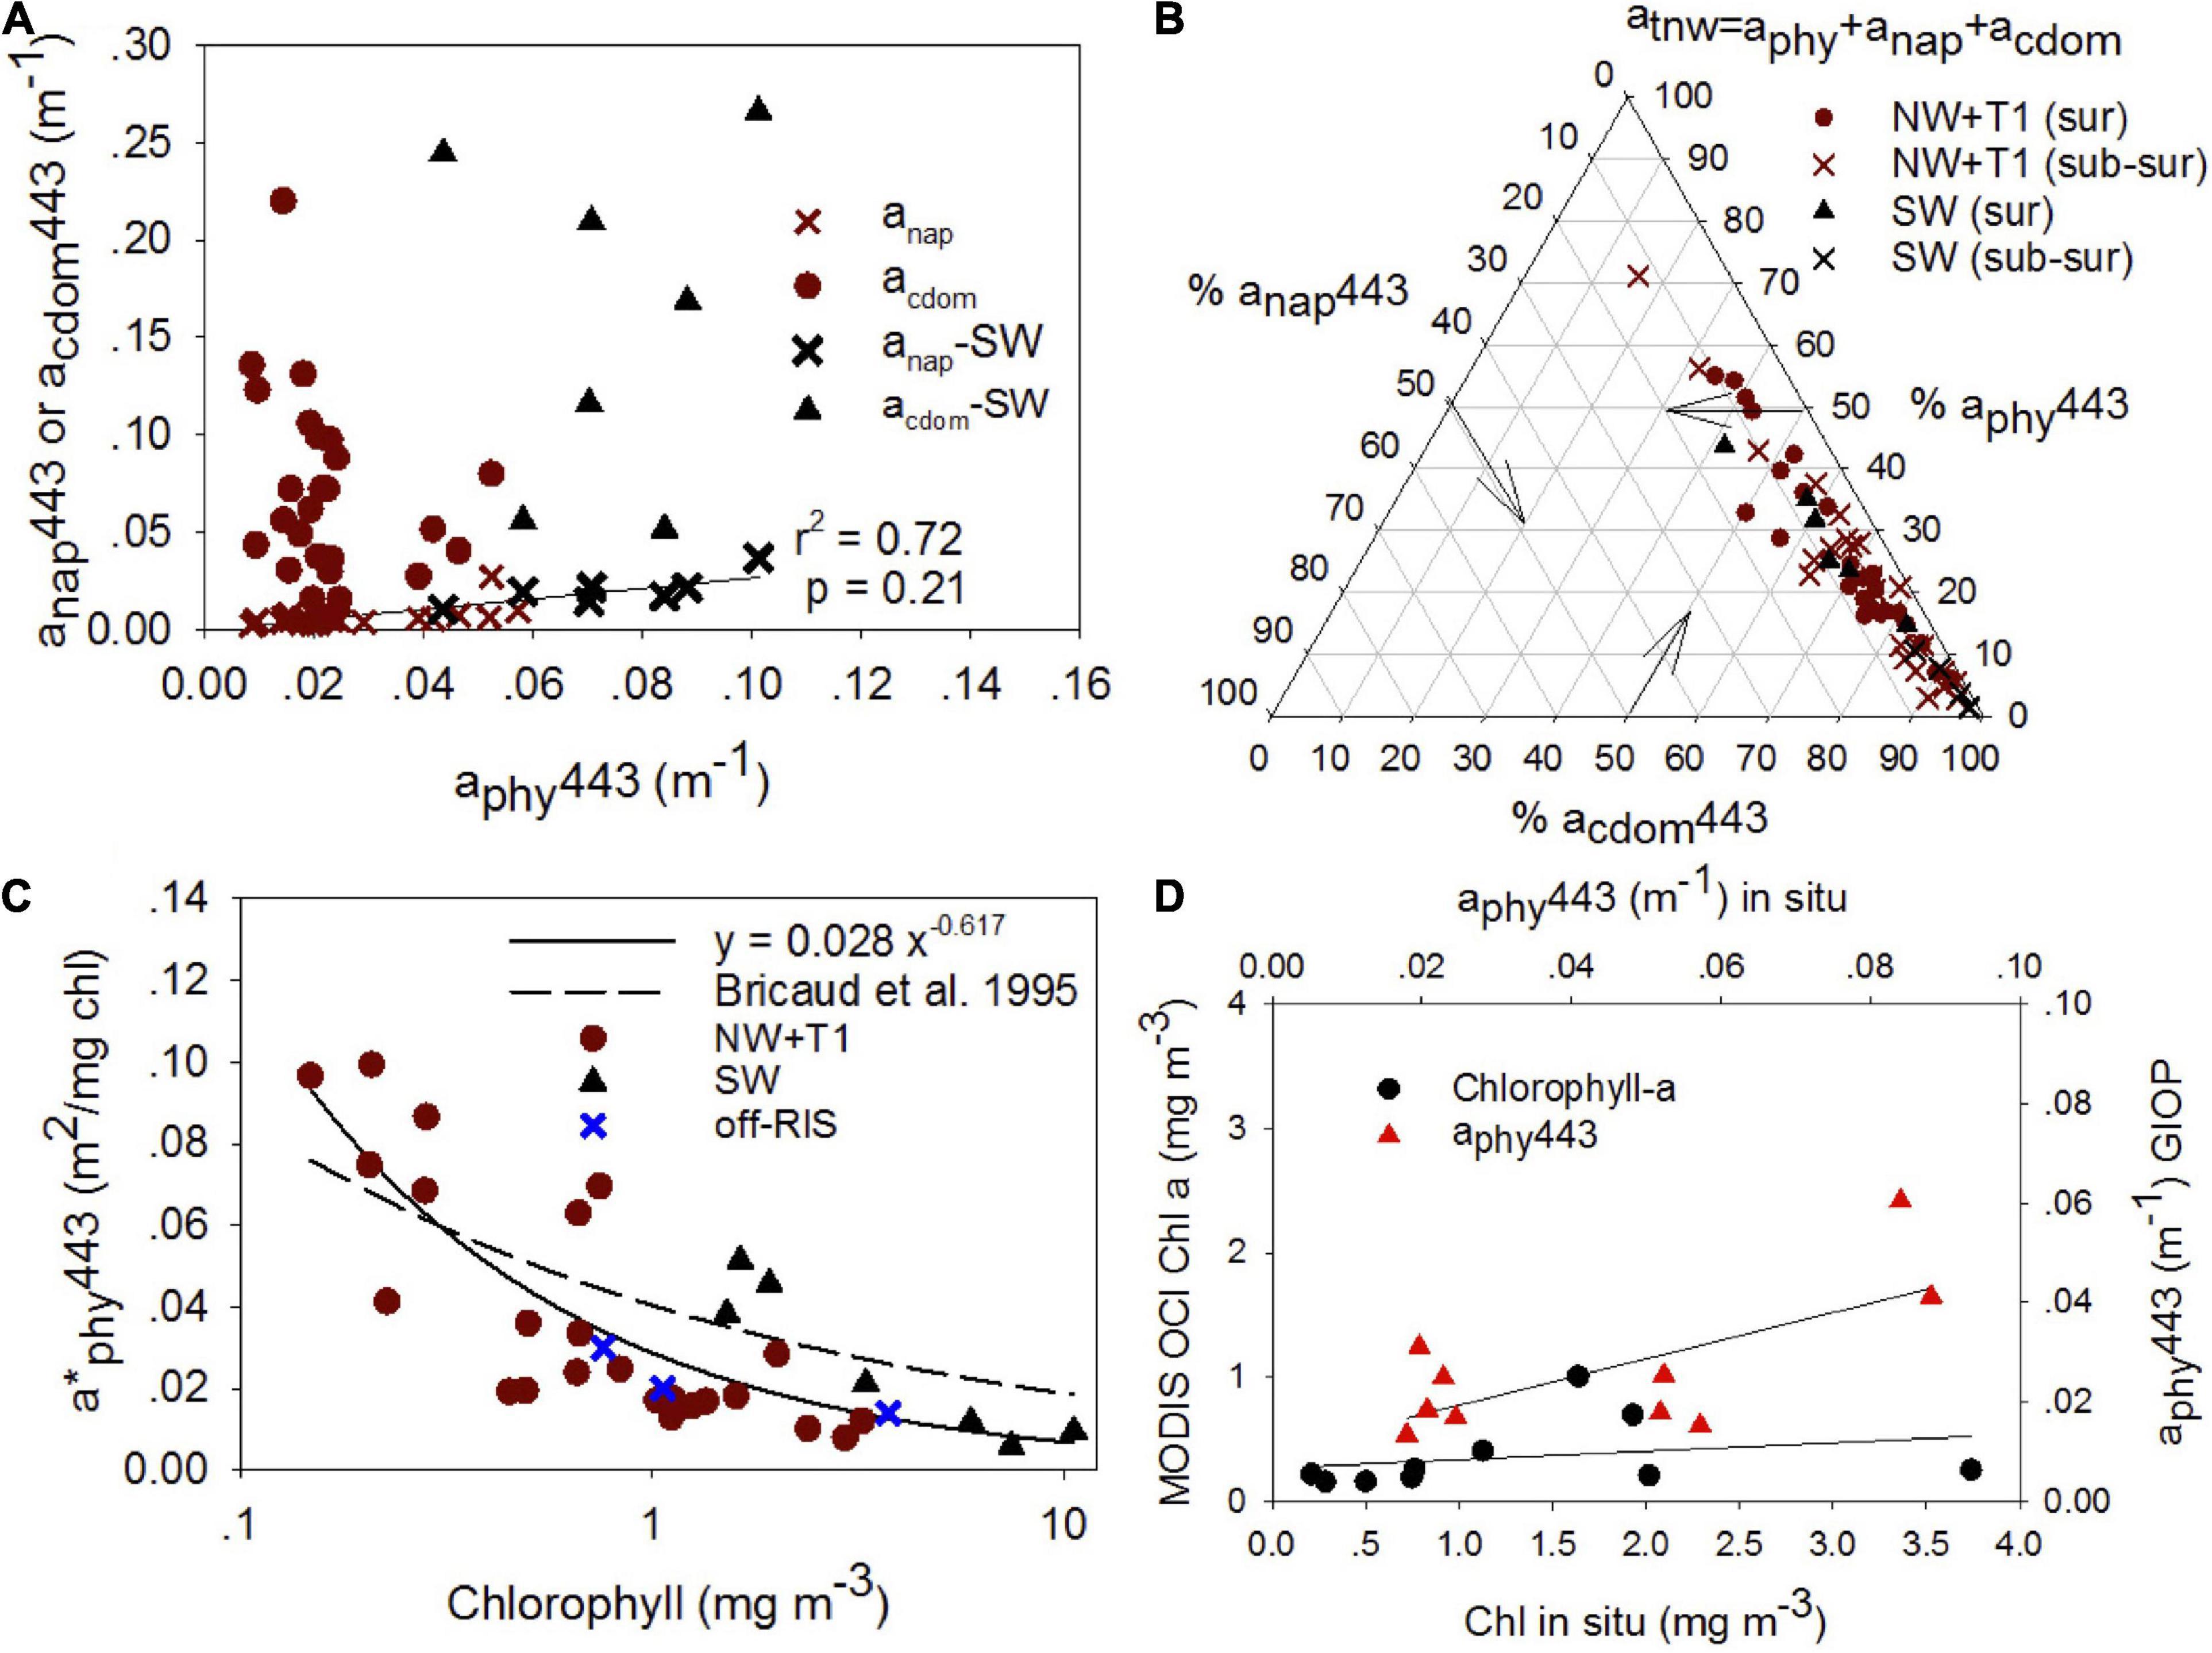
Figure 11. Particulate matter relationships and satellite estimates. (A) anap443 and ag443 vs aphy443 for surface (0 – 20 m), (B) Ternary plot showing the relative contributions (percent) of phytoplankton absorption (aphy), non-algal absorption (anap) and CDOM absorption (acdom) to total non-water absorption (atnw = aphy + anap + acdom) at 443 nm for surface (0 ∼ 20 m) and subsurface (> ∼20 m) waters, (C) relation between chlorophyll and specific phytoplankton absorption at 443 nm (a*phy443) for the SW and other regions of the shelf for surface waters (0 to ∼ 20 m). The regression fit for all the data are depicted. For comparison, the regression fit from Bricaud et al., 1995 study is shown (dashed line). (D) Comparison of in situ chlorophyll with standard NASA chlorophyll a algorithm (OCx) (black circles; y = 0.07 × + 0.27; r2 = 0.07; p = –0.13) and in situ aphy443 vs MODIS (red triangles; y = 0.37 × + 0.01; r2 = 0.47; p = 0.05) using the generalized NASA semi-analytic algorithm (GIOP).
We also examined the specific phytoplankton absorption spectra which are important in bio-optical models (Bricaud et al., 1998; Morel and Maritorena, 2001). A plot between chlorophyll and specific phytoplankton absorption at 443 nm (a∗phy443) for surface waters (0 to ∼20 m) shows decreasing a∗phy443 with increasing chlorophyll (Figure 11C), with SW stations showing greater values of a∗phy443 for similar range in chlorophyll concentrations. For comparison, we show the Bricaud et al. (1995) relationship which was derived from an extensive data set collected from six oceanic regions, but not including high latitude regions. Comparisons between in situ and average MODIS-derived chlorophyll using OCx algorithm and aphy443 using the GIOP algorithm are shown for January 2015 (Figure 11D).
Discussion
The Ross Sea Biophysical Properties
The Ross Sea polynya which increases with solar insolation during spring-summer, expanded rapidly northward from Dec into Jan 2014–15 austral summer (Figures 2A,B), with accompanying changes in surface algal biomass (Figures 2C,D). Such evolution of the Ross Sea polynya, which is also influenced by the variability in wind intensity and climate feedbacks (Park et al., 2018), plays an important role in the control of phytoplankton blooms and the biogeochemical cycling in the Ross Sea (Arrigo et al., 1998a; Dunbar et al., 1998; Asper and Smith, 1999; DiTullio et al., 2000). Our study area which encompassed most of the significant water masses in the Ross Sea (Figures 1A,B) included: (i) the northwest and a transect in central Ross Sea inshore of the shelf break (NW + T1), (ii) the southwest (SW), and (iii) off the RIS in the Ross Sea polynya (off-RIS). These three areas have been previously characterized into distinct biogeochemical regimes based on large gradients in biomass and phytoplankton community composition and differences in water column structure and stability, namely (i) the low-productivity NW and central shelf break region with diatom- or mixed diatom and Phaeocystis-dominated region, (ii) the diatom-dominated ice edge bloom region in the SW, and (iii) the Phaeocystis-dominated region north of the RIS (Goffart et al., 2000; Sweeney et al., 2000).
Along the northwest and inshore of the inner shelf transect (NW + T1), we observe the subsurface presence of the MCDW (warmer, saltier, and lower dissolved oxygen) at various locations linked to CDW incursions and mixing, and the inflow of nutrients and heat into the shelf (Jacobs et al., 1985). Average chlorophyll concentration in the NW + T1 section was the lowest compared to the SW and off-RIS (Figure 3 and Table 1). In the SW region with its shallow mixed layer, the phytoplankton absorption spectra (Figure 10) show similarities to Fragilariopsis cylindrus (Arrigo et al., 2010) and is consistent with past studies that indicate this region to be dominated by diatoms, especially the Fragilariopsis spp. (Arrigo et al., 2000; Goffart et al., 2000). At station 71 north of the Ross Island, elevated chlorophyll at subsurface and deeper depths (Figure 3) suggest sinking of the phytoplankton biomass, with phytoplankton absorption spectra showing similarities to diatom Fragilariopsis cylindrus (Figure 10; Arrigo et al., 2010). Rapid organic matter flux at settling rates of 60 to > 400 m d–1 have been reported in the SW region north of the Ross Island (Dunbar et al., 1998; Asper and Smith, 2003). Sustained elevated levels of phytoplankton biomass in the SW region especially north of Ross Island observed in satellite imagery during Dec and Jan (Figures 2C,D) could be a factor in the export of organic material to depths. North of the RIS, we observe deeper mixed layer depths with high subsurface chlorophyll concentrations (Figures 3D,E). Phytoplankton absorption spectra at these stations (Figure 10) show similarity to spectra of P. Antarctica with two peaks in the blue wavelengths (Arrigo et al., 2010), including a marked shoulder at ∼475 nm usually associated with alloxanthin and 19′-hexanoyloxyfucoxanthin pigments present in haptophyte phaeocystis; this is consistent with the dominance of P. antarctica generally reported in the region north of the RIS in the central Ross Sea polynya (Arrigo et al., 1999, 2000; Goffart et al., 2000; Sweeney et al., 2000).
Absorption Properties and Implications for Ocean Color
The spectral absorption properties of CDOM acdomλ, phytoplankton aphyλ and non-algal particles anapλ are important parameters to understand the behavior of underwater light field and in bio-optical models. The surface distributions of acdom, aphy and anap at 443 nm revealed distinct trends with higher absorption in the SW region of the Ross Sea (Figure 11A). Particulate matter absorption in the Ross Sea was dominated by phytoplankton, with aphy443 and anap443 well correlated. acdom443, which was the dominant contributor to the absorption budget (Table 2 and Figure 11B), was decoupled from aphy443, revealing that CDOM varied independently of phytoplankton in spite of its dominant role as a source of excess CDOM in the Ross Sea; this knowledge can be useful in improving satellite ocean color algorithm performance in the Ross Sea (e.g., Figure 11D).
The specific phytoplankton absorption a∗phyλ showed variability in the blue (443 nm) with a∗phy443 decreasing from 0.120 to 0.005 m2 (mg chl a)–1 with increasing chlorophyll (0.05 to 12 mg m–3). However, distinct trends in the SW suggest differences in pigment packaging and/or change in pigment composition (Bricaud et al., 1995) that is consistent with the phytoplankton taxa reported in past work (DiTullio and Smith, 1996; Arrigo et al., 1999, 2000; Smith et al., 2014), and as observed in the phytoplankton absorption spectra (Figure 10); further, higher a∗phy443 also suggest better light adaptation by diatoms in the SW. The a∗phy443 versus chlorophyll relationship shows similarity to other high latitude regions (e.g., Naik et al., 2013), but is lower than the fit reported by Bricaud et al. (1995), which was obtained for middle and lower latitude waters (Figure 11C). These differences in the a∗phyλ in the blue and other wavelengths including the green band has been shown to lead to underestimations in satellite derived chlorophyll (Arrigo et al., 1998b; Dierssen and Smith, 2000), as also demonstrated in our study (Figure 11D). We also observe that the satellite imagery misses the large sub-surface blooms observed north of the RIS in the Ross Sea polynya, thus likely underestimating satellite-derived productivity in the Ross Sea. This study demonstrates the need to better characterize linkages between bio-optical and biophysical systems in this highly productive region of the Southern Ocean.
Dissolved Organic Carbon and Dissolved Organic Matter Optical Properties and Sources
In spite of the various water masses, algal blooms and dominance of different phytoplankton species within different regions of the Ross Sea, DOC concentrations (mean: 47.82 ± 5.70 μM) during late summer varied over a relatively narrow range (38.75–67.58 μM; Figure 4A) consistent with previous studies (Carlson et al., 1998, 2000) and was ∼6.02 μM greater than the mean concentrations (41.8 ± 0.80 μM) obtained during late winter/early spring when waters are well mixed over the entire water column of the Ross Sea (Carlson et al., 2000). This excess summer DOC accumulation is slightly lower than the ∼7 μM enriched DOC in the DSW relative to the incoming MCDW reported by Bercovici et al. (2017). The relatively small magnitude of DOC production and accumulation in the Ross Sea was found to be nitrogen-rich compared to background DOM and referred to as “semi-labile” DOM (Carlson et al., 2000), with overall mean DOC concentrations at similar levels in the different regions of the Ross Sea (Table 1).
As in the case of DOC, the distribution of the three FDOM components showed no discernable regional trends in the Ross Sea (Figure 9 and Table 2). The three identified PARAFAC components (Figure 8 and Table 2) include C1 protein-like (predominantly Coble, 1996 peak T), C2 humic-like (peaks A and C) and C3 humic-like (peak M); these components are similar to other widely derived FDOM fractions in the global ocean (Yamashita and Tanoue, 2003; Coble, 2007; Jorgensen et al., 2011; D’Sa et al., 2014; Murphy et al., 2018) including the Southern Ocean (Wedborg et al., 2007; D’Sa and Kim, 2017; Chen et al., 2019; Jeon et al., 2021). However, while the three retrieved PARAFAC components in the Ross Sea were similar to that reported in the Amundsen Sea, Antarctica (Jeon et al., 2021), these FDOM components differed from another study in the same region by the absence of the tyrosine-like component linked to high abundance of low molecular weight DOC (Chen et al., 2019). An approach that combines both FDOM and DOM molecular size fractions (e.g., Chen et al., 2019) may help elucidate similarities or differences in the DOM pool within the same or different regions of the Southern Ocean.
Fluorescence dissolved organic matter production of T- and M-like fractions have been shown to be exuded by marine phytoplankton (Romera-Castillo et al., 2010), while the formation of more complex molecules associated with peaks A and C could be mediated by the bacterial degradation of phytoplankton-derived organic matter (Kinsey et al., 2018; Goto et al., 2020), suggesting that in remote locations such as the Ross Sea, autochthonous FDOM production associated with the spring/summer phytoplankton blooms would be expected. As an example, Figure 7 demonstrates increasing levels of both protein- and humic-like FDOM with increasing depths (surface to 200 m) at a station with sinking algal biomass (Figures 3, 10) undergoing remineralization (as indicated by the relatively low water column dissolved oxygen (Supplementary Figure 1B). Similar increases of both protein- and humic-like FDOM were observed at the subsurface P. antarctica bloom stations off-RIS (Supplementary Figure 2A) that show similarity to EEMs spectra described in Goto et al. (2020). The relatively high mean BIX value (> 1.0), the biological index parameter for which values > 0.8 suggest DOM with an obvious component of freshly produced organic matter of biological origin (Huguet et al., 2009), also support FDOM production in the Ross Sea. The generally increasing trend of DOC normalized C2 and C3 component intensities (Figure 9A) with increasing salinity suggest both effects of FDOM photooxidation and/or production in the upper water column of the Ross Sea. The weak, but significant correlation between DOC concentrations and the C2 + C3 humic-like components (Figure 9B) also indicate a close linkage between DOM and FDOM in the Ross Sea. The C1 protein-like component was however, more variable (Table 2) and varied over a greater range extending from below the detection limit to a high of 0.7 RU; such variability could be due to both production and consumption of colored materials by phytoplankton and bacteria (Romera-Castillo et al., 2011).
In contrast, CDOM showed significant differences between SW (acdom325: 0.63 ± 0.19 m–1 and spectral slope S275–295: 24.06 ± 2.93 μm–1) throughout the upper water column (Figures 4B,C) compared to the rest of the study area (acdom325: 0.25 ± 0.08 m–1; slope S275–295: 28.55 ± 1.90 μm–1). This compares to an increase in S275–295 and acdom325 of 0.142 ± 0.01 m–1 reported before a Pheocystis antarctica bloom in Nov 2005 within the Ross Sea polynya (Kieber et al., 2009), suggesting an approximate doubling of CDOM accumulation (∼0.11 m–1) over the summer (we note that measurements were obtained 10-years apart on different instruments). These acdom325 values are higher than those reported for the AABW (∼0.19 ± 0.01 m–1; Catala et al., 2015) or the surface waters of the New Zealand sector of the Southern Ocean (∼0.10 ± 0.06 m–1; D’Sa and Kim, 2017). A decreasing trend of S275–295 with increasing acdom325 (Figure 6D) suggest greater photobleaching in the stratified waters of the NW and the central Ross Sea polynya. CDOM values however, were on average highest in the SW with lowest S275–295, showing generally similar properties within the upper 100 m including the shallow surface mixed layer (Figures 4, 6) suggesting greater molecular weight and aromaticity of DOM in the SW; SUVA254, a useful proxy for DOM aromatic content (Weishaar et al., 2003) also indicated DOM in the SW to be more aromatic suggesting an additional source of CDOM in the SW. The slope ratio SR which has been linked to shifts in DOM molecular weight and photobleaching (higher slope ratios reflective of greater amounts of low molecular weight compounds; Helms et al., 2008), were within the range of 1.60–3.17, with mean values of 2.31 ± 0.37 for the NW + T1, 2.48 ± 0.33 off-RIS, and 2.62 ± 0.58 for station 71, but lowest value of 2.23 ± 0.33 for the SW (Table 1), suggesting relatively higher molecular weight DOM in the SW compared to other regions of the Ross Sea. Similar values have been observed in the subsurface subarctic waters and the deep ocean (Yamashita et al., 2013; Catala et al., 2015). Interestingly, an increase in the mean CDOM optical properties (acdom325, S275–295 and SR: 0.21 ± 0.01 m–1, 19.55 ± 1.0 μm–1 and 1.8 ± 0.1; Catala et al., 2015) in the CDW (the source waters for the Ross Sea) to (0.31 ± 0.18 m–1, 28.12 ± 3.24 μm–1, and 2.33 ± 0.38; Table 1) summer Ross Sea values strongly suggest DOM/CDOM enrichment in the Ross Sea with lower molecular weight fraction associated with the spring/summer phytoplankton bloom events. Further, lower values of CDOM optical properties in the AABW (linked to the outflowing DSW) which are observed to be similar to the CDW (Catala et al., 2015), suggest the eventual microbial degradation (Yamashita et al., 2013) of the Ross Sea DOM/CDOM. A similar process of microbial remineralization of the enriched Ross Sea DOM that is exported off the shelf has been proposed (Bercovici et al., 2017).
Chromophoric Dissolved Organic Matter Sources in the Southwest Ross Sea
While the Ross Sea DOC and CDOM enrichment (with reference to background values in late winter/early spring) can be attributed to the spring/summer phytoplankton blooms, the relatively high CDOM absorption and low spectral slope values throughout the upper water column in the SW region (Figures 4B,C and Table 1) appear to be linked to the dominance of diatoms in the highly stratified waters of the SW. We examine two factors that could have contributed to these distinct CDOM optical properties:
(i) Phytoplankton absorption spectra of surface and some sub-surface samples showed elevated values in the UV (300–400 nm) with peaks at ∼320 nm (Figure 10) mainly in the diatom- and haptophyte-dominated waters of the SW and off-RIS; these peaks have been attributed to mycosporine like amino acids (MAAs), a group of UV absorbing compounds that act as a sunscreen to reduce UV induced damage (Riegger and Robinson, 1997; Moisan and Mitchell, 2001). The amplitude of these absorption peaks was greater in the shallow mixed layer surface waters of the SW (Figure 10A) where, microphytoplankton such as diatoms have been shown to biosynthesize MAAs more efficiently in comparison to smaller nano- and picophytoplankton (Ha et al., 2018). Although relatively high levels of MAAs have been shown to influence CDOM absorption, especially in the UV region (D’Sa, 2008), elevated CDOM absorption in the surface as well as subsurface waters of the SW (Figure 4B) where phytoplankton absorption in the UV was low or negligible (Figure 10B), suggest MAAs were an unlikely contributor to the CDOM anomaly in the SW.
(ii) Antarctic krill (Euphausia superba) and ice krill (E. crystallorophias) are the two dominant species found in the Ross Sea (Ainley et al., 2006; Smith et al., 2007) with Antarctic krill dominant in the northern and northwestern areas of the Ross Sea and ice krill predominant in the southwestern areas (Davis et al., 2017). Our sampling region in the SW which is close to Terra Nova Bay (e.g., station 15, Figure 1) has been shown to have high krill population (Sala et al., 2002), with krill aggregations observed to be distributed in discrete layers in the upper water column (Kang et al., 2020). Other dominant grazers such as copepods and Limacina helecina that perform diel migration in the upper 200 m have also been identified in the diatom dominated western Ross Sea (Goffart et al., 2000). Antarctic krill has been confirmed as a direct source of CDOM in the peninsular region of the Southern Ocean (Ortega-Retuerta et al., 2009), while CDOM production by zooplankton along with active DOC transport through zooplankton vertical migration has also been reported (Steinberg et al., 2002, 2004). In addition, we observe similarities of the SW CDOM absorption spectra (Figure 5, station 15) to that produced by krill (Ortega-Retuerta et al., 2009) and zooplankton (Steinberg et al., 2004). These combined factors strongly support grazer contribution to the CDOM anomaly observed in the SW.
The anomaly in the SW CDOM optical properties (low S275–295 and high SUVA254) also suggest grazer generated DOM of greater aromaticity and molecular weight (Weishaar et al., 2003; Helms et al., 2008) that demonstrate the important role that grazers such as Antarctic krill could play in the biogeochemical cycling in some regions of the Southern Ocean due to their extraordinary high biomass (Alcaraz et al., 2014; Cavan et al., 2019). Owing to potential for long-term changes in krill stock within the Southern Ocean (Atkinson et al., 2004), future field campaigns should integrate studies of krill and DOC/CDOM measurements in this region.
Conclusion
The Ross Sea, one of the most remote and productive shelf regions in the Southern Ocean, undergoes seasonal spring/summer phytoplankton blooms that play an important role in the marine carbon cycle. In this study, we examined upper water column DOC concentrations, CDOM absorption and fluorescent properties in conjunction with biophysical properties that indicated DOC and CDOM accumulation and FDOM production during austral summer in the Ross Sea. Consistent with past studies that identified major biogeochemical regimes in the Ross Sea, we observed differences in phytoplankton absorption properties (spectral absorption and specific absorption coefficients) that were characteristic of diatom- and phaeocystis-dominated regions in the SW and off the RIS. These properties, including the dominant contribution by CDOM to the total absorption, have implications for ocean color and demonstrate the need to better characterize bio-optical properties in the Ross Sea.
We observed no discernible regional trends in DOC concentrations in the Ross Sea, with the DOC accumulation during summer associated with the spring/summer phytoplankton blooms consistent with previously reported values. Similarly, FDOM fractions showed no discernible regional trends, with the DOC normalized humic-like C2 and C3 components and sum of humic-like FDOM components showing weak, but significant positive correlation to salinity and DOC, respectively. Further, high BIX value and an instance of increasing FDOM with depth at a location with sinking organic matter strongly suggest FDOM production in the Ross Sea.
In contrast, we observed regional differences in the CDOM absorption properties in the Ross Sea. High acdom325, low S275–295 and high SUVA254 in the SW suggest CDOM of greater aromaticity and molecular weight that appear to be linked to biogeneration by krill, the dominant planktonic grazer in the region. Overall, mean CDOM optical properties (acdom325, S275–295 and SR) in the Ross Sea revealed DOM of lower molecular weight during summer in comparison to the inflowing CDW source waters and the AABW linked to the outflowing DSW. This study enhanced our understanding of DOC, CDOM and FDOM characteristics and dynamics in the Ross Sea; it also provided insights on the potentially important contribution of Antarctic krill to carbon cycling that should be considered in future studies due to their extraordinary high biomass in the Southern Ocean.
Data Availability Statement
The raw data supporting the conclusions of this article will be made available by the authors, without undue reservation.
Author Contributions
EJD and H-CK designed the study. EJD, H-CK, S-YH, and IJ contributed to this work through sample and data collection or processing of the field data. EJD analyzed the data and drafted the manuscript with contribution of all authors. All authors reviewed and approved the final version of the manuscript.
Funding
Funding for this work was provided by a Korea Polar Research Institute (KOPRI) grant PE21040 (Optimum Utilization of Satellite Data for Polar Research).
Conflict of Interest
The authors declare that the research was conducted in the absence of any commercial or financial relationships that could be construed as a potential conflict of interest.
Publisher’s Note
All claims expressed in this article are solely those of the authors and do not necessarily represent those of their affiliated organizations, or those of the publisher, the editors and the reviewers. Any product that may be evaluated in this article, or claim that may be made by its manufacturer, is not guaranteed or endorsed by the publisher.
Acknowledgments
The authors would like to express their thanks and appreciation to the captain and crew of IBRV Araon for assistance in collecting the samples and data. The authors also thank NASA GSFC for making available the satellite data. The use of the Ocean Data Viewer (http://odv.awi.de) is also gratefully acknowledged.
Supplementary Material
The Supplementary Material for this article can be found online at: https://www.frontiersin.org/articles/10.3389/fmars.2021.749096/full#supplementary-material
Footnotes
References
Ainley, D. G., Ballard, G., and Dugger, K. M. (2006). Competition among penguins and cetaceans reveals trophic cascades in the western Ross Sea, Antarctica. Ecology 87, 2080–2093. doi: 10.1890/0012-9658(2006)87[2080:CAPACR]2.0.CO;2
Alcaraz, M., Almeda, R., Duarte, C. M., Horstkotte, B., Lastemas, S., and Agusti, S. (2014). Changes in the C, N, and P cycles by the predicted salps-krill shift in the Southern Ocean. Front. Mar. Sci. 1:45. doi: 10.3389/fmars.2014.00045
Arrigo, K. R., and Van Dijken, G. L. (2003). Phytoplankton dynamics within 37 Antarctic coastal polynya systems. J. Geophys. Res. Oceans. 108:3271. doi: 10.1029/2002JC001739
Arrigo, K. R., DiTullio, G. R., Dunbar, R. B., Lizotte, M. P., Robinson, D. H., Van Woert, M., et al. (2000). Phytoplankton taxonomic variability and nutrient utilization and primary production in the Ross Sea. J. Geophys. Res. 105, 8827–8846. doi: 10.1029/1998JC000289
Arrigo, K. R., Mills, M. M., Kropuenske, L. R., van Dijken, G. L., Alderkamp, A.-C., and Robinson, D. H. (2010). Photophysiology in two major Southern Ocean phytoplankton taxa: Photosynthesis and growth of Phaeocystis Antarctica and Fragiriopsis cylindrus under different irradiance levels. Integ. Compar. Biol. 50, 950–966. doi: 10.1093/icb/icq021
Arrigo, K. R., Robinson, D. H., Worthen, D. L., Schieber, B., and Lizotte, M. P. (1998b). Bio-optical properties of the southwestern Ross Sea. J. Geophys. Res. 103, 21683–21695. doi: 10.1029/98JC02157
Arrigo, K. R., van Dijken, G. L., and Bushinsky, S. (2008). Primary production in the Southern Ocean, 1997-2006. J. Geophys. Res., Oceans 113:C08004. doi: 10.1029/2007JC004551
Arrigo, K. R., Weiss, A. M., and Smith, W. O. (1998a). Physical forcing of phytoplankton dynamics in the southwestern Ross Sea. J. Geophys. Res. Oceans 103, 1007–1021. doi: 10.1029/97JC02326
Arrigo, K. R., Worthen, D. L., Robinson, D. H., Dunbar, R. B., DiTullio, G. R., VanWoert, M., et al. (1999). Phytoplankton community structure and the drawdown of nutrients and CO2 in the Southern Ocean. Science 283, 365–367. doi: 10.1126/science.283.5400.365
Asper, V. L., and Smith, W. O. Jr. (1999). Particle fluxes during austral spring and summer in the southern Ross Sea, Antarctica. J. Geophys. Res. 104, 5345–5359. doi: 10.1029/1998JC900067
Asper, V. L., and Smith, W. O. Jr. (2003). Abundance, distribution and sinking rates of aggregates in the Ross Sea, Antarctica. Deep-Sea Res. I 50, 131–150. doi: 10.1016/S0967-0637(02)00146-2
Atkinson, A., Siegel, V., Pakhomov, E., and Rothery, P. (2004). Long-term decline in krill stock and increase in salps within the Southern Ocean. Nature 432, 100–103. doi: 10.1038/nature02996
Benner, R., and Strom, M. (1993). A critical evaluation of the analytical blank associated with DOC measurements by high temperature catalytic oxidation. Mar. Chem. 41, 153–160. doi: 10.1016/0304-4203(93)90113-3
Bercovici, S. K., Huber, B. A., Dejong, H. B., Dunbar, R. B., and Hansell, D. A. (2017). Dissolved organic carbon in the Ross Sea: Deep enrichment and export. Limnol. Oceanogr. 62, 2593–2603. doi: 10.1002/lno.10592
Blough, N. V., and Del Vecchio, R. (2002). “Chromophoric DOM in the coastal environment,” in Biogeochemistry of Marine Dissolved Organic Matter, eds D. A. Hansell and C. A. Carlson (San Diego, CA: Academic Press), 509–546. doi: 10.1016/B978-012323841-2/50012-9
Bricaud, A., Babin, M., Morel, A., and Claustre, H. (1995). Variability in the chlorophyll specific absorption-coefficients of natural phytoplankton — analysis and parameterization. J. Geophys. Res. 100, 13321–13332. doi: 10.1029/95JC00463
Bricaud, A., Morel, A., Babin, M., Allali, K., and Claustre, H. (1998). Variations of light absorption by suspended particles with chlorophyll a concentration in oceanic (case 1) waters: analysis and implications for biooptical models. J. Geophys. Res. 103, 31033–31044. doi: 10.1029/98JC02712
Budillon, G., Pacciaroni, M., Cozzi, S., Rivaro, P., Catalano, G., Ianni, C., et al. (2003). An optimum multiparameter mixing analysis of the shelf waters in the Ross Sea. Antarct. Sci. 15, 105–118. doi: 10.1017/S095410200300110X
Carlson, C. A. (2002). “Production and removal processes,” in Biogeochemistry of Marine Dissolved Organic Matter, eds D. A. Hansell and C. A. Carlson (New York: Academic), 91–151. doi: 10.1016/B978-012323841-2/50006-3
Carlson, C. A., and Hansell, D. A. (2015). “DOM sources, sinks, reactivity, and budgets,” in Biogeochemistry of Marine Dissolved Organic Matter, eds D. A. Hansell and C. A. Carlson (New York: Academic), 65–126. doi: 10.1016/B978-0-12-405940-5.00003-0
Carlson, C. A., Ducklow, H. W., Hansell, D. A., and Smith, W. O. (1998). Organic carbon partitioning during spring phytoplankton blooms in the Ross Sea polynya and the Sargasso Sea. Limnol. Oceanogr. 43, 375–386. doi: 10.4319/lo.1998.43.3.0375
Carlson, C. A., Hansell, D. A., Peltzer, E. T., and Smith, W. O. Jr. (2000). Stocks and dynamics of dissolved and particulate organic matter in the southern Ross Sea, Antarctica. Deep-Sea Res. II. 47, 3201–3225. doi: 10.1016/S0967-0645(00)00065-5
Catala, T. S., Reche, I., Alvarez, M., Khatiwala, S., Guallart, E. F., Benitez-Barrios, V. M., et al. (2015). Water mass age and aging driving chromophoric dissolved organic matter in the dark global ocean. Glob. Biogeochem. Cycles 29, 917–934. doi: 10.1002/2014GB005048
Cavan, E. L., Belcher, A., Atkinson, A., Hill, S. L., Kawaguchi, S., McCormack, S., et al. (2019). The importance of Antarctic krill in biogeochemical cycles. Nat. Commun. 10:4742. doi: 10.1038/s41467-019-12668-7
Chen, M., and Jaffé, R. (2014). Photo- and bio-reactivity patterns of dissolved organic matter from biomass and soil leachates and surface waters in a subtropical wetland. Water Res. 61, 181–190. doi: 10.1016/j.watres.2014.03.075
Chen, M., Jung, J., Lee, Y. K., Kim, T. W., and Hur, J. (2019). Production of tyrosine-like fluorescence and labile chromophoric dissolved organic matter (DOM) and low surface accumulation of low molecular weight-dominated DOM in a productive Antarctic sea. Mar. Chem. 213, 40–48. doi: 10.1016/j.marchem.2019.04.009
Clementson, L. A., Parslow, J. S., Turnbull, A. R., McKenzie, D. C., and Rathbone, C. E. (2001). Optical properties of waters in the Australasian sector of the Southern Ocean. J. Geophys. Res. 106, 611–631. doi: 10.1029/2000JC000359
Coble, P. (2007). Marine optical biogeochemistry: The chemistry of ocean color. Chem. Rev. 107, 402–418. doi: 10.1021/cr050350+
Coble, P. G. (1996). Characterization of marine and terrestrial DOM in seawater using excitation-emission matrix spectroscopy. Mar. Chem. 51, 325–346. doi: 10.1016/0304-4203(95)00062-3
D’Sa, E. J. (2008). Colored dissolved organic matter in coastal waters influenced by the Atchafalaya River, USA: effects of an algal bloom. J. Appl. Remote Sens. 2:023502. doi: 10.1117/1.2838253
D’Sa, E. J., and DiMarco, S. (2009). Seasonal variability and controls on chromophoric dissolved organic matter in a large river-dominated coastal margin. Limnol. Oceanogr. 54, 2233–2242. doi: 10.4319/lo.2009.54.6.2233
D’Sa, E. J., and Kim, H.-C. (2017). Surface gradients in dissolved organic matter absorption and fluorescence properties along the New Zealand sector of the Southern Ocean. Front. Mar. Sci. 4:21. doi: 10.3389/fmars.2017.00021
D’Sa, E. J., and Miller, R. L. (2003). Bio-optical properties in waters influenced by the Mississippi River during low flow conditions. Remote Sens. Environ. 84, 538–549. doi: 10.1016/S0034-4257(02)00163-3
D’Sa, E. J., Goes, J. I., Gomes, H., and Mouw, C. (2014). Absorption and fluorescence properties of chromophoric dissolved organic matter of the eastern Bering Sea in the summer with special reference to the influence of a cold pool. Biogeosciences 11, 3225–3244. doi: 10.5194/bg-11-3225-2014
D’Sa, E. J., Miller, R. L., and Del Castillo, C. (2006). Bio-optical properties and ocean color algorithms for coastal waters influenced by the Mississippi River during a cold front. Appl. Optics 45, 7410–7428. doi: 10.1364/AO.45.007410
D’Sa, E. J., Overton, E. B., Lohrenz, S. E., Maiti, K., Turner, R. E., and Freeman, A. (2016). Changing dynamics of dissolved organic matter fluorescence in the northern Gulf of Mexico following the Deepwater Horizon oil spill. Environ. Sci. Technol. 50, 4940–4950. doi: 10.1021/acs.est.5b04924
Davis, L. B., Hofmann, E. E., Klinck, J. M., Piñones, A., and Dinniman, M. S. (2017). Distributions of krill and Antarctic silverfish and correlations with environmental variables in the western Ross Sea, Antarctica. Mar. Ecol. Prog. Ser. 584, 45–65. doi: 10.3354/meps12347
Del Castillo, C. E., and Miller, R. L. (2010). Horizontal and vertical distribution of colored dissolved organic matter during the Southern Ocean Gas Exchange Experiment. J. Geophys. Res. 106:C00F07. doi: 10.1029/2010JC006781
Dierssen, H. M., and Smith, R. C. (2000). Bio-optical properties and remote sensing ocean color algorithms for Antarctic Peninsula waters. J. Geophys. Res. 105, 301–326. doi: 10.1029/1999JC000296
DiTullio, G. R., and Smith, W. O. Jr. (1996). Spatial patterns in phytoplankton biomass and pigment distributions in the Ross Sea. J. Geophys. Res. 101, 18467–18477. doi: 10.1029/96JC00034
DiTullio, G. R., Grebmeier, J., Arrigo, K. H., Lizotte, M. P., Robinson, D. H., Barry, J. P., et al. (2000). Rapid and early export of Phaeocystis Antarctica blooms in the Ross Sea, Antarctica. Nature 404, 595–598. doi: 10.1038/35007061
Ducklow, H., Carlson, C., Church, M., Kirchman, D., Smith, D., and Steward, G. (2001). The seasonal development of the bacterioplankton bloom in the Ross Sea, Antarctica, 1994-1997. Deep-Sea Res. II 48, 4199–4221. doi: 10.1016/S0967-0645(01)00086-8
Dunbar, R. B., Leventer, A. R., and Mucciarone, D. A. (1998). Water column sediment fluxes in the Ross Sea, Antarctica: atmospheric and sea ice forcing. J. Geophys. Res. 103, 30741–30759. doi: 10.1029/1998JC900001
Goffart, A., Catalano, G., and Hecq, J. H. (2000). Factors controlling the distribution of diatoms and Phaeocystis in the Ross Sea. J. Mar. Syst. 27, 161–175. doi: 10.1016/S0924-7963(00)00065-8
Goto, S., Tada, Y., Suzuki, K., and Yamashita, Y. (2020). Evaluation of the production of dissolved organic matter by three marine bacterial strains. Front. Microbiol. 11:584419. doi: 10.3389/fmicb.2020.584419
Ha, S.-Y., Min, J.-O., Joo, H., Kim, M.-S., and Kang, S.-H. (2018). Synthesis of mycosporine-like amino acids by a size-fractionated marine phytoplankton community of the Arctic Beaufort Sea. J. Photochem. Photobiol. B Biol. 188, 87–94. doi: 10.1016/j.jphotobiol.2018.09.008
Hansell, D. A., and Carlson, C. A. (2001). Marine dissolved organic matter and the carbon cycle. Oceanography 14, 41–49. doi: 10.5670/oceanog.2001.05
Hansen, A. M., Kraus, T. E. C., Pellerin, B. A., Fleck, J. A., Downing, B. D., and Bergamaschi, B. A. (2016). Optical properties of dissolved organic matter (DOM): Effects of biological and photolytic degradation. Limnol. Oceanogr. 61, 1015–1032. doi: 10.1002/lno.10270
Helms, J. R., Stubbins, A., Perdue, E. M., Green, N. W., Chen, H., and Mopper, K. (2013). Photochemical bleaching of oceanic dissolved organic matter and its effect on absorption spectral slope and fluorescence. Mar. Chem. 155, 81–91. doi: 10.1016/j.marchem.2013.05.015
Helms, J. R., Stubbins, A., Ritchie, J. D., Minor, E. C., Kieber, D. J., and Mopper, K. (2008). Absorption spectral slopes and slope ratios as indicators of molecular weight, source and photobleaching of chromophoric dissolved organic matter. Limnol. Oceanogr. 53, 955–969. doi: 10.4319/lo.2008.53.3.0955
Hirawake, T., Takao, S., Horimoto, N., Ishimaru, T., Yamaguchi, Y., and Fukuchi, Y. (2011). A phytoplankton absorption-based primary productivity model for remote sensing in the Southern Ocean. Polar Biol. 34, 291–302. doi: 10.1007/s00300-010-0949-y
Huguet, A., Vacher, L., Relexans, S., Saubusse, S., Froidefond, J. M., and Parlanti, E. (2009). Properties of fluorescent dissolved organic matter in the Gironde Estuary. Org. Geochem. 40, 706–719. doi: 10.1016/j.orggeochem.2009.03.002
Jacobs, S. S., Amos, A. F., and Bruchhausen, P. M. (1970). Ross Sea oceanography and Antarctic bottom water formation. Deep-Sea Res. 17, 935–962. doi: 10.1016/0011-7471(70)90046-X
Jacobs, S. S., and Giulivi, C. F. (1998). Interannual ocean and sea ice variability in the Ross Sea. Antarctic Res. Ser. 75, 135–150. doi: 10.1029/AR075p0135
Jacobs, S. S., Fairbanks, R. G., and Horibe, Y. (1985). “Origin and evolution of water masses near the Antarctic continental margin: evidence from H218O/H216O ratios in seawater,” in Oceanology of the Antarctic Continental Shelf (Antarctic Research Series 43), ed. S. S. Jacobs (Washington, DC: American Geophysical Union), 59–85.
Jeon, M. H., Jung, J., Park, M. O., Aoki, S., Kim, T.-W., and Kim, S.-K. (2021). Tracing circumpolar deep water and glacial meltwater using humic-like fluorescenct dissolved organic matter in the Amundsen Sea, Antarctica. Mar. Chem. 235:104008. doi: 10.1016/j.marchem.2021.104008
Jiao, N., Herndl, G. J., Hansell, D. A., Benner, R., Kattner, G., Wilhelm, S. W., et al. (2010). Microbial production of recalcitrant dissolved organic matter: long-term carbon storage in the global ocean. Nat. Rev. Microbiol. 8, 593–599. doi: 10.1038/nrmicro2386
Jorgensen, L., Stedmon, C., Kragh, T., Markager, S., Middelboe, M., and Sondergaard, M. (2011). Global trends in the fluorescence characteristics and distribution of marine dissolved organic matter. Mar. Chem. 126, 139–148. doi: 10.1016/j.marchem.2011.05.002
Joshi, I. D., D’Sa, E. J., Osburn, C. L., Bianchi, T. S., Ko, D. S., Oviedo-Vargas, D., et al. (2017). Assessing chromophoric dissolved organic matter (CDOM) distribution, stocks, and fluxes in Apalachicola Bay using combined field, VIIRS ocean color, and model observations. Remote Sens. Environm. 191, 359–372. doi: 10.1016/j.rse.2017.01.039
Kang, M., Fjaryanti, R., Son, W., Kim, J.-H., and La, H. S. (2020). Acoustic detection of krill scattering layer in the Terra Nova Bay polynya, Antarctica. Front. Mar. Sci. 7:584550. doi: 10.3389/fmars.2020.584550
Kieber, D. J., Toole, D. A., and Kiene, R. P. (2009). “Chromophoric dissolved organic matter cycling during a Ross Sea Phaeocystis Antarctica bloom,” in Smithsonian at the Poles: Contributions to International Polar Year Science, eds I. Krupnik, M. A. Lang, and S. E. Miller (Washington, D.C: Smithsonian Institution Scholarly Press), 309–318. doi: 10.5479/si.097884601X.24
Kinsey, J. D., Corradino, G., Ziervogel, K., Schnetzer, A., and Osburn, C. L. (2018). Formation of chromophoric dissolved organic matter by bacterial degradation of phytoplankton-derived aggregates. Front. Mar. Sci. 4:430. doi: 10.3389/fmars.2017.00430
Kirchman, D. L., Meon, B., Ducklow, H. W., Carlson, C. A., Hansell, D. A., and Steward, G. F. (2001). Glucose fluxes and concentrations of dissolved combined neutral sugars (polysaccharides) in the Ross Sea and Polar Front Zone. Antarctica. Deep-Sea Res. II 48, 4179–4197. doi: 10.1016/S0967-0645(01)00085-6
Lee, Z., Lance, V. P., Shang, S., Vaillancourt, R., Freeman, S., Lubac, B., et al. (2011). An assessment of optical properties and primary production derived from remote sensing in the Southern Ocean (SO GasEx). J. Geophys. Res. 16:C00F03. doi: 10.1029/2010JC006747
Liu, B., D’Sa, E. J., Maiti, K., Rivera-Monroy, V. K., and Xue, Z. (2021). Biogeographical trends in phytoplankton community size structure using adaptive sentinel 3-OLCI chlorophyll a and spectral empirical orthogonal functions in the estuarine-shelf waters of the northern Gulf of Mexico. Remote Sens. Environm. 252:112154. doi: 10.1016/j.rse.2020.112154
Mannino, A., Novak, M. G., Nelson, N. B., Belz, M., Berthon, J.-F., Blough, N. V., et al. (2019). “Measurement protocol of absorption by chromophoric dissolved organic matter (CDOM) and other dissolved materials,” in Inherent Optical Property Measurements and Protocols: Absorption Coefficient, Vol. 5, eds A. Mannino and M. G. Novak (Dartmouth, NS: IOCCG).
Moisan, T. A., and Mitchell, B. G. (2001). UV absorption by mycosporine-like amino acids in Phaeocystis antarctica Karsten induced by photosynthetically available radiation. Mar. Biol. 138, 217–227. doi: 10.1007/s002270000424
Mopper, K., and Kieber, D. J. (2002). “Photochemistry and cycling of carbon, sulfur, nitrogen and phosphorus,” in Biogeochemistry of Marine Dissolved Organic Matter, eds D. A. Hansell and C. A. Carlson (Academic Press: San Diego). doi: 10.1016/B978-012323841-2/50011-7
Morel, A., and Maritorena, S. (2001). Bio-optical properties of oceanic waters: A reappraisal. J. Geophys. Res. 106, 7163–7180. doi: 10.1029/2000JC000319
Murphy, K. R., Timko, S. A., Gonsior, M., Powers, L. C., Wünsch, U. J., and Stedmon, C. A. (2018). Photochemistry illuminates ubiquitous organic matter fluorescence spectra. Environ. Sci. Technol. 52, 11243–11250. doi: 10.1021/acs.est.8b02648
Naik, P., and D’Sa, E. J. (2012). Phytoplankton light absorption of cultures and natural samples: Comparisons using two spectrophotometers. Optics Express 20, 4871–4886. doi: 10.1364/OE.20.004871
Naik, P., D’Sa, E. J., Gomes, H. R., Goes, J. I., and Mouw, C. B. (2013). Light absorption properties of southeastern Bering Sea waters: analysis, parameterization and implications for remote sensing. Rem. Sens. Environm. 134, 120–134. doi: 10.1016/j.rse.2013.03.004
Nelson, N. B., Carlson, C. A., and Steinberg, D. K. (2004). Production of chromophoric dissolved organic matter by Sargasso Sea microbes. Mar. Chem. 89, 273–287. doi: 10.1016/j.marchem.2004.02.017
Nelson, N. B., Siegel, D. A., Carlson, C. A., and Swan, C. M. (2010). Tracing global biogeochemical cycles and meridional overturning circulation using chromophoric dissolved organic matter. Geophys. Res. Lett. 37:L03610. doi: 10.1029/2009GL042325
Orsi, A. H., and Wiederwohl, C. L. (2009). A recount of Ross Sea waters. Deep-Sea Res. II 56, 778–795. doi: 10.1016/j.dsr2.2008.10.033
Orsi, A. H., Smethie, W. M. Jr., and Bullister, J. L. (2002). On the total input of Antarctic Waters to the Deep Ocean: a preliminary estimate from chlorofluorocarbon measurements. J. Geophys. Res. 12:12. doi: 10.1029/2001JC000976
Ortega-Retuerta, E., Frazer, T. K., Duarte, C. M., Ruiz-Halpern, S., Tovar-Sanchez, A., Arrieta, J. M., et al. (2009). Biogeneration of chromophoric dissolved organic matter by bacteria and krill in the Southern Ocean. Limnol. Oceanogr. 54, 1941–1950. doi: 10.4319/lo.2009.54.6.1941
Ortega-Retuerta, E., Reche, I., Pulido-Villena, E., Agusti, S., and Duarte, C. M. (2010a). Distribution and photoreactivity of chromophoric dissolved organic matter in the Antarctic Peninsula (Southern Ocean). Mar. Chem. 118, 129–139. doi: 10.1016/j.marchem.2009.11.008
Ortega-Retuerta, E., Siegel, D. A., Nelson, N. B., Duarte, C. M., and Reche, I. (2010b). Observations of chromophoric dissolved and detrital organic matter distribution using remote sensing in the Southern Ocean: Validation, dynamics and regulation. J. Mar. Syst. 82, 295–303. doi: 10.1016/j.jmarsys.2010.06.004
Park, J., Kim, H.-C., Jo, Y.-H., Kidwell, A., and Hwang, J. (2018). Multi-temporal variation of the Ross Sea polynya in response to climate forcings. Polar Res. 37:1444891. doi: 10.1080/17518369.2018.1444891
Park, J., Kim, H.-J., Kim, H.-C., Hwang, J., Jo, Y.-H., and Lee, S. H. (2019). Environmental forcings on the remotely sensed phytoplankton bloom phenology in the central Ross Sea polynya. J. Geophys. Res. 124, 5400–5417. doi: 10.1029/2019JC015222
Reynolds, R. A., Stramski, D., and Mitchell, B. G. (2001). A chlorophyll-dependent semi-analytical reflectance model derived from field measurements of absorption and backscattering within the Southern Ocean. J. Geophys. Res. 106, 7125–7138. doi: 10.1029/1999JC000311
Riegger, L., and Robinson, D. (1997). Photoinduction of UV-absorbing compounds in Antarctic diatoms and Phaeocystis antarctica. Mar. Ecol. Progr. Ser. 160, 13–25. doi: 10.3354/meps160013
Roesler, C. S., Stramski, D., D’Sa, E. J., Rottgers, R., and Reynolds, R. A. (2018). “Spectrophotometric measurements of particulate absorption using filter pads,” in IOCCG Protocol Series - Ocean Optics and Biogeochemistry Protocols for Satellite Ocean Colour Sensor Validation, eds A. R. Neeley and A. Mannino (Dartmouth, NS: IOCCG).
Romera-Castillo, C., Chen, M., Yamashita, Y., and Jaffe, R. (2014). Fluorescence characteristics of size-fractionated dissolved organic matter: Implications for a molecular assembly based structure? Water Res. 55, 40–51. doi: 10.1016/j.watres.2014.02.017
Romera-Castillo, C., Sarmento, H., Alvarez-Salgado, X. A., Gasol, J. M., and Marrase, C. (2010). Production of chromophoric dissolved organic matter by marine phytoplankton. Limnol. Oceanogr. 55, 446–454. doi: 10.4319/lo.2010.55.1.0446
Romera-Castillo, C., Sarmento, H., Álvarez-Salgado, X. A., Gasol, J. M., and Marrasé, C. (2011). Net production and consumption of fluorescent colored dissolved organic matter by natural bacterial assemblages growing on marine phytoplankton exudates. Appl. Environ. Microbiol. 77, 7490–7498. doi: 10.1128/AEM.00200-11
Ruiz-Halpern, S., Duarte, C. M., Tovar-Sanchez, A., Pastor, M., Horstkotte, B., Lasternas, S., et al. (2011). Antarctic krill as a source of dissolved organic carbon to the Antarctic ecosystem. Limnol. Oceanogr. 56, 521–528. doi: 10.4319/lo.2011.56.2.0521
Sala, A., Azzali, M., and Russo, A. (2002). Krill of the Ross Sea: distribution, abundance and demography of Euphausia superba and Euphausia crystallorophias during the Italian Antarctic Expedition (January–February 2000). Sci. Mar. 66, 123–133. doi: 10.3989/scimar.2002.66n2123
Sgroi, M., Gagliano, E., Vagliasindi, F. G. A., and Rocarro, P. (2020). Absorbance and EEM fluorescence of wastewater: Effects of filters, storage conditions, and chlorination. Chemosphere 243:125292. doi: 10.1016/j.chemosphere.2019.125292
Singh, S., D’Sa, E. J., and Swenson, E. M. (2010). Chromophoric dissolved organic matter (CDOM) variability in Barataria Basin using excitation-emission matrix (EEM) fluorescence and parallel factor analysis (PARAFAC). Sci. Total Environ. 408, 3211–3222. doi: 10.1016/j.scitotenv.2010.03.044
Smith, W. O. Jr., Ainley, D. G., and Cattaneo-Vietti, R. (2007). Trophic interactions within the Ross Sea continental shelf ecosystem. Philos. Trans. R. Soc. Lond. B Biol. Sci. 362, 95–111. doi: 10.1098/rstb.2006.1956
Smith, W. O. Jr., Ainley, D. G., Arrigo, K. R., and Dinniman, M. S. (2014). The oceanography and ecology of the Ross Sea. Annual. Rev. Mar. Sci. 6, 469–487. doi: 10.1146/annurev-marine-010213-135114
Smith, W. O. Jr., and Jones, R. M. (2015). Vertical mixing, critical depths, and phytoplankton growth in the Ross Sea. ICES J. Mar. Sci. 72, 1952–1960. doi: 10.1093/icesjms/fsu234
Smith, W. O. Jr., Nelson, D. M., DiTullio, G. R., and Leventer, A. R. (1996). Temporal and spatial patterns in the Ross Sea: Phytoplankton biomass, elemental composition, productivity and growth rates. J. Geophys. Res. 101, 18455–18465. doi: 10.1029/96JC01304
Smith, W. O. Jr., Shields, A. R., Dreyer, J. C., Peloquin, J. A., and Asper, V. L. (2011). Interannual variability in vertical export in the Ross Sea: magnitude, composition, and environmental correlates. Deep-Sea Res. I 58, 147–159. doi: 10.1016/j.dsr.2010.11.007
Stedmon, C. A., and Bro, R. (2008). Characterizing dissolved organic matter fluorescence with parallel factor analysis: a tutorial. Limnol. Oceanogr. Methods 6, 572–579. doi: 10.4319/lom.2008.6.572
Stedmon, C. A., and Nelson, N. B. (2015). “The optical properties of DOM in the ocean,” in Biogeochemistry of Marine Dissolved Organic Matter, 2nd Edn, eds D. A. Hansell and C. A. Carlson (San Diego, CA: Academic Press), 481–508. doi: 10.1016/B978-0-12-405940-5.00010-8
Stedmon, C. A., Markager, S., and Bro, R. (2003). Tracing dissolved organic matter in aquatic environments using a new approach to fluorescence spectroscopy. Mar. Chem. 82, 239–254. doi: 10.1016/S0304-4203(03)00072-0
Steinberg, D. K., Goldthwait, S. A., and Hansell, D. A. (2002). Zooplankton vertical migration and the active transport of dissolved organic and inorganic carbon in the Sargasso Sea. Deep Sea Res. Part I 49, 1445–1461. doi: 10.1016/S0967-0637(02)00037-7
Steinberg, D. K., Nelson, N. B., Carlson, C. A., and Prusak, A. C. (2004). Production of chromophoric dissolved organic matter (CDOM) in the open ocean by zooplankton and the colonial cyanobacterium Trichodesmium spp. Mar. Ecol. Prog. Ser. 267, 45–56. doi: 10.3354/meps267045
Sweeney, C., Hansell, D. A., Carlson, C. A., Codispoti, L. A., Gordon, L. I., Marra, J., et al. (2000). Biogeochemical regimes, net community production and carbon export in the Ross Sea, Antarctica. Deep Sea Res. II 47, 3369–3394. doi: 10.1016/S0967-0645(00)00072-2
Wedborg, M., Persson, T., and Larsson, T. (2007). On the distribution of UV-blue fluorescent organic matter in the Southern Ocean. Deep-Sea Res. I 54, 1957–1971. doi: 10.1016/j.dsr.2007.07.003
Weishaar, J. L., Aiken, G. R., Bergamaschi, B. A., Fram, M. S., Fujii, R., and Mopper, K. (2003). Evaluation of specific ultraviolet absorbance as an indicator of the chemical composition and reactivity of dissolved organic carbon. Environ. Sci. Technol. 37, 4702–4708. doi: 10.1021/es030360x
Yamashita, Y., and Tanoue, E. (2003). Chemical characterization of protein-like fluorophores in DOM in relation to aromatic amino acids. Mar. Chem. 82, 255–271. doi: 10.1016/S0304-4203(03)00073-2
Yamashita, Y., Nosaka, Y., Suzuki, K., Ogawa, H., Takahashi, K., and Saito, H. (2013). Photobleaching as a factor controlling spectral characteristics of chromophoric dissolved organic matter in open ocean. Biogeosciences 10, 7207–7217. doi: 10.5194/bg-10-7207-2013
Keywords: Ross Sea, Southern Ocean, DOM, CDOM, FDOM, DOC
Citation: D’Sa EJ, Kim H-C, Ha S-Y and Joshi I (2021) Ross Sea Dissolved Organic Matter Optical Properties During an Austral Summer: Biophysical Influences. Front. Mar. Sci. 8:749096. doi: 10.3389/fmars.2021.749096
Received: 29 July 2021; Accepted: 04 October 2021;
Published: 27 October 2021.
Edited by:
Meilian Chen, Florida International University, United StatesReviewed by:
Peter Regier, Pacific Northwest National Laboratory (DOE), United StatesNorman B. Nelson, University of California, Santa Barbara, United States
Liyang Yang, Fuzhou University, China
Copyright © 2021 D’Sa, Kim, Ha and Joshi. This is an open-access article distributed under the terms of the Creative Commons Attribution License (CC BY). The use, distribution or reproduction in other forums is permitted, provided the original author(s) and the copyright owner(s) are credited and that the original publication in this journal is cited, in accordance with accepted academic practice. No use, distribution or reproduction is permitted which does not comply with these terms.
*Correspondence: Eurico J. D’Sa, ZWpkc2FAbHN1LmVkdQ==