 Alexandra Rosa1*
 Cláudio Cardoso1,2
 Rui Vieira1
 Ricardo Faria1
 Ana R. Oliveira3
 Gabriel Navarro4
 Rui M. A. Caldeira1,2
- 1Observatório Oceânico da Madeira, Agência Regional para o Desenvolvimento da Investigação, Tecnologia e Inovação, Funchal, Portugal
- 2Instituto Dom Luiz, Faculdade de Ciências, Universidade de Lisboa, Lisbon, Portugal
- 3Centro de Ciência e Tecnologia do Ambiente e do Mar (MARETEC-LARSyS), Instituto Superior Técnico, Universidade de Lisboa, Lisbon, Portugal
- 4Grupo de Ecología y Gestión Costera, Instituto de Ciencias Marinas de Andalucía, Consejo Superior de Investigaciones Científicas, Puerto Real, Spain
The Island Mass Effect has been primarily attributed to nutrient enhancement of waters surrounding oceanic islands due to physical processes, whereas the role of land runoff has seldom been considered. Land runoff can be particularly relevant in mountainous islands, highly susceptible to torrential rainfall that rapidly leads to flash floods. Madeira Island, located in the Northeast Atlantic Ocean, is historically known for its flash flood events, when steep streams transport high volumes of water and terrigenous material downstream. A 22-year analysis of satellite data revealed that a recent catastrophic flash flood (20 February 2010) was responsible for the most significant concentration of non-algal Suspended Particulate Matter (SPM) and Chlorophyll-a at the coast. In this context, our study aims to understand the impact of the February 2010 flash flood events on coastal waters, by assessing the impact of spatial and temporal variability of wind, precipitation, and river discharges. Two specific flash floods events are investigated in detail (2 and 20 February 2010), which coincided with northeasterly and southwesterly winds, respectively. Given the lack of in situ data documenting these events, a coupled air-sea-land numerical framework was used, including hydrological modeling. The dynamics of the modeled river plumes induced by flash floods were strongly influenced by the wind regimes subsequently affecting coastal circulation, which may help to explain the differences between observed SPM and Chlorophyll-a distributions. Model simulations showed that during northeasterly winds, coastal confinement of the buoyant river plume persisted on the island’s north coast, preventing offshore transport of SPM. This mechanism may have contributed to favorable conditions for phytoplankton growth, as captured by satellite-derived Chlorophyll-a in the northeastern coastal waters. On the island’s south coast, strong ocean currents generated in the eastern island flank promoted strong vertical shear, contributing to vertical mixing. During southwesterly winds, coastal confinement of the plume with strong vertical density gradient was observed on the south side. The switch to eastward winds spread the south river plume offshore, forming a filament of high Chlorophyll-a extending 70 km offshore. Our framework demonstrates a novel methodology to investigate ocean productivity around remote islands with sparse or absent field observations.
Introduction
Deep ocean islands are often characterized by pristine and remote ecosystems that support important socio-economic activities and provide resilience to local communities. From an ecological point of view, oceanic islands are characterized as biodiversity hotspots. This biological enhancement is strongly associated with the interaction of the wind and ocean currents with the islands, which can induce physical perturbations in the atmospheric and oceanic flows and ultimately boost phytoplankton growth in the surrounding environment. This concept is coined in the literature as the Island Mass Effect (IME). IME was first introduced by Doty and Oguri (1956) to explain the consistent increase of primary productivity on the windward waters of Oahu Island in the Hawaiian Archipelago, relative to offshore waters. Since then, this phenomenon has been intensively investigated and detected in several island-reef ecosystems around the world. In the South Pacific, IME processes were investigated by Jones (1962), Dandonneau and Charpy (1985), Signorini et al. (1999), Martinez and Maamaatuaiahutapu (2004), Andrade et al. (2014), Raapoto et al. (2018, 2019), Cassianides et al. (2020), James et al. (2020), and Messié et al. (2020). In the North Pacific, IME was investigated in the vicinity of the Kuroshio current (Hasegawa et al., 2004; Hasegawa, 2019) and within the Southern California Bight (Caldeira et al., 2005). In the Equatorial Pacific, IME was investigated around the Galápagos Archipelago (Palacios, 2002). In the Indian, IME was studied around the Prince Edward Islands (Perissinotto et al., 2000). IME processes in the North Atlantic Ocean were investigated around Gran Canaria Island (Arístegui et al., 1997) and Madeira Island (Caldeira et al., 2002). Island-induced physical processes, such as the formation of wakes, eddies, internal waves, fronts, and upwelling cells, are some of the features linked to the IME (Leichter et al., 1998, 2003; Signorini et al., 1999; Caldeira et al., 2002; Palacios, 2002; Hasegawa et al., 2004; Hasegawa, 2019). These processes are responsible for the increase of nutrients and consequent enhancement of the primary productivity in the vicinity of oceanic islands, supporting the upper trophic levels and, as a consequence, the distribution of fishing activities in these areas (Chassot et al., 2010; Gove et al., 2016).
Not with standing the current IME studies, the processes that occur at the land-sea boundary have been less addressed in the scientific literature. The processes include the role of benthic mechanisms, such as accumulation of inorganic nutrients by benthic algae and further nutrients remineralization (Doty and Oguri, 1956) and nutrient-enrich waters associated with hydrothermal fluxes (Signorini et al., 1999). The input of nutrients from submarine groundwater discharges (Street et al., 2008; Tait et al., 2014; Moosdorf et al., 2015) and from island surface runoff (Dandonneau and Charpy, 1985; Bell, 1992; Perissinotto et al., 2000; Messié et al., 2020) have also been demonstrated to contribute to IME. Island surface runoff is particularly important in mountainous islands. With rugged relief and complex river networks flowing through narrow and steep valleys, these islands are naturally vulnerable to extreme precipitation events and consequent torrential and rapid streamflow. During such events, flow in these small rivers—characterized by relatively small watersheds and a low baseflow (Kao and Milliman, 2008; Osadchiev and Korshenko, 2017)—drastically increases. As a consequence, high runoff events often transport large amounts of terrigenous sediments/nutrients (Milliman and Syvitski, 1992; Liu et al., 2013; Wang et al., 2020) and solid material (e.g., mud, rocks, blocks, wreckage) to the coastal environment, often leading to floods (Vieira et al., 2018). Such torrential discharge often generates buoyant river plumes that are easily identified by the high levels of suspended matter that spread from river mouths and mix with the surrounding oceanic waters. According to Osadchiev and Zavialov (2020), the formation, mixing, and spreading of buoyant river plumes depends on several factors that may be divided into two groups: (i) site characteristics, such as the geometry of the coastline and river mouths, bathymetry, and latitude-dependent Coriolis force (Chao and Boicourt, 1986; Simpson, 1997; Garvine, 1999; Horner-Devine et al., 2006, 2015; McCabe et al., 2009; Warrick and Farnsworth, 2017); and (ii) external forcing mechanisms, such as river flow, wind, coastal currents, tides, waves, and water column stratification (Fong and Geyer, 2001, 2002; Yankovsky et al., 2001; Wu et al., 2011; Korotenko et al., 2014; Osadchiev, 2018; Yuan et al., 2018; Zhao et al., 2018; Marta-Almeida et al., 2020). Thus, the land-sea discharges of freshwater, terrigenous sediments, nutrients, suspended matter, and anthropogenic contaminants or pollutants affect the physical, chemical, biological, and geological processes in the coastal environment (Milliman and Syvitski, 1992; Meybeck et al., 2003; Brodie et al., 2010; Hilton et al., 2011; Bao et al., 2015; Osadchiev et al., 2017; Warrick and Farnsworth, 2017; Osadchiev, 2018; Osadchiev and Zavialov, 2020).
In Madeira, a mountainous island located in the Northeast Atlantic Ocean, the frequent occurrence of flash flood events currently represents the most significant natural hazard (Fragoso et al., 2012; Vieira et al., 2018). The most recent catastrophic flash flood event occurred on 20 February 2010, causing numerous human casualties and substantial economic loss (∼1.4 billion euros; Baioni, 2011; Fragoso et al., 2012), mainly in the capital city, Funchal, located in the southern region. Several scientific studies addressed this specific event (Luna et al., 2011; Couto et al., 2012; Fragoso et al., 2012; Levizzani et al., 2013; Lira et al., 2013; Nguyen et al., 2013; Teixeira et al., 2014; Dasari and Salgado, 2015; Lopes et al., 2020). In simple terms, the 20 February flash flood event was caused by a large-scale atmospheric phenomenon associated with a southwesterly front embedded in a low-pressure system over the Azores Archipelago, intensified by an anomalous sea surface temperature gradient across the Atlantic Ocean (Luna et al., 2011; Fragoso et al., 2012). On 20 February, an atmospheric river extending the entire length of the North Atlantic Ocean is also responsible for the increased humidity in the lower atmospheric levels (Couto et al., 2012). As this frontal weather system passed over the island from the southwest, the orographic uplift associated with the island led to heavy precipitation (Luna et al., 2011; Couto et al., 2012; Fragoso et al., 2012; Levizzani et al., 2013). Considering that atmospheric rivers are linked to extreme precipitation events in Madeira (Couto et al., 2015; Ramos et al., 2018a) and that the frequency of these phenomena is expected to increase due to climate change (Ramos et al., 2016), extreme precipitation and flooding events are expected to become an important contributor to the local coastal waters. In addition to the persistent high rainfall during the preceding winter months, an intense precipitation event on 2 February 2010 resulted in saturation of the soil which prevented further infiltration, and accelerated surface runoff and subsequent river flow, ultimately causing flash floods downstream (Fragoso et al., 2012; Nguyen et al., 2013). The 2 February event was caused by a low-pressure system centered between Madeira and Canary Islands, but atmospheric rivers were not detected (Couto et al., 2012). Besides the studies that focused on the meteorological (Luna et al., 2011; Couto et al., 2012; Fragoso et al., 2012; Levizzani et al., 2013; Teixeira et al., 2014; Dasari and Salgado, 2015) and geomorphological (Lira et al., 2013; Nguyen et al., 2013; Lopes et al., 2020) aspects of these events, the impacts of the extreme discharges of freshwater and land-based material into the coastal area are undocumented.
A long-term analysis (22 years) of monthly-averaged satellite-based measurements of the sea surface (non-algal) Suspended Particulate Matter (SPM) and Chlorophyll-a (Chla) concentrations highlight the potential impact these high discharge events have on coastal marine waters, in which maximum SPM (1.2 g m–3) and Chla (0.5 mg m–3) concentrations occur concurrently with the February 2010 floods (Figures 1A,B). This is further supported by the significantly higher values of monthly-averaged SPM (>2 g m–3) and Chla (1 mg m–3) near the coast (Figures 1C,D, respectively). Typical concentrations reported around the island are characteristic of an oligotrophic marine ecosystem with nutrient-poor waters and low Chla concentrations (average of 0.15 mg m–3, red line in Figure 1B; Longhurst et al., 1995; Caldeira et al., 2002; Narciso et al., 2019; Schäfer et al., 2020). A past study focused on the IME around Madeira Island hypothesized upwelling as the main mechanism responsible for high Chla concentrations, while island runoff and river discharges were considered to have a weak contribution (Caldeira et al., 2002). However, the long-term analysis indicates that episodes of enhanced SPM and Chla concentrations related to island runoff are likely frequent, as shown by the concurrent trends in SPM and Chla with precipitation values (identified by black arrows in Figure 1B).
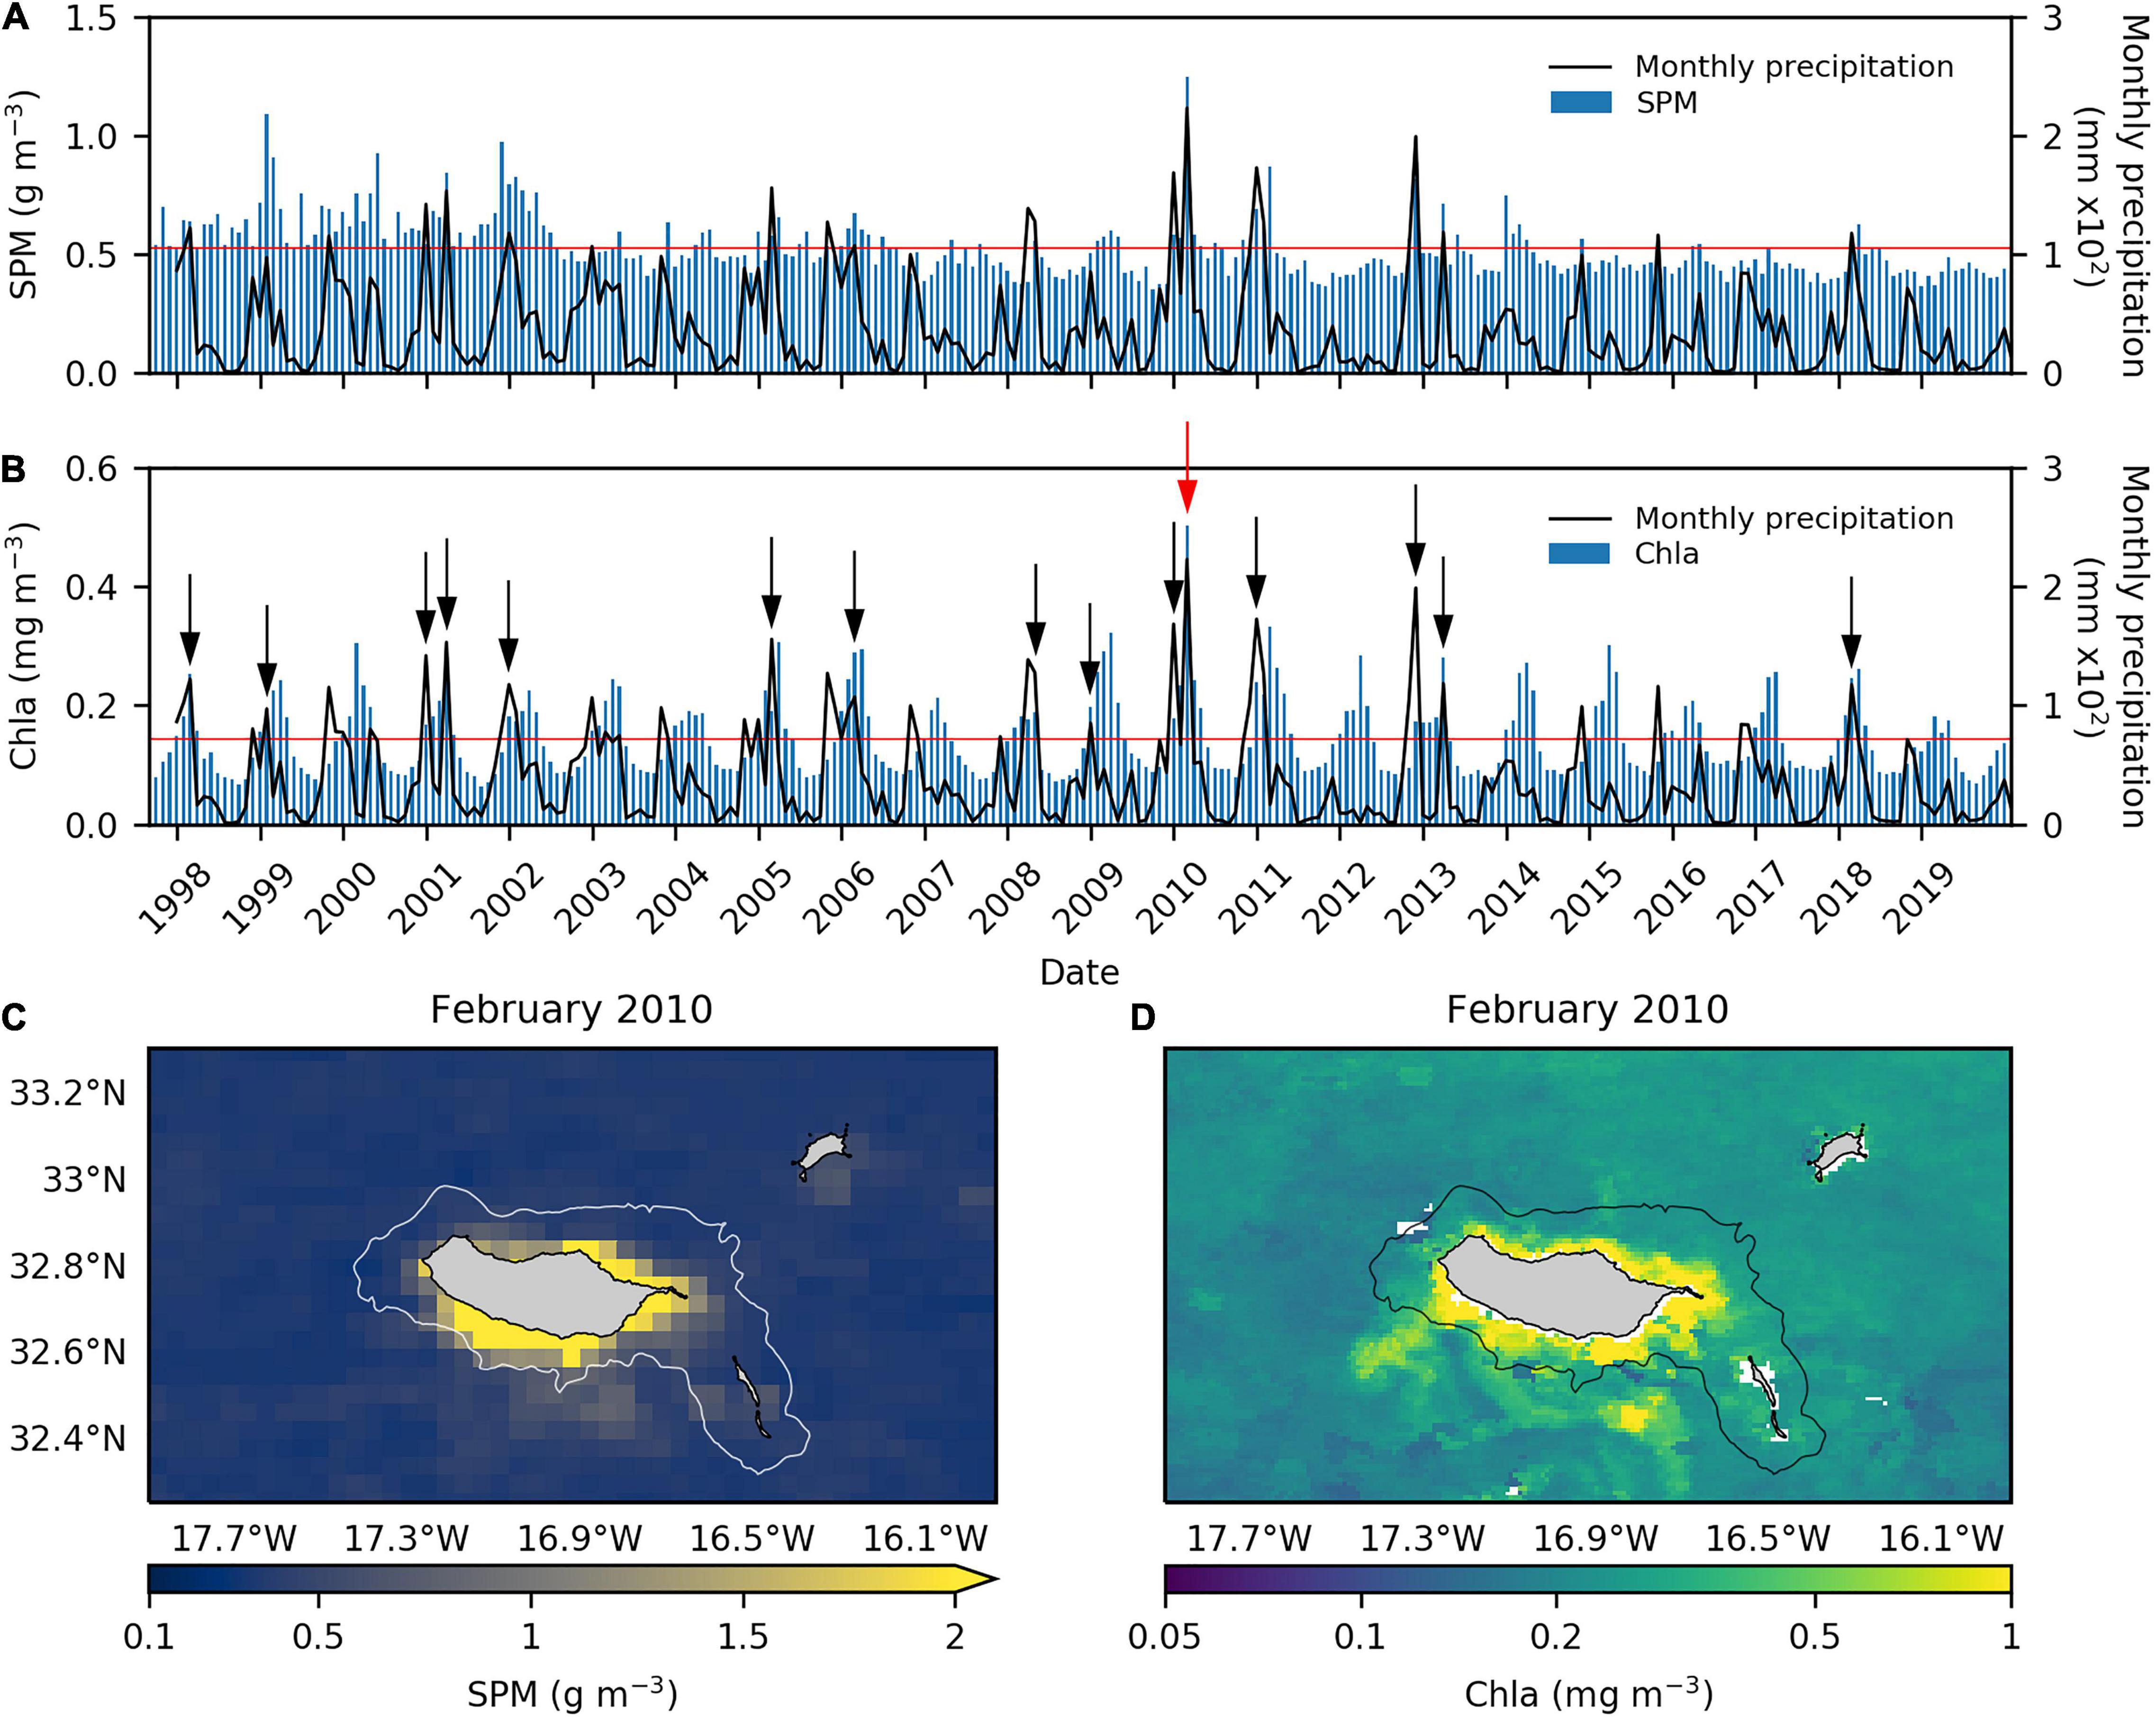
Figure 1. Monthly variability of (A) non-algal Suspended Particulate Matter (SPM; g m–3) and (B) Chlorophyll-a (Chla; mg m–3) concentrations at the inner shelf area (calculated with values within the -2000 m isobath, represented by the white and black line in C,D, respectively) between September 1997 and December 2019 based on satellite data along with monthly accumulated precipitation recorded at 9 meteorological stations distributed over the island (black line). The red line represents the mean, and the black arrows in (B) indicate anomalous Chla concentrations associated with runoff episodes. Satellite images of the regional area of Madeira Archipelago representing the monthly average of (C) SPM and (D) Chla concentrations for the specific episode of February 2010, when the maximum of concentrations occurred (red arrow in B).
This study aims to investigate the impact of two different flash flood events (on the 2nd and 20th of February 2010) on the coastal waters around Madeira Island, focusing on the spatial and temporal variability of the forcing mechanisms (i.e., wind, precipitation, and river discharges). In the absence of field observations capturing these two events, a numerical framework coupling the air-sea-land interfaces was used to theoretically investigate how the dynamics of the plumes might influence coastal circulation and help to explain the different SPM and Chla concentration distributions observed in the days after the flash flood events (Figure 2).
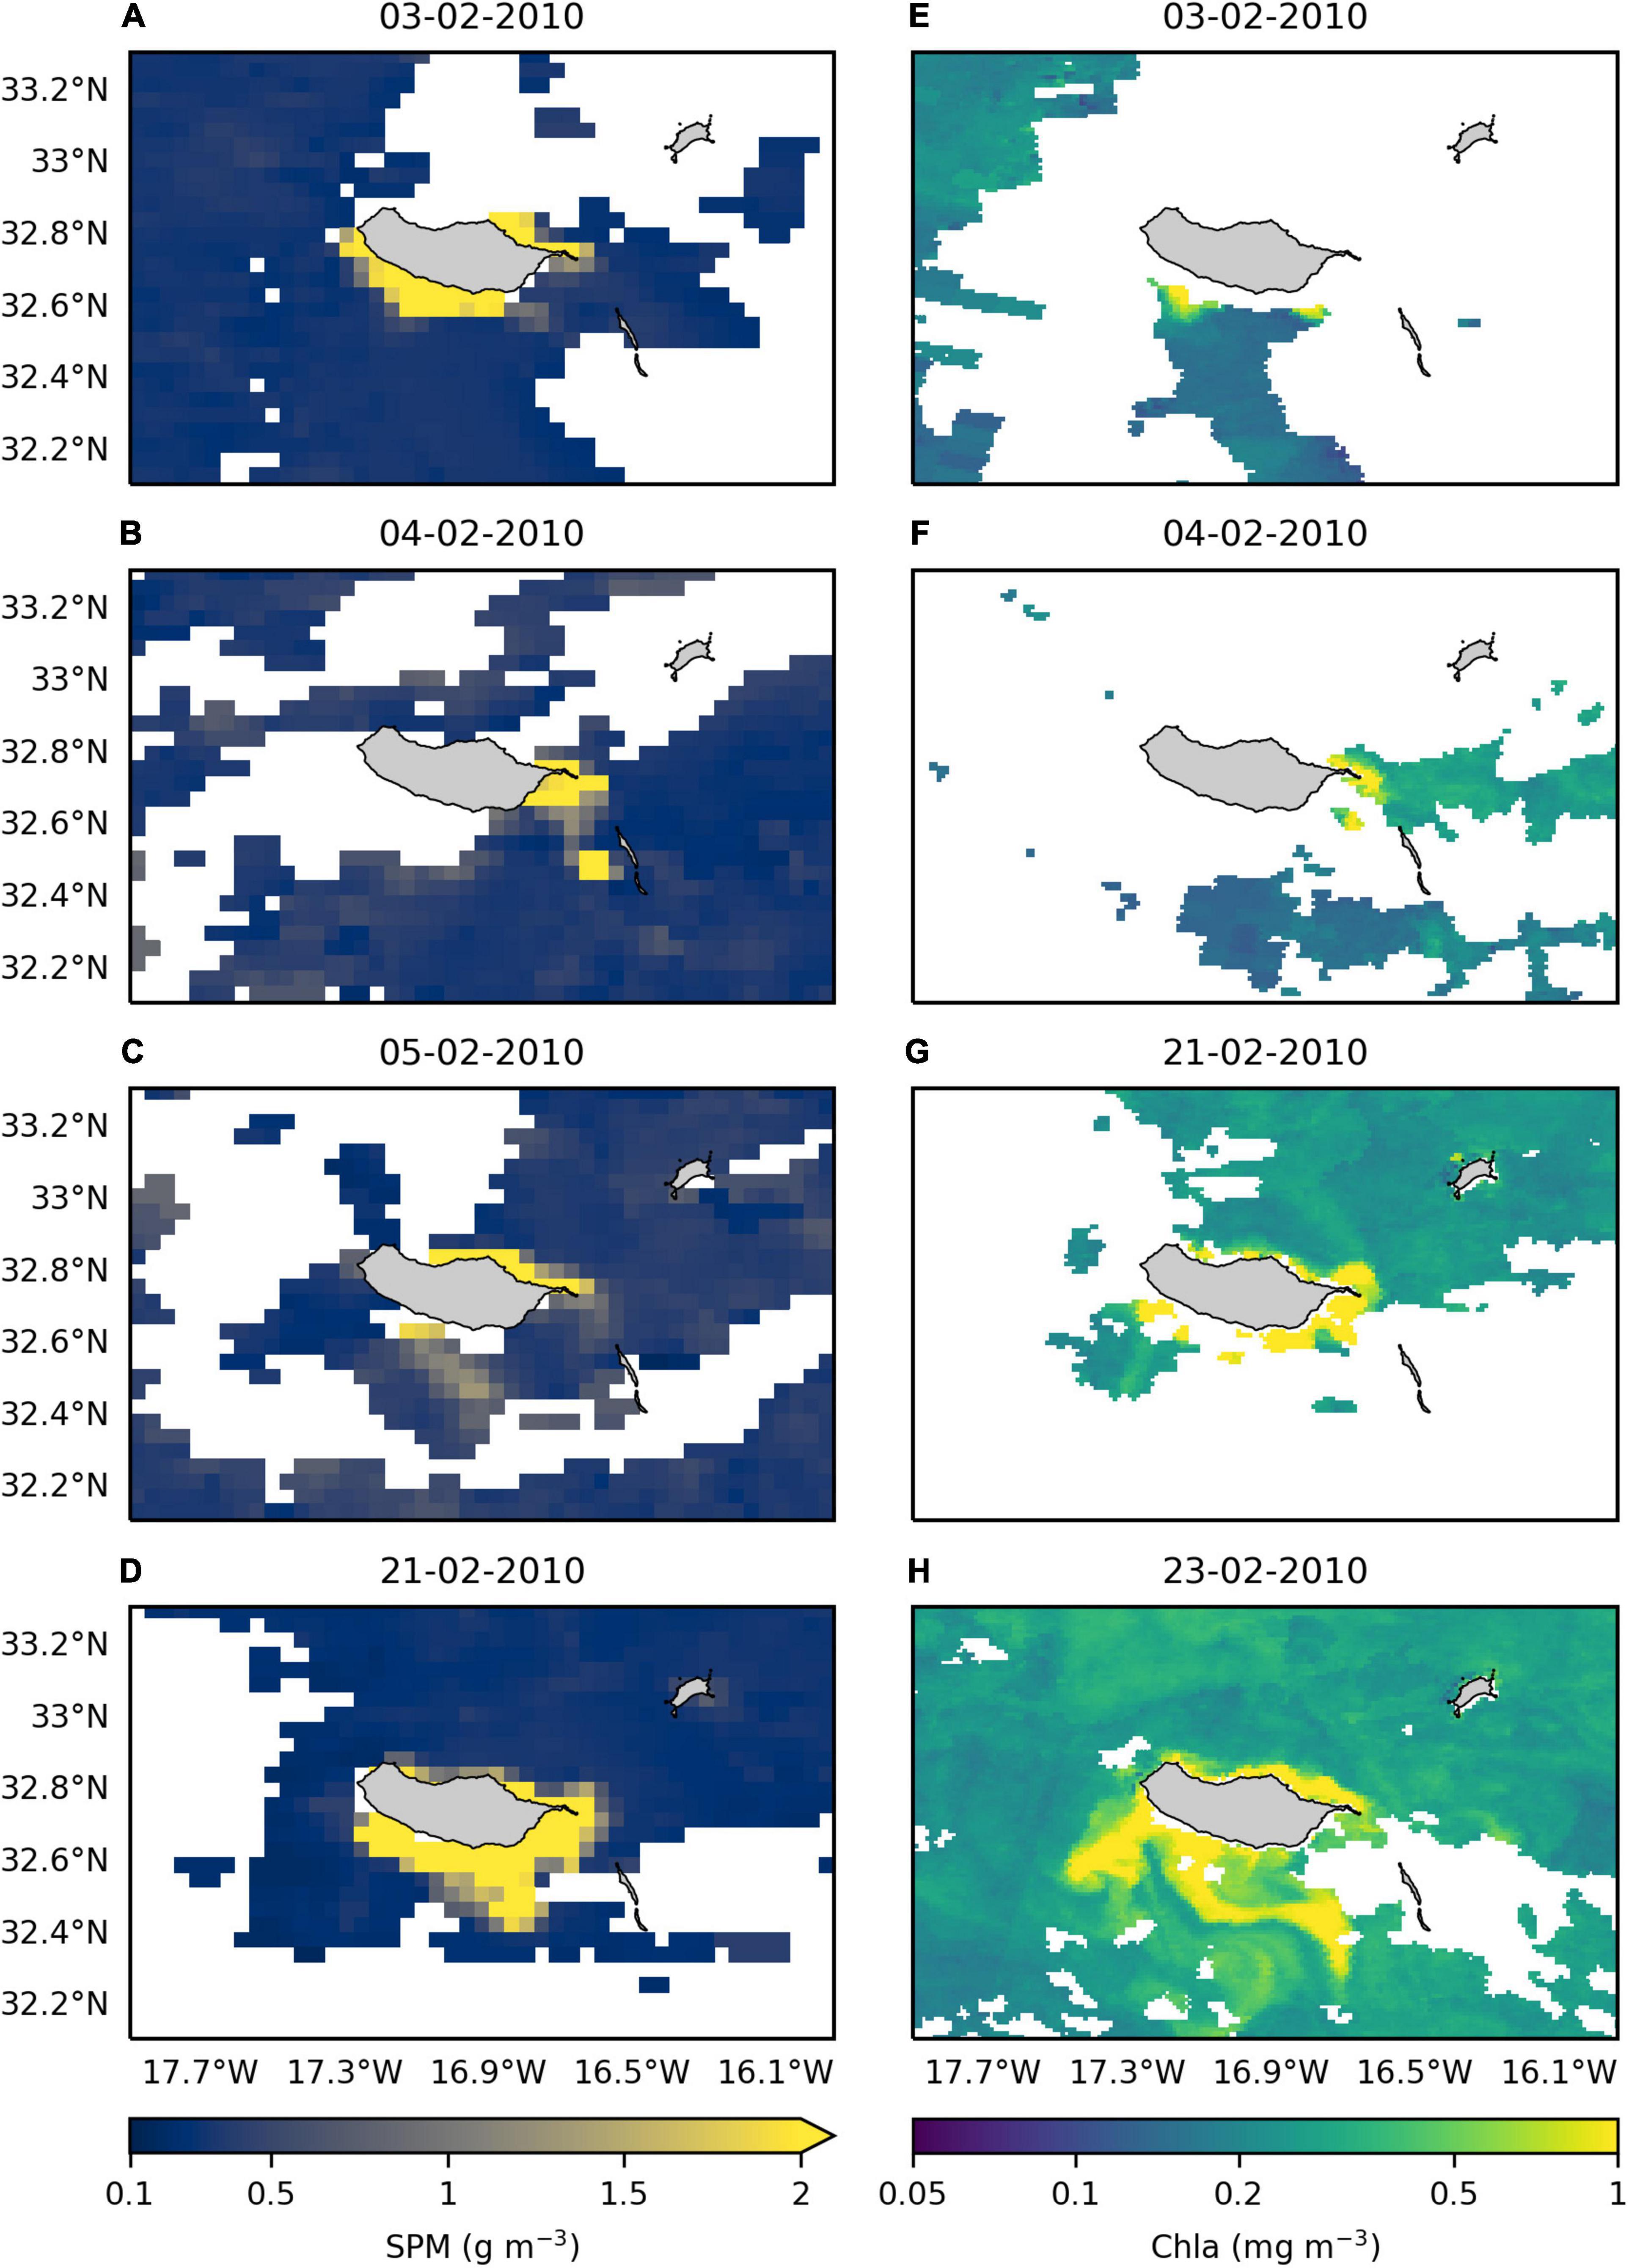
Figure 2. Satellite images of the regional area of Madeira Archipelago. Daily averages of (A–D) non-algal Suspended Particulate Matter (SPM; g m–3) and (E–H) Chlorophyll-a (Chla; mg m–3) concentrations for specific days of February 2010.
The manuscript is organized as follows: section “Study Area” is dedicated to the description of the study area. Section “Data and Methods” describes (i) the observational datasets used for model validation, (ii) the numerical models, their implementation, and the atmospheric model validation, and (iii) the kinematic parameters calculated to investigate the stratification and mixing of the water column. The results focused on the temporal variability of the forcing mechanisms and its impact on the coastal waters around Madeira Island are presented and discussed in section “Results and Discussion.” Lastly, the main conclusions are summarized in section “Conclusion”.
Study Area
Madeira Island is in the Northeast Atlantic Ocean 750 km west of the Northwestern African coast and 850 km southwest of Portugal (Figure 3A). Madeira is the largest and most populated island (∼260,000 inhabitants) of the Archipelago, with an area of 741 km2 and 1,861 m maximum altitude. Porto Santo Island (45 km to the northeast) is also populated (∼5,000 inhabitants). In contrast, the islands and small islets that constitute the Desertas Islands (20 km to the southeast; Figure 3B) and Selvagens Islands (300 km to the south; not shown) are uninhabited natural reserves. Madeira Island supports diverse socio-economic activities, such as fishing, aquaculture, agriculture, and tourism—the most important economic sector (hosting over one million visitors per year; Vieira et al., 2018). From a biodiversity viewpoint, the archipelago is recognized for its marine biodiversity, with several marine reserves and Natural Parks as part of the Natura 2000 network and UNESCO world heritage area.
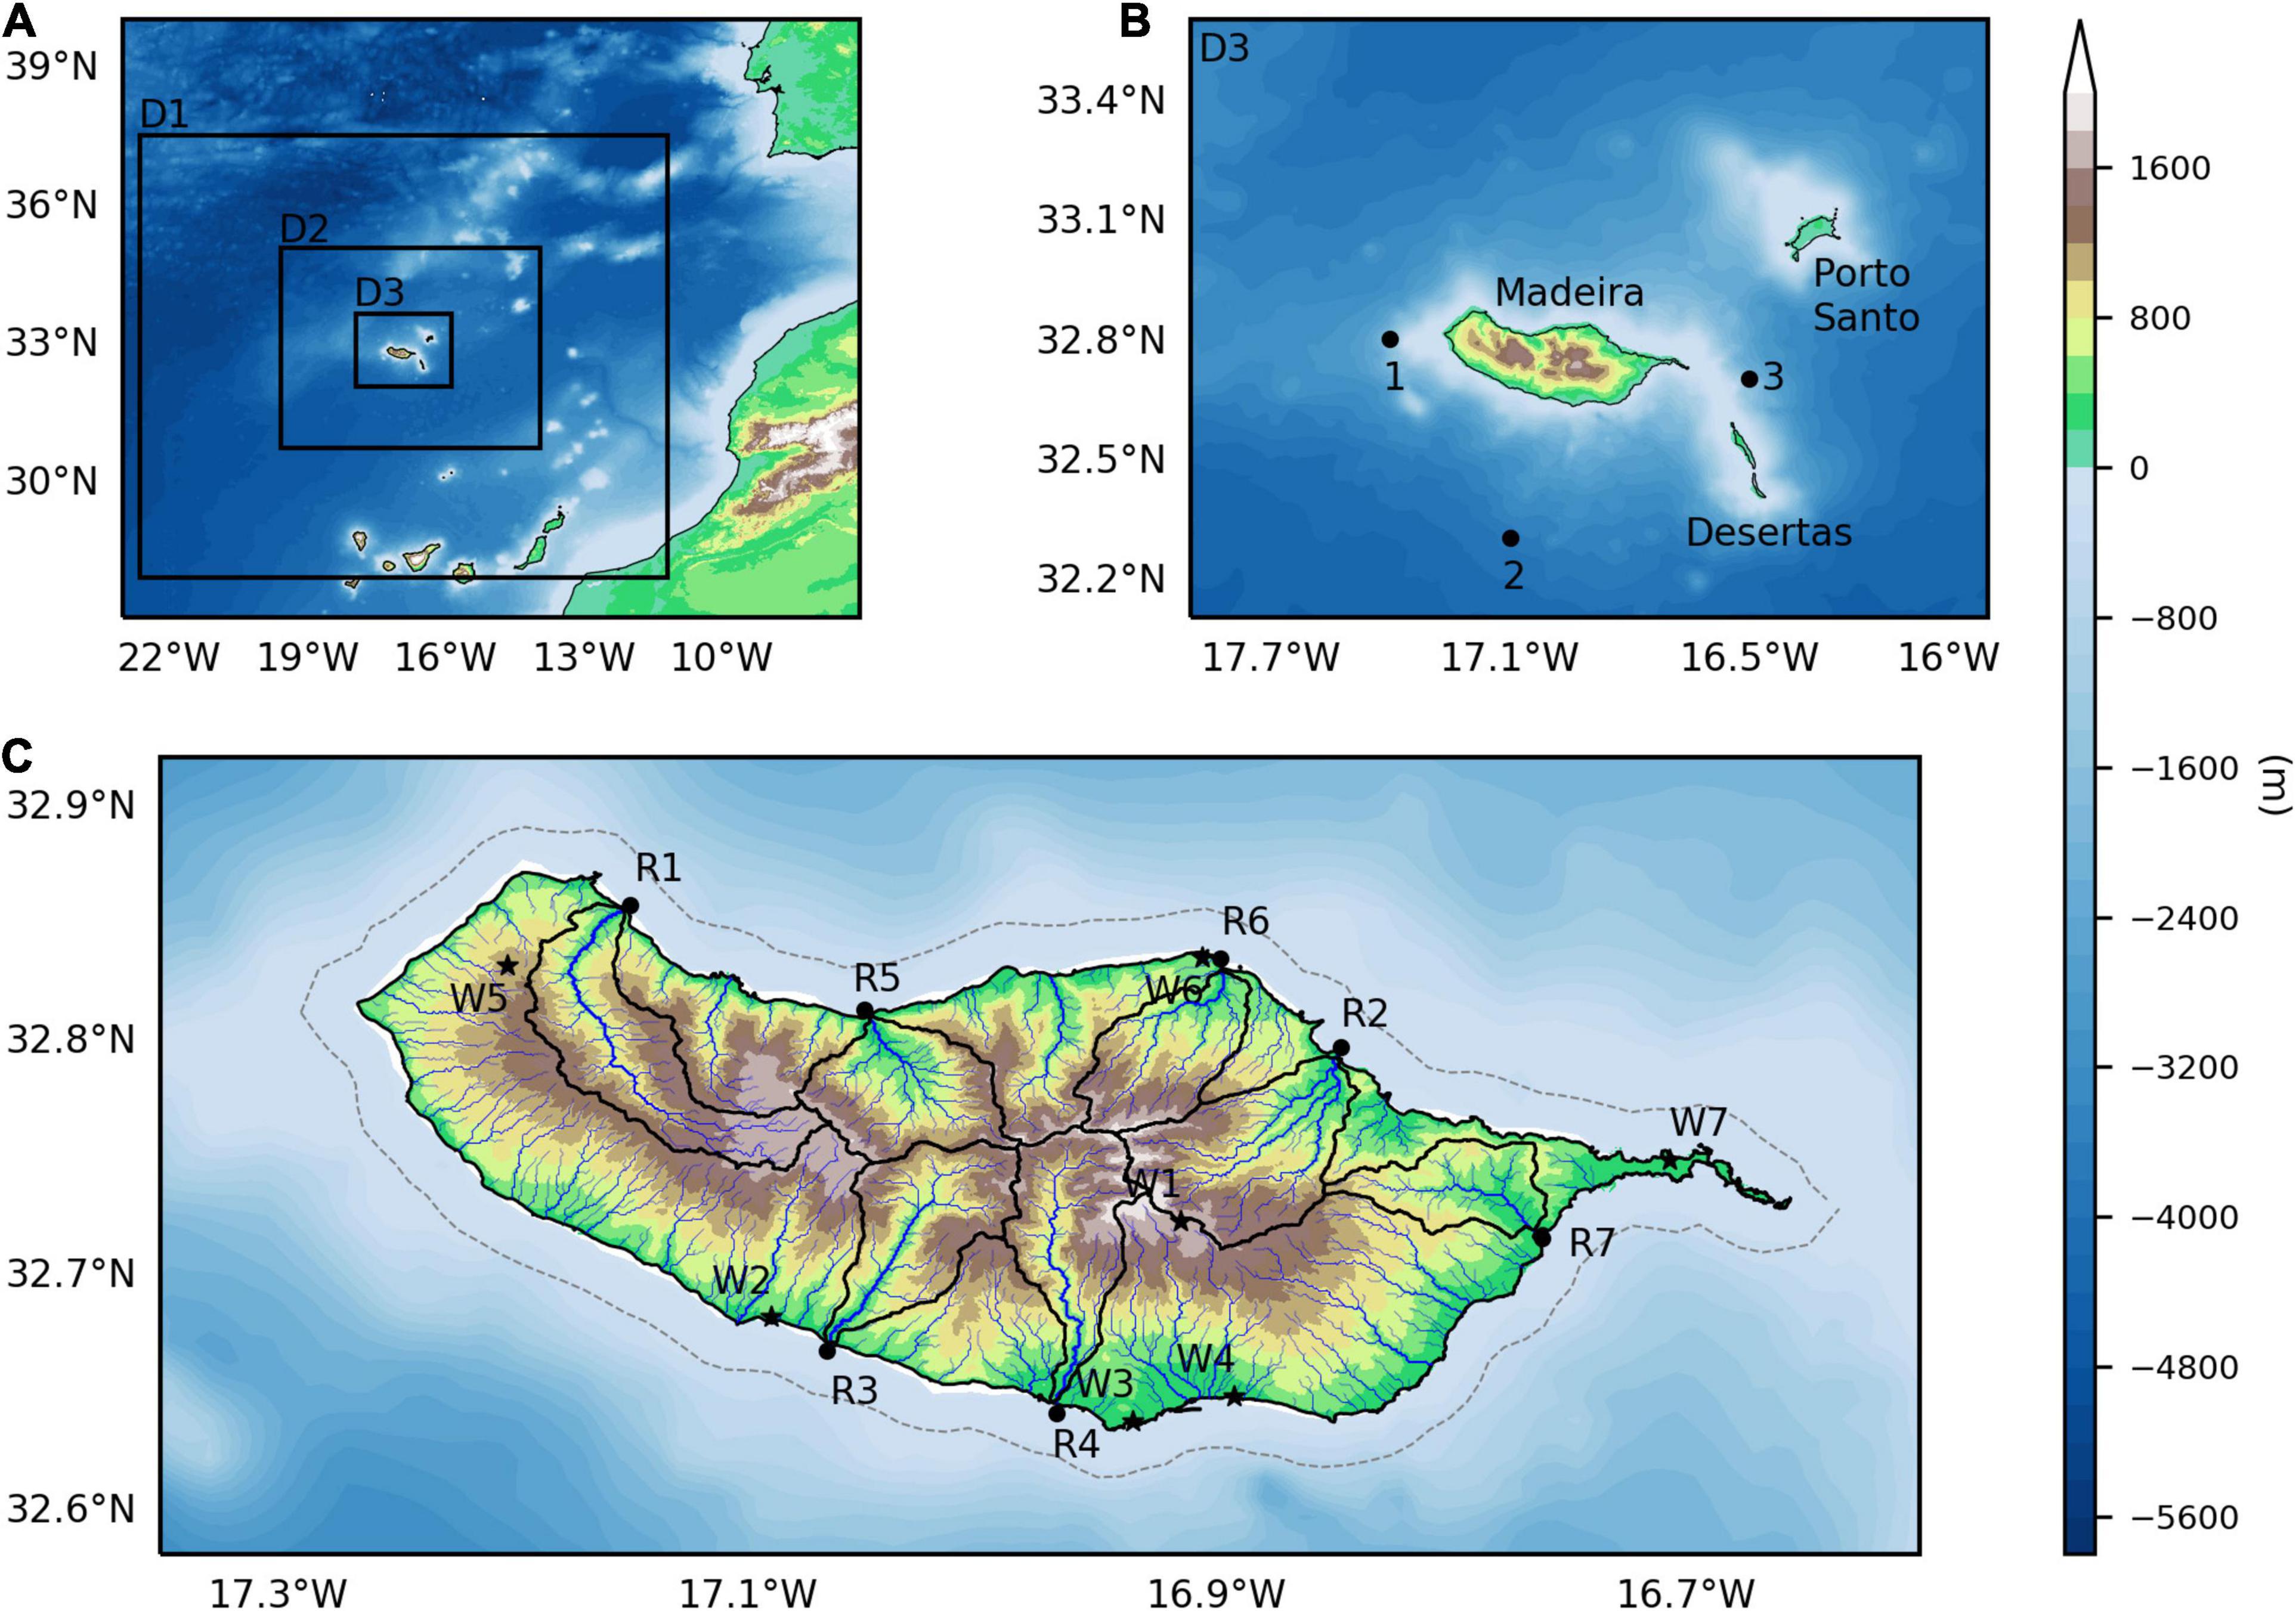
Figure 3. Map of the study area showing the topography and bathymetry retrieved from the Shuttle Radar Topography Mission (SRTM). (A) Representation of the three nested COAWST model domains (black boxes D1, D2, and D3, corresponding to 9, 3, and 1 km resolution, respectively). (B) Model domain D3 encompassing the regional area of Madeira Archipelago (Selvagens are not shown), where numbers correspond to locations used for model validation. (C) Madeira Island showing: (i) the drainage network (blue lines), with identification of the main river outlets (R1—Ribeira da Janela, R2—Ribeira de São Roque do Faial, R3—Ribeira Brava, R4—Ribeira dos Socorridos, R5—Ribeira de São Vicente, R6—Ribeira de São Jorge, R7—Ribeira de Machico; black circles) and its drainage basins (delimited by black lines); (ii) the location of the meteorological stations deployed by IPMA (Portuguese Institute for Sea and Atmosphere; black stars W1–W7) used for model validation; (iii) the location where vertical transects parallel to the north and south coast were performed (gray dashed lines).
Madeira is approximately 58 km in length, oriented in the northwest-southeast direction, with a maximum width of 23 km (Figure 3C). The island has a complex topography, with a mountainous ridge extending along the center. Given its location, at the eastern boundary of the North Atlantic Subtropical Gyre, the climate is mainly controlled by the Azores subtropical high-pressure system interacting with its topography. The high terrain acts as a perpendicular barrier to the prevailing northeastern trade winds (Caldeira et al., 2002; Prada et al., 2009; Gorricha et al., 2012; Alves et al., 2020; Belo-Pereira and Santos, 2020). As a result, many microclimates form within the island (Espinosa et al., 2021). Specifically, higher precipitation and lower air temperatures prevail in the northern slope (a more humid region), while the opposite pattern occurs in the southern slope, characterized as a dryer region (Caldeira et al., 2002; Prada et al., 2009). In addition, its topography causes an orographic effect on cloud formation, in which precipitation increases with altitude (Gorricha et al., 2012; Espinosa and Portela, 2020).
From the central mountainous ridge to the coast, there are very deep, narrow, and steep valleys formed by erosional processes associated with torrential river flow caused by historical extreme precipitation events (Rodrigues et al., 2006). Most of the valleys form a typical U-shaped profile, characteristic of a young geomorphology (Prada et al., 2005a; Rodrigues et al., 2006). The hydrological network is characterized by a radial pattern typical of volcanic islands, with more than 100 small drainage basins and a mean drainage density of 5.2 km–1. From those drainage basins, Ribeira da Janela (R1), Ribeira de São Roque do Faial (R2), Ribeira Brava (R3), Ribeira dos Socorridos (R4), Ribeira de São Vicente (R5), Ribeira de São Jorge (R6), and Ribeira de Machico (R7) are the most important with respect to runoff (see Figure 3C for location of rivers outlets and its drainage basins), with river catchment areas ranging between 52 and 24 km2 (Table 1). Due to the high-altitude origin (mostly > 1,600 m), high drainage density (4.4–5.5 km–1), and steep slopes (26°–40°; Table 1), these rivers are characterized by high torrential flow and high sediment erosion rates during episodes of heavy rain (Rodrigues et al., 2006). For the geometric characteristics of the remaining rivers of the island, please refer to Supplementary Table 1. The rivers that drain into the northern coast have a continuous flow—associated with higher rainfall, larger drainage basins, and higher groundwater supply—while river flow in the southern region is intermittent (Prada et al., 2005a).
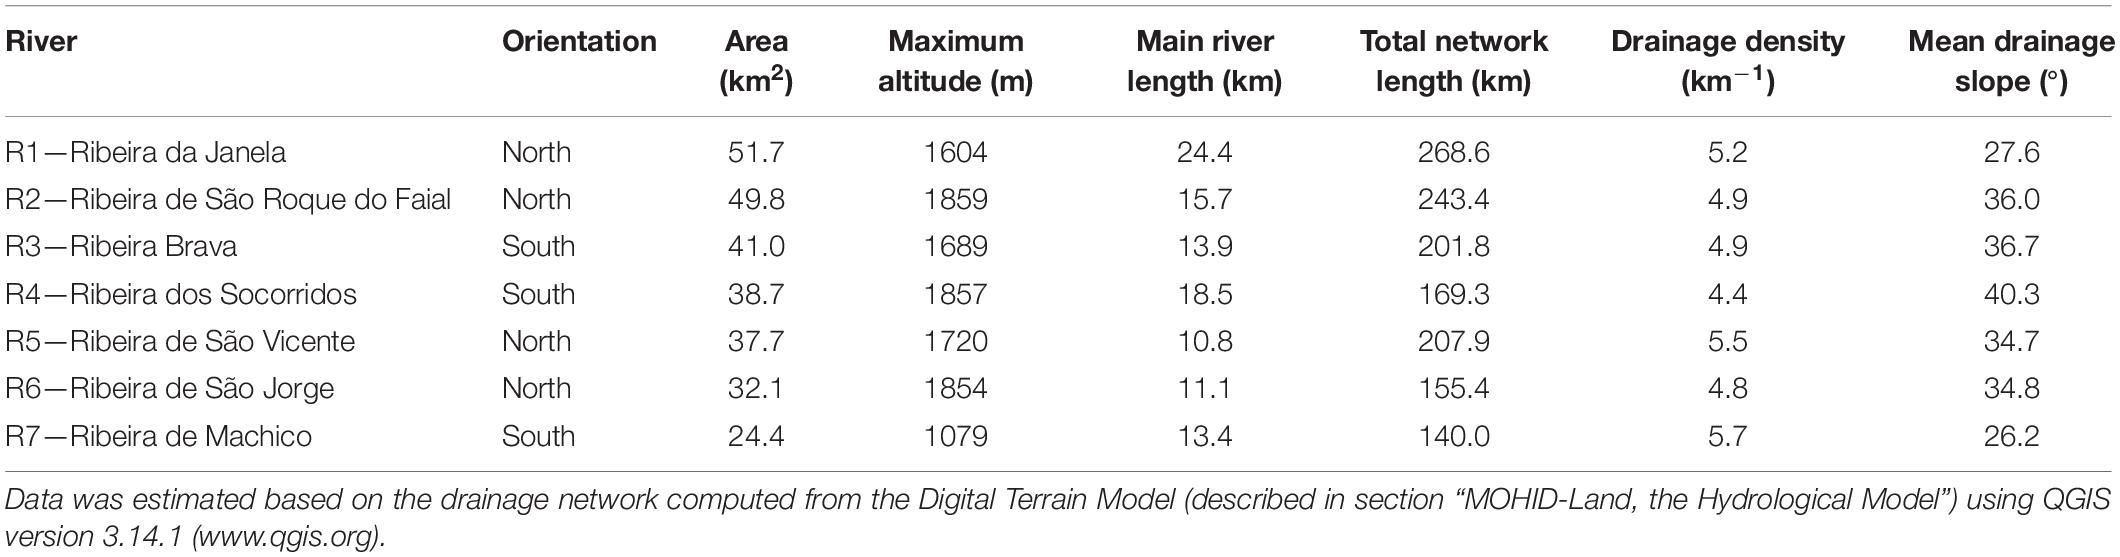
Table 1. Geometric characteristics (orientation, area, maximum altitude, main river length, total network length, drainage density and mean drainage slope) of the main rivers of Madeira Island.
Maps for land use (Carta de Ocupação do Solo da Região Autónoma da Madeira de 2007—COSRAM, Figure 4B) estimates that the majority (77%, ∼ 70 km2) of Madeira Island is covered by forests and natural/semi-natural areas. Agriculture/agroforestry is the next largest land use category, covering 15% (∼110 km2) of the island. Urban/artificial land use covers 8% (∼61 km2) of land, and wetlands and water bodies comprise 1% (∼4 km2; Figure 4B). In terms of soil properties, maps for soil type (Ricardo et al., 1992) show that 19 types of soil are present on the island, with Umbric Andosols (40%) and Dystric Rough Terrain (32%) being the dominant soil types (details provided in Supplementary Table 2 and Supplementary Figure 1).
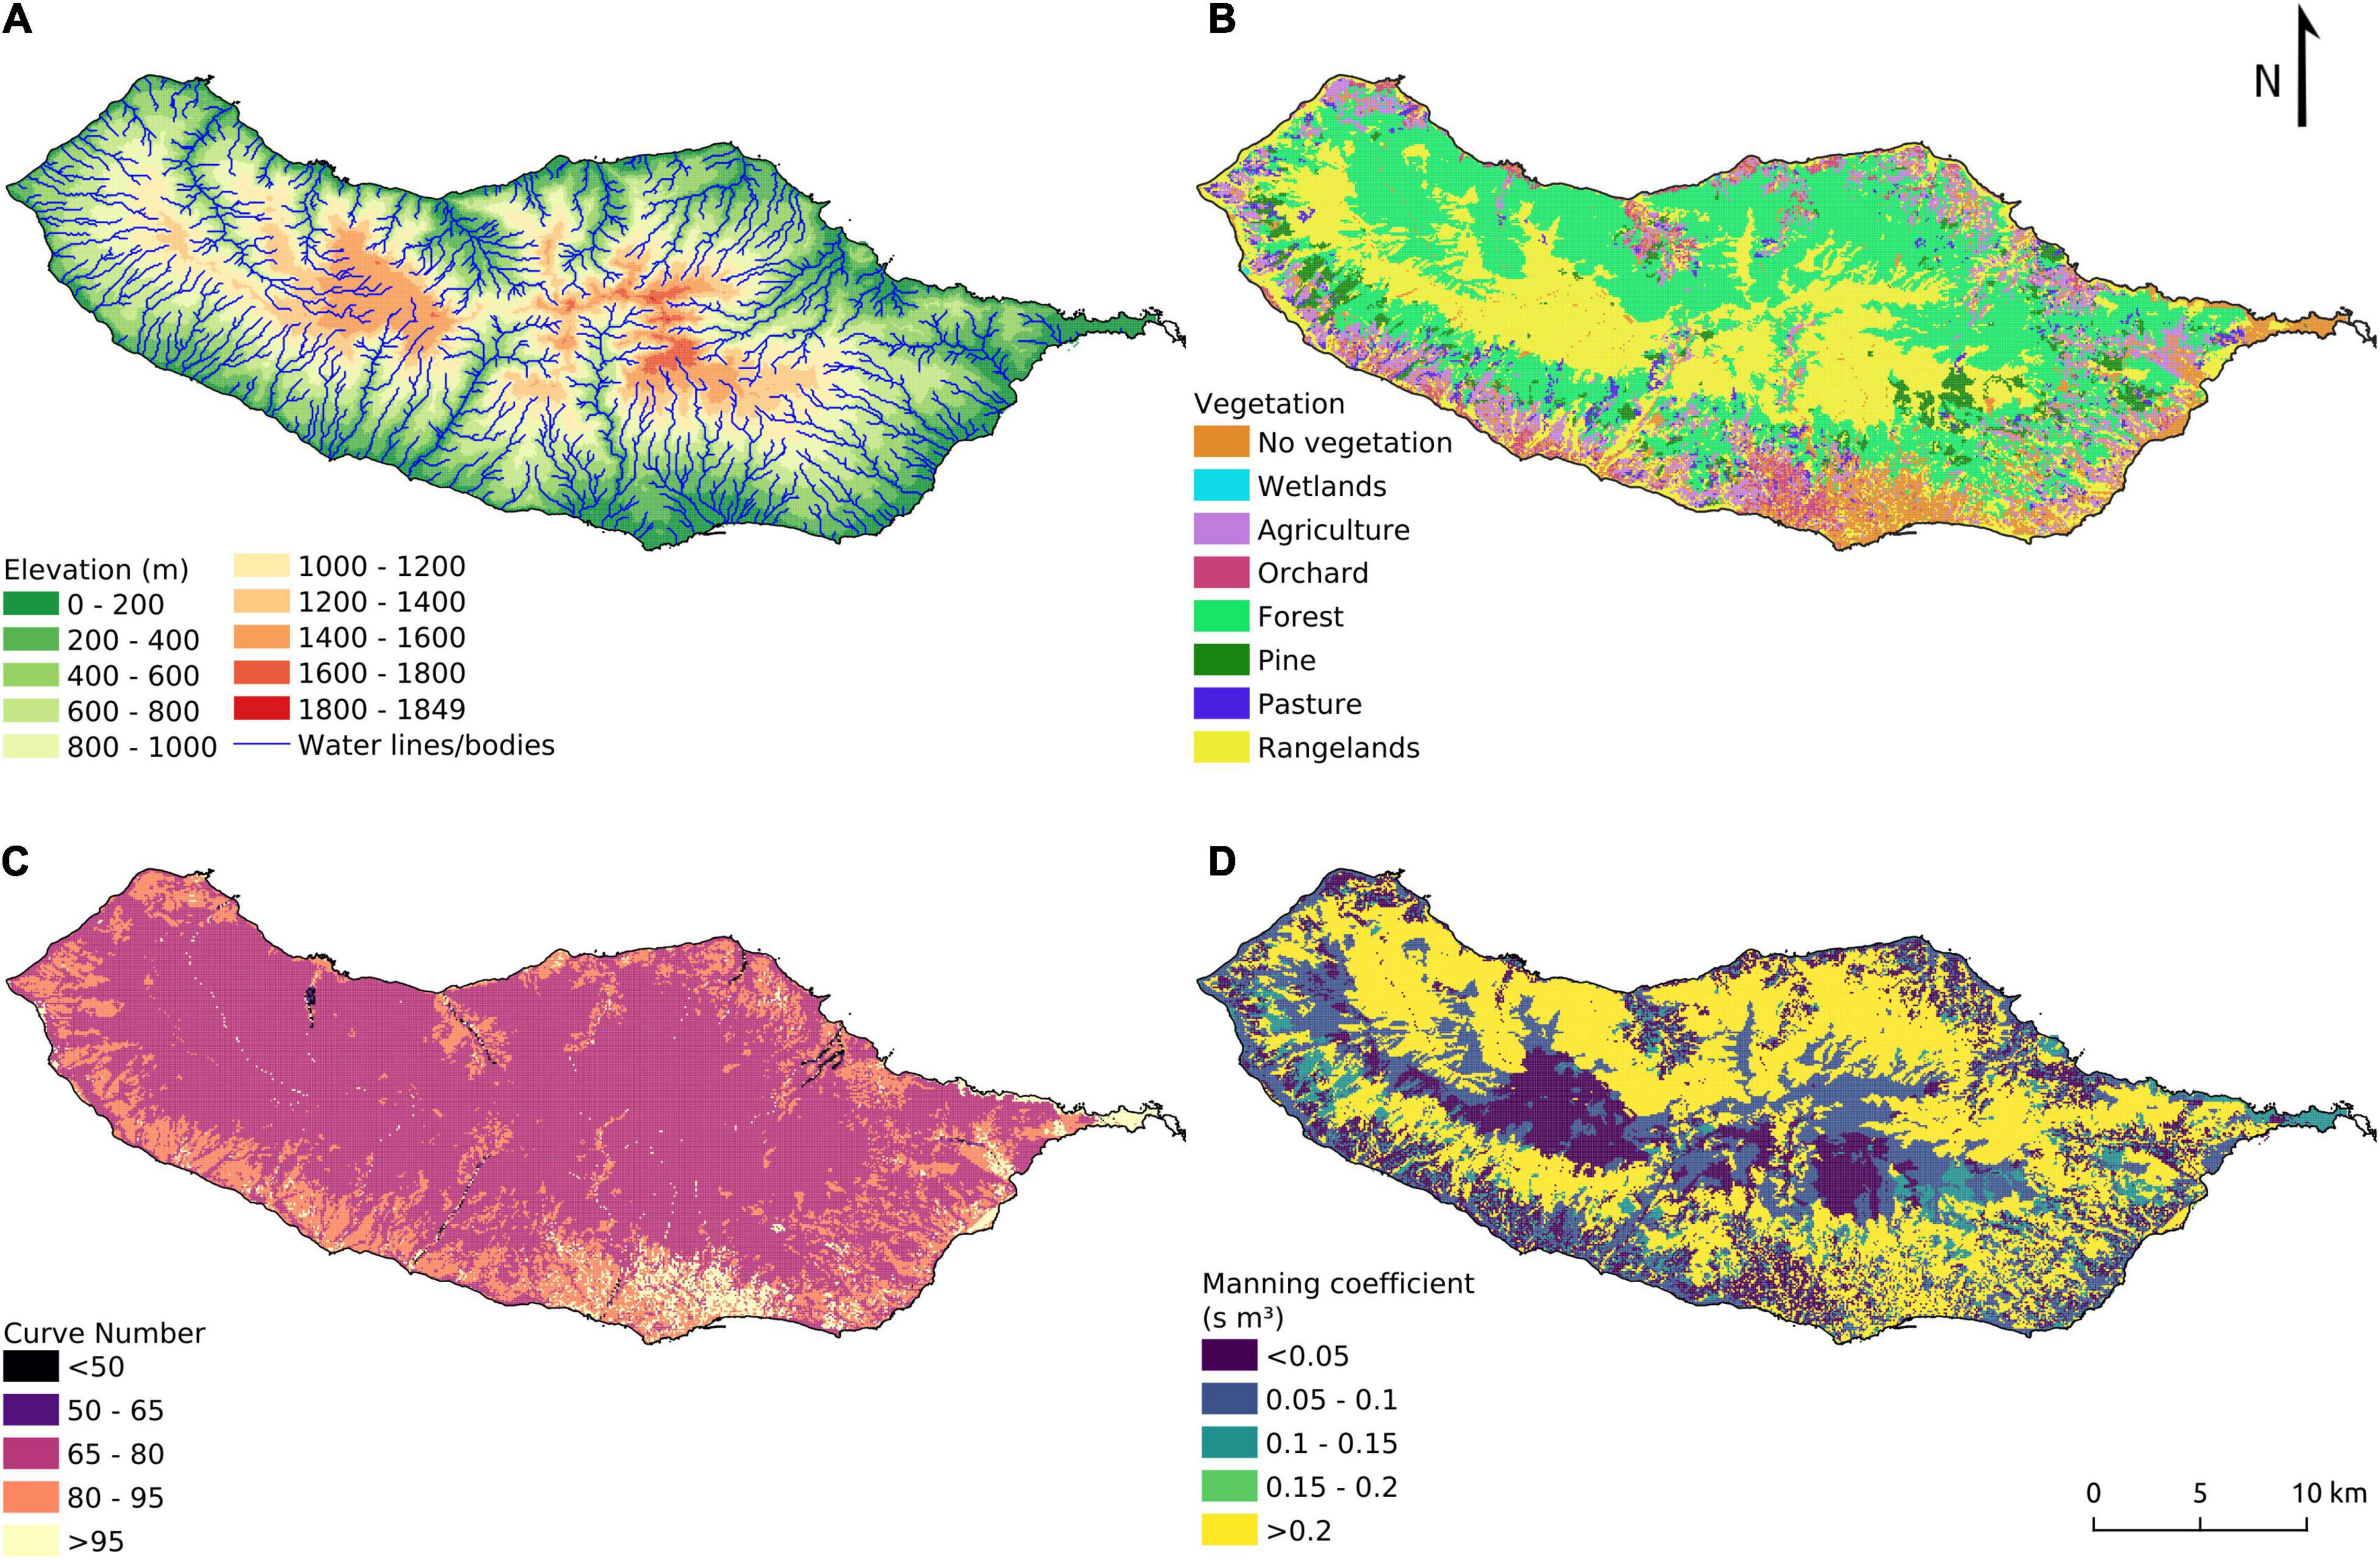
Figure 4. Maps used in the hydrological simulations (MOHID-Land): (A) Digital Terrain Model with drainage network; (B) soil use; (C) curve number (CN-AMCII); (D) Manning coefficient.
The insular shelf of Madeira is relatively narrow and steep, rapidly dropping from 200 to 500 m within ∼10 km from the coastline (Figure 3C). An underwater ridge of ∼100 m depth connects Madeira to the Desertas Islands (Figure 3B). The coastal circulation is influenced by semidiurnal tides, with an average tidal amplitude of ∼2 m (Canning-Clode et al., 2008). Salinity surrounding the island is typically 36.5 PSU (Caldeira et al., 2002; Narciso et al., 2019).
Previous studies in this region focused on atmospheric and oceanic island processes, combining the use of medium-high resolution numerical models (Caldeira and Sangrà, 2012; Couvelard et al., 2012; Caldeira and Tomé, 2013; Nunalee and Basu, 2014; Pullen et al., 2017b; Alves et al., 2021; Miranda et al., 2021), with in situ and satellite data (Caldeira et al., 2001, 2002, 2014; Grubišic et al., 2015; Alves et al., 2020; Azevedo et al., 2021). These studies revealed the complexity and variety of oceanic and atmospheric interactive processes which occur around the island, including the formation of von Kármán vortex streets, warm wakes, leeward eddies, and atmospheric jets that induce upwelling events.
Data and Methods
Observational Datasets
Meteorological data for precipitation, wind, and air temperature measured every 10 min at seven stations distributed throughout the island (see Figure 3C for stations location) were used to validate the atmospheric model results obtained from the coupled (WRF) model simulations. These data were provided by the Portuguese Institute for Sea and Atmosphere (IPMA), with data available since 2007. The model simulations were quantitatively assessed based on statistical analysis (correlation coefficient-r, root-mean-square error-RMSE, and bias; Table 2) widely used to evaluate atmospheric model performance (e.g., Alves et al., 2020; Belo-Pereira and Santos, 2020). Additionally, precipitation data for 9 meteorological stations were obtained from the Portuguese water resources database (SNIRH)1 to be used in the long-term analysis of SPM and Chla (shown in Figures 1A,B).
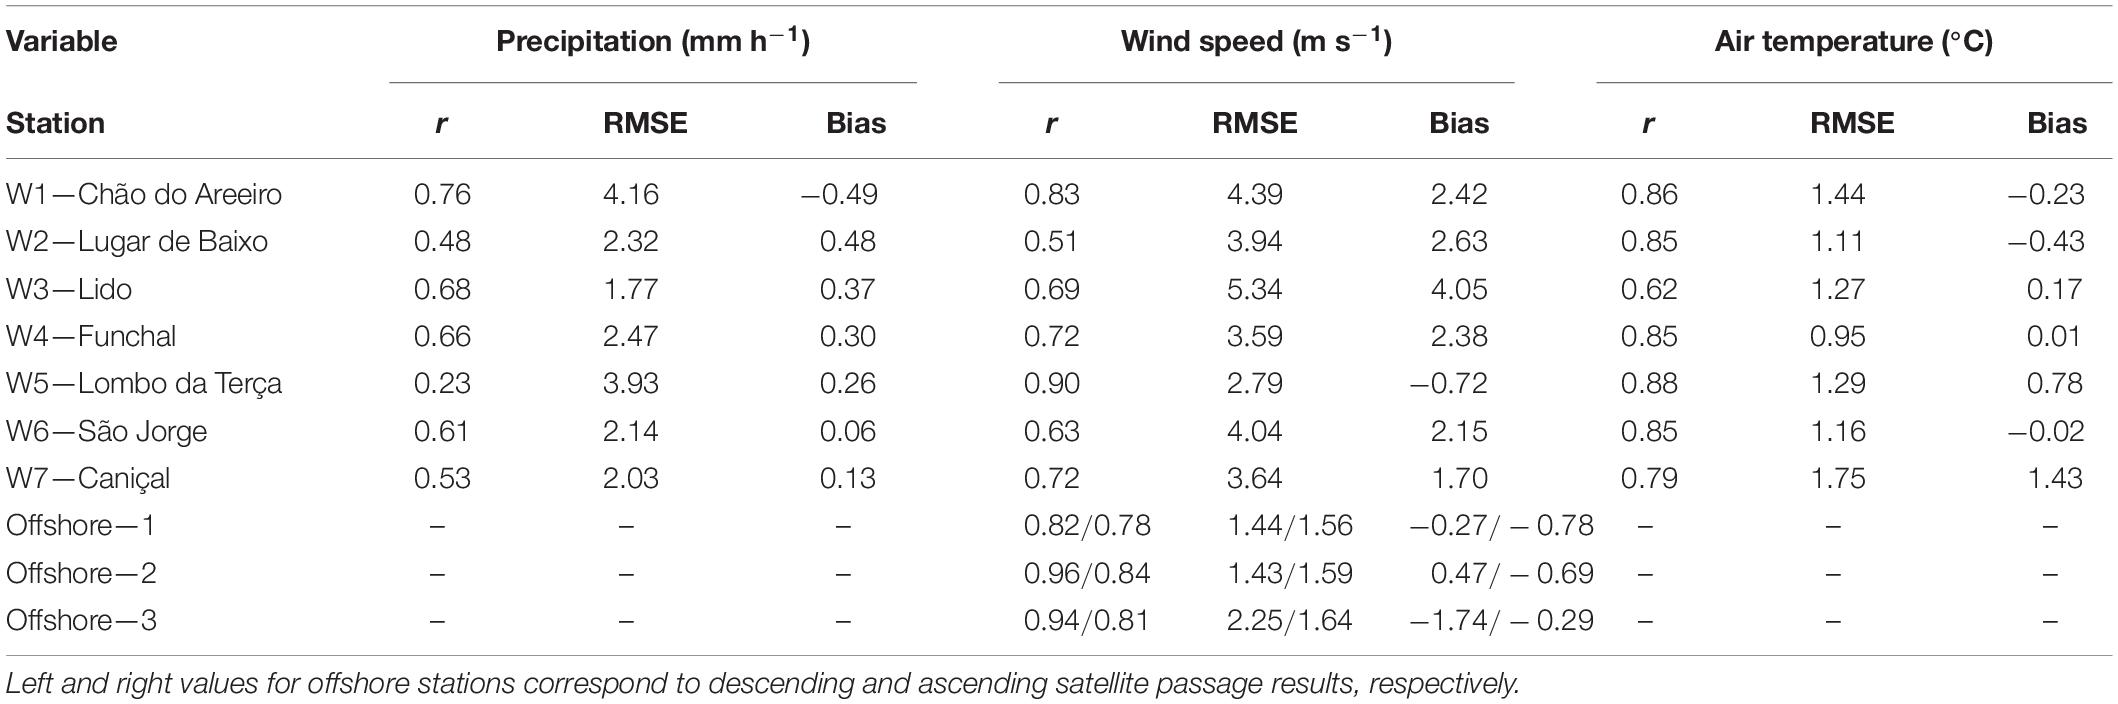
Table 2. Statistics obtained from the comparison between hourly meteorological data (precipitation, wind speed, and air temperature), daily instantaneous satellite-derived winds (offshore stations), and model simulations between 1 and 28 February 2010.
The rivers in Madeira are very poorly gauged, as are most of the small rivers in the world (Hrachowitz et al., 2013; Osadchiev and Zavialov, 2020). This lack of data acquisition is often associated with the difficulty to ensure the adequate maintenance of the hydrometric network due to the sharp topography of the island and due to the frequent torrential flow occurring during intense rain episodes which often damage the equipment and sensors (Prada et al., 2005b). Data are only available for 13 hydrometric stations, located at upstream sections of some of the rivers (altitudes higher than 400 m) and for sporadic periods between 1985 and 2000. Therefore, hydrological data at the river outlets are not available, which did not allow for the validation of the hydrological model’s outputs with in situ observations.
The accuracy of the offshore winds simulated by the coupled model was also assessed by analyzing 12.5 km resolution data from the Advanced SCATterometer (ASCAT) on MetOp-A, retrieved from a global ocean data product (WIND_GLO_WIND_L3_REP_OBSERVATIONS_012_005) provided by Copernicus Marine Service (CMEMS).2 The statistical validation was made with satellite observations from the descending (between 10:00-11:00 UTC) and ascending passage (between 21:00 and 23:00 UTC), by comparing instantaneous values both at regional scales (spatially averaged for the model domain D3; Figure 3B) and at specific locations around Madeira Island (points 1, 2, and 3 in Figure 3B).
Daily and monthly composites of satellite-derived data for SPM and Chla concentrations were obtained from the CMEMS data catalog. The analysis of SPM was based on a Level 3 data product (OCEANCOLOUR_GLO_OPTICS_L3_REP_OBSERVATIONS _009_086) at 4 km spatial resolution. The satellite-derived Chla surface concentrations were based on a Level 4 data product (OCEANCOLOUR_ATL_CHL_L4_REP_OBSERVATIONS_009 _091) at 1 km spatial resolution. Both datasets are blended gridded products and cover the period from 1997 to 2019. The usage of multi-mission products allow for an increased spatial and temporal coverage, especially relevant in regions where the analysis of satellite data is limited by cloud cover, such as over Madeira Island (Caldeira et al., 2002). Chla, SPM, and precipitation data were used to identify the periods associated with runoff events (black arrows in Figure 1B) and to assess the impact of the February 2010 flash flood events on primary productivity and turbidity around the island (regional monthly mean shown in Figures 1C,D and daily means in Figure 2).
COAWST Modeling Framework
The physical processes of the ocean and atmosphere were simulated using the Coupled Ocean-Atmosphere-Waves-Sediment Transport (COAWST), a two-way coupled numerical system, currently operational for Madeira Archipelago3 (Vieira et al., in preparation). COAWST includes the modeling of ocean circulation (Regional Ocean Modelling System—ROMS), atmosphere (Weather Research and Forecasting—WRF), and waves (Simulating WAves Nearshore—SWAN). COAWST is implemented following a downscaling technique, which consists in simulating at a regional scale, based on information provided by a larger domain, enabling the extension of operational global forecasting capabilities to local scales (Caldeira et al., 2016). Boundary conditions are provided from larger and coarser domains to their subdomains and vice-versa. In the present study, three nested domains were implemented (black boxes D1, D2, and D3 in Figure 3A). The coarsest spatial resolution, 9 km, was applied to D1 (WRF), decreasing to 3 km for D2 (WRF, ROMS, SWAN) and 1 km for D3 (WRF, ROMS, SWAN). The highest resolution, innermost grid (D3) covers Madeira, Porto Santo, and Desertas Islands (Figure 3B). Model outputs are written every 24, 12, and 1 h for the D1, D2, and D3 domains, respectively. Models within the COAWST coupled system are integrated by the Model Coupling Toolkit (MCT), an open-source software that enables the two-way exchange of data between the models with minimum effort (Jacob et al., 2005; Larson et al., 2005). For the coupling of the models, the Spherical Coordinate Remapping, and Interpolation Package (SCRIP; Jones, 1999) was used to compute addresses and weights for remapping and interpolating fields between atmospheric and oceanic grids of different spatial resolution in spherical coordinates. For a detailed description of the COAWST coupling methodology, see Warner et al. (2010).
The exchange of variables between the models that comprise the COAWST modeling system occurred every 30 min, in which: (i) the atmospheric model WRF provided 10 m surface winds to ROMS and SWAN and atmospheric pressure, air relative humidity, 2 m atmospheric surface temperature, cloud fraction, precipitation and short-wave and long-wave net radiative fluxes to ROMS; (ii) the oceanic model ROMS provided SST to WRF and surface currents, free surface elevation and bathymetry to SWAN; and (iii) the wave model SWAN provided significant wave height and wavelength to WRF and ROMS, and wave direction, surface and bottom wave periods, percent of breaking waves, wave energy dissipation and bottom orbital velocity to ROMS (Warner et al., 2010). This numerical framework was recently applied to the Madeira Archipelago (Pullen et al., 2017a; Alves et al., 2020; Azevedo et al., 2021), demonstrating that the coupling between the atmosphere and the ocean significantly improved model results. A recent study employing the COAWST demonstrated improved performance with respect to the replication of heavy precipitation events compared with stand-alone atmospheric models (Ricchi et al., 2021). In the present study, a numerical simulation was performed using COAWST, starting on 15 January and ending on 28 February 2010, where the first 15 days were used for model spin-up, with the remaining 28 days used for the analysis presented herein.
Oceanic Model
ROMS is a free-surface, terrain-following, primitive equations model used to study the ocean response to physical forcings. Bathymetry used in the present study resulted from interpolation between ETOPO2 (Smith and Sandwell, 1997) and GEBCO8 (General Bathymetric Chart of the Oceans; Becker et al., 2009), with 2 arc-minute resolution (∼3 km) in offshore regions and 30 arc-second resolution (∼0.78 km) in coastal regions, respectively. The vertical domain was discretized to 40 sigma levels, increasing the vertical resolution near the sea surface and sea bottom. To force ROMS, initial and boundary conditions were obtained from a Hybrid Coordinate Ocean Model (HYCOM) Navy Coupled Ocean Data Assimilation (NCODA) product (global 1/12° analysis), with approximately 9 km grid resolution and daily outputs. The parameterizations chosen included: (i) radiation and nudging for tracers (temperature and salinity) and baroclinic velocities (Marchesiello et al., 2001); (ii) Shchepetkin condition for barotropic velocities (Mason et al., 2010); (iii) Chapman explicit boundary condition for free-surface height (Chapman, 1985); (iv) Generic Length Scale (GLS) for vertical mixing (k–ε scheme; Umlauf and Burchard, 2003); and (v) tides, considering 10 tidal constituents (M2, S2, N2, K2, K1, O1, P1, Q1, Mf, Mm) from a global model (TPX07; Egbert and Erofeeva, 2002). At the riverine boundaries, salinity was set to 0 and water temperature and river flow was imposed based on 10-min hydrological simulation outputs performed with the MOHID-Land hydrological model. The model variables are spatially discretized on an Arakawa C-grid. Baroclinic timestep was set as 30 and 10 s for D2 and D3 domains, respectively. For each baroclinic timestep, 30 s barotropic timestep was defined. ROMS was successfully applied in previous studies focused on Madeira Island to investigate island-induced oceanic processes (Caldeira and Sangrà, 2012; Couvelard et al., 2012; Caldeira et al., 2016; Alves et al., 2021) and has also been used in idealized and realistic studies to investigate plume dynamics generated by the Columbia, Pearl, and South Brazilian rivers (Chen et al., 2009; Liu et al., 2009; Pan et al., 2014; Basdurak et al., 2020; Branch et al., 2020; Marta-Almeida et al., 2020). Despite the lack of in situ data to assess the accuracy of the coupled ROMS model outputs during February 2010, Vieira et al. (in preparation) are (at the time of publication) assessing the general capability of our numerical framework to represent island-scale geophysical processes, including warm wakes, storm events, and land runoff. Sea surface temperature, sea surface salinity, waves, and coastal currents compared well with data collected between 2018 and 2021. For more information on the numerical details of the ROMS model, the reader is referred to Shchepetkin and McWilliams (2005).
Atmospheric Model
WRF is a numerical model used for atmospheric research and operational forecasting. The WRF configuration used in the present study considers the non-hydrostatic terms and the second-order diffusion term to solve turbulence, except in the boundary layer where the turbulent flow is solved through the Smagorinsky scheme. The WRF parameterization comprised the following options: (i) WSM 6-class graupel scheme for cloud microphysics (Hong and Lim, 2006); (ii) Rapid Radiative Transfer Model for longwave and shortwave radiation (Mlawer et al., 1997); (iii) Eta similarity scheme for the surface layer (Janjic, 1996; Janjić, 2002); and (iv) Mellor-Yamada-Janjic scheme for the planetary boundary layer (Janjic, 1990, 1994). The vertical domain was discretized to 40 sigma levels. The initial and boundary conditions used to force the model were obtained from the NCEP (National Center for Environmental Prediction) FNL (Final) Operational Model Global Tropospheric Analyses, with 6 h interval outputs and 1° resolution. The Shuttle Radar Topography Mission (SRTM) was used as topographic data (Becker et al., 2009), with a horizontal resolution of 3 arc-second (∼90 m). Land use information was obtained from the Corine Land Cover 2006 (CLC-06) from USGS, National Center for Earth Resources Observation and Science (EROS; Büttner and Kosztra, 2007). CLC-06 classes were converted to 24 USGS classes and the classification table was obtained from De Meij and Vinuesa (2014). The use of SRTM and CLC-06 improved the topography and land-use representation and the calculation of topographically sensitive variables, such as wind speed, air temperature, and precipitation. The calculation time step was set to 45, 15, and 5 s for D1, D2, and D3 domains, respectively. Although with slightly different configurations, the stand-alone WRF was successfully implemented in Madeira Island in past studies (Couvelard et al., 2012; Caldeira and Tomé, 2013; Grubišic et al., 2015). For a detailed description of the WRF model, the reader is referred to Skamarock and Klemp (2008) and Skamarock et al. (2008).
Atmospheric Model Validation
The atmospheric model outputs for February 2010 were validated using hourly averaged data from seven meteorological stations. These stations are located at different altitudes: Chão do Areeiro (W1) is located at the central ridge; Lugar de Baixo (W2), Lido (W3), and Funchal (W4) are located at the southern region; Lombo da Terça (W5), São Jorge (W6) and Caniçal (W7) are located at the northwestern, northeastern and eastern regions, respectively (Figure 3C). Statistical validation between model results and observations are shown in Table 2. The comparison of modeled and in situ data for precipitation and wind speed are shown in Figure 5, while the air temperature is shown in Supplementary Figure 2. Offshore winds from numerical simulations were also compared with satellite data products and are shown in Figure 6.
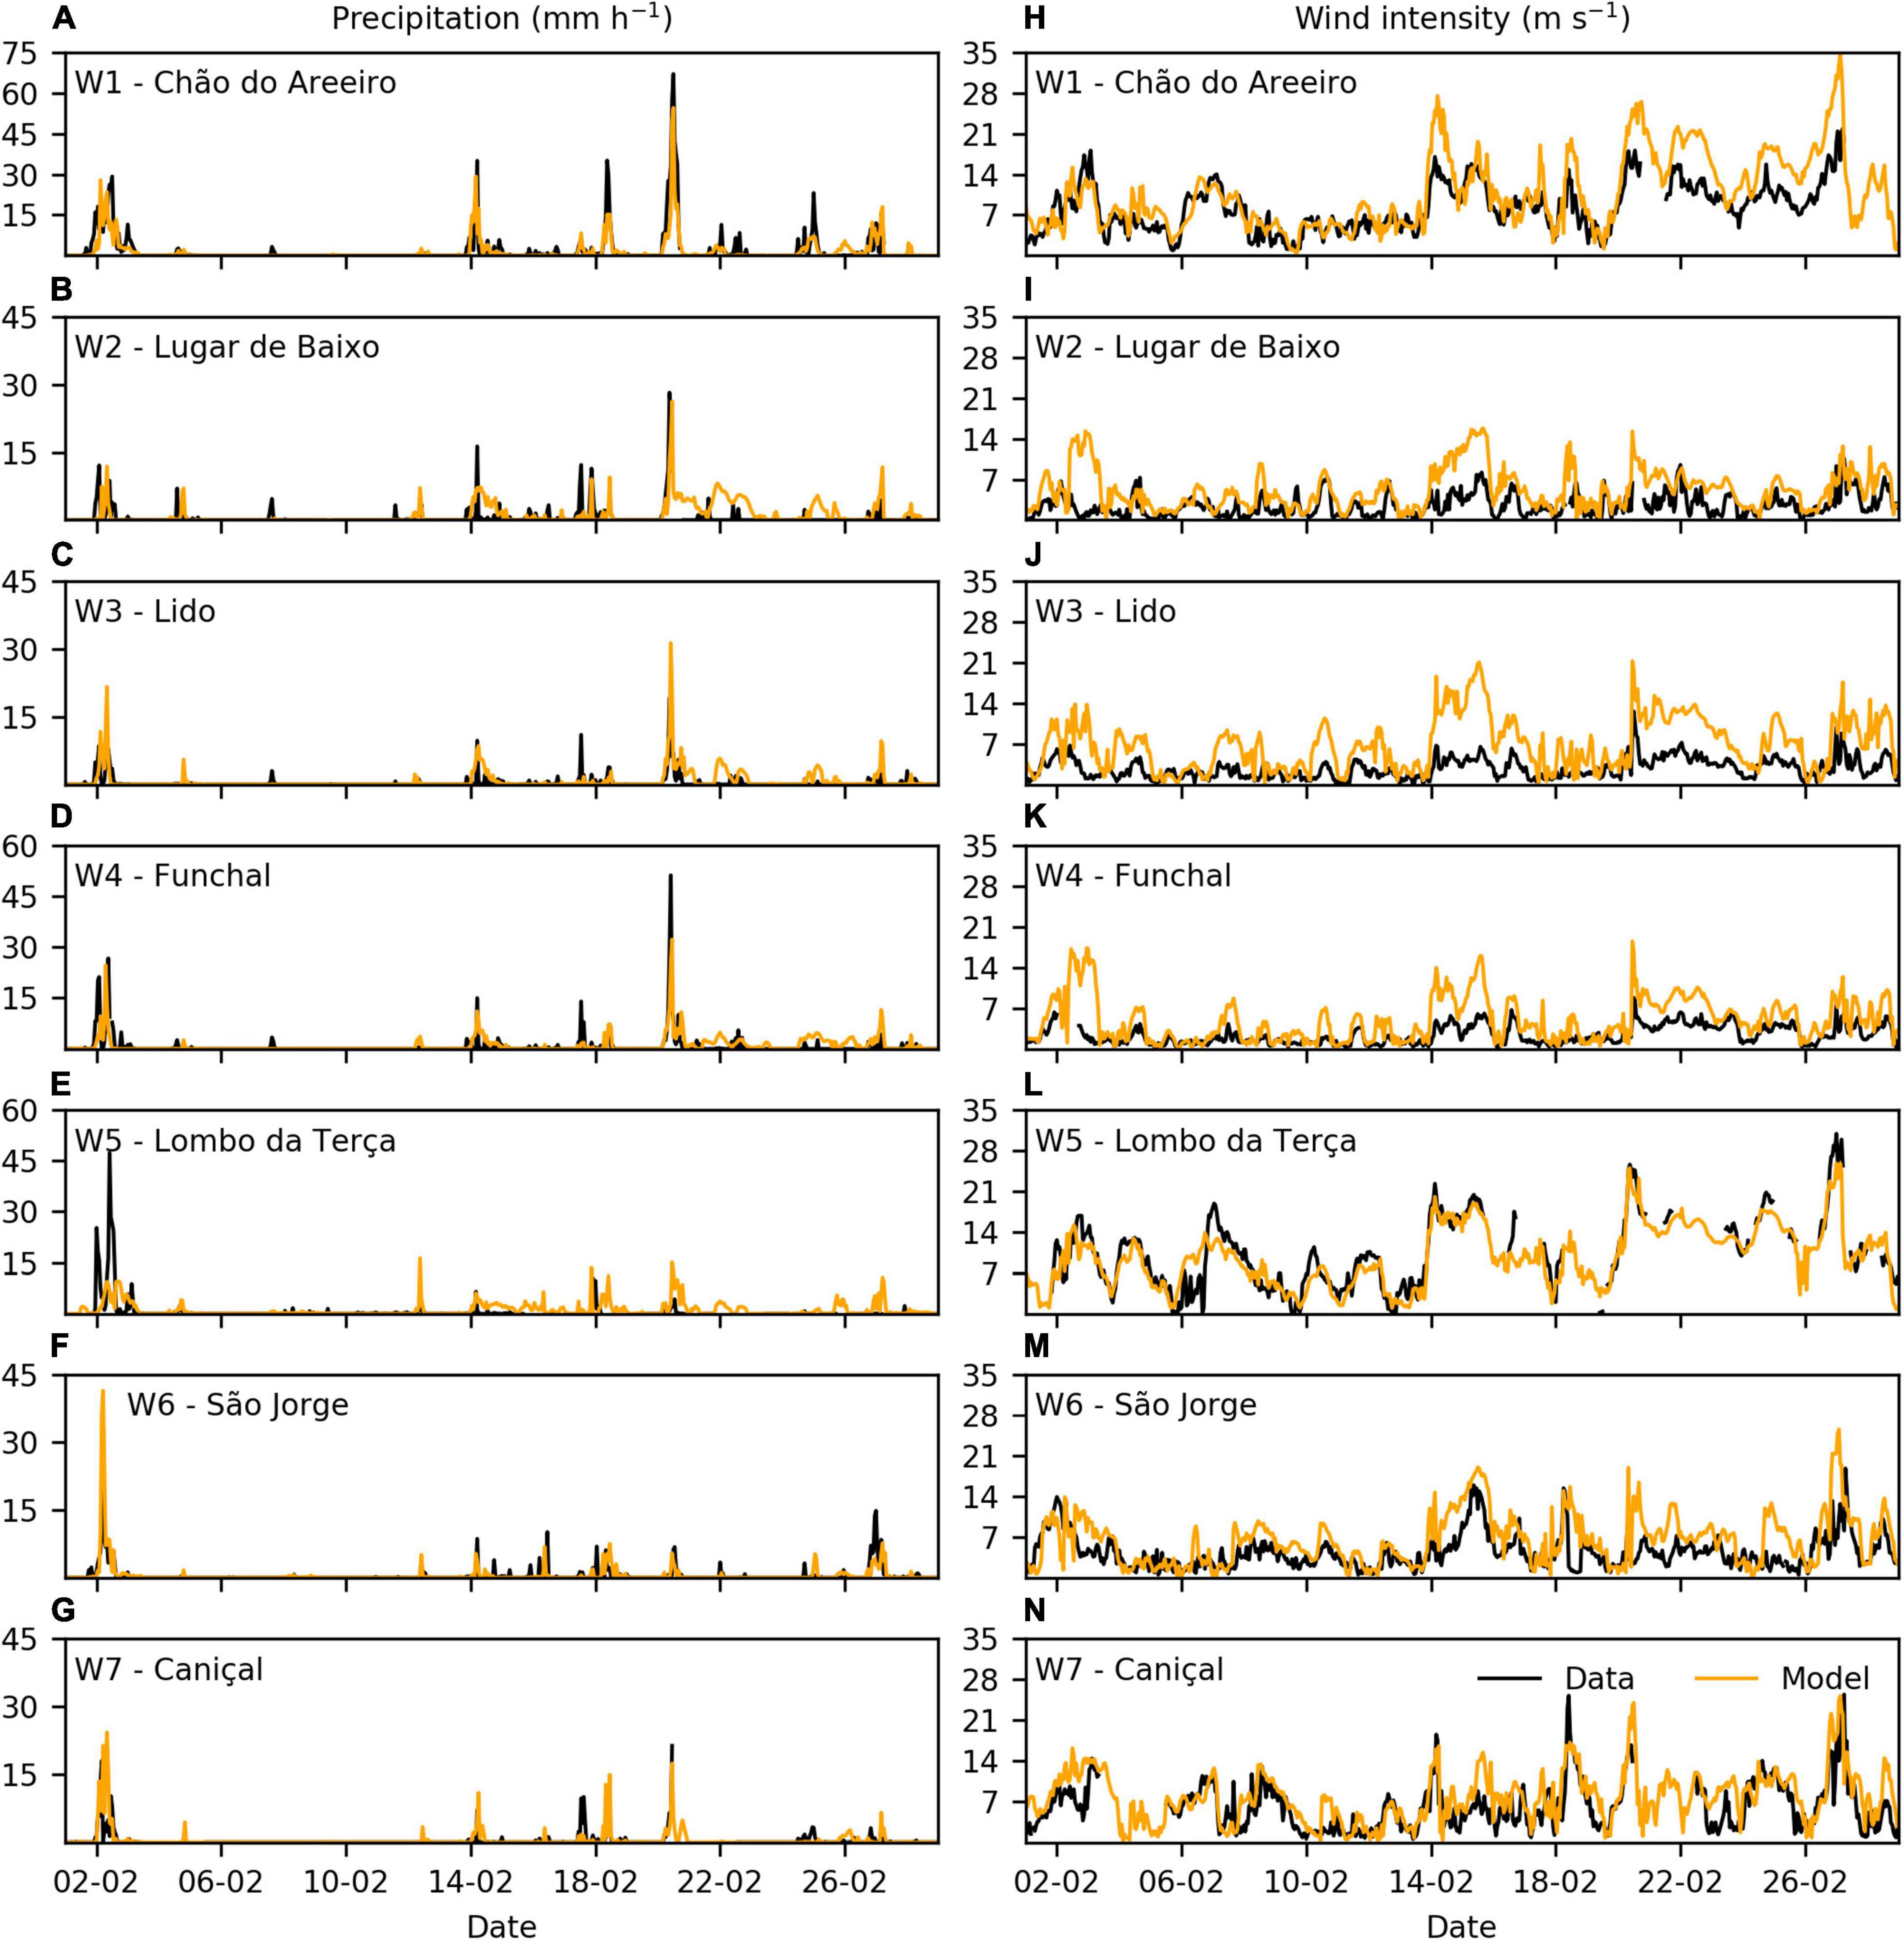
Figure 5. Comparison between the data recorded by the meteorological stations (black line) and the COAWST model results (orange line) for (A–G) precipitation (mm h–1; left panel) and (H–N) wind intensity (m s–1; right panel) during February 2010. Note the changes on the precipitation scales.
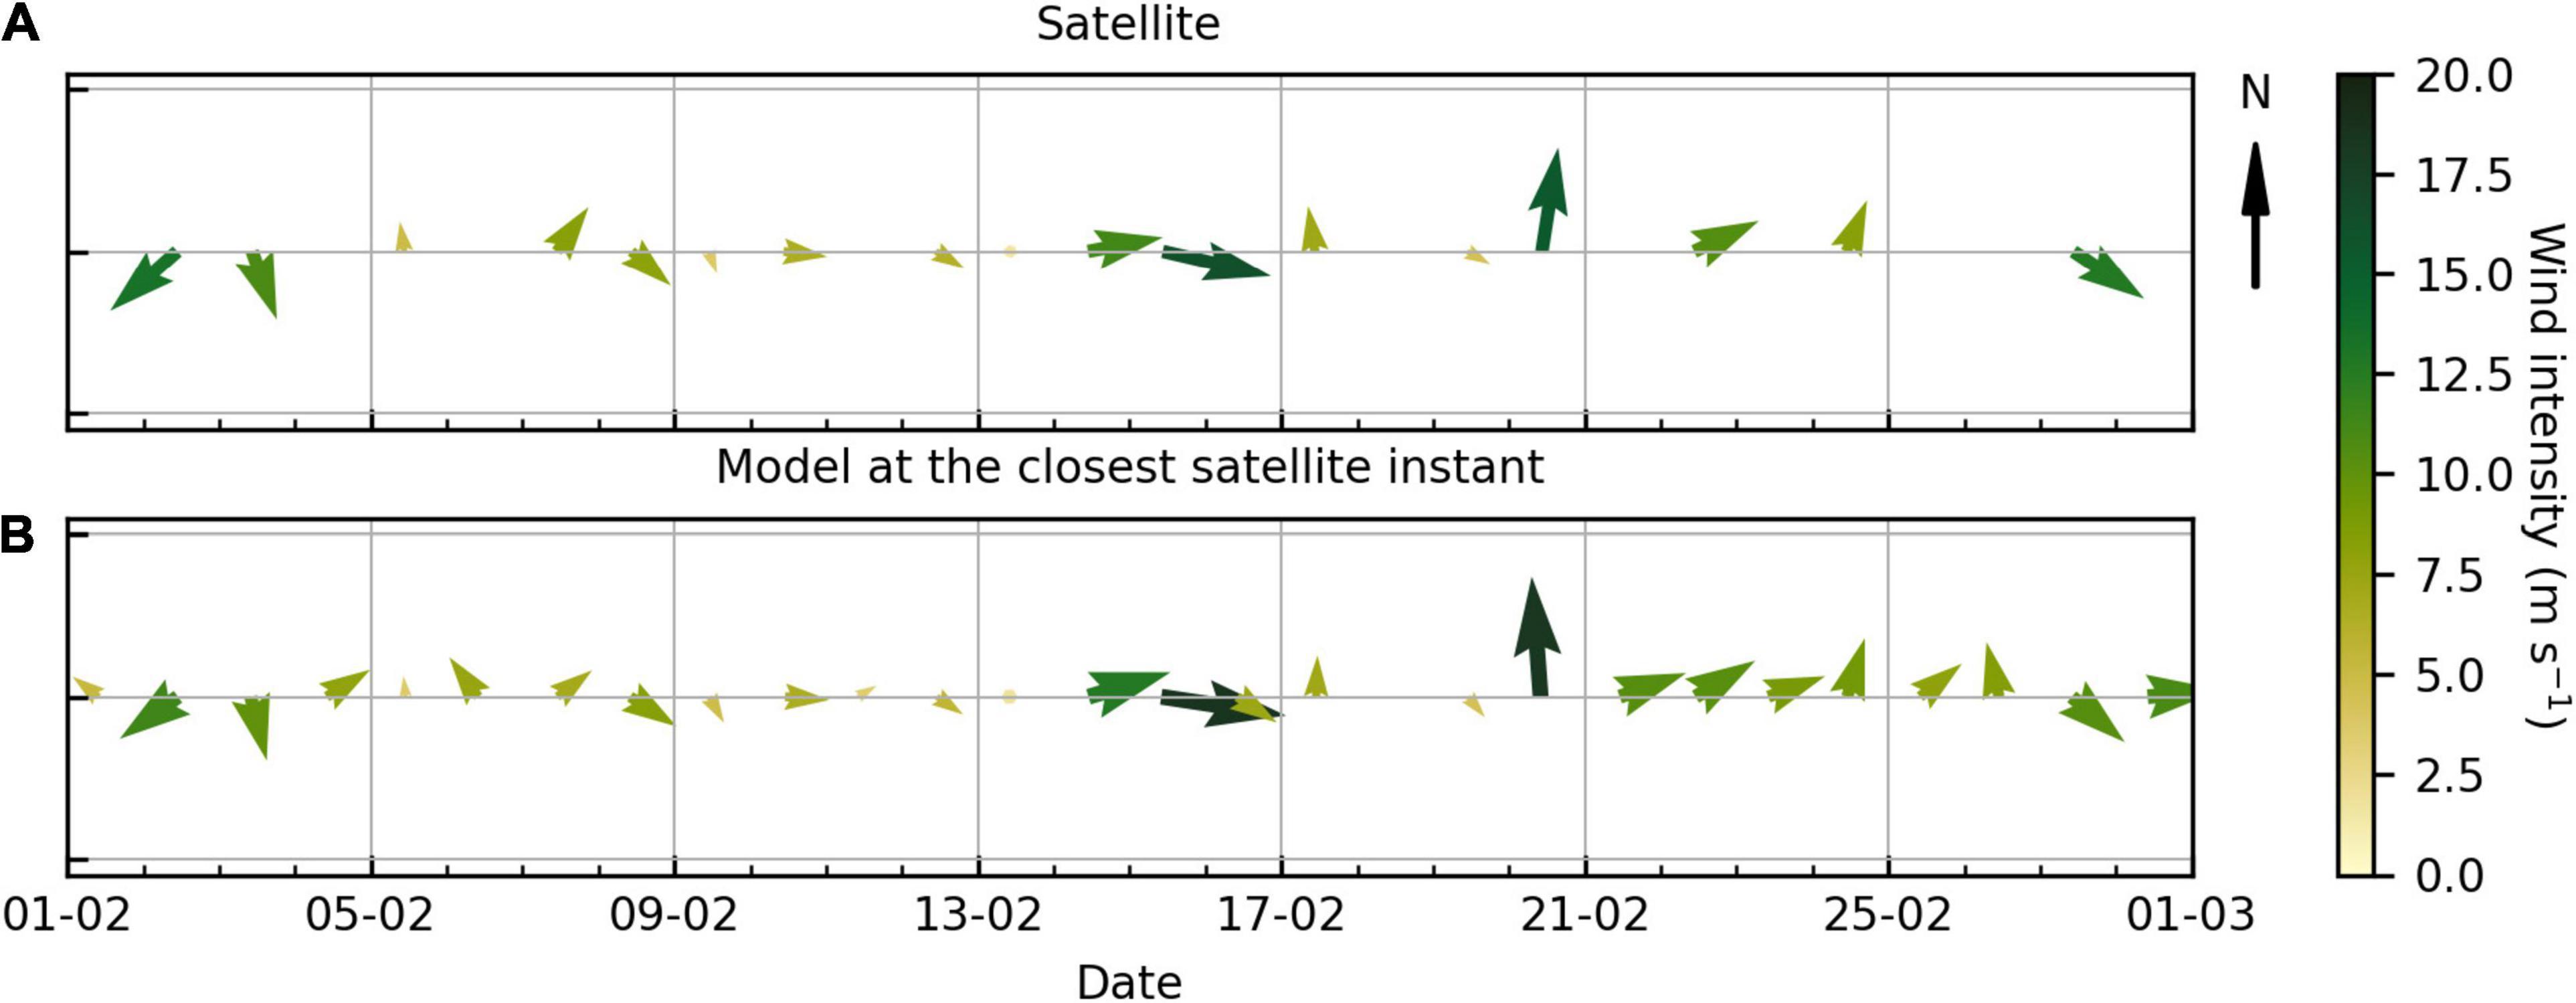
Figure 6. Comparison of D3 domain spatial average of wind direction and intensity (m s–1) from (A) ASCAT (descending satellite passage) and from (B) model simulations at the timestep closest to the time of the satellite passage.
Precipitation data recorded at the meteorological stations shows two periods of maximum rainfall depicted by the rain gauges (black line in Figure 5, left panels), on the 2nd and 20th of February. During the first episode, maximum rainfall occurred in São Jorge (W6) and Chão do Areeiro (W1) stations, reaching approximately 35 and 30 mm h–1, respectively, while the remaining stations measured values between 9 and 27 mm h–1. During the second event, precipitation was much higher than the values recorded on the 2nd of February, particularly in Chão do Areeiro (W1), Funchal (W4), Lugar de Baixo (W5), and Lido (W3) stations, with maximum values reaching 67, 51, 28 and 20 mm h–1, respectively. COAWST replicated precipitation during both quiescent and high precipitation events with a high degree of accuracy at most stations, as suggested by the RMSE (<2.5 mm h–1) and correlations coefficient values (r > 0.5; Table 2). Maximum agreement occurred at Lido (RMSE = 1.77, r = 0.68; W3) and maximum disagreement at Chão do Areeiro (RMSE = 4.16, r = 0.76; W1), followed by Lombo da Terça (RMSE = 3.93, r = 0.23; W5). Despite the strong correlation (r = 0.76) at Chão do Areeiro (W1), the model underestimated precipitation values over the entire period at this station (Figure 5A), as suggested by the negative bias (Table 2). At Lombo da Terça (W5), the model underestimated precipitation in the first episode and overestimated in the second event (Figure 5E), showing an overall overestimation, as indicated by a bias of 0.26 (Table 2). We believe that this discrepancy between model results and observations is likely due to the complex topography and the model spatial grid resolution (1 km), which may not be able to reproduce the exact weather conditions at the station location. It is also important to note that the model results used for this comparison were extracted from the nearest grid point to the meteorological station, which may not be the exact same position. However, overall, the model performs well and strikes a good balance between model accuracy and computational cost. Model RMSE and correlation coefficient obtained in the present study are similar to previous studies (Luna et al., 2011; Teixeira et al., 2014; Dasari and Salgado, 2015).
Concerning wind, comparison of model results with in situ measurements demonstrates that the model represents the main spatial and temporal variability of the wind speed (Figure 5, right panels). Correlation coefficients (mostly ranged between 0.7 and 0.9; Table 2) are similar or higher than those reported in previous studies (Pullen et al., 2017b; Alves et al., 2020; Belo-Pereira and Santos, 2020). However, RMSE are higher than those reported by Alves et al. (2020). The higher RMSE is associated with the fact that, in contrast to previous studies, our model was applied to replicate conditions during extreme weather, during which wind intensity and direction vary rapidly. Positive bias also indicates an overestimation of the wind speed by the model, except at Lombo da Terça station (W5) where the wind speed was underestimated (Table 2). Figure 6 shows the comparison between the average offshore winds for the regional domain (D3; Figure 3B) obtained from descending satellite passage and from the model simulation at the closest satellite instants. As can be seen, the model represents well the main temporal variability patterns of the wind direction (as observed in Figure 6) and wind intensity (r = 0.96) computed for February 2010. Ascending satellite passage shows similar results (r = 0.90). The accuracy of the modeled surface wind was also assessed at three specific locations (points 1, 2, and 3 represented in Figure 3B), and are presented in Table 2 for both descending and ascending satellite passages. Points 1 and 3 are located close to the regions of the atmospheric jets (Alves et al., 2020, 2021), and point 2 is in the southern region characterized by the frequent occurrence of warm wakes (Caldeira et al., 2002, 2016; Couvelard et al., 2012; Grubišic et al., 2015; Azevedo et al., 2021). In general, correlation coefficients were high (0.78–0.96) and RMSE values were low (mostly < 1.6 m s–1; Table 2), showing the strong performance of the model with respect to representing the wind variability. The point located at the eastern atmospheric tip-jet (point 3) showed the worst comparisons, as indicated by the highest RMSE (2.25 and 1.64 m s–1 for descending and ascending satellite data, respectively), associated with an underestimation of the wind speed, as suggested by negative bias (Table 2). Despite that, WRF wind correlation coefficients reported in this study are identical to those reported in previous studies using ASCAT satellite data products at similar locations (Alves et al., 2020, 2021).
The main spatial and temporal air temperature was also closely replicated by COAWST, as shown in Supplementary Figure 2, and as suggested by strong correlation coefficients (mostly > 0.8), low RMSE (<1.3), and low bias (ranged between −0.43 and 0.78; Table 2). Sites with the largest divergence from observations were Caniçal (W7) and Chão do Areeiro (W1) stations, with RMSE of 1.75 and 1.44°C, respectively (Table 2). RMSE and correlation coefficient in the present study are similar or better than those reported in former studies (Pullen et al., 2017b; Alves et al., 2020).
While small discrepancy between model outputs and observations are present, the WRF model performs well considering the complexity of atmospheric processes interacting with highly variable topography and terrain. Reported RMSE and correlations in this study closely agree with those reported in previous studies providing confidence in the WRF to replicate precipitation, wind and air temperature.
Wave Model
SWAN is a state-of-the-art third-generation wave model designed to simulate the generation and propagation of waves in coastal shallow waters (Booij et al., 1999). Initial and boundary conditions for the wave height, period and direction were obtained from a global model product (multi_1.glo_30m) with 30 arc-minute grid resolution (∼1 km) and outputs every 3 h, available at the NCEP database. The SWAN boundaries were divided into 10 directional bands and 25 frequencies (range: 0.04–1 Hz). The Taylor and Yelland (2001) formula was used for changes in sea surface roughness caused by waves. Timestep was set to 180 and 60 s for D2 and D3 domains, respectively.
MOHID-Land, the Hydrological Model
The hydrological simulations were performed using the MOHID-Land numerical code, a physically based, continuous and open-source model designed to study watershed dynamics and the transport of water quality tracers (Trancoso et al., 2009; Canuto et al., 2019; Oliveira et al., 2020). The model considers four mediums, the atmosphere (which provides the meteorological data, not explicitly simulated in MOHID-Land), porous media (i.e., soil), land surface, and drainage (i.e., river) network. The water circulates through the three latter compartments based on mass and momentum conservation equations. MOHID-Land is based on finite volumes organized into a regular structured grid, rectangular or quadrangular in the horizontal domain, and Cartesian in the vertical domain. MOHID-Land has been applied to study several research topics, including (i) forecasts of freshwater quantity and quality to improve the management of coastal systems (Brito et al., 2015); (ii) the assessment of nutrient transport and turnover processes at the watershed scale (Epelde et al., 2016); (iii) water-exchanges between surface water and groundwater in floodplains (Bernard-Jannin et al., 2016); (iv) the contribution of flash floods episodes to the eutrophication in water reservoirs (Brito et al., 2017, 2018); (v) the improvement of the irrigation water management (Simionesei et al., 2016, 2018, 2020; Ramos et al., 2017, 2018b); and (vi) the influence of reservoir management on the river flow regime (Canuto et al., 2019). For a more detailed description of the model’s architecture and sensitivity to parameterizations, the reader is referred to Trancoso et al. (2009) and Oliveira et al. (2020), respectively.
The configuration of MOHID-Land used in the present study relies on a rectangular grid with a 100 m horizontal resolution, meaning that all maps used for the calculation of surface and subsurface land runoff were resampled to a 100 m horizontal grid resolution, regardless of the original grid resolution. The Digital Terrain Model (DTM), used to derive the model’s drainage network (Figure 4A) and other parameters (e.g., soil depth), was sampled through LIDAR surveying techniques with a 5 m horizontal spatial resolution and was provided by the DROTe (Direção Regional do Ordenamento do Território). The geometry of the river cross-sections was considered rectangular and was defined as a function of the drained area in each node (linearly interpolated between user-specified values, presented in Supplementary Table 3). Considering that the present study aims to simulate an extreme weather event, the Manning coefficient for the entire drainage network was set to a constant value of 0.035 s.m–1/3, which according to Gonçalves (2016) is close to the optimum value estimated for three Madeiran rivers at peak discharge rate. Maps for land cover/land use (at 1:10,000 scale; COSRAM) and soil type (at 1:50,000 scale; Ricardo et al., 1992; Supplementary Figure 1) were also provided by DROTe.
In the present study, MOHID-Land calculated surface runoff and infiltration over different land uses with the runoff curve number (CN) method, based upon the methodology developed by the USDA Soil Conservation Service (1972). CN values can range from 0 to 100, in which high values are associated with less permeable soils and thus higher surface runoff. In practice, CN values estimated for Madeira assume that surface runoff and infiltration are dependent on the soil type and land use (e.g., Řehánek et al., 2019; Lopes et al., 2020). According to USDA Soil Conservation Service (1972), soils can be divided into four hydrologic groups from A to D, in which type A/D soil has the highest/lowest hydraulic conductivity and lowest/highest surface runoff potential. The definition of the soil hydrologic groups was done considering the soil texture (i.e., the relative proportion of sand, silt, and clay), following Sartori et al. (2009) (Supplementary Table 2). The CN values specific to each land use developed by the SCS were adapted to Portuguese soils by David (1976) and Correia (1983) (consulted in Oliveira, 2004). The resulting map was computed by merging the combined attributes of the hydrological soil type and land use (Figure 4C). As surface runoff and infiltration during a precipitation event is highly dependent on the soil’s antecedent moisture condition (AMC), CN values can also be adjusted to dry (CN AMC I), moderately wet (CN AMC II) or wet (CN AMC III) conditions. MOHID-Land works with CN AMC II by default but adjusts CN values according to the accumulated precipitation in the previous 5 days.
Using the information on land use, the vegetation type (Figure 4B) was defined according to MOHID’s vegetation database, and corresponding Manning coefficients (Figure 4D) were defined following Pestana et al. (2013). The porous media was divided into five grid layers, with a thickness of 0.3, 0.3, 0.4, 1.0, and 3.0 m (from surface to bottom). The soil depth in each cell varied according to the cell’s slope, set between a maximum of 5 m (flat areas) and a minimum of 0.1 m (steep areas). For the vertical soil profile, the soil was divided into four horizons with specific hydraulic parameters: (a) 0–0.6 m (1st and 2nd soil grid layers), (b) 0.6–1.0 m (3rd soil grid layer), (c) 1.0–2.0 m (4th soil grid layer), and (d) 2.0–5.0 m (5th soil grid layer; Supplementary Figure 3). This means that horizon (a) included the first two grid layers, horizon (b) included the third layer, horizon (c) included the fourth layer, and horizon (d) included the bottom layer. The hydraulic parameters for each horizon were extracted from the multilayered European Soil Hydraulic Database (Tóth et al., 2017), which includes the Mualem–van Genuchten hydraulic parameters with a 250 m resolution (Supplementary Table 4). The vertical hydraulic conductivity in each cell results from the multiplication of the horizontal hydraulic conductivity (retrieved from Tóth et al., 2017) by a factor of 10, the initial water depth was set to 50% of the soil’s depth.
Outputs from the coupled WRF model (within the COAWST numerical framework described and validated in section “Atmospheric Model Validation”) were used to simulate MOHID’s atmospheric forcing conditions (precipitation, temperature, wind, air humidity, and solar radiation). MOHID-Land’s calculation timestep was dynamically adjusted (decreasing/increasing) according to the precipitation rate. The MOHID-Land simulation period was set between 10 December 2009 and 1 April 2010, where the first 2 months were used as model spin-up. The river discharge rate (m3 s–1) and water temperature (°C) obtained from the hydrological simulations at 10-min timesteps were then used to force the oceanic model at the grid cells that were nearest to the actual river outlets (shown in Figure 3C). Given the spatial grid resolution of the oceanic model and the close proximity of the rivers, a total of 148 rivers were considered, which accounted for 96 riverine grid cells in the oceanic model. This model setup assumes that the land runoff due to high precipitation events predominantly flows abruptly via rivers, with sheet runoff making a negligible contribution to freshwater discharge from land. The numerical framework used in this study presents a significant advance for the scientific community mainly because the coupling of oceanic models with hydrological models is scarce (e.g., Dresback et al., 2013; Silva-Araya et al., 2018), especially when applied to insular systems with complex topography (e.g., Ogden, 2016). Despite the lack of in situ data to validate the MOHID-Land outputs, past studies focused on the flash flood event of 20 February 2010 employed theoretical methodologies for the calculation of peak river discharge and showed similar results with the present study, with river discharge rates ranging from ∼200 to 600 m3 s–1 in the large rivers (Oliveira et al., 2011; Caetano, 2014; Lousada and Loures, 2020). Still, there is a need to investigate model sensitivity to different hydrological scenarios when river gauge data becomes available.
Kinematic Parameters
To investigate the impact of the river plumes on coastal waters, two kinematic parameters were computed to study the stratification and mixing of the water column, the Brunt–Väisälä buoyancy frequency (N2) and Richardson Number (R_i), respectively. These two parameters have previously been employed to investigate stratification and mixing processes in coastal waters (Osadchiev, 2018; Ayouche et al., 2020, 2021; Basdurak et al., 2020; Sorgente et al., 2020).
The Brunt–Väisälä buoyancy frequency squared is defined as:
where g is the gravitational acceleration (9.8 m s–2), ρ0 is the reference density, ρ is the density calculated from temperature and salinity model outputs and ∂ρ/∂z is the vertical density gradient (thus, at the surface, N2 is equal to 0; Saldías et al., 2012). High Brunt–Väisälä values are indicative of vertical stratification.
The Richardson Number is defined as:
where N2 is the Brunt–Väisälä Frequency and S2 is the vertical shear (S2=(∂zu)2 + (∂zv)2, where u and v corresponds to the eastward and northward velocities, respectively; Ayouche et al., 2020). R_i values lower than 0.25 are indicative of vertical mixing and therefore the kinetic energy of the flow surpasses vertical stratification (Smyth and Moum, 2000; Sanders and Garvine, 2001).
Results and Discussion
The impact of flash floods events on coastal circulation and on ecosystem dynamics depends on the physical processes that control the spreading and mixing of buoyant river plumes (Horner-Devine et al., 2015). For example, the wind and ocean currents control the spreading, while the vertical shear controls the mixing of freshwater with oceanic waters, increasing salinity and decreasing concentrations of land-based material in the coastal plume (Horner-Devine et al., 2015). Bearing this in mind, the impact of the river discharges from the February 2010 flash floods on the coastal waters around Madeira Island is focused on the physical processes that mediated the plume’s behavior. In this regard, the variability of atmospheric forcing mechanisms (i.e., precipitation and wind), river discharges, and sea surface salinity (i.e., stratification) for the entire month is first described. Subsequently, two specific flash floods events are studied in more detail to better understand the potential processes influencing the different SPM and Chla concentration observations (Figure 2). To this end, we used modeled salinity distributions as a proxy to investigate the transport of freshwater and associated terrigenous material, including nutrients, to coastal and offshore waters.
Temporal Variability of Atmospheric Forcing, River Discharges, and Sea Surface Salinity
Temporal variability of wind, precipitation, river discharges, and sea surface salinity for February 2010 is shown in Figure 7. To analyze the prevailing wind direction and intensity, the wind field obtained from the coupled physical model was spatially averaged for the regional domain (D3; Figure 3B). As observed in Figure 7A, wind speed and direction varied quite significantly over the study period, changing anti-clockwise from south to southeast during the first 6 days, then turning clockwise and remaining with a westward orientation most of the time (varying between southwest and northwest direction). During the two periods of maximum rainfall, which corresponds to the 2nd and 20th of February (black dashed lines in Figure 7), prevailing winds had a northeast and southwest direction, respectively, reaching speeds typical of stormy weather conditions (∼ 15 and 20 m s–1, respectively). On these occasions, extreme volumes of rain fell over the island, such that the total daily precipitation during the 2nd and 20th of February 2010 accounted for 19 and 20% of the total monthly precipitation (blue line in Figure 7B). Hourly precipitation values higher than 0.5 mm h–1 prevailed 69% of the time.
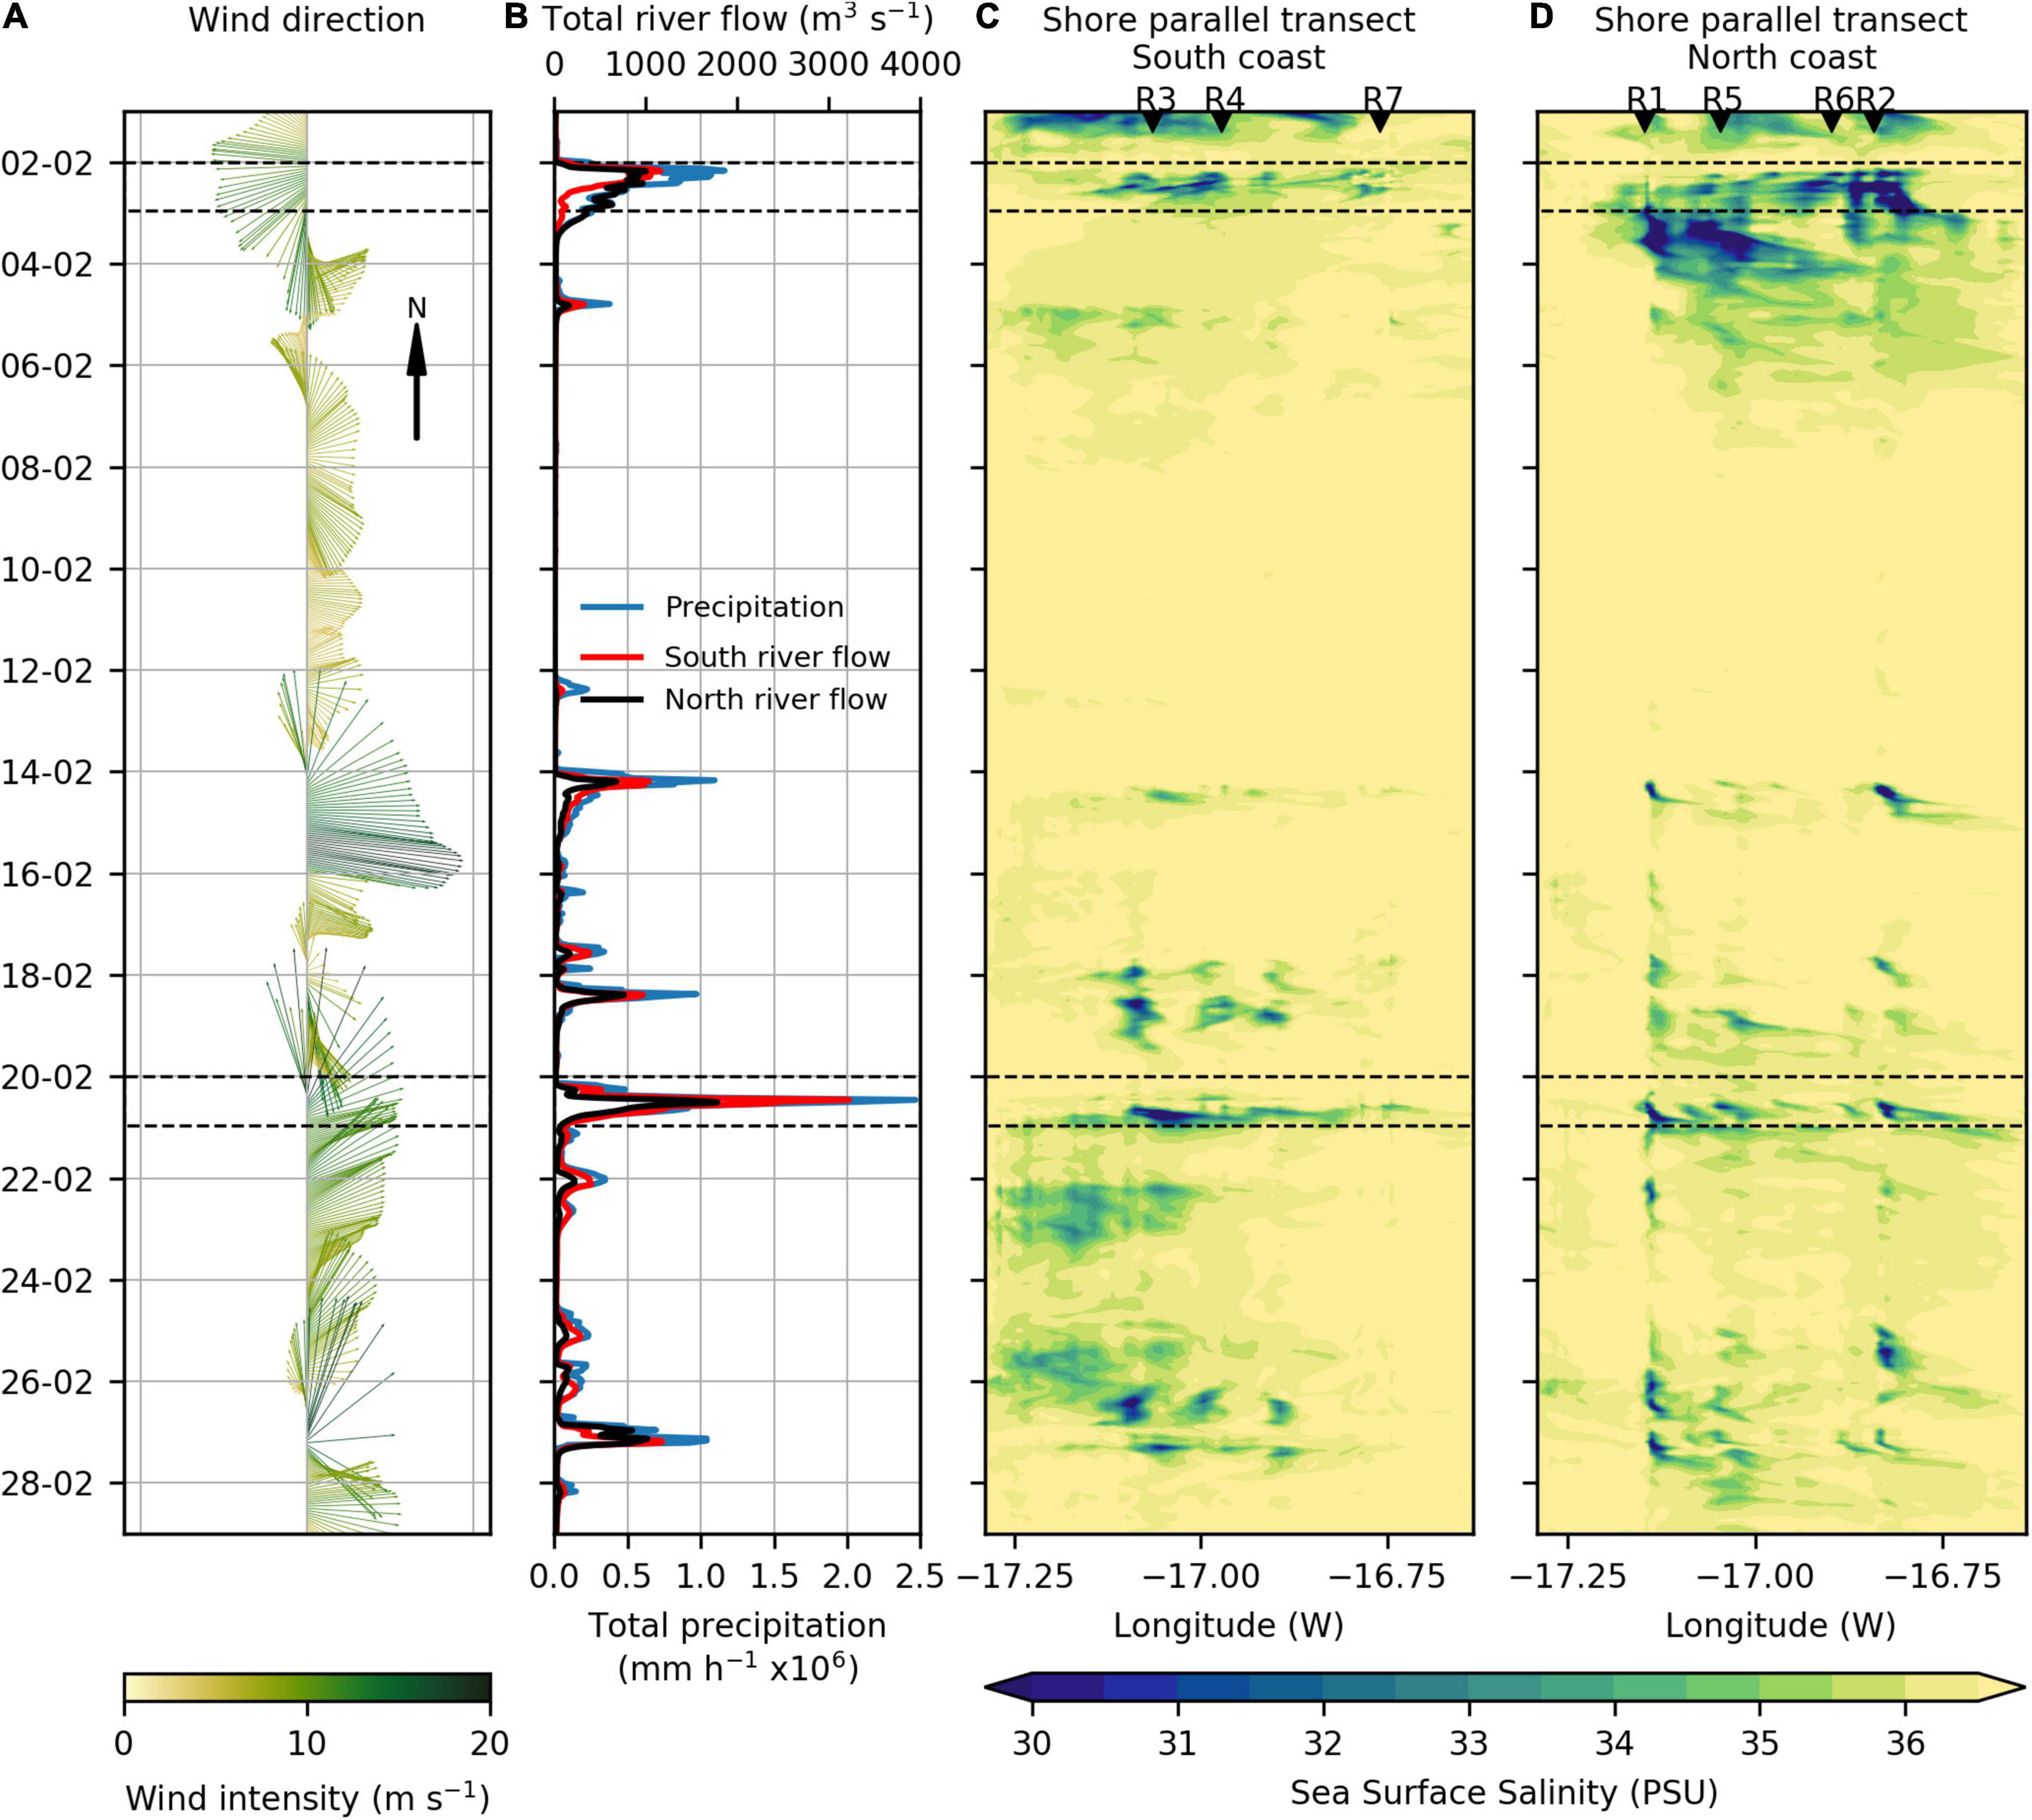
Figure 7. (A) Spatial average of WRF model wind direction and intensity (m s–1) for D3 domain, (B) total modeled river flow (m3 s–1) for rivers discharging in the south coast and north coast, along with the WRF model total precipitation (mm h–1) calculated for the island (red, black and blue lines, respectively), Hovmöller diagrams for the modeled Sea Surface Salinity (PSU) obtained from the shore parallel transects along (C) the southern shoreline and (D) northern shoreline during February 2010. The shoreline transects are positioned around 2 km from the coast and labels R1–R7 indicate the position of the main river outlets (see Figure 3C for transects and river outlets location). Black dashed lines identify two flash flood events.
As expected, river discharges simulated by the hydrological model responded rapidly to intense precipitation events, as suggested by the concurrent peaks of the river flow and precipitation (Figure 7B). This pattern is usually found in mountainous rivers characterized by small drainage basins and steep topography (Osadchiev et al., 2020). This is the case of the Kodor River (located in the northeastern region of the Black Sea), where the shape and size of its river plume are very dynamic and can change very quickly (Osadchiev et al., 2020). In Madeira, total river discharge rates ranged between 15 and 4,566 m3 s–1, corresponding to a total freshwater volume of 4.8 × 10⁸ m3 that entered the coastal area during the entire month. Southern rivers accounted for 56% of total freshwater volume (2.7 × 10⁸ m3 via 77 rivers outlets), while 44% of total freshwater volume flowed from northern rivers (2.1 × 10⁸ m3 via 71 rivers outlets). South rivers reached a maximum combined discharge rate of 3,220 m3 s–1, while north rivers reached a maximum combined discharge rate of 1,782 m3s–1 (both peaks on 20th of February; red and black line in Figure 7B, respectively).
Hovmöller diagrams representative of sea surface salinity transects parallel to the south and north coast (see Figure 3C for transects location) are shown in Figures 7C,D, respectively. In general, salinity values were typical of oceanic waters (>36.5 PSU; Caldeira et al., 2002; Narciso et al., 2019). The exceptions occurred during periods of strong precipitation and consequent intense river discharge, whereby salinity decreased to < 35 PSU (Figures 7C,D). Despite the occurrence of maximum precipitation and river discharges on the 20th of February (Figure 7B), the river plume at the surface showed a more persistent signature on the 2nd and 3rd of February on the northern coast, as indicated by low salinity values (<30 PSU; Figures 7C,D). Thus, two major hydrological events were identified: the 2nd of February, characterized by intense precipitation, high river discharges, moderate northeasterly winds forming a persistent river plume in the northern coast; and the 20th of February—the catastrophic flash flood event—characterized by extreme precipitation, extreme river discharges, strong southwesterly winds, and a less persistent surface river plume mainly affecting the southern coast. As such, we will focus on the plume dynamics and their impacts on the coastal waters during these two episodes.
Coastal Dynamics of River Plumes
Considering that freshwater discharges, wind, ocean currents, bathymetry, and coastal geometry are some of the primary factors that determine the shape and size of river plumes (Horner-Devine et al., 2015), here we discuss the dynamics of the plumes based on snapshots of surface maps representing the variability of precipitation, river flow, wind, ocean currents, and sea surface salinity, while water column stratification and mixing processes are discussed based on vertical transects of salinity, Brunt–Väisälä Frequency and Richardson Number.
February 2nd, 2010—Northeasterly Winds
Snapshots of surface maps for the 2nd of February 2010 flash flood event are shown in Figures 8A–D. The wind field clearly reflects the orographic effects on the lower atmospheric level, frequently detected in Madeira Island (Couvelard et al., 2012; Caldeira and Tomé, 2013; Caldeira et al., 2014; Pullen et al., 2017b; Caldeira, 2018; Alves et al., 2020, 2021; Belo-Pereira and Santos, 2020). This pattern is particularly evident at 06:00 and 12:00 UTC, when moderate northeasterly winds (∼15 m s–1) intercepted the island’s topography, inducing an intensification of the wind at the eastern and western flanks, and a deceleration in the southern (wake) side (<5 m s–1; Figures 8A,B). These two tip-jets are frequently observed on the island flanks of Madeira, particularly during Summer (Alves et al., 2020). As the north component of the wind intensified to ∼ 17 m s–1, orographic effects generated downslope airflow, resulting in stronger winds blowing offshore on the leeward side of the island, as captured at 21:00 UTC and at 6:00 UTC on 3 February (Figures 8C,D).
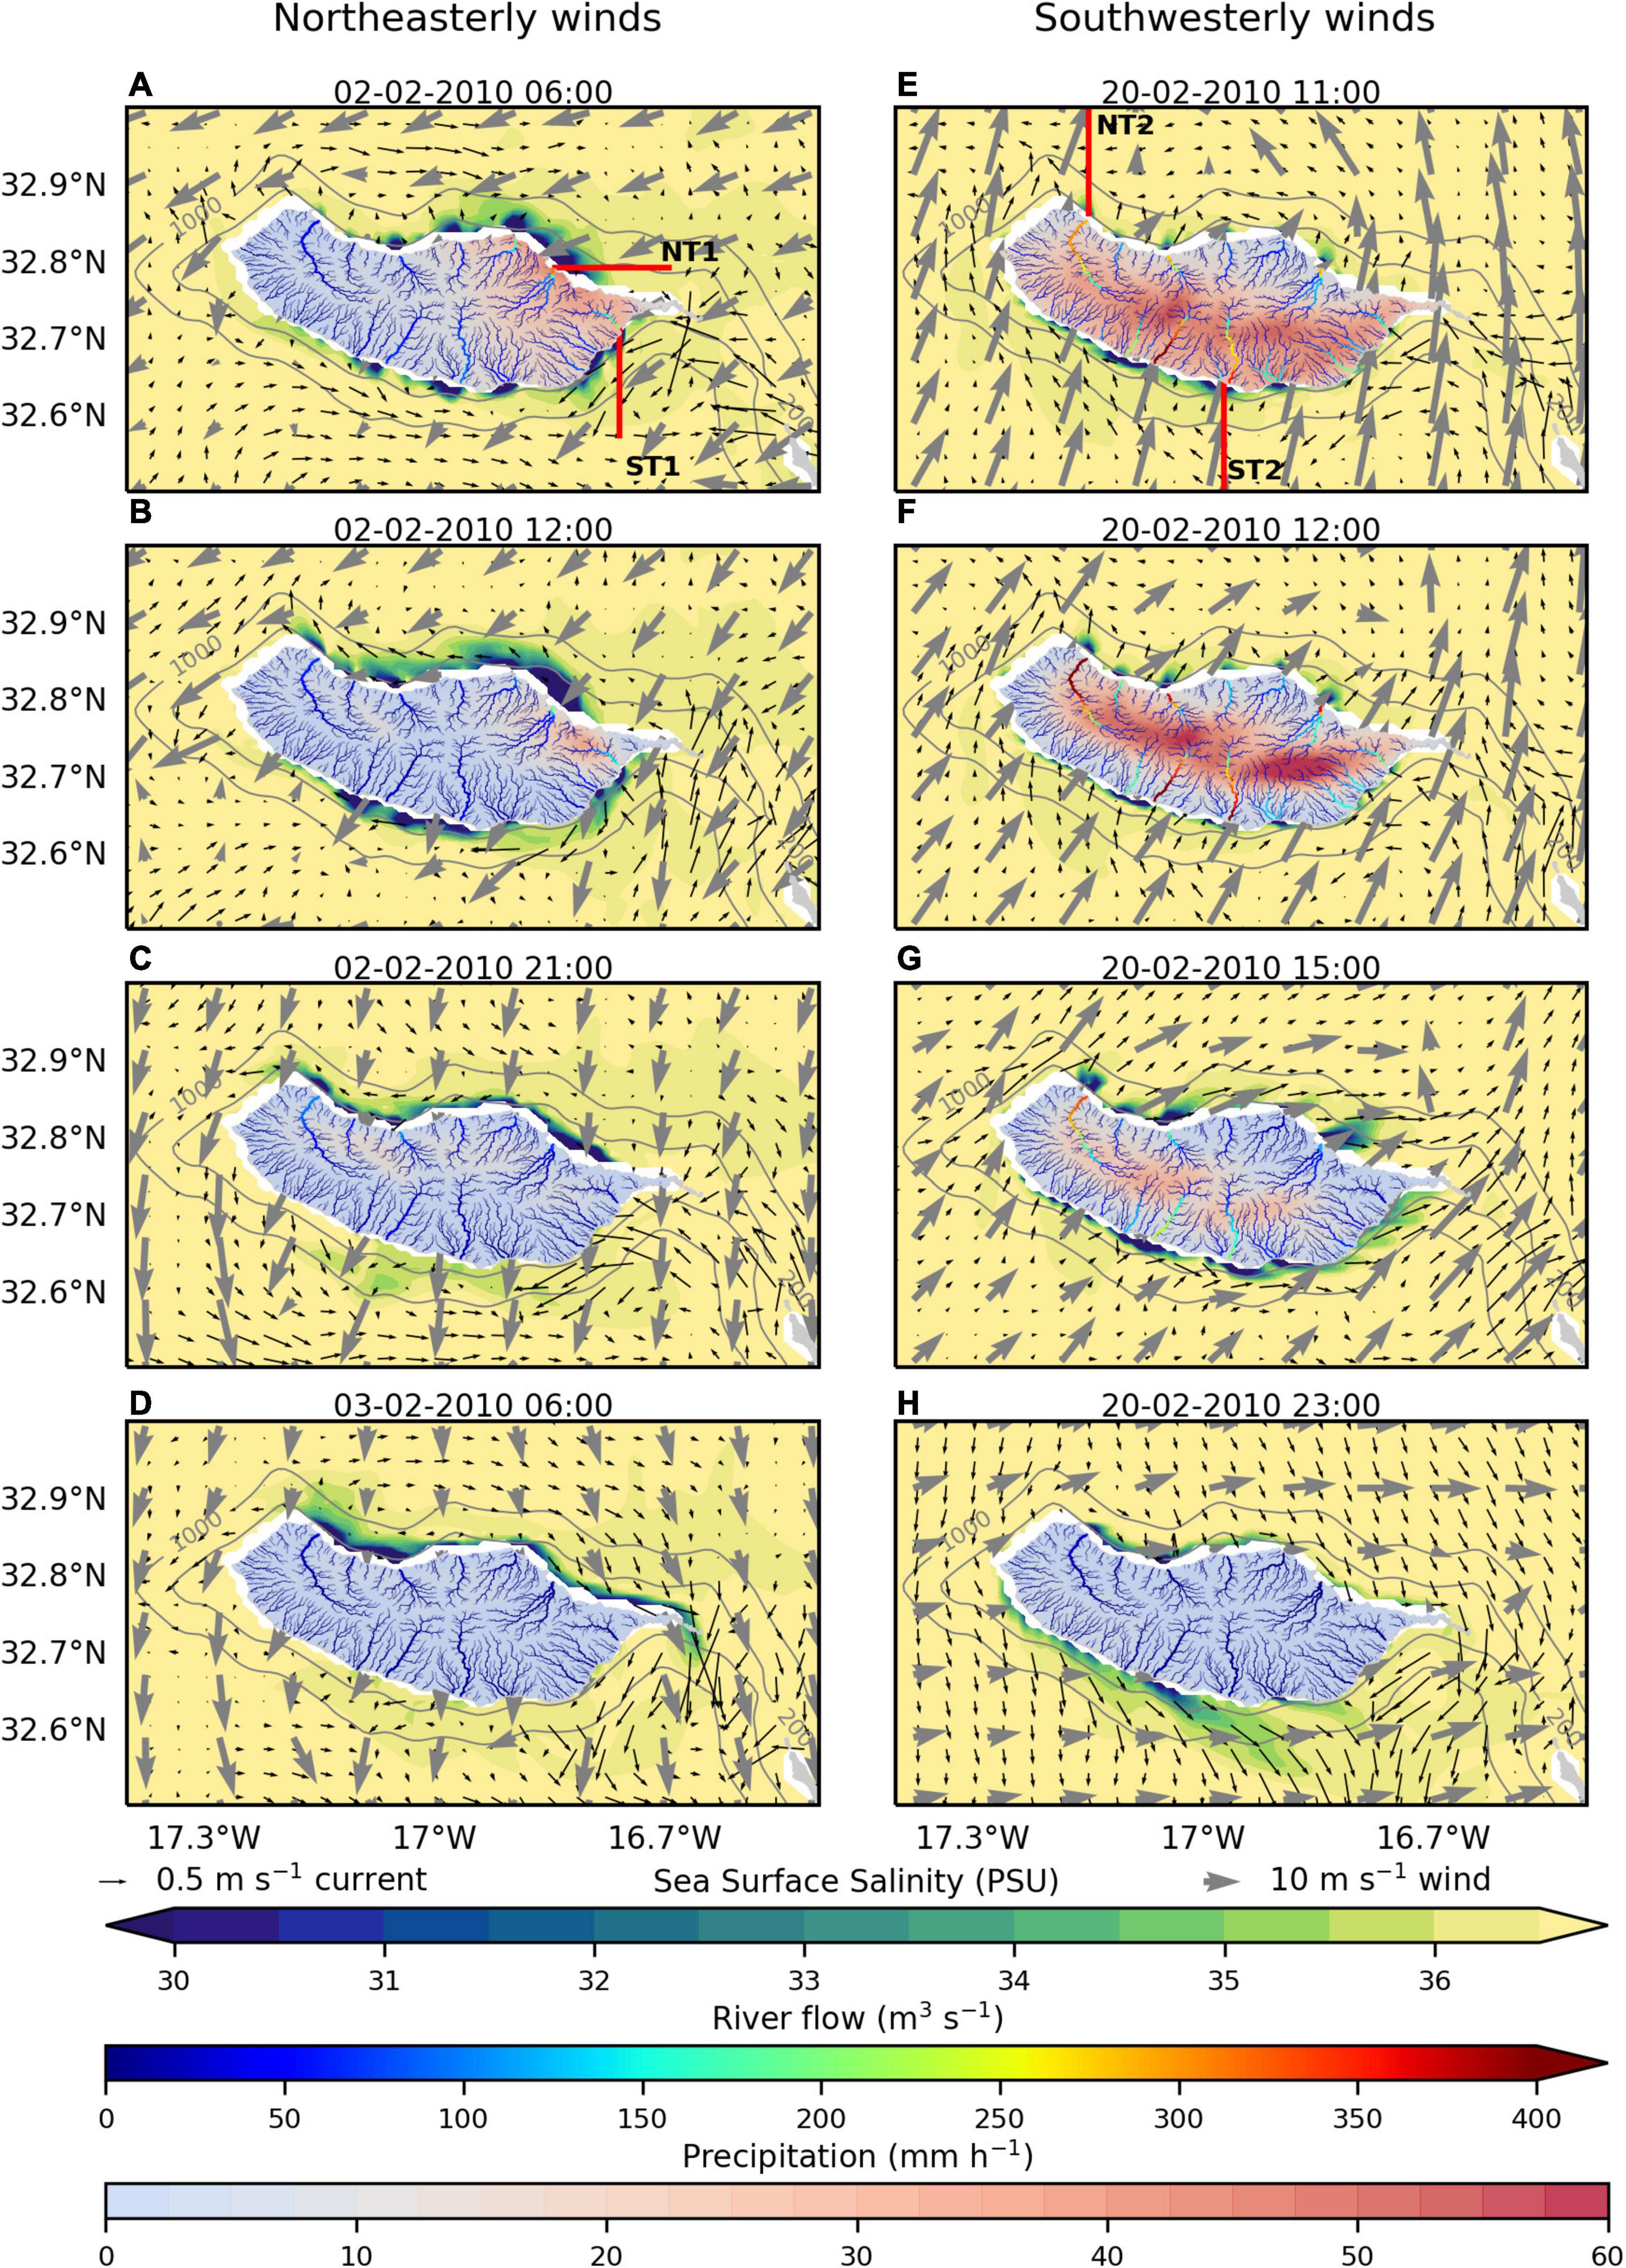
Figure 8. Snapshots of the spatial variability of Sea Surface Salinity (PSU) along with surface currents (black arrows), wind (gray arrows), precipitation (mm h–1), and river flow (m3 s–1) when (A–D) northeasterly (left panel) and (E–H) southwesterly (right panel) winds prevailed. See also Supplementary Video 1. The gray lines represent the bathymetric lines 200 and 1000 m. The red lines indicate the location of the vertical transects shown in Figure 10.
As a result of the northeastern winds converging to the eastern part of the mountainous ridge, the largest precipitation occurred over the eastern region of the island, reaching maximum values in the northeastern slopes (around 40 mm h–1; Figures 8A,B). These results are in line with Couto et al. (2012) and reinforce the fact that rainfall distribution over Madeira is strongly controlled by the intensity and direction of the prevailing winds (Gouveia-Reis et al., 2016). At this time, four main rivers oriented to the northeastern and southeastern coastal areas rapidly responded to the intense precipitation, with calculated river flow increasing from 5 to a maximum of 300 m3 s–1 (Figures 8A,B). In the northern region, the total river discharges were dominated by Ribeira de São Roque do Faial (R2) and Ribeira de São Jorge (R6), which accounted for 24 and 15%, respectively, of the total discharge in the north (Figure 9A). In the southern region, total river discharges were dominated by Ribeira de Machico (R7) and Ribeira dos Socorridos (R4), which constituted 15 and 11% of the total discharge in the south, respectively (Figure 9B). The remaining rivers had a small individual contribution to the total river flow in each region, which accounted for less than 10 and 8% of total north and south river discharge, respectively (gray lines in Figures 9A,B). However, while the minor rivers individually contribute little to total discharge in each region, cumulatively they account for approximately 61 and 74% of total north and south river discharge, respectively. The contribution small rivers make to discharge highlights the need of taking into account its cumulative contribution in the transport of land-based materials to the coastal environment in future studies, often neglected in other coastal regions (Osadchiev and Korshenko, 2017; Osadchiev and Zavialov, 2020).
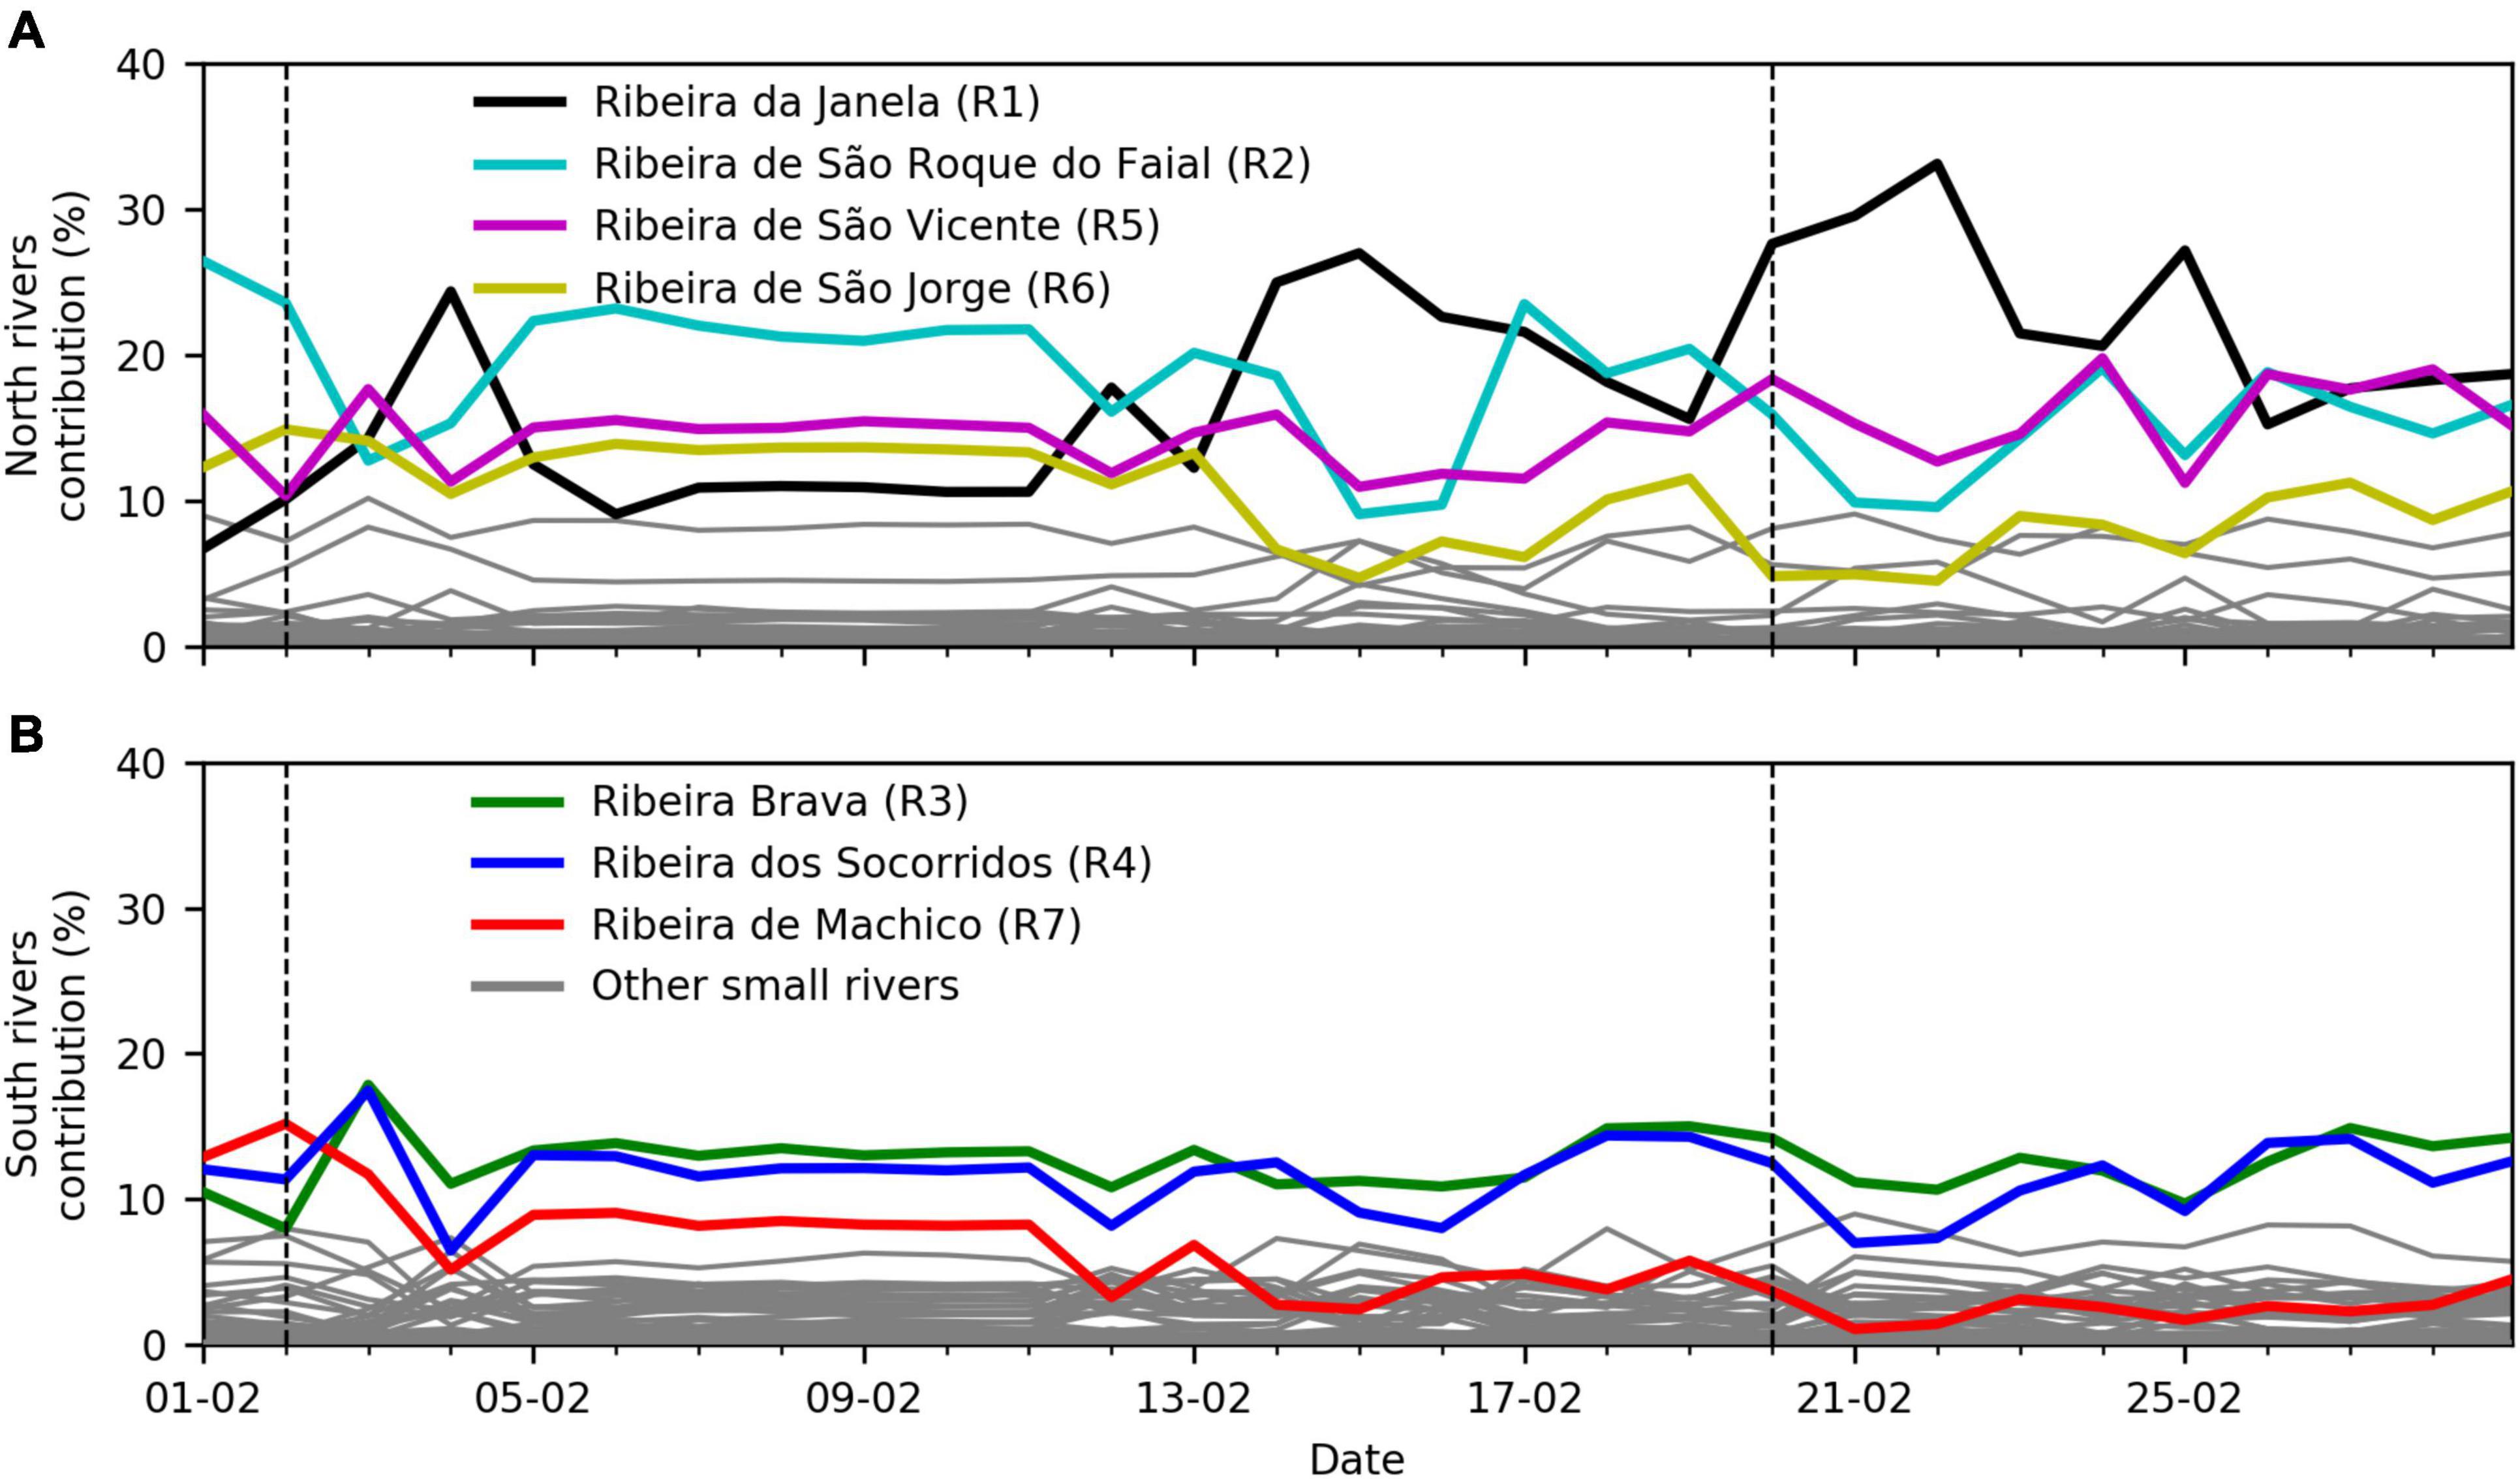
Figure 9. Daily contribution of each river (%) to (A) the northern river discharges, and (B) the southern river discharges during February 2010. The main seven rivers are identified by different colors, while the remaining small rivers are identified by gray. The black dashed lines identify the days of the flash floods events (2nd and 20th of February 2010).
Maps of modeled sea surface salinity illustrate the variability of the horizontal structure of the plumes, clearly demonstrating the impact of freshwater entering and interacting with the coastal ocean. Concurrent with maximum river flow (6:00 UTC), modeled low-salinity values near the river mouths suggests the presence of small-scale river plumes interacting with marine coastal waters (Figure 8A). As freshwater discharge from rivers continues, the individual surface plumes expand and spread offshore, almost reaching the 1,000 m isobath (Figure 8B). Collision and coalescence of the plumes is observed in the northern and southern regions (Figure 8B). The river plumes were mostly depicted by low salinity values at the inner shelf (<35 PSU between the coast and 1,000 m isobath), while offshore waters retained typical oceanic values (>36.5 PSU), inducing a strong horizontal salinity gradient and convergence zones at the plume’s front (Figure 8B). Collisions and coalescence of river plumes is a phenomenon commonly found in coastal regions characterized by the presence of several small rivers in close proximity (Warrick and Farnsworth, 2017), for example, the Russian coast in the northeastern Black Sea (Osadchiev et al., 2020). Considering that individual plumes have different shapes and sizes, the interaction between plumes strongly controls the transport of river-borne materials at the coast (Warrick and Farnsworth, 2017; Osadchiev et al., 2020). Given that our model results suggest collision and coalescence of river plumes, the detailed investigation of the interaction between individual river plumes and their role on the land-based material fluxes (including terrigenous sediments and nutrients) should be explored in future studies.
Within 24 h following maximum precipitation, the persistence of the northern and southern river plumes generated by the 2 February event differed (Figures 8C,D). On the north coast, the river plume remained evident within 24 h (see Supplementary Video 1), possibly due to the continuous river flow and corresponding onshore winds (northeastern), which confined riverine water to the coast. However, when wind direction shifted from northeasterly to northerly, riverine water started to spread toward the south coast, driven by the coastal circulation, as shown by the lower-salinity filament contouring the eastern flank of the island (Figure 8D and Supplementary Video 1). On the south coast, the river plume weakened and dispersed within 15 h after maximum precipitation (see Figures 8C,D, and Supplementary Video 1).
Vertical cross-shore transects beginning at two main river outlets (NT1 and ST1 for R2—Ribeira de São Roque do Faial and R7—Ribeira de Machico, respectively; Figure 8A) illustrate the vertical variability of these plumes (Figures 10–12). A shallow freshwater mass was trapped in the first 2 m of the water column, extending 6 km and 10 km offshore for the NT1 and ST1 transects, respectively, while salinity remained relatively constant below the buoyant plume (>36.5 PSU; Figures 10A,E). The vertical salinity gradient also implied strong stratification at the surface, as indicated by high values of Brunt–Väisälä Frequency and low-density values (<26 sigma-t kg m–3; Figures 11A,E). Brunt–Väisälä reached maximum values of 0.05 and 0.09 s–2 near the river mouths of Ribeira de São Roque do Faial (R2) and Ribeira de Machico (R7), respectively, similar to the values obtained in other stratified systems (Osadchiev, 2018; Mendes et al., 2021). Moreover, the strong vertical salinity gradient inhibited vertical mixing between the adjacent freshwater and oceanic water parcels, as suggested by Richardson Number > 0.25 (Figures 12A–F).
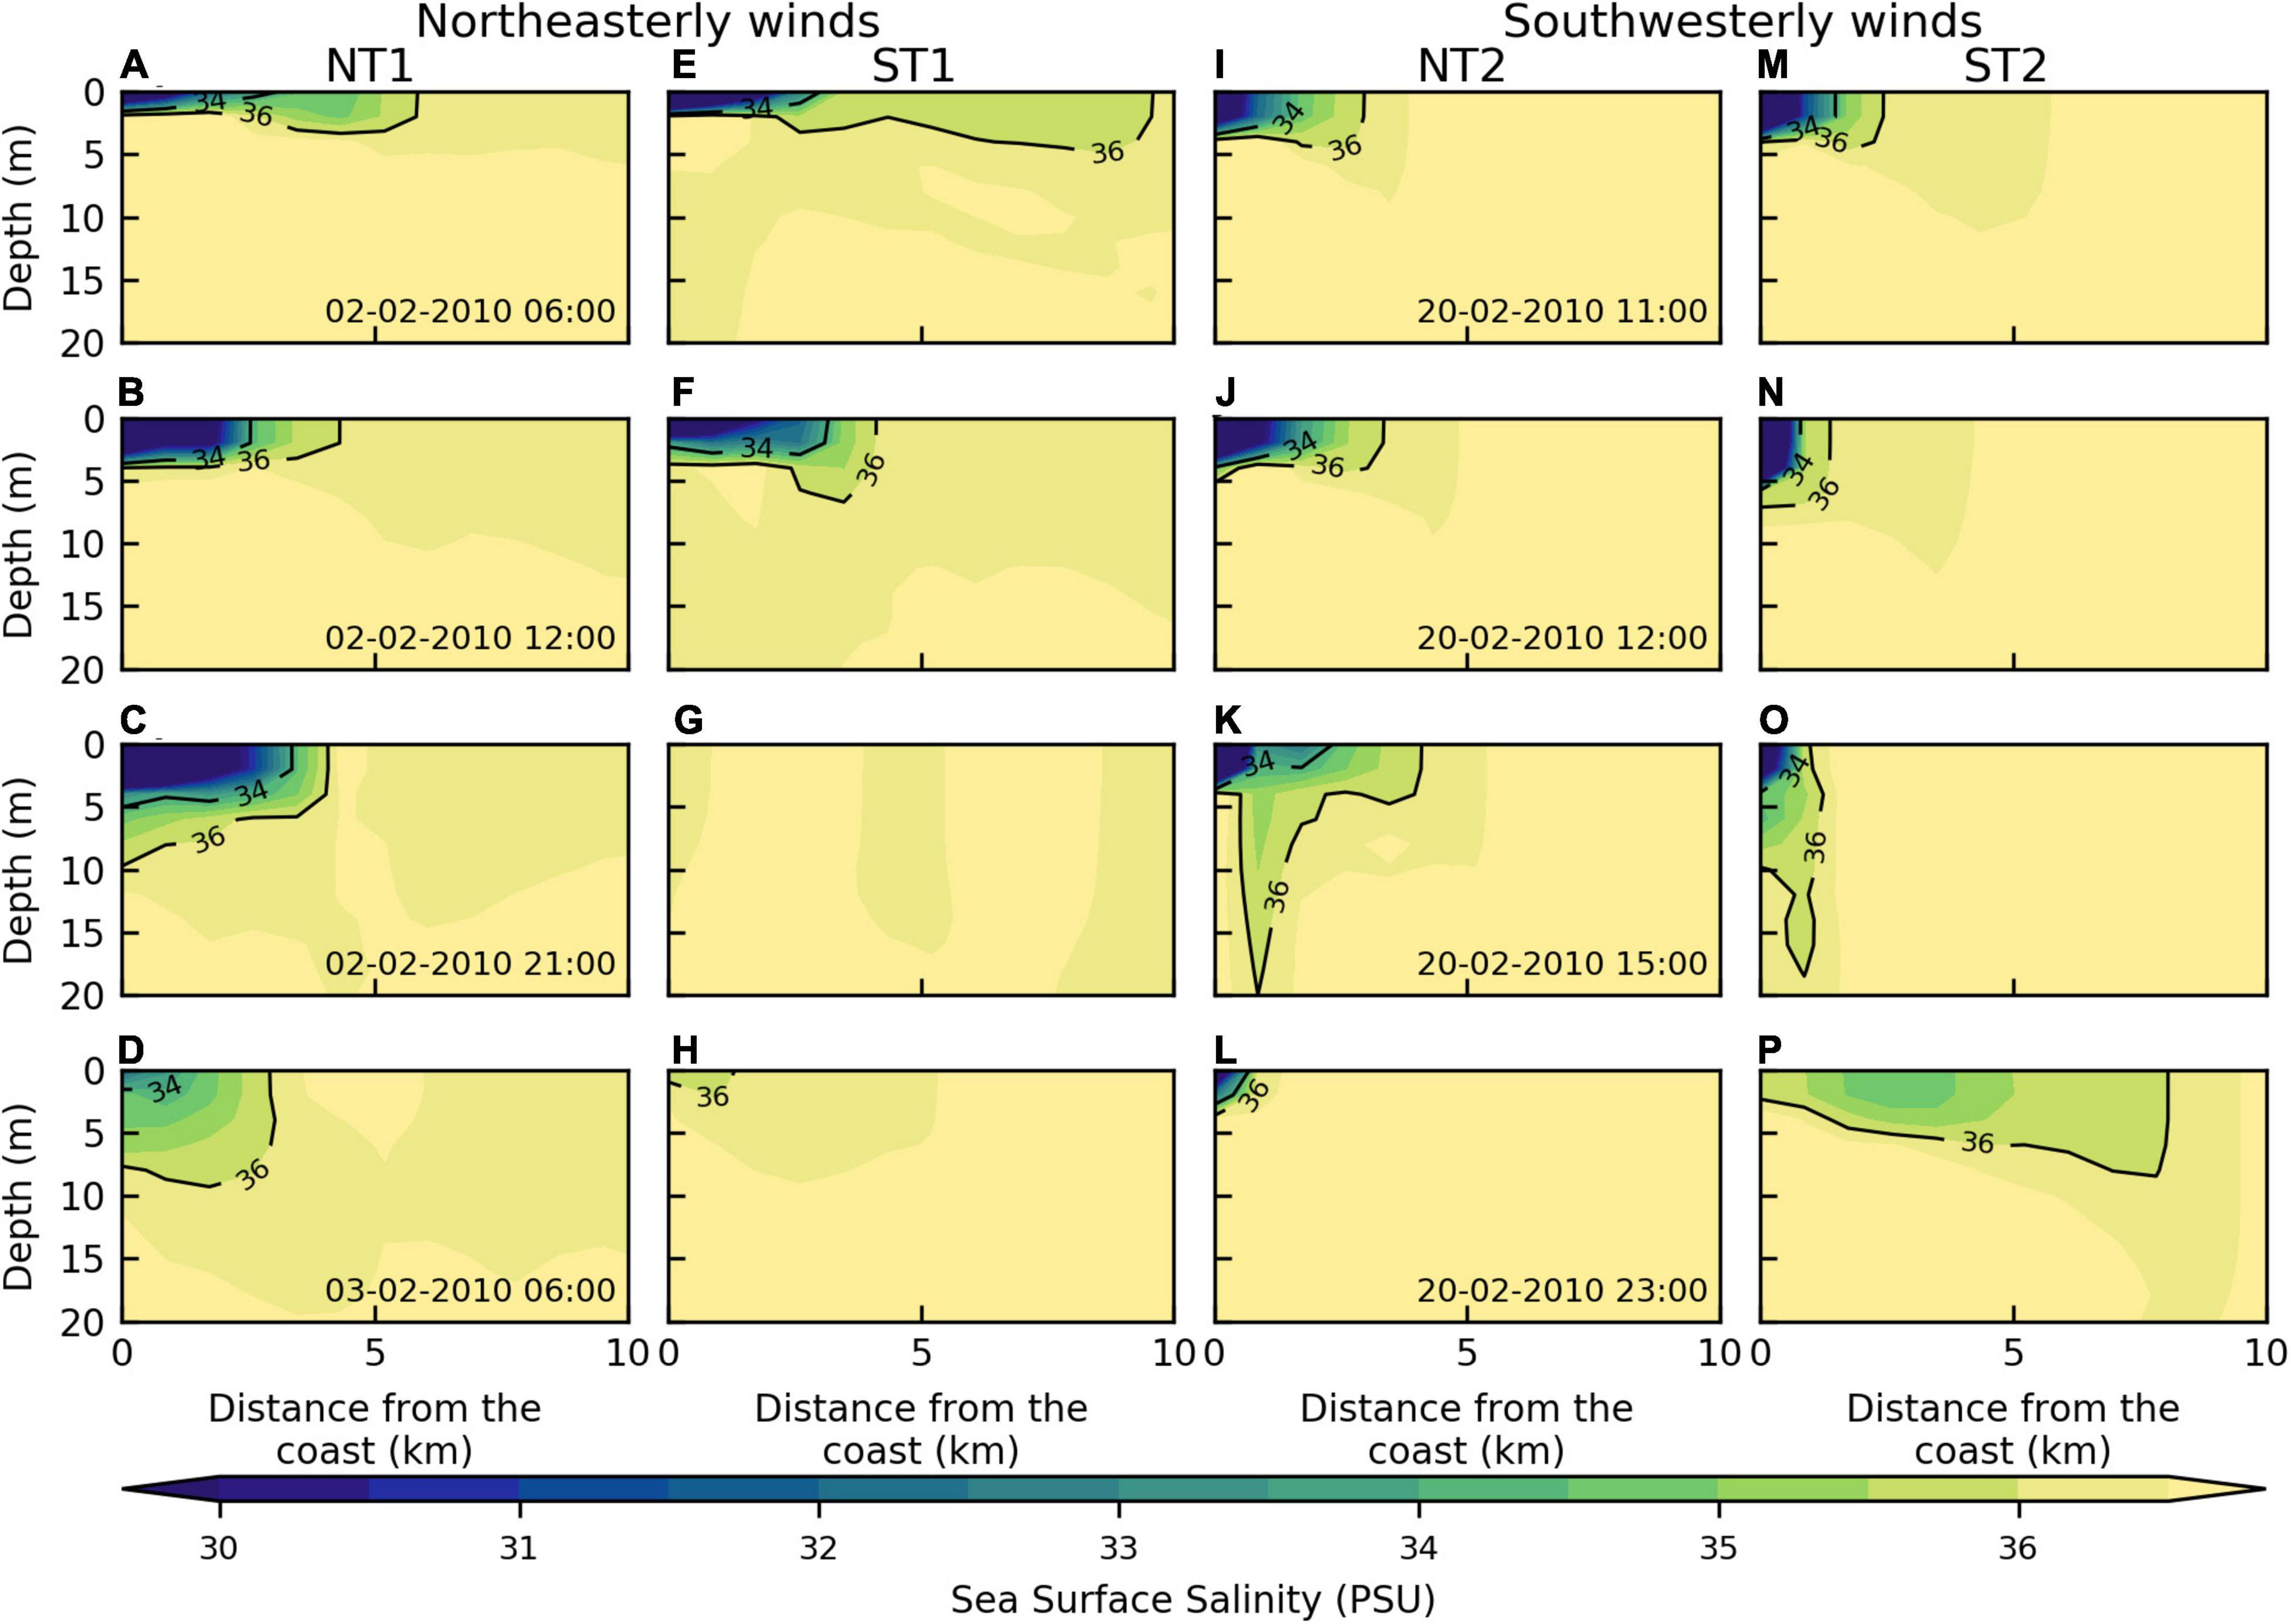
Figure 10. Snapshots (same time steps as shown in Figure 8) of vertical variability of salinity with contours in transects (A–D) NT1 and (E–H) ST1 during northeasterly winds and (I–L) NT2 and (M–P) ST2 during southwesterly winds. See Figure 8 for transect locations.
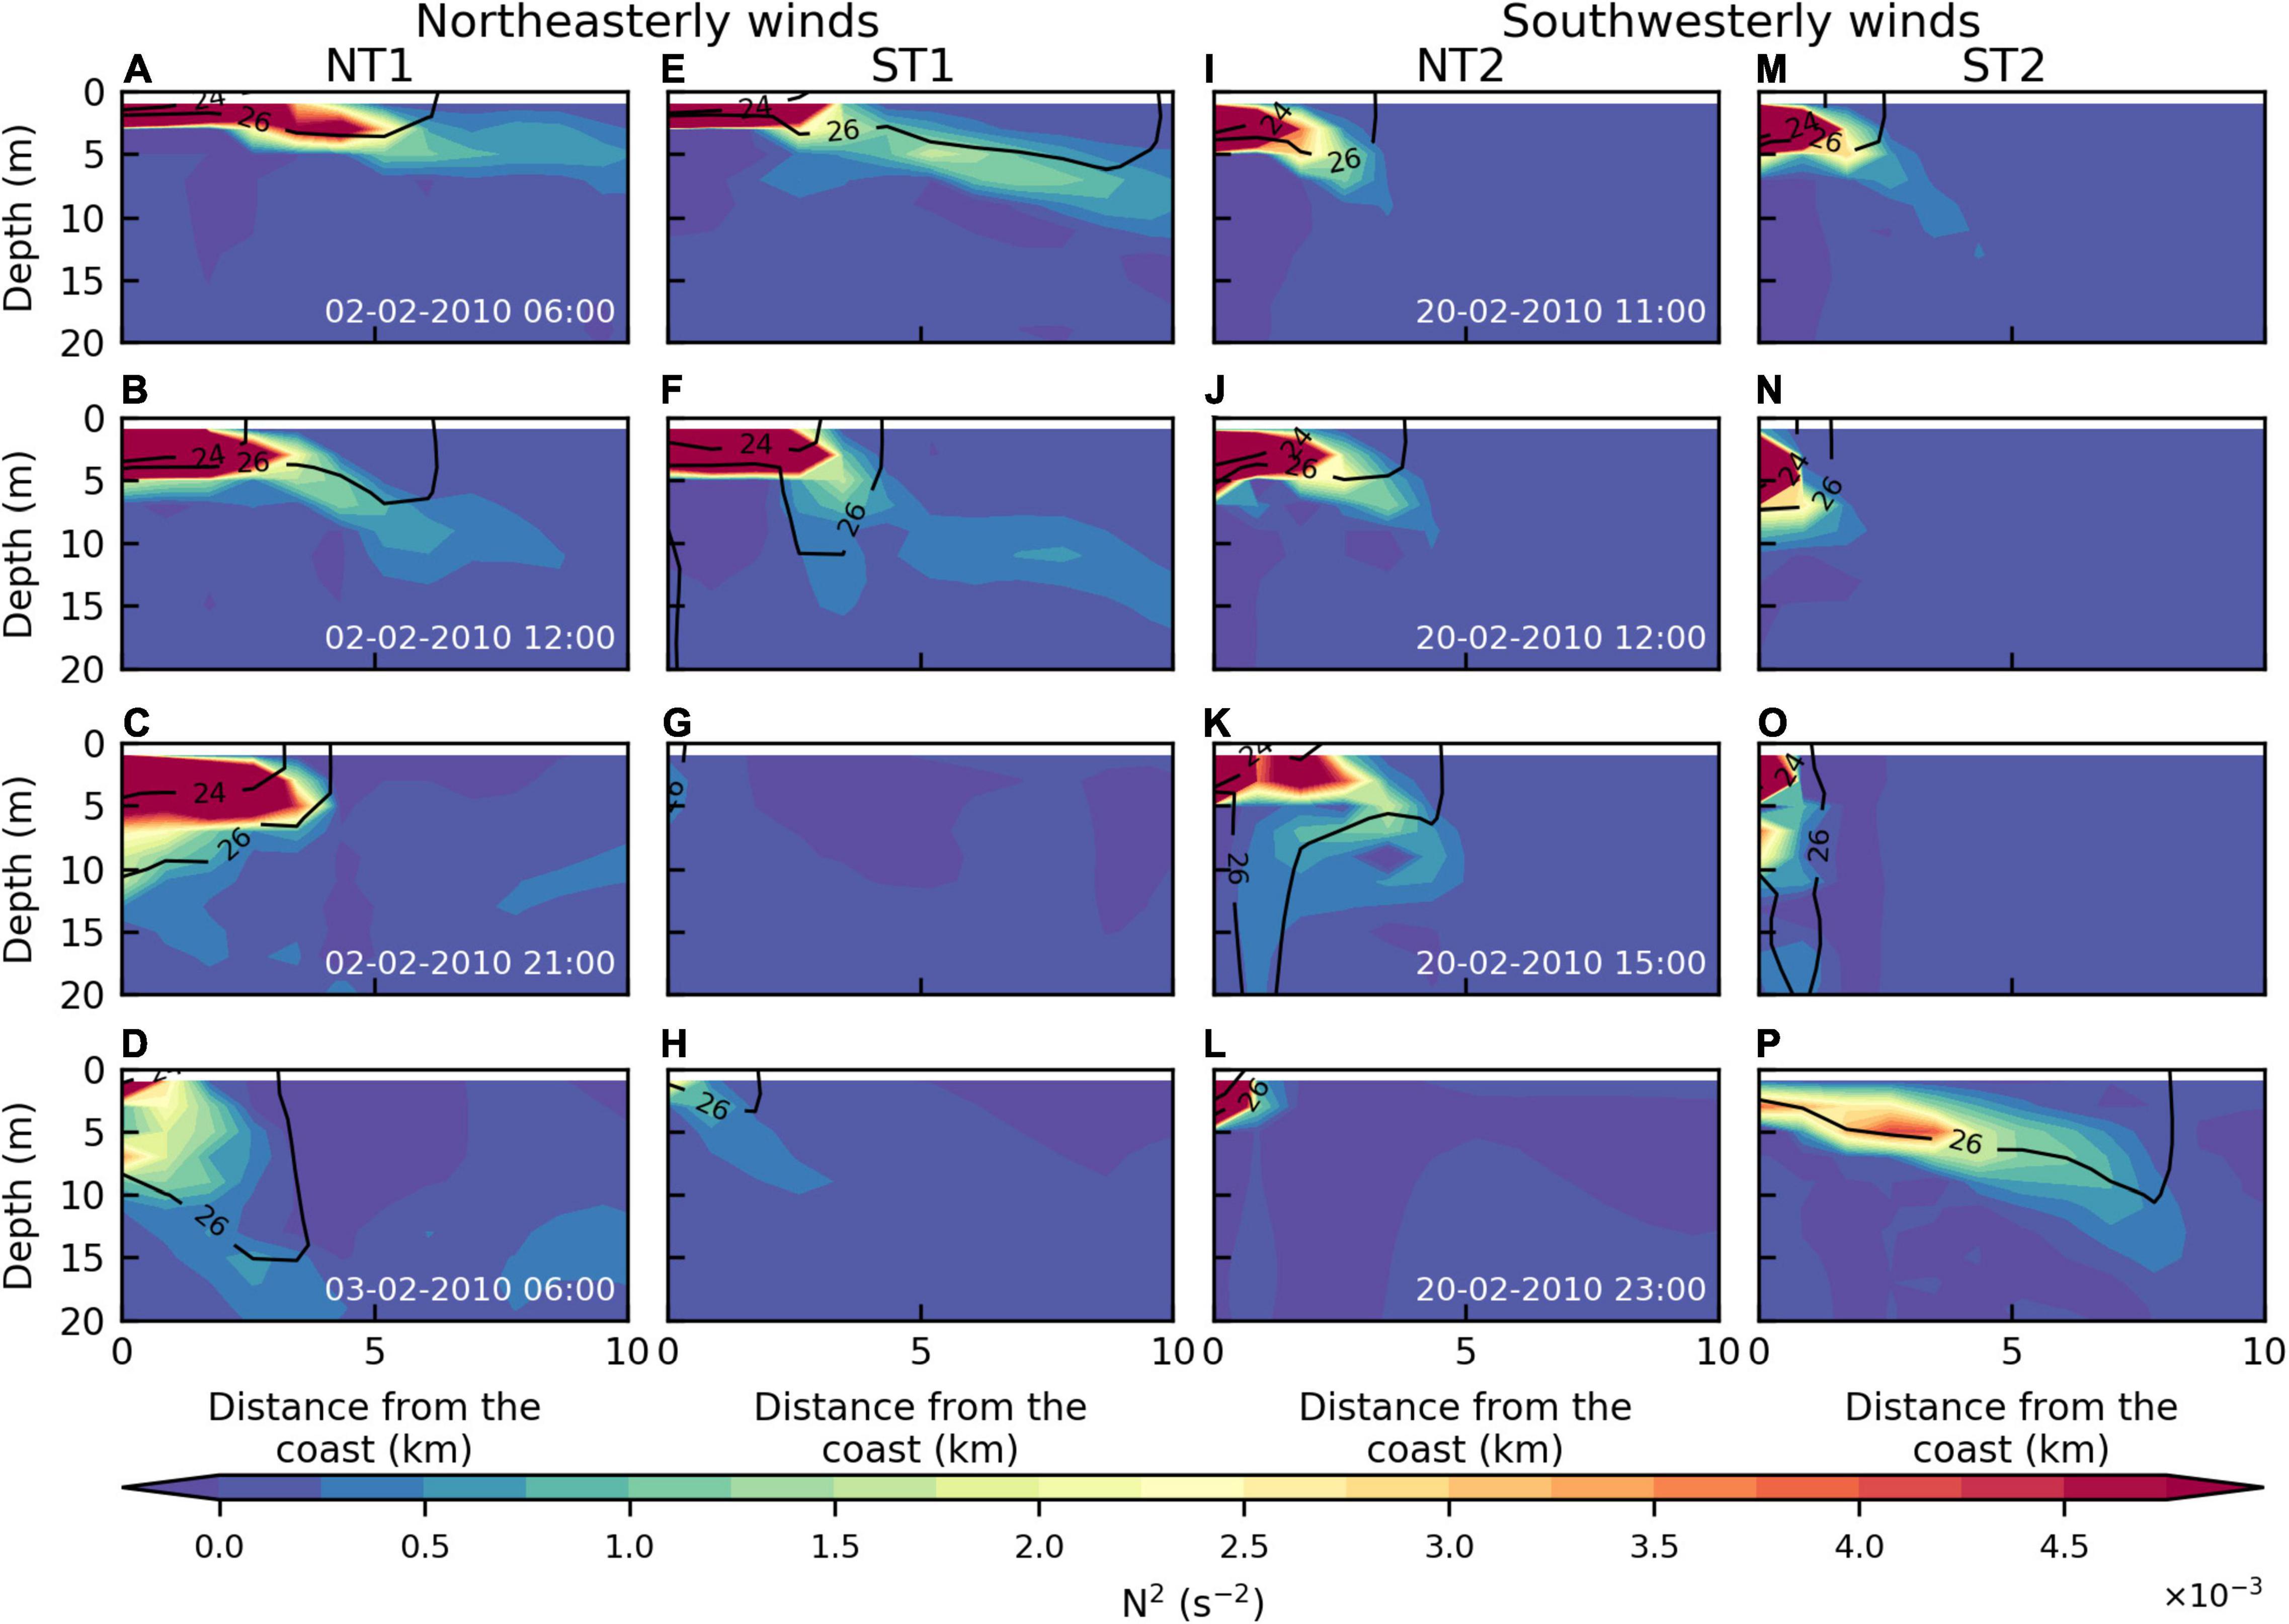
Figure 11. Vertical variability of Brunt–Väisälä Frequency (10–3 s–2) with density contours in transects (A–D) NT1 and (E–H) ST1 during northeasterly winds and (I–L) NT2 and (M–P) ST2 during southwesterly winds.
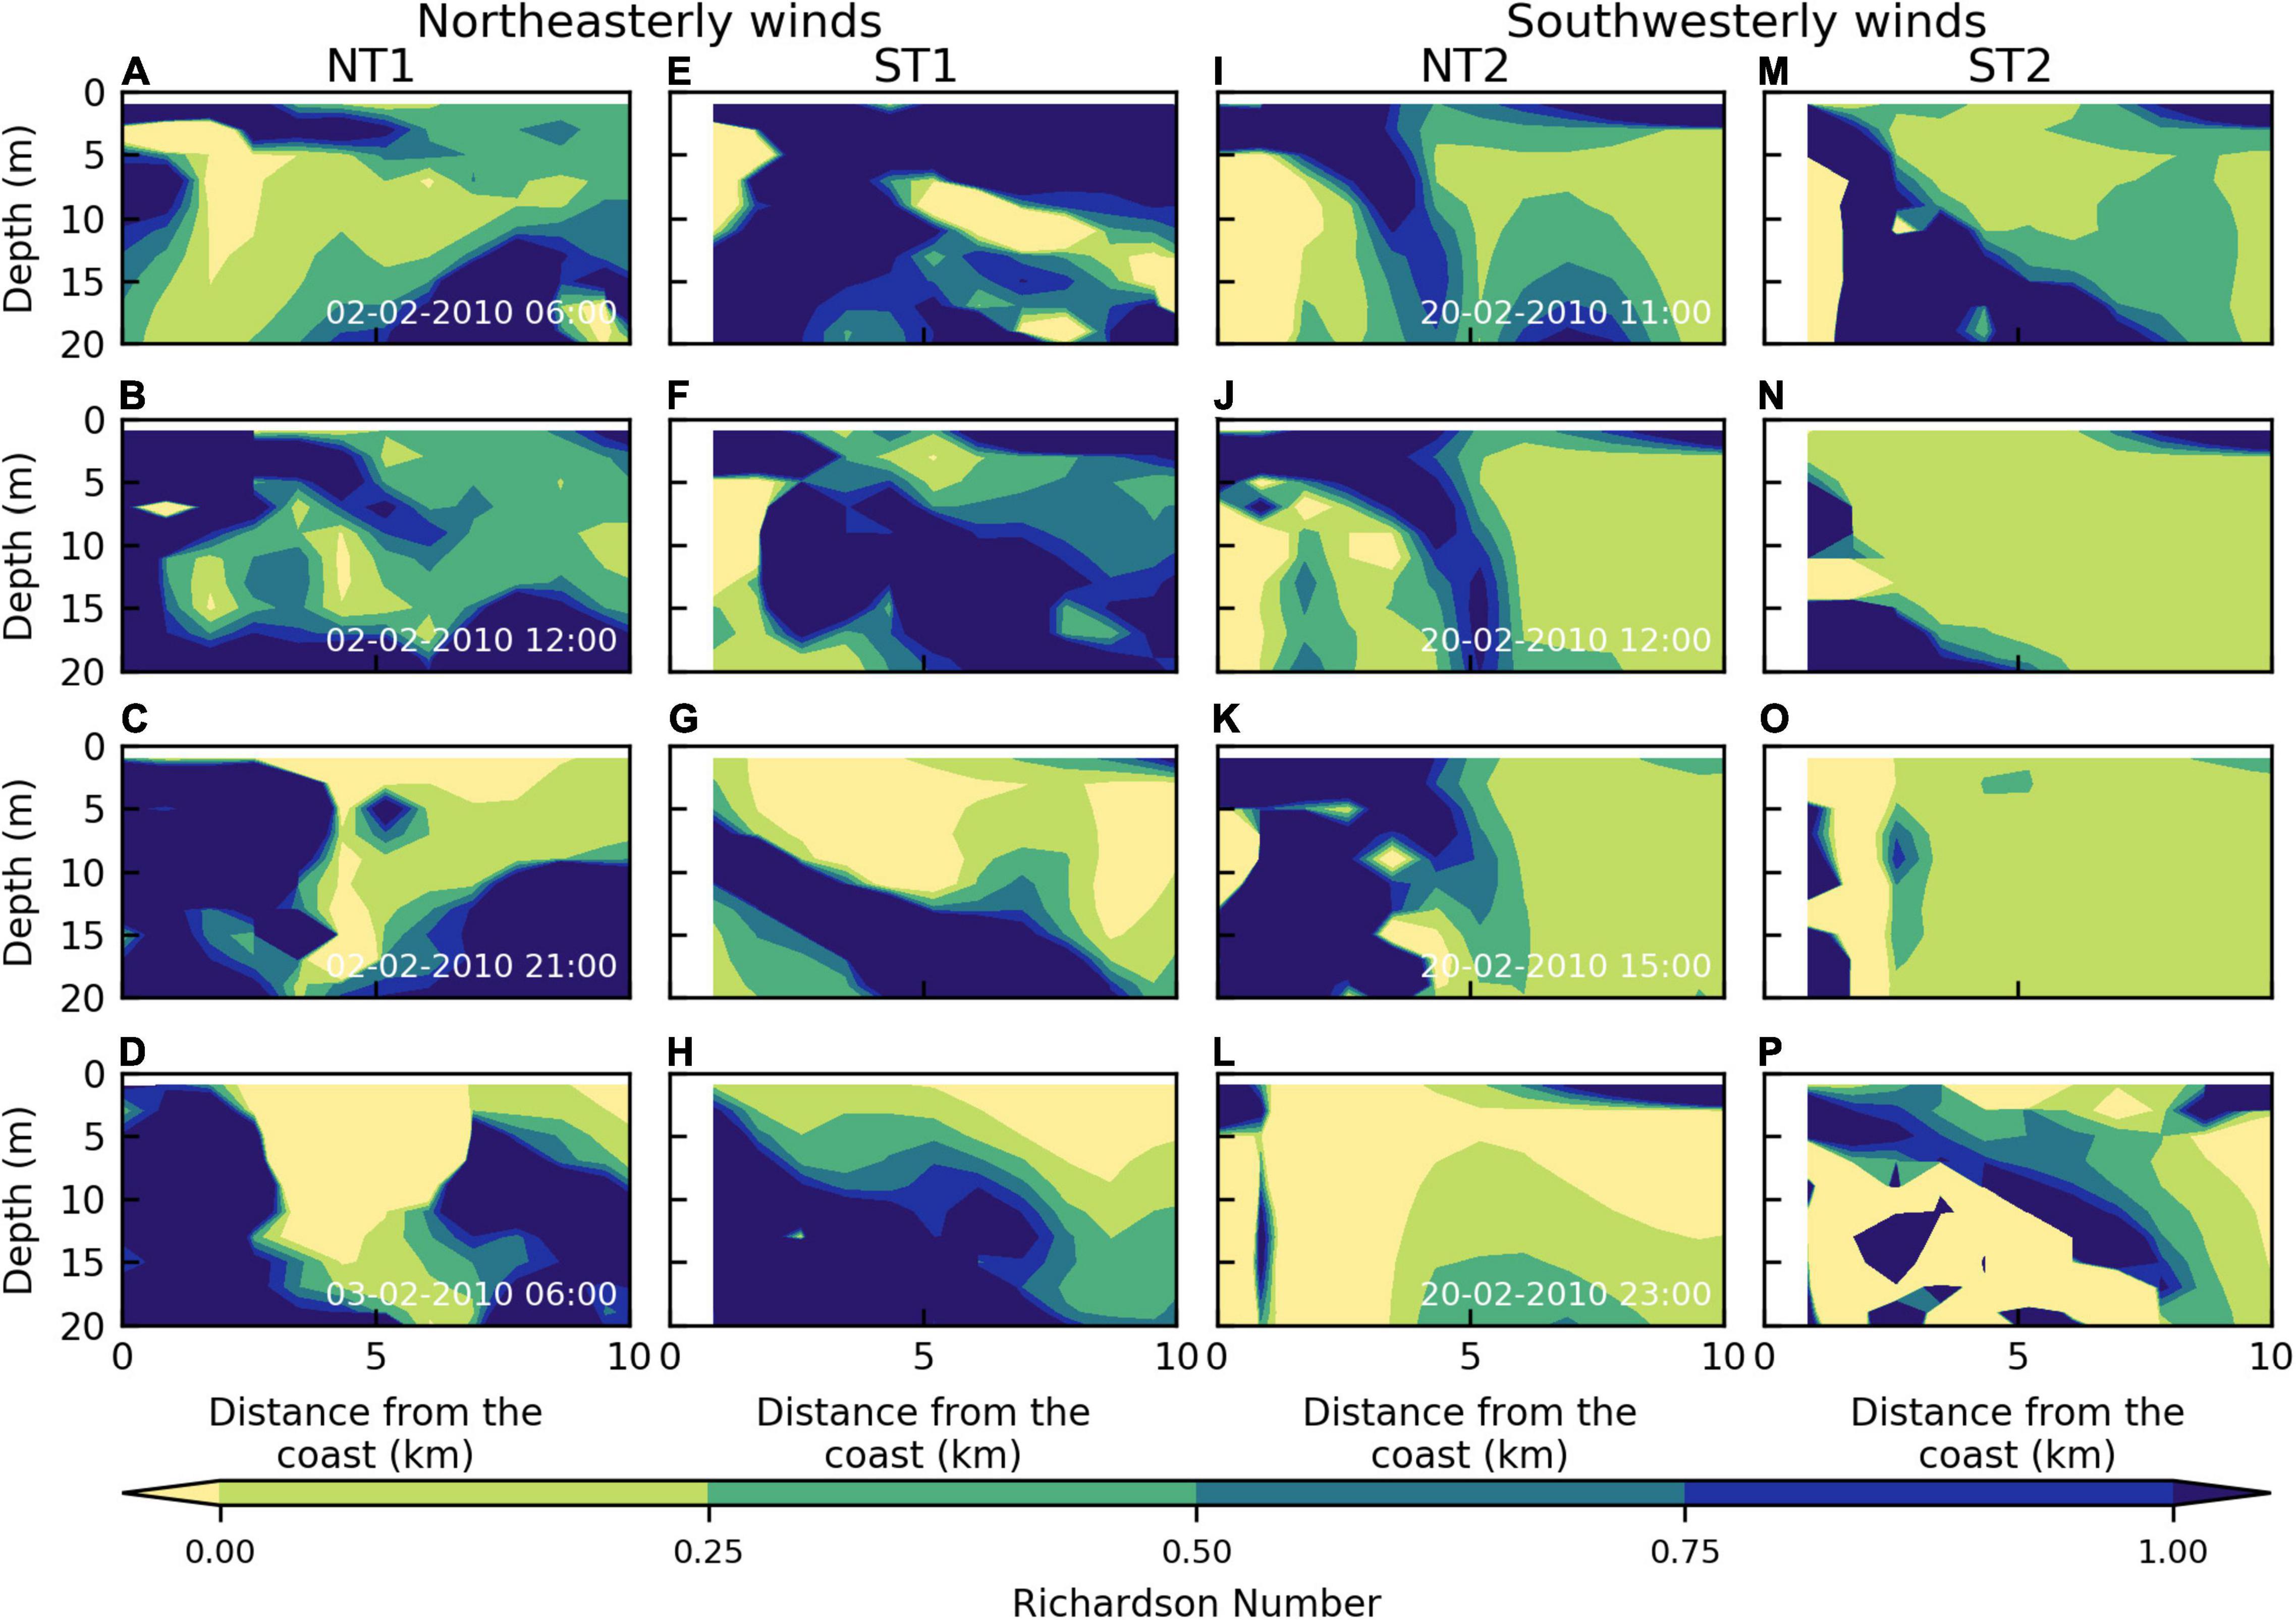
Figure 12. Vertical variability of Richardson Number in transects (A–D) NT1 and (E–H) ST1 during northeasterly winds and (I–L) NT2 and (M–P) ST2 during southwesterly winds.
The coastal confinement of the plume on the north coast is also noticeable on the vertical cross-shore transects depicting modeled salinity (Figures 10B–D) and Brunt–Väisälä Frequency (Figures 11B–D). The river plume retreats from 6 km offshore at 6:00 UTC, to 4 km offshore 6 h later at 12:00 UTC, resulting in a deepening of the freshwater signal. This behavior is likely due to the persistent runoff (∼50 m3 s–1) and northeasterly wind regime, which contained the freshwater discharge within a confined region near the coast (Figure 8C). The effect of wind on plume confinement is also evident from vertical cross-shore transects depicting modeled zonal-current component (u), in which a negative current (westward) was predicted within the upper 10 m of the water column, while a positive current (eastward) was predicted below 10 m depth, at NT1 (see Supplementary Figures 4A,B). The confinement of freshwater at the coast together with strong stratification modified the coastal circulation and prevented the transport of river-borne material to offshore waters. This is evident from daily averaged satellite images of SPM, showing the retention of suspended matter at the coast up to 3 days after the flash flood (Figures 2A–C). We believe that this retention zone is characterized by a stable water column (Figures 11B–D), with the continuous input of nutrients from river discharges and the decrease in wind intensity (Figure 7A and Supplementary Video 1) and thus mixing (Figures 12B–D) favored phytoplankton growth, as evidenced by the high concentrations of Chla in the northeastern coastal waters observed 2 days after the flash flood (Figure 2F). It is suspected that this pattern occurs frequently. The prevailing northeast trade winds often lead to higher rainfall in the north (Caldeira et al., 2002; Prada et al., 2009), and subsequent higher river discharge and erosion, evidenced by the concave morphology of the northern coast compared with the convex morphology seen on the southern coast (Figure 3C; Rodrigues et al., 2006; Baioni, 2011), where rainfall is lower. Four of the main drainage basins are in the north (Figure 3C and Table 1), inducing the transport of large amounts of terrigenous material to the coastal environment during discharge events, which partially explains the brown and turbid appearance of the sea surface on the north side of the island (Figures 2A–C). This may also explain the high Chla concentrations often detected near the northern coast (Caldeira et al., 2002), however, more in situ observations are required to confirm such speculations.
On the southern side of Madeira Island, river discharges were weak (∼20 m3 s–1), while tidal induced currents over the ridge that connects Madeira and Desertas Islands were relatively high (>0.5 m s–1; Figures 8C,D and Supplementary Figures 4G,H). From an oceanographic perspective, this region is dynamic, with the recurrent generation of internal waves (Reis et al., in preparation) and upwelling episodes, as detected by cold and Chla-rich water masses in satellite-derived datasets (Caldeira et al., 2002) and in situ measurements (Caldeira et al., 2014). Such strong currents promoted a strong vertical shear, which reduced the Richardson Number to values < 0.25 (Figures 12G,H) and contributed to the destratification of the water column (Figures 10G,H, 11G,H). These oceanographic processes may have contributed to the offshore spreading of river-borne materials (Figures 2A–C,E).
February 20th, 2010—Southwesterly Winds
Surface maps for the 20th of February 2010 flash flood event are presented in Figures 8E–H. Similar to the previous episode, the intense southwesterly winds (∼ 20 m s–1) created two tip-jets at the island flanks and a downslope flow, as indicated by high speeds and changeable direction on the northeastern side (Figures 8E–G). Such a wind regime agrees with Couto et al. (2012) and Teixeira et al. (2014). Southwesterly winds prevailed until 18:00 UTC (Supplementary Video 1), after which winds weakened and veered to the east, blowing parallel to the coast (Figure 8H).
On the 20th of February, extreme and persistent rainfall (>10 mm h–1 during 5–10 h) fell mostly over Madeira (Fragoso et al., 2012), but according to Couto et al. (2012), there could also be precipitation over the ocean south of the island. Our model results show that such rainfall started at ∼6:00 UTC (Supplementary Video 1) and intensified at 11:00 UTC (∼50 mm h–1), affecting mainly the leeward (southern) side of the island, particularly Funchal and Ribeira Brava (Figure 8E). At 12:00 UTC, modeled rainfall reached maximum values in high-altitude regions (∼60 mm h–1), in agreement with previous studies (Luna et al., 2011; Couto et al., 2012; Fragoso et al., 2012; Levizzani et al., 2013).
The discharge rates drastically increased during the period of maximum rainfall (11:00–12:00 UTC), reaching more than 400 m3 s–1 (Figures 8E,F and Supplementary Video 1). Such a high discharge rate, together with the high amount of solid material moved by the torrential flow, contributed to the flooding of the surrounding areas (Lira et al., 2013; Nguyen et al., 2013; Lopes et al., 2020). This was the case for Ribeira Brava (R3) and Ribeira dos Socorridos (R4), which constituted 14 and 12% of the total river discharges in the southern region during that day (Figure 9B). In the northern region, the total river discharges were dominated by Ribeira da Janela (R1) and Ribeira de São Vicente (R5), which accounted for 28 and 18% of total river discharges, respectively (Figure 9A). The extreme precipitation and associated surface runoff caused landslides in the upstream sections of the rivers (Oliveira et al., 2011; Lira et al., 2013; Nguyen et al., 2013; Lopes et al., 2020), leading to severe erosion of the drainage basins and river channels. It was estimated that a sediment volume of 2.2–3.4 × 10⁵ m3 and 6.1–9.8 × 10⁵ m3 was eroded during this event in the Funchal drainage basins (corresponding to Ribeira de São João, Ribeira de Santa Luzia and Ribeira de João Gomes) and Ribeira Brava drainage basins, respectively (Lira et al., 2013). Part of the resulting terrigenous sediments and solid material were deposited in the downstream (urbanized) areas of Funchal and Ribeira Brava, causing severe damage to the local infrastructure (see Figures in Fragoso et al., 2012; Levizzani et al., 2013; Lira et al., 2013; Nguyen et al., 2013; Lourenço and Rodrigues, 2016). Nevertheless, high volumes of freshwater and land-based solid material were discharged to southern coastal waters (Lourenço and Rodrigues, 2016), resulting in the formation of a brown-colored freshwater plume significantly large and visible from space 3 days after the event (see Figure 12 in Oliveira et al., 2011).
The dynamics of these river plumes are shown in the maps of modeled sea surface salinity (Figures 8E–H). During the early stages of the event, collisions and coalescence of the nearby river plumes resulted in the formation of a thin surface layer with low salinity values (<35 PSU) spreading along the southern coast, while small, localized plumes are also depicted on the northern coast (Figure 8E). The combination of rapid river flow and persistent southwesterly winds seem to cause the offshore spreading of the northern plumes (going over the 200 m isobath), whereas the southern plumes remained confined to the coast (Figure 8F). A general eastward transport of the plumes was observed 3 h later, particularly for the northern plumes, most likely induced by the wind-driven coastal circulation (Figure 8G). When wind veered from the southwest to the west, an intensification of the southward flowing surface ocean currents on the southern side of the island (from ∼ 0.2 to 0.5 m s–1) resulted in the rapid dispersion of the plume (Figure 8H and Supplementary Video 1). Collisions and coalescence of the plumes were predicted in northern coastal waters, which resulted in the formation of a thin freshwater surface layer along the coast (Figures 8H, 10L). Thus, winds from the west seem to spread the southern river plumes offshore, while the northern river plumes remain confined against the coast. Satellite images of SPM showed very similar responses of the river plumes, verifying the ability of the present numerical framework configuration to represent the plume dynamics (Figure 2D).
Vertical cross-shore transects beginning at the river outlets of Ribeira da Janela (R1) and Ribeira dos Socorridos (R4; NT2 and ST2 marked in Figure 8E, respectively) further demonstrate the impact of the southwesterly winds on the spreading and mixing of the river plumes (Figures 10–12). Similar, to the northeasterly flash flood episode, modeled vertical cross-sections of salinity showed a shallow freshwater lense trapped in the first 4 m of the water column, extending 3 km offshore from the river mouth, overlying high salinity water (>36.5 PSU; Figures 10I,M for NT2 and ST2, respectively). Such a shallow river plume is likely associated with the steep topography of the island (Figure 3C) and the torrential rains, which cause abrupt discharges at the coast (Figure 7B). Shallow river plumes were also found in the steep coastal region of Russia, in which the rapid river discharges formed a hydraulic jump, resulting in the generation of internal waves (Osadchiev, 2018). Considering the similarities between small rivers in Madeira and Russia, internal waves may also be generated during torrential rainfall episodes in Madeira. At 11:00 UTC, the vertical gradient of salinity and density induced strong water column stratification, as confirmed by high values of Brunt–Väisälä (Figures 11I,M), reaching maximum values of 0.06 s–2 near the river mouths of Ribeira da Janela (R1) and Ribeira dos Socorridos (R4). At this time, vertical shear was not sufficiently strong to induce turbulent mixing between the river plume and the oceanic waters, as indicated by Richardson Number > 0.25 near the river mouth (Figures 12I,M). Offshore waters were characterized by Richardson Number < 0.25, suggesting strong vertical mixing (Figures 12I,M), and constant values for salinity (Figures 10I,M) and Brunt–Väisälä Frequency (Figures 11I,M). The confinement of the southern river plumes against the coast is depicted in the vertical transects of salinity (Figures 10M–O) and Brunt–Väisälä Frequency (Figures 11M–O), where a retraction from 3 to 1 km away from the river outlet and a deepening of the plume to 20 m depth was observed. Such confinement is likely associated with the opposing wind flow (Figures 8E–G), acting to restrict offshore spreading of the plume (Zhao et al., 2018). During this same period, the northern river plumes tended to spread offshore (Figures 8E–G), likely facilitated by the offshore winds moving in the same direction as the plume front on the northern side of the island (Zhao et al., 2018). A similar wind-induced confinement/dispersion of the river plume in the north/south coast was observed on the 2nd of February (characterized by northeasterly winds), further highlighting the importance of the wind on the horizontal dispersion of the river plumes. Not with standing, one should note that the turbulent scheme used may favor the vertical mixing of the river plume (i.e., overmix; Li et al., 2005; Robertson and Dong, 2019) and thus weakening the horizontal dispersion of the northern (2nd of February; Figures 12B–D) and southern river plume (20th of February; Figures 12N,O). The shift in wind direction from southwest to the west (between 15:00 UTC and 23:00 UTC 20 February 2010; Figures 8G,H) impacted the dynamics of the modeled northern and southern river plumes. Under westerly winds, the horizontal extent of the northern river plume was limited by the strong landward (northerly) wind-driven currents (Figure 8H), pressing the plume against the northern coast (Figures 10K,L). Off the southern coast of Madeira, westerly winds and subsequently southward surface currents, caused modeled river plumes to spread farther offshore, extending ∼ 8 km from river outlets (Figures 10P, 11P, 12P). It is important to note that the dominant chemical weathering of basalt occurring in Madeira Island produces several types of soils (Supplementary Figure 1) rich in organic matter, nutrients (e.g., silicate), and trace metals (e.g., magnesium and iron; Van Der Weijden and Pacheco, 2003). Considering that all these elements regulate phytoplankton growth (Barcelos e Ramos et al., 2017), we believe that this buoyant river plume transported high amounts of land-based material and nutrients offshore (Figure 2D), which combined with the concurrent decrease in wind speed (Figure 7A and Supplementary Video 1) enhanced phytoplankton growth. This combination of processes is likely responsible for Chla-rich filament detected in satellite observations, which extended 70 km offshore 3 days after the 20 February 2010 flash flood event (Figure 2H). Given that salinity has a chemically conservative character, it is often used as a tracer of a conservative mixing between freshwater and seawater. For conservative nutrients, salinity can be used as a proxy to indicate the mixing processes affecting nutrient distribution (Liss, 1976). In dynamic environments, such as the ocean, many physical and biogeochemical processes including coastal upwelling, biological processes (e.g., nutrient uptake), remineralization, desorption, and adsorption of nutrients on settling particles (e.g., Carstensen et al., 2020; Jiang et al., 2021) cause relationships between salinity and nutrient concentrations to deviate from conservative behavior. Therefore, the use of salinity as a proxy for land-based nutrient inputs may not fully reflect nutrient distributions. As such, we believe that the coupling of a biogeochemical model to investigate the implications of flood episodes on nutrient cycling should be considered in follow up studies.
Conclusion
This study investigated the impact of February 2010 flash floods on the coastal waters around Madeira Island, focusing on the processes driving the dynamics of the river plumes, responsible for favoring the maximum monthly-averaged Chla concentrations around the island over the last two decades (Figure 1B).
Based on coupled air-sea-land numerical simulations, our results demonstrate that the wind is the main mechanism controlling river plume dynamics and subsequent impact on the coastal waters. Onshore winds confined the plumes against the coast on both sides of the island. In particular, on 2 February 2010, onshore winds (northeasterly) confined the northern plumes (Figures 8A–C), which resulted in strong horizontal and vertical density gradients (Figures 10A–C, 11A–C). Such confinement prevented the offshore transport of river-borne material (Figures 2A–C), favoring phytoplankton growth in inshore waters, as suggested by high concentrations of sea surface Chlorophyll-a in the northeastern region (Figure 2F). Considering the predominance of the impinging northeasterly winds, we believe that this retention zone is likely responsible for frequent localized eutrophication patches in the northeastern region of the island (Caldeira et al., 2002). On 20 February 2010 (the catastrophic flash flood event), onshore winds (southwesterly) caused confinement of the river plume characterized by a strong vertical density gradient in coastal waters on the south side of Madeira Island (Figures 10M–O, 11M–O). Offshore winds (southwesterly) caused plumes to spread offshore, as suggested by the eastward drift of the plumes in coastal waters on the north side of the island (Figures 8E–G). Cross-shore winds (westerly) pressed the northern plumes against the coast, leading to the coalescence and collisions of the plumes, and to the formation of a thin freshwater lenses that spread along the coast (Figure 8H). However, the spreading of the buoyant river plume offshore was observed in the southern region (Figure 8H), forming a high Chlorophyll-a patch protruding 70 km away from the island (Figure 2H). The persistence of plumes was governed by the duration of rainfall, river discharges, and strong onshore winds, while offshore winds and strong tidal currents generated over the underwater ridge that connects Madeira to Desertas Islands facilitated the dispersion of the plume (Figures 2, 8).
Overall, our numerical study suggests that the island’s surface runoff associated with high rainfall events may indeed enhance the primary productivity of the coastal waters surrounding Madeira Island, as shown by the low salinity river plumes serving as a proxy for the land-based nutrient input on the two distinct precipitation events. The latter suggests that IME episodes related to land runoff can occur frequently. The finding of this study reinforces the important role of small mountainous rivers in the delivery of river-borne material to the coastal ocean, particularly during flash floods episodes, and subsequent on phytoplankton growth. In this sense, we deem this episode as the “Land Mass Effect.”
Besides the strong likelihood that high runoff events make an important contribution to the primary productivity in Madeira’s coastal waters, in situ measurements (e.g., river gauges, salinity, and nutrients) are required to assess the model configurations (including model sensitivity analysis to the coupling frequency, boundary conditions, and vertical turbulence schemes) and future numerical studies. The integration of such in situ data in the present numerical framework is expected to improve the model capacity to investigate the occurrence of localized phenomena in different spatial and temporal scales, including the generation of internal waves related to rapid river flow and processes of coalescence and collisions of the rivers of Madeira. As future work, the coupling of a biogeochemical model would help to investigate the implications of flood episodes on the nutrients cycling and on the phytoplankton communities around Madeira Island. One should also consider that similar processes may affect the productivity of coastal waters in other oceanic islands, and that more observational and numerical investigations are needed to quantify the relative contribution of land runoff on the productivity of island coastal waters.
Data Availability Statement
The satellite datasets used in this study can be found in online repositories cited throughout the article. Upon request, the raw data supporting the conclusions of this article can be made available by the authors, without undue reservation.
Author Contributions
AR performed the data analysis and wrote most of the manuscript. RC and CC designed the numerical framework and guided the investigation. RV performed the COAWST numerical simulations. CC performed the MOHID-Land simulations in collaboration with AO. RF performed the validation of the WRF atmospheric model. GN performed part of the analysis of satellite-derived data of Chlorophyll-a. All authors contributed to the writing of the manuscript and approved the final version.
Funding
This work was partially financed by the Oceanic Observatory of Madeira Project (M1420-01-0145-FEDER-000001-Observatório Oceânico da Madeira-OOM) and by the Fundação para a Ciência e Tecnologia (FCT) through IDL project (UIDB/50019/2020). The COAWST numerical simulations were performed on the Cirrus platform of FCT, I.P. Advanced Computing Project (CPCA/A2/6193/2020).
Conflict of Interest
The authors declare that the research was conducted in the absence of any commercial or financial relationships that could be construed as a potential conflict of interest.
Publisher’s Note
All claims expressed in this article are solely those of the authors and do not necessarily represent those of their affiliated organizations, or those of the publisher, the editors and the reviewers. Any product that may be evaluated in this article, or claim that may be made by its manufacturer, is not guaranteed or endorsed by the publisher.
Acknowledgments
We would like to thank IPMA (Portuguese Institute for Sea and Atmosphere) for providing access to the meteorological data used to validate the atmospheric model; DROTe (Direção Regional do Ordenamento do Território) for providing the topography and maps for soil types and land-use used in the numerical systems; and CESGA (Supercomputing Center of Galicia) for enabling some of the computational resources used to conduct the model simulations. We are particularly indebted to comments from the reviewers that substantially improved the first version of the manuscript. Serena Blyth Lee provided a detailed and thorough review, for which we are very grateful.
Supplementary Material
The Supplementary Material for this article can be found online at: https://www.frontiersin.org/articles/10.3389/fmars.2021.749638/full#supplementary-material
Footnotes
References
Alves, J. M. R., Caldeira, R. M. A., and Miranda, P. M. A. (2020). Dynamics and oceanic response of the Madeira tip-jets. Q. J. R. Meteorol. Soc. 146, 3048–3063. doi: 10.1002/qj.3825
Alves, J. M. R., Tomé, R., Caldeira, R. M. A., Miranda, P. M. A., and Munoz-perez, J. J. (2021). Asymmetric ocean response to atmospheric forcing in an Island Wake: a 35-year high-resolution study. Front. Mar. Sci. 8:624392. doi: 10.3389/fmars.2021.624392
Andrade, I., Sangrà, P., Hormazabal, S., and Correa-Ramirez, M. (2014). Island mass effect in the Juan Fernández Archipelago (33°S), Southeastern Pacific. Deep. Res. 1 Oceanogr. Res. Pap. 84, 86–99. doi: 10.1016/j.dsr.2013.10.009
Arístegui, J., Tett, P., Hernández-Guerra, A., Basterretxea, G., Montero, M. F., Wild, K., et al. (1997). The influence of island-generated eddies on chlorophyll distribution: a study of mesoscale variation around Gran Canaria. Deep Sea Res. 1 Oceanogr. Res. Pap. 44, 71–96. doi: 10.1016/S0967-0637(96)00093-3
Ayouche, A., Carton, X., Charria, G., Theettens, S., and Ayoub, N. (2020). Instabilities and vertical mixing in river plumes: application to the Bay of Biscay. Geophys. Astrophys. Fluid Dyn. 114, 650–689. doi: 10.1080/03091929.2020.1814275
Ayouche, A., Charria, G., Carton, X., Ayoub, N., and Theetten, S. (2021). Non-linear processes in the gironde river plume (North-East Atlantic): instabilities and mixing. Front. Mar. Sci. 8:701773. doi: 10.3389/fmars.2021.701773
Azevedo, C. C., Camargo, C. M. L., Alves, J., and Caldeira, R. M. A. (2021). Convection and heat transfer in Island (Warm) wakes. J. Phys. Oceanogr. 51, 1187–1203. doi: 10.1175/JPO-D-20-0103.1
Baioni, D. (2011). Human activity and damaging landslides and floods on Madeira Island. Nat. Hazards Earth Syst. Sci. 11, 3035–3046. doi: 10.5194/nhess-11-3035-2011
Bao, H., Lee, T. Y., Huang, C., Feng, X., Dai, M., and Kao, S. J. (2015). Importance of Oceanian small mountainous rivers (SMRs) in global land-to-ocean output of lignin and modern biospheric carbon. Sci. Rep. 5:16217. doi: 10.1038/srep16217
Barcelos e Ramos, J., Schulz, K. G., Voss, M., Narciso, Á, Müller, M. N., Reis, F. V., et al. (2017). Nutrient-specific responses of a phytoplankton community: a case study of the North Atlantic Gyre, Azores. J. Plankton Res. 39, 744–761. doi: 10.1093/plankt/fbx025
Basdurak, N. B., Largier, J. L., and Nidzieko, N. J. (2020). Modeling the dynamics of small-scale river and creek plumes in tidal waters. J. Geophys. Res. Ocean. 125:e2019JC015737. doi: 10.1029/2019JC015737
Becker, J. J., Sandwell, D. T., Smith, W. H. F., Braud, J., Binder, B., Depner, J., et al. (2009). Global bathymetry and elevation data at 30 Arc seconds resolution: SRTM30_PLUS. Mar. Geod. 32, 355–371. doi: 10.1080/01490410903297766
Bell, P. R. F. (1992). Eutrophication and coral reefs-some examples in the Great Barrier Reef lagoon. Water Res. 26, 553–568. doi: 10.1016/0043-1354(92)90228-V
Belo-Pereira, M., and Santos, J. A. (2020). Air-traffic restrictions at the Madeira International Airport Due to adverse winds: links to synoptic-scale patterns and orographic effects. Atmosphere 11:1257. doi: 10.3390/atmos11111257
Bernard-Jannin, L., Brito, D., Sun, X., Jauch, E., Neves, R., Sauvage, S., et al. (2016). Spatially distributed modelling of surface water-groundwater exchanges during overbank flood events–a case study at the Garonne River. Adv. Water Resour. 94, 146–159. doi: 10.1016/j.advwatres.2016.05.008
Booij, N., Ris, R. C., and Holthuijsen, L. H. (1999). A third-generation wave model for coastal regions 1. Model description and validation. J. Geophys. Res. Ocean. 104, 7649–7666. doi: 10.1029/98JC02622
Branch, R. A., Horner-Devine, A. R., Kumar, N., and Poggioli, A. R. (2020). River plume Liftoff dynamics and surface expressions. Water Resour. Res. 56:e2019WR026475. doi: 10.1029/2019WR026475
Brito, D., Campuzano, F. J., Sobrinho, J., Fernandes, R., and Neves, R. (2015). Integrating operational watershed and coastal models for the Iberian Coast: watershed model implementation–a first approach. Estuar. Coast. Shelf Sci. 167, 138–146. doi: 10.1016/j.ecss.2015.10.022
Brito, D., Neves, R., Branco, M. A., Gonçalves, M. C., and Ramos, T. B. (2017). Modeling flood dynamics in a temporary river draining to an eutrophic reservoir in southeast Portugal. Environ. Earth Sci. 76:377. doi: 10.1007/s12665-017-6713-7
Brito, D., Ramos, T. B., Gonçalves, M. C., Morais, M., and Neves, R. (2018). Integrated modelling for water quality management in a eutrophic reservoir in south-eastern Portugal. Environ. Earth Sci. 77:40. doi: 10.1007/s12665-017-7221-5
Brodie, J., Schroeder, T., Rohde, K., Faithful, J., Masters, B., Dekker, A., et al. (2010). Dispersal of suspended sediments and nutrients in the Great Barrier Reef lagoon during river-discharge events: conclusions from satellite remote sensing and concurrent flood-plume sampling. Mar. Freshw. Res. 61, 651–664. doi: 10.1071/MF08030
Büttner, G., and Kosztra, B. (2007). CLC2006 technical guidelines. Eur. Environ. Agency Tech. Rep. 1:70.
Caetano, C. (2014). Avaliação do Risco de Aluviões das Ribeiras da Ilha da Madeira. Master’s thesis. Lisboa: Instituto Superior Técnico de Lisboa.
Caldeira, R., Couvelard, X., Vieira, R., Lucas, C., Sala, I., and Casanova, I. V. (2016). Challenges of building an operational ocean forecasting system for small island regions: regional to local. J. Oper. Oceanogr. 9:12. doi: 10.1080/1755876X.2016.1205304
Caldeira, R. M. A. (2018). Island Wakes, 3rd Edn. Amsterdam: Elsevier Inc. doi: 10.1016/B978-0-12-409548-9.11614-8
Caldeira, R. M. A., Groom, S., Miller, P., Pilgrim, D., and Nezlin, N. P. (2002). Sea-surface signatures of the island mass effect phenomena around Madeira Island, Northeast Atlantic. Remote Sens. Environ. 80, 336–360. doi: 10.1016/S0034-4257(01)00316-9
Caldeira, R. M. A., Marchesiello, P., Nezlin, N. P., DiGiacomo, P. M., and McWilliams, J. C. (2005). Island wakes in the Southern California Bight. J. Geophys. Res. Ocean. 110, 1–20. doi: 10.1029/2004JC002675
Caldeira, R. M. A., Russell, P., and Amorim, A. (2001). Evidence of an unproductive coastal front in Baía D’Abra, an embayment on the southeast of Madeira Island, Portugal. Bull. Mar. Sci. 69, 1057–1072.
Caldeira, R. M. A., and Sangrà, P. (2012). Complex geophysical wake flows Madeira archipelago case study. Ocean Dyn. 62, 683–700. doi: 10.1007/s10236-012-0528-6
Caldeira, R. M. A., Stegner, A., Couvelard, X., Araújo, I. B., Testor, P., and Lorenzo, A. (2014). Evolution of an oceanic anticyclone in the lee of Madeira Island: in situ and remote sensing survey. J. Geophys. Res. Ocean. 119, 1195–1216. doi: 10.1002/2013JC009493
Caldeira, R. M. A., and Tomé, R. (2013). Wake response to an ocean-feedback mechanism: Madeira Island case study. Boundary Layer Meteorol. 148, 419–436. doi: 10.1007/s10546-013-9817-y
Canning-Clode, J., Kaufmann, M., Molis, M., Wahl, M., and Lenz, M. (2008). Influence of disturbance and nutrient enrichment on early successional fouling communities in an oligotrophic marine system. Mar. Ecol. 29, 115–124. doi: 10.1111/j.1439-0485.2007.00210.x
Canuto, N., Ramos, T. B., Oliveira, A. R., Simionesei, L., Basso, M., and Neves, R. (2019). Influence of reservoir management on Guadiana streamflow regime. J. Hydrol. Reg. Stud. 25:100628. doi: 10.1016/j.ejrh.2019.100628
Carstensen, J., Conley, D. J., Almroth-Rosell, E., Asmala, E., Bonsdorff, E., Fleming-Lehtinen, V., et al. (2020). Factors regulating the coastal nutrient filter in the Baltic Sea. Ambio 49, 1194–1210. doi: 10.1007/s13280-019-01282-y
Cassianides, A., Martinez, E., Maes, C., Carton, X., and Gorgues, T. (2020). Monitoring the influence of the mesoscale ocean dynamics on phytoplanktonic plumes around the Marquesas Islands using multi-satellite missions. Remote Sens. 12:2520. doi: 10.3390/RS12162520
Chao, S.-Y., and Boicourt, W. C. (1986). Onset of estuarine plumes. J. Phys. Oceanogr. 16, 2137–2149. doi: 10.1175/1520-04851986016<2137:OOEP<2.0.CO;2
Chapman, D. C. (1985). Numerical treatment of cross-shelf open boundaries in a barotropic coastal ocean model. J. Phys. Ocean. 15, 1060–1075. doi: 10.1175/1520-04851985015<1060:ntocso<2.0.co;2
Chassot, E., Bonhommeau, S., Dulvy, N. K., Mélin, F., Watson, R., Gascuel, D., et al. (2010). Global marine primary production constrains fisheries catches. Ecol. Lett. 13, 495–505. doi: 10.1111/j.1461-0248.2010.01443.x
Chen, F., MacDonald, D. G., and Hetland, R. D. (2009). Lateral spreading of a near-field river plume: observations and numerical simulations. J. Geophys. Res. Ocean. 114, 1–12. doi: 10.1029/2008JC004893
Correia, F. N. (1983). “Alguns procedimentos adaptados pelo soil conservation service na determinação de Caudais de Cheia em Pequenas Bacias Naturais e Urbanas,” in Proceedings of the Seminário 290 “Contribuição para o Cálculo de Drenagem de Águas Pluviais em Zonas Urbanas, (Lisboa: Laboratório Nacional de Engenharia Civil).
Couto, F. T., Salgado, R., and Costa, M. J. (2012). Analysis of intense rainfall events on Madeira Island during the 2009/2010 winter. Nat. Hazards Earth Syst. Sci. 12, 2225–2240. doi: 10.5194/nhess-12-2225-2012
Couto, F. T., Salgado, R., Costa, M. J., and Prior, V. (2015). Precipitation in the Madeira Island over a 10-year period and the meridional water vapour transport during the winter seasons. Int. J. Climatol. 35, 3748–3759. doi: 10.1002/joc.4243
Couvelard, X., Caldeira, R. M. A., Araújo, I. B., and Tomé, R. (2012). Wind mediated vorticity-generation and eddy-confinement, leeward of the Madeira Island: 2008 numerical case study. Dyn. Atmos. Ocean. 58, 128–149. doi: 10.1016/j.dynatmoce.2012.09.005
Dandonneau, Y., and Charpy, L. (1985). An empirical approach to the island mass effect in the south tropical Pacific based on sea surface chlorophyll concentrations. Deep Sea Res. A Oceanogr. Res. Pap. 32, 707–721. doi: 10.1016/0198-0149(85)90074-3
Dasari, H. P., and Salgado, R. (2015). Numerical modelling of heavy rainfall event over Madeira Island in Portugal: sensitivity to different micro physical processes. Meteorol. Appl. 22, 113–127. doi: 10.1002/met.1375
David, J. S. (1976). Drenagem de Estradas, Caminhos de ferro e Aeródromos. Estudo Hidrogeológico. Determinação de Caudais de Ponta de cheia em Pequenas Bacias Hidrográficas. Lisboa: Laboratório Nacional de Engenharia Civil, SH-DHF.
De Meij, A., and Vinuesa, J. F. (2014). Impact of SRTM and corine land cover data on meteorological parameters using WRF. Atmos. Res. 143, 351–370. doi: 10.1016/j.atmosres.2014.03.004
Doty, M. S., and Oguri, M. (1956). The island mass effect. ICES J. Mar. Sci. 22, 33–37. doi: 10.1093/icesjms/22.1.33
Dresback, K. M., Fleming, J. G., Blanton, B. O., Kaiser, C., Gourley, J. J., Tromble, E. M., et al. (2013). Skill assessment of a real-time forecast system utilizing a coupled hydrologic and coastal hydrodynamic model during Hurricane Irene (2011). Cont. Shelf Res. 71, 78–94. doi: 10.1016/j.csr.2013.10.007
Egbert, G. D., and Erofeeva, S. Y. (2002). Efficient inverse modeling of barotropic ocean tides. J. Atmos. Ocean. Technol. 19, 183–204. doi: 10.1175/1520-04262002019<0183:EIMOBO<2.0.CO;2
Epelde, A. M., Antiguedad, I., Brito, D., Jauch, E., Neves, R., Garneau, C., et al. (2016). Different modelling approaches to evaluate nitrogen transport and turnover at the watershed scale. J. Hydrol. 539, 478–494. doi: 10.1016/j.jhydrol.2016.05.066
Espinosa, L. A., and Portela, M. M. (2020). Rainfall trends over a small island teleconnected to the North Atlantic oscillation–the case of Madeira Island, Portugal. Water Resour. Manag. 34, 4449–4467. doi: 10.1007/s11269-020-02668-4
Espinosa, L. A., Portela, M. M., Filho, J. D. P., and Zelenakova, M. (2021). Bivariate modelling of a teleconnection index and extreme rainfall in a small North Atlantic Island. Climate 9, 1–21. doi: 10.3390/cli9050086
Fong, D. A., and Geyer, W. R. (2001). Response of a river plume during an upwelling favorable wind event. J. Geophys. Res. Ocean. 106, 1067–1084. doi: 10.1029/2000JC900134
Fong, D. A., and Geyer, W. R. (2002). The alongshore transport of freshwater in a surface-trapped river plume. Br. J. Oral Maxillofac. Surg. 23, 251–258. doi: 10.1175/1520-04852002032<0957:TATOFI<2.0.CO;2
Fragoso, M., Trigo, R. M., Pinto, J. G., Lopes, S., Lopes, A., Ulbrich, S., et al. (2012). The 20 February 2010 Madeira flash-floods: synoptic analysis and extreme rainfall assessment. Nat. Hazards Earth Syst. Sci. 12, 715–730. doi: 10.5194/nhess-12-715-2012
Garvine, R. W. (1999). Penetration of buoyant coastal discharge onto the continental shelf: a numerical model experiment. J. Phys. Oceanogr. 29, 1892–1909. doi: 10.1175/1520-04851999029<1892:pobcdo<2.0.co;2
Gonçalves, J. A. V. (2016). Caracterização do Coeficiente de Rugosidade e seu Efeito no Escoamento em Canais Naturais Simulação e modelação (à escala) no laboratório de hidráulica Aplicação às ribeiras do Funchal. Master’s thesis. Funchal: University of Madeira.
Gorricha, J., Lobo, V., and Costa, A. C. (2012). “Spatial characterization of extreme precipitation in Madeira Island using geostatistical procedures and a 3D SOM,” in Proceedings of the GEOProcessing 2012. The Fourth International Conference on Advanced Geographic Information Systems, Applications, and Services, Valencia, 98–104.
Gouveia-Reis, D., Guerreiro Lopes, L., and Mendonça, S. (2016). A dependence modelling study of extreme rainfall in Madeira Island. Phys. Chem. Earth A/B/C 94, 85–93. doi: 10.1016/j.pce.2015.11.006
Gove, J. M., McManus, M. A., Neuheimer, A. B., Polovina, J. J., Drazen, J. C., Smith, C. R., et al. (2016). Near-island biological hotspots in barren ocean basins. Nat. Commun. 7:10581. doi: 10.1038/ncomms10581
Grubišic, V., Sachsperger, J., and Caldeira, R. M. A. (2015). Atmospheric wake of madeira: first aerial observations and numerical simulations. J. Atmos. Sci. 72, 4755–4776. doi: 10.1175/JAS-D-14-0251.1
Hasegawa, D. (2019). “Island mass effect,” in Kuroshio Current: Physical, Biogeochemical, and Ecosystem Dynamics, eds T. Nagai, H. Saito, K. Suzuki, and T. Motomitsu (Washington, DC: American Geophysical Union (AGU)), 163–174. doi: 10.1002/9781119428428.ch10
Hasegawa, D., Yamazaki, H., Lueck, R. G., and Seuront, L. (2004). How islands stir and fertilize the upper ocean. Geophys. Res. Lett. 31, 2–5. doi: 10.1029/2004GL020143
Hilton, R. G., Galy, A., Hovius, N., Horng, M. J., and Chen, H. (2011). Efficient transport of fossil organic carbon to the ocean by steep mountain rivers: an orogenic carbon sequestration mechanism. Geology 39, 71–74. doi: 10.1130/G31352.1
Hong, S.-Y., and Lim, J.-O. J. (2006). The WRF single-moment 6-class microphysics scheme (WSM6). Asia Pac. J. Atmos. Sci. 42, 129–151.
Horner-Devine, A. R., Fong, D. A., Monismith, S. G., and Maxworthy, T. (2006). Laboratory experiments simulating a coastal river inflow. J. Fluid Mech. 555, 203–232. doi: 10.1017/S0022112006008937
Horner-Devine, A. R., Hetland, R. D., and MacDonald, D. G. (2015). Mixing and transport in coastal river plumes. Annu. Rev. Fluid Mech. 47, 569–594. doi: 10.1146/annurev-fluid-010313-141408
Hrachowitz, M., Savenije, H. H. G., Blöschl, G., McDonnell, J. J., Sivapalan, M., Pomeroy, J. W., et al. (2013). A decade of predictions in ungauged basins (PUB)-a review. Hydrol. Sci. J. 58, 1198–1255. doi: 10.1080/02626667.2013.803183
Jacob, R., Larson, J., and Ong, E. (2005). M × N communication and parallel interpolation in community climate system model version 3 using the model coupling toolkit. Int. J. High Perform. Comput. Appl. 19, 293–307. doi: 10.1177/1094342005056116
James, A. K., Washburn, L., Gotschalk, C., Maritorena, S., Alldredge, A., Nelson, C. E., et al. (2020). An island mass effect resolved near Mo’orea, French Polynesia. Front. Mar. Sci. 7:16. doi: 10.3389/fmars.2020.00016
Janjic, Z. I. (1990). The step-mountain coordinate: physical package. Mon. Weather Rev. 118, 1429–1443. doi: 10.1175/1520-04931990118<1429:TSMCPP<2.0.CO;2
Janjic, Z. I. (1994). The step-mountain eta coordinate model: further developments of the convection, viscous sublayer, and turbulence closure schemes. Mon. Weather Rev. 122, 927–945. doi: 10.1175/1520-04931994122<0927:TSMECM<2.0.CO;2
Janjic, Z. I. (1996). “The surface layer in the NCEP eta model,” in Proceedings of the 11th Conference on Numerical Weather Prediction, Norfolk, VA, 354–355. doi: 10.1371/journal.pone.0117082
Janjić, Z. I. (2002). Nonsingular Implementation of the Mellor-Yamada level 2.5 Scheme in the NCEP Meso Model. NCEP Office Note 437. College Park, MD: 61.
Jiang, Z.-P., Tong, Y., Tong, M., Yuan, J., Cao, Q., and Pan, Y. (2021). The effects of suspended particulate matter, nutrient, and salinity on the growth of Amphidinium carterae under estuary environmental conditions. Front. Mar. Sci. 8:690764. doi: 10.3389/fmars.2021.690764
Jones, E. C. (1962). Evidence of an island effect upon the standing crop of zooplankton near the marquesas islands, central pacific. ICES J. Mar. Sci. 27, 223–231. doi: 10.1093/icesjms/27.3.223
Jones, P. W. (1999). First- and second-order conservative remapping schemes for grids in spherical coordinates. Mon. Weather Rev. 127, 2204–2210. doi: 10.1175/1520-04931999127<2204:FASOCR<2.0.CO;2
Kao, S. J., and Milliman, J. D. (2008). Water and sediment discharge from small mountainous rivers, Taiwan: the roles of lithology, episodic events, and human activities. J. Geol. 116, 431–448. doi: 10.1086/590921
Korotenko, K. A., Osadchiev, A. A., Zavialov, P. O., Kao, R. C., and Ding, C. F. (2014). Effects of bottom topography on dynamics of river discharges in tidal regions: case study of twin plumes in Taiwan Strait. Ocean Sci. 10, 863–879. doi: 10.5194/os-10-863-2014
Larson, J., Jacob, R., and Ong, E. (2005). The model coupling toolkit: a new Fortran90 Toolkit for building multiphysics parallel coupled models. Int. J. High Perform. Comput. Appl. 19, 277–292. doi: 10.1177/1094342005056115
Leichter, J. J., Shellenbarger, G., Genovese, J. S., and Wing, R. S. (1998). Breaking internal waves on a Florida (USA) coral reef: a plankton pump at work? Mar. Ecol. Prog. Ser. 166, 83–97. doi: 10.3354/meps166083
Leichter, J. J., Stewart, H. L., and Miller, S. L. (2003). Episodic nutrient transport to Florida coral reefs. Limnol. Oceanogr. 48, 1394–1407. doi: 10.4319/lo.2003.48.4.1394
Levizzani, V., Laviola, S., Cattani, E., and Costa, M. J. (2013). Extreme precipitation on the Island of Madeira on 20 February 2010 as seen by satellite passive microwave sounders. Eur. J. Remote Sens. 46, 475–489. doi: 10.5721/EuJRS20134628
Li, M., Zhong, L., and Boicourt, W. C. (2005). Simulations of Chesapeake Bay estuary: sensitivity to turbulence mixing parameterizations and comparison with observations. J. Geophys. Res. Ocean. 110, 1–22. doi: 10.1029/2004JC002585
Lira, C., Lousada, M., Falcão, A. P., Gonçalves, A. B., Heleno, S., Matias, M. P., et al. (2013). The 20 February 2010 Madeira Island flash-floods: VHR satellite imagery processing in support of landslide inventory and sediment budget assessment. Nat. Hazards Earth Syst. Sci. 13, 709–719. doi: 10.5194/nhess-13-709-2013
Liss, P. S. (1976). “Conservative and non-conservative behaviour of dissolved constituents during estuarine mixing,” in Estuarine Chemistry, eds J. D. Burton and P. S. Liss (London: Academic Press), 93–130.
Liu, J. T., Kao, S. J., Huh, C. A., and Hung, C. C. (2013). Gravity flows associated with flood events and carbon burial: Taiwan as instructional source area. Ann. Rev. Mar. Sci. 5, 48–68. doi: 10.1146/annurev-marine-121211-172307
Liu, Y., MacCready, P., Hickey, B. M., Dever, E. P., Kosro, P. M., and Banas, N. S. (2009). Evaluation of a coastal ocean circulation model for the Columbia river plume in summer 2004. J. Geophys. Res. Ocean. 114, 1–23. doi: 10.1029/2008JC004929
Longhurst, A., Sathyendranath, S., Platt, T., and Caverhill, C. (1995). An estimate of global primary production in the ocean from satellite radiometer data. J. Plankton Res. 17, 1245–1271. doi: 10.1093/plankt/17.6.1245
Lopes, S., Fragoso, M., and Lopes, A. (2020). Heavy rainfall events and mass movements in the funchal area (Madeira, Portugal): spatial analysis and susceptibility assessment. Atmosphere 11:104. doi: 10.3390/atmos11010104
Lourenço, S. D. N., and Rodrigues, D. M. M. (2016). “The 2010 flash floods in Madeira Island: characteristics and the role of soil water repellency in future events,” in Proceedings of the XVI European Conference on Soil Mechanics and Geotechnical Engineering, (London: British Geotechnical Association), 4. doi: 10.1680/ecsmge.60678.vol4.266
Lousada, S., and Loures, L. (2020). Modelling torrential rain flows in urban territories: floods - natural channels (the case study of Madeira Island). Am. J. Water Sci. Eng. 6:17. doi: 10.11648/j.ajwse.20200601.13
Luna, T., Rocha, A., Carvalho, A. C., Ferreira, J. A., and Sousa, J. (2011). Modelling the extreme precipitation event over Madeira Island on 20 February 2010. Nat. Hazards Earth Syst. Sci. 11, 2437–2452. doi: 10.5194/nhess-11-2437-2011
Marchesiello, P., McWilliams, J. C., and Shchepetkin, A. (2001). Open boundary conditions for long-term integration of regional oceanic models. Ocean Model. 3, 1–20. doi: 10.1016/S1463-5003(00)00013-5
Marta-Almeida, M., Dalbosco, A., Franco, D., and Ruiz-Villarreal, M. (2020). Dynamics of river plumes in the South Brazilian Bight and South Brazil. Ocean Dyn. 71, 59–80. doi: 10.1007/s10236-020-01397-x
Martinez, E., and Maamaatuaiahutapu, K. (2004). Island mass effect in the Marquesas Islands: time variation. Geophys. Res. Lett. 31, 1–4. doi: 10.1029/2004GL020682
Mason, E., Molemaker, J., Shchepetkin, A. F., Colas, F., McWilliams, J. C., and Sangrà, P. (2010). Procedures for offline grid nesting in regional ocean models. Ocean Model. 35, 1–15. doi: 10.1016/j.ocemod.2010.05.007
McCabe, R. M., MacCready, P., and Hickey, B. M. (2009). Ebb-tide dynamics and spreading of a large river plume. J. Phys. Oceanogr. 39, 2839–2856. doi: 10.1175/2009JPO4061.1
Mendes, R., da Silva, J. C. B., Magalhaes, J. M., St-Denis, B., Bourgault, D., Pinto, J., et al. (2021). On the generation of internal waves by river plumes in subcritical initial conditions. Sci. Rep. 11:1963. doi: 10.1038/s41598-021-81464-5
Messié, M., Petrenko, A., Doglioli, A. M., Aldebert, C., Martinez, E., Koenig, G., et al. (2020). The delayed island mass effect: how islands can remotely trigger blooms in the oligotrophic ocean. Geophys. Res. Lett. 47, 1–10. doi: 10.1029/2019GL085282
Meybeck, M., Laroche, L., Dürr, H. H., and Syvitski, J. P. M. (2003). Global variability of daily total suspended solids and their fluxes in rivers. Glob. Planet. Change 39, 65–93. doi: 10.1016/S0921-8181(03)00018-3
Milliman, J. D., and Syvitski, J. P. M. (1992). Geomorphic/tectonic control of sediment discharge to the ocean: the importance of small mountainous rivers. J. Geol. 100, 525–544. doi: 10.1086/629606
Miranda, P. M. A., Tomé, R., Frois, L., Nogueira, M., Alves, J. M. R., Prior, V., et al. (2021). Speed-up of the Madeira tip jets in the ERA5 climate highlights the decadal variability of the Atlantic subtropics. Q. J. R. Meteorol. Soc. 147, 679–690. doi: 10.1002/qj.3940
Mlawer, E. J., Taubman, S. J., Brown, P. D., Iacono, M. J., and Clough, S. A. (1997). Radiative transfer for inhomogeneous atmospheres: RRTM, a validated correlated-k model for the longwave. J. Geophys. Res. Atmos. 102, 16663–16682. doi: 10.1029/97jd00237
Moosdorf, N., Stieglitz, T., Waska, H., Dürr, H. H., and Hartmann, J. (2015). Submarine groundwater discharge from tropical islands: a review. Grundwasser 20, 53–67. doi: 10.1007/s00767-014-0275-3
Narciso, Á, Caldeira, R., Reis, J., Hoppenrath, M., Cachão, M., and Kaufmann, M. (2019). The effect of a transient frontal zone on the spatial distribution of extant coccolithophores around the Madeira archipelago (Northeast Atlantic). Estuar. Coast. Shelf Sci. 223, 25–38. doi: 10.1016/j.ecss.2019.04.014
Nguyen, H. T., Wiatr, T., Fernández-Steeger, T. M., Reicherter, K., Rodrigues, D. M. M., and Azzam, R. (2013). Landslide hazard and cascading effects following the extreme rainfall event on Madeira Island (February 2010). Nat. Hazards 65, 635–652. doi: 10.1007/s11069-012-0387-y
Nunalee, C. G., and Basu, S. (2014). On the periodicity of atmospheric von Kármán vortex streets. Environ. Fluid Mech. 14, 1335–1355. doi: 10.1007/s10652-014-9340-9
Ogden, F. L. (2016). Evidence of equilibrium peak runoff rates in steep tropical terrain on the island of Dominica during Tropical Storm Erika, August 27, 2015. J. Hydrol. 542, 35–46. doi: 10.1016/j.jhydrol.2016.08.041
Oliveira, A. R., Ramos, T. B., Simionesei, L., Pinto, L., and Neves, R. (2020). Sensitivity analysis of the MOHID-land hydrological model: a case study of the Ulla River Basin. Water 12:3258. doi: 10.3390/w12113258
Oliveira, M. M. (2004). “Recarga de Águas Subterrâneas: Métodos de Avaliação”. Dissertação de doutoramento em Geologia (hidrogeologia). Lisboa: Universidade de Lisboa e Laboratório Nacional de Engenharia Civil, 440.
Oliveira, R. P., Almeida, A. B., Sousa, J., Pereira, M. J., Portela, M. M., Coutinho, M. A., et al. (2011). “Avaliação do risco de aluviões na Ilha da Madeira,” in Proceedings of the 10? Simpósio de Hidráulica e Recursos Hídricos dos Países de Língua Oficial Portuguesa, Porto de Galinhas.
Osadchiev, A., Barymova, A., Sedakov, R., Zhiba, R., and Dbar, R. (2020). Spatial structure, short-temporal variability, and dynamical features of small river plumes as observed by aerial drones: case study of the Kodor and Bzyp river plumes. Remote Sens. 12:3079. doi: 10.3390/RS12183079
Osadchiev, A., and Korshenko, E. (2017). Small river plumes off the northeastern coast of the Black Sea under average climatic and flooding discharge conditions. Ocean Sci. 13, 465–482. doi: 10.5194/os-13-465-2017
Osadchiev, A., and Zavialov, P. (2020). “Structure and dynamics of plumes generated by small rivers,” in Estuaries and Coastal Zones–Dynamics and Response to Environmental Changes, eds J. Pan and A. Devlin (London: IntechOpen). doi: 10.5772/intechopen.87843
Osadchiev, A. A. (2018). Small mountainous rivers generate high-frequency internal waves in coastal ocean. Sci. Rep. 8:16609. doi: 10.1038/s41598-018-35070-7
Osadchiev, A. A., Izhitskiy, A. S., Zavialov, P. O., Kremenetskiy, V. V., Polukhin, A. A., Pelevin, V. V., et al. (2017). Structure of the buoyant plume formed by Ob and Yenisei river discharge in the southern part of the Kara Sea during summer and autumn. J. Geophys. Res. Ocean. 122, 1–22. doi: 10.1002/2016JC012603
Palacios, D. M. (2002). Factors influencing the island-mass effect of the Galápagos Archipelago. Geophys. Res. Lett. 29, 1–4. doi: 10.1029/2002GL016232
Pan, J., Gu, Y., and Wang, D. (2014). Observations and numerical modeling of the Pearl River plume in summer season. J. Geophys. Res. Ocean. 119, 2480–2500. doi: 10.1002/2013JC009042
Perissinotto, R., Lutjeharms, J. R. E., and Van Ballegooyen, R. C. (2000). Biological-physical interactions and pelagic productivity at the Prince Edward Islands, Southern Ocean. J. Mar. Syst. 24, 327–341. doi: 10.1016/S0924-7963(99)00093-7
Pestana, R., Matias, M., Canelas, R., Araújo, A., Roque, D., van Zeller, E., et al. (2013). “Calibration Of 2D hydraulic inundation models in the floodplain region of the Lower Tagus River,” in Proceedings of the ESA Living Planet Symposium, Edimburgh, 9–13.
Prada, S., Menezes de Sequeira, M., Figueira, C., and da Silva, M. O. (2009). Fog precipitation and rainfall interception in the natural forests of Madeira Island (Portugal). Agric. For. Meteorol. 149, 1179–1187. doi: 10.1016/j.agrformet.2009.02.010
Prada, S. N., da Silva, M. O., and Cruz, J. V. (2005a). Groundwater behaviour in Madeira, volcanic island (Portugal). Hydrogeol. J. 13, 800–812. doi: 10.1007/s10040-005-0448-3
Prada, S., Perestrelo, A., Sequeira, M., Nunes, A., Figueira, C., and Cruz, J. V. (2005b). “Disponibilidades hídricas da ilha da Madeira,” in Projecto AQUAMAC – Técnicas e Métodos para a Gestão da Água na Macaronésia, eds A. Ortega, L. V. Peña, and G. M. Rodríguez (Las Palmas: Consejo Insular de Aguas de Lanzarote), 261–294.
Pullen, J., Allard, R., Seo, H., Miller, A. J., Chen, S. Y., Pezzi, L. P., et al. (2017a). Coupled ocean–atmosphere forecasting at short and medium time scales. J. Mar. Res. 75, 877–921. doi: 10.1357/002224017823523991
Pullen, J., Caldeira, R., Doyle, J. D., May, P., and Tomé, R. (2017b). Modeling the air-sea feedback system of Madeira Island. J. Adv. Model. Earth Syst. 6, 513–526. doi: 10.1002/2016MS000861
Raapoto, H., Martinez, E., Petrenko, A., Doglioli, A., Gorgues, T., Sauzède, R., et al. (2019). Role of iron in the Marquesas Island mass effect. J. Geophys. Res. Ocean. 124, 7781–7796. doi: 10.1029/2019JC015275
Raapoto, H., Martinez, E., Petrenko, A., Doglioli, A. M., and Maes, C. (2018). Modeling the wake of the Marquesas archipelago. J. Geophys. Res. Ocean. 123, 1213–1228. doi: 10.1002/2017JC013285
Ramos, A. M., Tomé, R., Trigo, R. M., Liberato, M. L. R., and Pinto, J. G. (2016). Projected changes in atmospheric rivers affecting Europe in CMIP5 models. Geophys. Res. Lett. 43, 9315–9323. doi: 10.1002/2016GL070634
Ramos, A. M., Trigo, R. M., Tomé, R., and Liberato, M. L. R. (2018a). Impacts of atmospheric rivers in extreme precipitation on the European Macaronesian Islands. Atmosphere 9:325. doi: 10.3390/atmos9080325
Ramos, T. B., Simionesei, L., Jauch, E., Almeida, C., and Neves, R. (2017). Modelling soil water and maize growth dynamics influenced by shallow groundwater conditions in the Sorraia Valley region, Portugal. Agric. Water Manag. 185, 27–42. doi: 10.1016/j.agwat.2017.02.007
Ramos, T. B., Simionesei, L., Oliveira, A. R., Darouich, H., and Neves, R. (2018b). Assessing the impact of LAI data assimilation on simulations of the soil water balance and maize development using MOHID-Land. Water 10:1367. doi: 10.3390/w10101367
Řehánek, T., Podhorányi, M., and Křenek, J. (2019). Parameter recalculation for a rainfall-runoff model with a focus on runoff curve numbers. Geoscape 13, 132–140. doi: 10.2478/geosc-2019-0013
Ricardo, R. P., Câmara, E. M. S., and Ferreira, M. A. M. (1992). Carta dos Solos da Ilha da Madeira (1:50,000). Lisboa: Secretaria Regional de Economia, Direcção Regional de Agricultura da Madeira.
Ricchi, A., Bonaldo, D., Cioni, G., Carniel, S., and Miglietta, M. M. (2021). Simulation of a flash flood event over the Adriatic Sea with a high resolution atmosphere–ocean–wave coupled system. Sci. Rep. 11: 9388. doi: 10.1038/s41598-021-88476-1
Robertson, R., and Dong, C. (2019). An evaluation of the performance of vertical mixing parameterizations for tidal mixing in the regional ocean modeling system (ROMS). Geosci. Lett. 6, 1–18. doi: 10.1186/s40562-019-0146-y
Rodrigues, A., Oliveira, A., Fonseca, R., Taborda, R., and Cascalho, J. (2006). Sedimentary dynamics of the southern shelf of Madeira (Portugal). J. Coast. Res. 1, 454–458.
Saldías, G. S., Sobarzo, M., Largier, J., Moffat, C., and Letelier, R. (2012). Seasonal variability of turbid river plumes off central Chile based on high-resolution MODIS imagery. Remote Sens. Environ. 123, 220–233. doi: 10.1016/j.rse.2012.03.010
Sanders, T. M., and Garvine, R. W. (2001). Fresh water delivery to the continental shelf and subsequent mixing: an observational study. J. Geophys. Res. Ocean. 106, 27087–27101. doi: 10.1029/2001jc000802
Sartori, A., Genovez, A. M., and Neto, F. L. (2009). “Tentative Hydrologic soil Classification for Tropical Soils,” in Proceedings of the 16th IAHR-APD Congress and 3rd Symposium of IAHR-ISHS, Nanjing, 199–204. doi: 10.1007/978-3-540-89465-0_37
Schäfer, S., Monteiro, J., Castro, N., Gizzi, F., Henriques, F., Ramalhosa, P., et al. (2020). Lost and found: a new hope for the seagrass Cymodocea nodosa in the marine ecosystem of a subtropical Atlantic Island. Reg. Stud. Mar. Sci. 41:101575. doi: 10.1016/j.rsma.2020.101575
Shchepetkin, A. F., and McWilliams, J. C. (2005). The regional oceanic modeling system (ROMS): a split-explicit, free-surface, topography-following-coordinate oceanic model. Ocean Model. 9, 347–404. doi: 10.1016/j.ocemod.2004.08.002
Signorini, S. R., McClain, C. R., and Dandonneau, Y. (1999). Mixing and phytoplankton bloom in the wake of the Marquesas Islands. Geophys. Res. Lett. 26, 3121–3124. doi: 10.1029/1999GL010470
Silva-Araya, W. F., Santiago-Collazo, F. L., Gonzalez-Lopez, J., and Maldonado-Maldonado, J. (2018). Dynamic modeling of surface runoff and storm surge during hurricane and tropical storm events. Hydrology 5, 1–28. doi: 10.3390/hydrology5010013
Simionesei, L., Ramos, T. B., Brito, D., Jauch, E., Leitão, P. C., Almeida, C., et al. (2016). Numerical simulation of soil water dynamics under stationary sprinkler irrigation with mohid-land. Irrig. Drain. 65, 98–111. doi: 10.1002/ird.1944
Simionesei, L., Ramos, T. B., Oliveira, A. R., Jongen, M., Darouich, H., Weber, K., et al. (2018). Modeling soilwater dynamics and pasture growth in the montado ecosystem using MOHID land. Water 10, 1–19. doi: 10.3390/w10040489
Simionesei, L., Ramos, T. B., Palma, J., Oliveira, A. R., and Neves, R. (2020). IrrigaSys: a web-based irrigation decision support system based on open source data and technology. Comput. Electron. Agric. 178:105822. doi: 10.1016/j.compag.2020.105822
Simpson, J. H. (1997). Physical processes in the ROFI regime. Oceanogr. Lit. Rev. 45, 6. doi: 10.1016/S0924-7963(96)00085-1
Skamarock, W. C., and Klemp, J. B. (2008). A time-split nonhydrostatic atmospheric model for weather research and forecasting applications. J. Comput. Phys. 227, 3465–3485. doi: 10.1016/j.jcp.2007.01.037
Skamarock, W. C., Klemp, J. B., Dudhia, J., Gill, D. O., Barker, D. M., Wang, W., et al. (2008). A Description of the Advanced Research WRF version 3. NCAR Technical note-475+ STR. Boulder, CO: National Center for Atmospheric Research. doi: 10.5065/D68S4MVH
Smith, W. H. F., and Sandwell, D. T. (1997). Global sea floor topography from satellite altimetry and ship depth soundings. Science 277, 1956–1962. doi: 10.1126/science.277.5334.1956
Smyth, W. D., and Moum, J. N. (2000). Anisotropy of turbulence in stably stratified mixing layers. Phys. Fluids 12, 1343–1362. doi: 10.1063/1.870386
Sorgente, R., Di Maio, A., Pessini, F., Ribotti, A., Bonomo, S., Perilli, A., et al. (2020). Impact of freshwater inflow from the Volturno river on coastal circulation. Front. Mar. Sci. 7:293. doi: 10.3389/fmars.2020.00293
Street, J. H., Knee, K. L., Grossman, E. E., and Paytan, A. (2008). Submarine groundwater discharge and nutrient addition to the coastal zone and coral reefs of leeward Hawai’i. Mar. Chem. 109, 355–376. doi: 10.1016/j.marchem.2007.08.009
Tait, D. R., Erler, D. V., Santos, I. R., Cyronak, T. J., Morgenstern, U., and Eyre, B. D. (2014). The influence of groundwater inputs and age on nutrient dynamics in a coral reef lagoon. Mar. Chem. 166, 36–47. doi: 10.1016/j.marchem.2014.08.004
Taylor, P. K., and Yelland, M. J. (2001). The dependence of sea surface roughness on the height and steepness of the waves. J. Phys. Oceanogr. 31, 572–590. doi: 10.1175/1520-04852001031<0572:TDOSSR<2.0.CO;2
Teixeira, J. C., Carvalho, A. C., Carvalho, M. J., Luna, T., and Rocha, A. (2014). Sensitivity of the WRF model to the lower boundary in an extreme precipitation event-Madeira island case study. Nat. Hazards Earth Syst. Sci. 14, 2009–2025. doi: 10.5194/nhess-14-2009-2014
Tóth, B., Weynants, M., Pásztor, L., and Hengl, T. (2017). 3D soil hydraulic database of Europe at 250 m resolution. Hydrol. Process. 31, 2662–2666. doi: 10.1002/hyp.11203
Trancoso, A. R., Braunschweig, F., Chambel Leitão, P., Obermann, M., and Neves, R. (2009). An advanced modelling tool for simulating complex river systems. Sci. Total Environ. 407, 3004–3016. doi: 10.1016/j.scitotenv.2009.01.015
Umlauf, L., and Burchard, H. (2003). A generic length-scale equation for geophysical turbulence models. J. Mar. Res. 61, 235–265. doi: 10.1357/002224003322005087
USDA Soil Conservation Service (1972). National Engineering Handbook, Section 4: Hydrology, Chapters 4–10. Washington, DC: USDA Soil Conservation Service, 762.
Van Der Weijden, C. H., and Pacheco, F. A. L. (2003). Hydrochemistry, weathering and weathering rates on Madeira island. J. Hydrol. 283, 122–145. doi: 10.1016/S0022-1694(03)00245-2
Vieira, I., Barreto, V., Figueira, C., Lousada, S., and Prada, S. (2018). The use of detention basins to reduce flash flood hazard in small and steep volcanic watersheds–a simulation from Madeira Island. J. Flood Risk Manag. 11, S930–S942. doi: 10.1111/jfr3.12285
Wang, A., Wei, B., Xiang, Y., Li, Y., Hassan, M. H. A., Hoe, L. K., et al. (2020). Transport mechanism and fate of terrestrial materials delivered by a small tropical mountainous river: a case study of the Kelantan River, Malaysia. Mar. Geol. 430:106344. doi: 10.1016/j.margeo.2020.106344
Warner, J. C., Armstrong, B., He, R., and Zambon, J. B. (2010). Development of a coupled ocean – atmosphere – wave – sediment transport (COAWST) modeling system. Ocean Modell. 35, 230–244. doi: 10.1016/j.ocemod.2010.07.010
Warrick, J. A., and Farnsworth, K. L. (2017). Coastal river plumes: collisions and coalescence. Prog. Oceanogr. 151, 245–260. doi: 10.1016/j.pocean.2016.11.008
Wu, H., Zhu, J., Shen, J., and Wang, H. (2011). Tidal modulation on the Changjiang River plume in summer. J. Geophys. Res. Ocean. 116, 1–21. doi: 10.1029/2011JC007209
Yankovsky, A. E., Hickey, B. M., and Münchow, A. K. (2001). Impact of variable inflow on the dynamics of a coastal buoyant plume. J. Geophys. Res. Ocean. 106, 19809–19824. doi: 10.1029/2001jc000792
Yuan, Y., Horner-Devine, A. R., Avener, M., and Bevan, S. (2018). The role of periodically varying discharge on river plume structure and transport. Cont. Shelf Res. 158, 15–25. doi: 10.1016/j.csr.2018.02.009
Keywords: oceanic island, Island Mass Effect, extreme precipitation, flash floods, small mountainous rivers, river plumes dynamics, coupled numerical modeling, hydrological modeling
Citation: Rosa A, Cardoso C, Vieira R, Faria R, Oliveira AR, Navarro G and Caldeira RMA (2022) Impact of Flash Flood Events on the Coastal Waters Around Madeira Island: The “Land Mass Effect”. Front. Mar. Sci. 8:749638. doi: 10.3389/fmars.2021.749638
Received: 29 July 2021; Accepted: 03 December 2021;
Published: 06 January 2022.
Edited by:
Yang Yang, Nanjing Normal University, ChinaReviewed by:
Rui Salgado, Universidade de Évora, PortugalAlfredo L. Aretxabaleta, United States Geological Survey (USGS), United States
Serena Blyth Lee, Griffith University, Australia
Copyright © 2022 Rosa, Cardoso, Vieira, Faria, Oliveira, Navarro and Caldeira. This is an open-access article distributed under the terms of the Creative Commons Attribution License (CC BY). The use, distribution or reproduction in other forums is permitted, provided the original author(s) and the copyright owner(s) are credited and that the original publication in this journal is cited, in accordance with accepted academic practice. No use, distribution or reproduction is permitted which does not comply with these terms.
*Correspondence: Alexandra Rosa, YWxleGFuZHJhLnJvc2FAb29tLmFyZGl0aS5wdA==