Abstract
The diel variability of the abundance and cell size of picoplanktonic groups in the central Red Sea was monitored every 2 h in situ on 4 occasions (once per season) from 2015 to 2016. We distinguished Prochlorococcus, low (LF-Syn) and high (HF-Syn) fluorescence Synechococcus, small (Speuk) and large (Lpeuk) picoeukaryotes and two groups of heterotrophic prokaryotes of low (LNA) and high (HNA) nucleic acid content. The diel variability in abundance was less marked than in cell size and more apparent in autotrophs than heterotrophs. Specific growth rates were estimated by an empirical relationship from measurements obtained in bottle incubations of surface and deep samples collected in the winter compared with in situ variations in cell size over 24 h. Autotrophic picoplankton groups generally grew faster (0.23–0.77 d–1) than heterotrophic prokaryotes (0.12–0.50 d–1). Surface to 100 m depth-weighted specific growth rates displayed a clear seasonal pattern for Prochlorococcus, with maxima in winter (0.77 ± 0.07 d–1) and minima in fall (0.52 ± 0.07 d–1). The two groups of Synechococcus peaked in spring, with slightly higher growth rates of LF-Syn (0.57 ± 0.04 d–1) than HF-Syn (0.43 ± 0.04 d–1). Speuk and Lpeuk showed different seasonal patterns, with lower values of the former (0.27 ± 0.02 and 0.37 ± 0.04 d–1, respectively). HNA consistently outgrew LNA heterotrophic prokaryotes, with a higher growth in the epipelagic (0–200 m, 0.36 ± 0.03 d–1) than in the mesopelagic (200–700 m, 0.26 ± 0.03 d–1), while no differences were found for LNA cells (0.19 ± 0.03 d–1 and 0.17 ± 0.02 d–1, respectively). With all data pooled, the mean diel abundances of autotrophic picoplankton in the upper epipelagic and of HNA cells in the epipelagic and mesopelagic layers were significantly correlated with the specific growth rates estimated from cell size variations. Our high-resolution sampling dataset suggests that changes in growth rates underlie the noticeable seasonality of picoplankton recently described in these tropical waters.
Introduction
Picoplankton (i.e., organisms with cell sizes ranging from 0.2 to 2 μm) play an essential role in the productivity and biogeochemical cycles of the oceans and frequently dominate in oligotrophic regions (Olson et al., 1990a; Zubkov et al., 2000; DuRand et al., 2001). Flow cytometry has become the routine tool for measuring their abundance and cellular characteristics. Using this technique, two genera of picocyanobacteria (Prochlorococcus and Synechococcus) and at least one group of picoeukaryotes are easily distinguished by optical properties of light scatter (related to cell size and complexity) and fluorescence (distinguished by the red and orange fluorescence signals due to the presence of chlorophyll a and phycoerythrin pigments). Heterotrophic prokaryotes are in turn almost universally made up of two clusters of differing relative nucleic acid content: low (LNA) and high (HNA) after specific staining (Gasol et al., 1999; Bouvier et al., 2007).
The temporal dynamics of these picoplanktonic groups have been mostly described at fairly broad time-scales, predominantly seasonal studies based on monthly (e.g., Campbell et al., 1997; DuRand et al., 2001; Malmstrom et al., 2010) or, less frequently, weekly (e.g., Worden et al., 2004; Huete-Stauffer and Morán, 2012; Sabbagh et al., 2020) sampling intervals, typically as part of long-term monitoring efforts. Understanding the key biological factors (i.e., growth and mortality rates) driving the changes in picoplankton populations abundance on a time scale of hours requires a high-frequency sampling. So far, only a few studies have investigated picoplankton communities with a higher resolution of multiple samples per day, including the equatorial Pacific (Durand and Olson, 1996; Landry et al., 1996; Blanchot et al., 1997; Vaulot and Marie, 1999), the north Atlantic (Olson et al., 1990b; Sosik et al., 2003; Hunter-Cevera et al., 2014) and the Mediterranean Sea (Jacquet et al., 1998, 2002). Most of them have revealed clear diel changes in Prochlorococcus and Synechococcus abundance, with typically maxima in the late afternoon or early night accompanied by an inverse pattern in cell size (Binder and DuRand, 2002; Lefort and Gasol, 2014), despite considerable variability exists among depths and sampling locations. Although these two variables are undoubtedly connected through synchronized cell division (Durand and Olson, 1996; Vaulot and Marie, 1999), and would be useful for calculating growth rates in the absence of loss processes, in situ changes in cell abundance alone do not allow for an accurate estimation.
Microbial plankton growth rates are commonly measured from short-term production experiments involving the use of radiolabeled substrates and standing stocks (Ducklow, 2000). Another approach is to measure the changes in abundance using experimental setups, either in the presence of the entire microbial community (i.e., including protistan grazers and viruses), yielding estimates of the net growth rate, or after diluting with organism-free water and/or pre-filtering through appropriate pore-size filters for minimizing grazing pressure in order to estimate the specific growth rate (Landry and Hassett, 1982; Kirchman, 2016). Recently, a model-based approach has been used to obtain independent, high-resolution estimates of in situ growth rates from continuous measurements of Synechococcus cell size over the diel cycle (Sosik et al., 2003; Hunter-Cevera et al., 2014). In open ocean tropical and subtropical waters, picoplankton growth rates vary widely depending on the taxa and environmental conditions, but also the approaches used. For instance, Prochlorococcus specific growth rates ranged from 0.32 to 0.76 d–1 in the tropical NE Atlantic Ocean (Partensky et al., 1996; Quevedo and Anadón, 2001; Worden and Binder, 2003), but increased to 1.58 d–1 in the tropical central Atlantic (Agawin and Agustí, 2005). In contrast, Prochlorococcus growth rates were reportedly lower in the north Pacific Ocean with an average of 0.29 ± 0.18 d–1 (Selph et al., 2005) and increasing up to 1.27 d–1 in the upwelling region (Taniguchi et al., 2014; Selph et al., 2016). The growth rate of Synechococcus populations were within the same range of Prochlorococcus in the NE Atlantic Ocean (Quevedo and Anadón, 2001), but higher growth rates have been reported in the tropical Pacific Ocean (1.52 d–1; Taniguchi et al., 2014; Selph et al., 2016). Picoeukaryotes specific growth rates usually vary more than those of cyanobacteria, with an overall range of 0.1 to >1.6 d–1 (Landry et al., 2003; Selph et al., 2005; Taniguchi et al., 2014). Compared with picophytoplankton groups, the specific growth rates of heterotrophic prokaryotes in the upper layers of low latitude waters are usually lower (Kirchman, 2016). Very low values have occasionally been measured (ca. 0.03 to 0.08 d–1) in the western North Atlantic Subtropical waters (Steinberg et al., 2001), but in the absence of predators they may reach up to 1.0 d–1 (e.g., in the Atlantic Ocean, Gasol et al., 2002). The review by Kirchman (2016) provides a mean growth rate of 1.10 ± 0.83 d–1 for heterotrophic prokaryotes, derived from seawater culture experiments conducted over a large geographical scale. Although the above-mentioned values refer to the average heterotrophic bacteria, the LNA and HNA flow cytometric groups typically present different growth rates, with higher values of the former (Lebaron et al., 2001; Longnecker et al., 2005; Morán et al., 2007; Wang et al., 2009).
The Red Sea offers a good opportunity to explore the fine-scale dynamics of picoplankton communities in tropical waters. Its highly saline oligotrophic waters are characterized by the highest surface temperatures of any deep marine basin of the world (even exceeding 35°C in summer, Rasul et al., 2015; Chaidez et al., 2017). The overall low primary productivity becomes more marked in the central region (Raitsos et al., 2013). The abundance of auto- and heterotrophic picoplankton are seemingly lower than in other tropical ecosystems (Al-Otaibi et al., 2020), even in shallow waters subject to human influence (Silva et al., 2019; Sabbagh et al., 2020), likely caused by strong top-down control (Sabbagh et al., 2020). However, our knowledge about the Red Sea microbial plankton in situ diel dynamics is limited and the growth rates of picoplankton remain largely unknown for this marine basin, except only a few recent studies targeting the specific growth rates of heterotrophic bacteria and archaea from incubation bottles (Calleja et al., 2018; Silva et al., 2019) and the net growth rates of phytoplankton along the eastern Red Sea from isotopic labeling method (López-Sandoval et al., 2021).
Here, we provide the first high-resolution study of the diel abundance and cell size of auto- and heterotrophic picoplankton in the central Red Sea covering each of the four seasons. We performed flow cytometric analysis of samples taken at 2 h intervals during 24 h throughout the water column of a 700 m deep station. The objectives were: (i) to examine any systematic diel changes in picoplankton cell abundance and size in order to allow for in situ growth rates estimation in the epipelagic (0–200 m) and mesopelagic layers (200–700 m), and (ii) to assess the relationship between picoplankton growth rates and the observed abundances over the seasonal cycle.
Materials and Methods
Sampling
Sampling took place at a station located 6 km offshore to the northwest of King Abdullah Economic City (KAEC) in Saudi Arabia (latitude 22.46°N, longitude 39.02°E), on board of RV Thuwal. Four high-frequency diel surveys were performed covering the different seasons on a purely astronomical basis: Winter (March 6t–7th, 2016), Spring (March 24–25th, 2015), Summer (September 5–6th, 2015) and Fall (October 26–27th, 2016). Although the lag between the winter and spring samplings (in different years) was of only 3 weeks due to logistic constraints, we preferred to keep the seasonal references since the temporal variations in oceanographic and planktonic variables over the annual cycle at the study site were remarkable (Al-Otaibi et al., 2020). For instance, although our samplings could also be grouped as Winter-Spring and Summer-Fall, neither temperature nor salinity did overlap in Winter and Spring (Figure 1). Each time, sampling started at noon and 13 CTD casts were made in total with a 2 h window. At each cast, seawater was collected from 12 to 16 depths ranging from 5 to 700 m with Niskin bottles attached to a rosette system equipped with either a SeaBird SB9 Plus or an Idronaut 305 CTD for the in situ measurement of temperature and salinity (Supplementary Figure 1A). Chlorophyll a concentration (Chl a) was obtained after filtering 200 ml samples through Whatman GF/F glass fiber filters (25 mm diameter, 0.7 μm nominal pore-size) in the 2015 cruises and sequentially through membrane filters of 20, 2, and 0.2 μm pore-size (IsoporeTM, RTTP, 47 mm diameter) in 2016. The 3 size-fractions (micro-, nano- and picophytoplankton) were summed to obtain total Chl a concentration in the Summer and Fall cruises. Filters were frozen at –80°C until analysis in the laboratory as described in detail in Al-Otaibi et al. (2020).
FIGURE 1
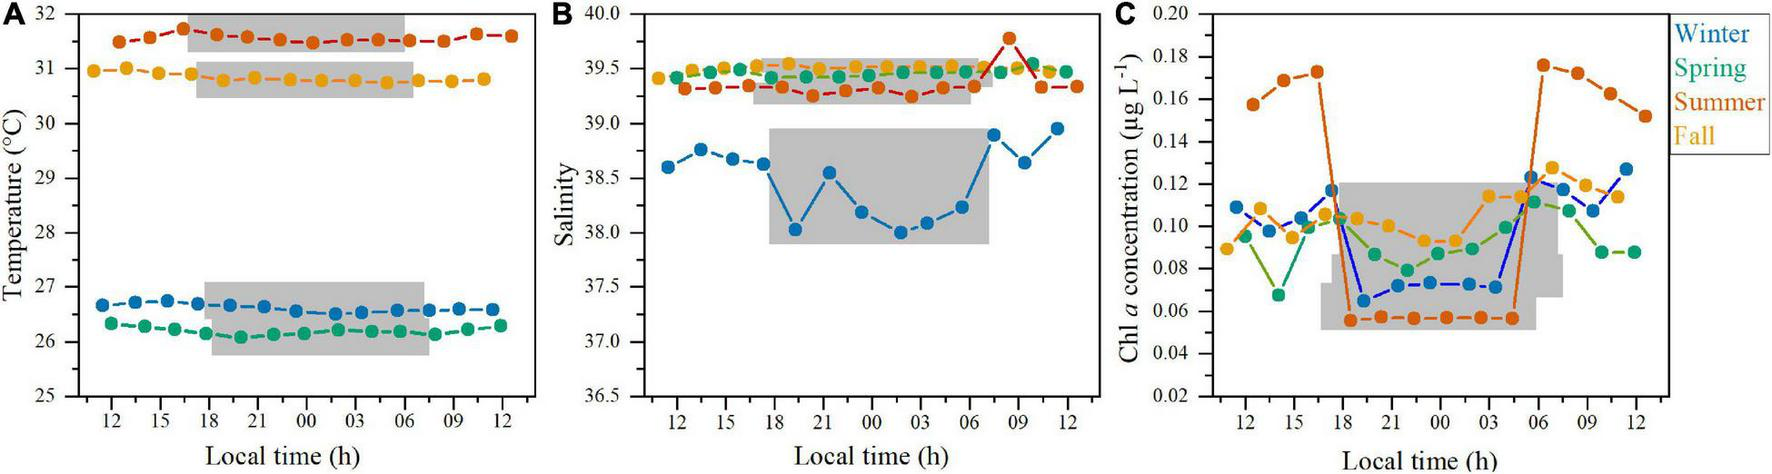
Environmental properties measured every 2 h at the surface of the study station in the four diel cycles. (A) temperature (°C), (B) salinity, and (C) chlorophyll a concentration (μg L–1). The gray shading represents nighttime for each sampling.
Flow Cytometric Analyses
Seawater samples (1.8 mL) were fixed with 1% paraformaldehyde and 0.05% glutaraldehyde for estimating the abundance and cellular characteristics of picoplankton communities, placed in liquid nitrogen and stored at –80°C until analysis. After thawing, aliquots of 600 μL for picophytoplankton and 400 μL for heterotrophic prokaryotes were usually run in a BD FACSCanto II flow cytometer. Before analysis, heterotrophic prokaryotes were stained with 2.5 μmol L–1 of the DNA fluorochrome SYBR Green II (Gasol and Moraìn, 2015). Picoplankton abundances were estimated based on analysis time and the actual flow rates, which were measured daily. Molecular Probes fluorescent latex beads of 1 μm were added to each sample as an internal standard for size and fluorescence measurements, according to Calvo-Díaz and Morán (2006). Full details about the FACSCanto settings can be found in Al-Otaibi et al. (2020). The cytograms were analyzed using FCSExpress 5 software in order to distinguish picocyanobacteria (Prochlorococcus and Synechococcus) and picoeukaryotes based on their orange and red fluorescence and light scatter at 90° or side scatter (SSC) signals. Two groups of heterotrophic prokaryotes were separated based on their relative green fluorescence signal into low (LNA) and high (HNA) nucleic acid content. An empirical calibration between relative SSC and cell diameter was used to determine the cell size of picoplankton groups, as previously described in Calvo-Díaz and Morán (2006). Spherical shape was assumed for estimating the biovolume for all the groups.
Experimental Incubations for Estimating Specific Growth Rates From Cell Size Changes
During the winter sampling, 10 L seawater was collected from the surface (5 m) and from 550 m depth (i.e., the depth with the strongest acoustic signal of the deep scattering layer formed by mesopelagic fish during light hours, Calleja et al., 2018; Morán et al., 2022) at midnight (Supplementary Figure 1B). Water was pre-filtered through pre-combusted Whatman GF/C filters (1.2 μm) in order to remove protistan grazers. A total of 3 bottles with 2 L each were incubated for 8 days in Percival Twin Chamber I-22LLVL vertical incubators, which mimicked the in situ temperature (± 0.1°C, as continuously recorded by iBWetLand 22L, AlphaMach temperature loggers) and light regimes (white fluorescent lights providing ca. 115 μmol photons m–2 s–1 measured by a LI-COR Biosciences photosynthetically active radiation sensor, in a 11:13 h light:dark for the surface sample and in darkness for the 550 m depth one). Two replicates of 1.8 mL were sampled 1–2 times per day and preserved in 1% paraformaldehyde and 0.05% glutaraldehyde until analysis by flow cytometry as previously described. After plotting the dynamics of each group during the incubation, the specific growth rate was calculated as the slope of the ln-transformed abundance vs. time for the first period of exponential growth, which averaged 2.7 days (from 1.5 days for Prochlorococcus and the two groups of Synechococcus to 6.3 days for LNA prokaryotes from 550 m). Although viruses were not removed in this experimental setup, these relatively short periods likely precluded a major role of viral infections in the different groups’ growth dynamics. Our specific growth rate estimates should be considered conservative in that case. The coefficients of variation of the cell size (CV, %) measured over the full 24 h in situ were then compared with the estimated specific growth rates of Prochlorococcus, low (LF-Syn) and high (HF-Syn) phycoerythrin fluorescence of Synechococcus, small picoeukaryotes, LNA and HNA prokaryotes derived from the incubations.
Statistical Analysis
Mean values of cell abundance and size of each picoplankton group were calculated for the first 12 sampling points along each diel cycle (the 13th, corresponding again to noon, was excluded). The coefficient of variation of the mean (CV, %) was used to assess the diel variability of both variables (abundance and size) for each depth. Depth-weighted averages (from 0 to 100 m for autotrophs and from 0 to 200 m and from 200 to ca. 700 m for heterotrophs) were calculated by the trapezoidal method. Since normal data distribution and homoscedasticity were usually not met, a Kruskal-Wallis analysis of variance was employed to detect significant differences in abundance and cell size between the different seasons. The multiple comparison Dunn’s test was used to determine the cases with significant differences. Wilcoxon signed rank tests were used to determine whether mean day and night values were significantly different in the vertical profiles of abundance and cell size. All tests were performed with the OriginPro software. The linear regression between the changes in cell size along the 24 h and the estimated specific growth rates from the winter experiment was performed according to the ordinary least-squares (OLS) or Model I method, after checking for normality of both datasets (Shapiro-Wilk goodness of fit, p = 0.21 for cell size and p = 0.14 for specific growth rates).
Results
Diel Variations in Environmental Variables, Picoplankton Abundance, and Cell Size
Diel variations in temperature, salinity and chlorophyll a (Chl a) concentration at the surface of the study site during the four periods are shown in Figure 1. Seasonal differences were more conspicuous for temperature, which ranged from 26.3 ± 0.1°C (SD) in spring to 31.5 ± 0.2°C in summer, while low variability was found between the day and night values (CVs = 0.3–0.7%, Figure 1A). Surface salinity displayed lower values in winter (38.4 ± 0.4), with a noticeable diel pattern, but was more similar in the remaining periods (ca. 39.5, Figure 1B). Chl a showed higher variability at the diel scale (CVs = 11.0 – 49.4%), with the highest values found in summer during the day (0.17 ± 0.01 μg L–1) and mean values in the other periods were more similar (ca. 0.10 μg L–1, Figure 1C). Seasonal differences in these environmental variables were significant (Supplementary Table 1, p < 0.001), but differences between day and night time were not.
Diel variations in autotrophic and heterotrophic picoplankton abundance at the surface were not consistent (Figure 2), similarly to the rest of the water column (see below). Prochlorococcus mean abundance ranged from 2.34 ± 0.76 × 10⁴ cells mL–1 in summer to 6.00 ± 1.13 × 10⁴ cells mL–1 in spring, but showed high diel variations (CVs = 18.9–32.5%, Supplementary Table 1 and Figures 2A–D). Synechococcus cells dominated autotrophic picoplankton in the four cycles (56–70% of total picophytoplankton), but a seasonal shift was found between the two groups of differing phycoerythrin content, with dominance of LF-Syn in winter (5.36 ± 0.82 × 10⁴ cells mL–1) and spring (4.03 ± 1.63 × 10⁴ cells mL–1), while HF-Syn clearly dominated in summer (4.26 ± 1.16 × 10⁴ cells mL–1) and fall (5.14 ± 1.13 × 10⁴ cells mL–1, Figures 2E–H). The two populations of Synechococcus tended to show similar diel dynamics, with abundance peaking at night, but LF-Syn was more variable than HF-Syn (CVs = 15.3–40.6% and 15.6–27.3%, respectively) (Supplementary Table 1 and Figures 2E–H). The abundances of the two groups of picoeukaryotes were as expected consistently lower, with values ranging from 1.40 to 2.13 × 10³ cells mL–1 for Speuk and 2.24 to 3.17 × 10² cells mL–1 for Lpeuk, respectively, (Figures 1I–L). Picoeukaryotes abundances showed higher diel variations than picocyanobacteria, especially Lpeuk (CVs 32.7–55.9%, Supplementary Table 1 and Figures 1A–L). LNA and HNA heterotrophic prokaryotes were one order of magnitude more abundant than cyanobacteria. LNA cells (0.65–2.26 × 10⁵ cells mL–1) outnumbered HNA cells (0.50–1.92 × 10⁵ cells mL–1) at the surface, but the variability of HNA cells (25.0–36.0%) was slightly higher than LNA cells (18.9–31.8%, Figures 2M–P).
FIGURE 2
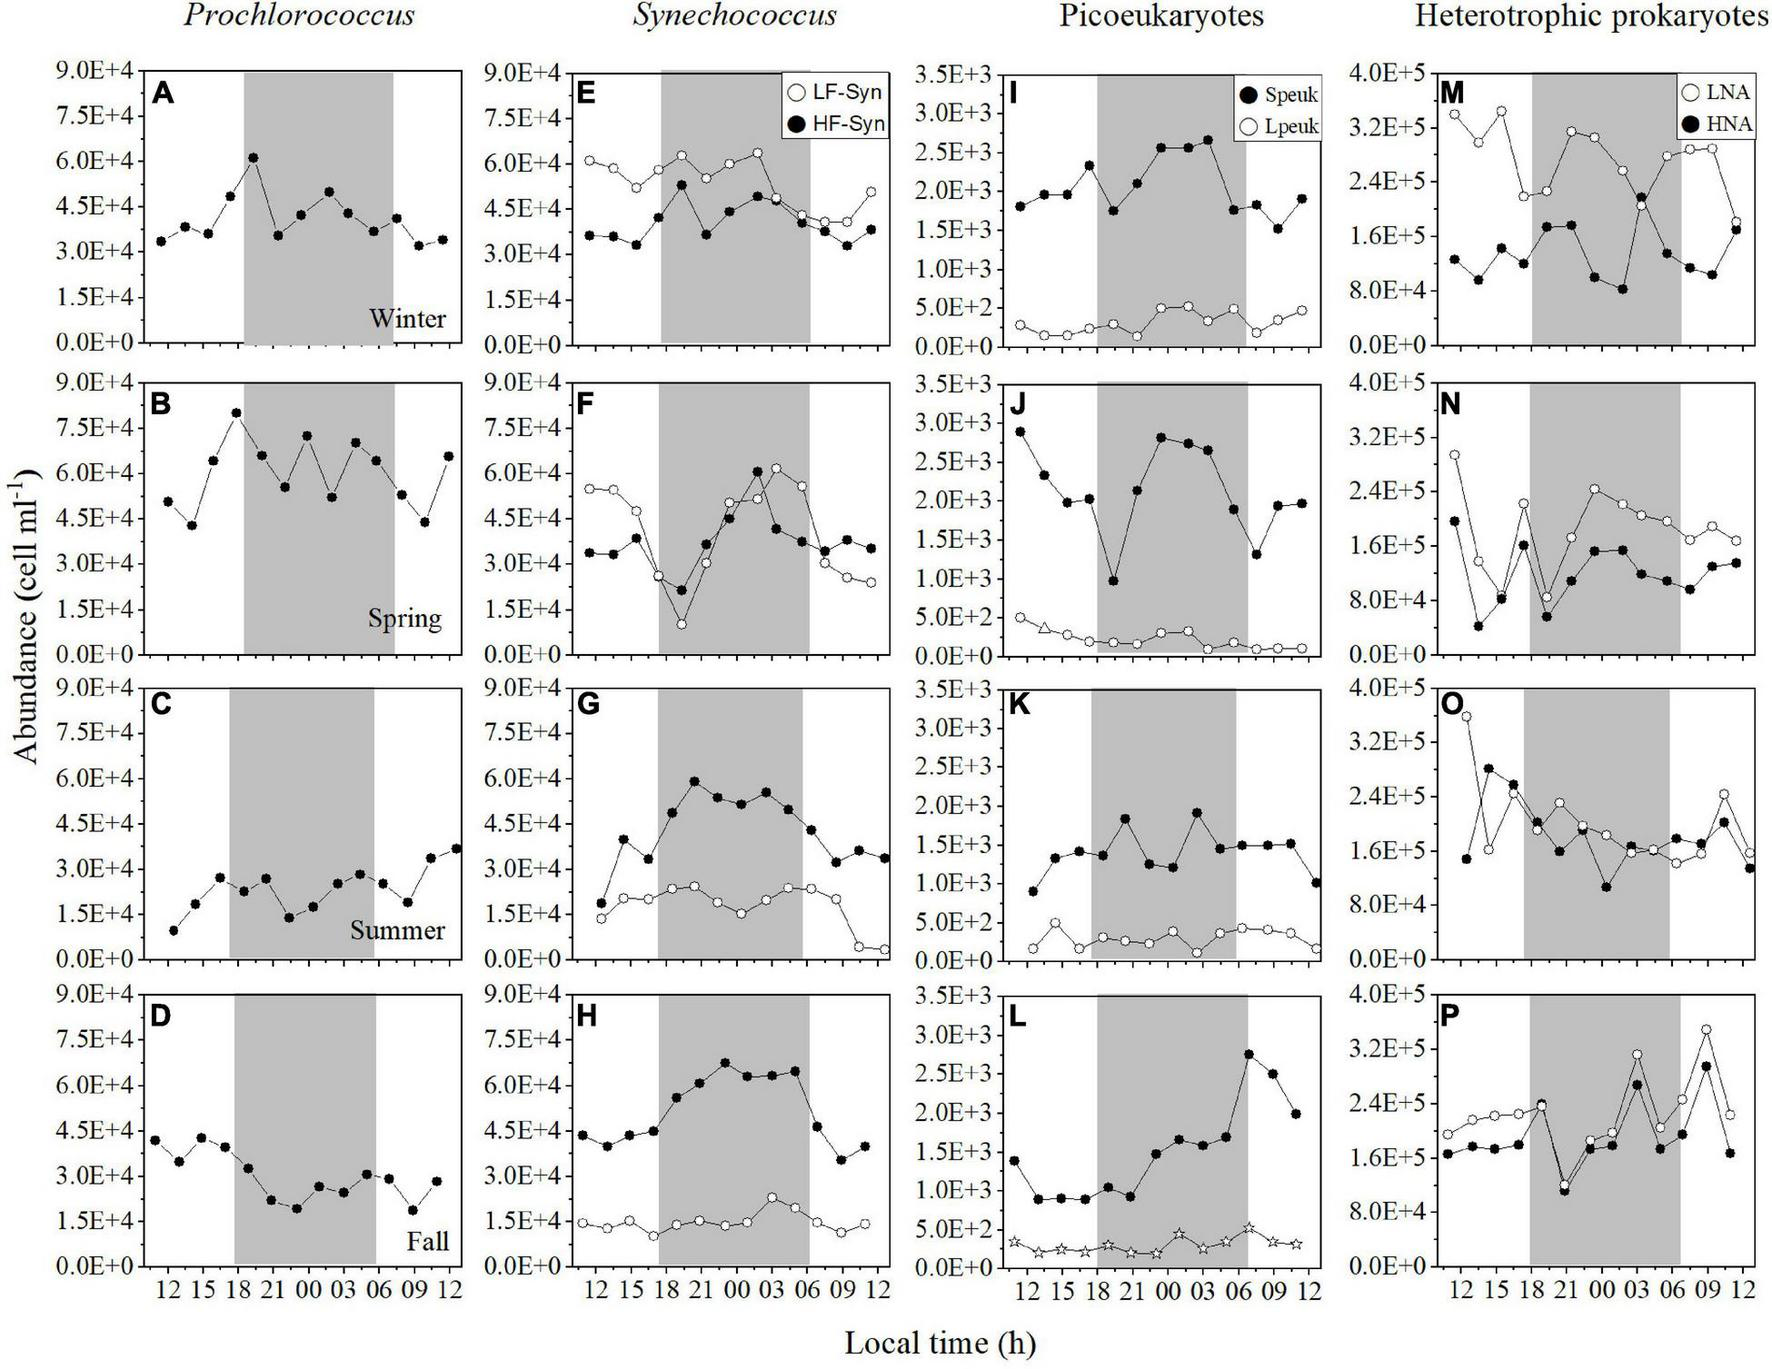
Diel variation in picoplankton abundance at the surface of the study site in winter, spring, summer, and fall. Prochlorococcus(A–D) low (LF-Syn, open circles) and high (HF-Syn, filled circles) fluorescence Synechococcus(E–H), small (Speuk, filled circles) and large (Lpeuk, open circles) picoeukaryotes (I–L), low (LNA, open circles), and high (HNA, filled circles) nucleic acid content heterotrophic prokaryotes (M–P). The gray shading represents nighttime.
Contrary to abundance, the cell size of surface picocyanobacteria presented clear and consistent diel periodicities, with biovolume increasing during the day and decreasing early at night at each sampling period (Figures 3A–H). The precise timing of the decrease in cell size differed slightly between Prochlorococcus and Synechococcus (Figures 3A–H). Overall, cell size ranged from 0.04 to 0.11 μm3 for Prochlorococcus, from 0.08 to 0.21 μm3 for LF-Syn and from 0.10 to 0.28 μm3 for HF-Syn and (Figures 3A–H). Diel patterns were less marked in Speuk (1.19–1.59 μm3) and Lpeuk (3.04–4.06 μm3, Figures 3I–M) and no obvious trends were observed either for LNA (0.02–0.03 μm3; Figures 3M–P) or HNA heterotrophic prokaryotes (0.03–0.05 μm3; Figures 3M–P). Considering the cell size CVs of each group and sampling period, there was a clear difference between the low variability of heterotrophic prokaryotes (LNA, 3.3–11.2%; HNA, 11.4–19.2%) and the more variable picocyanobacteria (Prochlorococcus, 24.6–36.9%; LF-Syn, 18.3–36.9%; HF-Syn, 16.9–26.0%). Surface picoeukaryotes cell size CVs were similar to those of HNA cells (Speuk, 7.03–14.7%; Lpeuk, 9.6–18.9%, Supplementary Table 1).
FIGURE 3
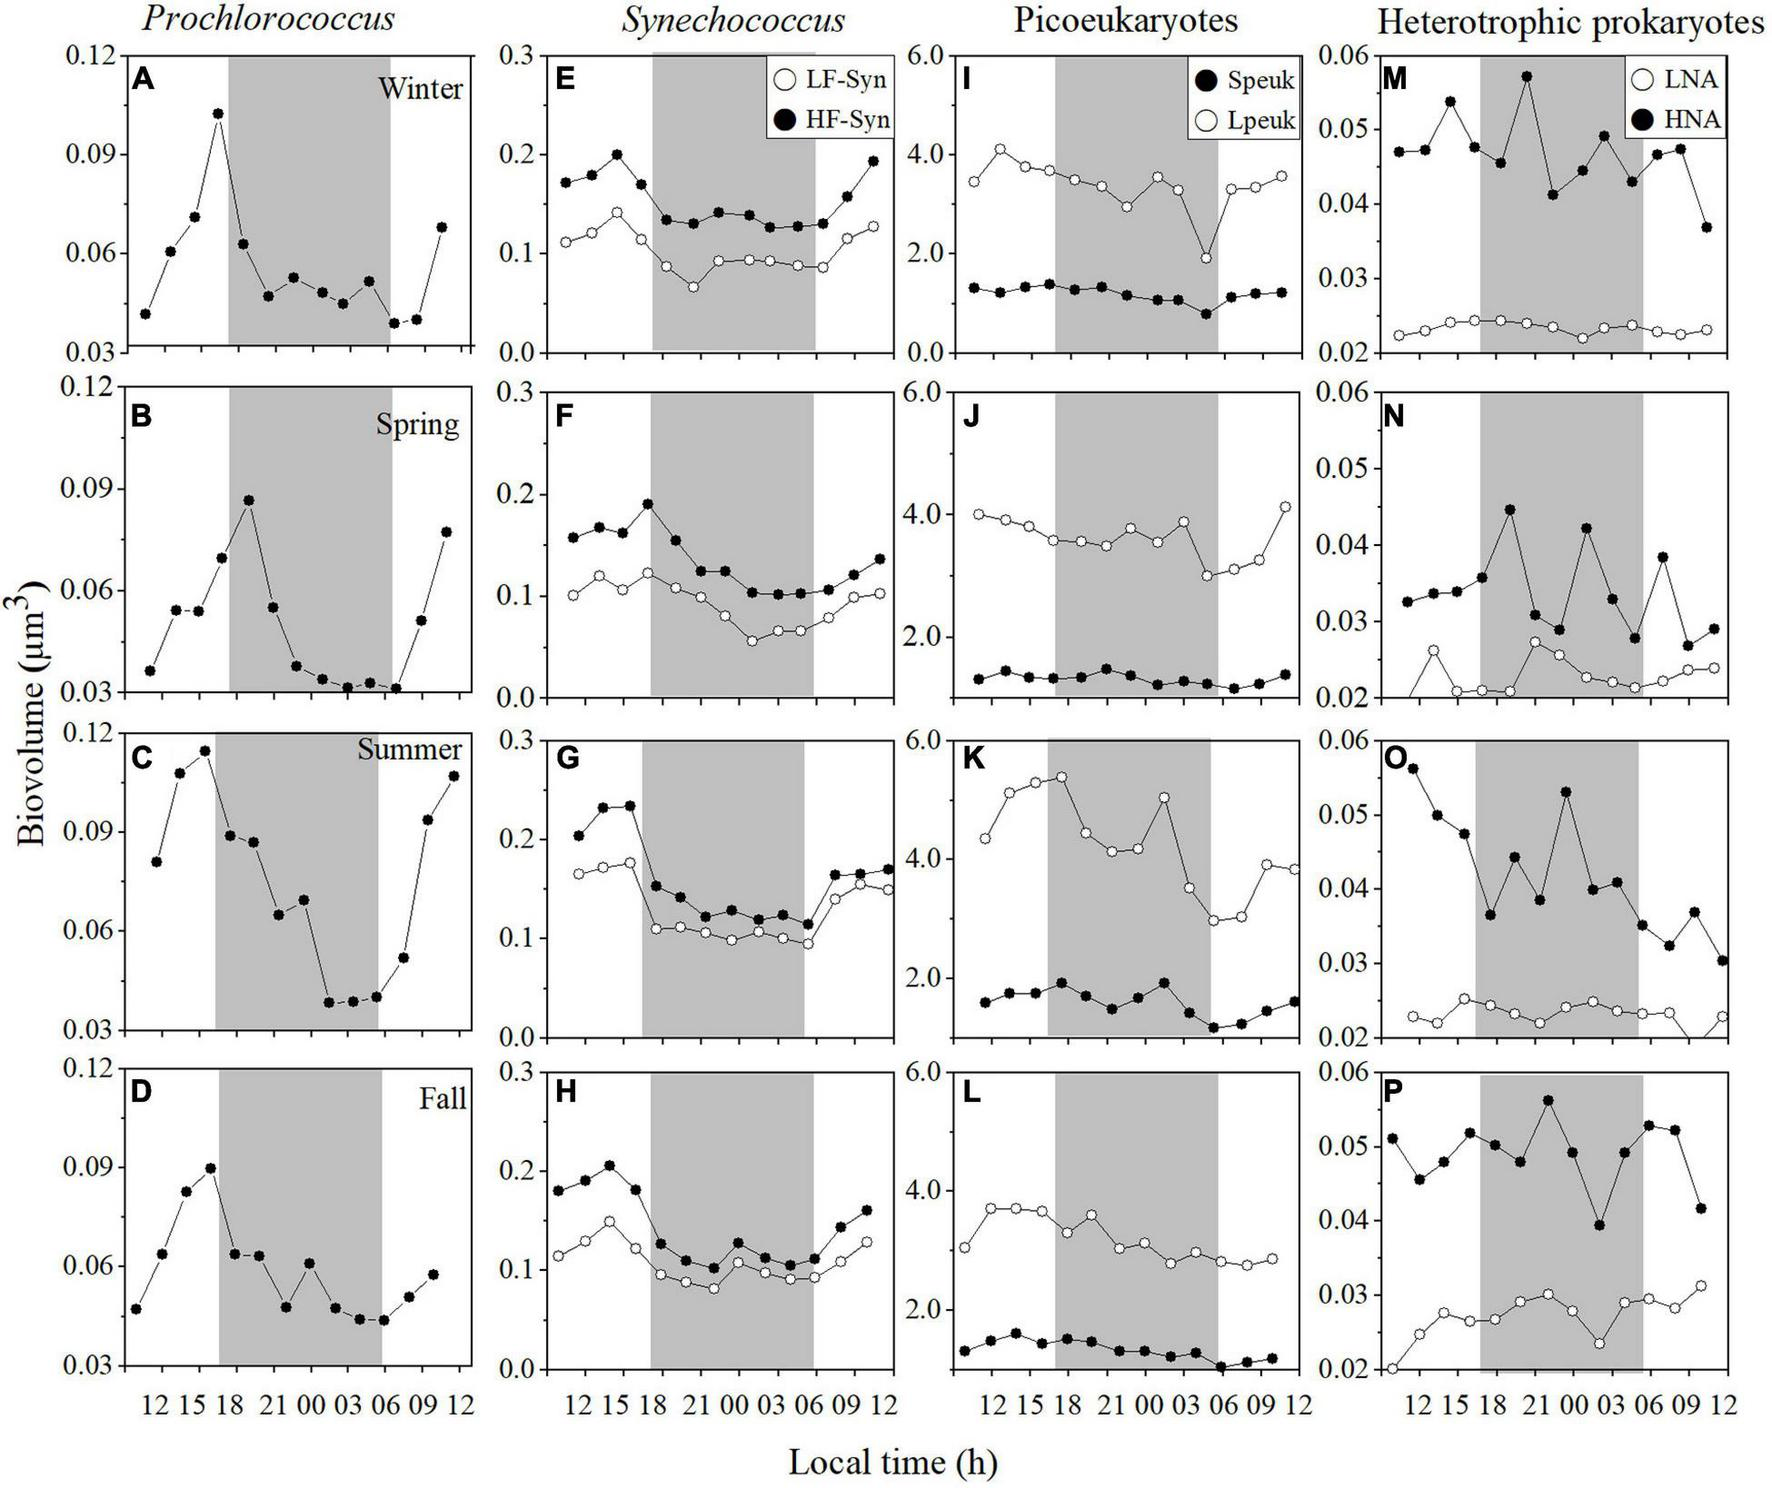
Diel variation in picoplankton cell size at the surface of the study site in winter, spring, summer, and fall. Prochlorococcus(A–D) low (LF-Syn, open circles) and high (HF-Syn, filled circles) fluorescence Synechococcus(E–H), small (Speuk, filled circles) and large (Lpeuk, open circles) picoeukaryotes (I–L), low (LNA, open circles), and high (HNA, filled circles) nucleic acid content heterotrophic prokaryotes (M–P). The gray shading represents nighttime.
Similar to the surface values presented above, the abundance and cell size of the different groups varied considerably over 24 h throughout the different sampling depths. The vertical distributions of mean abundance and cell size during daytime and nighttime are presented in Supplementary Figures 2, 3, respectively. There were no consistently, significant differences between the two periods for either abundance or cell size, in spite of the conspicuous diel pattern for the latter. Since picophytoplankton virtually disappeared below 100 m, Table 1 summarizes the 0–100 m depth-weighted abundances and cell sizes of the autotrophic groups. Even with only four samples, autotrophic picoplankton presented clear seasonal differences as shown in detail in Al-Otaibi et al. (2020) and (Table 1). The coefficient of variation of cell size was systematically lower than that of abundance for all groups (Supplementary Figures 2, 3 and Table 1). Prochlorococcus showed the highest variation in cell size regardless of the season (CVs = 22.3–33.7%), followed by LF-Syn (16.1–23.3%) and the lowest was 4.2–10.4% for LNA prokaryotes (Table 1). Table 2 shows the depth-weighted abundances and cell sizes of heterotrophic prokaryotes in the two zones, epipelagic (0–200 m) and mesopelagic (200–700 m). The mean abundance of LNA and HNA prokaryotes presented different seasonality in the epipelagic, with maximum values recorded in winter and fall for LNA and in summer and fall for HNA (Table 2). Seasonal patterns of LNA and HNA cells were similar in the mesopelagic layer, with lower abundances in spring and 1.4- to 2.0-fold higher in winter and fall (Table 2). The variability of LNA and HNA cell abundances was higher in the epipelagic than in the mesopelagic layer (Table 2). The variations of LNA and HNA mean cell size were less marked than those of abundance (Table 2) and did not show any conspicuous seasonal pattern.
TABLE 1
| Winter | Spring | Summer | Fall | ||
| Abundance | Prochlorococcus (104 cell ml–1) | 3.39 ± 0.83 (27.0%) | 6.35 ± 1.26 (31.0%) | 7.40 ± 2.34 (27.3%) | 5.03 ± 1.17 (40.1%) |
| LF-Syn (104 cell ml–1) | 2.90 ± 0.77 (61.7%) | 2.34 ± 1.18 (54.8%) | 1.08 ± 0.21 (52.7%) | 1.08 ± 0.30 (39.4%) | |
| HF-Syn (104 cell ml–1) | 2.38 ± 0.57 (33.1%) | 1.74 ± 0.51 (36.8%) | 2.50 ± 1.29 (49.6%) | 2.75 ± 0.97 (87.3%) | |
| Speuk (104 cell ml–1) | 0.29 ± 0.12 (41.1%) | 0.22 ± 0.77 (34.6%) | 0.42 ± 0.19 (38.5%) | 0.35 ± 0.12 (62.0%) | |
| Lpeuk (104 cell ml–1) | 0.04 ± 0.00 (53.7%) | 0.02 ± 0.00 (63.0%) | 0.03 ± 0.00 (47.9%) | 0.06 ± 0.00 (68.6%) | |
| Cell size | Prochlorococcus (μm3) | 0.21 ± 0.06 (33.7%) | 0.21 ± 0.03 (26.1%) | 0.26 ± 0.04 (25.1%) | 0.23 ± 0.03 (22.3%) |
| LF-Syn (μm3) | 0.16 ± 0.03 (23.3%) | 0.10 ± 0.03 (24.9%) | 0.15 ± 0.03 (19.6%) | 0.12 ± 0.02 (16.1%) | |
| HF-Syn (μm3) | 0.28 ± 0.04 (15.4%) | 0.36 ± 0.07 (18.2%) | 0.34 ± 0.05 (16.7%) | 0.29 ± 0.04 (16.0%) | |
| Speuk (μm3) | 1.50 ± 0.6 (12.4%) | 1.53 ± 0.2 (10.3%) | 1.67 ± 0.14 (9.2%) | 1.37 ± 0.16 (11.8%) | |
| Lpeuk (μm3) | 3.3 ± 0.2 (19.0%) | 3.1 ± 0.5 (13.3%) | 4.1 ± 0.7 (19.0%) | 2.7 ± 0.3 (11.4%) |
Depth-weighted (0–100 m) averages of autotrophic picoplankton abundances and cell sizes with the corresponding coefficients of variation (%) between parentheses in winter, spring, summer, and fall.
TABLE 2
| Winter | Spring | Summer | Fall | |||
| Abundance | Epipelagic (0–200 m) | LNA (105 cell ml–1) | 1.39 ± 0.27 (19.1%) | 0.87 ± 0.29 (44.0%) | 1.03 ± 0.29 (37.8%) | 1.33 ± 0.34 (45.0%) |
| HNA (105 cell ml–1) | 0.87 ± 0.20 (20.7%) | 0.72 ± 0.27 (46.6%) | 1.30 ± 0.29 (34.0%) | 1.25 ± 0.29 (40.8%) | ||
| Mesopelagic (200–700 m) | LNA* (105 cell ml–1) | 0.46 ± 0.09a (14.8%) | 0.25 ± 0.07b (28.5%) | 0.34 ± 0.06a (17.3%) | 0.45 ± 0.06a (10.8%) | |
| HNA* (105 cell ml–1) | 0.41 ± 0.08a,b (14.5%) | 0.29 ± 0.09a (29.1%) | 0.47 ± 0.09a,b (16.0%) | 0.57 ± 0.08b (11.5%) | ||
| Cell size | Epipelagic (0–200 m) | LNA (μm3) | 0.02 ± 0.00 (4.9%) | 0.02 ± 0.00 (9.7%) | 0.02 ± 0.00 (5.9%) | 0.04 ± 0.00 (9.0%) |
| HNA (μm3) | 0.05 ± 0.01 (17.6%) | 0.04 ± 0.01 (14.4%) | 0.04 ± 0.01 (17.5%) | 0.05 ± 0.01 (11.5%) | ||
| Mesopelagic (200–700 m) | LNA (μm3) | 0.02 ± 0.00 (4.1%) | 0.02 ± 0.00 (8.0%) | 0.02 ± 0.00 (4.3%) | 0.02 ± 0.00 (8.1%) | |
| HNA (μm3) | 0.04 ± 0.01 (12.2%) | 0.03 ± 0.00 (7.6%) | 0.04 ± 0.01 (8.5%) | 0.03 ± 0.00 (8.8%) |
Depth-weighted averages of heterotrophic picoplankton abundances and cell sizes in the epipelagic (0–200 m) and mesopelagic (200–700 m) with the corresponding coefficients of variation (%) between parentheses in winter, spring summer, and fall.
Stars and superscript letters indicate significant differences between seasons (Kruskal-Wallis analysis and Dunn’s test; *p < 0.05).
Microbial Groups Dynamics in the Experimental Incubations
All autotrophic picoplankton groups were able to grow in the winter incubation experiments. Initial abundances were 2.85 × 10³ cells mL–1 for Prochlorococcus, 4.33 × 10³ cells mL–1 for LF-Syn, 3.47 × 10³ cells mL–1 for HF-Syn and 2.85 × 10² cells mL–1 for Speuk (Supplementary Figures 4A–C). Although the initial cell concentrations were similar for most groups, their growth curves were quite different, as well as the duration of the exponential growth phases (Supplementary Figures 4A–C). Prochlorococcus and LF-Syn reached a comparatively higher carrying capacity (8.33 × 10³ ± 2.69 × 10² and 1.02 × 10⁴ ± 2.19 × 10³ cells mL–1, respectively) than HF-Syn (6.10 ± 2.29 × 10³ cells mL–1), while Speuk were able to grow for a longer period (until 4.25 days), reaching a maximum abundance of 1.57 ± 0.16 × 10³ cells mL–1 (Supplementary Figures 4A–C). The dynamics of the LNA and HNA heterotrophic prokaryotes differed clearly between the surface and 550 m (Supplementary Figures 4D,E).
Autotrophic picoplankton always grew faster than heterotrophs, with the highest specific growth rates corresponding to LF-Syn (0.86 ± 0.03 d–1) and the lowest to HF-Syn (0.19 ± 0.03 d–1) (Supplementary Figure 5A). HNA and LNA showed consistent differences in their specific growth rates at both depths, with higher growth rates of the former both at the surface (0.25 ± 0.02 and 0.11 ± 0.04 d–1, respectively) and 550 m depth (0.17 ± 0.03 and 0.05 ± 0.01 d–1, respectively) (Supplementary Figure 5B).
Specific Growth Rate Estimates
The changes in cell size of the epipelagic and mesopelagic autotrophic and heterotrophic groups monitored in situ for 24 h reflected their specific growth rates estimated in the concurrent laboratory incubations of the winter sampling (Figure 4). CVs of cell size ranged from 2.5 (for LNA cells at 550 m) to 37.0% (for LF-Syn). The fitted linear regression between both variables was able to explain 85% of the variance in specific growth rates. This model was subsequently applied to estimate the specific growth rates from the cell size CVs for each of the sampling periods and depths.
FIGURE 4
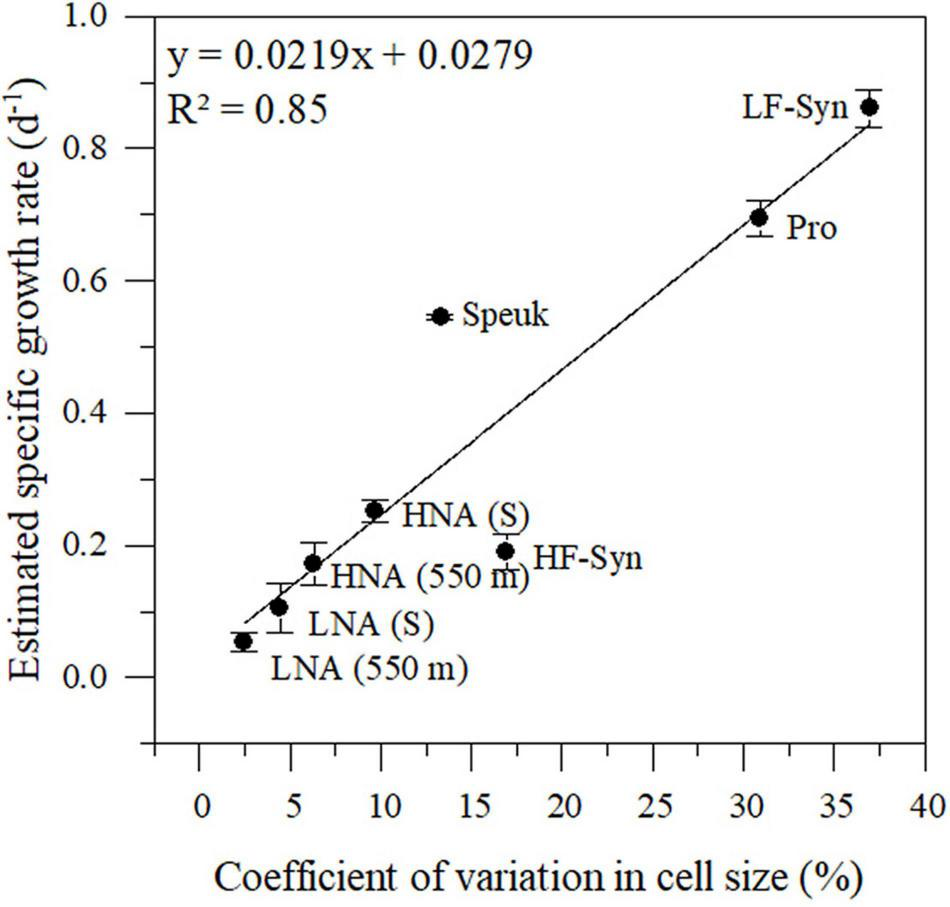
Relationship between the diel coefficient of variation in cell size measured over 24 h from in situ samples and the estimated specific growth rate from the incubation experiments conducted in winter. Pro, Prochlorococcus; LF-Syn, low phycoerythrin fluorescence Synechococcus, HF-Syn, high phycoerythrin fluorescence Synechococcus; Speuk, small picoeukaryotes; LNA, low nucleic acid content; HNA, high and low nucleic heterotrophic prokaryotes. Samples were collected from the surface (S) and 550 m depth. See details in the main text.
The vertical distribution of specific growth rates resembled that of abundance for Prochlorococcus, systematically peaking at the deep chlorophyll maximum (DCM) with a rather invariable value of ca. 0.80 d–1 except in winter (Figure 5A). The vertical distribution of the LF-Syn and HF-Syn specific growth rates were less coupled to their abundance distribution (Figures 5B,C). LF-Syn specific growth rates peaked at the depth of maximum detection (ca. 50–70 m), with values ranging from 0.41 to 1.12 d–1 (Figure 5B). The specific growth rate of HF-Syn slightly decreased from the surface to 100 m, with values ranging from 0.40 to 0.60 d–1 and from 0.22 to 0.50 d–1, respectively (Figure 5C). The specific growth rate of Speuk and Lpeuk did not show clear vertical patterns, with values ranging from 0.13 to 0.43 d–1 and from 0.12 to 0.64 d–1, respectively (Figures 5D,E). The specific growth rate of LNA cells exhibited a more homogeneous vertical distribution, with values generally lower than 0.20 d–1, while HNA prokaryotes slightly increased from the surface (overall range 0.28–0.45 d–1) to the DCM (0.36–0.51 d–1) and remained quite stable within the mesopelagic layer at values of ca. 0.25 d–1 except in winter, with a higher mean value of 0.41 d–1 (Figures 6A,B).
FIGURE 5
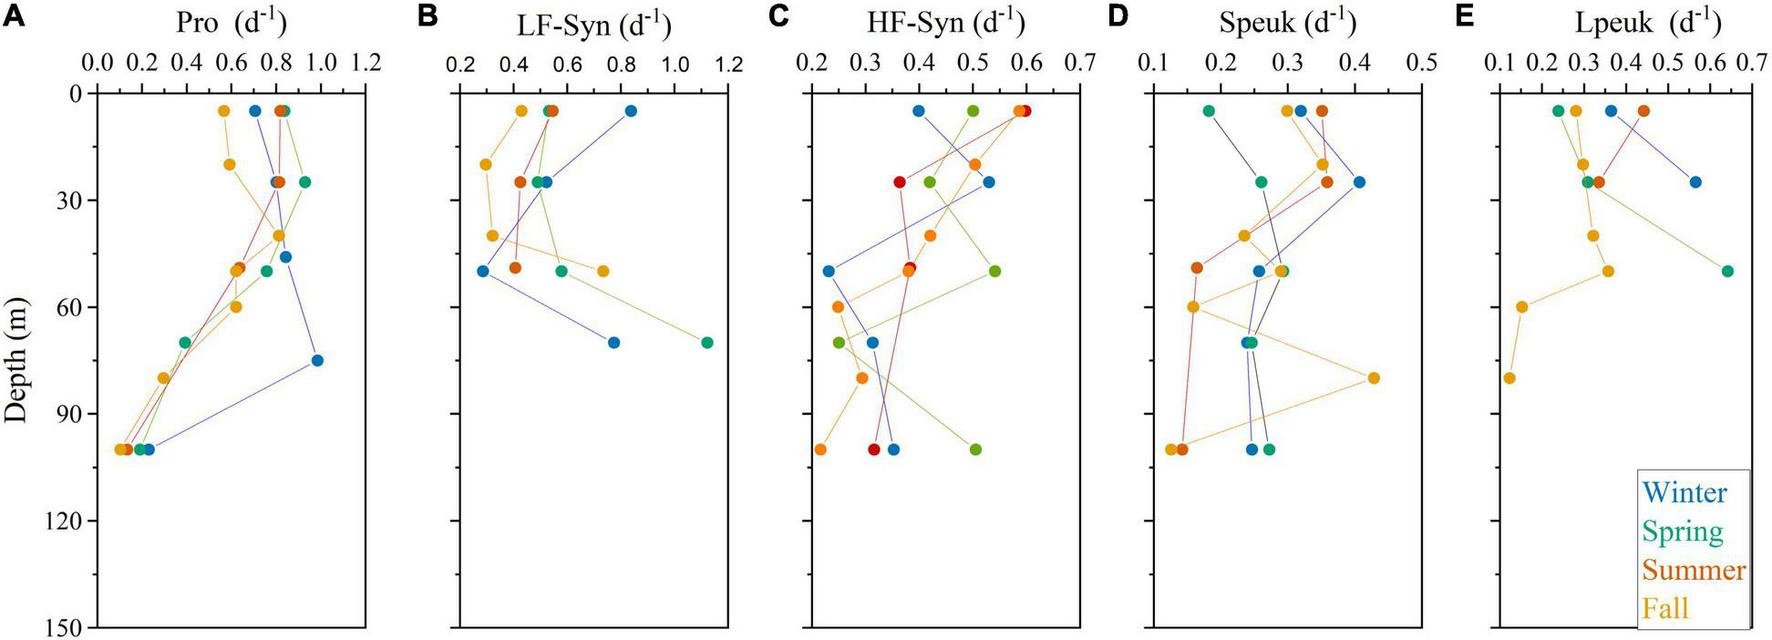
Vertical profile of the estimated specific growth rates of Prochlorococcus (Pro, A), low (LF-Syn, B) and high (HF-Syn, C) fluorescence Synechococcus, small (Speuk, D), and large (Lpeuk, E) picoeukaryotes in the four sampling cycles. Note that different scales were used.
FIGURE 6
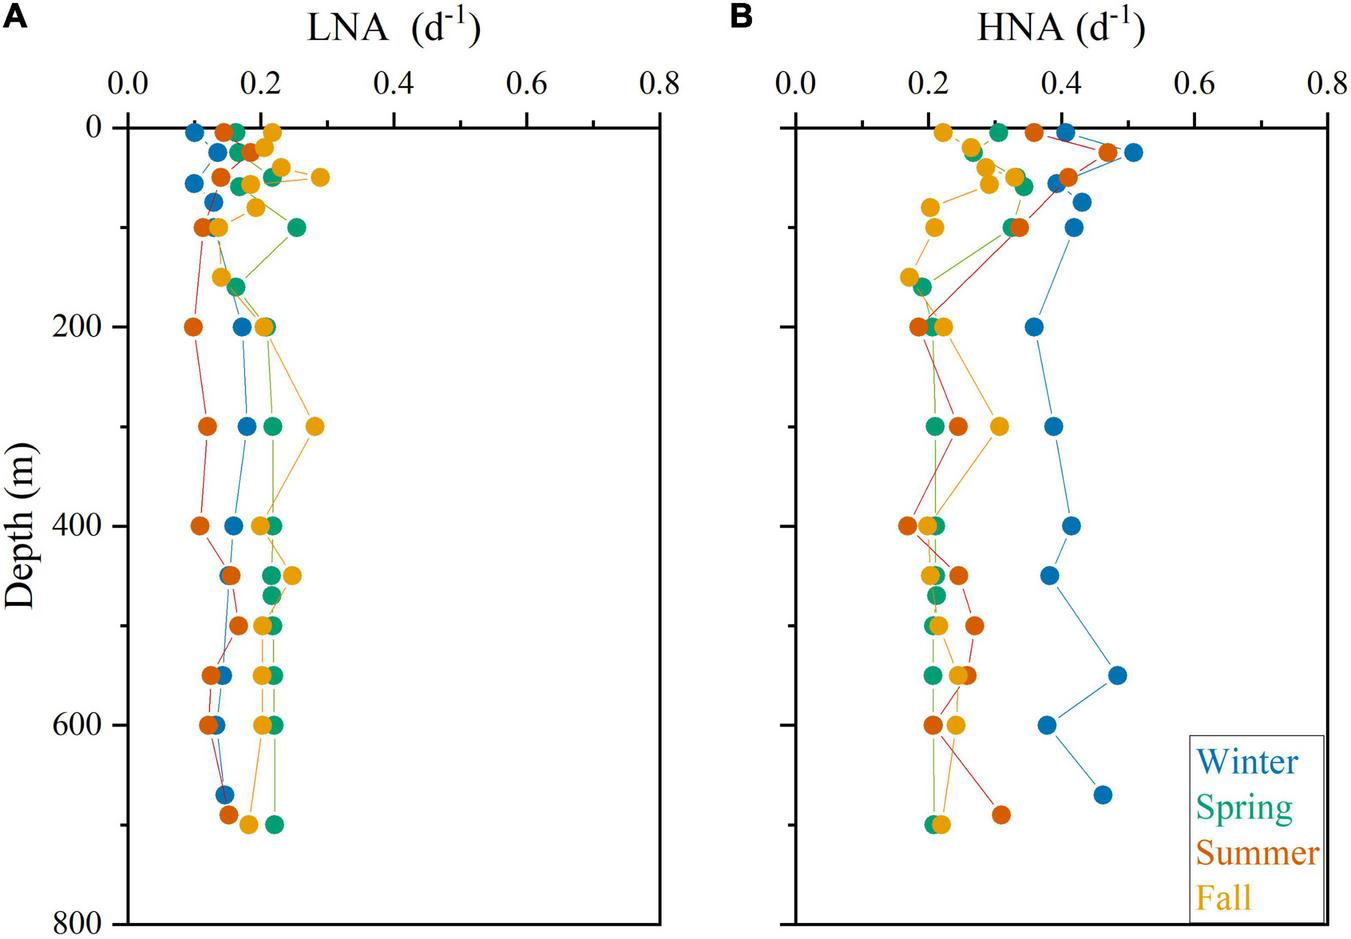
Vertical profile of the estimated specific growth rates of low (LNA, A) and high (HNA, B) nucleic acid heterotrophic prokaryotes in the four sampling cycles.
Figure 7 shows the seasonal of picophytoplankton and heterotrophic prokaryotes specific growth rates averaged for the different layers of the study site, the upper epipelagic (0–100 m) for picophytoplankton and the epipelagic (0–200 m) and mesopelagic (200–700 m) for heterotrophic prokaryotes. Prochlorococcus cyanobacteria consistently exhibited the highest mean specific growth rates, ranging from 0.52 ± 0.07 to 0.77 ± 0.07 d–1 (Figure 7A). The two groups of Synechococcus showed similar patterns with consistently higher values of LF-Syn (from 0.38 ± 0.05 to 0.57 ± 0.04 d–1) than HF-Syn (from 0.37 ± 0.04 to 0.43 ± 0.04 d–1) (Figure 7A). Remarkably, the two groups of picoeukaryotes distinguished according to their size showed an inverse pattern to that of the two Synechococcus clusters with higher values of Lpeuk (0.25 ± 0.03 – 0.44 ± 0.07 d–1) than Speuk (0.23 ± 0.04 – 0.30 ± 0.03 d–1) except in Fall (Figure 7A). The estimated specific growth rate of HNA prokaryotes in the epipelagic was higher (0.28 ± 0.01 – 0.54 ± 0.04 d–1) than in the mesopelagic layer (0.20 ± 0.02 – 0.34 ± 0.02 d–1), while LNA mean seasonal values were very similar in both layers of (0.14 ± 0.01 – 0.25 ± 0.02 in the epi- and 0.13 ± 0.01 – 0.21 ± 0.02 d–1 in the mesopelagic) (Figure 7B).
FIGURE 7
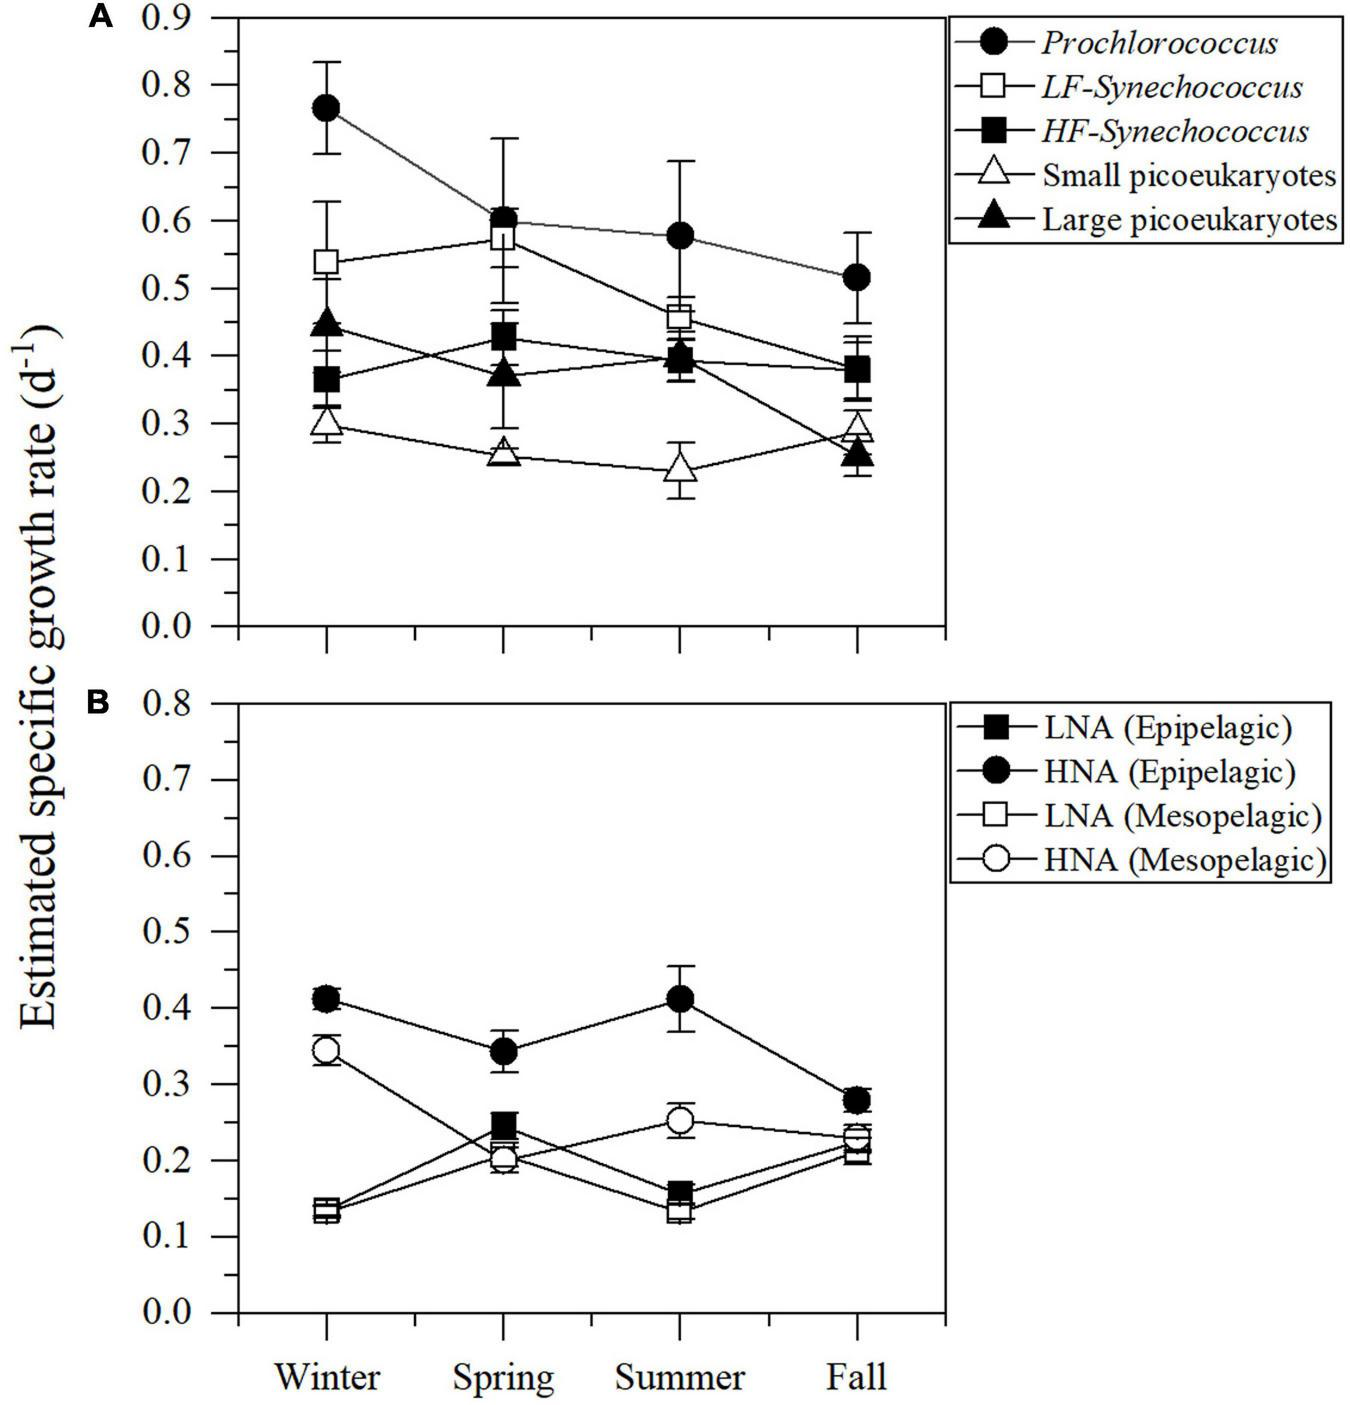
Depth-weighted averages of the estimated specific growth rates of autotrophic picoplankton groups for the upper 100 m (A) and heterotrophic prokaryotes for the epi- (0–200 m) and mesopelagic (200–700 m) layers (B).
With all epipelagic data pooled, we found a positive relationship between the estimated specific growth rates and the mean diel abundances of picophytoplankton (Figure 8). The correlation between specific growth rate and mean diel abundance was also significant for HNA heterotrophic prokaryotes when pooling data from the epi- and mesopelagic layers, but not for LNA cells (Figures 8B,C).
FIGURE 8
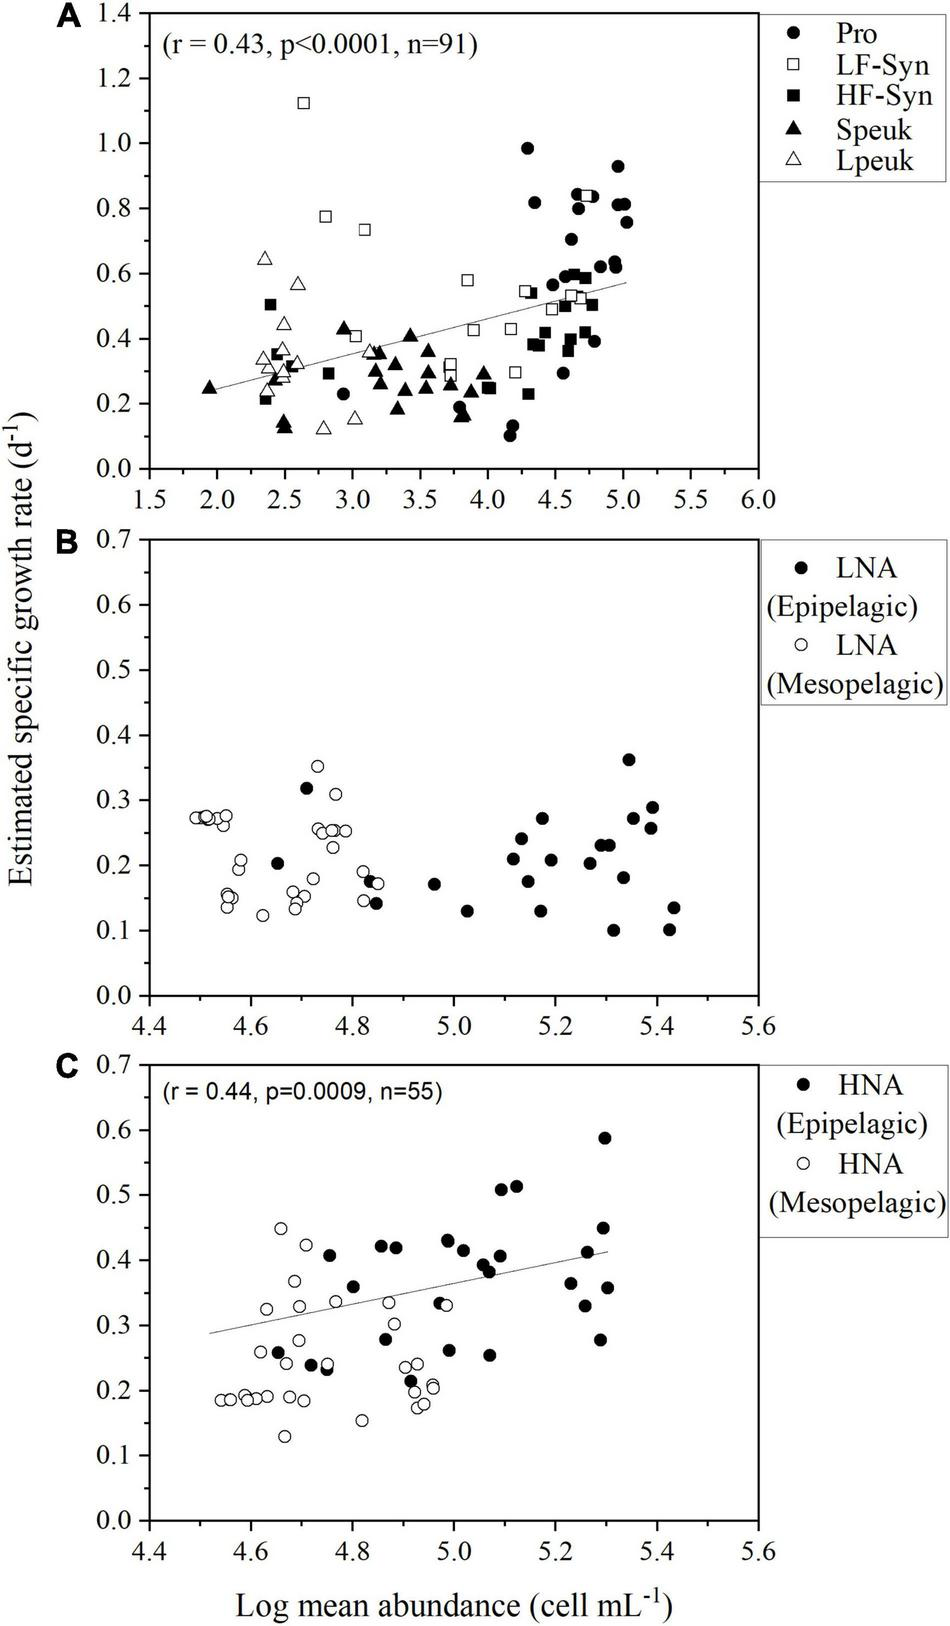
Relationships between the mean diel abundance of (A) autotrophic picoplankton and (B,C) HNA and LNA heterotrophic prokaryotes in the epipelagic and mesopelagic layers, excluding the second-noon to avoid duplicate data, and the estimated specific growth rate. Group abbreviations as in Figure 4.
Discussion
The Red Sea belongs to the vast area occupied by tropical and nutrient-poor waters, but stands out as having significantly warmer (Raitsos et al., 2013; Chaidez et al., 2017) and saltier (Tesfamichael and Pauly, 2016) surface waters. However, by being more accessible than the open Atlantic, Indian or Pacific oceans, the oligotrophic and quasi-permanently stratified Red Sea is an appropriate model for studying the spatio-temporal changes in picoplankton communities, the dominant planktonic size class in low latitude waters (Campbell et al., 1997; DuRand et al., 2001; Agawin and Agustí, 2005). Flow cytometry allowed us to consistently identify seven groups of picoplanktonic organisms: five autotrophs (Prochlorococcus, two populations of Synechococcus characterized by differing phycoerythrin content and two differently sized clusters of picoeukaryotes) plus the two widespread clusters of heterotrophic prokaryotes, LNA, and HNA. The two Synechococcus groups, named as low (LF-Syn) and high (HF-Syn) fluorescence (Al-Otaibi et al., 2020), seem to be a general characteristic of at least the central, both in coastal (Sabbagh et al., 2020) and offshore waters (Al-Otaibi et al., 2020), and southern regions of the Red Sea (Veldhuis and Kraay, 1993). They had already been reported in other oligotrophic sites such as an Indian estuary (Mitbavkar et al., 2012) and the subtropical North Atlantic (Taucher et al., 2018). Although not always consistently found (Grégori et al., 2001; Liu et al., 2014; Thyssen et al., 2014), we were also able to discern two groups of picoeukaryotes in the Red Sea, with the small picoeukaryotes (Speuk) group also probably more homogeneous taxonomically than the larger (Lpeuk) one (Not et al., 2009; Cabello et al., 2016). While the numbers of picoeukaryotes were comparable, the abundance of single-celled cyanobacteria was generally lower than in other warm regions (Zubkov et al., 2000; Worden et al., 2004). Lower picoplankton abundances were even more noticeable in the case of LNA and HNA prokaryotes, when compared to other low latitude waters (e.g., Carlson et al., 1996; Gundersen et al., 2001; Hale et al., 2017). Sabbagh et al. (2020) have recently suggested that top-down control by viruses and heterotrophic nanoflagellates was fundamental in keeping autotrophic and heterotrophic bacterial abundances low in the nearby shallow waters of KAUST Harbor, a process probably also behind the low numbers at our study site (Al-Otaibi et al., 2020). Recent studies have shown that the seasonal variability of the diverse picoplanktonic groups was higher than anticipated for tropical oceans and comparable to higher latitude regions (Calleja et al., 2019; Al-Otaibi et al., 2020). However, no information with a frequency higher than once per day was available for Red Sea microbial plankton. The high resolution (with a total of 52 vertical profiles from the surface down to the bottom equally distributed in each season) reached in this study has allowed us to even estimate in situ specific growth rates, providing a dynamical and functional representation of picoplankton across the epi- and mesopelagic layers of the central Red Sea.
Diel changes in the abundance of picoplankton groups are driven by the periodicity in physical (e.g., light and temperature) and biological factors (e.g., cell division, grazing, and viral lysis, Ribalet et al., 2015; Tsai et al., 2018). The diel dynamics of autotrophic picoplankton abundance in oligotrophic waters have shown typically an increase in the afternoon or early evening and a decrease through the night until dawn, following the typically synchronized cell division (Landry et al., 1996; Blanchot et al., 1997; Vaulot and Marie, 1999). While increases in autotrophic picoplankton abundance can only be explained by cell division in the absence of strong advection, decreases can be caused by cell death, grazing mostly caused by heterotrophic nanoflagellates (Dolan and Šimek, 1999; Christaki et al., 2001; Guillou et al., 2001) and/or viral infection (Suttle and Chan, 1994; Dolan and Šimek, 1999; Sullivan et al., 2003). The fact that the surface diel variations of picoplankton abundance did not show any consistent pattern in this dataset (Figure 2), contrary to other studies (André et al., 1999; Vaulot and Marie, 1999; Lefort and Gasol, 2014), can be explained by the tight coupling between growth and loss processes (Lefort and Gasol, 2014), preventing standing stocks from sustained, marked increases or decreases on a diel basis. The diel variations in the abundance of heterotrophic picoplankton could also be explained by the numerous species likely present within the flow cytometric categories of LNA (for instance the Alphaproteobacteria SAR11 or the Gammaproteobacteria SAR86 clades) and HNA cells (frequently members of Roseobacter, Gammaproteobacteria and Bacteroidetes, Schattenhofer et al., 2011; Morris et al., 2012). Although lacking any clear pattern, the diel variations in the abundance of picophytoplankton were usually higher than those of heterotrophic prokaryotes (Tables 1, 2, Figure 2, and Supplementary Figure 2).
In contrast to variations in abundance, highly consistent periodicities in cell size were apparent for picocyanobacteria regardless of the sampled period (Figure 3). The diel increase in surface LF- and HF-Synechococcus cell size ceased approximately 2 h earlier than that of Prochlorococcus, indicating that the time of cell division differed between these picocyanobacteria genera (Figures 3A–H). Although diel changes in cell size have been used to estimate in situ growth rate in some studies (Sosik et al., 2003; Hunter-Cevera et al., 2014; Ribalet et al., 2015), the straightforward application of relationships obtained in regions with different environmental characteristics to the Red Sea is not feasible. In an early study, Moigis (1999) showed high growth rates values (up to 3 d–1) of marine cyanobacteria along the latitudinal axis of the Red Sea, especially in the territorial waters of Sudan and Yemen. With regard to heterotrophic prokaryotes, Silva et al. (2019) recently provided estimates of the specific growth rates of LNA and HNA groups at the surface of the shallow waters of KAUST Harbor, but there is virtually no information about their vertical variability in Red Sea open waters. At the study site off KAEC, we only have direct growth measurements of autotrophic and heterotrophic picoplankton groups in predator-free incubations of samples collected in the epipelagic and mesopelagic zone in the winter 24 h cycle (Figure 4 and Supplementary Figure 5). In situ changes in cell size reflected remarkably well the measured specific growth rates of all picoplankton groups, except Lpeuk which were removed by the pre-filtration step, in the experimental incubations. Unfortunately, this was the only concurrent autotrophic and heterotrophic picoplankton growth rate experiment conducted at the study site but given the high percentage of variance explained we felt it was safe to extrapolate this relationship to the remaining periods. Two additional experiments focused on heterotrophic prokaryotes and how migrating mesopelagic fishes were able to supply labile DOC to sustain their growth rate (Calleja et al., 2018; Morán et al., 2022) were not included because no information about picophytoplankton was available. Previous studies have estimated in situ division rates of picoplankton populations from the ratio of the maximum to the minimum flow cytometric right angle light scatter value, a common proxy for picoplankton cell size (Vaulot and Marie, 1999; Jacquet et al., 2002; Lefort and Gasol, 2014). The higher values of this ratio were indicative of higher division rates. In this study, SSC values were converted to biovolume assuming a spherical shape. However, rather than using only two values of cell size, the minimum and maximum, we decided to use the coefficient of variation (CV) of all data of cell size available over 24 h. Although the cell size CVs and the maximum to minimum SSC ratios were as expected correlated (r = 0.41, p = 0.0002, n = 91), by choosing the CVs we minimized the possible errors of anomalously low or high values in the ratio.
The vertical distributions of Prochlorococcus abundance and estimated growth rates showed similar trends with depth (Figure 5A and Supplementary Figure 2), while the match was less marked for the other groups of picophytoplankton (Figures 5B–E). Our maximum estimated specific growth rates of Prochlorococcus in the central Red Sea were slightly lower than the values measured in the tropical Pacific (ca. 1 d–1, Vaulot et al., 1995; Selph et al., 2005) and central Atlantic (ca. 1.5 d–1, Quevedo and Anadón, 2001; Worden and Binder, 2003; Agawin and Agustí, 2005; Figure 7A). The maximum specific growth rates of the two groups of Synechococcus were slightly higher than in tropical Pacific waters (0.50 d–1, Landry et al., 2003; Selph et al., 2005), but notably lower than in the central Atlantic (1.85 d–1, Agawin and Agustí, 2005) and the NW Mediterranean (1.79 d–1, Agawin et al., 1998; Figure 7A). However, none of these studies distinguished between low and high fluorescence groups as we did here. It is remarkable that the difference between the LF-Syn and HF-Syn groups usually held year-round, so that the similar seasonal variability in the upper epipelagic suggests a common response of both types to environmental factors. In shallow waters, however, the HF-Syn group is virtually absent from April to September (Sabbagh et al., 2020), suggesting that some requirements for HF-Syn growth are absent in shallow waters for a substantial period of the year. Not many studies have assessed the specific growth rates of picoeukaryotes in oligotrophic tropical waters. Those we are aware of report values for the central (Landry et al., 1995), northwest (Selph et al., 2005) and eastern tropical Pacific (Taniguchi et al., 2014). Although the large picoeukaryotes group typically grew faster than the small one, our values (Figure 7A) were uniformly lower than in the tropical Pacific (0.77 d–1, Selph et al., 2005).
Heterotrophic bacteria and archaea consistently showed lower variations in cell size than autotrophic picoplankton (Table 2 and Figures 3M–P), resulting in lower specific growth rate estimates according to our model. The vertical distribution of LNA prokaryotes growth was as expected more uniform than their HNA counterparts, with no significant differences between the epipelagic and mesopelagic layers (Figures 6A, 7B). Similar to Prochlorococcus, we typically observed higher specific growth rates of HNA prokaryotes at the DCM than at the surface (Figure 6B), indicating that copiotroph taxa were able to respond to higher substrate inputs as suggested elsewhere (Morán et al., 2011). In contrast to our findings, Scharek and Latasa (2007) showed higher specific growth rates of LNA cells (ca. 0.90 d–1) at the DCM of the NW Mediterranean, doubling the values of the HNA group (ca. 0.40 d–1), while HNA grew clearly faster at the surface (1.18 for HNA and 0.50 d–1 for LNA). Also, seasonality was much more marked for HNA than for LNA cells in the epipelagic layer (Figure 7B). Our estimated specific growth rates of LNA and HNA heterotrophic prokaryotes were lower than the maxima reported for the NW Mediterranean Sea (ca. 1.0 d–1, Vaqué et al., 2001; Sala et al., 2002) and the tropical Atlantic Ocean (ca. 0.8 d–1, Steinberg et al., 2001). Compared with the few studies reporting specific growth rates of heterotrophic prokaryotes in the Red Sea, our values were higher than in the surface northern Red Sea (0.15 d–1; Grossart and Simon, 2002), but lower than in the central (ca. 1.5 d–1) and southern regions (ca. 0.7 d–1; Weisse, 1989). A recent study reported notably higher values (up to 1.1 d–1 for LNA cells and 2.3 d–1 for HNA cells) in the nearby shallow waters of KAUST Harbor (Silva et al., 2019). The low mean values of dissolved inorganic nitrogen (nitrite plus nitrate, 0.17 ± 0.11 μmol L–1) and dissolved organic carbon (76 ± 8 μmol C L–1) concentrations characterizing this study site (Al-Otaibi et al., 2020) could partially explain our lower values compared with the shallower environment (occasionally exceeding 20 μmol L–1 of DIN and up to 98 μmol L–1 of DOC, Silva et al., 2019). Another important process sustaining heterotrophic prokaryotes growth in the Red Sea is the diel vertical migration of mesopelagic fish (Calleja et al., 2018; García et al., 2018). The deep scattering layer (DSL), located between 400 and 600 m at our study site (Klevjer et al., 2016), is dominated by Benthosema pterotum lanternfishes. The labile dissolved organic matter released by the fishes fuels an active community of heterotrophic prokaryotes at the DSL (Calleja et al., 2018; García et al., 2018), with significant differences between day and night linked to the presence and absence, respectively, of mesopelagic fish (Morán et al., 2022). Our LNA and HNA prokaryotes specific growth rate estimates did not show any consistent increase at the DSL depth (Figure 6). Although in direct incubations Calleja et al. (2018) had reported higher specific growth rates of heterotrophic prokaryotes from mesopelagic depths than those at the surface, a more recent study using the same approach found the opposite (Morán et al., 2022), indicating that vertical variations in their growth rates can also vary temporally, especially for the HNA group (see for instance Winter values in Figure 6B).
Differences in the various picoplankton groups’ specific growth rates can, as mentioned above, be partially due to the different approaches being used, but we would argue that offshore Red Sea microbial plankton grow at slower rates than other tropical sites. However, an interesting finding is that higher specific growth rates of picophytoplankton and HNA heterotrophic prokaryotes were mirrored by higher abundances averaged for the different 24 h periods (Figures 8A,C), suggesting a tight coupling between the growth and loss rates over the annual cycle. Although we lacked concomitant measurements of grazing and viral lysis, strong top-down control by heterotrophic nanoflagellates and viruses was the plausible cause for the low abundances of autotrophic and heterotrophic bacterioplankton found in shallower waters of the central Red Sea (Silva et al., 2019; Sabbagh et al., 2020). Future detailed studies about grazing and viral mortality in the whole water column are needed to fully understand the diel variability of planktonic microbes in this tropical basin. By filling the gap of diel scale studies of picoplankton communities in low latitude regions, our results also add to the currently limited database on their growth rates in the Red Sea.
Conclusion
Our findings confirm the importance of the diel scale for variations in the abundance and cell size of the major groups of picoplankton dominating plankton communities in the central Red Sea. The diel coefficient of variation in cell size allowed us to estimate the specific growth rates of autotrophic and heterotrophic picoplankton in offshore Red Sea waters after confirming a strongly positive association between in situ variations in cell size and the specific growth rates obtained in concurrent experimental incubations. The vertical profiles of the estimated specific growth rates of Prochlorococcus and HNA heterotrophic prokaryotes were more similar to their corresponding in situ abundances than the other groups. The estimated specific growth rates were generally lower than in other tropical environments. Prochlorococcus showed the highest values year-round, followed by the low phycoerythrin fluorescence group of Synechococcus and the lowest corresponded to small picoeukaryotes. HNA consistently outgrew LNA heterotrophic prokaryotes, which failed to show marked vertical or seasonal variations. These results suggest a fine coupling between picophytoplankton and HNA prokaryotes standing stocks and specific growth rates over the seasonal cycle in Red Sea waters.
Publisher’s Note
All claims expressed in this article are solely those of the authors and do not necessarily represent those of their affiliated organizations, or those of the publisher, the editors and the reviewers. Any product that may be evaluated in this article, or claim that may be made by its manufacturer, is not guaranteed or endorsed by the publisher.
Statements
Data availability statement
The original contributions presented in the study are included in the article/Supplementary Material, further inquiries can be directed to the corresponding authors.
Author contributions
NA-O analyzed the data, prepared figures and/or tables, authored or reviewed drafts of the manuscript, and approved the final draft. FCG analyzed the data, reviewed drafts of the manuscript, and approved the final draft. XAGM conceived the research, analyzed the data, contributed to the interpretation of results, reviewed drafts of the manuscript, and approved the final draft.
Acknowledgments
We gratefully acknowledge the crew of the RVs Thuwal and KAUST Explorer and all the personnel from the Coastal and Marine Resources Core Lab for their diligent field-work assistance. Luis Silva designed and performed the winter experiment for estimating specific growth rates. Miguel Viegas, Eman I. Sabbagh, Abbrar Labban, Maria Ll. Calleja, Katherine Rowe, Anders Røstad, and Luis Silva aided enormously with fieldwork.
Conflict of interest
The authors declare that the research was conducted in the absence of any commercial or financial relationships that could be construed as a potential conflict of interest.
Supplementary material
The Supplementary Material for this article can be found online at: https://www.frontiersin.org/articles/10.3389/fmars.2021.752910/full#supplementary-material
References
1
Agawin N. S. Duarte C. M. Agustí S. (1998). Growth and abundance of Synechococcus sp. in a Mediterranean Bay: seasonality and relationship with temperature.Mar. Ecol. Prog. Ser.17045–53. 10.3354/MEPS170045
2
Agawin N. S. R. Agustí S. (2005). Prochlorococcus and synechococcus cells in the central Atlantic Ocean: distribution, growth and mortality (grazing) rates.Vie Milieu55165–175.
3
Al-Otaibi N. Huete-Stauffer T. M. Calleja M. L. Irigoien X. Morán X. A. G. (2020). Seasonal variability and vertical distribution of autotrophic and heterotrophic picoplankton in the Central Red Sea.PeerJ8:e8612. 10.7717/peerj.8612
4
André J. M. Navarette C. Blanchot J. Radenac M. H. (1999). Picophytoplankton dynamics in the equatorial Pacific: growth and grazing rates from cytometric counts.J. Geophys. Res. Oceans1043369–3380. 10.1029/1998JC900005
5
Binder B. J. DuRand M. D. (2002). Diel cycles in surface waters of the equatorial Pacific.Deep-Sea Res. II Top. Stud. Oceanogr.492601–2617. 10.1016/S0967-0645(02)00050-4
6
Blanchot J. André J.-M. Navarette C. Neveux J. (1997). Picophytoplankton dynamics in the equatorial Pacific: diel cycling from flow-cytometer observations.C. R. Acad. Sci. III320925–931.
7
Bouvier T. Del Giorgio P. A. Gasol J. M. (2007). A comparative study of the cytometric characteristics of high and low nucleic-acid bacterioplankton cells from different aquatic ecosystems.Environ. Microbiol.92050–2066. 10.1111/j.1462-2920.2007.01321.x
8
Cabello A. M. Latasa M. Forn I. Morán X. A. G. Massana R. (2016). Vertical distribution of major photosynthetic picoeukaryotic groups in stratified marine waters.Environ. Microbiol.181578–1590. 10.1111/1462-2920.13285
9
Calleja M. L. Al-Otaibi N. Morán X. A. G. (2019). Dissolved organic carbon contribution to oxygen respiration in the central Red Sea.Sci. Rep.9:4690. 10.1038/s41598-019-40753-w
10
Calleja M. L. Ansari M. I. Rostad A. Silva L. Kaartvedt S. Irigoien X. et al (2018). The Mesopelagic Scattering Layer: a Hotspot for Heterotrophic Prokaryotes in the Red Sea Twilight Zone.Front. Mar. Sci.5:259. 10.3389/fmars.2018.00259
11
Calvo-Díaz A. Morán X. A. G. (2006). Seasonal dynamics of picoplankton in shelf waters of the southern Bay of Biscay.Aquat. Microb. Ecol.42159–174. 10.3354/ame042159
12
Campbell L. Liu H. Nolla H. A. Vaulot D. (1997). Annual variability of phytoplankton and bacteria in the subtropical North Pacific Ocean at Station ALOHA during the 1991–1994 ENSO event.Deep Sea Res. I Oceanogr. Res. Pap.44167–192. 10.1016/S0967-0637(96)00102-1
13
Carlson C. A. Ducklow H. W. Sleeter T. D. (1996). Stocks and dynamics of bacterioplankton in the northwestern Sargasso Sea.Deep-Sea Res. II Top. Stud. Oceanogr.43491–515. 10.1016/0967-0645(95)00101-8
14
Chaidez V. Dreano D. Agustí S. Duarte C. M. Hoteit I. (2017). Decadal trends in Red Sea maximum surface temperature.Sci. Rep.7:8144. 10.1038/s41598-017-08146-z
15
Christaki U. Giannakourou A. Van Wambeke F. Grégori G. (2001). Nanoflagellate predation on auto-and heterotrophic picoplankton in the oligotrophic Mediterranean Sea.J. Plankton Res.231297–1310. 10.1093/plankt/23.11.1297
16
Dolan J. R. Šimek K. (1999). Diel periodicity in Synechococcus populations and grazing by heterotrophic nanoflagellates: analysis of food vacuole contents.Limnol. Oceanogr.441565–1570. 10.4319/lo.1999.44.6.1565
17
Ducklow H. (2000). Bacterial production and biomass in the oceans.Microb. Ecol. Ocean.185–120.
18
Durand M. D. Olson R. J. (1996). Contributions of phytoplankton light scattering and cell concentration changes to diel variations in beam attenuation in the equatorial Pacific from flow cytometric measurements of pico-, ultra-and nanoplankton.Deep-Sea Res. II Top. Stud. Oceanogr.43891–906. 10.1016/0967-0645(96)00020-3
19
DuRand M. D. Olson R. J. Chisholm S. W. (2001). Phytoplankton population dynamics at the Bermuda Atlantic Time-series station in the Sargasso Sea.Deep-Sea Res. II Top. Stud. Oceanogr.481983–2003. 10.1016/S0967-0645(00)00166-1
20
García F. C. Calleja M. L. Al-Otaibi N. Røstad A. Morán X. A. G. (2018). Diel dynamics and coupling of heterotrophic prokaryotes and dissolved organic matter in epipelagic and mesopelagic waters of the central Red Sea.Environ. Microbiol.202990–3000. 10.1111/1462-2920.14336
21
Gasol J. M. Moraìn X. A. G. (2015). “Flow cytometric determination of microbial abundances and its use to obtain indices of community structure and relative activity,” in Hydrocarb. Lipid Microbiol. Protocols. Springer Protoc. Handbooks, edsMcGenityT.TimmisK.NogalesB. (Berlin: Springer), 1–29.
22
Gasol J. M. Pedrós-Alió C. Vaqué D. (2002). Regulation of bacterial assemblages in oligotrophic plankton systems: results from experimental and empirical approaches.Antonie Van Leeuwenhoek81435–452.
23
Gasol J. M. Zweifel U. L. Peters F. Fuhrman J. A. Hagström Å (1999). Significance of size and nucleic acid content heterogeneity as measured by flow cytometry in natural planktonic bacteria.Appl. Environ. Microbiol.654475–4483. 10.1128/AEM.65.10.4475-4483.1999
24
Grégori G. Colosimo A. Denis M. (2001). Phytoplankton group dynamics in the Bay of Marseilles during a 2-year survey based on analytical flow cytometry.Cytom. J. Int. Soc. Anal. Cytol.44247–256.
25
Grossart H.-P. Simon M. (2002). Bacterioplankton dynamics in the Gulf of Aqaba and the northern Red Sea in early spring.Mar. Ecol. Prog. Ser.239263–276. 10.3354/meps239263
26
Guillou L. Jacquet S. Chrétiennot-Dinet M.-J. Vaulot D. (2001). Grazing impact of two small heterotrophic flagellates on Prochlorococcus and Synechococcus.Aquat. Microb. Ecol.26201–207. 10.3354/ame026201
27
Gundersen K. Orcutt K. M. Purdie D. A. Michaels A. F. Knap A. H. (2001). Particulate organic carbon mass distribution at the Bermuda Atlantic Time-series Study (BATS) site.Deep-Sea Res. II Top. Stud. Oceanogr.481697–1718. 10.1016/S0967-0645(00)00156-9
28
Hale M. S. Li W. K. Rivkin R. B. (2017). Meridional patterns of inorganic nutrient limitation and co-limitation of bacterial growth in the Atlantic Ocean.Prog. Oceanogr.15890–98. 10.1016/j.pocean.2016.11.007
29
Huete-Stauffer T. M. Morán X. A. G. (2012). Dynamics of heterotrophic bacteria in temperate coastal waters: similar net growth but different controls in low and high nucleic acid cells.Aquat. Microb. Ecol.67211–223. 10.3354/ame01590
30
Hunter-Cevera K. R. Neubert M. G. Solow A. R. Olson R. J. Shalapyonok A. Sosik H. M. (2014). Diel size distributions reveal seasonal growth dynamics of a coastal phytoplankter.Proc. Natl. Acad. Sci. U. S. A.1119852–9857. 10.1073/pnas.1321421111
31
Jacquet S. Lennon J. F. Marie D. Vaulot D. (1998). Picoplankton population dynamics in coastal waters of the northwestern Mediterranean Sea.Limnol. Oceanogr.431916–1931. 10.4319/lo.1998.43.8.1916
32
Jacquet S. Prieur L. Avois-Jacquet C. Lennon J. F. Vaulot D. (2002). Short-timescale variability of picophytoplankton abundance and cellular parameters in surface waters of the Alboran Sea (western Mediterranean).J. Plankton Res.24635–651. 10.1093/plankt/24.7.635
33
Kirchman D. L. (2016). Growth Rates of Microbes in the Oceans.Ann. Rev. Mar. Sci.8285–309. 10.1146/annurev-marine-122414-033938
34
Klevjer T. A. Irigoien X. Røstad A. Fraile-Nuez E. Benítez-Barrios V. M. Kaartvedt S. (2016). Large scale patterns in vertical distribution and behaviour of mesopelagic scattering layers.Sci. Rep.6:19873. 10.1038/srep19873
35
Landry M. Hassett R. (1982). Estimating the grazing impact of marine micro-zooplankton.Mar. Biol.67283–288.
36
Landry M. R. Brown S. L. Neveux J. Dupouy C. Blanchot J. Christensen S. et al (2003). Phytoplankton growth and microzooplankton grazing in high-nutrient, low-chlorophyll waters of the equatorial Pacific: community and taxon-specific rate assessments from pigment and flow cytometric analyses.J. Geophys. Res.108:8142. 10.1029/2000JC000744
37
Landry M. R. Kirshtein J. Constantinou J. (1995). A refined dilution technique for measuring the community grazing impact of microzooplankton, with experimental tests in the central equatorial Pacific.Mar. Ecol. Prog. Ser.120, 53–63. 10.3354/meps120053
38
Landry M. R. Kirshtein J. Constantinou J. (1996). Abundances and distributions of picoplankton populations in the central equatorial Pacific from 12 N to 12 S, 140 W.Deep-Sea Res. II Top. Stud. Oceanogr.43871–890. 10.1016/0967-0645(96)00018-5
39
Lebaron P. Servais P. Agogué H. Courties C. Joux F. (2001). Does the high nucleic acid content of individual bacterial cells allow us to discriminate between active cells and inactive cells in aquatic systems?Appl. Environ. Microbiol.671775–1782. 10.1128/AEM.67.4.1775-1782.2001
40
Lefort T. Gasol J. M. (2014). Short-time scale coupling of picoplankton community structure and single-cell heterotrophic activity in winter in coastal NW Mediterranean Sea waters.J. Plankton Res.36243–258. 10.1093/plankt/fbt073
41
Liu H. Jing H. Wong T. H. Chen B. (2014). Co-occurrence of phycocyanin-and phycoerythrin-rich S ynechococcus in subtropical estuarine and coastal waters of Hong Kong.Environ. Microbiol. Rep.690–99. 10.1111/1758-2229.12111
42
Longnecker K. Sherr B. F. Sherr E. (2005). Activity and phylogenetic diversity of bacterial cells with high and low nucleic acid content and electron transport system activity in an upwelling ecosystem.Appl. Environ. Microbiol.717737–7749. 10.1128/AEM.71.12.7737-7749.2005
43
López-Sandoval D. C. Duarte C. M. Agustí S. (2021). Nutrient and temperature constraints on primary production and net phytoplankton growth in a tropical ecosystem.Limnol. Oceanogr.662923–2935. 10.1002/lno.11849
44
Malmstrom R. R. Coe A. Kettler G. C. Martiny A. C. Frias-Lopez J. Zinser E. R. et al (2010). Temporal dynamics of Prochlorococcus ecotypes in the Atlantic and Pacific oceans.ISME J.41252–1264. 10.1038/ismej.2010.60
45
Mitbavkar S. Rajaneesh K. Anil A. Sundar D. (2012). Picophytoplankton community in a tropical estuary: detection of Prochlorococcus-like populations.Estuar. Coast. Shelf Sci.107159–164. 10.1016/j.ecss.2012.05.002
46
Moigis A. G. (1999). Photosynthetic rates in the surface waters of the Red Sea: the radiocarbon versus the non-isotopic dilution method.J. Plankton Res.22713–727.
47
Morán X. A. G. Bode A. Suárez L. Á Nogueira E. (2007). Assessing the relevance of nucleic acid content as an indicator of marine bacterial activity.Aquat. Microb. Ecol.46141–152. 10.3354/ame046141
48
Morán X. A. G. Ducklow H. W. Erickson M. (2011). Single-cell physiological structure and growth rates of heterotrophic bacteria in a temperate estuary (Waquoit Bay, Massachusetts).Limnol. Oceanogr.5637–48. 10.4319/lo.2011.56.1.0037
49
Morán X. A. G. García F. C. Røstad A. Silva L. Al-Otaibi N. Irigoien X. et al (2022). Diel dynamics of dissolved organic matter and heterotrophic prokaryotes reveal enhanced growth at the ocean’s mesopelagic fish layer during daytime.Sci. Total Environ.804:150098. 10.1016/j.scitotenv.2021.150098
50
Morris R. M. Frazar C. D. Carlson C. A. (2012). Basin-scale patterns in the abundance of SAR11 subclades, marine Actinobacteria (OM1), members of the Roseobacter clade and OCS116 in the South Atlantic.Environ. Microbiol.141133–1144. 10.1111/j.1462-2920.2011.02694.x
51
Not F. del Campo J. Balague V. de Vargas C. Massana R. (2009). New insights into the diversity of marine picoeukaryotes.PLoS One4:e7143. 10.1371/journal.pone.0007143
52
Olson R. J. Chisholm S. W. Zettler E. R. Altabet M. A. Dusenberry J. A. (1990a). Spatial and temporal distributions of prochlorophyte picoplankton in the North Atlantic Ocean.Deep-Sea Res. I Oceanogr. Res. Pap.371033–1051. 10.1016/0198-0149(90)90109-9
53
Olson R. J. Chisholm S. W. Zettler E. R. Armbrust E. V. (1990b). Pigments, size, and distributions of Synechococcus in the North Atlantic and Pacific Oceans.Limnol. Oceanogr.3545–58. 10.4319/lo.1990.35.1.0045
54
Partensky F. Blanchot J. Lantoine F. Neveux J. Marie D. (1996). Vertical structure of picophytoplankton at different trophic sites of the tropical northeastern Atlantic Ocean.Deep-Sea Res. I Oceanogr. Res. Pap.431191–1213. 10.1016/0967-0637(96)00056-8
55
Quevedo M. Anadón R. (2001). Protist control of phytoplankton growth in the subtropical north-east Atlantic.Mar. Ecol. Prog. Ser.22129–38. 10.3354/meps221029
56
Raitsos D. E. Pradhan Y. Brewin R. J. Stenchikov G. Hoteit I. (2013). Remote sensing the phytoplankton seasonal succession of the Red Sea.PLoS One8:e64909. 10.1371/journal.pone.0064909
57
Rasul N. M. A. Stewart I. C. F. Nawab Z. A. (2015). “Introduction to the Red Sea: its origin, structure, and environment,” in The Red Sea. Springer Earth System Sciences, edsRasulN.StewartI. (Berlin: Springer), 1–28.
58
Ribalet F. Swalwell J. Clayton S. Jimenez V. Sudek S. Lin Y. J. et al (2015). Light-driven synchrony of Prochlorococcus growth and mortality in the subtropical Pacific gyre.Proc. Natl. Acad. Sci. U. S. A.1128008–8012. 10.1073/pnas.1424279112
59
Sabbagh E. I. Huete-Stauffer T. M. Calleja M. L. L. Silva L. Viegas M. Moran X. A. G. (2020). Weekly variations of viruses and heterotrophic nanoflagellates and their potential impact on bacterioplankton in shallow waters of the central Red Sea.FEMS Microbiol. Ecol.96:fiaa033. 10.1093/femsec/fiaa033
60
Sala M. M. Peters F. Gasol J. M. Pedrós-Alió C. Marrasé C. Vaqué D. (2002). Seasonal and spatial variations in the nutrient limitation of bacterioplankton growth in the northwestern Mediterranean.Aquat. Microb. Ecol.2747–56. 10.3354/ame027047
61
Scharek R. Latasa M. (2007). Growth, grazing and carbon flux of high and low nucleic acid bacteria differ in surface and deep chlorophyll maximum layers in the NW Mediterranean Sea.Aquat. Microb. Ecol.46153–161. 10.3354/ame046153
62
Schattenhofer M. Wulf J. Kostadinov I. Glöckner F. O. Zubkov M. V. Fuchs B. M. (2011). Phylogenetic characterisation of picoplanktonic populations with high and low nucleic acid content in the North Atlantic Ocean.Syst. Appl. Microbiol.34470–475. 10.1016/j.syapm.2011.01.008
63
Selph K. E. Landry M. R. Taylor A. G. Gutierrez-Rodriguez A. Stukel M. R. Wokuluk J. et al (2016). Phytoplankton production and taxon-specific growth rates in the Costa Rica Dome.J Plankton Res.38199–215. 10.1093/plankt/fbv063
64
Selph K. E. Shacat J. Landry M. R. (2005). Microbial community composition and growth rates in the NW Pacific during spring 2002.Geochem. Geophys. Geosyst.6:Q12M05. 10.1029/2005GC000983
65
Silva L. Calleja M. L. Huete-Stauffer T. M. Ivetic S. Ansari M. I. Viegas M. et al (2019). Low Abundances but High Growth Rates of Coastal Heterotrophic Bacteria in the Red Sea.Front. Microbiol.9:3244. 10.3389/fmicb.2018.03244
66
Sosik H. M. Olson R. J. Neubert M. G. Shalapyonok A. Solow A. R. (2003). Growth rates of coastal phytoplankton from time-series measurements with a submersible flow cytometer.Limnol. Oceanogr.481756–1765. 10.4319/lo.2003.48.5.1756
67
Steinberg D. K. Carlson C. A. Bates N. R. Johnson R. J. Michaels A. F. Knap A. H. (2001). Overview of the US JGOFS Bermuda Atlantic Time-series Study (BATS): a decade-scale look at ocean biology and biogeochemistry.Deep-Sea Res. II Top. Stud. Oceanogr.481405–1447. 10.1016/S0967-0645(00)00148-X
68
Sullivan M. B. Waterbury J. B. Chisholm S. W. (2003). Cyanophages infecting the oceanic cyanobacterium Prochlorococcus.Nature4241047–1051. 10.1038/nature01929
69
Suttle C. A. Chan A. M. (1994). Dynamics and distribution of cyanophages and their effect on marine Synechococcus spp.Appl. Environ. Microbiol.603167–3174. 10.1128/aem.60.9.3167-3174.1994
70
Taniguchi D. A. A. Landry M. R. Franks P. J. S. Selph K. E. (2014). Size-specific growth and grazing rates for picophytoplankton in coastal and oceanic regions of the eastern Pacific.Mar. Ecol. Prog. Ser.50987–101. 10.3354/meps10895
71
Taucher J. Arístegui J. Bach L. T. Guan W. Montero M. F. Nauendorf A. et al (2018). Response of subtropical phytoplankton communities to ocean acidification under oligotrophic conditions and during nutrient fertilization.Front. Mar. Sci.5:330. 10.3389/fmars.2018.00330
72
Tesfamichael D. Pauly D. (2016). The Red Sea Ecosystem and Fisheries.Berlin: Springer.
73
Thyssen M. Grégori G. J. Grisoni J.-M. Pedrotti M. L. Mousseau L. Artigas L. F. et al (2014). Onset of the spring bloom in the northwestern Mediterranean Sea: influence of environmental pulse events on the in situ hourly-scale dynamics of the phytoplankton community structure.Front. Microbiol.5:387. 10.3389/fmicb.2014.00387
74
Tsai A. Y. Gong G. C. Chung C. C. Huang Y. T. (2018). Different impact of nanoflagellate grazing and viral lysis on Synechococcus spp. and picoeukaryotic mortality in coastal waters.Coast. Shelf Sci.2091–6. 10.1016/j.ecss.2018.05.012
75
Vaqué D. Casamayor E. O. Gasol J. M. (2001). Dynamics of whole community bacterial production and grazing losses in seawater incubations as related to the changes in the proportions of bacteria with different DNA content.Aquat. Microb. Ecol.25163–177. 10.3354/ame025163
76
Vaulot D. Marie D. (1999). Diel variability of photosynthetic picoplankton in the equatorial Pacific.J. Geophys. Res. Oceans1043297–3310.
77
Vaulot D. Marie D. Olson R. J. Chisholm S. W. (1995). Growth of prochlorococcus, a photosynthetic prokaryote, in the equatorial pacific ocean.Science268, 1480–1482. 10.1126/science.268.5216.1480
78
Veldhuis M. J. Kraay G. W. (1993). Cell abundance and fluorescence of picoplankton in relation to growth irradiance and nitrogen availability in the Red Sea.Neth. J. Sea Res.31135–145.
79
Wang G. Guo C. Luo W. Cai M. He J. (2009). The distribution of picoplankton and nanoplankton in Kongsfjorden, Svalbard during late summer 2006.Polar Biol.321233–1238. 10.1007/s00300-009-0666-6
80
Weisse T. (1989). The microbial loop in the Red Sea: dynamics of pelagic bacteria and heterotrophic nanoflagellates.Mar. Ecol. Prog. Ser.55241–250.
81
Worden A. Z. Binder B. J. (2003). Application of dilution experiments for measuring growth and mortality rates among Prochlorococcus and Synechococcus populations in oligotrophic environments.Aquat. Microb. Ecol.30159–174. 10.3354/ame030159
82
Worden A. Z. Nolan J. K. Palenik B. (2004). Assessing the dynamics and ecology of marine picophytoplankton: the importance of the eukaryotic component.Limnol. Oceanogr.49168–179. 10.4319/lo.2004.49.1.0168
83
Zubkov M. V. Sleigh M. A. Burkill P. H. Leakey R. J. (2000). Picoplankton community structure on the Atlantic Meridional Transect: a comparison between seasons.Prog. Oceanogr.45369–386. 10.1016/S0079-6611(00)00008-2
Summary
Keywords
Red Sea, picoplankton, Prochlorococcus , Synechococcus , picoeukaryotes, heterotrophic bacteria, growth rate, diel variability
Citation
Al-Otaibi N, García FC and Morán XAG (2021) Picoplankton Diel Variability and Estimated Growth Rates in Epipelagic and Mesopelagic Waters of the Central Red Sea. Front. Mar. Sci. 8:752910. doi: 10.3389/fmars.2021.752910
Received
03 August 2021
Accepted
18 October 2021
Published
08 November 2021
Volume
8 - 2021
Edited by
Ryan Paerl, North Carolina State University, United States
Reviewed by
Raffaella Casotti, Stazione Zoologica Anton Dohrn Napoli, Italy; Pradeep Ram Angia Sriram, UMR 6023 Laboratoire Microorganismes Génome Et Environnement (LMGE), France; Olga Mangoni, University of Naples Federico II, Italy
Updates
Copyright
© 2021 Al-Otaibi, García and Morán.
This is an open-access article distributed under the terms of the Creative Commons Attribution License (CC BY). The use, distribution or reproduction in other forums is permitted, provided the original author(s) and the copyright owner(s) are credited and that the original publication in this journal is cited, in accordance with accepted academic practice. No use, distribution or reproduction is permitted which does not comply with these terms.
*Correspondence: Najwa Al-Otaibi, naotaibi@tu.edu.sa; najwa.otaibi@kaust.edu.saXosé Anxelu G. Morán, xelu.moran@kaust.edu.sa; xelu.moran@ieo.es
This article was submitted to Aquatic Microbiology, a section of the journal Frontiers in Marine Science
Disclaimer
All claims expressed in this article are solely those of the authors and do not necessarily represent those of their affiliated organizations, or those of the publisher, the editors and the reviewers. Any product that may be evaluated in this article or claim that may be made by its manufacturer is not guaranteed or endorsed by the publisher.