 Martin Zurowietz
 Tim W. Nattkemper
- Biodata Mining Group, Faculty of Technology, Bielefeld University, Bielefeld, Germany
Marine imaging has evolved from small, narrowly focussed applications to large-scale applications covering areas of several hundred square kilometers or time series covering observation periods of several months. The analysis and interpretation of the accumulating large volume of digital images or videos will continue to challenge the marine science community to keep this process efficient and effective. It is safe to say that any strategy will rely on some software platform supporting manual image and video annotation, either for a direct manual annotation-based analysis or for collecting training data to deploy a machine learning–based approach for (semi-)automatic annotation. This paper describes how computer-assisted manual full-frame image and video annotation is currently performed in marine science and how it can evolve to keep up with the increasing demand for image and video annotation and the growing volume of imaging data. As an example, observations are presented how the image and video annotation tool BIIGLE 2.0 has been used by an international community of more than one thousand users in the last 4 years. In addition, new features and tools are presented to show how BIIGLE 2.0 has evolved over the same time period: video annotation, support for large images in the gigapixel range, machine learning assisted image annotation, improved mobility and affordability, application instance federation and enhanced label tree collaboration. The observations indicate that, despite novel concepts and tools introduced by BIIGLE 2.0, full-frame image and video annotation is still mostly done in the same way as two decades ago, where single users annotated subsets of image collections or single video frames with limited computational support. We encourage researchers to review their protocols for education and annotation, making use of newer technologies and tools to improve the efficiency and effectivity of image and video annotation in marine science.
1. Introduction
Marine imaging is an increasingly important technique for environmental monitoring and exploration of the oceans (Solan et al., 2003; Bicknell et al., 2016; Durden et al., 2016b). Today, technological advances in high-resolution digital imaging, mobile underwater carrier systems and digital storage technology make it possible to acquire vast volumes of imaging data in a short period of time (Morris et al., 2014). While the sustainable curation and management of large volumes of marine imaging data has been recently addressed (Schoening et al., 2018), the analysis of the data continues to be a major challenge. Marine imaging data is traditionally analyzed through manual image annotation by marine biologists and other domain experts. In this context, image annotation refers to the assignment of labels (e.g., a species name selected from a certain taxonomy) to points or regions in a full-frame image or video (in contrast to part-frame imaging such as pre-segmented pelagic imaging) (Durden et al., 2016a; Schoening et al., 2016). This is a time-consuming and error-prone task (Culverhouse et al., 2003; Schoening et al., 2012; Seiler et al., 2012). As a consequence of the rapidly increasing rates at which marine imaging data is acquired today and the highly limited availability of domain experts, time-consuming purely manual image annotation is no longer acceptable as the only method of analysis.
Multiple paths could lead to a mitigation of this bottleneck of image annotation that the field of marine imaging currently faces. One path is specialized software that aims to support human observers and make manual image annotation as efficient and effective as possible. Annotation software for marine imaging already has a history (Durden et al., 2016a) starting with offline desktop applications supporting only single users and gradually shifting to multi-user web-based applications that can be deployed at scale [e.g., CoralNet (Beijbom et al., 2015), SQUIDLE+ (Proctor et al., 2018), or BIIGLE 2.0 (Langenkämper et al., 2017)]. These applications provide a multitude of features and tools to make manual marine image annotation easier, faster and more accurate. However, annotation by human observers is expensive and the availability of domain experts is highly limited so that sometimes only a small fraction of the collected imaging data can be analyzed. Therefore, the question of the efficiency of purely manual annotation needs to be addressed.
A second path to deal with the bottleneck of marine image annotation is to automate it (to a certain degree and on a particular scale) (MacLeod et al., 2010). Recent advances in computer vision through deep learning (LeCun et al., 2015) promised a new era of fully automated image processing. While this promise has yet to be fulfilled for many imaging domains, computer vision through deep learning certainly produced impressive results that other computer vision techniques have not been able to match. Deep learning has also been employed in various recent approaches to marine image processing (Li et al., 2015; Beijbom et al., 2016; Mahmood et al., 2016) (the reviews of Moniruzzaman et al. (2017) and Xu et al. (2019) provide a comprehensive overview). However, even with deep learning, a computer vision system that works as accurately as human observers in all possible scenarios of marine imaging remains an unrealistic achievement for the near future. The performance of deep learning algorithms can depend heavily on the size (as well as composition and quality) of the training data (Sun et al., 2017). This is a big challenge for applications in marine imaging, since training data cannot be acquired as easily as in other imaging domains such as everyday images (e.g., planes, cars, trees, etc.) where deep learning achieved its most impressive results so far. Even if there came to be an alternative to deep learning for computer vision in the future, it is very likely that it would also heavily depend on high-quality training data.
Thus, it becomes apparent that the two possible paths of specialized annotation software and automated image processing to mitigate the bottleneck of marine image annotation are tightly interlinked. On the one hand, state-of-the art methods for automated image processing require large training datasets with high-quality image annotations. These datasets can only be created efficiently with specialized software. On the other hand, specialized software for manual image annotation alone is not sufficient to cope with the increasing volume of imaging data and requires the integration of (semi-)automatic methods for efficient and effective image analysis. Still, fully automated processing of marine imaging data may never be achieved in all conceivable scenarios of marine imaging, and manual image annotation will likely continue to play an essential role in this field. With a growing interest in marine environmental monitoring and exploration, as well as continuing technological advances, the demand for both annotation software and methods for automatic processing will continue to increase in the foreseeable future. Both must continually and jointly evolve to keep up with demand.
In this paper, we want to describe how annotation software and methods for automatic processing of marine imaging can evolve. We present examples and observations from BIIGLE 2.0 (Langenkämper et al., 2017) which has been publicly available and operating for more than 4 years at biigle.de, and which is used by an international community of over one thousand users (see Figures 1, 2). We present new features and tools of BIIGLE 2.0 that have been developed on the basis of user requests and feedback as an example how a marine image and video annotation software can evolve. In addition, we present usage statistics which have been collected from biigle.de to show how image annotation is currently performed. These observations indicate not only how software such as BIIGLE 2.0 could be further improved but also how the marine imaging community could evolve to make the analysis of marine imaging data more efficient and effective in the future.
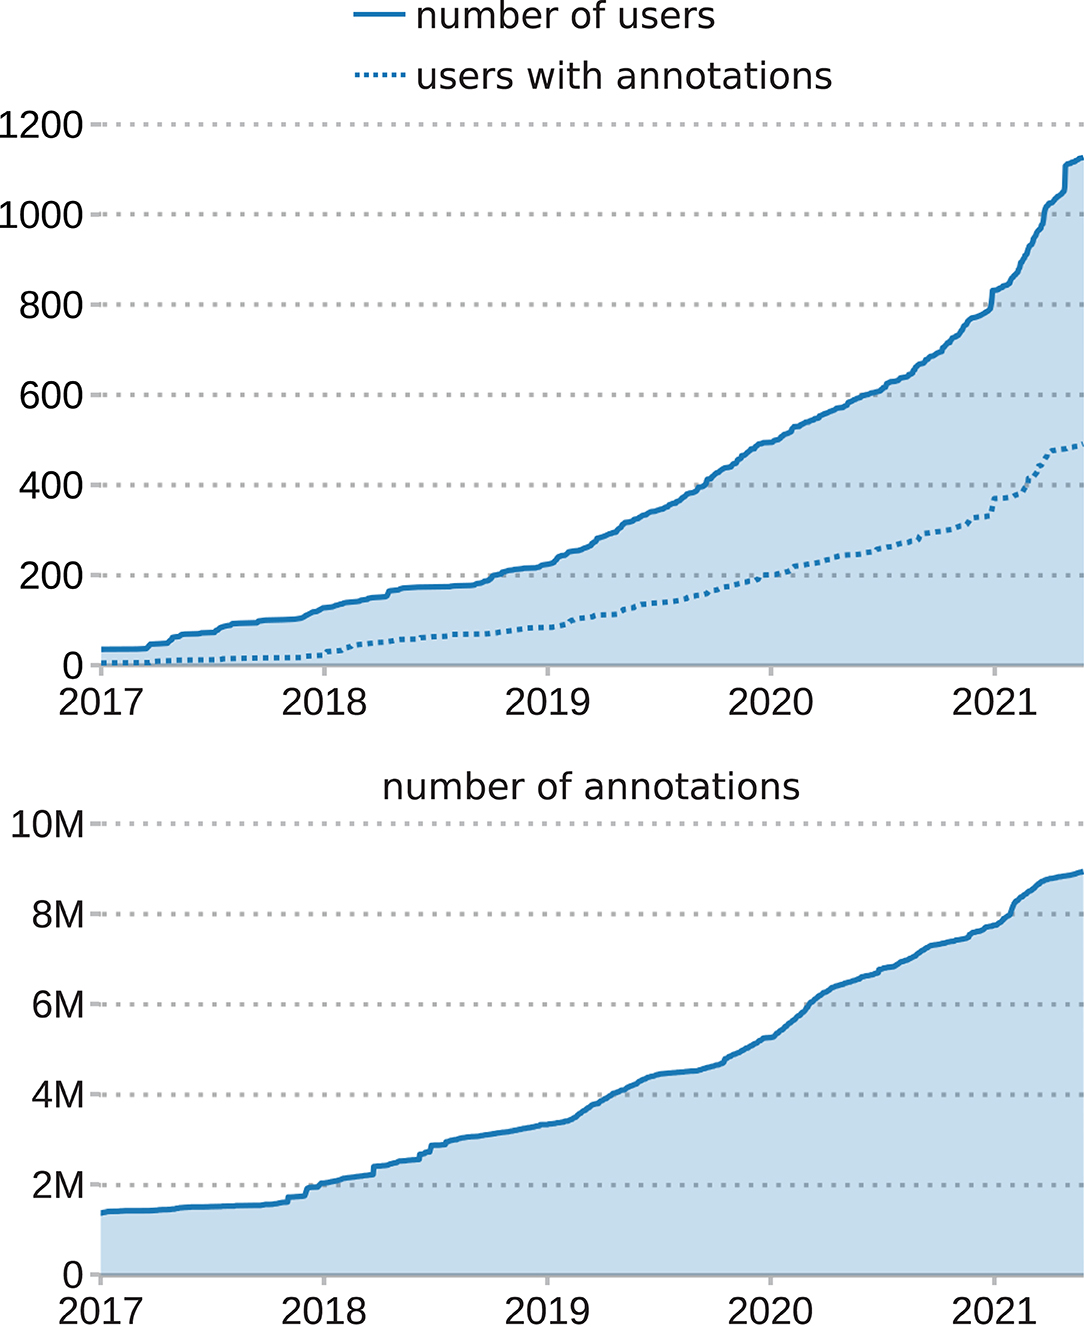
Figure 1. Development of the number of users (top) as well as image and video annotations (bottom) in the BIIGLE instance at biigle.de since 2017. The dotted line represents the number of users with at least one image and/or video annotation.
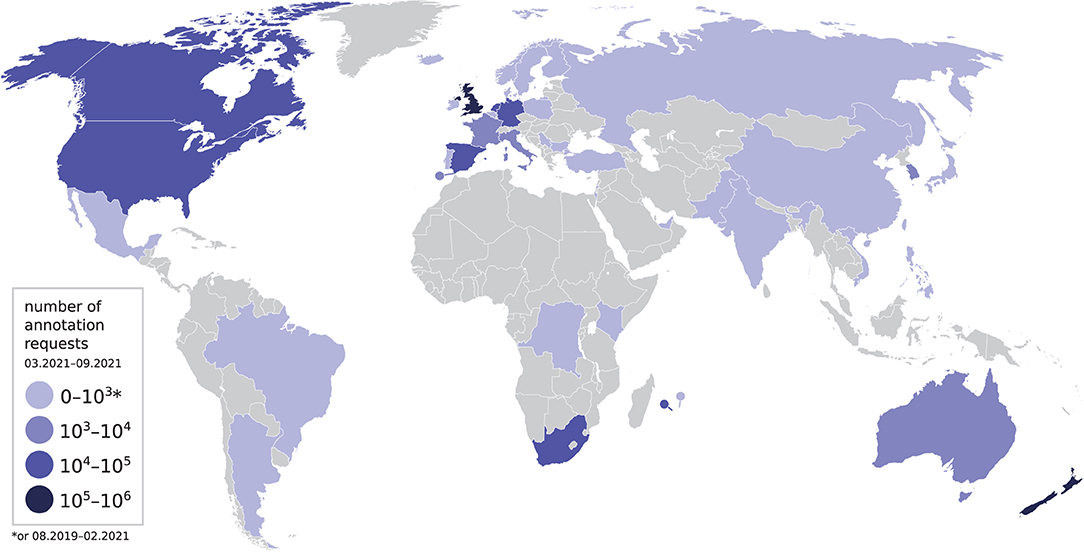
Figure 2. Countries from which annotation requests have been sent to biigle.de between March and September 2021. The countries are split into four groups depending on the number of annotation requests that were sent from the respective country. The group of countries with 0−103 requests also includes countries from which any requests were sent between August 2019 and February 2021.
In the following, BIIGLE 2.0 will be referred to simply as BIIGLE. In the next section of this document, new features and tools of BIIGLE are presented. In section 3, we present observations and statistics on the use of both the existing and the new features and tools of BIIGLE. The implications of the usage observations are discussed in section 4. The paper is concluded in section 5, with recommendations on how computerized support systems for manual and automated image annotation as well as the marine imaging community could evolve to cope with the increasing demand for image annotation in this field.
2. Materials and Methods
After the redesign and full reimplementation of BIIGLE in 2017 (Langenkämper et al., 2017), the software included features and tools that were largely based on lessons learned from the previous version of BIIGLE (Ontrup et al., 2009). Since the publication of the new version, the community of BIIGLE users has grown substantially and has increasingly expressed requests for new features. Based on these user requests, BIIGLE has been continuously extended over the years. Here, we present the major new features and tools.
2.1. Video Annotation
The video annotation tool of BIIGLE was first made available at biigle.de in 2019. It was implemented to have a similar user interface (UI) than the existing image annotation tool (Langenkämper et al., 2017, section 3) to keep the learning effort for users shifting between image and video annotation low. However, some key components of the video annotation tool are different. The most notable difference is that video annotations can span multiple video frames and change their position and/or shape along with the objects of interest (OOIs) that they mark.
The UI of the video annotation tool consists of a main view which displays the video, colored outlines of video annotations and an overview minimap (see Figure 3A). At the bottom of the main view there is a control panel with buttons for video playback and annotation instruments (see Figure 3B). To the right of the main view there is the sidebar with tabs such as a list of all annotations on the video or all “label trees” that are available for annotation (see Figure 3C). In BIIGLE, label trees refer to hierarchical lists of labels for OOIs. In addition to these UI elements that are similar to the image annotation tool, the video annotation tool also includes a “timeline” below the main view (see Figure 3D). The timeline was inspired by UI elements of professional video editing software (e.g., DaVinci Resolve®) and offline video annotation tools [e.g., ANVIL (Kipp, 2001) or VCode (Hagedorn et al., 2008)]. It provides an overview over all annotations on the video, indicating the positions (i.e., times) of “single-frame” annotations, that mark an OOI in a single video frame, as well as the start and end positions or gaps of “multi-frame” annotations, which span a specific period of time of the video. Gaps in multi-frame annotations can be used if, for example, the OOIs that they mark disappear from the visible area of the video and reappear later. Annotation indicators are grouped by label and colored in the color associated with the label that is attached to each annotation. The timeline also indicates the current time of the video and allows users to freely move the video playback to a specific point of time or to a time associated with an annotation.
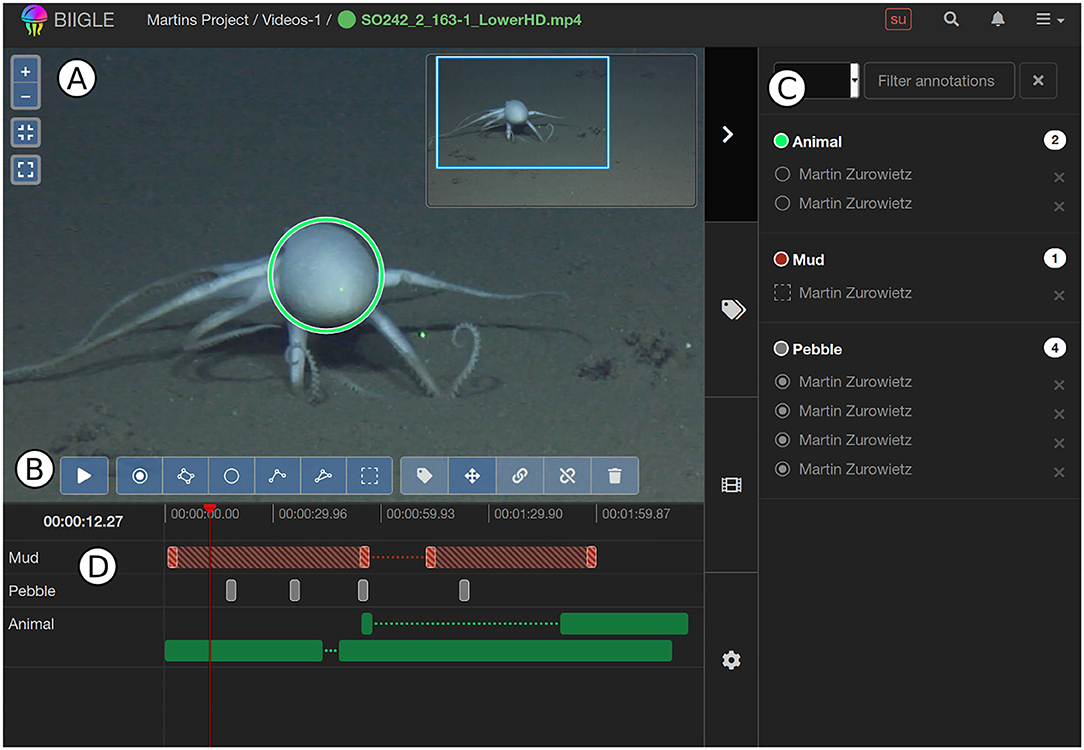
Figure 3. User interface of the BIIGLE video annotation tool: (A) Main display of the video showing the colored outlines of the annotations and the overview minimap. (B) Buttons for video playback and to toggle annotation instruments. (C) Timeline showing the current time of the video as well as indicators for all annotations in the video (indicators for annotations that mark the whole video frame are crosshatched, gaps in annotations are shown as dotted lines). (D) Sidebar with the open tab containing a list of all annotations on the video. Source of the annotated video: (Purser et al., 2016), licensed under CC BY NC 3.0 (https://creativecommons.org/licenses/by-nc/3.0/).
A video annotation consists of one or more “key frames.” Each key frame combines a specific point of time in the video with the spatial coordinates of the video annotation. Single-frame video annotations consist of only one key frame and are comparable to still image annotations. Multi-frame video annotations consist of many key frames. During video playback, the spatial coordinates of multi-frame annotations are linearly interpolated between key frames. The concept of multi-frame video annotations with gaps and interpolated spatial coordinates was inspired by the Computer Vision Annotation Tool (Sekachev et al., 2020). The more key frames a multi-frame annotation has, the more accurately it can follow and mark an OOI in the video. To make the annotation of many moving OOIs more efficient, the video annotation tool offers computer assisted object tracking. Starting with an initial single-frame annotation that marks the OOI, the object tracking algorithm (Lukezic et al., 2017) attempts to follow the position and size of the OOI as long as it is visible in the video, automatically extending the annotation with additional key frames.
Based on user feedback, a new WholeFrame annotation shape was implemented in BIIGLE which can be selected from the annotation instruments and is only available for video annotations (see Figure 3B). A WholeFrame video annotation marks one or more entire video frames and is visually distinguished through a crosshatch pattern from annotations with other shapes in the video timeline (see Figure 3D).
In the initial version of the video annotation tool, single videos were directly associated to annotation projects. This was changed later with the implementation of “video volumes” which behave similar to the existing “image volumes.” In BIIGLE, a “volume” refers to a collection of images or videos which is associated to an annotation project. Video volumes now offer most of the features already available for image volumes, e.g., sorting and filtering of video collections, tools for quality control or export of annotation reports.
2.2. Gigapixel Image Annotation
Some areas of biology, including marine biology, observe a shift from traditional microscopy to high-resolution digital microscopy. This became apparent when BIIGLE users requested the support for virtual microscopy slides—large images in the gigapixel range—in the image annotation tool. Support for gigapixel image annotation was implemented in BIIGLE in late 2017 and already supported several studies in the marine biology community (Kloster et al., 2020; Burfeid-Castellanos et al., 2021). Gigapixel images differ from regular, smaller images since the original image files cannot be displayed unmodified in a web browser. BIIGLE detects gigapixel images when they are created and preprocesses them to extract smaller image “tiles” for different resolutions of the image. These image tiles are displayed by the annotation tool, which dynamically loads new tiles based on the viewport and zoom level (see Figure 4).
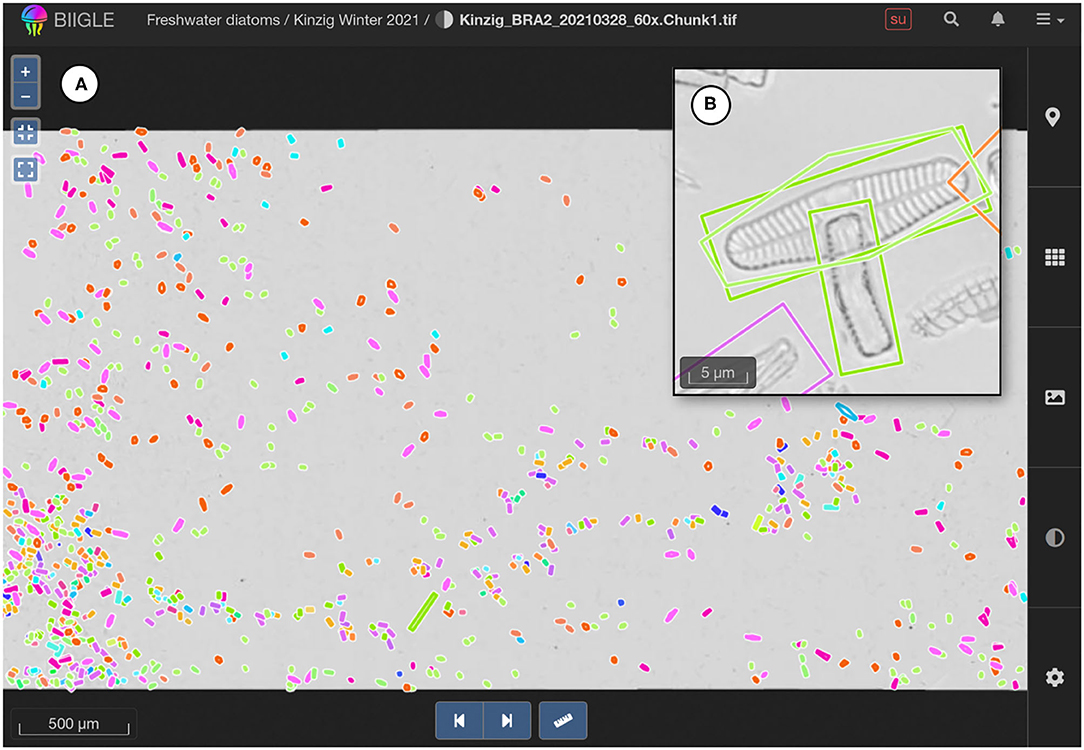
Figure 4. Annotated gigapixel image (virtual microscopy slide, 55, 354 × 28, 112 px). (A) Overview of the full image in the image annotation tool of BIIGLE. (B) Crop of the image in the original resolution (not part of the user interface).
2.3. Machine Learning Assisted Image Annotation
The Machine learning Assisted Image Annotation method (MAIA) (Zurowietz et al., 2018) has been developed to automate the time-consuming detection of OOIs in deep sea images. In a small study with three marine imaging datasets, the authors of MAIA found that collections with more than 200 images can be annotated much faster using MAIA than using traditional purely manual annotation—with the trade-off of missing an estimated 16% of OOIs. The MAIA method consists of four consecutive stages: 1. novelty detection, 2. filtering of “training proposals,” 3. instance segmentation and 4. filtering of “annotation candidates.” The individual stages and their implementation in BIIGLE are described below.
MAIA has been fully integrated into BIIGLE and is available at biigle.de since 2019. Users can configure and start a “MAIA job” that guides the user through the four stages of MAIA for a given image collection in BIIGLE. Among the configuration options for a MAIA job are tunable parameters for the first stage (novelty detection) and the third stage (instance segmentation). By default, a newly initialized MAIA job starts to automatically process the images in the first stage with unsupervised novelty detection. The novelty detection algorithm attempts to find image regions that might contain OOIs without prior knowledge what actually represents an OOI in the images. This is done by applying an autoencoder network (Baldi and Hornik, 1989) to discriminate the “common” sea floor from “novel” potential OOIs in the images. Once complete, this stage returns a set of potential OOIs called “training proposals” that can be used to train a more accurate machine learning model for object detection in the third stage (instance segmentation).
In the second stage of MAIA, the training proposals are manually filtered and refined by a human observer who selects only those proposals that actually show OOIs relevant to the current research question. In BIIGLE, only a maximum of 50,000 training proposals are displayed in this stage, since an unlimited number could take too long to manually filter. As with the video annotation tool, the UI of MAIA in BIIGLE adheres as much as possible to existing UI elements and interaction patterns. To this effect, the training proposals are displayed in a regular grid (see Figure 5A), similar to the existing Label Review Grid Overview (Largo) tool of BIIGLE (Langenkämper et al., 2017, section 3.3). As in Largo, users can quickly scroll through the list of training proposals and select those that show relevant OOIs. Next, users are guided to refine the selected training proposals, adjusting their size and position, since they may not always perfectly enclose the OOIs that they mark. This is done in a view that largely resembles the image annotation tool of BIIGLE (see Figure 5C). Adding to the MAIA workflow described in the original publication, unselected training proposals are also shown in the refine view and can be selected there. This feature was implemented because sometimes OOIs can be identified better within the context of the full image. The refine view only offers a very limited set of annotation instruments for this task, though. Users should be encouraged to quickly step through the selected training proposals but not spend much time on searching and annotating additional OOIs that were missed by the novelty detection.
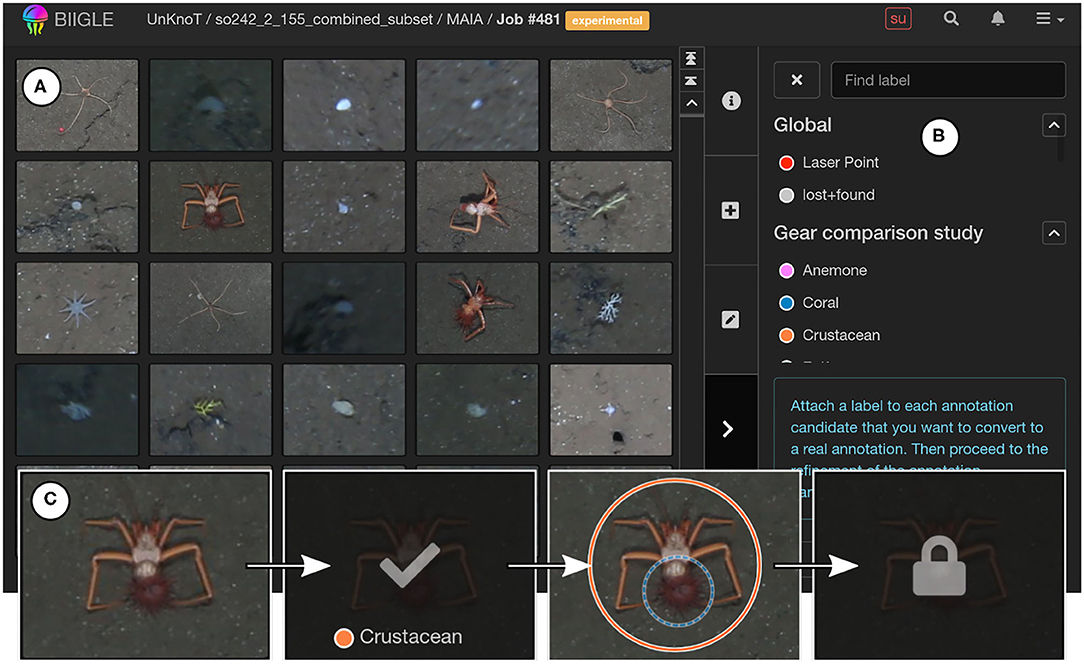
Figure 5. User interface of MAIA in BIIGLE. (A) Training proposals and annotation candidates are shown as thumbnails in a large regular grid (this picture shows annotation candidates). (B) Labels to select annotation candidates can be chosen from a list of label trees in the sidebar. (C) Exemplary interaction with an annotation candidate thumbnail. First, the user inspects the candidate to identify an OOI. Next, the user selects the candidate with the appropriate label. Then the annotation candidate is refined in the original image to exactly mark the OOI (unselected annotation candidates are shown with a dashed outline). Finally, the candidate is converted to a real annotation and locked in the MAIA user interface.
The selected and refined training proposals are used to train a machine learning model for instance segmentation in the third stage of MAIA. The instance segmentation is performed on all images of the image collection to find a single object class “interesting,” using a variant of the Mask R-CNN deep neural network (He et al., 2017). As the machine learning model of this stage is trained in a supervised way with examples of actual OOIs, the object detections returned by this process are more accurate than the training proposals of the first stage of MAIA. The object detections produced by this stage are called “annotation candidates.”
In the fourth stage of MAIA, the annotation candidates are again manually filtered and refined by a human observer. This process is done in a similar way and with a similar UI than the filtering and refinement of the training proposals in the second stage of MAIA. The only difference is that the user now also chooses a label from a label tree to select and classify a relevant annotation candidate (see Figure 5B). As in the second stage of MAIA, users can select annotation candidates both in the regular grid and in the refine view. Selected and refined annotation candidates are finally converted to regular image annotations.
In contrast to a fully automatic method where detection results would be accepted blindly, MAIA still requires user interaction and manual validation of the detection results to ensure high quality annotations. In addition, manual validation mitigates the tradeoff between the recall (i.e., the ratio of successfully detected OOIs) and the precision (i.e., the ratio of correct detections) of a machine learning method, as often an optimized recall results in a lower precision or vice versa. With MAIA, the recall can be optimized and a lower precision is compensated with manual validation.
A feature that was frequently requested by BIIGLE users in the context of MAIA was the ability to apply a trained machine learning model of the third stage of a finished MAIA job to a new image collection. This idea inspired the development of Unsupervised Knowledge Transfer for Object Detection in Marine Environmental Monitoring and Exploration (UnKnoT) (Zurowietz and Nattkemper, 2020). Research leading to the development of UnKnoT found that the transfer of an object detection model from one image collection to another is not straight forward. With UnKnoT, however, this transfer can be achieved for cases where similar OOIs are visible in the images and the relative area shown by the images is known. This information is used to adapt the (annotated) source image collection to the scale of the (unannotated) target image collection, and then by retraining the machine learning model on the adapted/scaled annotations. In the original publication of UnKnoT, the relative image area was estimated based on the distance of the camera to the sea floor. In the implementation in BIIGLE, the image area can also be directly imported in the image metadata or calculated using automatic laser point detection, as this metadata information turned out to be more common than the distance to the sea floor.
UnKnoT has been implemented in BIIGLE and is available at biigle.de since 2020. It offers an alternative to novelty detection to provide training data for the third stage of MAIA if an annotated source dataset meeting the requirements of UnKnoT is available. In addition to that, users can also choose to use (a subset of) the existing image annotations of the given image collection as training data for the machine learning model of the third stage. The original implementation of MAIA was limited to the application on deep sea image datasets, owing to the way the novelty detection of the first stage works. UnKnoT and the option to select existing annotations as training data extend the potential applications of MAIA in BIIGLE to possibly any other marine imaging domain.
2.4. Mobility and Affordability
Among the requirements that have been identified for marine image annotation software such as BIIGLE is the ability for universal deployment (Gomes-Pereira et al., 2016). Part of this requirement is the goal to deploy the software in different scenarios such as a mobile off-shore deployment on a research ship or an on-shore deployment in a research institute. Also, capacity building in scenarios where special hardware and internet access are unavailable or unaffordable is becoming increasingly important in the context of biodiversity research (Schmeller et al., 2017; Gustafsson et al., 2020). Since 2017, the application architecture of BIIGLE has been improved to allow a flexible (mobile) deployment (Zurowietz et al., 2019). BIIGLE can now run on a wide variety of hardware platforms, ranging from large cloud-based operations to the deployment on a mobile and cheap single chip computer such as a Raspberry Pi, which is still powerful enough to serve as a multi-user annotation system on a smaller scale. In addition to the main instance on biigle.de, BIIGLE has now been deployed as a mobile instance on multiple research cruises and several research institutes maintain their own stationary instance.
2.5. Application Instance Federation
One requirement for marine image annotation software that has not been identified by Gomes-Pereira et al. (2016) is the ability to transfer and synchronize information between different application instances. This need arises naturally whenever there is fragmentation of data between multiple application instances that are deployed in different settings (see section 2.4).
The ability to transfer and synchronize data between multiple application instances has been added to BIIGLE in 2018. It allows to transfer user accounts, label trees and/or image or video collections (including annotations) between application instances. In the case of user accounts and label trees, the information is synchronized and merged with existing user accounts and label trees in the target instance. A typical use case for data synchronization is a temporary application instance that is set up for the duration of a research cruise. When the temporary instance is prepared, existing users and label trees are transferred from a permanent application instance of the research institute. During the research cruise, images, videos, annotations and maybe new user accounts or label trees are added to the temporary application instance. Once the research cruise is finished, all data gathered in the temporary application instance is transferred and merged back into the permanent application instance of the research institute.
Another benefit of the ability for universal deployment of image annotation software is that research institutes can maintain their own (internal) application instances. This allows them to implement their own policies for user and data management, and to keep possibly confidential datasets in-house. This causes another type of data fragmentation than between permanent and temporary application instances described above, which cannot be easily solved with data transfer and synchronization. Still, users of BIIGLE requested a way to share data between permanent application instances, aiding collaboration between research institutes. To this end, the federated search feature was added to BIIGLE in 2020. The federated search connects two or more BIIGLE application instances which regularly share a search index of their database. This allows users of one application instance to find annotation projects, image or video collections as well as label trees of all connected application instances with a single search query in their own instance. Search results redirect to the respective resources of the BIIGLE instance in which they are stored, saving users the time to search in each individual instance.
2.6. Label Tree Collaboration
Labels that are used to classify annotations are an essential component of marine image annotation and there is a continued effort to establish standardized label collections in the field (Howell et al., 2019). To aid this effort, BIIGLE introduced the concept of label trees—collections of hierarchically organized labels that can be created and edited collaboratively by multiple users. In addition, standardized labels can be imported from the WoRMS database of marine species (WoRMS Editorial Board, 2021). Label trees have been continuously enhanced since the original publication of BIIGLE in 2017.
Since 2019, label trees support versions which mark a fixed state of a label tree at a specific point of time. Label tree versions can ensure that the exact same set of labels is reused throughout different studies. Furthermore, label tree versions can be exported as a ZIP archive file and be associated with an external digital object identifier (DOI). This allows users to publish the ZIP archive of a label tree (version) in a long term archive such as Zenodo (zenodo.org) which can assign a DOI to the label tree [e.g., the CATAMI (Althaus et al., 2015) v1.4 label tree (Zurowietz, 2019)]. Such a published label tree can be referenced in publications—along with complementing guidelines on the identification of the OOIs referenced by the label tree—to aid reusability and reproducibility of research studies. Label trees can also be imported in BIIGLE using the same ZIP archive format, which was a frequently requested feature by users. Often, research institutes already maintain their own taxonomic catalogs and the import is a convenient way to reproduce existing catalogs as label trees in BIIGLE.
For enhanced collaboration, label trees in BIIGLE can now be copied, modified and then merged back into the original label tree. This workflow was inspired by software development best practices, where source code is copied (“forked”), the copy is modified and then the modifications are reviewed and merged back into the original source code. This practice is very successful for large communities of software developers and could be equally successful for collaboratively created and maintained label trees.
3. Results
Since the initial publication in 2017, we observed an increasing interest in BIIGLE with continuously rising numbers of users and annotations in the main instance at biigle.de. Here, we have collected usage statistics of the main instance between January 1st, 2017 and May 26th, 2021 that we found of most interest for the marine imaging community. The usage statistics indicate how image annotation is currently performed with a tool such as BIIGLE and how image annotation tools as well as the marine imaging community could further evolve.
3.1. Development of Usage
As of May 26th, 2021, the BIIGLE instance at biigle.de had 1,125 users, of which 1,061 have logged in at least once. The users created more than 8.4 Million image annotations on more than 1.2 Million images and almost 240,000 video annotations on more than 830 h of video material (additional information can be found in the Supplementary Material). These annotations were created from more than 40 different countries worldwide (see Figure 2). Of the 1,061 active users, 518 (49%) have created at least one annotation and half of these have created more than 205 annotations (see Figure 6). About 200 users have created more than 1,000 annotations each and 825,000 is the highest number of annotations created by a single user.
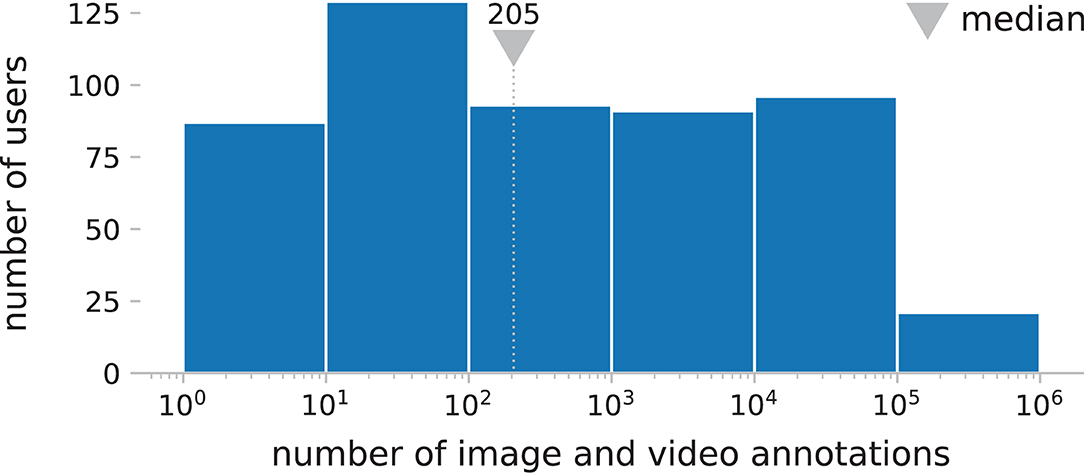
Figure 6. Number of users grouped by the number of image and video annotations they have created on biigle.de. Out of a total of 1,061 users who have ever logged in, 518 (49%) have created at least one annotation. Half of these have created more than 205 annotations. No user has created more than 106 annotations.
The development of the number of users and annotations shown in Figure 1 indicates a linear increase between the beginning of 2019 and the end of 2020. After that, the rate of new user registrations seems to rise substantially, while the rate of new image and video annotations stays the same. Also in 2020 we have observed an increased interest of users to apply BIIGLE in teaching. In courses with up to 50 participants, students practiced the identification and annotation of OOIs in videos, regular images and virtual microscopy slides (see section 2.2).
3.2. Popular Annotation Shapes
BIIGLE provides six different geometric shapes for image and video annotations (see Figure 7, WholeFrame is only available for video annotations and Ellipse is only available for image annotations). Point, Circle, Polygon, Rectangle and Ellipse are basic geometric shapes. The LineString shape can be a simple line with two vertices but can also include more vertices (like a polygon that is not closed). WholeFrame marks an entire frame of a video. With more than 60%, the vast majority of image and video annotations use the Point shape, even if laser point annotations—which are most often annotated with points—are excluded. With the exception of the LineString shape (as well as WholeFame and Ellipse), the ranking of annotation shapes by their usage percentage is the same for image and video annotations. LineString is used more often than Rectangle for video annotations but less often for image annotations. The Ellipse shape has a very low share of 0.2% among image annotations.
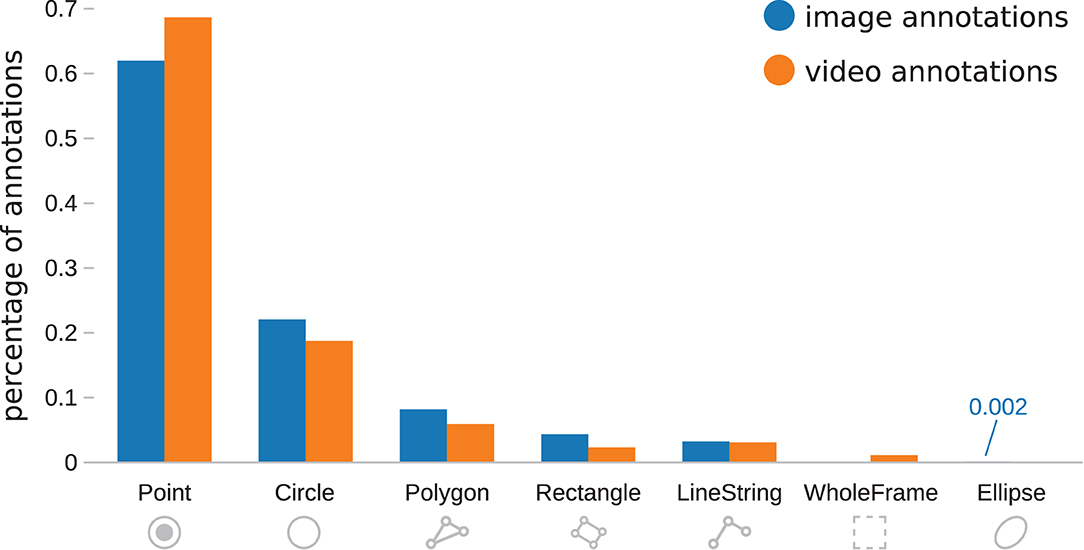
Figure 7. Comparison of the percentage of annotation shapes used for image annotations and video annotations. The WholeFrame shape is only available for video annotations and the Ellipse shape is only available for image annotations. Image annotations for laser points or created by using MAIA (see Section 2.3) are excluded. The vast majority of annotations have the Point shape.
3.3. Video Annotation Types
Video annotations can be either single-frame or multi-frame annotations (see section 2.1). About 85% of the almost 240,000 video annotations on biigle.de are single-frame annotations.
3.4. Average Annotation Time
To assess the time a user needs to create a new image or video annotation, we have determined the average time between any two consecutive annotations of a user. We excluded image annotations that were created using MAIA, as well as annotations with a time distance of less than 1 s, as these were likely also created in an automated way through the BIIGLE API. In addition, we excluded all annotations with a time distance larger than 15 min, as these likely no longer belong to the same annotation “sequence.” With these restrictions, a total of 4,622,274 image annotations of 441 different users and 236,561 video annotations of 89 different users were collected.
Most new image annotations were created in a time window of 1–30 s (see Figure 8). The number of users who took longer than 30 s to create new image annotations gradually decreases and only few users took longer than 3 min. The median time between two new image annotations of a user is 40.3 s. Different to image annotations, most users took 60–120 s to create new video annotations. Only after 2 min the number of users decreases substantially for video annotations. With 87.6 s, the median time between two new video annotations of a user is more than twice as high than the median time between two new image annotations.
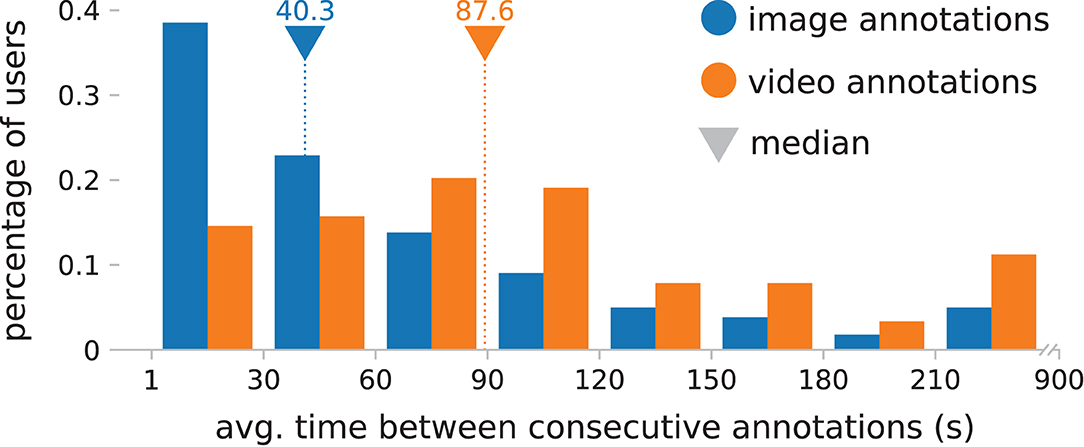
Figure 8. Percentage of users grouped by the average time between any two of their consecutively created annotations, which are at least 1 s and at most 15 min apart. Image annotations created by using MAIA (see section 2.3) are excluded. The median of the average time it takes to create a video annotation is more than twice as high as the median for image annotations.
3.5. Collaboration
Image and video volumes in BIIGLE and can be annotated collaboratively by many users. On biigle.de about 60% of the 1,775 annotated image volumes and about 70% of the 152 annotated video volumes were annotated by only a single user (see Figure 9). Almost 20% of the annotated image and video volumes were annotated by exactly two and 12–21% by more than two different users.
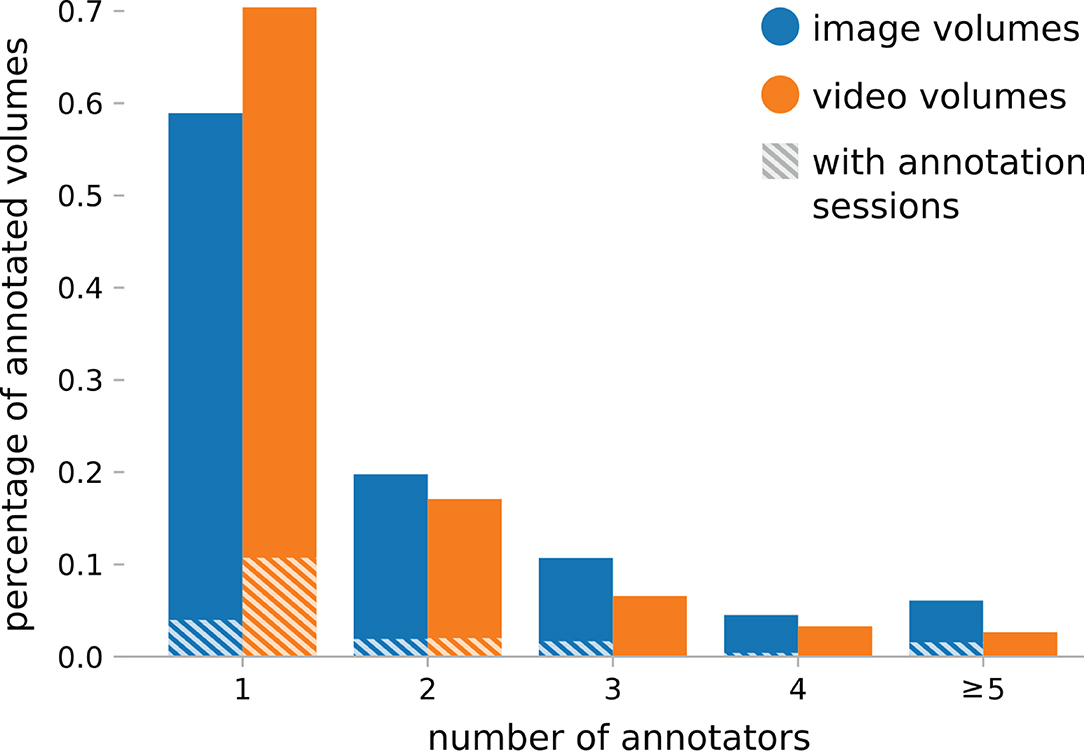
Figure 9. Percentage of annotated image and video collections (volumes) on biigle.de, grouped by the number of distinct users who created annotations in the volume. The majority of volumes was annotated by only a single user. Only a low percentage of the volumes used annotations sessions that allow to determine the intraobserver and/or interobserver agreement.
BIIGLE provides a feature for “annotation sessions” (Langenkämper et al., 2017, section 3.4). In an annotation session, users can choose to hide their previous annotations and/or the annotations of other users to annotate the same images or videos again. After annotation, reports can be exported for each annotation session and users can determine the intraobserver and/or interobserver agreement (Schoening et al., 2016) of the annotations. Only 9.3% of the annotated image volumes and 13.1% of the annotated video volumes used annotation sessions. Notably, only 6.6% of the image volumes and 15.0% of the video volumes with a single annotator used annotation sessions. A single annotator could use annotation sessions to reannotate images (with previous annotations hidden) and use the two sets of annotations to determine their own intraobserver agreement.
Label trees in BIIGLE can also be created collaboratively and shared across multiple annotation projects. Of the relevant label trees (see Figure 10), about 60% are used by only a single project and curated by only a single user. Thirty-eight percent of the label trees (140) are used by more than one project and the most shared label tree is used by 22 different projects. Forty-four percent of the label trees (161) are curated by more than one user and the highest number of collaborators on a single label tree is 30.
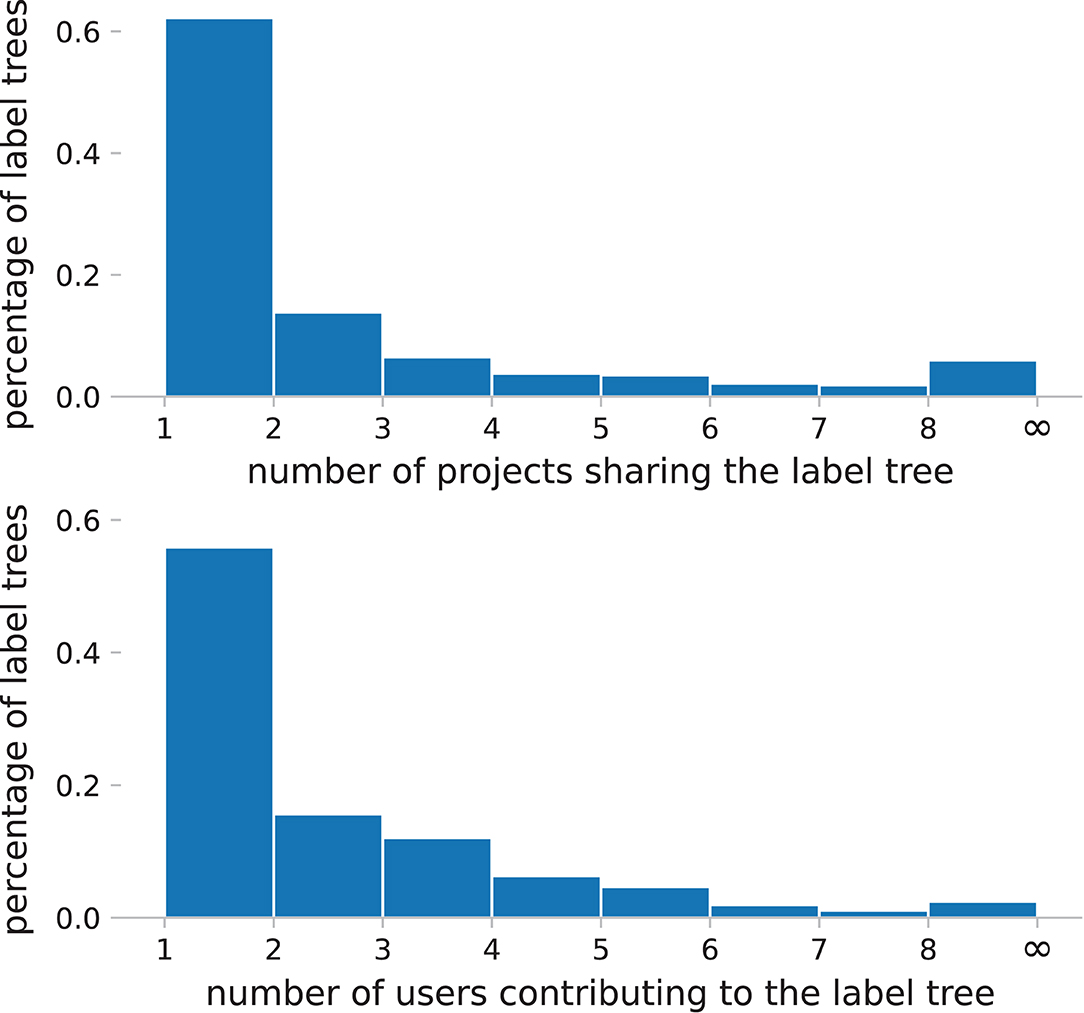
Figure 10. Percentage of label trees on biigle.de, grouped by the number of projects sharing the label tree (top) and the number of users contributing to the label tree (bottom). The majority of label trees is used by only a single project and is curated by only a single user. The following label trees were excluded for this figure: The global label tree attached to new projects by default, the label tree of the “demo” project, label trees without labels, label trees without project and label trees called “test”.
3.6. Use of Automated Assistance
Of all image volumes that have been created on biigle.de, 2,217 non-empty ones were created since MAIA has been made available as the first method for automated assistance for image annotation in BIIGLE. Six percent of these volumes (129) have used MAIA to generate a total of 1,899,545 annotation candidates. Twenty percent of the annotation candidates (376,837) were manually converted to real annotations, which amount to 7.2% of the total 5,214,280 image annotations that were created on biigle.de since MAIA has been made available.
4. Discussion
Since the initial publication of BIIGLE, many new features have been implemented and made available on the main instance at biigle.de (see section 2). A large proportion of the updates and new features was done based on feedback and requests of users. Over the years, the international community of users has been growing continuously along with the number of annotations (see Figure 1). The substantial increase of the rate of new users beginning in 2020 could be explained with the simultaneous increasing interest in the application of BIIGLE for teaching. With the sudden increase in online and remote teaching courses because of the Corona pandemic during the year, more teachers in higher education discovered the advantages of a multi-user web application for image and video annotation. The increased application for teaching could also be an explanation for the distribution of annotations per user shown in Figure 6. Teaching classes are likely to introduce many new users who do not create many annotations. Related to this is also the development of new techniques and workflows for digital microscopy (Burfeid-Castellanos et al., 2021a, in review)1 that were enabled through gigapixel image annotation support in BIIGLE (see section 2.2). Other established software tools such as OMERO (Allan et al., 2012) in this field focus more on data management, whereas BIIGLE focuses on fully-featured and collaborative annotation. Students are now taught how to annotate virtual microscopy slides directly in BIIGLE, which also leads to increasing numbers of users with a background in teaching.
A surprising observation was that only about half of the active users on biigle.de have created annotations (see section 3.1). One possible explanation could be that BIIGLE is not only used for annotation but also in a large part for the exploration and presentation of images, videos and annotations. As there is no concept of making data from BIIGLE directly available without a login, a user account is required to access the data. This interpretation also confirms the utility of an annotation tool as a web application, as it enables data sharing and collaboration across the research institutes, universities, countries and continents.
Overall, the acceptance of BIIGLE as an image and video annotation tool in the marine imaging community seems to increase. In part, this could hint at the rising demand in annotation systems in general, caused by rapidly increasing volumes of marine imaging data. Another contributing factor could be that one fundamental design principle of BIIGLE is a high-quality and efficient user interface (UI). Our concept of a high-quality and efficient UI consists of a consistent color scheme for the UI, the reuse of familiar UI elements and interaction patterns where possible (e.g., image and video annotation tool, see Figure 3, or Largo and MAIA, see Figure 5) as well as a reduced information density of the UI that can be optionally increased where necessary. Furthermore, the UI should support and encourage efficient workflows, e.g., in the filtering and refinement steps of MAIA (see section 2.3). We believe that such a high-quality UI is critical for efficient and effective annotation workflows and the acceptance of a tool such as BIIGLE in general. This is confirmed by feedback of users who recommend BIIGLE because of its efficient UI.
Another notable observation is the dominance of point and circle annotations both for image and video annotations (see Figure 7), as well as single-frame annotations for video annotations (see section 3.3). In all cases, users chose the simplest annotation shape and annotation type that requires the least effort (i.e., number of mouse clicks) to create. Effectively, this means that video annotation is mostly performed like image annotation on single video frames. Still, video annotation seems to be used for different tasks than image annotation, as indicated by the difference in the average time to create image and video annotations (see Figure 8). Another contributing factor could be the additional time a user needs to browse for a specific frame that should be annotated in the video, compared to image annotation where this is not necessary. One of the supposedly biggest advantages of videos over still images is the ability to identify moving OOIs in videos much better than motionless OOIs in images. While the OOIs might never be identified (as accurately) in still images, the identification in videos takes more time. This leads to different use cases for image and video annotation. Image annotation can be faster for studies that count OOIs (e.g., biodiversity assessment), whereas video annotations can be more accurate for the detection of rare events (e.g., the occurrence of a rare species) or for habitat classification.
The very high percentage of point annotations both for image and video annotations could indicate that most annotation studies are only interested in the occurrence of OOIs and not the area or size. Another explanation could be that annotation protocols prescribe the use of point annotations because they were created for older annotation software with more limited capabilities. Users could stick to point annotations out of habit or the need to maintain comparability with previous annotation studies. This could also be true for the high percentage of single-frame video annotations. Users could stick to this type of annotation because no previous video annotation tool for marine imaging exists that offers annotation types such as multi-frame annotations with automatic object tracking. This presumption is supported by the fact that—after more than 2 years of operation and increasing usage—we have received very little feedback and user requests on the video annotation tool. Users seem to have no reference for an “ideal” video annotation tool or a “standard” video annotation workflow for marine imaging and hence are not missing any features that they might require for their work. Since the video annotation tool in its current form was only our best guess at how video annotation could work for marine imaging, there could be a huge potential for improvements to tools and workflows for marine video annotation based on user feedback.
Another key observation is the distribution of the number of distinct annotators of a given volume (see Figure 9). By far the most volumes were annotated by only a single user. Likewise, most label trees are curated by only a single user and used in only a single annotation project (see Figure 10). On the other hand, about 40% of the image and video volumes were annotated by more than one user and about 40% of the label trees are used in up to 22 different projects and curated by up to 30 users. While this observation highlights the need for annotation tools to support collaboration as indicated by Gomes-Pereira et al. (2016), it also shows that the majority of annotation tasks are still done by only a single researcher. Furthermore, only a small fraction of the volumes used annotation sessions which enable the assessment of intra- and interobserver agreement of one or more annotators. This is contrary to recommended annotation best practices (Schoening et al., 2016) where repeated annotation to determine the intraobserver agreement of a single annotator is the minimum requirement for reliable annotations. Even of the volumes with two or more different annotators almost none used annotation sessions to determine the interobserver agreement. The most likely reason for the observed predominance of little collaboration and annotations not adhering to best practices is tight time constraints for researchers and studies. Any annotation task is time-consuming and a doubled time because of repeated annotation is likely not acceptable in many scenarios. Some studies may have access to multiple annotators who can annotate in parallel and—using annotation sessions—determine the interobserver agreement afterwards to produce reliable annotations. In other cases, automated assistance such as MAIA could be an alternative where a single annotator could perform multiple repeated annotation sessions faster than without automated assistance. In addition, BIIGLE does not yet offer a way to calculate the intra- and interobserver agreement automatically. Matching between annotations that should mark the same OOI is not an easy problem to solve and can also be done differently depending on the type of annotation study. For now, BIIGLE leaves this calculation up to the users which may contribute to the little adoption of annotation sessions.
The current state of automated assistance for marine image and video annotation leaves much room for further improvements or new computer vision approaches to this task. MAIA for automated annotation assistance has been employed in BIIGLE to some success (see section 3.6) but still the majority of annotation studies are conducted purely manually. In the same reasoning as outlined previously, users could stick to manual annotation out of habit or the need to maintain comparability with previous annotation studies. Also, there may be a need to establish more trust toward automated methods and to validate their capabilities with additional studies. Furthermore, MAIA in BIIGLE could originally be only applied effectively on deep sea images. The extended capabilities with UnKnoT may have yet to be discovered by users. Many ideas exist to improve automated assistance in BIIGLE (e.g., through automated classification, semi-automatic filtering of proposed detections or improved user interactions). Any of these methods for automated assistance have yet to be ported to the task of video annotation as well. This could be a big opportunity to not only encourage collaboration on the level of image and video annotation studies but also on the level of software development for annotation tools. In 2019, the source code of BIIGLE has been published under an open and permissive GPL v3.0 license (github.com/biigle). We encourage everyone to participate in the continued development of BIIGLE with feedback, open discussion or code contributions.
5. Conclusion
We have presented the most important new features of the image and video annotation tool BIIGLE that have been developed since the initial publication in 2017. These features have been developed largely based on user requests and feedback, and can give an example how a marine image and video annotation tool can evolve over time. Our experience has shown that a continuous development process and a feedback cycle with the community of users is crucial to keep up with changing demands and the rapidly increasing volume as well as diversifying types of imaging data in the field of marine science.
Our usage observations of the main BIIGLE instance at biigle.de and the new developments for BIIGLE can be summarized with the following key findings for marine image annotation software:
• In addition to still images, other modalities such as videos and gigapixel images are increasingly used in marine imaging and should be supported by annotation tools (see sections 2.1, 2.2). In the case of video annotation, a best practice specification needs to be established to ensure efficient and standardized workflows as well as the improvement of available tools.
• There is a continuous demand for automated processing and/or assistance for annotation. The impressive developments in this field have a great potential to lead to more efficient annotation workflows (see section 2.3). However, systems for automatic annotation assistance still seem far from being the default choice for annotation tasks as they are performed in BIIGLE. Better communication between the developers and the users of these systems can help to build trust in the systems as well as improve them further.
• Application development should consider mobility and affordability to enable capacity building in scenarios with limited resources (see section 2.4). This is especially relevant in the context of biodiversity research where areas of particularly high biodiversity can often have less developed infrastructure. Furthermore, an efficient and high-quality user interface can contribute substantially to the success and acceptance of an annotation tool and should not be neglected during the development.
• Collaboration between users of the same application instance as well as different application instances should be supported, as it is crucial for interdisciplinary research across research institutes and countries. This is not only relevant for the task of image or video annotation itself but also to enable sharing of datasets and observations (see section 2.5), the collaborative development of common nomenclatures (see section 2.6) or online teaching.
Current annotation protocols are in need to be revised. They should make use of the capabilities of newer technologies and tools for a more efficient and effective annotation process, as well as collaboration for more reliable annotations. Protocols should encourage the use of methods for automated assistance and the adherence of annotation best practices wherever possible. The demand for image and video annotation tools will rise in tandem with the demand for image and video annotation in marine science. The increasing use in teaching adds to this demand and introduces even more requirements for these tools. A healthy and open discussion as well as close collaboration between the developers and the users of annotation tools will be the best strategy to keep the software evolving, and to meet future demands and new requirements.
Data Availability Statement
Publicly available datasets were analyzed in this study. The source code of BIIGLE 2.0 is publicly available at https://github.com/biigle.
Author Contributions
MZ and TN contributed to all aspects of designing the software and method, preparing the paper and reviewing it. MZ implemented the software and method, collected and evaluated the usage statistics presented in this manuscript. All authors contributed to manuscript revision, read and approved the submitted version.
Funding
This work was supported by BMBF project COSEMIO (FKZ 03F0812C) and by the BMBF-funded de.NBI Cloud within the German Network for Bioinformatics Infrastructure (de.NBI) (031A537B, 031A533A, 031A538A, 031A533B, 031A535A, 031A537C, 031A534A, 031A532B). We acknowledge the financial support of the German Research Foundation (DFG) and the Open Access Publication Fund of Bielefeld University for the article processing charge.
Conflict of Interest
The authors declare that the research was conducted in the absence of any commercial or financial relationships that could be construed as a potential conflict of interest.
Publisher's Note
All claims expressed in this article are solely those of the authors and do not necessarily represent those of their affiliated organizations, or those of the publisher, the editors and the reviewers. Any product that may be evaluated in this article, or claim that may be made by its manufacturer, is not guaranteed or endorsed by the publisher.
Acknowledgments
We thank Prof. Dr. Bánk Beszteri and the Beszteri phycology lab at the University of Duisburg-Essen for providing the annotated virtual microscopy slides that are used as examples in this publication.
Supplementary Material
The Supplementary Material for this article can be found online at: https://www.frontiersin.org/articles/10.3389/fmars.2021.760036/full#supplementary-material
Footnotes
1. ^Burfeid-Castellanos, A. M., Kloster, M., Beszteri, S., Postel, U., Spyra, M., Zurowietz, M., et al. (2021). Digital microscopy can improve the reproducibility and taxonomic precision of diatom identification. (in review).
References
Allan, C., Burel, J.-M., Moore, J., Blackburn, C., Linkert, M., Loynton, S., et al. (2012). OMERO: flexible, model-driven data management for experimental biology. Nat. Methods 9, 245–253. doi: 10.1038/nmeth.1896
Althaus, F., Hill, N., Ferrari, R., Edwards, L., Przeslawski, R., Schönberg, C. H. L., et al. (2015). A standardised vocabulary for identifying benthic biota and substrata from underwater imagery: the CATAMI classification scheme. PLoS ONE 10:e0141039. doi: 10.1371/journal.pone.0141039
Baldi, P., and Hornik, K. (1989). Neural networks and principal component analysis: Learning from examples without local minima. Neural Netw. 2, 53–58. doi: 10.1016/0893-6080(89)90014-2
Beijbom, O., Edmunds, P. J., Roelfsema, C., Smith, J., Kline, D. I., Neal, B. P., et al. (2015). Towards automated annotation of benthic survey images: variability of human experts and operational modes of automation. PLoS ONE 10:e0130312. doi: 10.1371/journal.pone.0130312
Beijbom, O., Treibitz, T., Kline, D. I., Eyal, G., Khen, A., Neal, B., et al. (2016). Improving automated annotation of benthic survey images using wide-band fluorescence. Sci. Rep. 6:23166. doi: 10.1038/srep23166
Bicknell, A. W., Godley, B. J., Sheehan, E. V., Votier, S. C., and Witt, M. J. (2016). Camera technology for monitoring marine biodiversity and human impact. Front. Ecol. Environ. 14, 424–432. doi: 10.1002/fee.1322
Burfeid-Castellanos, A. M., Martin-Martin, R. P., Kloster, M., Angulo-Preckler, C., Avila, C., and Beszteri, B. (2021). Epiphytic diatom community structure and richness is determined by macroalgal host and location in the south Shetland Islands (Antarctica). PLoS ONE 16:e0250629. doi: 10.1371/journal.pone.0250629
Culverhouse, P., Williams, R., Reguera, B., Herry, V., and González-Gil, S. (2003). Do experts make mistakes? A comparison of human and machine identification of dinoflagellates. Mar. Ecol. Prog. Ser. 247, 17–25. doi: 10.3354/meps247017
Durden, J., Bett, B., Schoening, T., Morris, K., Nattkemper, T., and Ruhl, H. (2016a). Comparison of image annotation data generated by multiple investigators for benthic ecology. Mar. Ecol. Prog. Ser. 552, 61–70. doi: 10.3354/meps11775
Durden, J. M., Schoening, T., Althaus, F., Friedman, A., Garcia, R., Glover, A. G., et al. (2016b). Perspectives in visual imaging for marine biology and ecology: from acquisition to understanding. Oceanogr. Mar. Biol. Annu. Rev. 54, 1–72. doi: 10.1201/9781315368597-2
Gomes-Pereira, J. N., Auger, V., Beisiegel, K., Benjamin, R., Bergmann, M., Bowden, D., et al. (2016). Current and future trends in marine image annotation software. Prog. Oceanogr. 149, 106–120. doi: 10.1016/j.pocean.2016.07.005
Gustafsson, K. M., Diaz-Reviriego, I., and Turnhout, E. (2020). Building capacity for the science-policy interface on biodiversity and ecosystem services: activities, fellows, outcomes, and neglected capacity building needs. Earth Syst. Govern. 4:100050. doi: 10.1016/j.esg.2020.100050
Hagedorn, J., Hailpern, J., and Karahalios, K. G. (2008). “VCode and VData,” in Proceedings of the Working Conference on Advanced Visual Interfaces - AVI'08 (Napoli: ACM Press). doi: 10.1145/1385569.1385622
He, K., Gkioxari, G., Dollar, P., and Girshick, R. (2017). “Mask r-CNN,” in 2017 IEEE International Conference on Computer Vision (ICCV) (Venice: IEEE). doi: 10.1109/ICCV.2017.322
Howell, K. L., Davies, J. S., Allcock, A. L., Braga-Henriques, A., Buhl-Mortensen, P., Carreiro-Silva, M., et al. (2019). A framework for the development of a global standardised marine taxon reference image database (SMarTaR-ID) to support image-based analyses. PLoS ONE 14:e0218904. doi: 10.1371/journal.pone.0218904
Kipp, M. (2001). “Anvil-a generic annotation tool for multimodal dialogue,” in Seventh European Conference on Speech Communication and Technology (Aalborg).
Kloster, M., Langenkämper, D., Zurowietz, M., Beszteri, B., and Nattkemper, T. W. (2020). Deep learning-based diatom taxonomy on virtual slides. Sci. Rep. 10:14416. doi: 10.1038/s41598-020-71165-w
Langenkämper, D., Zurowietz, M., Schoening, T., and Nattkemper, T. W. (2017). BIIGLE 2.0 - browsing and annotating large marine image collections. Front. Mar. Sci. 4:83. doi: 10.3389/fmars.2017.00083
LeCun, Y., Bengio, Y., and Hinton, G. (2015). Deep learning. Nature 521, 436–444. doi: 10.1038/nature14539
Li, X., Shang, M., Qin, H., and Chen, L. (2015). “Fast accurate fish detection and recognition of underwater images with fast r-CNN,” in OCEANS 2015 - MTS/IEEE (Washington, DC: IEEE).
Lukezic, A., Vojir, T., Zajc, L. C., Matas, J., and Kristan, M. (2017). “Discriminative correlation filter with channel and spatial reliability,” in 2017 IEEE Conference on Computer Vision and Pattern Recognition (CVPR) (Honolulu, HI: IEEE). doi: 10.1109/CVPR.2017.515
MacLeod, N., Benfield, M., and Culverhouse, P. (2010). Time to automate identification. Nature 467, 154–155. doi: 10.1038/467154a
Mahmood, A., Bennamoun, M., An, S., Sohel, F., Boussaid, F., Hovey, R., et al. (2016). “Automatic annotation of coral reefs using deep learning,” in OCEANS 2016 MTS/IEEE (Monterey, CA: IEEE). doi: 10.1109/OCEANS.2016.7761105
Moniruzzaman, M., Islam, S. M. S., Bennamoun, M., and Lavery, P. (2017). “Deep learning on underwater marine object detection: a survey,” in Advanced Concepts for Intelligent Vision Systems, eds J. Blanc-Talon, R. Penne, W. Philips, D. Popescu, and P. Scheunders (Antwerp: Springer International Publishing), 150–160. doi: 10.1007/978-3-319-70353-4_13
Morris, K. J., Bett, B. J., Durden, J. M., Huvenne, V. A. I., Milligan, R., Jones, D. O. B., et al. (2014). A new method for ecological surveying of the abyss using autonomous underwater vehicle photography. Limnol. Oceanogr. Methods 12, 795–809. doi: 10.4319/lom.2014.12.795
Ontrup, J., Ehnert, N., Bergmann, M., and Nattkemper, T. W. (2009). “Biigle - web 2.0 enabled labelling and exploring of images from the arctic deep-sea observatory HAUSGARTEN,” in OCEANS 2009-EUROPE. (Bremen: IEEE). doi: 10.1109/OCEANSE.2009.5278332
Proctor, R., Langlois, T., Friedman, A., Mancini, S., Hoenner, X., and Davey, B. (2018). “Cloud-based national on-line services to annotate and analyse underwater imagery,” in IMDIS 2018 International Conference on Marine Data and Information Systems (Barcelona), 49.
Purser, A., Marcon, Y., Hoving, H. J. T., Vecchione, M., Piatkowski, U., Eason, D., et al. (2016). Videos snippets of incirrate octopods observed during SONNE cruise SO242/2 to the DISCOL Experimental Area, Peru Basin. PANGAEA. doi: 10.1594/PANGAEA.865439
Schmeller, D. S., Böhm, M., Arvanitidis, C., Barber-Meyer, S., Brummitt, N., Chandler, M., et al. (2017). Building capacity in biodiversity monitoring at the global scale. Biodivers. Conserv. 26, 2765–2790. doi: 10.1007/s10531-017-1388-7
Schoening, T., Bergmann, M., Ontrup, J., Taylor, J., Dannheim, J., Gutt, J., et al. (2012). Semi-automated image analysis for the assessment of megafaunal densities at the arctic deep-sea observatory HAUSGARTEN. PLoS ONE 7:e38179. doi: 10.1371/journal.pone.0038179
Schoening, T., Köser, K., and Greinert, J. (2018). An acquisition, curation and management workflow for sustainable, terabyte-scale marine image analysis. Sci. Data 5:180181. doi: 10.1038/sdata.2018.181
Schoening, T., Osterloff, J., and Nattkemper, T. W. (2016). RecoMIA–recommendations for marine image annotation: lessons learned and future directions. Front. Mar. Sci. 3:59. doi: 10.3389/fmars.2016.00059
Seiler, J., Friedman, A., Steinberg, D., Barrett, N., Williams, A., and Holbrook, N. J. (2012). Image-based continental shelf habitat mapping using novel automated data extraction techniques. Continent. Shelf Re. 45, 87–97. doi: 10.1016/j.csr.2012.06.003
Sekachev, B, Manovich, N., Zhiltsov, M, Zhavoronkov, A., Kalinin, D., Ben Hoff, T., et al. (2020). opencv/cvat: v1.1.0 (v1.1.0). Zenodo. doi: 10.5281/zenodo.4009388
Solan, M., Germano, J. D., Rhoads, D. C., Smith, C., Michaud, E., Parry, D., et al. (2003). Towards a greater understanding of pattern, scale and process in marine benthic systems: a picture is worth a thousand worms. J. Exp. Mar. Biol. Ecol. 285–286, 313–338. doi: 10.1016/S0022-0981(02)00535-X
Sun, C., Shrivastava, A., Singh, S., and Gupta, A. (2017). “Revisiting unreasonable effectiveness of data in deep learning era,” in 2017 IEEE International Conference on Computer Vision (ICCV) (Venice: IEEE). doi: 10.1109/ICCV.2017.97
WoRMS Editorial Board (2021). World Register of Marine Species (WoRMS). Available online at: https://www.marinespecies.org (accessed February 16, 2021).
Xu, L., Bennamoun, M., An, S., Sohel, F., and Boussaid, F. (2019). “Deep learning for marine species recognition,” in Handbook of Deep Learning Applications, eds V. Balas, S. Roy, D. Sharma, and P. Samui (Springer International Publishing), 129–145. doi: 10.1007/978-3-030-11479-4_7
Zurowietz, M. (2019). CATAMI Label Tree. Available online at: https://zenodo.org/record/3374162
Zurowietz, M., Langenkämper, D., Hosking, B., Ruhl, H. A., and Nattkemper, T. W. (2018). MAIA–a machine learning assisted image annotation method for environmental monitoring and exploration. PLoS ONE 13:e0207498. doi: 10.1371/journal.pone.0207498
Zurowietz, M., Langenkämper, D., and Nattkemper, T. W. (2019). “BIIGLE2Go–a scalable image annotation system for easy deployment on cruises,” in OCEANS 2019 (Marseille: IEEE). doi: 10.1109/OCEANSE.2019.8867417
Keywords: marine imaging, image annotation, video annotation, environmental monitoring, machine learning
Citation: Zurowietz M and Nattkemper TW (2021) Current Trends and Future Directions of Large Scale Image and Video Annotation: Observations From Four Years of BIIGLE 2.0. Front. Mar. Sci. 8:760036. doi: 10.3389/fmars.2021.760036
Received: 17 August 2021; Accepted: 01 November 2021;
Published: 30 November 2021.
Edited by:
Hervé Claustre, Centre National de la Recherche Scientifique (CNRS), FranceReviewed by:
Jean-Olivier Irisson, Sorbonne Universités, FranceSalem Ibrahim Salem, Kyoto University of Advanced Science (KUAS), Japan
Copyright © 2021 Zurowietz and Nattkemper. This is an open-access article distributed under the terms of the Creative Commons Attribution License (CC BY). The use, distribution or reproduction in other forums is permitted, provided the original author(s) and the copyright owner(s) are credited and that the original publication in this journal is cited, in accordance with accepted academic practice. No use, distribution or reproduction is permitted which does not comply with these terms.
*Correspondence: Martin Zurowietz, bWFydGluQGNlYml0ZWMudW5pLWJpZWxlZmVsZC5kZQ==