 Bin Yuan
 Hanxiao Xu
- College of Management, Ocean University of China, Qingdao, China
The damage caused by pollution is not equal across individuals within a given population, due to the differences in pollution level and coping ability. Identifying the different impacts of environmental pollution on agricultural economic growth and the source of the pollution is of great reference significance for realizing the organic integration of ecological protection and relative poverty alleviation. This study takes marine fishery culture as an example, with the cultured products data of 53 coastal cities in China from 1994 to 2018 and empirically captures the heterogeneous effects of environmental pollution on mariculture growth by constructing a theoretical analysis framework of heterogeneity in pollution damage. Results show that the deepening of marine environmental pollution will reduce the growth rate of marine cultured output, emerging significant regional differences. Nevertheless, under the background of the complex environmental situation currently, further damages mainly derive from the difference in the ability to deal with environmental pollution rather than the difference in pollution degree. In terms of different wastewater sources, the impact of industrial wastewater discharge on marine aquaculture production is not very significant. In contrast, the adverse shocks of urban domestic sewage are more prominent. Notably, the environmental pollution has a significant cumulative effect, which is not reversed. Therefore, a pollution shock in one period may leave the region permanently further behind. Based on this, in the follow-up process of pollution control, we should fully consider the heterogeneity in coping ability of individuals. While promoting industrial wastewater emission reduction, we should emphasize strengthening of the urban domestic sewage treatment strategies and give overall consideration to the ecological environment treatment and regional coordinated development.
Highlights
- Costs of pollution are unlikely to be evenly distributed across individuals.
- Different marginal damages stem from differences in vulnerability.
- Urban sewage is more destructive than industrial wastewater.
- Effect of pollution is cumulative and not reversed.
Introduction
Since the reform and opening-up policy, while the industry and agriculture enjoy rapid development, it is bringing about severe environmental problems. The aggravation of environmental pollution has not only restricted the high-quality development of the Chinese economy but also caused the loss of value of life of the Chinese residents at a trillion scale (Xie et al., 2019; Khan and Ozturk, 2020). Meanwhile, agriculture restricted by vulnerability and reliance on the natural environment has been subject to various constraints and negative influence of environmental pollution. The worsening of the eco-environment can not only impair the output of agricultural products, but also pose a serious threat to the quality and output of agricultural products and even the income of the farmers (Carter et al., 2017). In the field of natural sciences, a string of researches have already provided evidences for the influence of chemical-caused air pollution on agricultural production. The deepening of nitric oxide, ozone, and haze will impair the photosynthesis and disease resistance of agricultural products (Field et al., 2012; Huang et al., 2015; Rai, 2016). It is predicted that, by the year 2030, increase in the ozone concentration will have caused a drop of 12.1–16.4% in the global soybean output, a drop of 4.3–6.5% in the global corn output, and a drop of 10.6–15.6% in the global wheat output (Avnery et al., 2011). By resorting to the framework of economics and the econometric model, economic circles have also substantiated the negative impact of ozone pollution on grain output. They have also predicted that the losses caused by ozone pollution could be as high as 18 billion USD at a global scale, of which 6.45 billion USD would be from China (Wang and Mauzerall, 2004; Powell and Reinhard, 2016; Yi et al., 2016; YI et al., 2020).
As we all know, marine fishery plays an important role in the economic development of various countries, which is also affected by a set of external factors, such as climate change and environmental pollution (Kassa et al., 2018; Guo, 2020; Ameyaw et al., 2021; Kundu and Santhanam, 2021). The existing studies have shown that while environmental pollution affects fishery yield (Hai and Speelman, 2020), it also indirectly brings uncertainty to the growth of total factor productivity. As the saying goes, “Lucid waters and lush mountains are invaluable assets.” With the growing attention paid by all walks of life toward environmental pollution, relevant subjects, such as economics and ecology, have vigorously examined the impact of environmental pollution on economic activities, particularly agricultural production, by an unprecedented depth and breadth (Shao, 2020; Shao et al., 2021). What's important, poverty-stricken rural areas in China are usually mired by environmental pollution, resource dependence, inequality, etc. (Shuai et al., 2019). Those short of capitals usually excessively rely on free natural resources and lack the ability to cope with environmental changes, thus aggravating environmental degradation (Ruch and Geyer, 2017). In additions, existing studies have almost unanimously agreed that individuals will take a serious of adaptive behaviors (e.g., diversification of production and adjustment of factors input) to diversify risks, in the face of changes in the external environment (Bezabih et al., 2010; Krüger et al., 2017; Maire et al., 2021).
However, there is a worth concern that the existing research studies may suffer from two sources of question. The first concerns that there is little observable research focusing on the effects of pollutions on marine production, especially fishery culture. On the one hand, against the background of consumption upgrading, the marine fishery culture as an important source of high quality proteins is a basic link for the Chinese nation to realize its generation-held dream of becoming a superpower in the field of marine development; on the other hand, the ecological status of marine is not optimistic, and a tremendous pressure of sewage is apparent (Bergland et al., 2020; Peng et al., 2021). These factors underscore the need for more detailed analyses and rigorous strategies to estimate the potential effects of pollution. What's important, the changes in environment may generate uneven distribution of costs across individuals within a given population (Hsiang et al., 2019). For example, agriculture usually takes up a high percentage in a the industrial development of a country and it lacks the ability to efficiently cope with changes, so impoverished countries are more vulnerable to global warming. As the new stage began, we will confront tougher challenges to address relative poverty. Therefore, at the heart of another question is that to capture the heterogeneity in the shocks of pollution and juggle mitigation environmental care with poverty alleviation.
To fill that gap, by taking marine fishery culture as an example, this study attempts to assess heterogeneity in hazards of environmental pollution and causes of that. It is hoped that theoretical bases and references can be provided to fuel the green, high-quality development of fishery production. Compared with the existing studies, the contributions to this strand of the literature can be summarized as follows: First, by recognizing heterogeneity in hazards of environmental pollution and causes, this study further enriches the research perspectives of the impact of environmental pollution on fishery culture production; second, for the purpose of increasing the universality and representativeness of the research findings, this study adopts sample data of 53 coastal cities over a long span of time for an empirical analysis.
Theoretical Framework
Variation of Fishery Cultured Output and Cause of Difference From the Perspective of Environmental Pollution
There has been a consensus both in the field of natural sciences and social sciences on hazards of environmental pollution to the agricultural output. For example, the increase in nitric oxide, ozone, and haze in the air will impair the photosynthesis and disease resistance of crops, thus exerting a negative impact on the grain output. In cases where the maximum benefit is as a production goal, producers will adjust the allocation of production elements according to the current environmental status and technical conditions. In order to clarify the impact of environmental pollution on, this study builds the following analysis logic chart. In Figures 1A,B, the internal correlation of the output quantity, Q, and environmental pollution degree, w, with fishery cultured output losses, D, is presented, respectively. When the external environmental pollution reaches the degree of WL, then the optimal output for fishermen to maximize their profits should be Q1. In the short term, when the external environmental pollution keeps on worsening with the element price and consumer preference unchanged, namely when the pollution degree increases from WL to WH, its negative impact on the total output will be further deepened (as shown in Figure 1B), thus changing the correlation between the input and output of production elements, and reducing the marginal output value of elements (Saddique et al., 2020). Meanwhile, with the growing output losses, the marginal cost curve of products also increases from MCPL to MCPH. At the moment, fishermen will definitely reduce their fishery cultured output so as to maximize their profits, and thus lead to a decline of production (ΔQ = Q1−Q2), which is equal to the change of damages (ΔD = DH−DL) in Figure 1B.
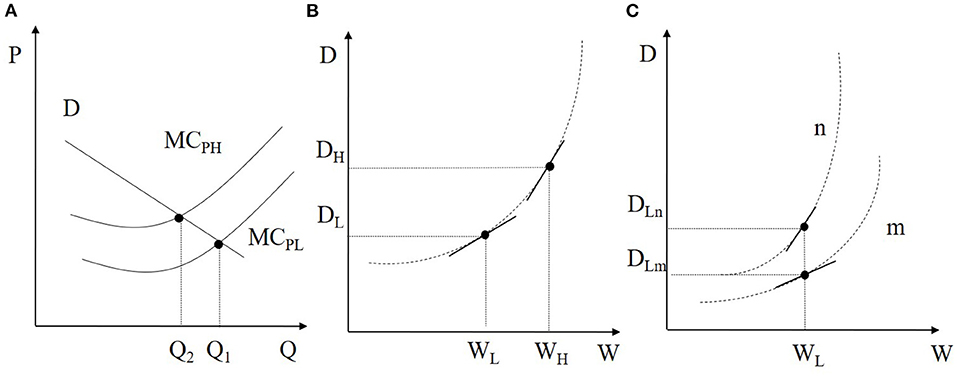
Figure 1. (A–C) Differences in marginal damage from pollution and impacts under different scenarios.
Of special note is that the negative impact of environmental pollution on fishery cultured output is not linear. The negative impact might be varied with different degrees of pollution and different individual adaptability. First of all, the marginal hazards caused by environmental pollution toward seawater cultured output fishery output usually demonstrates an exponential distribution (Burke et al., 2015). Specifically, at the initial stage of pollution, increase in pollutants does not have an obvious impact on output, and the marginal hazards of the former to the latter usually turn out to be zero. Nevertheless, with the worsening of pollution, the marginal hazards will gradually increase. Therefore, to fishermen in different regions (with environmental pollution), worsening of environmental pollution might cause or even widen the gap of output among different regions. On the other hand, concerning individual adaptability toward environmental pollution, differences in individual producers can change the level of exposure toward pollutants and resistance against pollution. On that basis, the marginal hazards of pollutants will also be changed. For example, though increase in the ozone concentration can affect photosynthesis of crops, fishermen can not only change the ozone concentration of the crop environment through the establishment of greenhouses but also alleviate the impact of the ozone concentration on crop output by changing the input of elements, such as nitrogen fertilizers, in accordance with the crop growth. Furthermore, from the perspective of fishery cultivation, fishermen can change the aquatic environment by inputting algae, chemical purifiers, etc. This can help alleviate the hazards of water pollution. Therefore, as shown in Figure 1C, the marginal hazard curve of fisherman m with a stronger resistance and adaptability toward pollution is obviously lower than that of the fisherman n. At the moment, even if in cases where a lower level of external environmental pollution (WL), due to heterogeneous adaptability, the differences in damages of environmental pollution across individuals who own the same initial fishery are apparent and thus will lead to an output gap DLm–DLn between fisherman n and fisherman m, as shown in Figure 1C.
Theoretical Model
With rich marine natural resources, while the marine fishery enjoys rapid development in China, it is reaching fullness. In cases where the maximum benefit is as a production goal, based on the theoretical model developed by Bond et al. (2010), and combining the impact path and mechanism of environmental pollution on fishery cultured output, this study builds the following production function model:
In Equation (1), Y denotes the total output; K denotes various production elements; A denotes the productivity of elements; P denotes the degree of environmental pollution; β and γ denote the impact of environmental pollution on the average fishery cultured output and productivity; and gi denotes the average output growth of fishery output in i region without the impact of environmental pollution. After taking logarithm of Equation (1), the cumulative effect of environmental pollution and capital accumulation on output should be included in Equation (1) to obtain the following dynamic growth model:
In Equation (3), yit and kit denote the logarithm of the fishery cultured output and element input. Under the condition that the external market environment remains unchanged, the fishery economic growth rate, Δyit, of t period in i region can be obtained through the difference of Equation (3).
In order to facilitate the explanation and exploration of the impact of environmental pollution on fishery cultured output, it is assumed that output maintains at a steady status, namely, Δyit − j = Δyi. ρ is defined as the estimation coefficient of environmental pollution toward output; then, the impact of environmental pollution can be given by Equation (4).
If only the impact of the current environmental pollution is considered, that is, ΔAit = gi + γ0Pit and yit = β0Pit + Ait + kit + εit, then Equation (5) can be simplified as below:
In Equation (6), Δyit stands for economic growth. One can easily observe from Equation (6) that, when environmental pollution reaches a normal level, its average impact on fishery cultured output will reverse. For example, the aggravation of environmental pollution might cause a drop in output, but once environment returns to its average value, fishery cultured yields bounce back. Comparatively, the impact of environmental pollution on productivity will not reverse along with the recovery of environment. This means that environmental pollution in one period leaves the fishery culture economy permanently further behind.
Methodology and Data
Model Construction and Description of Variables
Based on the above theoretical model, this study constructs the following econometric regression model to estimate the impact of environmental pollution on fishery cultured output (Carroll and Weil, 1994; Bond et al., 2001):
where, θi denotes the regional fixed effect; θrt denotes the time fixed effect, including the dummy variables and differences across regions; εit denotes the error item; P denotes the environmental pollution of the lag item during L period; and ρ denotes the impact of environmental pollution on output growth. As major crops in China, field crops, such as wheat and paddy rice, are faced with not only a worsening atmospheric environment beset by increasing concentration of zone and haze, but also the aggravation of environmental pollution caused by the enrichment of waters and soil organic matters exceeding acceptable levels. In addition, the pollution degree, Polltotall, can be written as the total sewage discharge of the t year in the i region. It includes the industrial sewage discharge (Pollindustry) and the urban domestic sewage discharge (Pollliving). Different from the complex and various polluted environments facing field crops, environmental pollution confronting production of marine fishery mainly happens to waters. Besides, industrial sewage and domestic sewage of urban areas constitute primary sources of water pollution (Vennemo et al., 2009). Thereby, this study resorts to marine fishery production data of the coastal areas of China, and conducts an empirical analysis on the heterogeneity of hazards caused by environmental pollution. The explained variable git can be written as the net output growth of seawater cultured products of the t year in i region.
In recognizing causes of the heterogeneity of environmental pollution, this study proceeds from the perspective of relative vulnerability and environmental pollution to construct relevant variables. The vulnerability of fishery culture depends on the sensitivity toward environmental pollution and adaptability measures adopted by humans. Compared with the former, the latter is by no means more referential for the design and formulation of relevant policies. A research study has revealed that worsening of environmental pollution has been a long-lasting trend. With a high income and a large number of assets, fishermen can effectively alleviate the negative impact of external factors on production through pre-event and post-event defensive investment. Comparatively, impoverished fishermen with a lower income are more vulnerable toward external impact (Dell et al., 2012). On that basis, this study adopts the per capita disposable income of fishermen as a measure of vulnerability. The relatively vulnerable area is defined by dummy variables. In other words, areas where the per capita disposable income of current fishermen is lower than the average is defined as relatively vulnerable (poor). Assume that poor = 1. On the contrary, it is 0. Similarly, concerning the degree of environmental pollution, this study defines the area where the current total sewage discharge is higher than the average of samples as seriously polluted (worse). Assume that worse = 1. On the contrary, it is 0.
Based on the existing literatures, this study further constructs the relevant control variable matrix, Z, to cover the regional development characteristics, technological level, and circulation of agricultural products. As an important starting point for raising the level of education and promoting the progress of technology, the number of educational personnel is directly related to the improvement of productivity. Meanwhile, the auspice of government is an external force to be reckoned with in the technological advancements. In addition, as the income of the people keeps increasing, there has been an increasing requirement of the protein intake. Thus, with modern conditions of transportation, the growing demand for fresh seawater aquatic products could be satisfied in inner areas, providing an economic motivation of production. According to the above analysis, in order to control the social and impacts on marine fishery culture, this study employs following indicators: local public budget expenditure, expenditure for science and technology, educational fiscal expenditure, the number of educational personnel involved in regular higher education and research institutions, the local average annual population, freight traffic by highways, and area of paved roads, etc.
According to above theoretical analysis, to adopt Equation 6 for a quantitative analysis should meet the prerequisite that αi = 0. Therefore, this study further examines the linear correlation between the random disturbance item, Δεit, in Equation (5) and the lag period, Δyit−1, of growth, and in order to choose the prolonged lag period as an instrumental variable of growth, Δyit−1, for a robustness test. Besides, in order to further identify the heterogeneity in hazards caused by pollution to fishery cultured output and causes of the heterogeneity, this study introduces the interaction item of environmental pollution, vulnerability (poor), and pollution degree (worse). Thereby, the model to estimate the heterogeneity in the impact of environmental pollution on output growth can be obtained, respectively:
According to the theoretical model Equations 4, 5, the correlation between output growth during sample period should be verified before using the measurement model for estimation. This can help clarify whether the lag of output growth should be included into the regression model. Estimation results of the correlation coefficient are listed in Table 1. As shown in Table 11, a weak correlation between the aquatic product output over different periods of time in different regions is not observed, which is different from the theoretical hypothesis above. Specifically, the current output growth and one lag are significantly and negatively correlated. This finding probably has a close bearing on the marine fishery production. As renewable biological resources, the stock of marine fishery resources is subject to not only the influence of biological factors, but also human production activities. This means that the resource stock after human exploitation can directly react upon the availability of future resources (Emery et al., 2017). Consequently, a significantly negative correlation is formed between the current output growth and the growth of Lag Phase 1. In light of the above conclusions, this study includes one lag of output growth into the panel estimation model of Equation (6).
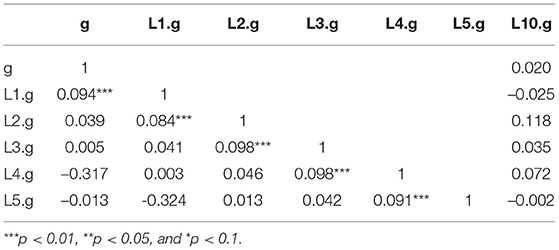
Table 1. Relevance statistics.
Concerning potential problems, such as endogeneity caused by the first-order lag item of the explained item, this paper estimates the dynamic panel model Equations 7, 8 using the generalized method of moments (GMM). Compared with the differential GMM, the system GMM adopts the lags of horizontal value as the instrumental variable of the differential function. At the same time, the differential GMM and the horizontal GMM are combined. The lags of the differential variable are used as the instrumental variable of the horizontal equation. On that basis, the differential equation and the horizontal equation are adopted as an equation system for estimation. Therefore, the system GMM is more efficient in estimation. Moreover, the SE obtained by the model estimation can significantly address problems, such as weak instrumental variables of the horizontal lag item in the panel data model. Considering that, this study chooses the panel data of 53 coastal cities from 1994 to 2018, and uses the system GMM to estimate the impact of environmental pollution on growth of marine cultured output.
Data Sources
As a main source of high-quality proteins in China, the yield of seawater cultured products reached 20.65 million tons in 2019, accounting for about 31.8% of the total aquatic products. Meanwhile, the proportion of seawater fishing products has decreased to about 18.7%. The cultured products have become the type of seawater aquatic products with the largest cultured output in China. It is important to note that little adaptation targeted at offsetting the shock of pollution is observable, although the seawater fishing industry is facing increasing environmental pressures. Therefore, with growing proportion of seawater fishing products, choosing marine fishery culture as a sample for the study can reflect to a certain extent the impact of pollution on the marine fishery. According to the production, acreage, and fisher household income levels of the different main producing areas in 2019, we picked 53 prefecture-level cities of 11 provinces2, autonomous regions, and municipalities excluding the Hong Kong, Macau, and Taiwan, as our sampling regions, by using system sampling and K-means cluster. Data selected span from 1991 to 2018.
In 2018, the output of seawater cultured products of prefecture-level city samples takes up 95.7% of the national total, which suggests that the sample regions selected are representative enough. Data about the output of seawater cultured products are collected from the “China's Rural Statistical Yearbook” and statistical yearbooks of each cities and the provinces where they belong. Variables, such as the industrial sewage discharge, local average annual pollution, local public budget, spending on science and technology, spending on education, highway freight volume, and actual urban road area, are from “China's Marine Statistical Yearbook,” “China's Marine Yearbook,” and “China's Urban Statistical Yearbook.” Discharge of urban domestic sewage is measured by the total domestic water of residents. Regarding other missing data, this study replaces them with the average of sample data at the early and late stage.
Descriptive statistics of variables required by this study are presented in Table 2. As one observes in Table 2, seawater cultured products of different regions in China experience a fast growth, which maintains an average annual growth of around 159.22 million tons. Differences in seawater cultured output across regions can also provide evidence for this point. At the same time, the industrial sewage discharge, domestic sewage discharge, and per capita disposable income of fishermen demonstrate obvious regional and temporal differences across coastal regions. The aforesaid differences can not only suggest a high representativeness of samples but also lay a solid data basis for the follow-up empirical analysis.
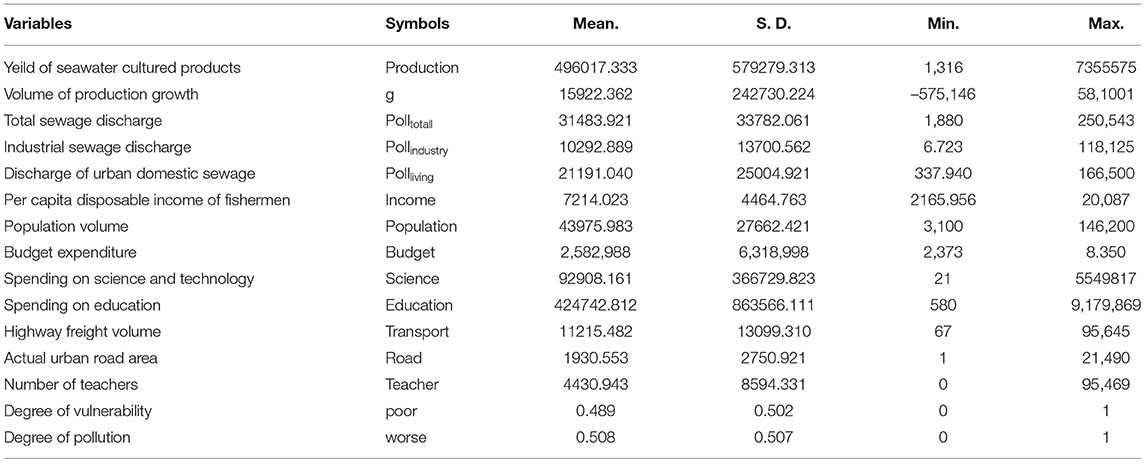
Table 2. Descriptive analysis results.
Empirical Results and Analysis
Stationary Test of Panel Data
In order to ensure the accuracy of model regression and avoid the appearance of “spurious regression,” this study carries out stationary test of all variables. The Levin Lin and Chu T statistical magnitude (LLC), which are used to judge the existence of the common unit root, and the Fisher ADF statistical magnitude (ADF), which is used to judge the existence of the individual unit root, are both adopted. The lag order is judged by the Akaike Information Criterion (AIC) and Schwarz Criterion (SC). The results of the test are shown in Table 3 below. Results suggest that all variables have denied the existence of the unit root and eliminated the possibility of “spurious regression.”
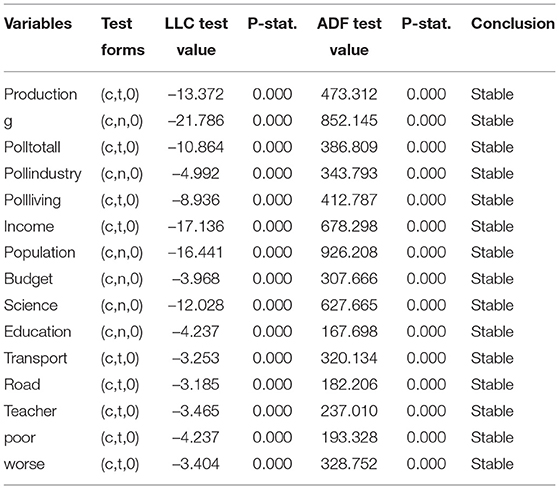
Table 3. Unit root test for panel data.
Analysis of Benchmark Estimation Results
The estimation results of the impact of environmental pollution on output growth are shown in Table 4. Model (1) demonstrates the impact of environmental pollution with the total sewage discharge as the measure; Model (2) further clarifies the impact of environmental pollution on output growth of aquatic products. The P-value of AR (1) and AR (2) test3 in Table 4 suggests that the residual series of the differential equation is found with the first-order series only and that no second-order series correlation is observed. Besides, the model passes the autocorrelation test. According to the null hypothesis of Sargan test, if all instrumental variables are valid, and their P-value is all larger than 0.1, then the null hypothesis is substantiated at the significance level of 10%. Sargan test results indicate that all instrumental variables are valid. Through the Arellano-Bond series correlation test and Sargan test of the model, it can be identified that the system GMM estimation results are consistent and reliable.
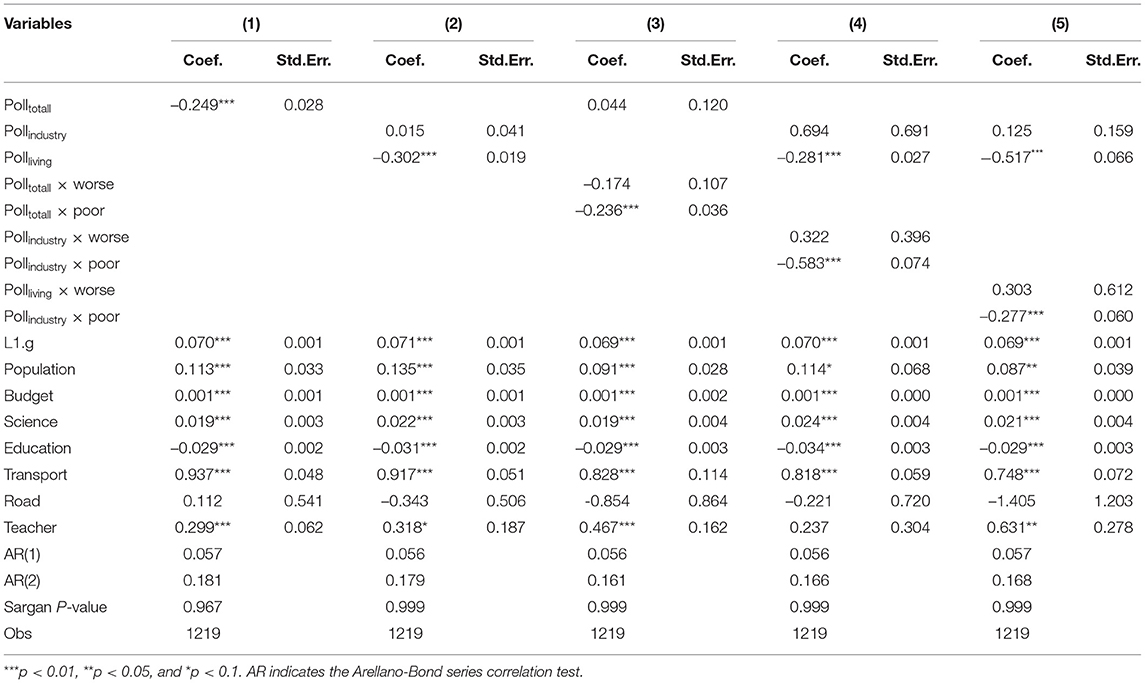
Table 4. Estimated results of the impact of environmental pollution on the volume of output growth.
Benchmark model estimation results presented in Table 4 show that the core explaining variable, the total sewage discharge (Polltotall), has a significantly negative impact on the output growth of aquatic products. This to some extent, suggests that the aggravation of environmental pollution might hinder the development of the regional marine fishery culture. After considering different types of pollution sources, this study finds that the domestic sewage discharge (Pollliving) also has a significantly negative impact on the output growth of aquatic products, and that the negative impact is more obvious than the negative impact of the total sewage discharge. Of special note is that the industrial discharge (Pollindustry) has a positive impact on the output growth of aquatic products, but the finding fails to pass the significance test. As stated above, the pollution can impair the nutrition and quality of waters, thus restricting the growth of fishes. At the same time, increase in harmful material content, such as water nitrogen and phosphorus, will not only cause variations of fish diseases but also increase the probability of infection among fish. This will significantly restrict the breeding and reproduction of fish. As to other control variables, the total population has a significantly positive impact on the fishery aquatic cultivation growth (Hasan et al., 2019).
As important sources of high-quality proteins, fishery cultivation plays an indispensable role in the daily diets of humans. As the income of the people keeps increasing, there has been an increasing requirement of the protein intake. This explains why the growing population will drive the growth of the fishery cultivation industry. The public fiscal budget expenditure, spending on science and technology, and the number of faculties in institutions of higher learning all have a significantly positive impact on the growth of marine fishery production. Fiscal spending of government on science and technology and increase in top-notch technological talents are important propellers of scientific and technological development. They can, in addition to improving the regional total-factor productivity, provide effective countermeasures for the fishery to cope with climate and environmental changes and drive the steady growth of fishery production. It should be noted that the educational fiscal expenditure has a significantly negative impact on the marine fishery production growth. This can, to some extent, indicate that increase in educational fiscal spending is not conducive to the development of marine fishery culture. According to labor marked theory, in cases where all workers face the same labor market opportunities, educational fiscal spending could effectively improve the years of education for individuals, especially low-income populations, leading to a parallel upward shift in the wage frontier and a redistribution in labors. In other words, under the conditions that the wage gap across sectors is opening, more years of education could improve the probability for the fishers to obtain a non-agricultural employment with a relatively higher wages. Therefore, the improvement of educational fiscal expenditure provides an economic motivation of transfer of the labor from fishery industry to non-agricultural sectors (e.g., manufacturing, hotels, and catering services), thus leading to a decrease in the growth of marine fishery culture.
On that basis, the amount of environmental pollution is interacted with pollution degree and vulnerability degree in Model (3)–(5), which are used to further verify the sources of heterogeneity in hazards of environmental pollution. Regression results indicate that, with the pollution level and vulnerability degree introduced, the heterogeneity in hazards of environmental pollution across development zones is more obvious. Besides, the backward regions are suffering to more serious damage. In terms of the causes of heterogeneity, the coefficient on the interaction between total sewage discharge and pollution level, although negative, did not pass the significance test, suggesting that the amount of marginal damage caused by pollution did not differ according to the difference in pollution level, i.e., the difference in pollution level was not the main cause of the heterogeneity in marginal damage from pollution at this stage. As a center of economy, the eastern coastal regions are densely populated with industrial enterprises and its rapid economic development has led to more serious environmental pollution, which in turn has led to a relatively high level of pollution in the eastern region as a whole, thus reducing the difference in marginal damage from pollution to some extent. On the other hand, as a typical public good, the quality of the marine environment has obvious externalities and non-exclusivity. An increase in environmental pollution in some areas can not only directly affect the place where the pollution occurs but can also have cascading negative externalities. At the same time, the estimated coefficient of the interaction between vulnerability and total sewage discharge is significantly positive at the 1% confidence level, indicating that increased coping capacity can effectively mitigate the negative shocks of pollution. In addition, for different sources of pollution, the estimated coefficients of the interaction coefficients of industrial sewage discharge, urban domestic sewage discharge, and pollution level and vulnerability level are basically the same, i.e., the impact of environmental pollution on marine fishery culture in relatively vulnerable areas is more pronounced. Due to the differences in factor structure and economic development patterns, there is a clear bias and agglomeration in technological progress across regions (Inyinbor Adejumoke et al., 2018; Jayaswal et al., 2018). Developed regions have a clear advantage in terms of material base and technological availability compared to lagging regions, and therefore, have a wider range of effective tools to deal with the negative impacts of environmental pollution.
Analysis of Results From Models With Lags
Based on the former panel regression model, this paper adds the industrial sewage discharge with five lags at most to better understand and estimate the impact of environmental pollution and heterogeneity in the impact. Table 5 presents results from the model with no lags, one lag, three lags, or five lags. According to regression results, under the condition that the lags of total sewage discharge are introduced, the negative impact of environmental pollution on marine fishery culture is still significant. If the lag is not introduced, the increase in the unit sewage discharge can lead to a decrease of 0.249 in the output growth of the backward region. With one lag of total sewage discharge added, the impact of the sewage discharge on the output growth increase to 0.309. After more lags are introduced, cumulative effects of environmental pollution are generally similar. The unit sewage discharge increase reduces growth by 0.215–0.766. It can be seen that although the estimated coefficients of the lags are interleaved, the sum of the estimated coefficients of all lags is not significantly zero. This suggests to some extent that there is a significant negative cumulative effect of environmental pollution on regional marine fish farming production, with environmental pollution not only affecting current average output levels but also affecting productivity through lagged effects. This may be due to the fact that environmental pollution increases the probability of the occurrence and spread of fish fry diseases, which in turn leads to a reduction in cultured output. At this point, producers, as rational economic agents, will inevitably reduce the amount of inputs of factors of production based on the goal of profit maximization, resulting in lower productivity that has a lagged effect. When the capital stock is adjusted to a new steady state, the permanent impact on productivity may affect subsequent capital accumulation, resulting in a lagged growth effect. As can be seen, there is not only a horizontal but also a growth effect from the negative effects of environmental pollution, both of which may have an impact on the output growth of marine fishery culture. The difference is that when pollution returns to normal levels, the effect of environmental pollution on average output can be restored to normal levels, i.e., its horizontal effect on output will be reversed. In contrast, the lagged growth effect on productivity is not reversed by an improvement in environmental pollution, and the presence of this effect means that the environmental declines in one period leaves the fishery culture economy permanently further behind.
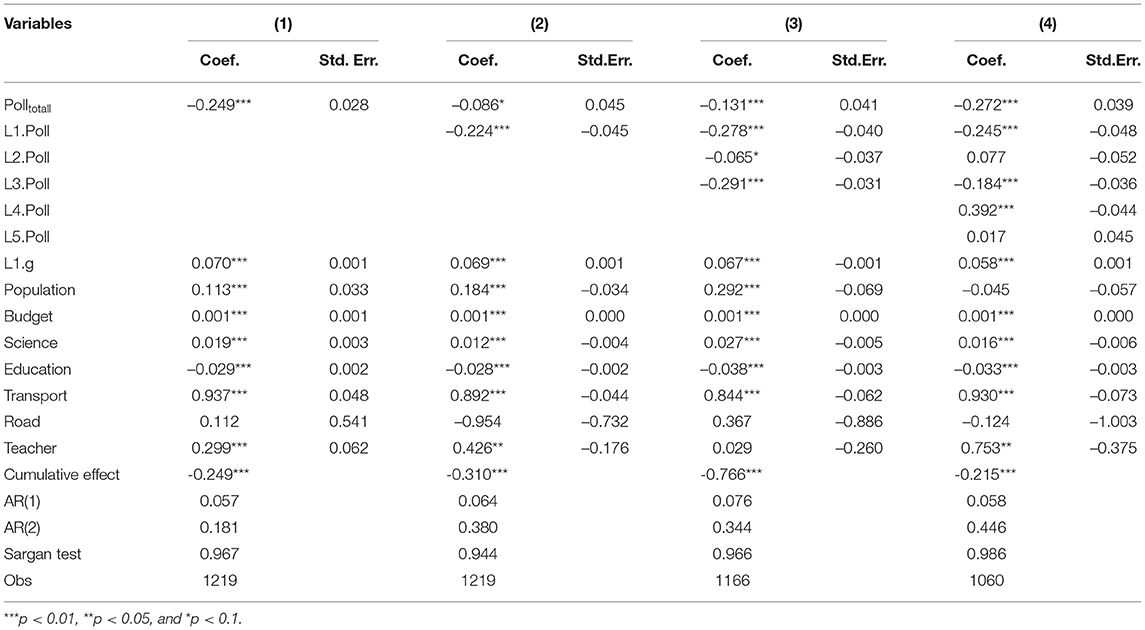
Table 5. Results of dynamic estimates of the impact of total effluent discharge on the volume of output growth.
According to above theoretical analysis, environmental pollution not only affects the average output, but also affects the fishery productivity. The difference is that the impact on output disappears as pollution degree returns to its prior state. However, the impact on the fishery growth rate will not reserve, along with the alleviation of the pollution degree. Though the estimation coefficient of the lag is an interleaving positive and negative number, the sum of estimation coefficients on lags is obviously not significantly zero. This means that the impact of environmental pollution on the output growth is significantly long term. In other words, its impact on the productivity is obviously higher than its impact on the average output. This also means that the aggravation of pollution over one period might cause the backwardness of this region in the long term.
In addition to examining the impact of total sewage discharge, this study also takes into account differences in the impact of different pollution sources. According to analysis results, this study adds the lags of the industrial sewage discharge and the domestic sewage discharge. The dynamic panel model is built for a better understanding and estimation of the impact of environmental pollution and the heterogeneity of the impact. Tables 6, 7 presents results from the model with no lags, one lag, three lags, or five lags. As shown in Table 6, as the lags increases, the impact of the core explaining variable, industrial sewage discharge on the output growth gradually shifts from positive to negative, but it fails to pass the significance test. The result is also reflected in the cumulative effect of the industrial sewage discharge. By calculating the cumulative effects of different lags, this study easily observes that, though the above result fails to pass the significance test, the impact of industrial sewage discharge on marine fishery production growth becomes increasingly obvious, with the passage of time. As the central economic regions of China, industrial development in the eastern coastal regions of China is obviously clustered. This allows the industry to capitalize on the efficiency of labor distribution among enterprises to significantly promote the concentrated governance of industrial pollution. After that, the negative impact of water pollution can be maximally alleviated through collective discharge and concentrated treatment (Wang et al., 2021).
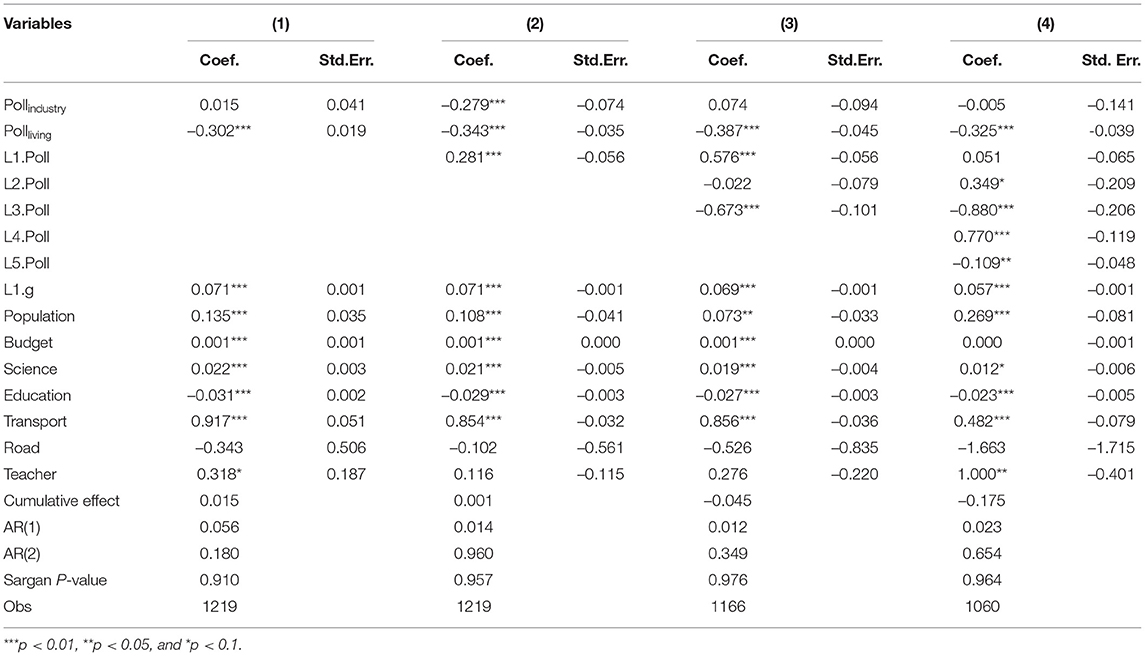
Table 6. Results of dynamic estimation of the impact of industrial wastewater emissions on the volume of output growth.
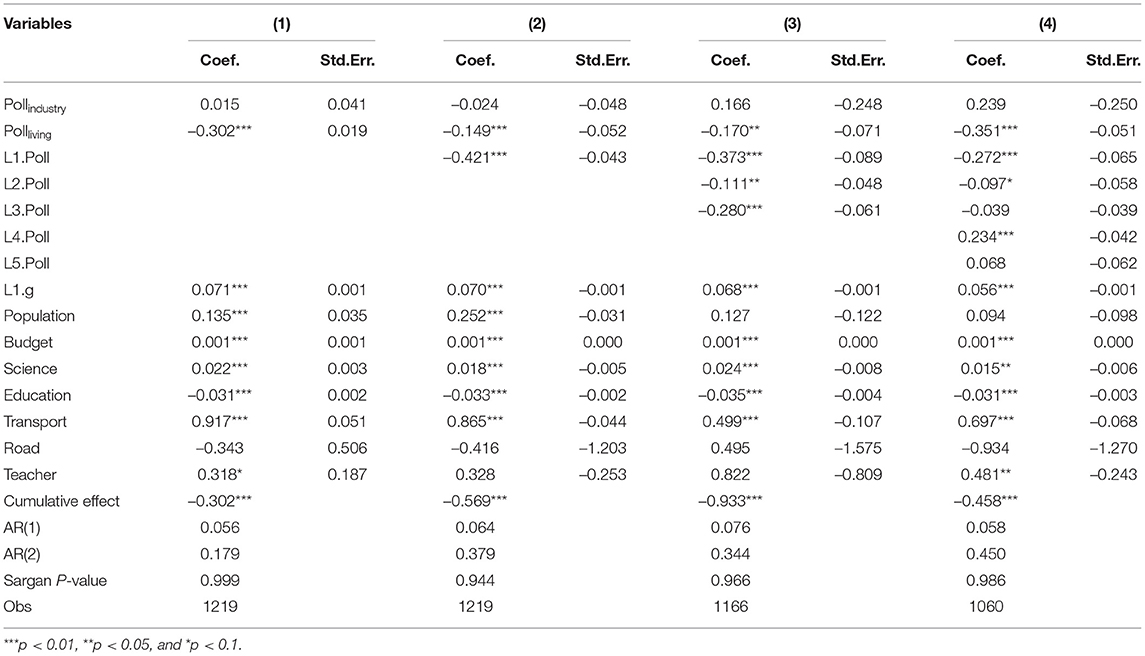
Table 7. Results of dynamic estimation of the impact of domestic sewage discharges on the volume of output growth.
As to urban domestic sewage, estimated results of dynamic panel model in Table 7 shows that the impact of the current domestic sewage discharge on output growth is significantly negative in the models with lags. This can, to some extent, reveal that the increase in domestic sewage discharge can significantly hinder the development of marine fishery culture industry. Of special note is that the domestic sewage discharge exhibits significantly negative cumulative effects. With three lags of sewage discharge introduced, the marginal impact of the domestic sewage discharge on output growth increases from 0.302 to 0.933. Summing up the above analysis results, this study points out that the impact of the urban domestic sewage on the marine fishery production should not be ignored, compared with the impact of industrial sewage discharge. Though the Chinese government has adopted a series of severe environmental regulations, most are mainly targeted at industrial enterprises. Seldom are there any regulations intended for the treatment of urban domestic sewage. Meanwhile, as the resource consumption and pollutants increase along with the increasing population, domestic sewage has been a critical part of the water pollution treatment (Zuo et al., 2019).
Robustness Test
Comparison of Estimated Results During Different Periods of Time
In 2017, the Chinese government launched the Second National Agricultural Census, which led to the adjustment of statistical standards of the marine fishery cultured output in different regions, such as redefining the standards to compute shell products (oysters, scallops, etc.). In order to prevent differences of data standards from impairing the precision of estimated results, and also considering differences in recalculating the output of marine fishery cultured product s across regions, this study adopts 2007 as the demarcation and divides samples into two periods, namely, from 1994 to 2006 and 2007 to 2018. The current effects of the total sewage discharge and the cumulative effect of one, three, and five lags are analyzed. Table 8 lists the estimated results. Among them, Column (1) demonstrates the benchmark regression results, and Column (2), (3), and (4) are estimated results containing different phase items. Model regression results show that both current effects and cumulative effects of environmental pollution are consistent with the benchmark regression results in previous parts. Meanwhile, the absolute value and significance of estimation coefficient have been significantly improved. This suggests that the aggravation of environmental pollution can pronouncedly slow down the growth of the marine fishery production. Meanwhile, the hazards caused by the environmental pollution also demonstrate obvious cumulative effects.
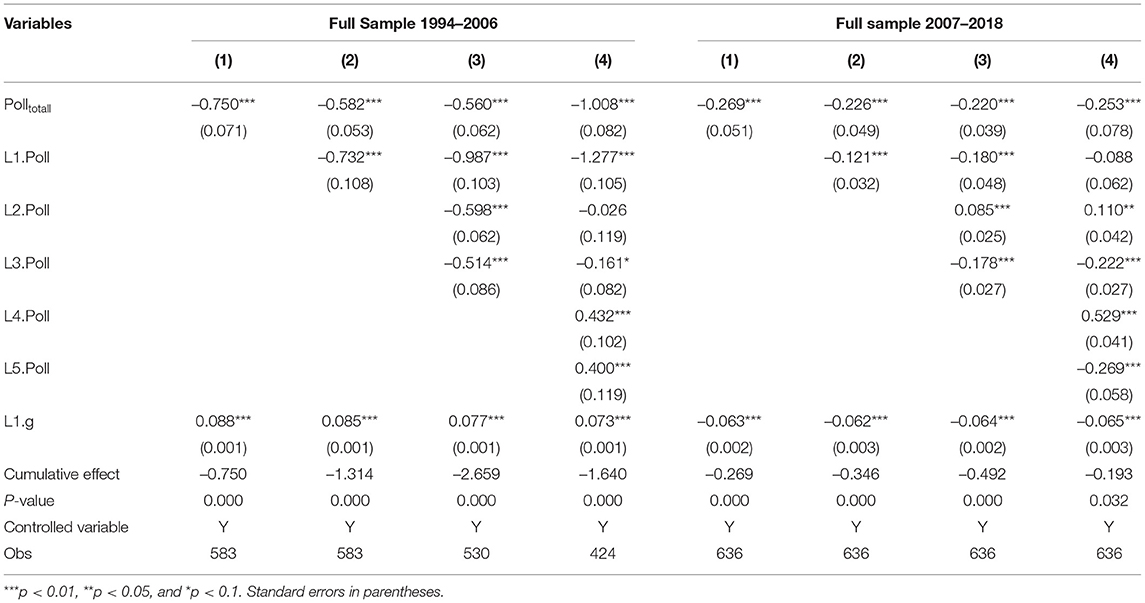
Table 8. Estimated results by time period.
Comparison of Estimated Results in Different Regions
Statistical errors can be easily found with statistical modes, standards, and accuracy in underdeveloped regions (Ciccone and Jarociński, 2010; Deaton and Heston, 2010). The credibility of estimated results heavily depends on the accuracy of the survey data. Therefore, according to the regional differences of economic development in China, this study divides the samples into the northern region and southern region with Yangtze River as the demarcation for a robustness test4. The test results are shown in Table 9. Similarly, considering the direction and significance of the estimation coefficient of the model, this study observes that the impact of the regional total sewage discharge on the output growth has not yet undergone obvious changes, and that the significance has also improved. Combining the above robustness test results, it is self–evident that the research findings obtained by estimation in this study are consistent, robust, reliable, and persuasive.
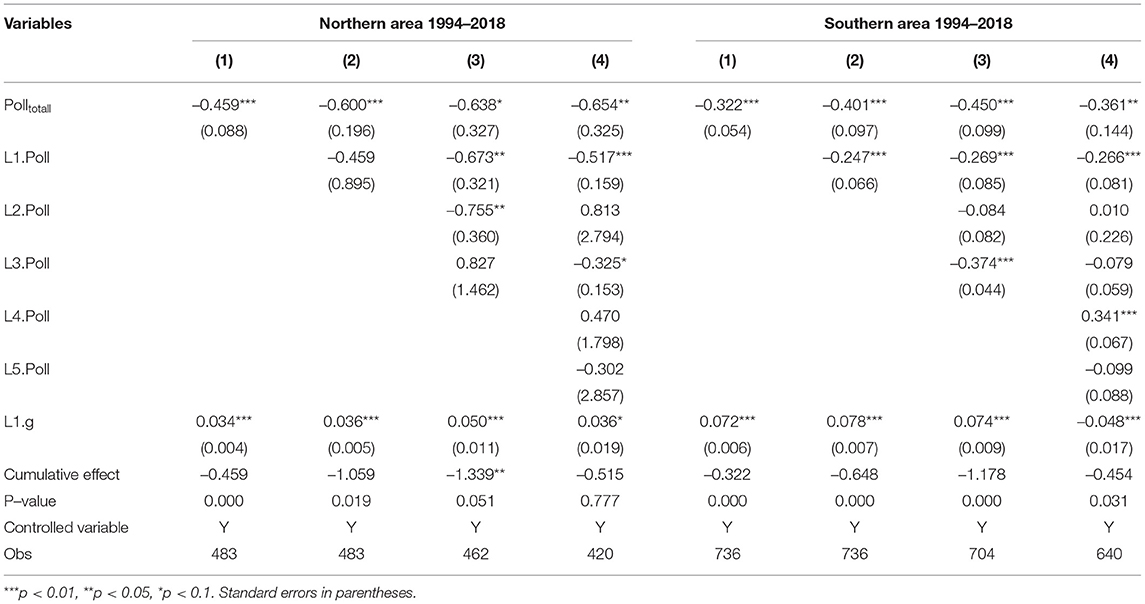
Table 9. Estimated results by region.
Conclusion and Recommendations
This study takes marine fishery culture as an example, based on the seawater cultured products data of 53 coastal cities in China from 1994 to 2018. From theoretical analysis to empirical discrimination, this study captures the heterogeneous impact of environmental pollution on output growth. It is found that the weakening effect of the environmental pollution on the output growth of seawater products has apparent regional heterogeneity, and this damage difference mainly comes from the different ability to deal with the environmental pollution among different regions, rather than the difference of pollution degree. In terms of different wastewater sources, the impact of industrial wastewater discharge on marine fishery culture is not very significant. In contrast, the adverse shocks of urban domestic sewage are more prominent. Notably, the impact of environmental pollution has a significant cumulative effect, and this negative impact is just irreversible. Therefore, the aggravation of environmental pollution will further widen the gap in marine cultured output between regions.
Under the background of the green sustainable development of marine fishery in China, a full understanding of the possible negative impact of pollution is necessary to actively take measures to respond to the challenge. Generally speaking, there are two ways to deal with environmental pollution: “adaptation” and “mitigation.” First in terms of “adaptation,” an emphasis and increase in research, development, and the promotion of relevant technologies (e.g., the warning mechanism of environmental pollution, the development on new varieties, the purification equipment research, and development) are needed. More importantly, we should pay attention to the universality of technological progress. By constructing a reasonable technology subsidy policy, with the help of knowledge popularization and technology promotion, we can guide the transfer of advanced technology to backward areas, which improve the coping ability of fishers there effectively and urge them to take adaptive behavior to alleviate the negative impact of environmental pollution and realize the balanced development among regions. Secondly, in terms of “mitigation,” on the one hand, innovation should be actively promoted and new techniques for urban wastewater should be explored to address the environmental damage of pollutions; on the other hand, improvements are needed in the chemical articles for daily use, such as liquid detergent and toilet cleaners, etc., and more pollution–free articles should be developed. Meanwhile, given the spatial spillover effect and relevance of marine pollution, through the identification of interest demands of different subjects, we shall establish more diversified governance incentives and compensation mechanisms, scientifically delimit the cross–provincial and cross-municipal boundaries of marine pollution control, and increase the public responsibility awareness and supervision efficiency by further building a communication platform between the government and non-governmental organizations.
Although our study confirms the role of pollution in the production of marine fishery culture, further investigation is necessary to improve the accuracy of pollution reduction strategies. One of the main premises for the application of the model in this study is that the marine fishery culture development has been saturated, whereas marine aquaculture has not reached fullness in the early years, and some areas have not even been developed due to environmental protection and other factors. Another limitation of our study is that the industry production conditions are poorly treated. For instance, biological, and technological conditions, and economic environment for the producers, e.g., product markets and input markets (labor market) in fishery production, have not been considered. Therefore, a more substantial data should be collected, which is important for future research to compare the shocks of pollutions and evaluate the treated effectiveness of different related strategies.
Data Availability Statement
The original contributions presented in the study are included in the article/supplementary material, further inquiries can be directed to the corresponding author.
Author Contributions
BY: writing, original draft, writing–review, and editing. FY: methodology, software, writing–review, and editing. XW: data curation, software, writing–review, and editing. HX: conceptualization, visualization, writing–review, and editing. All authors contributed to the article and approved the submitted version.
Funding
This study was supported in part by grants from the Ministry of education of Humanities and Social Science project (grant no. 21YJC790149), Qingdao social science planning and research project in 2021 (QDSKL2101031), Social Science Planning Research Project of Shandong “Research on the Stagnation and Breakthrough Path of Relative Poverty Management in Shandong Province after 2020” (grant no. 20CDCJ21), the key project of plan in research and development of Shandong “Research on the protection and utilization of marine fishery germplasm resources in Shandong Province” (grant no. 2020RZE29007), the Natural Science Foundation of Shandong “Research on the Long-term Path of Poverty Alleviation in Agricultural Industry from the Perspective of High-Quality Development” (grant no. ZR2020QG045), the Fundamental Research Funds for the Central Universities (grant no. 202013011), and the China Postdoctoral Science Foundation (grant no. 2019M652486).
Conflict of Interest
The authors declare that the research was conducted in the absence of any commercial or financial relationships that could be construed as a potential conflict of interest.
The reviewer YZ declared a shared affiliation with several of the authors HX, BY, FY, and XW to the handling editor at the time of the review.
Publisher's Note
All claims expressed in this article are solely those of the authors and do not necessarily represent those of their affiliated organizations, or those of the publisher, the editors and the reviewers. Any product that may be evaluated in this article, or claim that may be made by its manufacturer, is not guaranteed or endorsed by the publisher.
Footnotes
1. ^This study estimates the correlation coefficient among the output growth of 10 lag phases, but statistical results of only lag phase 5 and lag phase 10 are demonstrated in the paragraph.
2. ^The 53 coastal cities in this article mainly include: Dalian, Dandong, Jinzhou, Yingkou, Panjin; Tianjin; Hebei Province includes: Tangshan, Qinhuangdao, Cangzhou; Shandong Province includes: Qingdao, Dongying, Yantai, Weifang, Weihai, Rizhao, Binzhou; Jiangsu Province includes: Lianyungang, Yancheng, Nantong; Shanghai; Zhejiang Province includes: Hangzhou, Ningbo, Wenzhou, Jiaxing, Shaoxing, Zhoushan, Taizhou; Fujian Province including: Fuzhou, Xiamen, Putian, Quanzhou, Zhangzhou, Ningde; Guangdong Province including: Guangzhou, Shenzhen, Zhuhai, Shantou, Jiangmen, Zhanjiang, Maoming, Huizhou, Shanwei, Yangjiang, Dongguan, Zhongshan, Chaozhou, Jieyang; Guangxi Autonomous Region including: Beihai, Fangchenggang, Qinzhou; Hainan Province including: Haikou, Sanya.
3. ^As the consistent estimator, the precondition of GMM is that there is no autocorrelation of the second order of a higher order existing in the residual sequence of the differential equation. Besides, the instrumental variable is found with a strict exogeneity. Therefore, it is necessary to carry out the Arellano-Bond series correlation test (AR) and Sargan test on estimation results. The Arellano-Bond series correlation test makes the null hypothesis that the residual sequence of the differential equation is not found with the second-order series correlation.
4. ^In this study, the area north of the mouth of the Yangtze River is classified as the northern region, mainly including: Dalian, Dandong, Jinzhou, Yingkou, Panjin, Tianjin, Tangshan, Qinhuangdao, Cangzhou, Qingdao, Dongying, Yantai, Weifang, Weihai, Rizhao, Binzhou, Lianyungang, Yancheng, Nantong, Shanghai; the southern region includes: Hangzhou, Ningbo, Wenzhou, Jiaxing, Shaoxing, Zhoushan, Taizhou, Fuzhou, Xiamen, Putian, Quanzhou, Zhangzhou The southern region includes Hangzhou, Ningbo, Wenzhou, Jiaxing, Shaoxing, Zhoushan, Taizhou, Fuzhou, Xiamen, Putian, Quanzhou, Zhangzhou, Ningde, Guangzhou, Shenzhen, Zhuhai, Shantou, Jiangmen, Zhanjiang, Maoming, Huizhou, Shanwei, Yangjiang, Dongguan, Zhongshan, Chaozhou, Jieyang, Beihai, Fangchenggang, Qinzhou, Haikou and Sanya.
References
Ameyaw, G. A., Tsamenyi, M., McIlgorm, A., and Aheto, D. W. (2021). Challenges in the management of small-scale marine fisheries conflicts in ghana. Ocean Coastal Manag. 211:105791. doi: 10.1016/j.ocecoaman.2021.105791
Avnery, S., Mauzerall, D. L., Liu, J., and Horowitz, L. W. (2011). Global crop yield reductions due to surface ozone exposure: 2. year 2030 potential crop production losses and economic damage under two scenarios of o3 pollution. Atmos. Environ. 45, 2297–2309. doi: 10.1016/j.atmosenv.2011.01.002
Bergland, H., Burlakov, E., Pedersen, P. A., and Wyller, J. (2020). Aquaculture, pollution and fishery-dynamics of marine industrial interactions. Ecol. Complex. 43:100853. doi: 10.1016/j.ecocom.2020.100853
Bezabih, M., Chambwera, M., and Stage, J. (2010). Climate change, total factor productivity, and the tanzanian economy: a compatible general equilibrium analysis. Clim. Policy 11, 1289–1302. doi: 10.1080/14693062.2011.579300
Bond, S., Leblebicioǧlu, A., and Schiantarelli, F. (2010). Capital accumulation and growth: a new look at the empirical evidence. J. Appl. Econom. 25, 1073–1099. doi: 10.1002/jae.1163
Bond, S. R., Hoeffler, A., and Temple, J. R. (2001). Gmm Estimation of Empirical Growth Models. Available at SSRN 290522.
Burke, M., Hsiang, S. M., and Miguel, E. (2015). Global non-linear effect of temperature on economic production. Nature 527, 235–239. doi: 10.1038/nature15725
Carroll, C. D., and Weil, D. N. (1994). “Saving and growth: a reinterpretation,” in Carnegie-Rochester Conference Series on Public Policy, Vol. 40 (Haarlem: Elsevier), 133–192.
Carter, C. A., Cui, X., Ding, A., Ghanem, D., Jiang, F., Yi, F., et al. (2017). Stage-specific, nonlinear surface ozone damage to rice production in china. Sci. Rep. 7, 1–6. doi: 10.1038/srep44224
Ciccone, A., and Jarociński, M. (2010). Determinants of economic growth: will data tell? Am. Econ. J. Macroecon. 2, 222–246. doi: 10.1257/mac.2.4.222
Deaton, A., and Heston, A. (2010). Understanding ppps and ppp-based national accounts. Am. Econ. J. Macroecon. 2, 1–35. doi: 10.1257/mac.2.4.1
Dell, M., Jones, B. F., and Olken, B. A. (2012). Temperature shocks and economic growth: Evidence from the last half century. Am. Econ. J. Macroecon. 4, 66–95. doi: 10.1257/mac.4.3.66
Emery, T. J., Gardner, C., Hartmann, K., and Cartwright, I. (2017). Incorporating economics into fisheries management frameworks in australia. Mar. Policy 77:136–143. doi: 10.1016/j.marpol.2016.12.018
Field, C. B., Barros, V., Stocker, T. F., and Dahe, Q. (2012). Managing the Risks of Extreme Events and Disasters to Advance Climate Change Adaptation: Special Report of the Intergovernmental Panel on Climate Change. London: Cambridge University Press.
Guo, J. (2020). The developments of marine environmental protection obligation in article 192 of unclos and the operational impact on china's marine policy-a south china sea fisheries perspective. Marine Policy 120:104140. doi: 10.1016/j.marpol.2020.104140
Hai, A. T. N., and Speelman, S. (2020). Economic-environmental trade-offs in marine aquaculture: The case of lobster farming in vietnam. Aquaculture 516:734593. doi: 10.1016/j.aquaculture.2019.734593
Hasan, M. K., Shahriar, A., and Jim, K. U. (2019). Water pollution in bangladesh and its impact on public health. Heliyon 5:e02145. doi: 10.1016/j.heliyon.2019.e02145
Hsiang, S., Oliva, P., and Walker, R. (2019). The distribution of environmental damages. Rev. Environ. Econ. Policy 13, 83–103. doi: 10.1093/reep/rey024
Huang, J., Huang, Z., Jia, X., Hu, R., and Xiang, C. (2015). Long-term reduction of nitrogen fertilizer use through knowledge training in rice production in china. Agric. Syst. 135:105–111. doi: 10.1016/j.agsy.2015.01.004
Inyinbor Adejumoke, A., Adebesin Babatunde, O., Oluyori Abimbola, P., Adelani Akande Tabitha, A., Dada Adewumi, O., and Oreofe Toyin, A. (2018). Water pollution: effects, prevention, and climatic impact. Water Challenges of an Urbanizing World 33.
Jayaswal, K., Sahu, V., and Gurjar, B. (2018). “Water pollution, human health and remediation,” in Water Remediation (Roorkee: Springer), 11–27.
Kassa, G., Teferi, B., and Delelegn, N. (2018). The poverty-environment nexus in developing countries: evidence from ethiopia: a systematic review. Asian J. Agric. Extens. Econ. Sociol. 24, 1–13. doi: 10.9734/AJAEES/2018/39310
Khan, M. A., and Ozturk, I. (2020). Examining foreign direct investment and environmental pollution linkage in asia. Environ. Sci. Pollut. Res. 27, 7244–7255. doi: 10.1007/s11356-019-07387-x
Krüger, L., Paiva, V. H., Petry, M. V., and Ramos, J. A. (2017). Seabird breeding population size on the antarctic peninsula related to fisheries activities in non-breeding ranges off south america. Antarctic Sci. 29, 495–498. doi: 10.1017/S0954102017000207
Kundu, S. K., and Santhanam, H. (2021). All pain and no gain: Factors impacting local and regional sustainability due to covid-19 pandemic with respect to the indian marine fisheries. Curr. Res. Environ. Sustain. 3:100086. doi: 10.1016/j.crsust.2021.100086
Maire, E., Graham, N. A., MacNeil, M. A., Lam, V. W., Robinson, J. P., Cheung, W. W., et al. (2021). Micronutrient supply from global marine fisheries under climate change and overfishing. Curr. Biol. 31, 4132–4138.e3. doi: 10.1016/j.cub.2021.06.067
Peng, D., Mu, Y., and Zhu, Y. (2021). Evaluating the level of coordinated development of fisheries economic growth and environmental quality in selected chinese regions. Environ. Impact. Assess. Rev. 89:106605. doi: 10.1016/j.eiar.2021.106605
Powell, J., and Reinhard, S. (2016). Measuring the effects of extreme weather events on yields. Weather Clim. Extremes 12, 69–79. doi: 10.1016/j.wace.2016.02.003
Rai, P. K. (2016). Impacts of particulate matter pollution on plants: Implications for environmental biomonitoring. Ecotoxicol. Environ. Saf. 129, 120–136. doi: 10.1016/j.ecoenv.2016.03.012
Ruch, W., and Geyer Jr, H. S. (2017). Public capital investment, economic growth and poverty reduction in south african municipalities. Reg. Sci. Policy Pract. 9, 269–284. doi: 10.1111/rsp3.12104
Saddique, Q., Li Liu, D., Wang, B., Feng, P., He, J., Ajaz, A., et al. (2020). Modelling future climate change impacts on winter wheat yield and water use: a case study in guanzhong plain, northwestern china. Eur. J. Agron. 119:126113. doi: 10.1016/j.eja.2020.126113
Shao, Q. (2020). Nonlinear effects of marine economic growth and technological innovation on marine pollution: panel threshold analysis for china's 11 coastal regions. Mar. Policy 121:104110. doi: 10.1016/j.marpol.2020.104110
Shao, Q., Guo, J., and Kang, P. (2021). Environmental response to growth in the marine economy and urbanization: a heterogeneity analysis of 11 chinese coastal regions using a panel vector autoregressive model. Mar. Policy 124:104350. doi: 10.1016/j.marpol.2020.104350
Shuai, J., Cheng, X., Tao, X., Shuai, C., and Wang, B. (2019). A theoretical framework for understanding the spatial coupling between poverty and the environment: a case study from china. Agron. J. 111, 1097–1108. doi: 10.2134/agronj2018.10.0681
Vennemo, H., Aunan, K., Lindhjem, H., and Seip, H. M. (2009). Environmental pollution in china: status and trends. Rev. Environ. Econ. Policy 3, 209–230. doi: 10.1093/reep/rep009
Wang, X., and Mauzerall, D. L. (2004). Characterizing distributions of surface ozone and its impact on grain production in china, japan and south korea: 1990 and 2020. Atmos Environ. 38, 4383–4402. doi: 10.1016/j.atmosenv.2004.03.067
Wang, Y., Wei, H., Wang, Y., Peng, C., and Dai, J. (2021). Chinese industrial water pollution and the prevention trends: An assessment based on environmental complaint reporting system (ecrs). Alex. Eng. J. 60, 5803–5812. doi: 10.1016/j.aej.2021.04.015
Xie, Y., Dai, H., Zhang, Y., Wu, Y., Hanaoka, T., and Masui, T. (2019). Comparison of health and economic impacts of pm2. 5 and ozone pollution in china. Environ. Int. 130:104881. doi: 10.1016/j.envint.2019.05.075
Yi, F., Jiang, F., Zhong, F., Zhou, X., and Ding, A. (2016). The impacts of surface ozone pollution on winter wheat productivity in china-an econometric approach. Environ. Pollut. 208, 326–335. doi: 10.1016/j.envpol.2015.09.052
Yi, F.-J., Feng, J.-A., Wang, Y.-J., and Jiang, F. (2020). Influence of surface ozone on crop yield of maize in china. J. Integr. Agric. 19, 578–589. doi: 10.1016/S2095-3119(19)62822-4
Keywords: environmental pollution, marginal damage amount, vulnerability, marine fishery culture, heterogeneous growth
Citation: Yuan B, Yue F, Wang X and Xu H (2021) The Impact of Pollution on China Marine Fishery Culture: An Econometric Analysis of Heterogeneous Growth. Front. Mar. Sci. 8:760539. doi: 10.3389/fmars.2021.760539
Received: 18 August 2021; Accepted: 15 September 2021;
Published: 15 October 2021.
Edited by:
Kum Fai Yuen, Nanyang Technological University, SingaporeReviewed by:
Zhihua Wang, Institute of Geographic Sciences and Natural Resources Research, Chinese Academy of Sciences, ChinaYugui Zhu, Ocean University of China, China
Copyright © 2021 Yuan, Yue, Wang and Xu. This is an open-access article distributed under the terms of the Creative Commons Attribution License (CC BY). The use, distribution or reproduction in other forums is permitted, provided the original author(s) and the copyright owner(s) are credited and that the original publication in this journal is cited, in accordance with accepted academic practice. No use, distribution or reproduction is permitted which does not comply with these terms.
*Correspondence: Hanxiao Xu, MTM0NTU2NDYwOTRAMTYzLmNvbQ==