 Tharmini Kalananthan1*
 Ana S. Gomes1
 Floriana Lai1
 Ingvill Tolås1
 Ann-Elise O. Jordal1
 Sissel Norland1
 Koji Murashita1,2
 Ivar Rønnestad1*
- 1Department of Biological Sciences, University of Bergen, Bergen, Norway
- 2Physiological Function Division, Aquaculture Research Department, Fisheries Technology Institute, Japan Fisheries Research and Education Agency, Tamaki, Japan
Cocaine- and amphetamine-regulated transcript (CART) has been known to be involved in feeding and energy balance in mammals, acting as an anorexigenic neuropeptide in hypothalamus. In Atlantic salmon, little is known about Cart brain localization and its function. In this study, in silico analysis revealed the existence of 10 cart paralogs, here named cart1a, 1b1, 1b2, 2a, 2b1, 2b2, 3a1, 3a2, 3b, and 4. The Atlantic salmon Cart sequences shared from 19 to 50% of identity with the human homolog and between 25 and 90% of sequence identity among paralogs, except for Cart4 which only shared 18–23% of identity. We further explored cart mRNA expressions in 8 brain regions (Olfactory Bulb-OB, Telencephalon-TEL, Midbrain-MB, Cerebellum-CE, Hypothalamus-HYP, Saccus vasculosus-SV, Pituitary-PT, and Brain Stem-BS) of Atlantic salmon smolt under 4 days of fasting and continuous fed conditions. The cart paralogs analyzed were widely distributed among the brain regions and OB, TEL, HYP, MB, and BS seemed to be the major sites of expression. The expression of cart1a and 1b showed quite similar pattern in MB, HYP, and BS. The expression of cart2a had the highest in MB followed by HYP and TEL. The cart3a transcript was widely distributed in rostrocaudal regions of brain except in OB and SV whereas cart3b was predominantly expressed in BS followed by MB. Expression of cart4 was high in HYP followed by TEL. With regards to effect of feeding status the Atlantic salmon cart2b, which is the most abundant among the paralogs, was upregulated after 4 days of fasting in OB, MB, and HYP compared to fed group. This may suggest an unexpected, but possible orexigenic role of cart2b in Atlantic salmon or a fasting induced stress effect. No other significant effect was observed. Collectively, the differential expressions of the cart paralogs in different brain regions suggest that they may have roles in regional integration of appetite signals and are possibly involved in regulating other brain functions in Atlantic salmon. The fact that salmon has 10 cart paralogs, while mammalians only one, opens interesting perspectives for comparative research on evolutionary adaptations of gene function in the control of appetite and energy homeostasis.
Introduction
The cocaine- and amphetamine-regulated transcript (CART), initially discovered as an unknown peptide isolated from ovine hypothalamus by Spiess et al. (1981), was found to be released in response to the psychomotor stimulants cocaine and amphetamine in rat brain by Douglass et al. (1995) and, thus, its name. The mammalian CART is known to be an anorectic peptide in mediating feeding in accordance with energy balance (Kristensen et al., 1998; Yang et al., 2005; Rogge et al., 2008) but is also involved in stress response, reward and drug addiction/abuse (Koylu et al., 2006).
The CART function and its involvement in appetite control is, however, not so clear for other vertebrates, including teleost fishes. In fish, one cart gene has been previously identified in several species, such as Atlantic cod (Gadus morhua) (Le et al., 2016), winter flounder (Pseudopleuronectes americanus) (MacDonald and Volkoff, 2009a), winter skate (Raja ocellata) (MacDonald and Volkoff, 2009b), Mexican tetra/blind cave fish (Astyanax mexicanus) (Penney and Volkoff, 2014), rainbow trout (Oncorhynchus mykiss) (Comesaña et al., 2018), channel catfish (Ictalurus punctatus) (Kobayashi et al., 2008), silver dollar (Metynnis argenteus), bucktooth tetra (Exodon paradoxus), black widow tetra (Gymnocorymbus ternetzi) (Butt et al., 2019), and Atlantic salmon (Salmo salar) (Murashita et al., 2009). In other teleost species, multiple cart transcripts have been identified in the brain including two genes in goldfish (Carassius auracius) (Volkoff and Peter, 2001), three in Ya-fish (Schizothorax prenanti) (Yuan et al., 2015), four in zebrafish (Danio rerio) (Nishio et al., 2012; Akash et al., 2014; Ahi et al., 2019), five in yellowtail (Seriola quinqueradiata) (Fukada et al., 2021), six in medaka (Oryzias latipes) (Murashita and Kurokawa, 2011), and seven in Senegalese sole (Solea senegalensis) (Bonacic et al., 2015).
The existence of multiple cart genes raises questions about their physiological function, and recent studies have suggested that maybe not all the paralogs are involved in the control of feed intake. The cart response to feeding has varied among studies, which can possibly be explained by differences in the method of analysis used, like in situ vs. qPCR, or varied methodological approaches like use of whole brain vs. specific brain regions and different development stages, and sampling time related with feeding or fasting. However, it might well be that Cart response to feeding is also species-specific. The differential expression patterns of cart genes in brain regions have been described in some teleost species such as goldfish (Volkoff and Peter, 2001), zebrafish (Nishio et al., 2012; Akash et al., 2014), yellowtail (Fukada et al., 2021), and Senegalese sole (Bonacic et al., 2015). The anorectic effect of cart has been reported for several teleost species, notably in zebrafish where two forms of hypothalamic cart mRNA expressions were downregulated after 5 days of fasting (Akash et al., 2014), and all four identified cart genes expression decreased in the brain after 3 days of fasting (Nishio et al., 2012). Similar cart anorectic effects have been observed in Ya-fish, where the mRNA expression of the three identified cart genes decreased in the hypothalamus after fasting and increased with refeeding (Yuan et al., 2015), while in yellowtail, cart1b and 2a mRNA expression decreased in the telencephalon and hypothalamus following 8 days of fasting (Fukada et al., 2021). Furthermore, whole brain analysis of cart mRNA expression showed that 6 days of fasting downregulated it’s expression in Atlantic salmon (Murashita et al., 2009), while 1 week of fasting decreased cart mRNA in silver dollar but did not affect the expression in bucktooth or black widow tetra (Butt et al., 2019). In medaka, cart2b (previously named cart ch3) expression decreased with 17 days of starvation (Murashita and Kurokawa, 2011).
Atlantic salmon is a key species in Norwegian aquaculture industry and a substantial portion of the production cost, more than 50%, goes to fish feed (Asche and Oglend, 2016). Furthermore, the extensive expansion of the fish industry combined with frequent overfeeding has contributed to potentially negative effects on the ecosystem (Strain and Hargrave, 2005). As such, the efficient utilization of fish feed is vital to ensure sustainable production with regards to the environment, fish welfare, and production costs. Thus, a clear understanding of the biological mechanisms that underly hunger and satiety, and thereby control feed intake, can be of great benefit to the salmon industry. This includes the neuro-endocrine players that modulate feeding and the identification of reliable biomarkers that can be used to assess appetite and potentially growth in fish trials. Moreover, a 2–4 days fasting is implemented prior to aquaculture practices like handling for vaccination, transportation, and harvest (Waagbø et al., 2017). In this regard, learning the impact of fasting will help to optimize the feed utilization, fish growth performance, and welfare. In the current study, we have identified 10 cart paralogs in the Atlantic salmon genome databases and analyzed their brain distribution as well as their response to 4 days of fasting. The results provide a basis for a more comprehensive understanding the role of Cart in the appetite control in Atlantic salmon.
Materials and Methods
Ethics Statement
The animal experiment was conducted in accordance with the National Animal Research Authority regulations and approved by the local representative of Animal Welfare at Department of Biological Sciences, University of Bergen, Norway.
Experimental Animals and Sampling
To evaluate the effect of 4 days fasting, we used the experimental design described by Kalananthan et al. (2020b). In brief, Atlantic salmon post smolt (mean body weight 183.81 ± 35.89 g, mean length 25.42 ± 1.68 cm) were divided in two groups, one was kept under continuous feeding (fed group), whereas the other tank was fasted for 4 days (fasted group). Fish were sampled 2 h after feeding for the fed group (n = 6, per tank n = 2) and 4 days of fasting for the fasted group (n = 6, per tank n = 2). Fish were euthanized with a lethal dose of 200 mg/l of MS222 (Tricaine methanesulfonate, Sigma-Aldrich, MO, United States). The whole brain including pituitary was removed from the skull, placed in RNA later (Thermo Fisher Scientific, MA, United States) and stored overnight at 4∘C before transferring it to −80∘C until further use. Because the key regulatory neural pathways involving CART in appetite control are found in the hypothalamus of mammals, we have also investigated the hypothalamic cart mRNA expression using the total RNA from Kalananthan et al. (2020b) study, which analyzed 3 days fasting vs. normally fed fish groups (n = 6 per group).
Sequence Comparison and Phylogenetic Analyses of Cart
Putative Atlantic salmon cart genes were retrieved from Ensembl1 and GenBank2 genome databases (ICSASG_v2) and compared using ClustalX 2.1 (Larkin et al., 2007).
The Atlantic salmon Cart deduced amino acid (AA) sequences and the homolog sequences from human (Homo sapiens) and from 15 other fish species, including the Callorhinchidae, elephant shark (Callorhinchus milii); Latimeriidae and Lepisosteidae, spotted gar (Lepisosteus oculatus) as species before the teleost specific whole genome duplication event (Ts WGD); two Cyprinidae, goldfish (Carassius auracius) as species that went through a very recent 4R WGD and zebrafish (Danio rerio) which did not; Characidae, Mexican tetra/blind cave fish (Astyanax mexicanus); Clupeidae, Atlantic herring (Clupea harengus) as old teleost; another Salmonidae species, rainbow trout (Oncorhynchus mykiss); the Esocidae northern pike (Esox lucius) as a sister group of salmonids that diverged before the Ss 4R WGD; six Neoteleostei Gadidae Atlantic cod, Adrianichthyidae medaka (Oryzias latipes), Gasterosteidae stickleback (Gasterosteus aculeatus), Cichlidae Nile tilapia (Oreochromis niloticus) and Scophthalmidae turbot (Scophthalmus maximus), Senegalese sole (Solea senegalensis), and coelacanth (Latimeria chalumnae) were retrieved from Ensembl or GenBank databases.
Cart prepro- and mature peptide sequences were aligned using MUSCLE with the default parameters (UPGMA clustering method, Gap opening penalty −2.90, Gap extension 0.0) from MEGAX (Hall, 2013). The alignments were displayed in GeneDoc 2.7 (Nicholas et al., 1997) and percentages of sequence identity calculated. Putative signal peptides were predicted using PrediSi3 and proteolytic cleavage sites predicted using Neuropred.4 Phylogenetic analysis was performed using the predicted mature peptide sequences of Cart. Based on best-fit substitution model analysis in MEGAX, phylogenetic tree was constructed using Maximum Likelihood (ML) with a Jones-Taylor-Thornton (JTT) model (Jones et al., 1992; Kumar et al., 2018) with fixed Gamma distribution (+G) parameter with five rate categories and 500 bootstrap replicates. The tree was rooted to the human CART.
Brain Dissection
Six brains from fed and six from the fasted group of Atlantic salmon were dissected into 8 regions: olfactory bulb (OB), telencephalon (TEL), midbrain (MB), cerebellum (CE), hypothalamus (HYP), saccus vasculosus (SV), pituitary (PT), and medulla oblongata/brain stem (BS) using the same standard dissection protocol as illustrated by Kalananthan et al. (2020a). To ensure high integrity and quality of total RNA, the brain was placed on an ice block during dissection under a zoom stereomicroscope (Olympus SZ51) and cleaned from blood vessels. The brain regions PT, OB, TEL, BS, CE, SV, HYP, and MB were separated in this respective order.
RNA Extraction and cDNA Synthesis
Total RNA was extracted from each dissected brain region using TRI Reagent (Sigma-Aldrich, MO, United States) following the manufacturer’s protocol. To avoid any remnants of genomic DNA 5 or 10 μg of total RNA was treated with TURBO DNase-free Kit (Ambion Applied Biosystem, Foster City, CA, United States) using 2 U DNase per reaction. The input amount of total RNA and the reaction volume for DNase treatment was adjusted depending on the available amount of total RNA per region. A NanoDrop ND-1000 spectrophotometer (Thermo Fisher Scientific, MA, United States) and a 2100 Bioanalyzer with RNA 6000 Nano Kit (Agilent Technologies, CA, United States) were used to assess the quantity, purity and integrity of the extracted total RNA. First strand cDNA was synthesized from 1.1 μg of the total RNA using SuperScript III Reverse Transcriptase (Invitrogen, CA, United States) and Oligo (dT)20 (50 μM) primers in a total reaction volume of 20 μl for OB, TEL, MB, CE, HYP, PT, and BS (n = 6 per group) and for SV (n = 4 per group). The hypothalamic total RNA from 3 days fasting and normally fed groups were also performed with DNase treatment and cDNA as described above.
qPCR Set Up and Primer Design
Atlantic salmon cart qPCR primers were designed using NCBI primer designing tool (Primer-BLAST5) and synthesized by Sigma-Aldrich (St. Louis, MO, United States) (Table 1). Wherever possible specific primers were designed spanning an exon-exon junction. Due to the high degree of identity between cart1b1 and 1b2; 2b1 and 2b2; 3a1 and 3a2 transcripts, common primer pairs were designed for these paralogs (Table 1). Further, the primers were designed to amplify alternate splice variants (if existing) of the gene. Two genes actin beta (actb) and ribosomal protein s20 (s20) were used as reference genes (Olsvik et al., 2005). For each primer pair, quantitation cycle (Cq), primer efficiency and melting peaks were analyzed. All qPCR products were resolved in a 2% agarose gel, purified using QIAquick Gel Extraction Kit (Qiagen, Hilden, Germany) and cloned into a pCR4-TOPO vector (Thermo Fisher, Scientific, Waltham, MA, United States). Sequencing was performed at the University of Bergen Sequencing Facility (Bergen, Norway), and their identity was confirmed using BLASTN6 analysis against the Atlantic salmon genome database. A standard curve dilution series (10-fold) was generated from each target and reference gene cloned into a pCR4-TOPO vector.
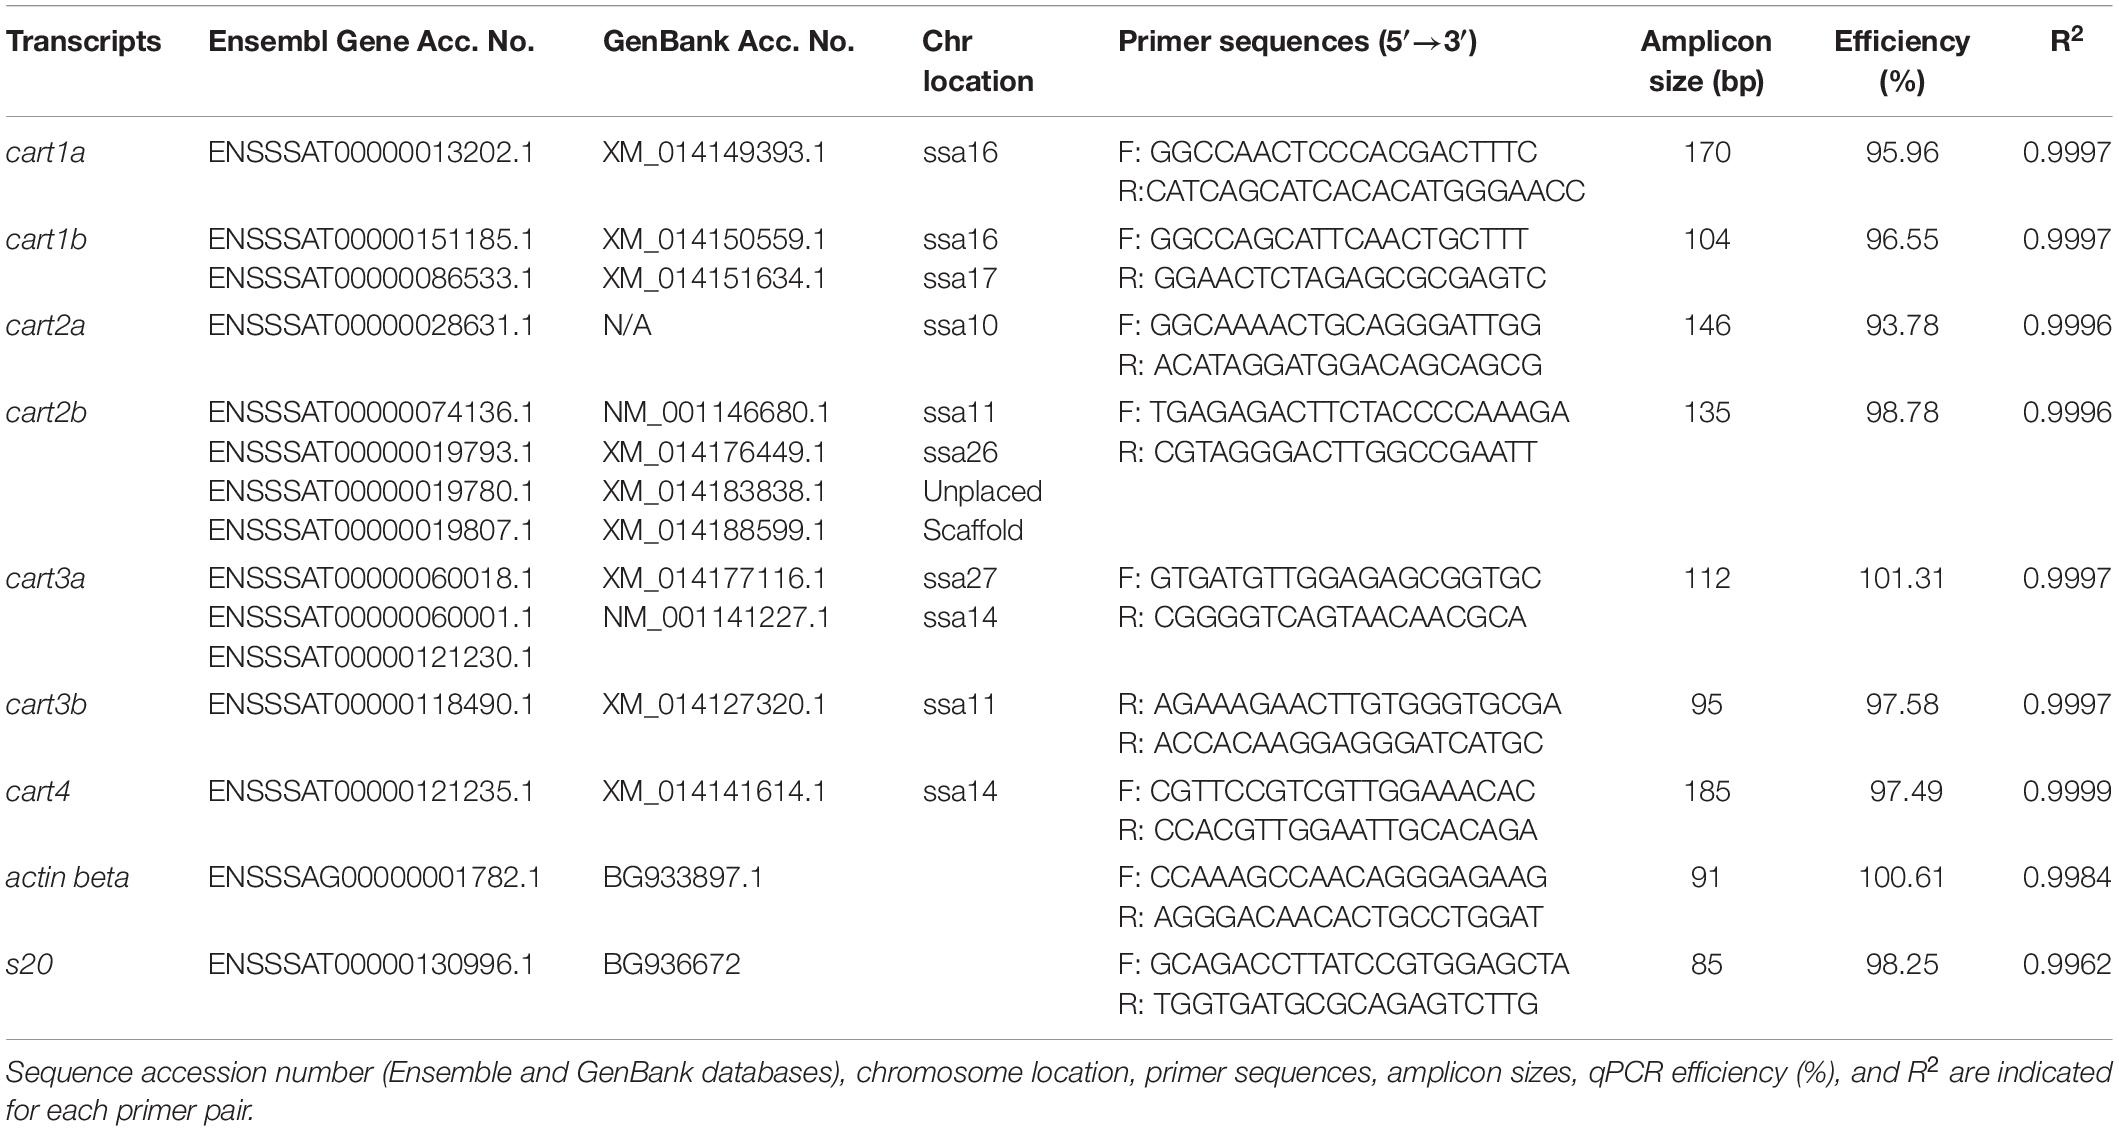
Table 1. Sequence of specific primers used for reverse transcriptase quantitative PCR (RT-qPCR) analyses.
All qPCR assays were performed using 10 μl of iTaq Universal SYBR Green supermix (Bio-Rad, CA, United States), 0.3 μM of each forward and reverse primers, and 2 μl of cDNA template (for target genes 40 ng/reaction and for reference genes 5 ng/reaction) in 20 μl final reaction volume made with ultra-pure water (Biochrom, Berlin, Germany). All the reactions were performed in duplicate, and a non-template control, no-reverse transcriptase control and a positive between plate control were included in every plate. The qPCR was performed using a CFX96 Real-Time System (Bio-Rad Laboratories, CA, United States) in connection to CFX Manager Software version 3.1 (Bio-Rad, Laboratories, CA, United States) with the following conditions: (1) 95∘C for 30 s, (2) 95∘C for 5 s, (3) 60∘C for 25 s, (4) repeating step 2–3 for 39 more times. Melting curve analysis over a range of 65–95°C (increment of 0.5°C for 2 s) allowed for the detection of possible non-specific products and/or primer dimers.
Subsequently, the copy number for each gene/sample were determined based on the respective standard curve and using the following equation:
The copy number was normalized using the total ng of RNA used in the reaction for each target and reference gene. The ratio of the target gene copy number to the geometric mean copy number of reference genes was used in for the plots and statistical analysis.
Statistical Analysis
The data analysis was carried out using GraphPad version 8 (GraphPad Software, San Diego, CA, United States). Normality of distribution and equal variances of gene expression were assessed using Shapiro-Wilk normality test and F-test, respectively. The data were log transformed to ensure normal distribution before statistical analysis. The analysis of differential expression between the fed and fasted group were performed with two-tail t-test. When either the F-test or the normality test failed, the non-parametric Mann-Whitney test was performed. A p < 0.05 was considered significant. All data are presented as mean ± SEM.
Results
Sequences and Phylogenetic Comparison of Cart
In silico searches identified the presence of 10 cart paralogous genes in the Atlantic salmon genomic databases. Comparison of the Atlantic salmon cart gene structure indicated that gene organization is conserved with three exons encoding the prepro-Cart sequence separated by two introns (Figure 1). The coding regions of the identified cart genes were 327, 393, 327, 357, 357, 357, 345, 345, 324, and 372 bp (Figure 1), translated into 108, 130, 108, 118, 118, 118, 114, 114, 107, and 123 AA, respectively (Figure 2). The Cart paralogs were found to be encoded by genes located on chromosomes (Chr) ssa16, ssa17, ssa16, ssa10 (exclusively predicted in Ensembl database), ssa11, ssa26, ssa14, ssa27, ssa11, and ssa14 (Table 1). Two alternate splice variants were found for cart located in chromosome ssa26, with coding regions of 267 and 510 bp which translate into 88 AA and 169 AA, respectively. One splice variant of cart located in chromosome ssa27 was found with a 381 bp coding region that translate into 126 AA.
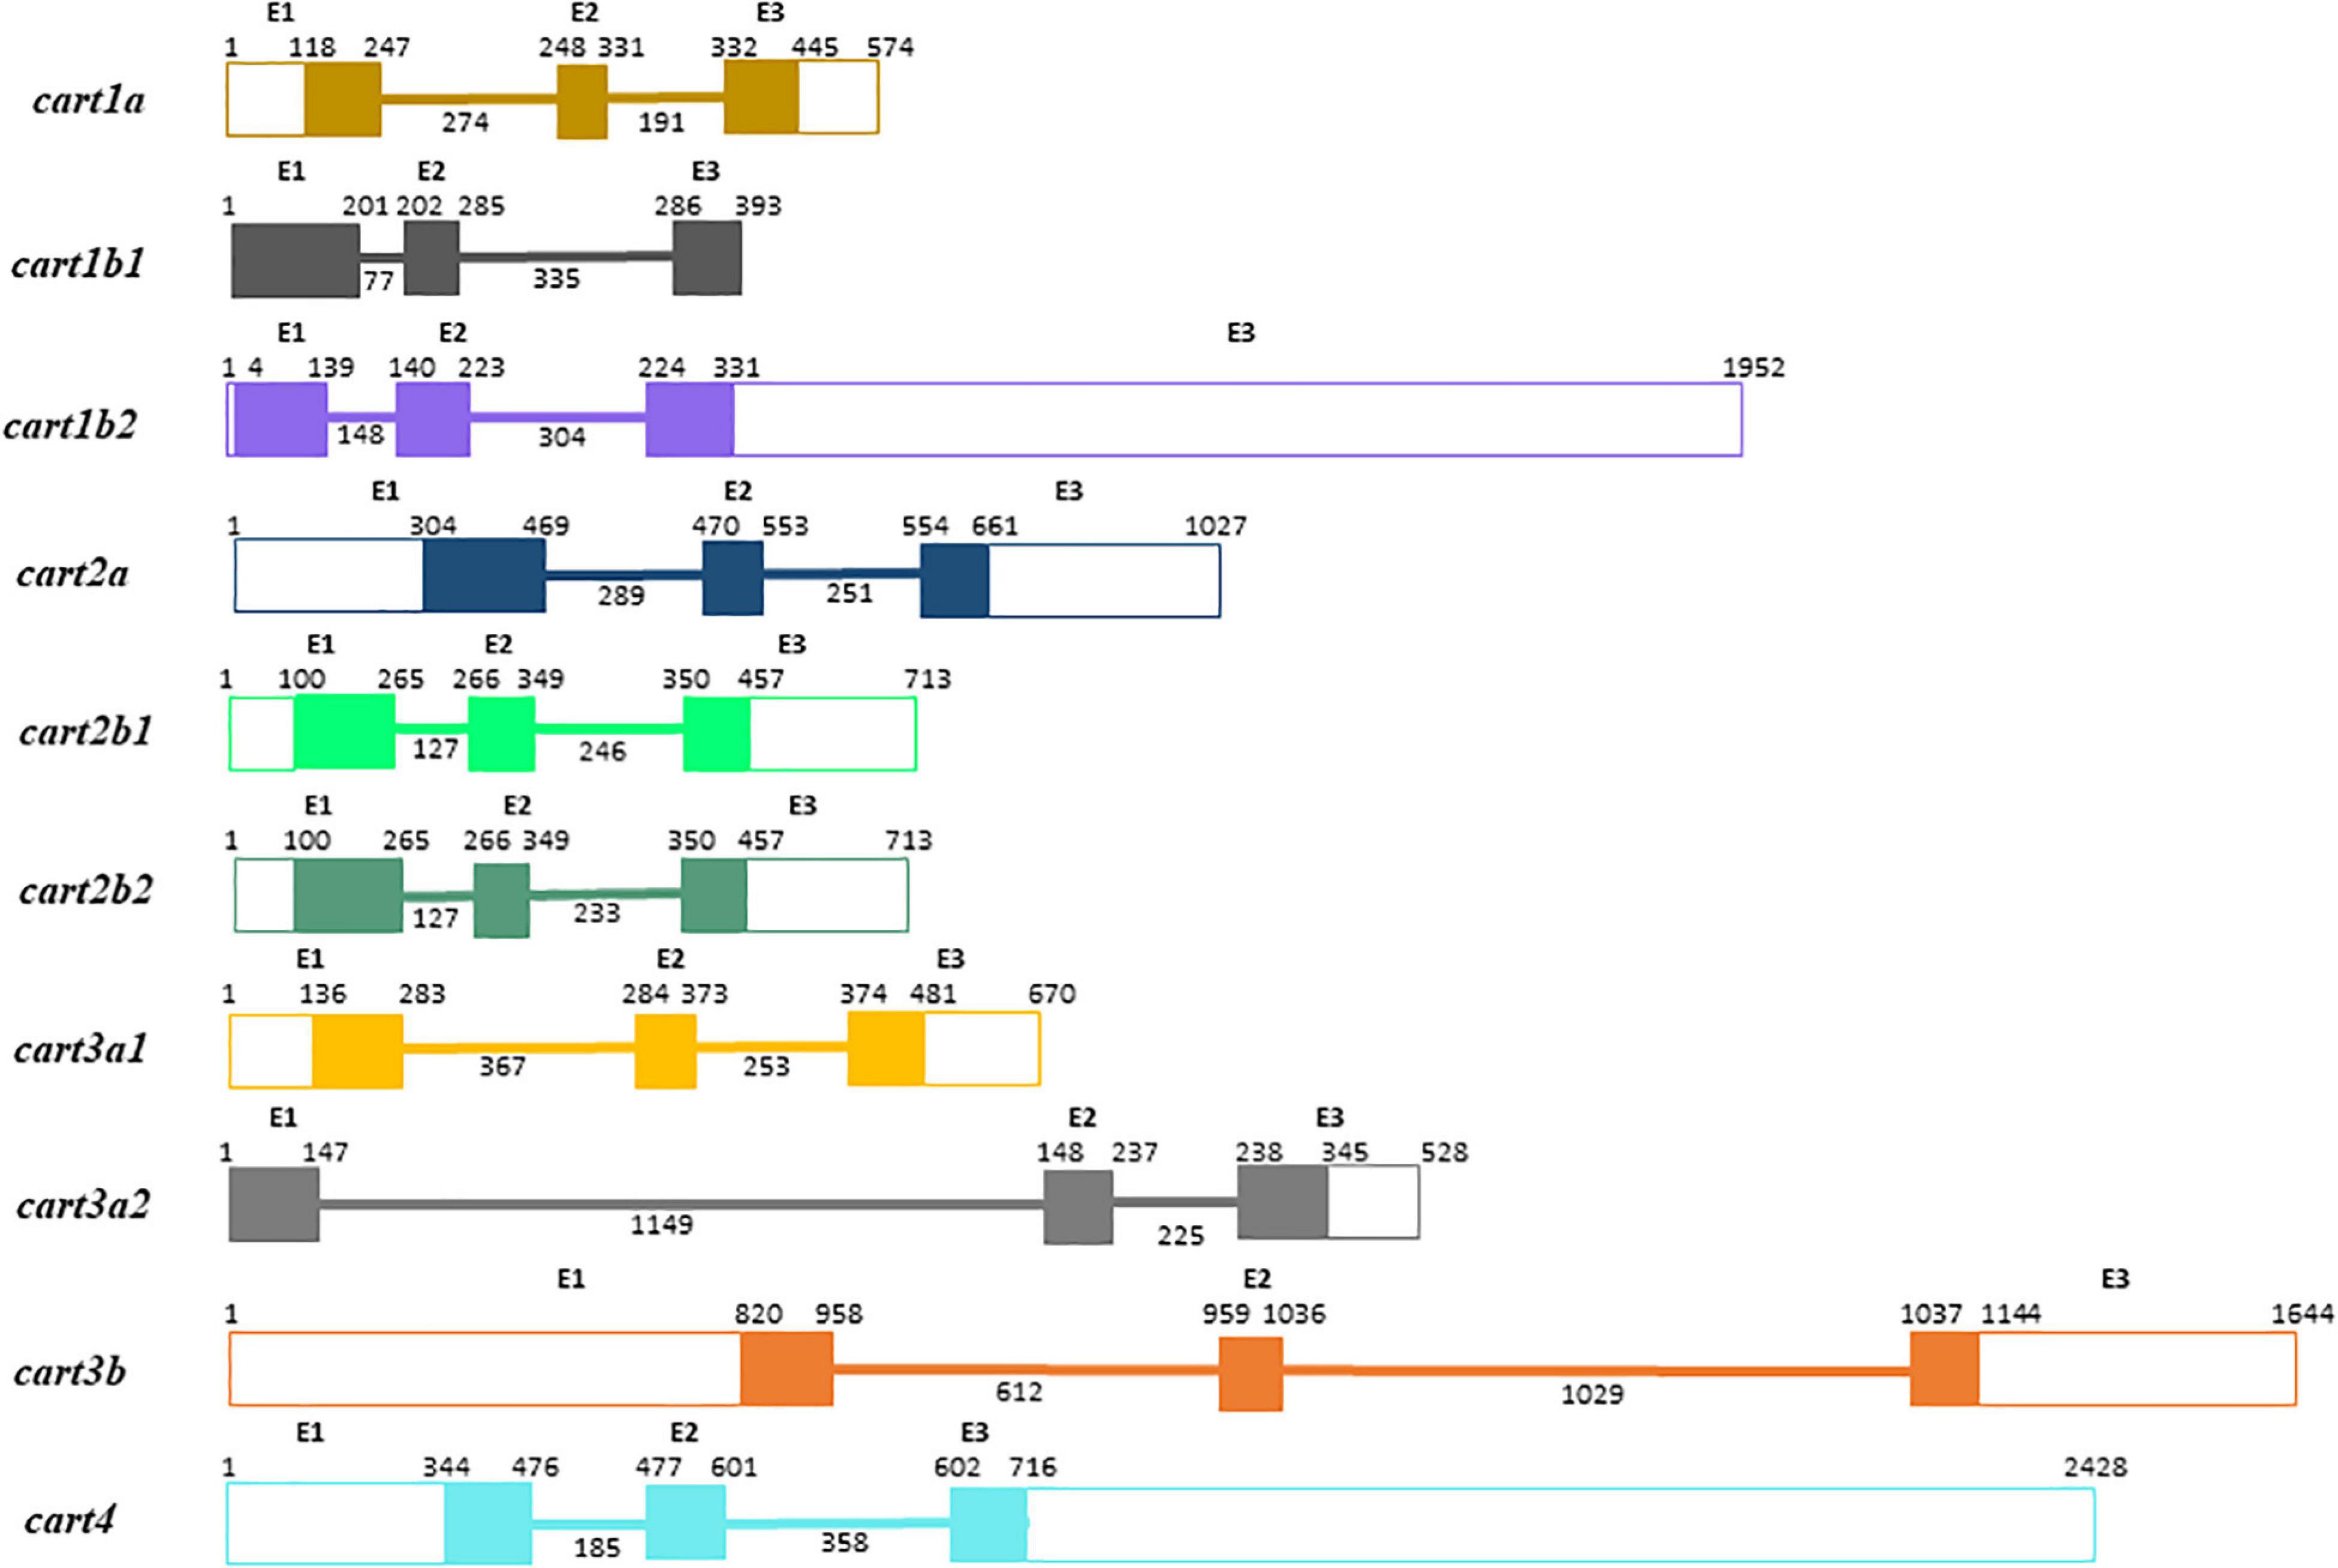
Figure 1. Predicted gene structure of Atlantic salmon cart paralogs. Exons (E1–E3) are represented by boxes and connection lines indicate introns. The open reading frames (ORF) are indicated by filled boxes and untranslated regions (5′UTR and 3′UTR) by open boxes. Size of introns and exons (UTRs and ORFs) are given below the lines and above the boxes, respectively, in base pairs (bp).
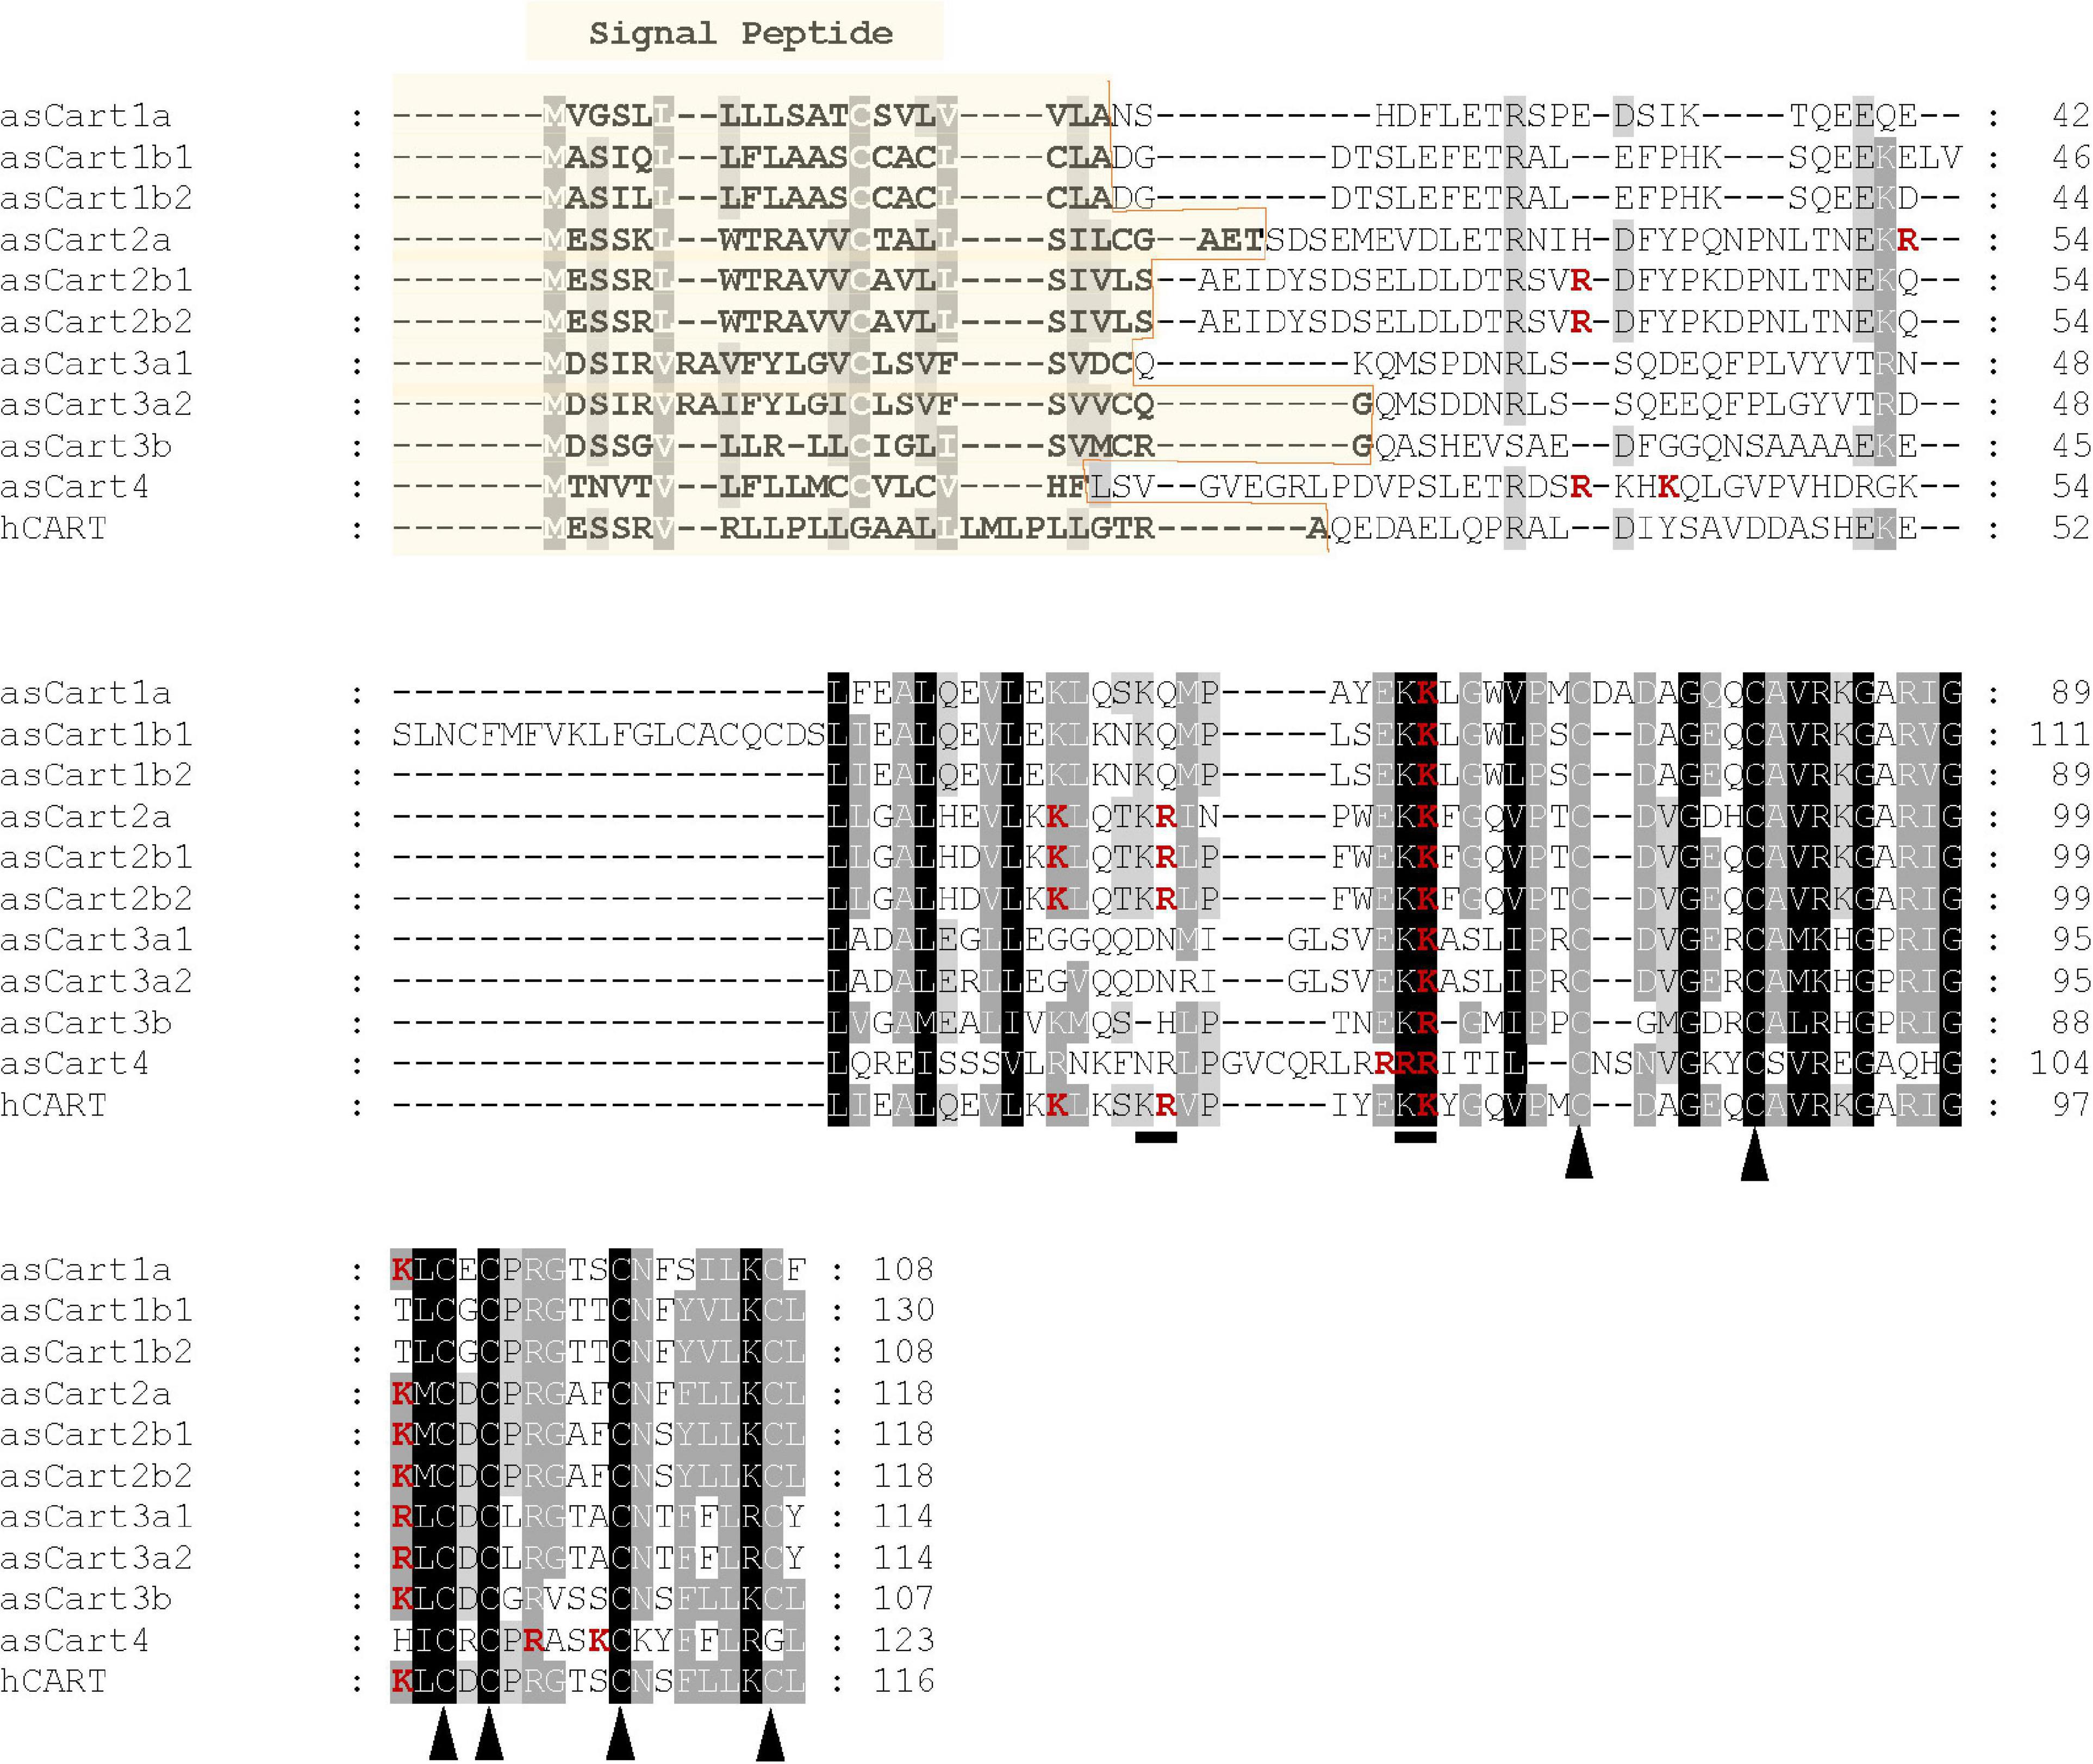
Figure 2. Multiple sequence alignment of Atlantic salmon (as) and human (h) Cart amino acid sequences obtained by using ClustalX 2.1 and edited in GeneDoc 2.7 software. Black areas indicate 100% and shaded areas indicate > 60% conserved amino acid residues among the Cart sequences. The putative signal peptide is highlighted in yellow. Potential proteolytic processing sites KK and KR for hCART are underlined with thick lines and marked in red bold letters are the predicted sites for Cart using Neuropred application. Arrowheads indicate the conserved 6 cysteine residues that forms the disulfide bond in human CART.
Phylogenetic analyses revealed that the predicted Atlantic salmon Cart sequences were grouped into 4 major clusters. The Atlantic salmon paralogs were named following the nomenclature proposed by Bonacic et al. (2015): Cart1a, 1b1, 1b2, 2a, 2b1, 2b2, 3a1, 3a2, 3b, and 4 (Figure 3). As expected, the sequences of rainbow trout (a very close relative to Atlantic salmon) Cart and Northern pike (a basal sister clade to salmonids) Cart cluster very close with Atlantic salmon Cart. The zebrafish and goldfish (cyprinids that are distant relatives to salmonids) Carts formed only 3 major clusters, lacking Cart4. The Atlantic salmon prepro-Cart sequences shared 19–50% of AA with human homolog sequence. Among the Atlantic salmon Cart paralogs, Cart1 sequences shared between 48 and 81% of identity, Cart2 shared 37–77% sequence identity, and Cart3 35–90% AA identity, whereas Cart4 only shared 18–23% of AA sequence identity with the other Cart paralogs (Supplementary Table 1).
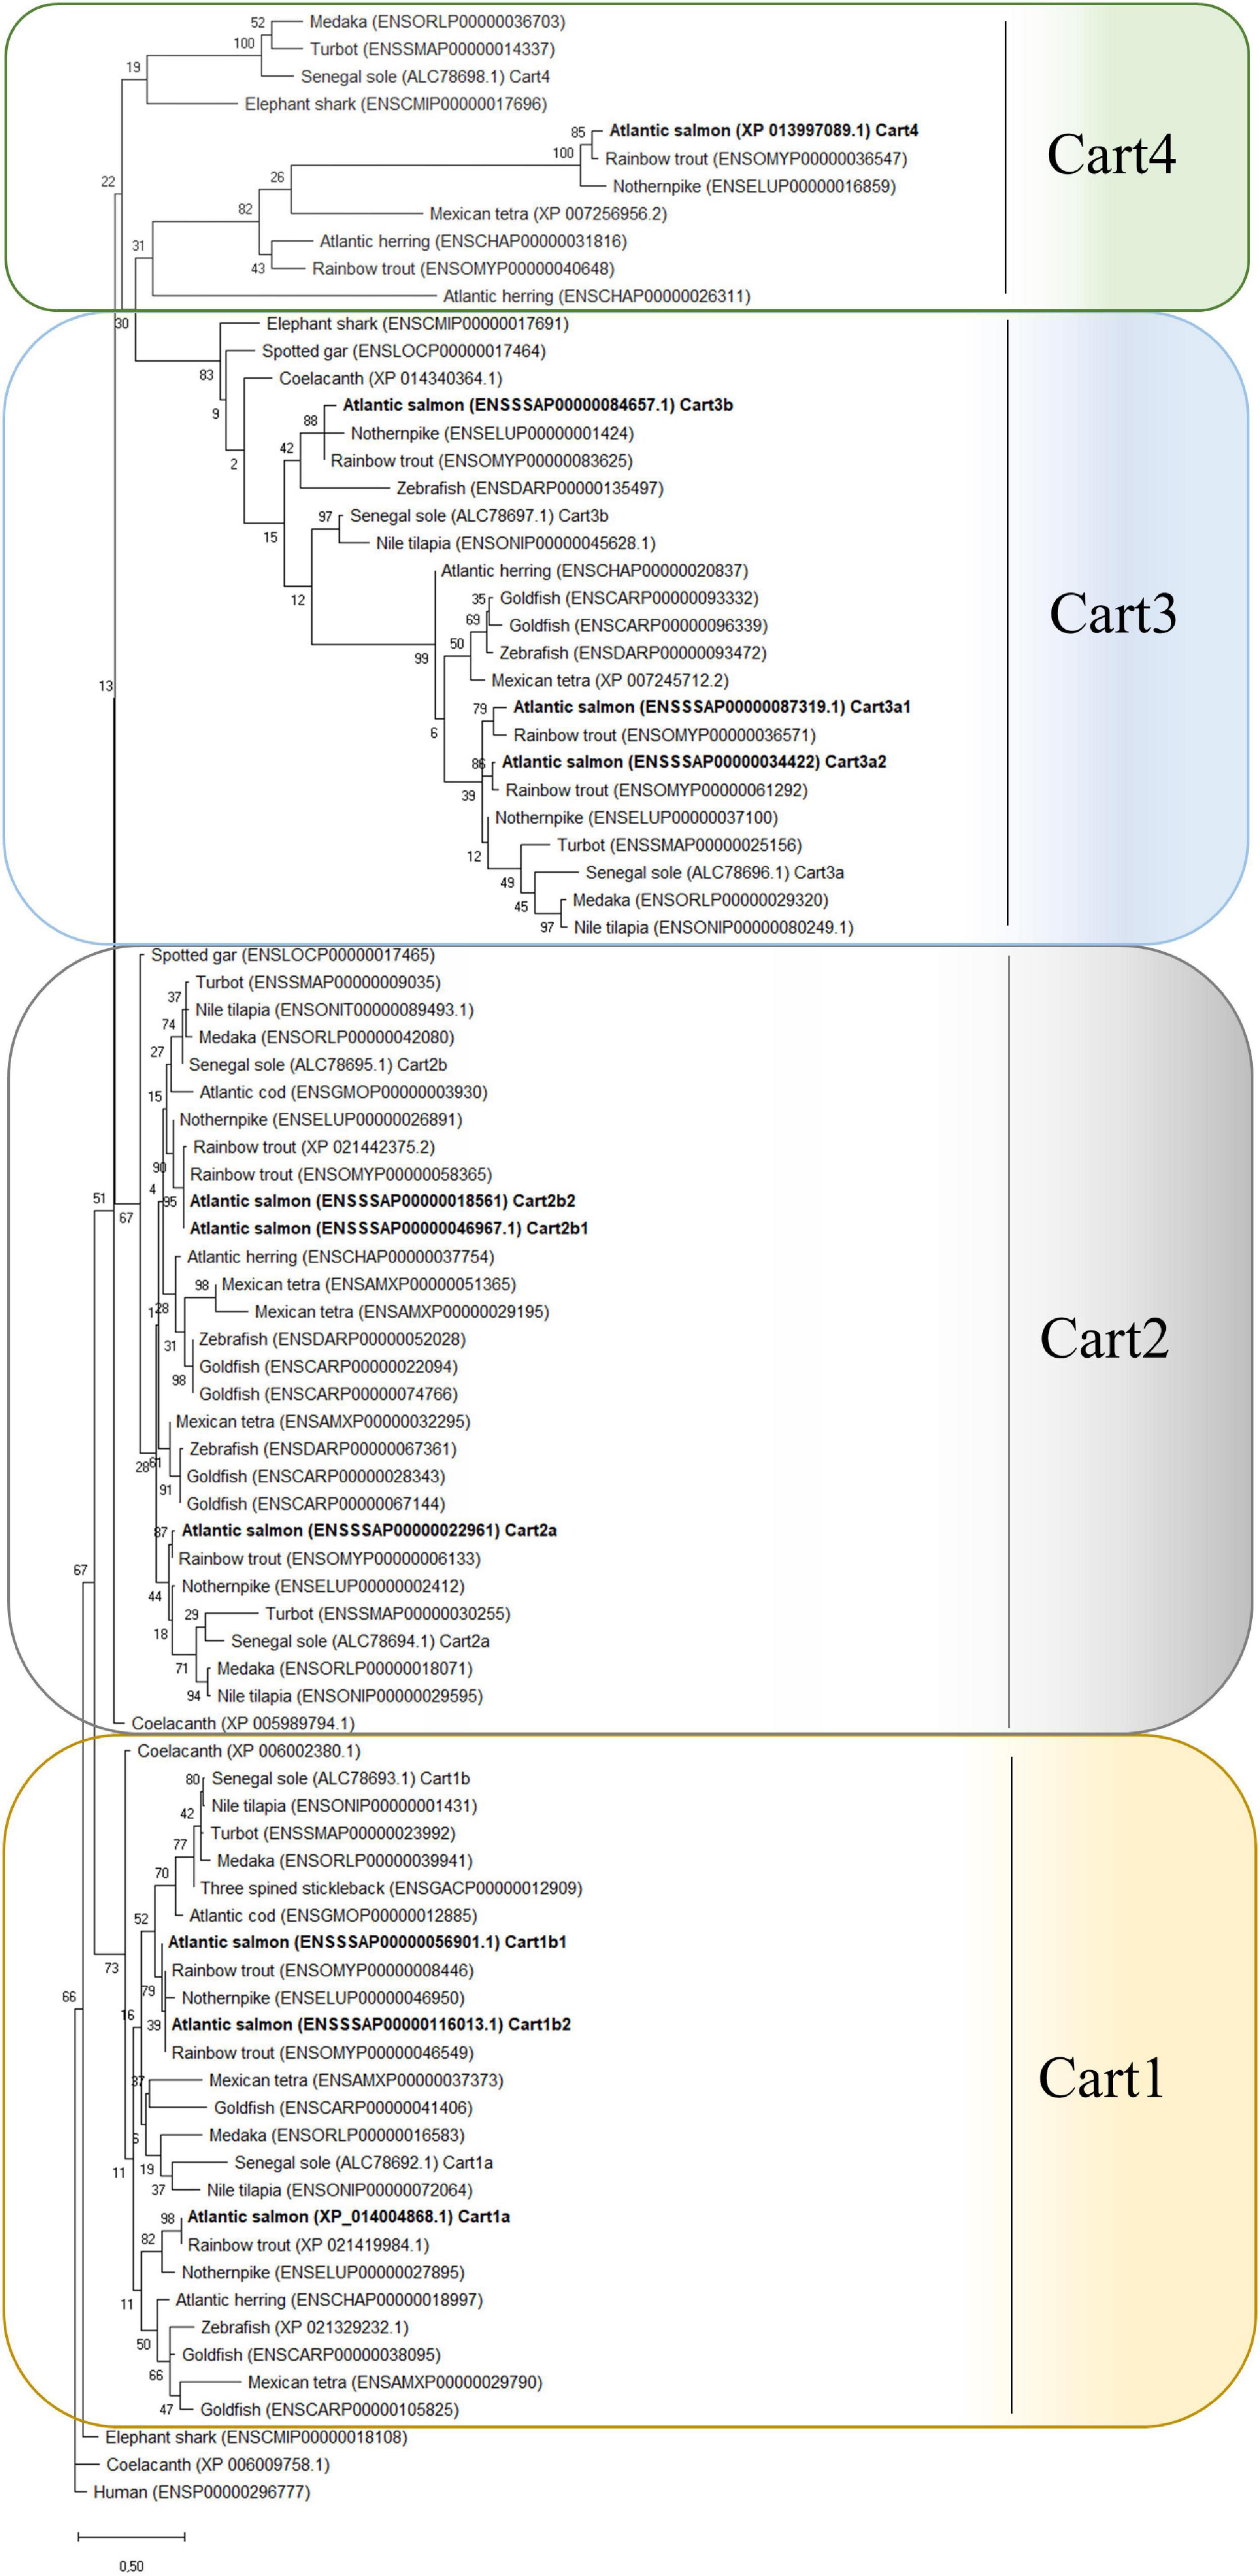
Figure 3. Phylogenetic analyses of Atlantic salmon Cart and other fish species and human based on the predicted mature peptide sequences. The evolutionary history was constructed by using the Maximum Likelihood method, 500 bootstraps replicates and JTT + G matrix-based model in MEGA X. The tree with the highest log likelihood (–4018, 51) is shown. The percentage of trees in which the associated taxa clustered together is shown next to the branches. The tree is drawn to scale, with branch lengths measured in the number of substitutions per site. This analysis involved 91 amino acid sequences. The tree is rooted to human CART.
All the predicted Cart sequences of Atlantic salmon showed a highly divergent N-terminal AA residues with the signal peptide ranging from 19 to 27 AA long, whereas the C-terminal was highly conserved (Figure 2 and Supplementary Figure 1). The human CART proteolytic processing sites of dibasic residues Lys-Arg (KR), Arg-Arg (KK) were conserved in Atlantic salmon Cart2, but only KK site is conserved in Cart1 and Cart3a, while in Cart3b and Cart4, KK is replaced with other proteolytic dibasic residues KR or RR, respectively (Figure 2). Furthermore, the 6 cysteine residues that are critical for disulfide bond in human CART are conserved in Atlantic salmon Cart paralogs except for Cart4 where only 5 cysteines are conserved.
Brain Distribution of cart mRNA in Atlantic Salmon and Response to Fasting
The qPCR analysis showed that the cart paralogs have a wide distribution pattern in the brain with varying abundance between regions (Figure 4). The cart2b is the most abundant among the cart paralogs followed by cart3b, 3a, 2a, 1b, 1a, and cart4. For cart2b OB, TEL, MB, HYP, SV, and BS were the regions where high levels of mRNA were found, whereas low expression was found in the CE and PT. The cart3b was mainly expressed in BS followed by MB. The cart2a was prominently expressed in MB, HYP, and TEL whilst cart4 showed remarkable expression in HYP and TEL. The cart3a, 1a, and 1b expression profiles were quite similar with major expression in MB, however, cart3a was also expressed considerably in BS, TEL, and CE while PT was the second highest site of expression for cart1a and 1b. In the regions OB, TEL, CE and SV for cart1b; OB, CE, SV, and PT for cart2a; CE and PT for cart2b; OB and SV for cart3a, and TEL, CE and SV for cart3b only residual mRNA expression levels were found.
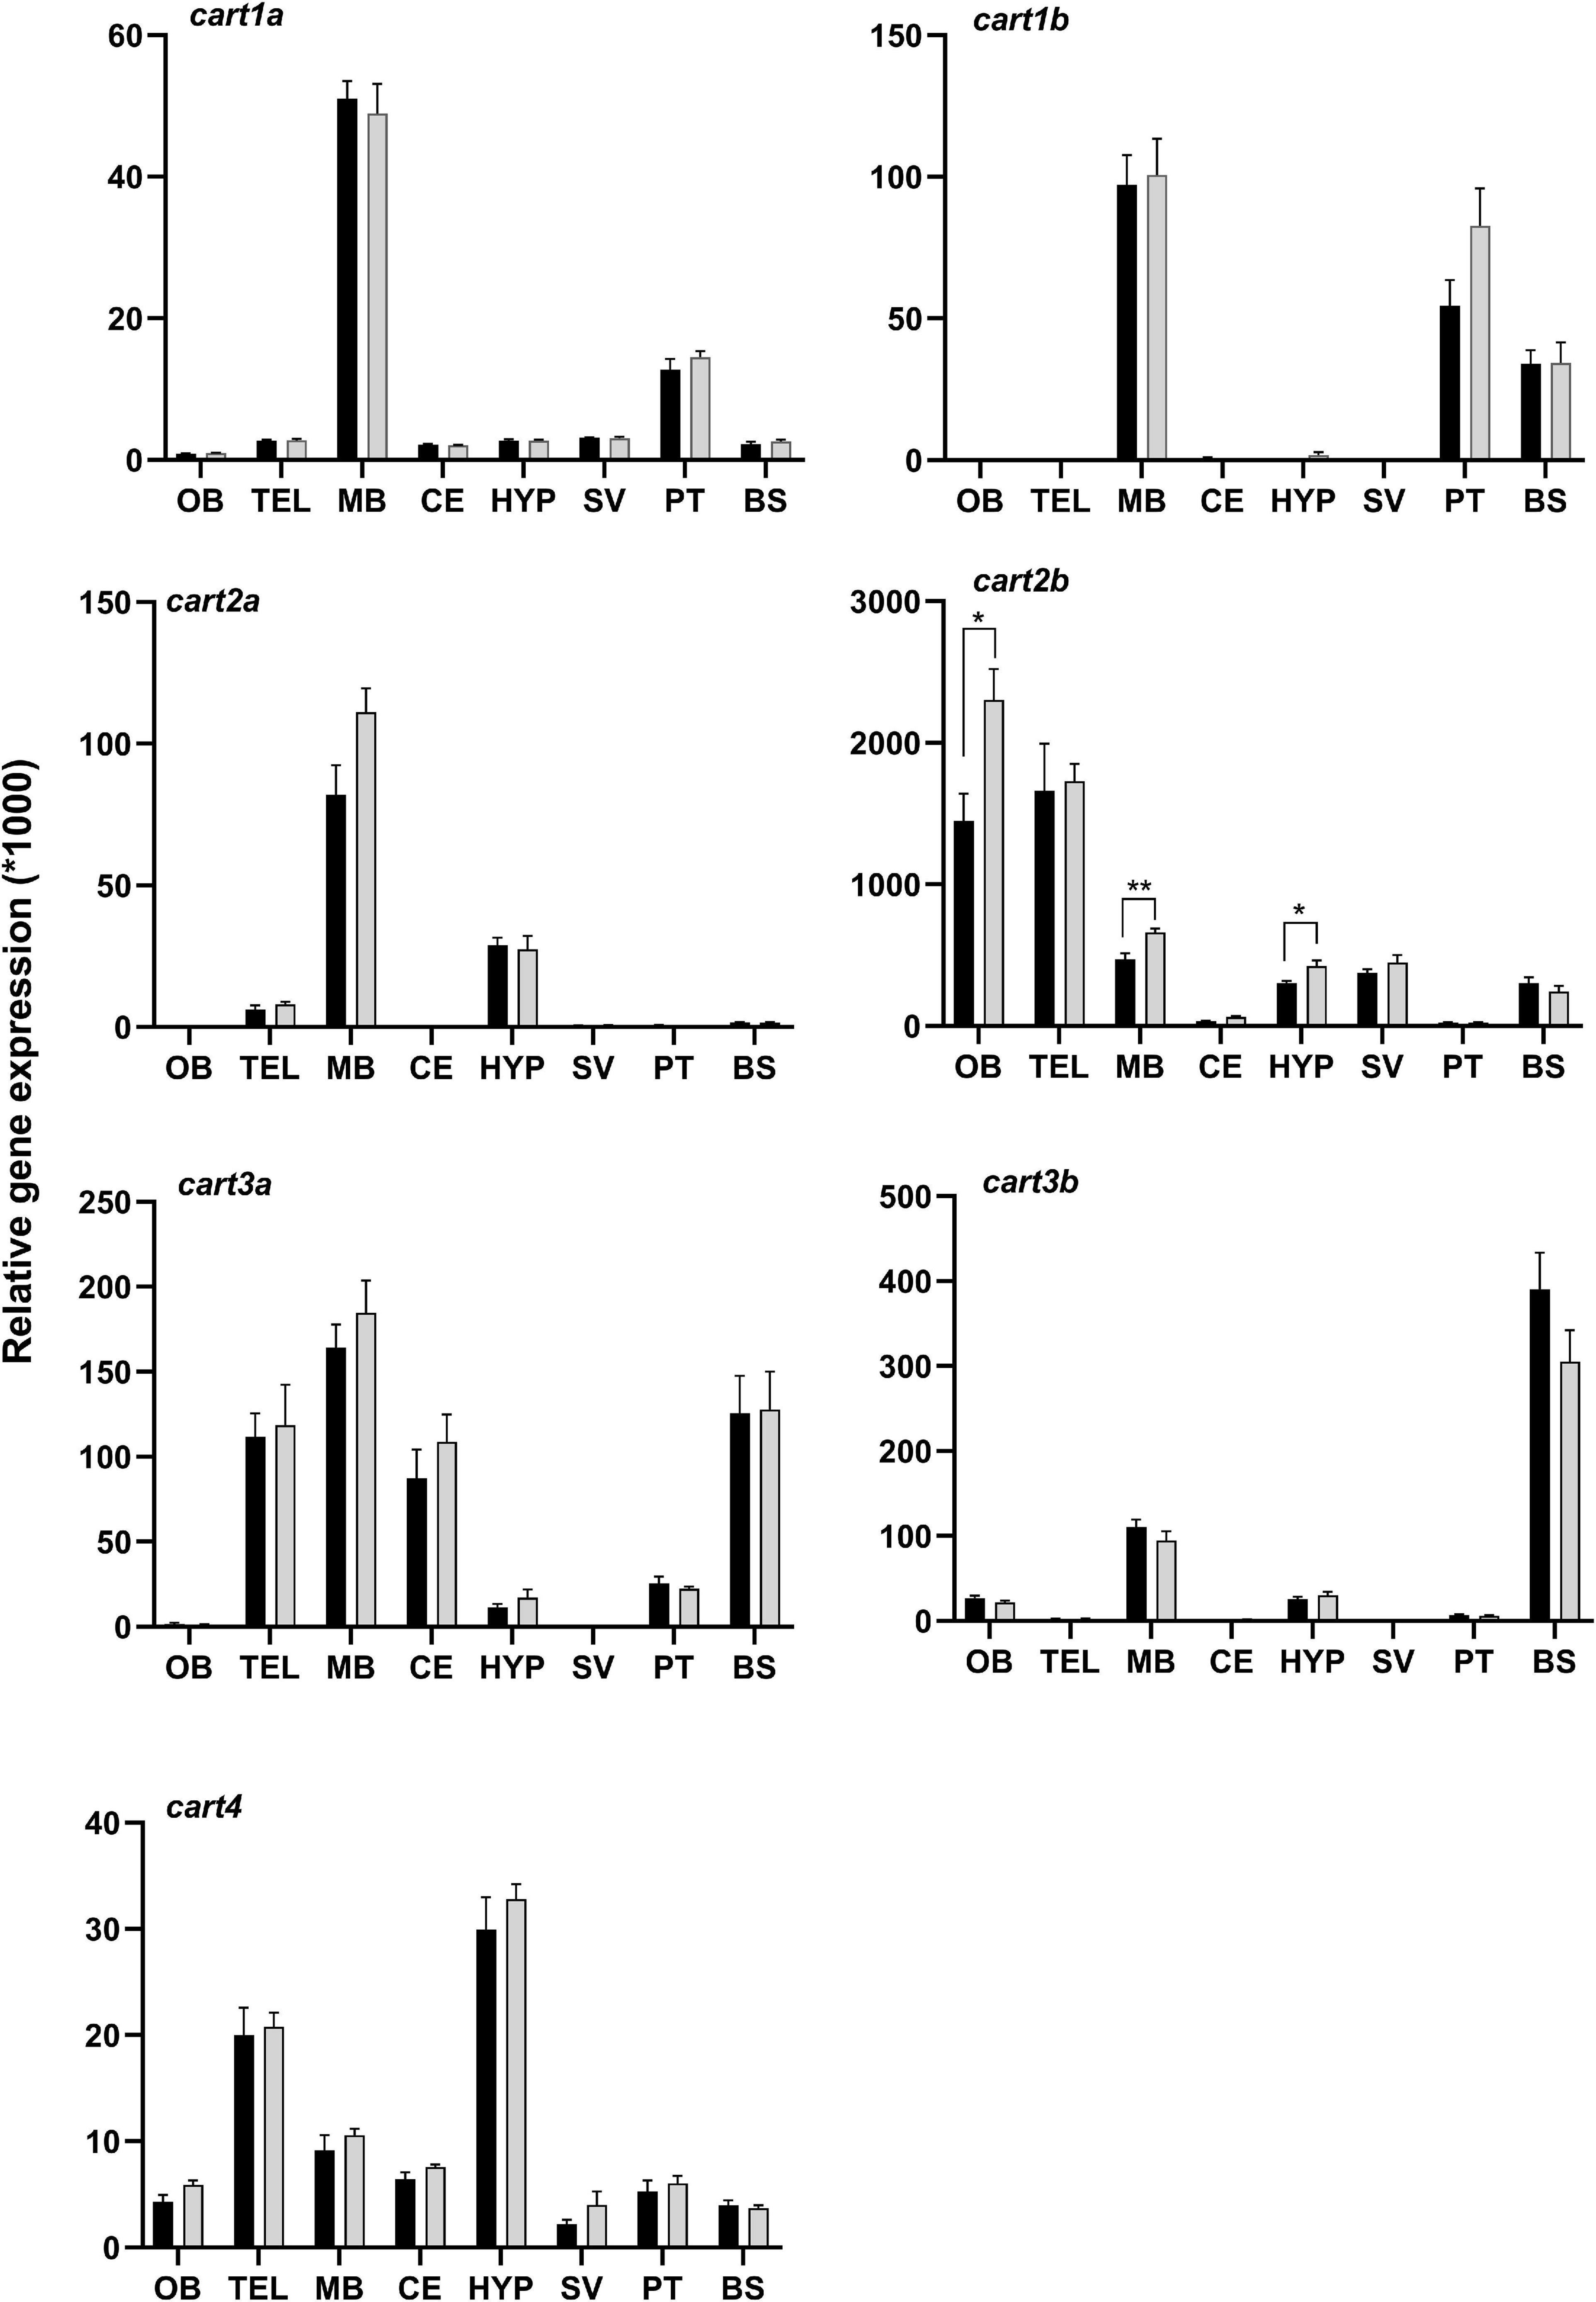
Figure 4. Effect of 4 days of fasting on the mRNA expression of cart paralogs in eight brain regions of Atlantic salmon. Black and gray bars represent fed (n = 6 except for SV n = 4) and fasted (n = 6 except for SV n = 4) groups, respectively. The graphs show the normalized cart mRNA copy number to the geometric mean copy number of actin beta and s20. Two-tailed t-test and non-parametric Mann-Whitney test was performed to assess the statistically significant differences between the two groups. The error bars represent mean ± SEM and asterisks show the significant level (*p < 0.05, **p < 0.01). OB, olfactory bulb; TEL, telencephalon; MB, midbrain; HYP, hypothalamus; CE, cerebellum; SV, saccus vasculosus; PT, pituitary; BS, brain stem.
Atlantic salmon cart2b, which is the most abundant cart paralog, was upregulated in OB (p < 0.05), MB (p < 0.01), and HYP (p < 0.05) after 4 days of fasting (Figure 4). No effect of fasting was observed for the other cart paralogs in any of the highly expressed brain regions (Supplementary Table 2).
Among the cart paralogs that were tested for the effect of 3 days of fasting in hypothalamus of Atlantic salmon, cart3a showed significant (p < 0.01) increase in the mRNA expression (Figure 5).
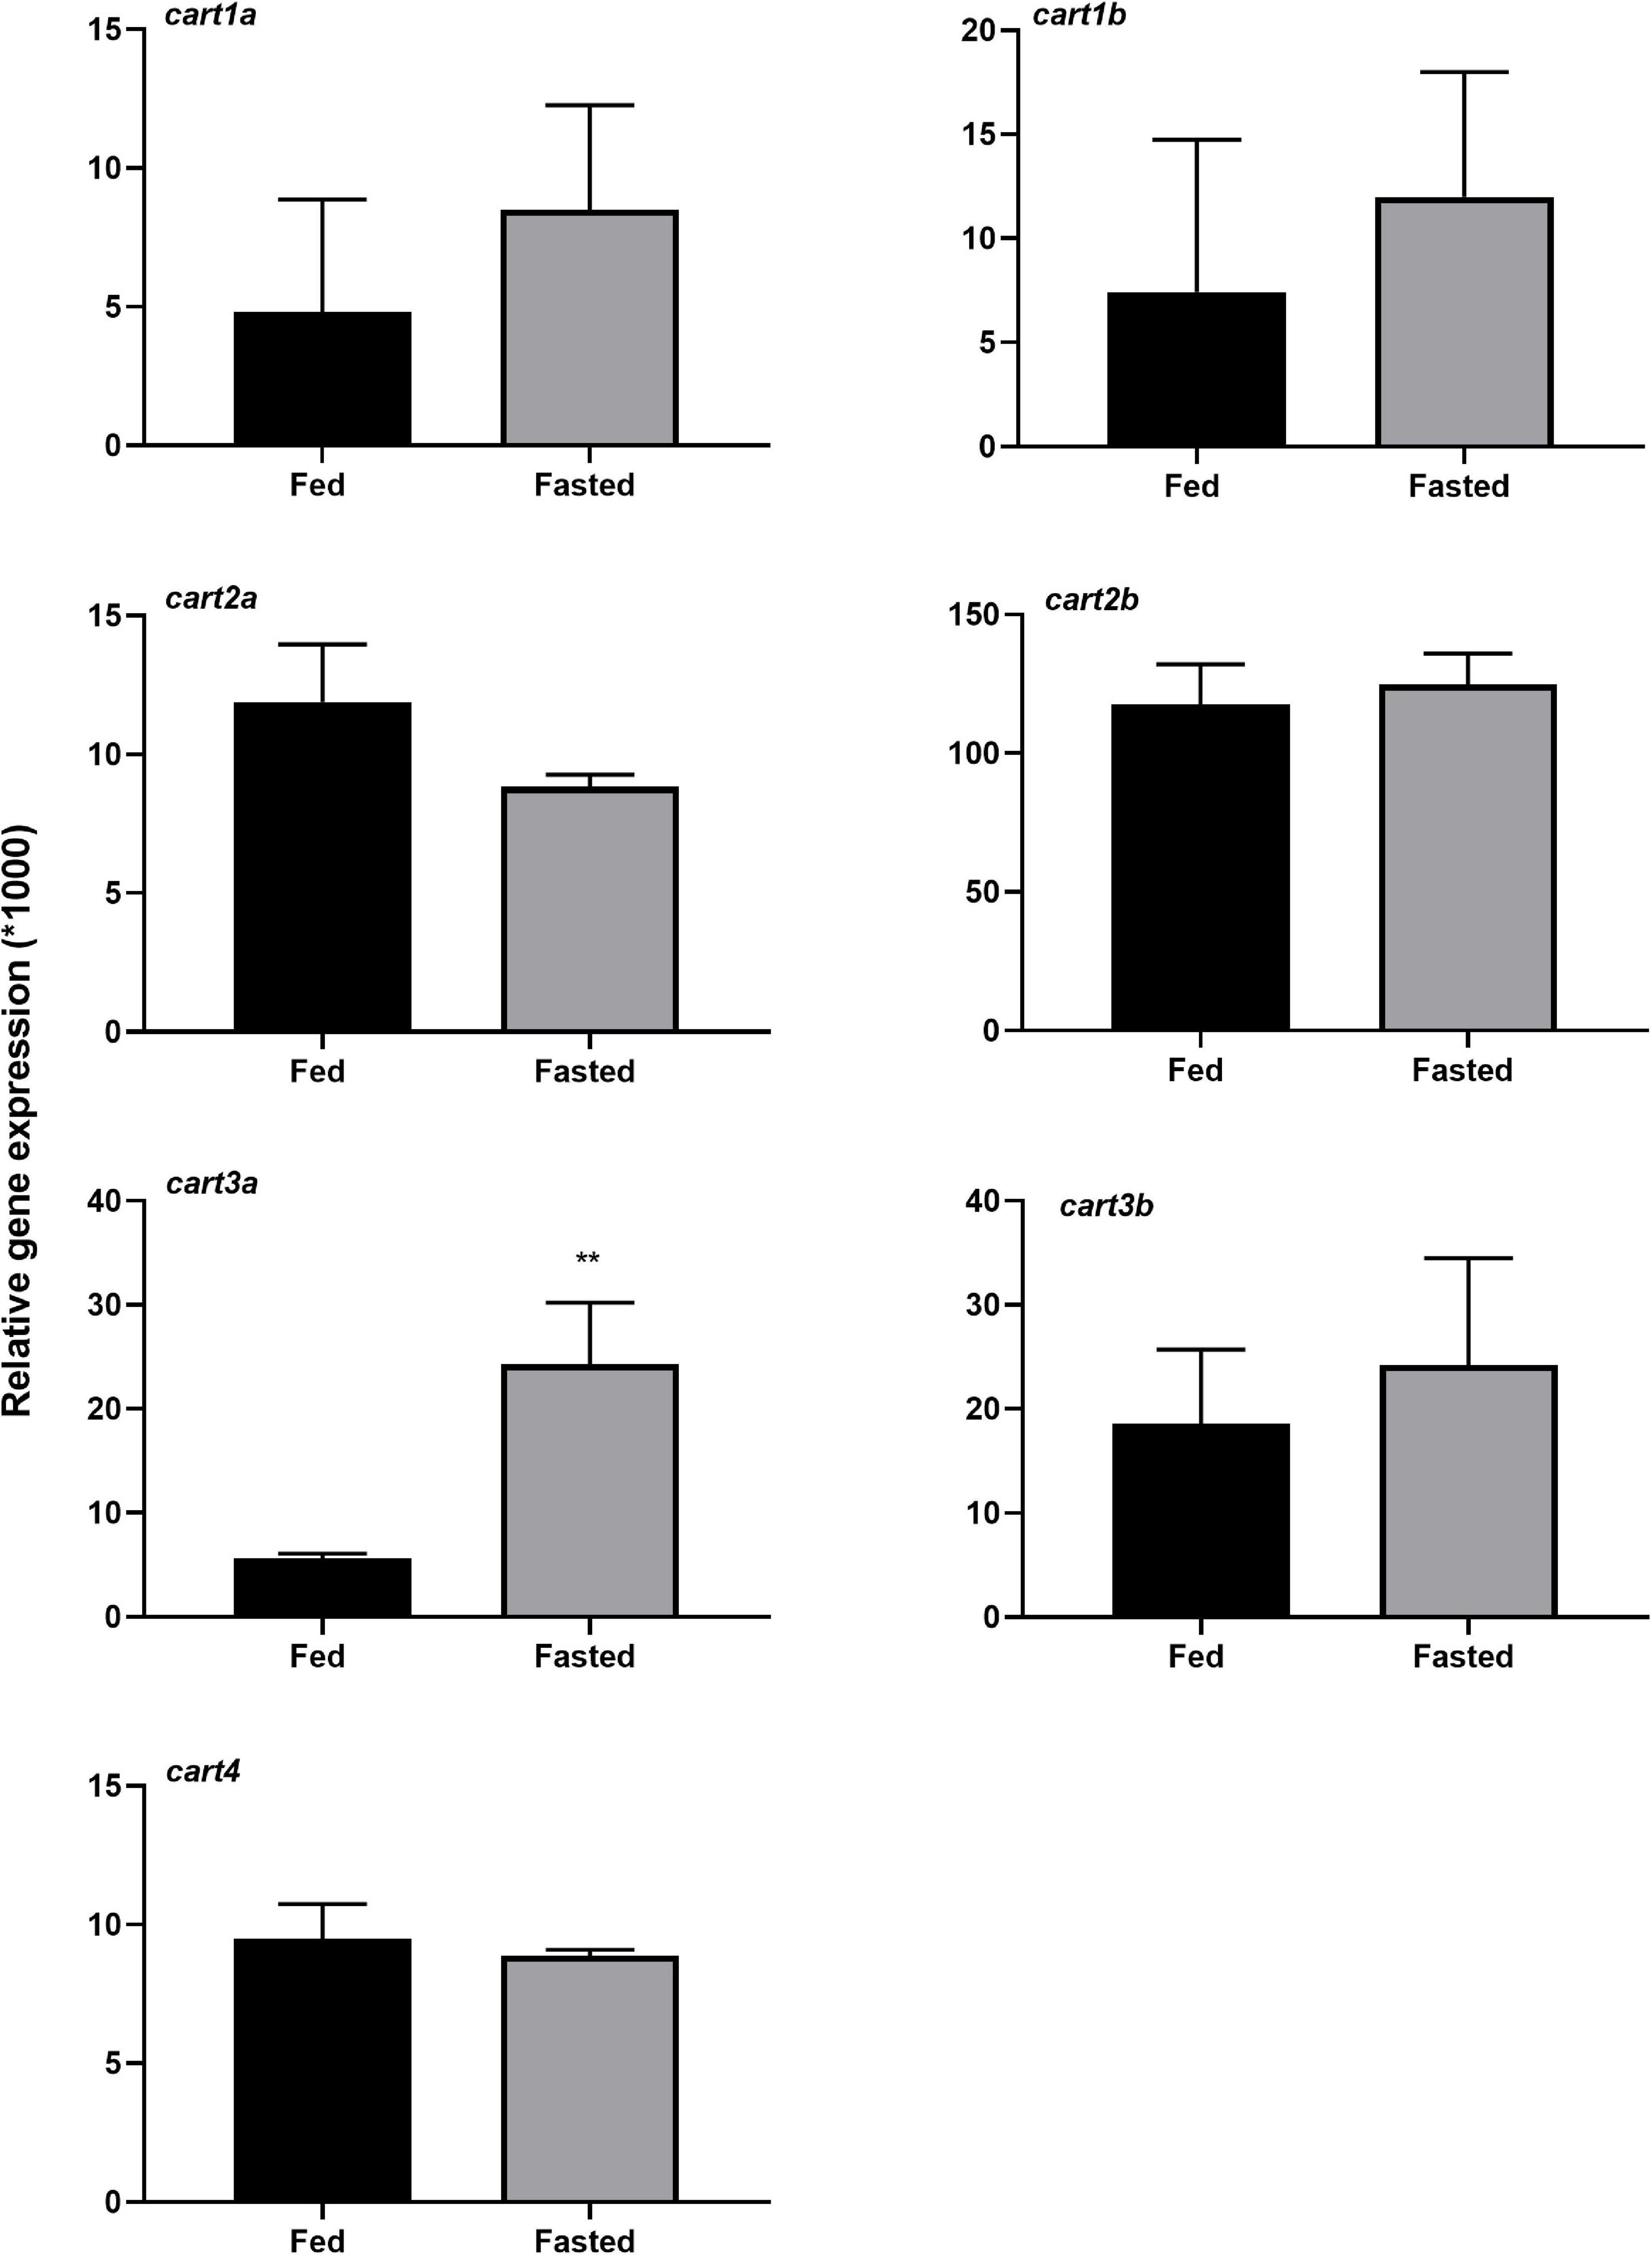
Figure 5. Effect of 3 days of fasting on mRNA expression of cart paralogs in hypothalamus of Atlantic salmon. Black and gray bars represent fed (n = 5–6) and fasted (n = 5–6) groups, respectively. The graphs show the normalized cart mRNA copy number to the geometric mean copy number of actin β and s20. Two-tailed t-test and non-parametric Mann-Whitney test was performed to assess the statistically significant differences between the two groups. The error bars represent mean ± SEM and asterisks show the significant level (**p < 0.01).
Discussion
In this study, we report the identification and characterization of 10 cart paralogs in Atlantic salmon, here named cart1a, 1b1, 1b2, 2a, 2b1, 2b2, 3a1, 3a2, 3b, and cart4. This is the first study to analyze all the aforementioned paralogs physiological role in Atlantic salmon appetite control, while the previously reported Atlantic salmon Cart by Murashita et al. (2009) is here denoted as Cart2b (b1 and b2). Furthermore, the mRNA sequences of the qPCR amplicons confirmed that none of salmon cart genes are pseudogenes. The deduced amino acid sequences showed a highly divergent N-terminal AA residues whereas the C-terminal showed a high degree of conservation. Among Cart paralogs, the potential proteolytic processing sites of dibasic residues KR and KK (Kuhar and Yoho, 1999; Rogge et al., 2008) are conserved only in Cart2, possibly cleaving it into two different size products as previously suggested by Murashita et al. (2009). In previous studies, Kuhar and Yoho (1999) identified four immunoreactive CART peptides from human and five from rat hypothalamus varying from 4 to 10 kDa. The predicted cleavage sites for Atlantic salmon Cart (Figure 2) also suggest possible multiple Cart peptides. The 3 cysteine disulfide bonds between Cys82 and Cys100, Cys88 and Cys108, Cys102, and Cys115 were predicted for human CART C-termini (UNIPROT7). These six C-terminal cysteines are conserved in all the Atlantic salmon Cart, except Cart4 where only 5 cysteine residues are present. The absence of C- terminal cysteine bond among the homologs has not been reported in teleosts before. The three disulfide bridges are key residual structures that are essential for the protein 3-dimensional structure and its function in biological activities such as food intake (Ludvigsen et al., 2001; Maixnerová et al., 2007). The Atlantic salmon Cart sequence alignment clearly show that Cart4 structure potentially differs from the other salmon’s Carts and human CART. This suggests that Atlantic salmon Cart4 may differ in functionality from the other Carts and may likely be ruled out from its role in appetite regulation. It would also be possible that Cart4 is non-functional or has adopted new function and this warrants further studies. In teleost cart mRNA expression in peripheral tissues like eye, gill, ovary, testis has also been reported suggesting Cart may also have other roles (Volkoff and Peter, 2001; Murashita et al., 2009). Interestingly, the multiple sequence alignment of Cart prepropeptides revealed also Cart4 in northern pike, rainbow trout, Atlantic herring and Cart2 in Atlantic cod lack of one or more Cysteine residue in the C-termini (Supplementary Figure 1).
The evolutionary history of cart depicted in the phylogenetic tree shows that the Ts 3R genome duplication resulted in the presence of 7 cart genes in species like Senegalese sole, Mexican tetra, Northern pike, etc., and the Ss 4R genome duplication resulted in 10 cart genes in the Atlantic salmon, including sub types cart1b1 and 1b2, cart2b1 and 2b2, cart3a1 and 3a2. The divergence of the cart gene in salmonids opens the possibility that the gene products might have adopted to new functions (neofunctionalization) or partitioning the ancestral function among the paralogs (sub functionalization) during genome evolution reviewed by Volff (2005). Furthermore, the fact that Atlantic salmon and other teleosts have multiple cart genes while only one is present in mammals’, open up interesting perspectives for comparative research on evolutionary adaptations of gene function and the control of appetite and energy homeostasis.
To date, there are only a few studies exploring the full cart gene repertoire in teleost species. These studies include the identification of seven cart paralogous genes in Senegalese sole (Bonacic et al., 2015), six genes in medaka (Murashita and Kurokawa, 2011), and five yellowtail (Fukada et al., 2021). Thus, a revision of the teleost genome databases and nomenclature of cart genes is essential in further studies exploring the functional role of Cart in these species.
Our results revealed that all cart paralogs were expressed at different mRNA levels in the eight brain regions analyzed in this study. Among all the cart genes, cart2b was the most abundant paralog, with predominant expression in the OB followed by TEL, MB, HYP, and SV. A similar pattern has also been reported in Senegalese sole (Bonacic et al., 2015) and yellowtail (Fukada et al., 2021). In teleosts, Cart has been suggested to play a role in processing olfactory information (Akash et al., 2014; Porter et al., 2017) including antiviral immune response (Sepahi et al., 2019). However, the Atlantic salmon cart2b expression in the OB and a possible link to olfaction and/or immune response is not clear and needs to be further investigated. The cart2b was the only gene that was affected by 4 days of fasting, and a significantly higher expression was observed in the fasted group compared to the fed group in the Atlantic salmon specifically in OB, MB, and HYP. Hypothalamus is considered as a center of appetite control in vertebrates (Volkoff, 2016; Rønnestad et al., 2017; Soengas et al., 2018), and in fish this is supported by Ye et al. (2020) who reported that in grass carp the hypothalamus and telencephalon might be involved in feeding and reproduction. Hence, in Atlantic salmon, hypothalamic cart2b might play a vital role in appetite regulation, with fasting maybe inducing shutting down hunger. This is in line with observations in Siberian sturgeon (Acipenser baerii) (Zhang et al., 2018), where cart mRNA in whole brain increased after 3–17 days of food deprivation. Interestingly, our finding is contrary to several previous studies that demonstrate the anorectic function of Cart. In goldfish, cart form I (alias cart2b) mRNA level declined with 96 h food deprivation in telencephalon, hypothalamus, and olfactory bulb while cart form II (alias cart2a) mRNA level declined only in the olfactory bulb. In the same study, cart2b transcript levels increased 2 h following a meal in olfactory bulb and hypothalamus whereas no postprandial changes were observed in cart2a (Volkoff and Peter, 2001; Volkoff et al., 2005). However, in yellowtail cart2b expression in OB, TEL, HYP was upregulated in fish fasted for 8 days, though not significantly, while cart3a was significantly upregulated in OB, TEL, and PT of the fasted group (Fukada et al., 2021). The brain cart mRNA expression in response to fasting varied depending on species, and even within the same order as for example, in silver dollar, fasting induced a decrease in cart expression while for black widow tetra and bucktooth no effect was observed (Butt et al., 2019). Forebrain cart mRNA expression levels were significantly higher in cod fish held at 2∘C than in those held at either 11 or 15∘C (Kehoe and Volkoff, 2008) suggesting Cart mediates temperature- induced changes in appetite during the seasonal changes in the lifespan of this species. In addition, the stomach from fish acclimated to 2∘C had less food. Taking into consideration that these fish were handfed to satiety, the results suggested Cart acts as a satiety factor in this species (Kehoe and Volkoff, 2008). Previous studies investigating the role of cart in appetite regulation in Atlantic cod (Kehoe and Volkoff, 2007, 2008) and Atlantic salmon (Murashita et al., 2009) using a single cart paralog suggested an anorectic role for the neuropeptide. Indeed, in Atlantic salmon, 6 days of fasting resulted in decrease of brain cart2b (previously named cart) (Murashita et al., 2009). In medaka, 17 days of fasting also downregulated brain cart2b (previously named cart ch3) (Murashita and Kurokawa, 2011). However, both studies have used whole brain in the gene expression analysis. Accordingly, cart2b seemed to be involved in appetite regulation but the available data on its action are contradictory since orexigenic, anorexigenic or no action have been reported depending on whether the analyses were performed at brain region level (for e.g., hypothalamus) or on the whole brain and/or the fasting time used. Besides, two different studies in zebrafish reported that cart2a and cart3a (previously named cart2 and cart4, respectively, Akash et al., 2014) were downregulated in response to short-term fasting within hypothalamic region and cart2b (previously named cart3, Ahi et al., 2019) was downregulated in brain after 7 days of fasting. The involvement of Cart2 in appetite regulation in Atlantic salmon is further supported by the fact that this is the only Cart paralog that has the same potential proteolytic sites as in mammals. These studies show the diversity between species and importance of long-term vs. short-term testing of the Cart neuropeptide and emphasizes the need for more sampling time points to uncover the specific role of Cart paralogs in appetite regulation in Atlantic salmon.
The cart1a and 1b show quite similar mRNA expression profile and cart1, cart2a, and cart3a are highly expressed specially in the MB, suggesting that these cart paralogs might share the same functional role. Comparably, in Senegalese sole, Bonacic et al. (2015) observed that cart1, cart2a, and cart3a were highly expressed in mesencephalon which is the equivalent region to the MB in our study. The cart1a and 1b are primarily expressed in MB followed by PT in Atlantic salmon brain, which indicate that these genes might be involved in functions linked to these brain regions, such as vision and feeding for MB, and energy metabolism, organ development and reproduction for PT. Ye et al. (2020) showed that in grass carp the optic tectum seems to play an important role in the visual system and feeding. The potential role of cart in reproduction is reported in chicken, where pituitary CART peptide expression and secretion is regulated in the hypothalamic-pituitary-gonadal (HPG) axis through gonadotropin-releasing hormone (GnRH), and GnRH administration increased plasma CART (Mo et al., 2019). In this study, the cart2a, 2b, and 4 mRNA expression in hypothalamus suggests that these might be involved in appetite control in Atlantic salmon. We further speculate that they might relay the signals relevant to feeding at different time points. However, further studies are needed to unravel the actual molecular interaction and functionalization among cart paralogs.
The feeding regime (continuously or meal-based) and the period in between last feed and sampling are also reflected in the expression of neuropeptides regulating appetite in the brain. Most probably, there is a higher variation in voluntary feed intake when the fish are fed continuously. The macronutrient composition of the feed and the period of fasting are also important factors as it can influence the species digestive physiology and gut evacuation time, and consequently affect the appetite control. Fukada et al. (2021) reported that in yellowtail, cart2a showed a tendency to decrease in hypothalamus with fasting and increased with refeeding when the sampling was performed 3 h after feeding. Similarly, in our study, 3 days of fasting resulted a tendency to downregulation of cart2a in HYP in fasted group compared to the fed group (sampled 2 h after last feed).
The cart3b expression revealed a completely different profile compared to other paralogs with BS as its primary site of expression of this paralog in the brain. This is in line with particularly high expression levels detected in the spinal cord in Senegalese sole (Bonacic et al., 2015). Though there was no significant difference in cart3b mRNA expression between the fed and fasted group, the decreasing trend with fasting in BS shows a potential anorexigenic role. We speculate that satiety information generated during a meal, largely conveyed via afferent fibers of vagus nerves first to the hindbrain from the upper gastrointestinal tract in mammals (reviewed in Schwartz et al., 2000), seems to be conserved in fish species. The BS region which contains Mauthner neurons (MN), specific multifunctional neurons in fish, receives afferent information from vestibular, auditory, and visual analyzers and can integrate the afferent activity. In Chinese sleeper (Perccottus glehni), the MN responded to severe environmental conditions like deficit of nutrients/energy substrates, oxygen and temperature changes by modifying the structure of the cell and through different pathways for the maintenance of the energy balance (Santalova et al., 2018). Whether this link between cart3b and MN is also seen in Atlantic salmon brain under starvation is unknown and would be an interesting topic for further studies.
Cart has also been suggested to be involved in other physiological processes like stress response, anxiety, depression, reproduction (Koylu et al., 2006), and immune response (Burgos et al., 2019) in mammals.
The interlink between CART peptide and other stress related peptides in the hypothalamic-pituitary-adrenal (HPA) axis have been somewhat studied in mammals and the findings show that intracerebroventricular CART injection increases hypothalamic corticotropin-releasing factor (crf) mRNA levels and CRF release. In rats, centrally administered CART increased adrenocorticotropic hormone and corticosterone in circulation and exerted dose-dependent increase in anxiety-related behaviors (reviewed in Koylu et al., 2006). Similarly, in fish under stressed conditions the mechanisms involving food intake are deregulated. Consequently, the regular signals controlling appetite in the brain are altered, resulting in changes in the expression of the appetite-related neuropeptides and reduction in food intake (reviewed in Conde-Sieira et al., 2018). In zebrafish, exposure to acute handling stress induced increased expression of cart and pro-opiomelanocortin (pomc) as central keys in the appetite control (Cortés et al., 2018), but the response of appetite regulating neuropeptides to stress can differ in salmonids (reviewed in Conde-Sieira et al., 2018). In our study, both experimental groups of fish were maintained throughout the experiment under same rearing conditions, even during sampling both groups went through the same procedures. The effect of handling stress in the appetite regulating neuropeptides genes expression in Atlantic salmon brain still remains to be uncovered.
Conclusion
This study identifies 10 cart paralogs in Atlantic salmon brain with distinct distribution profile. Among the paralogs cart2b responded to 4 days of fasting by increase in mRNA expression in hypothalamus, olfactory bulb and midbrain while cart3b showed a trend of decline in brain stem. The difference in key residual structure of Cart4 suggesting potentially different function other than appetite regulation. The Cart paralogs 1a, 1b, 2a, and 3a might likely have potential different roles in the regional integration of appetite (relaying) signals in the hypothalamus, telencephalon, and brain stem, and/or other functions in the olfactory bulb and midbrain. To uncover their specific role in appetite regulation in Atlantic salmon more sampling time points will be required. Moreover, the complex molecular interactions with other peptide hormones need to be untangled to understand the potential role of Cart in appetite regulation in Atlantic salmon.
Data Availability Statement
The datasets presented in this study can be found in Supplementary Table 3.
Ethics Statement
The animal study was reviewed and approved by the Local Representative of Animal Welfare at Department of Biological Sciences, University of Bergen, Norway, in accordance with Norwegian Animal Research Authority regulations.
Author Contributions
TK, AG, KM, IT, FL, and IR conceived and designed the study. AG, KM, and IR conducted the experiment. AG, TK, KM, and FL contributed to the sampling. TK and AG did the primers design and phylogenetic analysis. TK and IT did preparatory lab work and qPCR. TK performed statistical analysis and drafted the manuscript. All authors contributed to the interpretation of the data, writing of the manuscript, read and approved the submitted version.
Funding
This study was supported by the Research Council of Norway (projects 261753, 267626, 268987, and 221568/030) and Regional Research Fund West (project 259183).
Conflict of Interest
The authors declare that the research was conducted in the absence of any commercial or financial relationships that could be construed as a potential conflict of interest.
Publisher’s Note
All claims expressed in this article are solely those of the authors and do not necessarily represent those of their affiliated organizations, or those of the publisher, the editors and the reviewers. Any product that may be evaluated in this article, or claim that may be made by its manufacturer, is not guaranteed or endorsed by the publisher.
Acknowledgments
We would like to thank E. Pino Martinez and Prof. S. O. Handeland for providing the fish, H. Savolainen for technical support with the fish tanks, and Dr. V. Gelebart, D. Flatejord, and G. Del Vecchio for assistance during sampling.
Supplementary Material
The Supplementary Material for this article can be found online at: https://www.frontiersin.org/articles/10.3389/fmars.2021.763766/full#supplementary-material
Footnotes
- ^ http://www.ensembl.org/index.html
- ^ https://www.ncbi.nlm.nih.gov/
- ^ http://www.predisi.de/index.html
- ^ http://stagbeetle.animal.uiuc.edu/cgi-bin/neuropred.py
- ^ https://www.ncbi.nlm.nih.gov/tools/primer-blast
- ^ https://blast.ncbi.nlm.nih.gov/Blast.cgi
- ^ https://www.uniprot.org/uniprot/Q16568
References
Ahi, E. P., Brunel, M., Tsakoumis, E., and Schmitz, M. (2019). Transcriptional study of appetite regulating genes in the brain of zebrafish (Danio rerio) with impaired leptin signalling. Sci. Rep. 9:20166. doi: 10.1038/s41598-019-56779-z
Akash, G., Kaniganti, T., Tiwari, N. K., Subhedar, N. K., and Ghose, A. (2014). Differential distribution and energy status-dependent regulation of the four CART neuropeptide genes in the zebrafish brain. J. Comp. Neurol. 522, 2266–2285. doi: 10.1002/cne.23532
Asche, F., and Oglend, A. (2016). The relationship between input-factor and output prices in commodity industries: the case of Norwegian salmon aquaculture. J. Commod. Mark. 1, 35–47. doi: 10.1016/j.jcomm.2015.11.001
Bonacic, K., Martínez, A., Martín-Robles, ÁJ., Muñoz-Cueto, J. A., and Morais, S. (2015). Characterization of seven cocaine- and amphetamine-regulated transcripts (CARTs) differentially expressed in the brain and peripheral tissues of Solea senegalensis (Kaup). Gen. Comp. Endocrinol. 224, 260–272. doi: 10.1016/j.ygcen.2015.08.017
Burgos, J. R., Iresjö, B. M., Olsson, L., and Smedh, U. (2019). LPS immune challenge reduces arcuate nucleus TSHR and CART mRNA and elevates plasma CART peptides. BMC Neurosci. 20:59. doi: 10.1186/s12868-019-0539-z
Butt, Z. D., O’Brien, E., and Volkoff, H. (2019). Effects of fasting on the gene expression of appetite regulators in three Characiformes with different feeding habits (Gymnocorymbus ternetzi, Metynnis argenteus and Exodon paradoxus). Comp. Biochem. Physiol. 227, 105–115. doi: 10.1016/j.cbpa.2018.10.002
Comesaña, S., Velasco, C., Ceinos, R. M., López-Patiño, M. A., Míguez, J. M., Morais, S., et al. (2018). Evidence for the presence in rainbow trout brain of amino acid-sensing systems involved in the control of food intake. Am. J. Physiol. 314, R201–R215. doi: 10.1152/ajpregu.00283.2017
Conde-Sieira, M., Chivite, M., Míguez, J. M., and Soengas, J. L. (2018). Stress effects on the mechanisms regulating appetite in teleost fish. Front. Endocrinol. 9:631. doi: 10.3389/fendo.2018.00631
Cortés, R., Teles, M., Oliveira, M., Fierro-Castro, C., Tort, L., and Cerdá-Reverter, J. M. (2018). Effects of acute handling stress on short-term central expression of orexigenic/anorexigenic genes in zebrafish. Fish Physiol. Biochem. 44, 257–272. doi: 10.1007/s10695-017-0431-7
Douglass, J., McKinzie, A. A., and Couceyro, P. (1995). PCR differential display identifies a rat brain mRNA that is transcriptionally regulated by cocaine and amphetamine. J. Neurosci. 15, 2471–2481. doi: 10.1523/jneurosci.15-03-02471.1995
Fukada, H., Murashita, K., Senzui, A., and Masumoto, T. (2021). Multiple cocaine and amphetamine-regulated transcript genes in yellowtail Seriola quinqueradiata: cloning, tissue distribution in the brain, and response to fasting and fish meal soluble fraction. Fish. Sci. 87, 55–64. doi: 10.1007/s12562-020-01475-5
Hall, B. G. (2013). Building phylogenetic trees from molecular data with MEGA. Mol. Biol. Evol. 30, 1229–1235. doi: 10.1093/molbev/mst012
Jones, D. T., Taylor, W. R., and Thornton, J. M. (1992). The rapid generation of mutation data matrices from protein sequences. Comput. Appl. Biosci. 8, 275–282. doi: 10.1093/bioinformatics/8.3.275
Kalananthan, T., Murashita, K., Rønnestad, I., Ishigaki, M., Takahashi, K., Silva, M. S., et al. (2020b). Hypothalamic agrp and pomc mRNA responses to gastrointestinal fullness and fasting in Atlantic salmon (Salmo salar, L). Front. Physiol. 11:61. doi: 10.3389/fphys.2020.00061
Kalananthan, T., Lai, F., Gomes, A. S., Murashita, K., Handeland, S., and Rønnestad, I. (2020a). The melanocortin system in Atlantic salmon (Salmo salar L.) and its role in appetite control. Front. Neuroanat. 14:48. doi: 10.3389/fnana.2020.00048
Kehoe, A. S., and Volkoff, H. (2007). Cloning and characterization of neuropeptide Y (NPY) and cocaine and amphetamine regulated transcript (CART) in Atlantic cod (Gadus morhua). Comp. Biochem. Physiol. 146, 451–461. doi: 10.1016/j.cbpa.2006.12.026
Kehoe, A. S., and Volkoff, H. (2008). The effects of temperature on feeding and expression of two appetite-related factors, neuropeptide Y and cocaine and amphetamine-regulated transcript, in Atlantic cod, Gadus morhua. J. World Aquac. Soc. 39, 790–796. doi: 10.1111/j.1749-7345.2008.00215.x
Kobayashi, Y., Peterson, B. C., and Waldbieser, G. C. (2008). Association of cocaine- and amphetamine-regulated transcript (CART) messenger RNA level, food intake, and growth in channel catfish. Comp. Biochem. Physiol. 151, 219–225. doi: 10.1016/j.cbpa.2008.06.029
Koylu, E. O., Balkan, B., Kuhar, M. J., and Pogun, S. (2006). Cocaine and amphetamine regulated transcript (CART) and the stress response. Peptides 27, 1956–1969. doi: 10.1016/j.peptides.2006.03.032
Kristensen, P., Judge, M. E., Thim, L., Ribel, U., Christjansen, K. N., Wulff, B. S., et al. (1998). Hypothalamic CART is a new anorectic peptide regulated by leptin. Nature 393, 72–76. doi: 10.1038/29993
Kuhar, M. J., and Yoho, L. L. (1999). CART peptide analysis by western blotting. Synapse 33, 163–171. doi: 10.1002/(SICI)1098-2396(19990901)33:3
Kumar, S., Stecher, G., Li, M., Knyaz, C., and Tamura, K. (2018). MEGA X: molecular evolutionary genetics analysis across computing platforms. Mol. Biol. Evol. 35, 1547–1549. doi: 10.1093/molbev/msy096
Larkin, M. A., Blackshields, G., Brown, N. P., Chenna, R., McGettigan, P. A., McWilliam, H., et al. (2007). Clustal W and clustal X version 2.0. Bioinformatics 23, 2947–2948. doi: 10.1093/bioinformatics/btm404
Le, H. T. M. D., Angotzi, A. R., Ebbesson, L. O. E., Karlsen, Ø, and Rønnestad, I. (2016). The ontogeny and brain distribution dynamics of the appetite regulators NPY, CART and pOX in larval Atlantic cod (Gadus morhua L.). PLoS One 11:e0153743. doi: 10.1371/journal.pone.0153743
Ludvigsen, S., Thim, L., Blom, A. M., and Wulff, B. S. (2001). Solution structure of the satiety factor, CART, reveals new functionality of a well-known fold. Biochemistry 40, 9082–9088. doi: 10.1021/bi010433u
MacDonald, E., and Volkoff, H. (2009a). Cloning, distribution and effects of season and nutritional status on the expression of neuropeptide Y (NPY), cocaine and amphetamine regulated transcript (CART) and cholecystokinin (CCK) in winter flounder (Pseudopleuronectes americanus). Horm. Behav. 56, 58–65. doi: 10.1016/j.yhbeh.2009.03.002
MacDonald, E., and Volkoff, H. (2009b). Neuropeptide Y (NPY), cocaine- and amphetamine-regulated transcript (CART) and cholecystokinin (CCK) in winter skate (Raja ocellata): cDNA cloning, tissue distribution and mRNA expression responses to fasting. Gen. Comp. Endocrinol. 161, 252–261. doi: 10.1016/j.ygcen.2009.01.021
Maixnerová, J., Hlaváček, J., Blokešová, D., Kowalczyk, W., Elbert, T., Šanda, M., et al. (2007). Structure-activity relationship of CART (cocaine- and amphetamine-regulated transcript) peptide fragments. Peptides 28, 1945–1953. doi: 10.1016/j.peptides.2007.07.022
Mo, C., Lv, C., Huang, L., Li, Z., Zhang, J., Li, J., et al. (2019). Regulation of pituitary cocaine- and amphetamine-regulated transcript expression and secretion by hypothalamic gonadotropin-releasing hormone in chickens. Front.Physiol. 10:882. doi: 10.3389/fphys.2019.00882
Murashita, K., and Kurokawa, T. (2011). Multiple cocaine- and amphetamine-regulated transcript (CART) genes in medaka, Oryzias latipes: cloning, tissue distribution and effect of starvation. Gen. Comp. Endocrinol. 170, 494–500. doi: 10.1016/j.ygcen.2010.11.005
Murashita, K., Kurokawa, T., Ebbesson, L. O. E., Stefansson, S. O., and Rønnestad, I. (2009). Characterization, tissue distribution, and regulation of agouti-related protein (AgRP), cocaine- and amphetamine-regulated transcript (CART) and neuropeptide Y (NPY) in Atlantic salmon (Salmo salar). Gen. Comp. Endocrinol. 162, 160–171. doi: 10.1016/j.ygcen.2009.03.015
Nicholas, K. B., Nicholas, H. B. J., and Deerfield, D. W. (1997). GeneDoc: analysis and visualization of genetic variation. Embnet. News 4:14.
Nishio, S. I., Gibert, Y., Berekelya, L., Bernard, L., Brunet, F., Guillot, E., et al. (2012). Fasting induces CART down-regulation in the zebrafish nervous system in a cannabinoid receptor 1-dependent manner. Mol. Endocrinol. 26, 1316–1326. doi: 10.1210/me.2011-1180
Olsvik, P. A., Lie, K. K., Jordal, A. E. O., Nilsen, T. O., and Hordvik, I. (2005). Evaluation of potential reference genes in real-time RT-PCR studies of Atlantic salmon. BMC Mol. Biol. 6:21. doi: 10.1186/1471-2199-6-21
Penney, C. C., and Volkoff, H. (2014). Peripheral injections of cholecystokinin, apelin, ghrelin and orexin in cavefish (Astyanax fasciatus mexicanus): effects on feeding and on the brain expression levels of tyrosine hydroxylase, mechanistic target of rapamycin and appetite-related hormones. Gen. Comp. Endocrinol. 196, 34–40. doi: 10.1016/j.ygcen.2013.11.015
Porter, D. T., Roberts, D. A., and Maruska, K. P. (2017). Distribution and female reproductive state differences in orexigenic and anorexigenic neurons in the brain of the mouth brooding African cichlid fish, Astatotilapia burtoni. J. Comp. Neurol. 525, 3126–3157. doi: 10.1002/cne.24268
Rogge, G., Jones, D., Hubert, G. W., Lin, Y., and Kuhar, M. J. (2008). CART peptides: regulators of body weight, reward and other functions. Nat. Rev. Neurosci. 9, 747–758. doi: 10.1038/nrn2493
Rønnestad, I., Gomes, A. S., Murashita, K., Angotzi, R., Jönsson, E., and Volkoff, H. (2017). Appetite-controlling endocrine systems in teleosts. Front. Endocrinol. 8:73. doi: 10.3389/fendo.2017.00073
Santalova, I. M., Gordon, R. Y., Mikheeva, I. B., Khutsian, S. S., and Maevsky, E. I. (2018). Pecularities of the structure of glycogen as an indicator of the functional state of mauthner neurons in fish Perccottus glehni during wintering. Neurosci. Lett. 664, 133–138. doi: 10.1016/j.neulet.2017.11.024
Schwartz, M. W., Woods, S. C., Porte, D. Jr., Seeley, R. J., and Baskin, D. G. (2000). Central nervous system control of food intake. Nature 404, 661–671. doi: 10.1038/35007534
Sepahi, A., Kraus, A., Casadei, E., Johnston, C. A., Galindo-Villegas, J., Kelly, C., et al. (2019). Olfactory sensory neurons mediate ultrarapid antiviral immune responses in a TrkA-dependent manner. Proc. Natl. Acad. Sci. U.S.A. 116, 12428–12436. doi: 10.1073/pnas.1900083116
Soengas, J. L., Cerdá-Reverter, J. M., and Delgado, M. J. (2018). Central regulation of food intake in fish: an evolutionary perspective. J. Mol. Endocrinol. 60, R171–R199. doi: 10.1530/JME-17-0320
Spiess, J., Villarreal, J., and Vale, W. (1981). Isolation and sequence analysis of a somatostatin-like polypeptide from ovine hypothalamus. Biochemistry 20, 1982–1990. doi: 10.1021/bi00510a038
Strain, P. M., and Hargrave, B. T. (2005). “Salmon aquaculture, Nnutrient fluxes and ecosystem processes in southwestern New Brunswick,” in Environmental Effects of Marine Finfish Aquaculture, ed. B. T. Hargrave (Heidelberg: Springer-Verlag), 29–57. doi: 10.1007/b136003
Volff, J. N. (2005). Genome evolution and biodiversity in teleost fish. Heredity 94, 280–294. doi: 10.1038/sj.hdy.6800635
Volkoff, H. (2016). The neuroendocrine regulation of food intake in fish: a review of current knowledge. Front. Neurosci. 10:540. doi: 10.3389/fnins.2016.00540
Volkoff, H., and Peter, R. E. (2001). Characterization of two forms of cocaine- and amphetamine-regulated transcript (CART) peptide precursors in goldfish: molecular cloning and distribution, modulation of expression by nutritional status, and interactions with leptin. Endocrinology 142, 5076–5088. doi: 10.1210/endo.142.12.8519
Volkoff, H., Canosa, L. F., Unniappan, S., Cerdá-Reverter, J. M., Bernier, N. J., Kelly, S. P., et al. (2005). Neuropeptides and the control of food intake in fish. Gen. Comp. Endocrinol. 142, 3–19. doi: 10.1016/j.ygcen.2004.11.001
Waagbø, R., Jørgensen, S. M., Timmerhaus, G., Breck, O., and Olsvik, P. A. (2017). Short-term starvation at low temperature prior to harvest does not impact the health and acute stress response of adult Atlantic salmon. PeerJ 5:e3273. doi: 10.7717/peerj.3273
Yang, S. C., Shieh, K. R., and Li, H. Y. (2005). Cocaine- and amphetamine-regulated transcript in the nucleus accumbens participates in the regulation of feeding behavior in rats. Neuroscience 133, 841–851. doi: 10.1016/j.neuroscience.2005.03.023
Ye, C., Xu, S., Hu, Q., Hu, M., Zhou, L., Qin, X., et al. (2020). Structure and function analysis of various brain subregions and pituitary in grass carp (Ctenopharyngodon idellus). Comp. Biochem. Physiol. 33:100653. doi: 10.1016/j.cbd.2019.100653
Yuan, D., Wei, R., Wang, T., Wu, Y., Lin, F., Chen, H., et al. (2015). Appetite regulation in Schizothorax prenanti by three CART genes. Gen. Comp. Endocrinol. 224, 194–204. doi: 10.1016/j.ygcen.2015.08.015
Keywords: appetite, Atlantic salmon, brain, CART, fasting, neuropeptides
Citation: Kalananthan T, Gomes AS, Lai F, Tolås I, Jordal A-EO, Norland S, Murashita K and Rønnestad I (2021) Brain Distribution of 10 cart Transcripts and Their Response to 4 Days of Fasting in Atlantic Salmon (Salmo salar L.). Front. Mar. Sci. 8:763766. doi: 10.3389/fmars.2021.763766
Received: 24 August 2021; Accepted: 04 October 2021;
Published: 25 October 2021.
Edited by:
Carlo C. Lazado, Norwegian Institute of Food, Fisheries and Aquaculture Research (Nofima), NorwayReviewed by:
Nikko Alvin Rizardo Cabillon, Hebrew University of Jerusalem, IsraelGonzalo Martinez-Rodriguez, Institute of Marine Sciences of Andalusia (ICMAN), Spain
Copyright © 2021 Kalananthan, Gomes, Lai, Tolås, Jordal, Norland, Murashita and Rønnestad. This is an open-access article distributed under the terms of the Creative Commons Attribution License (CC BY). The use, distribution or reproduction in other forums is permitted, provided the original author(s) and the copyright owner(s) are credited and that the original publication in this journal is cited, in accordance with accepted academic practice. No use, distribution or reproduction is permitted which does not comply with these terms.
*Correspondence: Tharmini Kalananthan, VGhhcm1pbmkuS2FsYW5hbnRoYW5AdWliLm5v; Ivar Rønnestad, SXZhci5Sb25uZXN0YWRAdWliLm5v