 Helge-Ansgar Giebel1
 Carol Arnosti2
 Thomas H. Badewien1
 Insa Bakenhus1
 John Paul Balmonte2†
 Sara Billerbeck1
 Leon Dlugosch1
 Rohan Henkel1Birgit Kuerzel1
 Jens Meyerjürgens1
 Felix Milke1Daniela Voss1
 Gerrit Wienhausen1
 Matthias Wietz1†Holger Winkler1Mathias Wolterink1
 Meinhard Simon1,3*
- 1Institute for Chemistry and Biology of the Marine Environment, University of Oldenburg, Oldenburg, Germany
- 2Department of Marine Sciences, University of North Carolina at Chapel Hill, Chapel Hill, NC, United States
- 3Helmholtz Institute for Functional Marine Biodiversity at the University of Oldenburg (HIFMB), Oldenburg, Germany
The Pacific Ocean constitutes about half of the global oceans and thus microbial processes in this ocean have a large impact on global elemental cycles. Despite several intensely studied regions large areas are still greatly understudied regarding microbial activities, organic matter cycling and biogeography. Refined information about these features is most important to better understand the significance of this ocean for global biogeochemical and elemental cycles. Therefore we investigated a suite of microbial and geochemical variables along a transect from the subantarctic to the subarctic Pacific in the upper 200 m of the water column. The aim was to quantify rates of organic matter processing, identify potential controlling factors and prokaryotic key players. The assessed variables included abundance of heterotrophic prokaryotes and cyanobacteria, heterotrophic prokaryotic production (HPP), turnover rate constants of amino acids, glucose, and acetate, leucine aminopeptidase and β-glucosidase activities, and the composition of the bacterial community by fluorescence in situ hybridization (FISH). The additional quantification of nitrate, dissolved amino acids and carbohydrates, chlorophyll a, particulate organic carbon and nitrogen (POC, PON) provided a rich environmental context. The oligotrophic gyres exhibited the lowest prokaryotic abundances, rates of HPP and substrate turnover. Low nucleic acid prokaryotes dominated in these gyres, whereas in temperate and subpolar regions further north and south, high nucleic acid prokaryotes dominated. Turnover rate constants of glucose and acetate, as well as leucine aminopeptidase activity, increased from (sub)tropical toward the subpolar regions. In contrast, HPP and bulk growth rates were highest near the equatorial upwelling and lowest in the central gyres and subpolar regions. The SAR11 clade, the Roseobacter group and Flavobacteria constituted the majority of the prokaryotic communities. Vertical profiles of the biogeochemical and microbial variables markedly differed among the different regions and showed close covariations of the microbial variables and chlorophyll a, POC and PON. The results show that hydrographic, microbial, and biogeochemical properties exhibited distinct patterns reflecting the biogeographic provinces along the transect. The microbial variables assessed contribute to a better and refined understanding of the scales of microbial organic matter processing in large areas of the epipelagic Pacific beyond its well-studied regions.
Introduction
Heterotrophic prokaryotes are major players in decomposing and cycling of organic matter fixed by phytoplankton primary production in the global oceans (Azam and Malfatti, 2007). Corresponding to the greatly varying rates of primary production in distinct oceanic regions, heterotrophic prokaryotic production (HPP) and bulk growth rates exhibit pronounced differences from polar to tropical realms. Temperature limits prokaryotic growth strongly below 5°C (Kirchman et al., 2009), but above 5°C other factors, such as substrate supply, grazing, or phage-induced mortality, are more important in controlling growth (Azam and Malfatti, 2007). Many studies assessing HPP and microbial growth dynamics have been carried out within different oceanic regions (Ducklow, 1999; Zubkov et al., 2000; Church et al., 2006; Simon and Rosenstock, 2007; Kirchman et al., 2009). However, there are surprisingly few studies along transects in ocean basins that allow a detailed examination of the manner in which HPP, bacterial growth, and their potentially controlling variables in the epipelagic zone differ in biogeographic provinces (Longhurst, 2007), and across oceanic fronts. These few studies include two transects between the North and South Atlantic and the Southern Ocean (Zubkov et al., 2000; Hoppe et al., 2002). In the Pacific Ocean, microbial abundance and HPP have been investigated between the subarctic region and the Antarctic province (Baldwin et al., 2005; Yokokawa et al., 2013), although Yokokawa et al. (2013) focused mostly on the bathypelagic zone.
Understanding the role and significance of oceanic prokaryotic communities for organic matter cycling requires an assessment of the relationships between their growth properties and composition. Recently, large-scale investigations of the composition and diversity of prokaryotic microbial communities have been carried out within and across a number of oceanic basins (Schattenhofer et al., 2011; Ghiglione et al., 2012; Tada et al., 2013; Sunagawa et al., 2015; Milici et al., 2016; Raes et al., 2018, 2021); most studies correlated community composition to hydrographic, nutrient, and general trophic features of the study area. Characterizing the roles of these spatially distinct microbial communities in organic matter cycling, however, requires complementary measurements of microbial growth activities and the rates at which they process major substrate classes, such as dissolved amino acids and carbohydrates.
Measurements of microbial activities and biogeochemical properties pertinent to carbon cycling are sparse in the vast Pacific Ocean, which covers 50% of the world’s ocean surface. Differences in hydrographic, geochemical, and biological properties across the biogeographic provinces of the Pacific Ocean between the tropics and subpolar regions (Longhurst, 2007) suggest dynamic microbial contributions to carbon cycling. However, investigating microbial growth and substrate dynamics, nutrients and biogeochemical variables systematically across latitudes and biogeographic provinces in such a large ocean is a considerable challenge. This may be a reason why most studies have focused on one particular region, such as the subarctic Pacific, or the north or south Pacific subtropical gyres (e.g., Kirchman et al., 1992; Karl and Church, 2014, 2017; Reintjes et al., 2019b), but only a handful of studies have assessed these properties concurrently across large-scale latitudinal gradients. For example, Nagata et al. (2000) and Yokokawa et al. (2013) investigated numbers and biomass production of prokaryotes between the subarctic and Antarctic regions, but with an emphasis on the bathypelagic zone. Baldwin et al. (2005) assessed inorganic nutrient concentrations, chlorophyll a (Chl a), abundances of various auto-and heterotrophic microbial groups, and leucine incorporation, together with ribotype diversity patterns, in surface waters between the Bering Sea and Antarctic waters. Arnosti et al. (2011) measured the activities of polysaccharide-degrading enzymes at selected stations of this same transect. Raes et al. (2018, 2021) quantified inorganic nutrient concentrations, rates of primary production, and abundances of various nano- and picoplankton groups between the equator and Antarctic waters, together with a detailed analysis of the composition and functional profiles of prokaryotic communities based on 16S rRNA gene amplicon sequencing and metagenomics. Each of these studies focused on sets of a rather limited number of specific variables and distinct near-surface or deep layers which made it challenging to obtain a comprehensive overview on microbial growth and population dynamics along the Pacific latitudinal transect.
To expand our understanding of prokaryotic bulk growth and substrate dynamics and their relationship with biogeochemical properties beyond the well-studied regions of the Pacific Ocean, we investigated a 12,400 km transect between subantarctic waters at 52°S and the Bering Sea at 59°N, close to 180° longitude E/W. We addressed the following questions: (i) how is prokaryotic abundance, HPP and bulk growth related to phytoplankton and particulate organic matter, the major substrate sources? (ii) how is HPP related to the hydrolysis of major dissolved biopolymers and the turnover of monomeric substrate classes, dissolved free amino acids (DFAA), dissolved free monosaccharides and acetate? (iii) how do the patterns of these variables differ along the transect and vertically in the upper 200 m? (iv) how does the composition of the bacterial communities vary along the transect and reflect the latitudinal patterns of the microbial organic matter cycling and the biogeochemical features? (v) do the microbial and biogeochemical properties assessed reflect the different biogeographic provinces?
Materials and Methods
Study Area, Sampling and Hydrography
Samples were collected aboard RV Sonne in the Pacific Ocean during two cruises at 25 stations along a transect closely following 180° longitude E/W between 52.1°S southeast of New Zealand and 58.9°N in the Bering Sea (Figure 1 and Supplementary Table 1). The first cruise (SO248), which encompassed stations 1–19, started in Auckland, New Zealand, on May 1st and ended in Dutch Harbor, Alaska, United States, on June 3rd, 2016. The second cruise (SO254; Auckland—Auckland) took place during the austral summer from January 26th to February 27th, 2017, and covered the southernmost stations 20–25 of the transect (Figure 1A). Samples were collected at all stations at the following depths: 20, 40, 60, 100, variable depth of the deep chlorophyll maximum (DCM), 200, 300, 500, and 1,000 m. At 14 stations samples were additionally collected down to the seafloor. Samples of the depth range 20–200 m were assessed for the variables described below. Data on selected variables from 300 and 500 m (temperature, salinity, nitrate, prokaryotic cell numbers, HPP) are presented as well, but are available together with all data at Pangaea (see below). Sampling was carried out using 20 L-Niskin bottles mounted on a Sea-Bird Electronics 32 Carousel Water Sampler containing 24 × 20 L-Niskin bottles (Ocean Test Equipment Inc.). The carousel included the CTD system SBE 911 plus a probe with double-sensors for temperature (SBE 3), conductivity (SBE 4), pressure (Digiquartz), Chl a-fluorescence combined with turbidity (FluoroWetlab ECO_AFL FL, WET Labs Inc.), dissolved oxygen (Optode 4831F, Aanderaa) and an altimeter (Teledyne Benthos). After retrieval, subsamples were immediately withdrawn from the bottles and further processed for various measurements (see below).
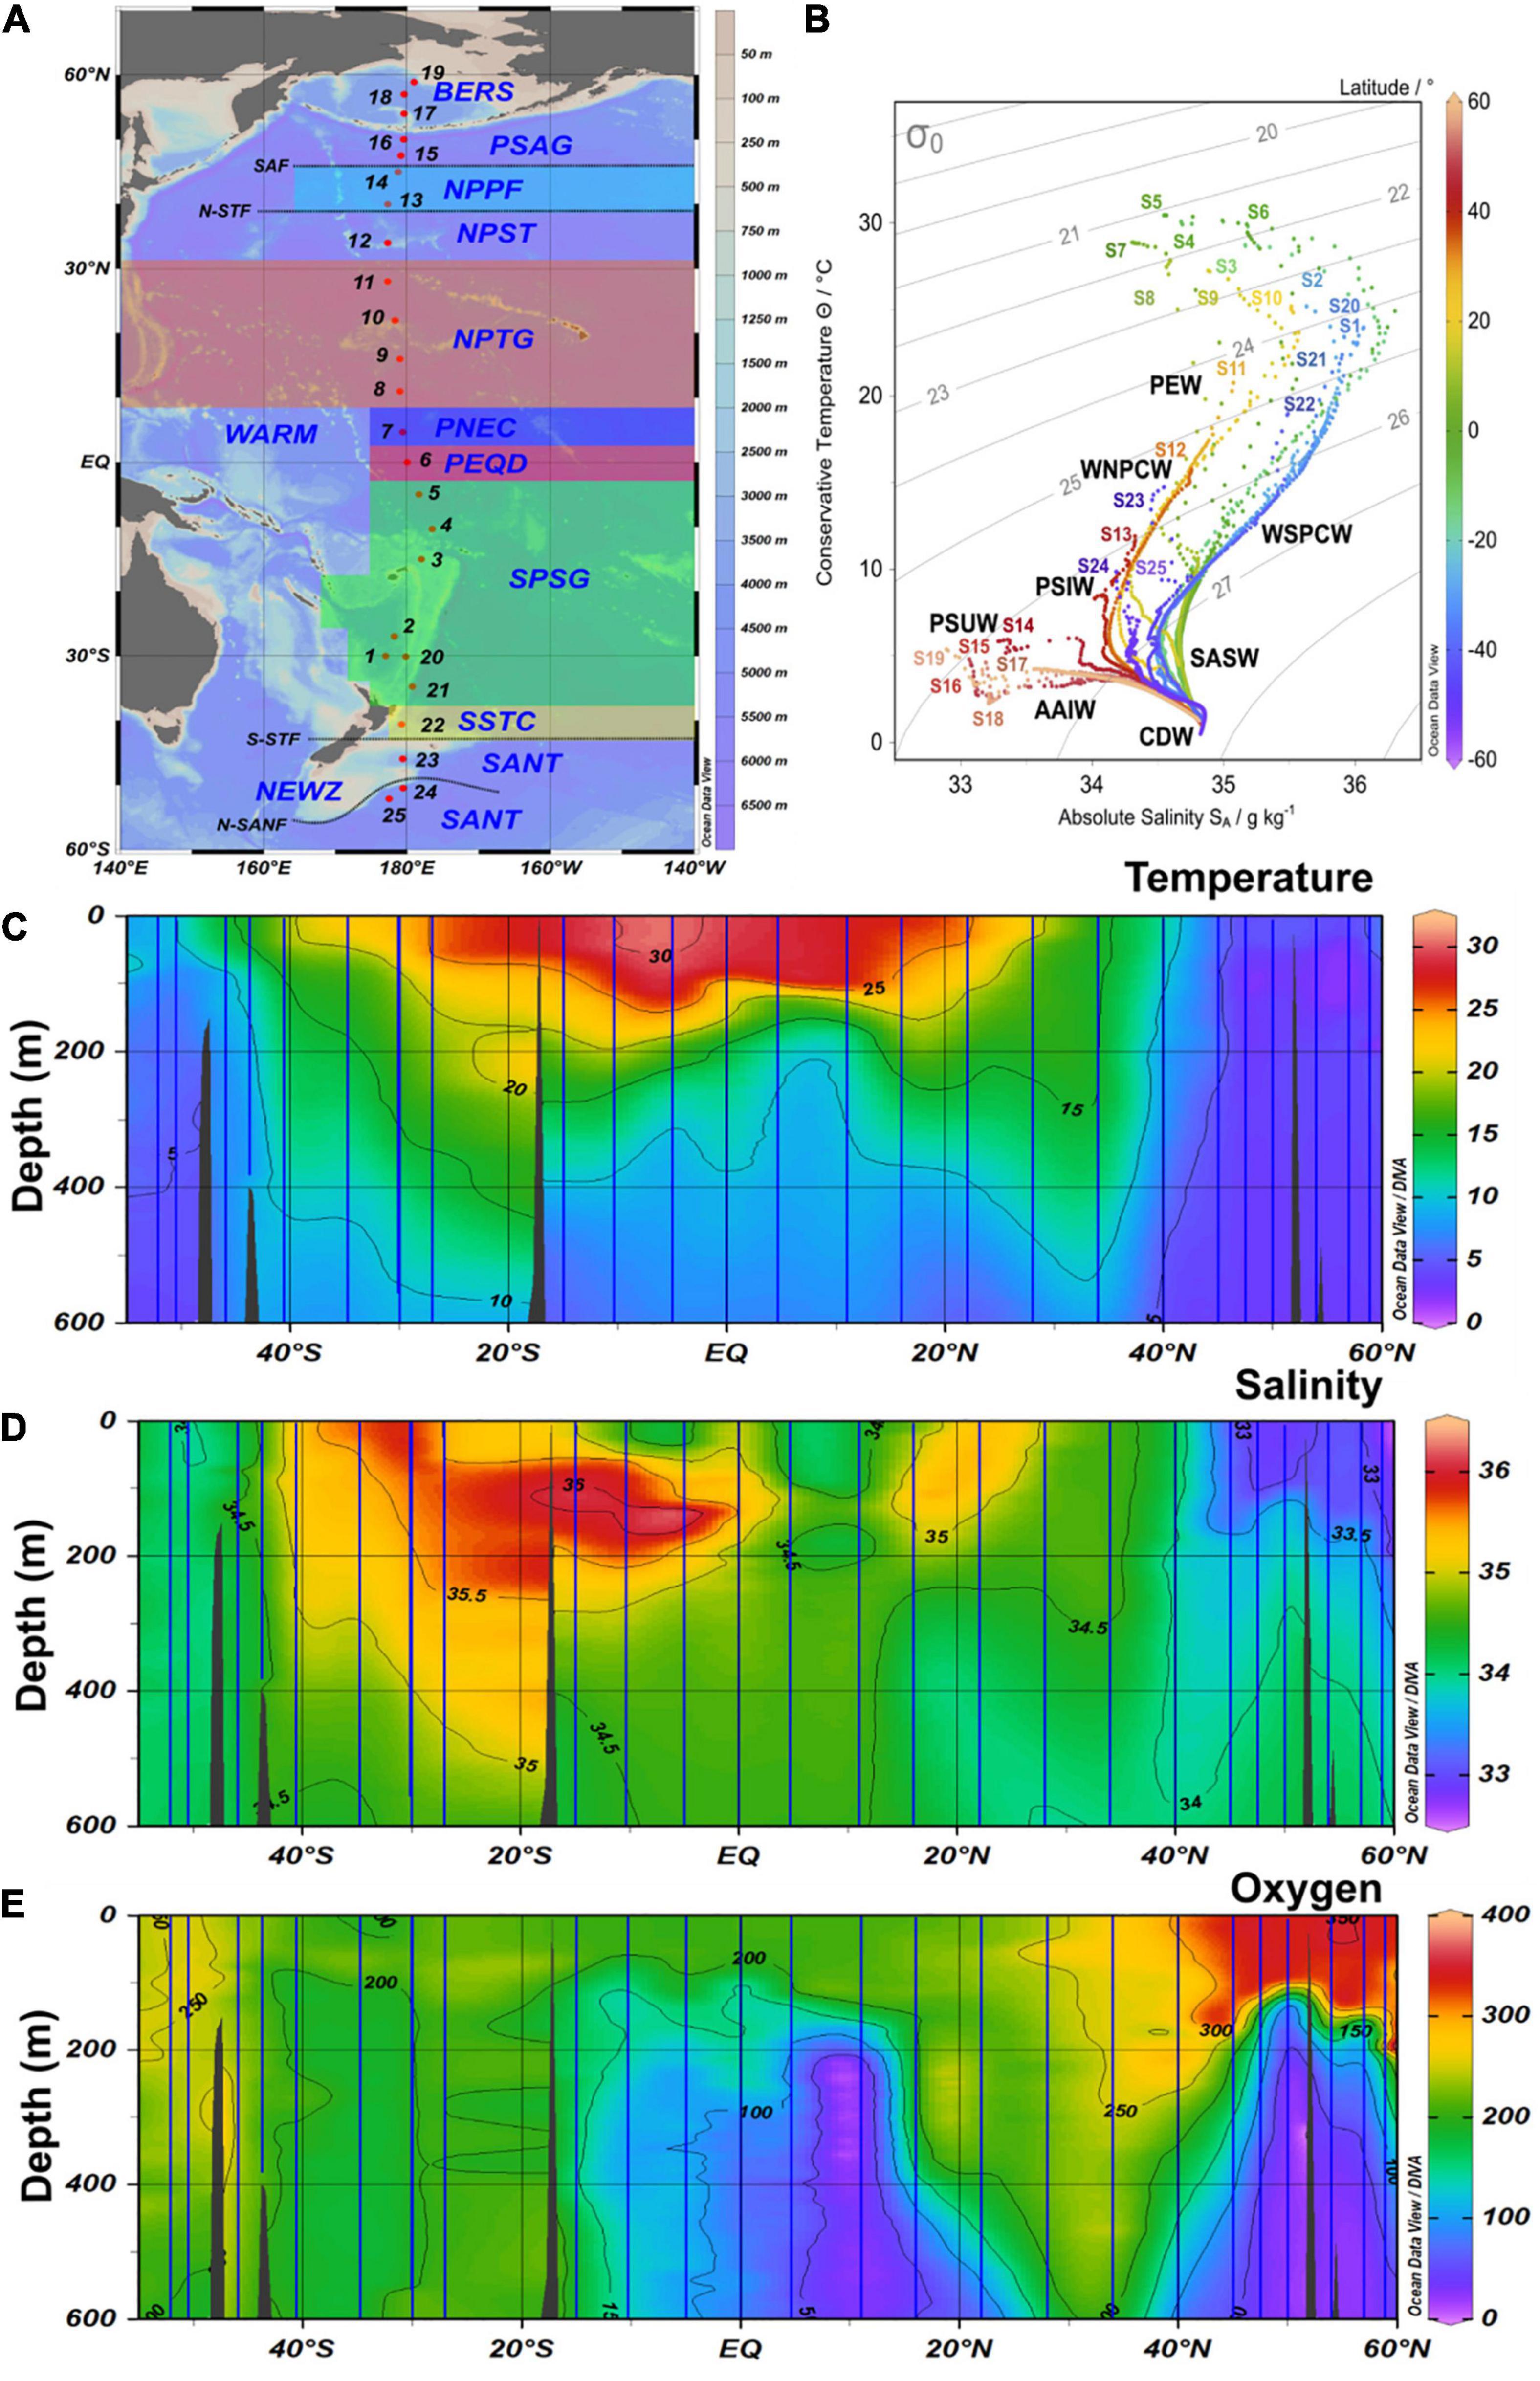
Figure 1. (A) Map with biogeographic provinces, track and station numbers of cruises SO248 (station 1–19) and SO254 (station 20–25) with RV Sonne along a transect across the Pacific Ocean. BERS, Bering Sea; PSAG, Pacific subarctic gyre; NPPF, north Pacific polar frontal region; NPST, north Pacific subtropical gyre; NPTG, north Pacific tropical gyre; PNEQ, Pacific north equatorial counter current; PEQD, Pacific equatorial divergence; SPSG, south Pacific subtropical gyre; SSTC, south subtropical convergence; SANT, subantarctic province. (B) T-S graph of all stations with data throughout the water column and identified water masses. SASW, Subantarctic surface water; AAIW, Antarctic intermediate water; PEW, Pacific equatorial water; CDW, Circumpolar deep water; PSUW, Pacific subarctic upper water; PSIW, Pacific intermediate water. (C–E) Contour graph of potential temperature, salinity and oxygen along the transect in the upper 600 m. Vertical blue lines indicate the continuous CTD-measurements at the stations.
Nitrate, Chlorophyll a, Particulate Organic Carbon
Samples for dissolved nitrate were fixed with mercury chloride according to Kattner (1999) and stored at 4°C until analysis in the home lab. For the spectrophotometric analysis of nitrate/nitrite (NOx) concentrations a microtiter plate reader (FLUOstar Optima, BMG Labtech) was used. Nitrate was calculated as the difference of NOx and nitrite– according to Schnetger and Lehners (2014).
For determination of Chl a concentrations, one to three L of seawater were filtered through GF/F filters (25 mm diameter; Whatman) that were immediately wrapped with aluminum foil and kept frozen at –80°C until further analysis in the home lab. In the lab, filters were mechanically crushed (Fast Prep-24 MP, Biomedicals) and extracted in ice-cold acetone (90%, –20°C) for 2 h in the dark. Concentrations of Chl a were determined fluorometrically (Turner Designs) and calculated according to Tremblay et al. (2002). Fluorescence was calibrated with a standard solution of Chl a (Sigma-Aldrich).
Subsamples of 1–3 L for the analysis of particulate organic carbon (POC) were filtered onto precombusted (3 h, 500°C) GF/F filters (Whatman, 25 mm diameter). Filters were rinsed with distilled water to remove salt and kept frozen at –20°C until analysis as described in Lunau et al. (2006).
Dissolved Amino Acids, and Carbohydrates
Samples for amino acid and carbohydrate analyses were gently filtered by hand on board through 0.2 μm low-protein binding filters (Tuffrin Acrodisc, Whatman) using a 25 ml-high density polyethylene syringe and kept frozen at –20°C until analysis in the home lab. Concentrations of dissolved free amino acids (DFAA) were analyzed by high performance liquid chromatography (HPLC, Agilent 1200) after ortho-phthaldialdehyde precolumn derivatization as described in Lunau et al. (2006) with slight modifications. Samples for total dissolved amino acids (TDAA) were hydrolyzed using 6 N HCl for 1 h at 155°C in glass ampoules, sealed under nitrogen gas and analyzed as DFAA. Dissolved combined amino acids (DCAA) were calculated as the difference of TDAA and DFAA. Concentrations of dissolved free carbohydrates and total hydrolyzable carbohydrates were measured by HPLC and pulsed amperometric detection (PAD) according to Mopper et al. (1992) with a Dionex Thermo Scientific ICS-5000+DC instrument. Prior to analysis, samples were desalted by ion-exchange chromatography. The retention efficiency for neutral monosaccharides of the ion exchange resins was determined in each analytical batch with a standard containing arabinose, fucose, galactose, glucose, mannose, rhamnose, and xylose (Hahnke et al., 2013). Polysaccharides were hydrolyzed in 0.1 M HCl for 20 h at 100°C in combusted and sealed glass ampules. Thereafter, samples were neutralized with 6 N NaOH, desalted by DionexOnGuard II Ag/H cartridges (Thermo Fisher Scientific), and eluted with 100 mM sodium acetate tri-hydrate in 100 mM NaOH. Concentrations were determined using a Carbo Pac PA1 (4 × 250 mm) and a Carbo Guard PA1 (4 × 50 mm) column (Thermo Scientific) with NaOH (18 mM) as eluent.
Microbial Cell Counts and Catalyzed Reporter Deposition-Fluorescence in situ Hybridization
Abundance of heterotrophic prokaryotic cells (<50 μm) was determined aboard ship immediately after sampling using flow cytometry (BD Accurri C6, BD Biosciences) by DNA-staining with SybrGreen I as described in Giebel et al. (2019). Autofluorescence of phototrophic eukaryotic cells was assessed after excitation by blue as well as red laser light (488 and 630 nm, respectively). Cell counts of autofluorescent pico-, nano- and microplankton were determined by re-gating data from a plot of fluorescence FL3 (red, > 670 nm) vs. FL2 (orange, 585 ± 20 nm) to a cytogram of FL4 (red, 675 ± 12.5 nm) vs. forward scattered light (FSC). Cyanobacterial abundance, including Synechococcus spp. and Prochlorococcus spp., was determined according to Marie et al. (1997). Glutaraldehyde-fixed (1% final concentration) and at –80°C preserved samples were analyzed in the home lab using a FACS ARIAIII (BD Biosciences). The threshold (600) was set on red fluorescence (PerCP-Cy5-5-H). Blanks were measured prior to every analysis of a batch of samples and subtracted from the sample readings. Volume calibration was done by using TruCount tube controls (BD Biosciences) resulting in 40.5 μl per 4 min analysis time. Noise correction of Prochlorococcus cell counts was adapted from Ribeiro et al. (2016) with the following modifications: To account for noise signals within the Prochlorococcus gate, an error profile was generated from cell counts measured in blanks. For each set of measurements, a random set of blank signals was generated and subtracted before interpolation of the Prochlorococcus population. Autofluorescence histograms were not smoothed before interpolation.
The abundance of specific bacterial groups at 20 m and the DCM depth was assessed by Catalyzed Reporter Deposition (CARD)-FISH as described in Bakenhus et al. (2017). Briefly, seawater subsamples, fixed with formaldehyde (final concentration 1% v/v) for 1 h at room temperature and filtered onto 0.2 μm polycarbonate membrane filters (47 mm diameter, Sterlitech), were kept frozen at –20°C until further analysis in the home lab. We applied horseradish peroxidase-labeled oligonucleotide probes (Biomers) targeting Gammaproteobacteria (GAM42a; Manz et al., 1992), Bacteroidetes (CF319a; Manz et al., 1996), Polaribacter (POL740; Malmstrom et al., 2007), the Roseobacter group (ROS536; Brinkmeyer et al., 2000), the RCA cluster (RCA996; Bakenhus et al., 2017) and the SAR11 clade (SAR11-441R; Rappé et al., 2002). Polaribacter and the RCA cluster were assessed because both sublineages represent major groups of Bacteroidetes and the Roseobacter group, respectively. Tests with a non-EUB probe as negative control yielded 0% of total DAPI cell counts with most samples and as an overall mean 0.03%. Hybridized and DAPI-stained cells were visualized semi-automatically using a Zeiss AxioImager.Z2m epifluorescence microscope including the software package AxioVision 4.8.2.0 and enumerated using ACMEtool3.1
Heterotrophic Prokaryotic Production, Substrate Turnover Rates, and Hydrolytic Enzyme Activities
Rates of HPP were determined by incorporation of 14C-leucine as described in Simon et al. (2004). Triplicate subsamples of 10 or 20 ml and a formalin-killed control were incubated with 14C-leucine (12.1 GBq mmol–1, 328 mCi/mmol, Hartmann Analytic) at a final concentration of 10 nM in the dark at in situ temperature for 4–8 h and further processed as described in Simon et al. (2004). Biomass production was calculated using a conversion factor of 3.05 kg C (mol leucine)–1 according to Simon and Azam (1989). At stations 22–24, HPP was also assessed on polycarbonate filters with pore sizes of 3.0 and 8.0 μm to calculate rates in the size-fractions 0.2–3.0, 3.0–8.0 and > 8.0 μm. Growth rates (μ) of the bulk prokaryotic communities were calculated as μ (d–1) = (ln(B1)-ln(B0))/(T1-T0), where B0 and B1 are bacterial biomass at T0 and T1. Biomass at T0 was calculated from cell numbers, assuming 20 fg C cell–1 (Simon and Azam, 1989) and at T1 as B0 plus HPP rates.
To assess cycling of the major substrate classes consumed by heterotrophic prokaryotes, turnover rate constants of DFAA, glucose, and acetate were measured. Whereas turnover of DFAA and glucose has been measured in a number of studies (e.g., Keil and Kirchman, 1999; Kirchman et al., 2001; Simon and Rosenstock, 2007; Zubkov et al., 2008), turnover of acetate in oxic pelagic marine systems has rarely been assessed (Ho et al., 2002; Bunse et al., 2019). Acetate is the final breakdown product of lipid and fatty acid metabolism. Lipids are important storage products of dinoflagellates, diatoms, and crustacean zooplankton (Shin et al., 2000; Wilson et al., 2010; Grosse et al., 2017). Therefore, it is relevant to study the turnover of acetate to trace this class of biopolymers as a substrate for heterotrophic prokaryotes. Turnover rate constants of DFAA, glucose, and acetate were determined by measuring the incorporation of a mixture of 16 3H-DFAA (mean specific activity 2.22 TBq mmol–1, Hartmann Analytic), 3H-glucose (2.22 TBq mmol–1, Hartmann Analytic) and 3H-acetate (0.925 TBq mmol–1, Hartmann Analytic), respectively, according to Simon and Rosenstock (2007). Briefly, 3H-substrates were added to triplicate 10 ml subsamples as well as a Formalin-killed control at a final concentration of 1.0 nmol L–1 of DFAA, glucose, and acetate, respectively. Incubations were further processed as for HPP. Hence, the data provide turnover rate constants of the fractions of these substrate pools, which are incorporated into the prokaryotic biomass. These values are presumably slightly smaller than those of the entire pool taken up considering also the pool in the cells’ cytosol. Further, they do not consider the fraction which is respired. Turnover rate constants were calculated as the ratio of the radioactivity incorporated over the radioactivity added.
Hydrolytic activities of leucine aminopeptidase (Leu-AMP) and β-glucosidases (β-GlcAse) in bulk waters were measured as described in Balmonte et al. (2021). Briefly, either leucine-methylcoumarin or β-glucopyranoside-methylumbelliferyl was added to triplicate samples and killed controls to a final concentration of 100 μM and a volume of 200 μl in 96 well black, flat-bottomed plates. Incubations were stored in the dark at ambient seawater temperatures. Fluorescence was measured periodically for up to 72 h using a Tecan plate reader, and readings were converted to rates using a standard curve against known substrate concentrations. Only rates measured at 12 h are reported in this study. Detailed information and separate analyses on the enzymatic assays not included in this study are published elsewhere (Balmonte et al., 2021).
Data Visualization and Statistics
Ocean Data View (ODV) version 5.2.1 was used for generating the station map, T-S diagrams, surface and latitudinal section plots, applying the DIVA gridding tool for interpolation (Schlitzer, 2015). Other graphs were generated using Sigmaplot version 12. Linear regression statistics were calculated after Benjamini-Hochberg adjustment using the software package R (R Core Team, 2019). Package vegan (Oksanen et al., 2019) was used for transformation and standardization of variables, package stats for Principal Component Analysis (PCA) and Pearson correlation. For the PCA, variables were first standardized to zero mean and unit variance and afterward transformed into Euclidean distances. The explained variance of each principal component was calculated based on their eigenvalues. Absolute latitude and temperature were overlayed on the PCA biplots to visualize the effect of geographic distance and temperature on sample scores.
Data Storage and Availability
Data are available at Pangaea2 under the cruise identifier SO248 and SO254 or at https://doi.org/10.1594/PANGAEA.864673 (Badewien et al., 2016), https://doi.org/10.1594/PANGAEA.890453 (Zielinski et al., 2018), and https://doi.pangaea.de/10.1594/PANGAEA.918500 (Giebel et al., 2020). Leu-AMP and β-GlcAse data are available at the BCO-DMO database (Arnosti, 2020a,b,c,d).
Results
Hydrography, Biogeochemical Variables and Cyanobacteria
The stations covered all biogeographic provinces (Longhurst, 2007) of the central Pacific Ocean (Figure 1 and Supplementary Table 1). The subpolar provinces beyond 45°N and 50°S, respectively, exhibited temperatures of < 10°C and weak stratification. In contrast, the subtropical and tropical provinces between 40°S and 30°N were characterized by temperatures of 22–30°C in the upper 60 m and a pronounced stratification. Temperatures between 10 and 22°C were characteristic of the temperate regions.
Concentrations of nitrate along the transect showed consistently low values, often close to or below the detection limit, in the upper 60 m between 40°S and 35°N (Figure 2A and Supplementary Figure 1A). In the colder, less stratified regions beyond 40°N/S, nitrate concentrations in near-surface waters were higher and peaking in the Bering Sea (BERS) at 21–25 μM.
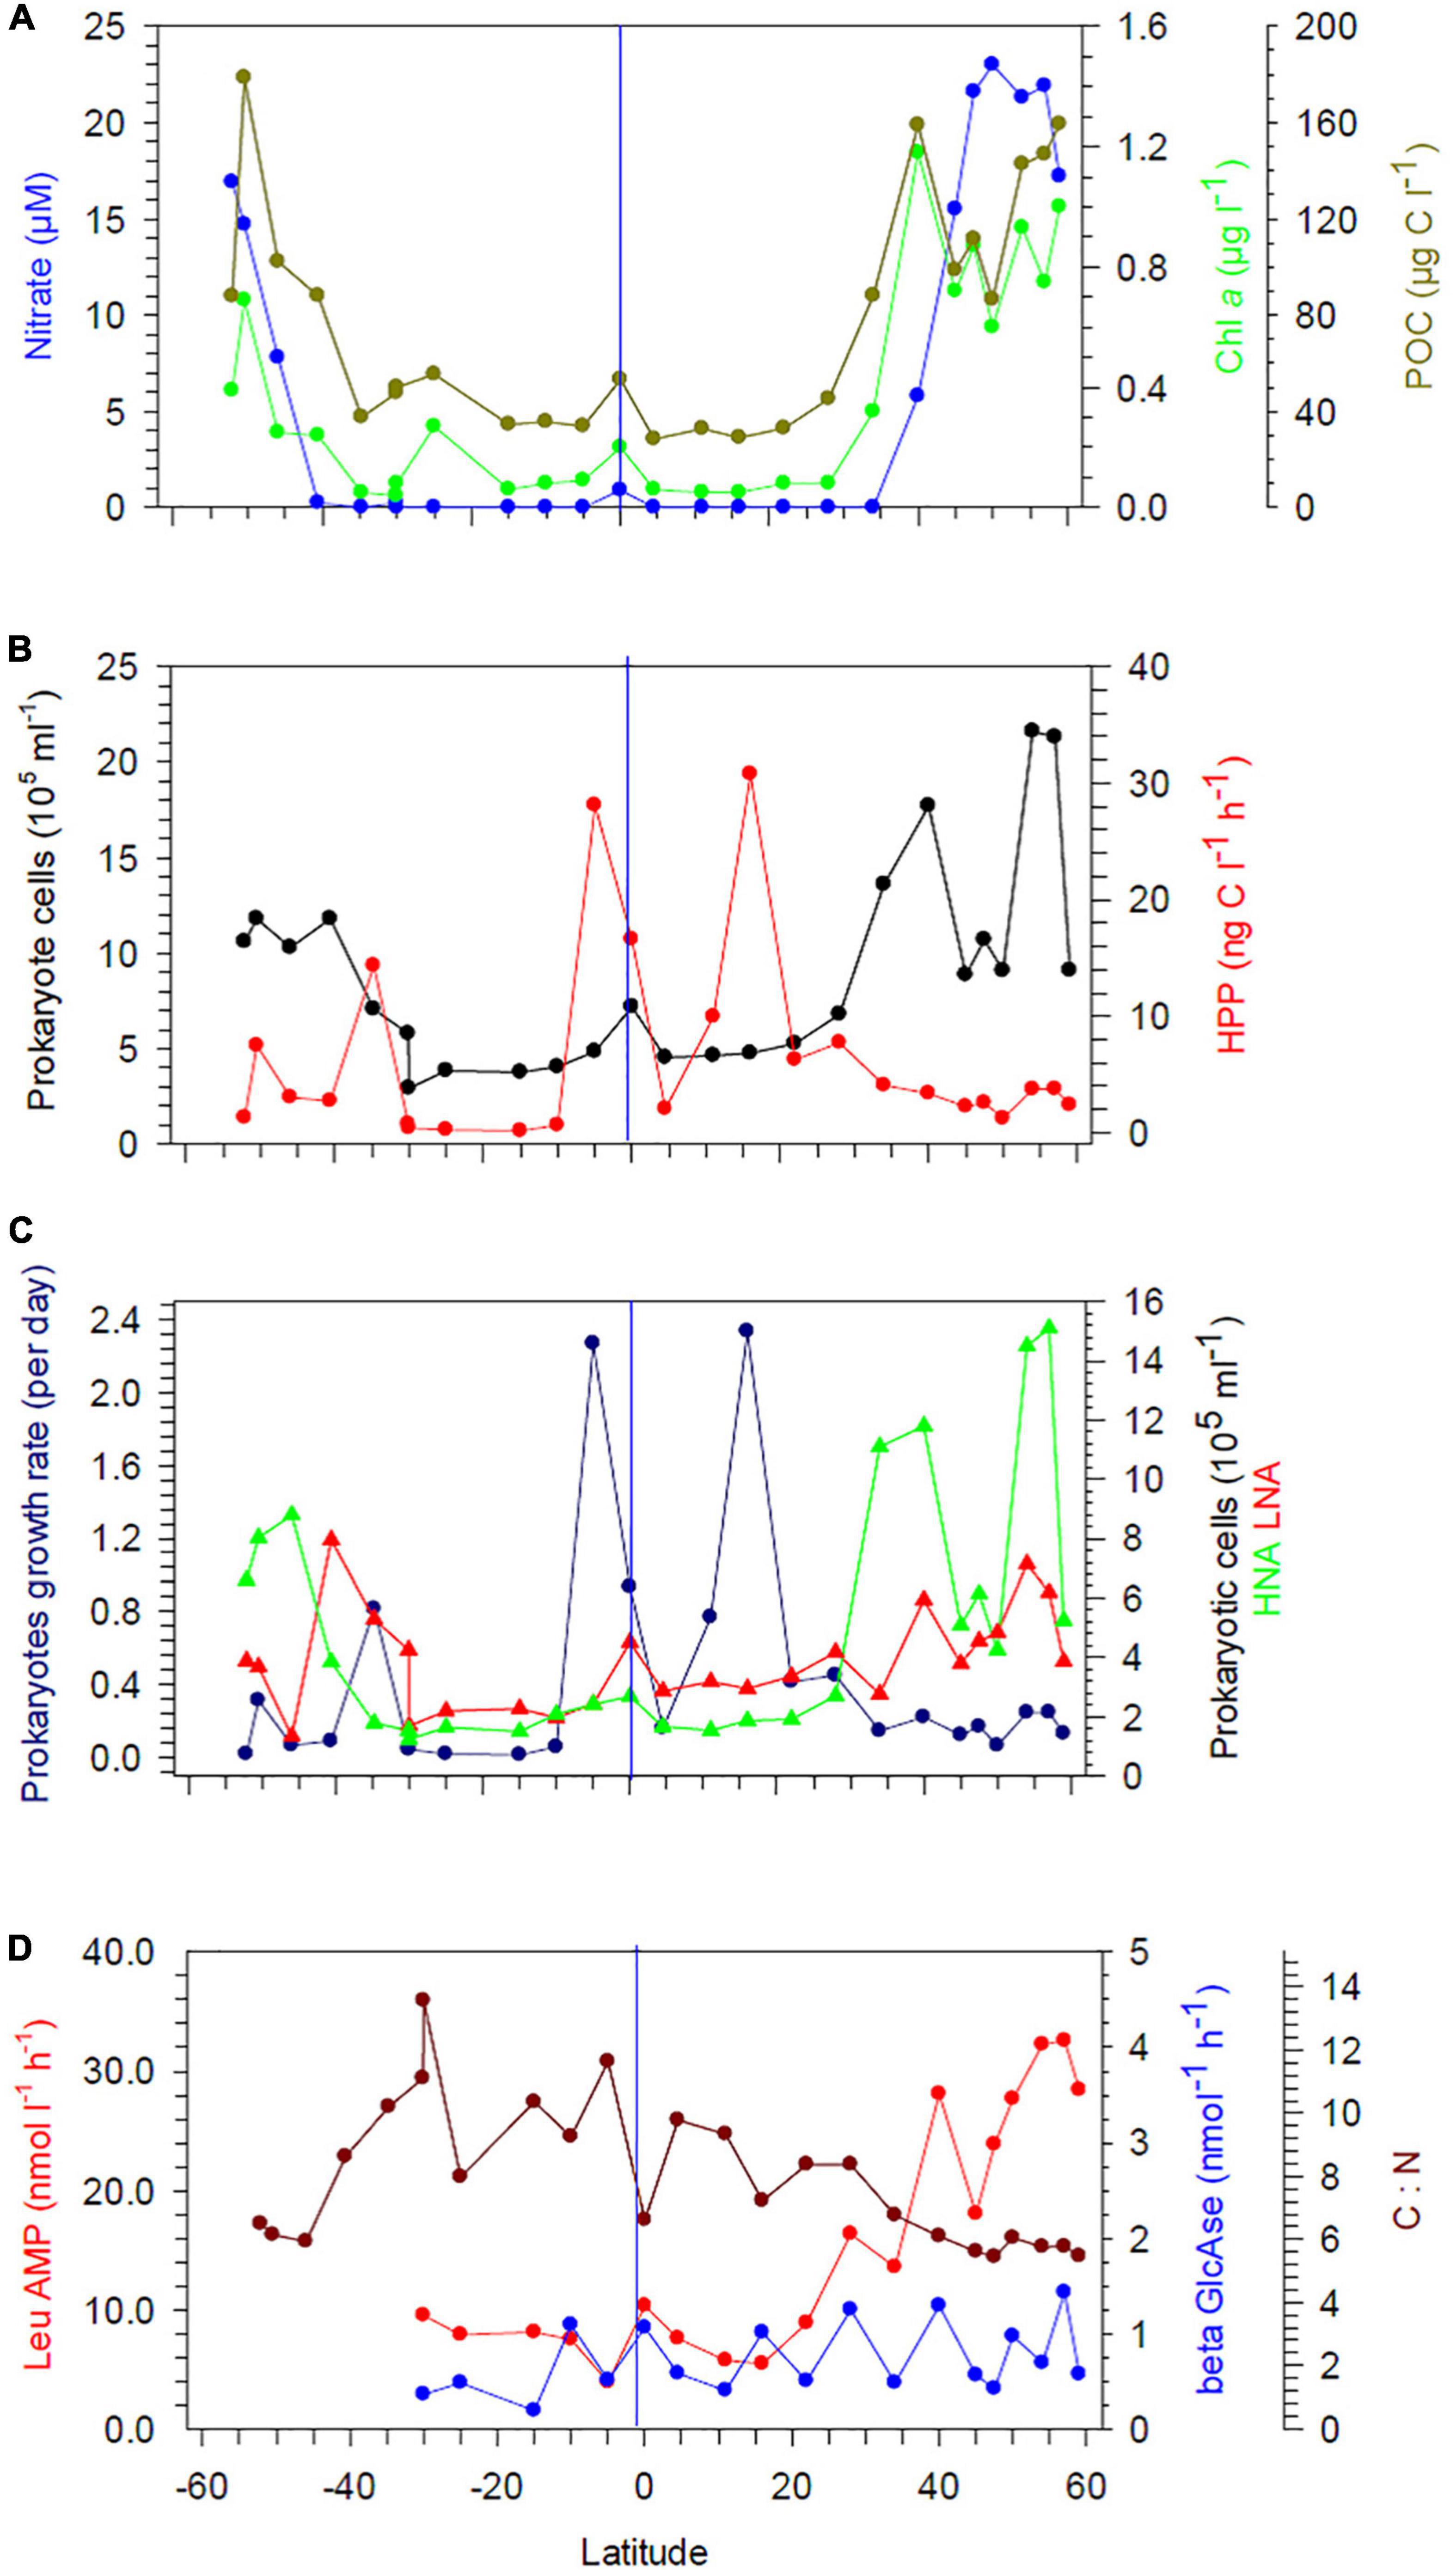
Figure 2. (A) Concentrations of nitrate, Chl a, and POC at 20 m depth between 52°S and 59°N in the Pacific Ocean during cruises SO248 and SO254. (B) Prokaryotic cell numbers and heterotrophic prokaryotic production (HPP). (C) Growth rate and cell numbers of prokaryotic high (HNA) and low nucleic acid (LNA) cells. (D) Hydrolysis rates of leucine amino peptidase (Leu-AMP) and β-glucosidase (β-GlcAse). The blue vertical lines mark the equator.
Concentrations of POC in the upper 60 m exhibited patterns similar to those of nitrate, with the lowest values at 20 m depth in the subtropical and tropical regions between 35°S and 30°N (stations 21, 20, 1–11). A distinct POC peak was observed in the Pacific equatorial divergence (PEQD) at the equator and in the south Pacific subtropical gyre (SPSG) at 35°S (Figure 2A and Supplementary Figure 1A). Beyond 35°N/S, higher concentrations were measured. The highest concentrations of Chl a of > 0.5 μg L–1 were recorded in the upper 60 m north of 40°N and south of 46°S (Figures 2A, 3A). Patterns of Chl a concentrations in the upper 60 m covaried with those of POC (Figure 2A and Supplementary Figure 1A). Chlorophyll autofluorescence of the flow cytometric analyses showed that Prochlorococcus constituted largely the DCM, with abundances of 1.0–2.3 × 10⁵ cells ml–1 between 30°S and 30°N (Figure 3C). Synechococcus exhibited the highest abundances of 2–3 × 10⁴ cells ml–1 at depths of 20–40 m in the equatorial region, the NPPF at 40°N and between 40° and 46°S. In the latter region they represented the DCM (Figure 3B).
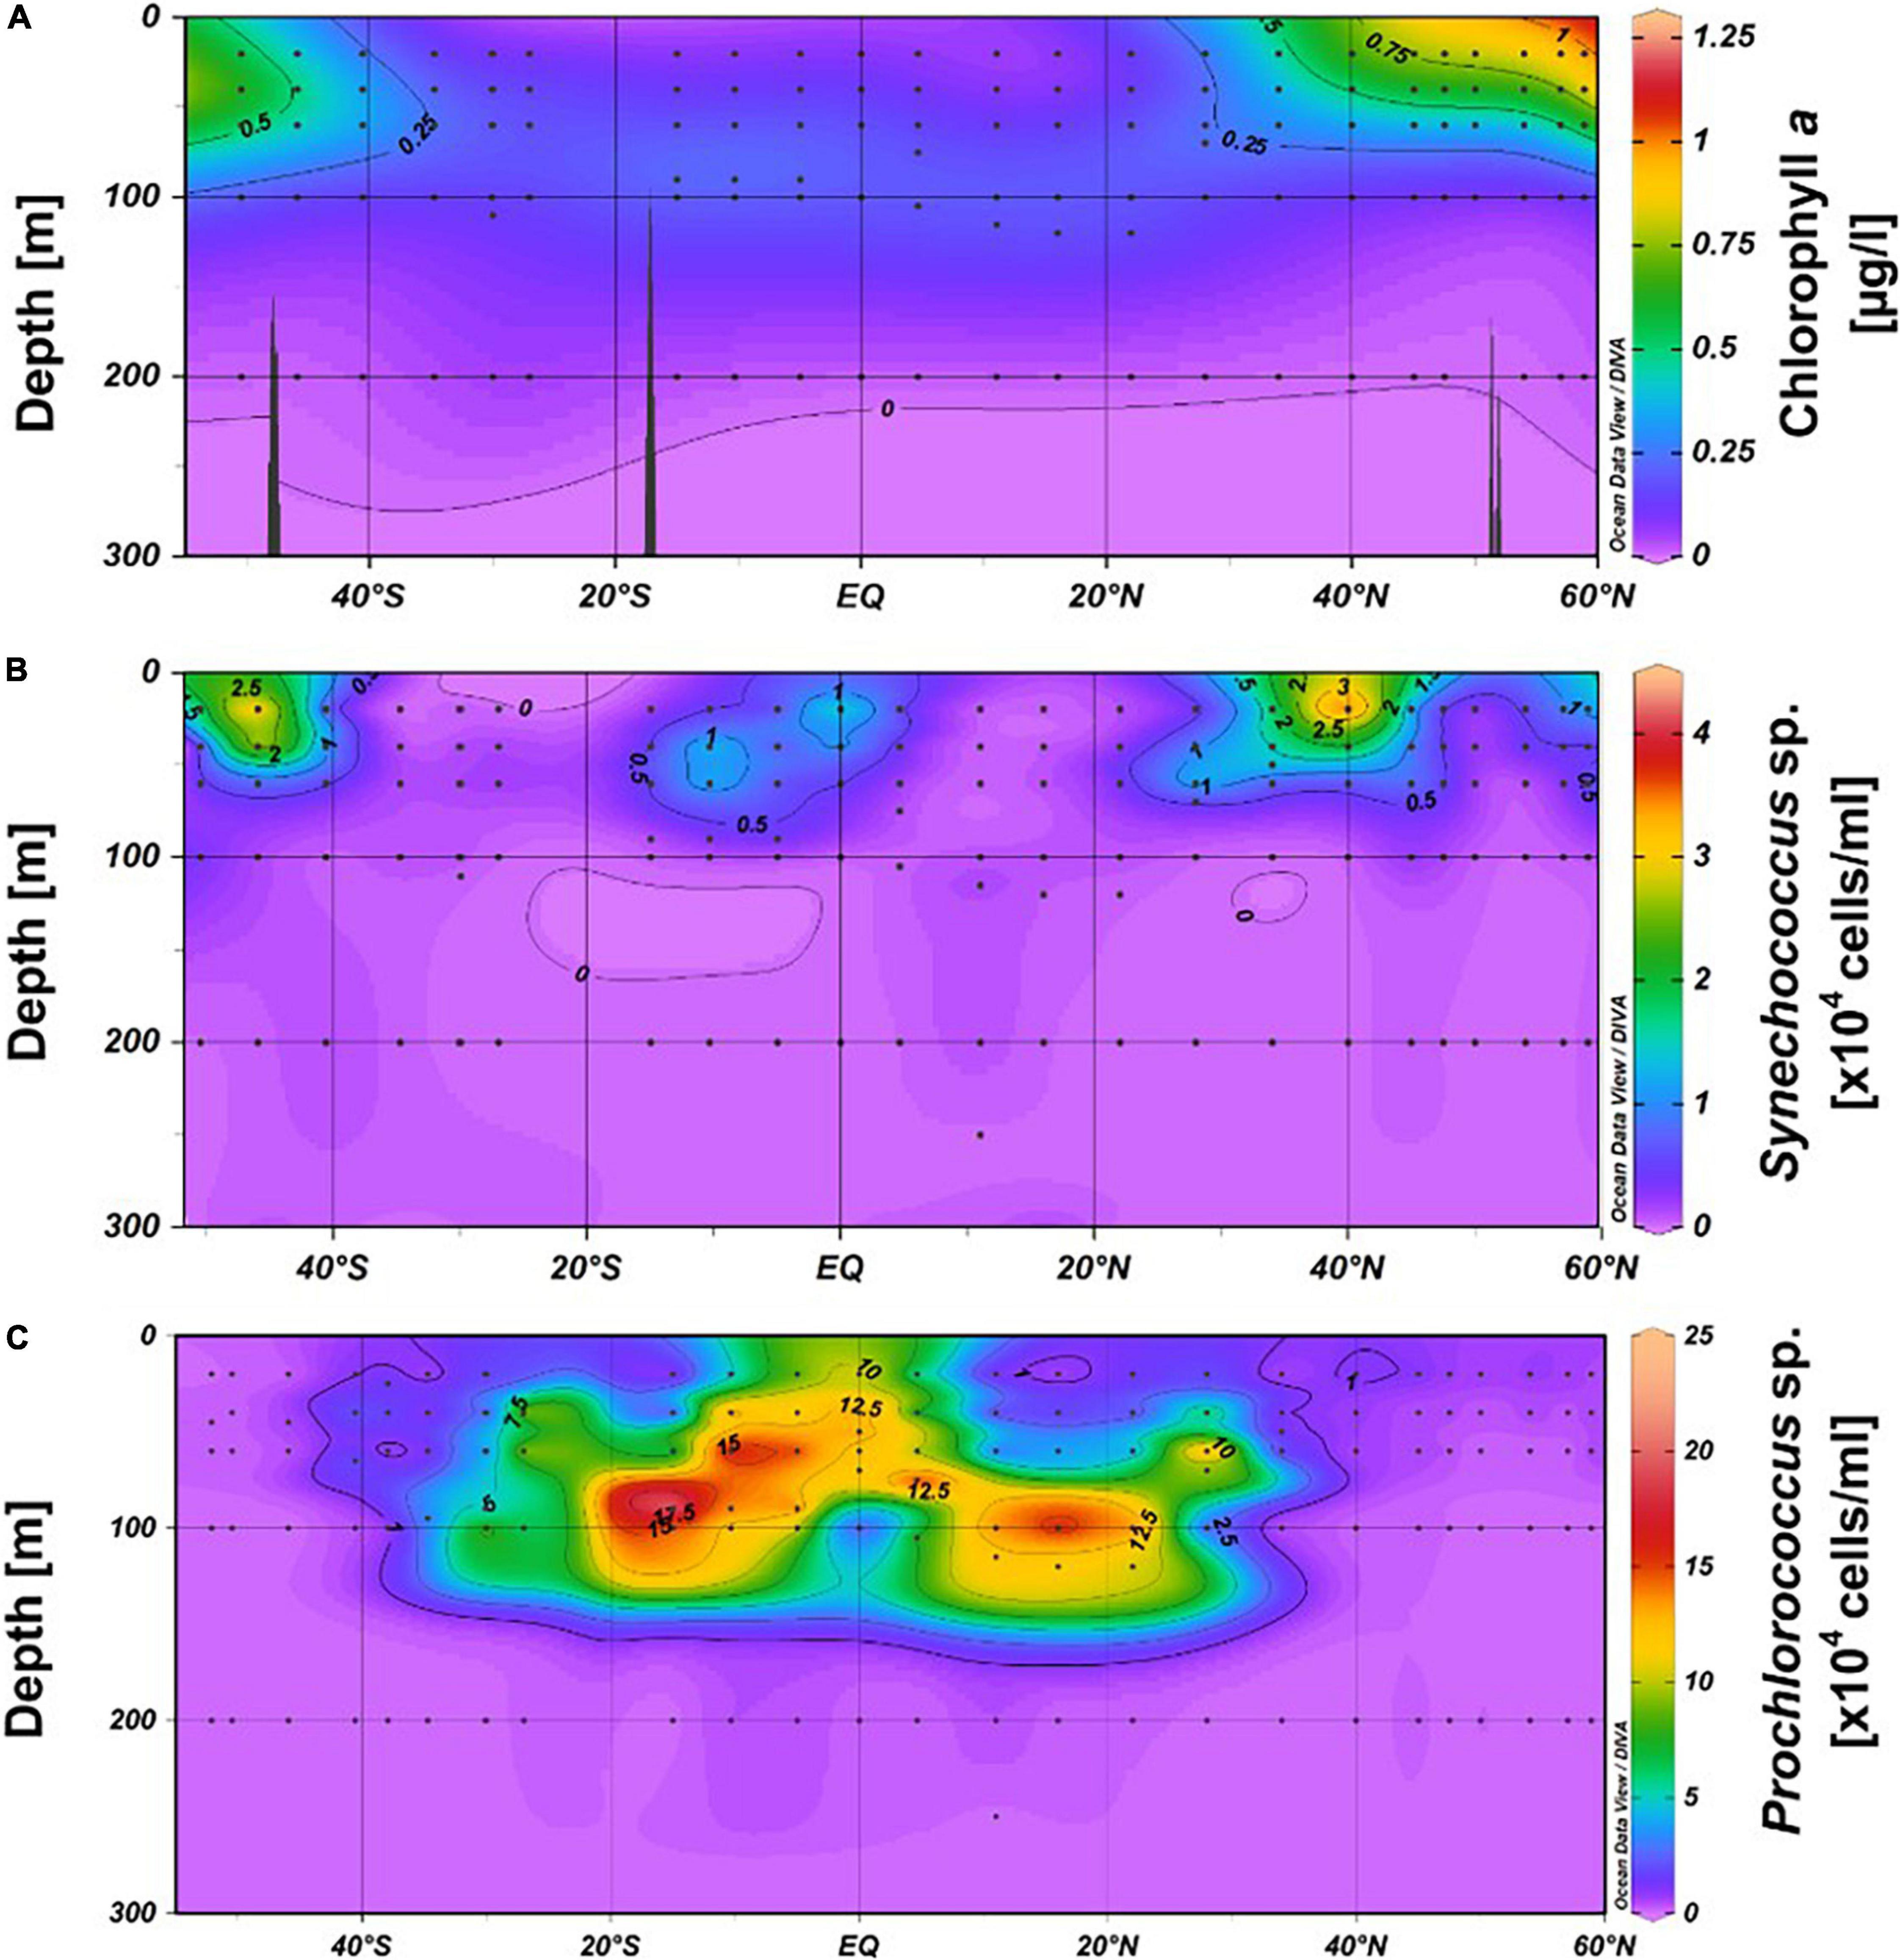
Figure 3. Contour graphs of Chl a (A), Synechococcus (B) and Prochlorococcus (C) in the upper 300 m between 52°S and 59°N in the Pacific Ocean during cruises SO248 and SO254. The black dots indicate the depths at the stations where samples were collected.
Abundance and Composition of Heterotrophic Prokaryotic Communities
The abundance of heterotrophic prokaryotes between 30°S and 20°N at 20 and 60 m did not exceed 6.4 × 10⁵ cells ml–1, except at the equator at 20 m with 8.7 × 10⁵ cells ml–1 (Figure 2B and Supplementary Figure 1B). Poleward of 30°S and 30°N, abundances increased up to 11.8 × 10⁵ and 21.6 × 10⁵ cells ml–1, respectively, but with large variations. Counts of high nucleic acid (HNA) and low nucleic acid (LNA) cells followed these general patterns, but HNA cell counts increased north of 30°N at 20 and 60 m depth (Figure 2C and Supplementary Figures 1C, 2B,C). Proportions of LNA cells exceeded 50% in the SPSG in the upper 40–60 m between 40° and 15°S, as well as in the north Pacific tropical gyre (NPTG) between 10° and 22°N, reaching proportions of > 60% at several stations (Figure 2C and Supplementary Figures 1C, 2C). Accordingly, proportions of HNA cells in these provinces remained below 40%, except at 5° and 10°S (SPSG) in the upper 100 m (Supplementary Figures 1C, 2B). Below 100 m and at the southern- and northernmost stations the proportions of LNA remained below 50% with lowest values of < 35% in the Pacific subarctic gyre (PSAG), BERS and the subantarctic province (SANT; Supplementary Figure 2C).
The abundance of four bacterial groups assessed by CARD-FISH covaried with total prokaryotic abundance at 20 m depth (Figure 4A). The SAR11 clade constituted the largest fraction at nearly all stations, with proportions of 20–50% of total prokaryotic cells (Figure 4B). Bacteroidetes (Cytophaga/Flavobacteria) comprised < 5.7% of prokaryotic cells between 40°S and 28°N, but reached proportions of > 12% further south and north, with highest values of 30% in the BERS (Figure 4B). Gammaproteobacteria constituted < 5% along the transect and the Roseobacter group < 6% except at station 12 where it reached 12% (Figure 4B). The RCA cluster of the Roseobacter group was not detected between 40°S and 40°N, except at the equator and the Pacific north equatorial current (PNEC) with very low numbers, but constituted 34–38% of the Roseobacter group at the southernmost stations and 54–79% at the stations at 45°N and beyond in colder regions. The genus Polaribacter constituted 3–15% of Bacteroidetes between 15°S and 40°N and 22–39% further south and north.
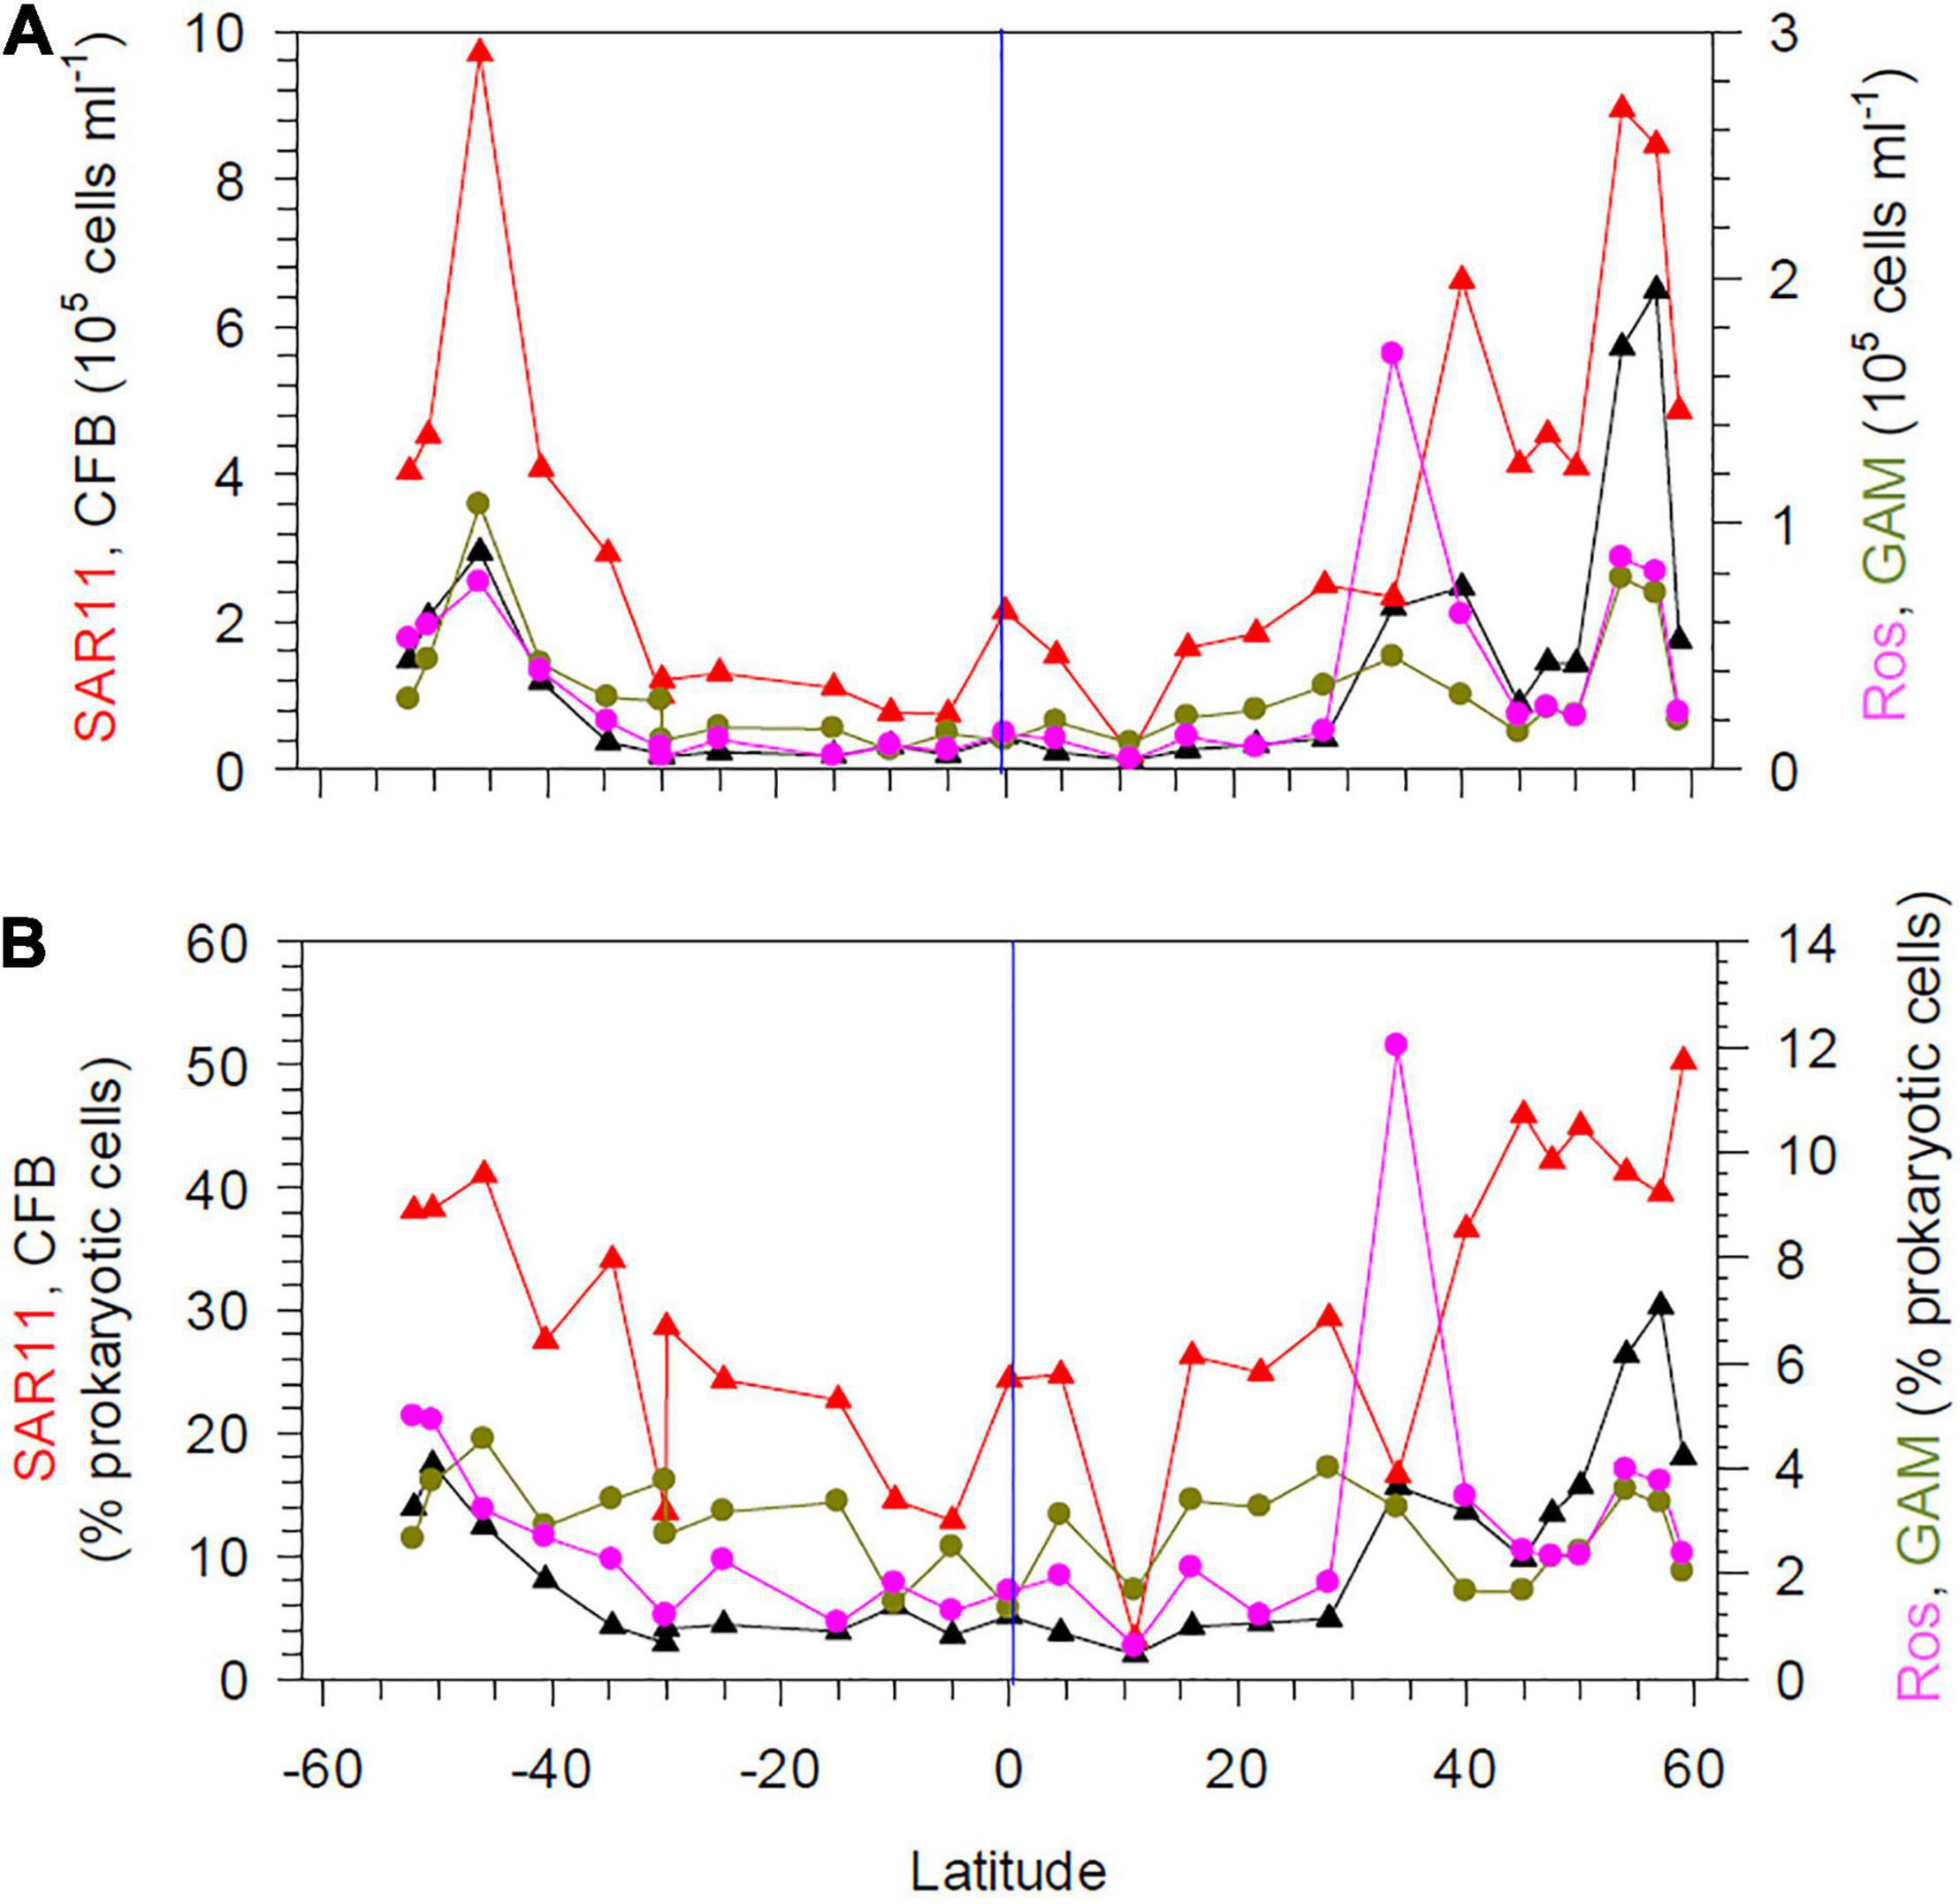
Figure 4. Numbers (A) and proportions (B) of SAR11, Cytophaga/Flavobacteria (CF), the Roseobacter group and Gammaproteobacteria assessed by CARD-FISH at 20 m depth between 52°S and 59°N in the Pacific Ocean during cruises SO248 and SO254. The blue vertical lines mark the equator.
Heterotrophic Prokaryotic Production, Growth, and Substrate Turnover
Rates of HPP varied greatly along the transect with the highest values at 20 m in tropical regions at several stations and in the SPSG at station 21 (Figure 2B and Supplementary Figure 1B). In the main part of the SPSG and beyond 40°S and 28°N rates at 20 m remained below 10 ng C L–1 d–1. At 60 m depth, HPP remained lower and values did not exceed 6 ng C L–1 d–1, except at station 7 in the PNEC (Supplementary Figure 1B). High rates of HPP integrated over the upper 300 m of the water column occurred at the edges of the SPSG at 35°S, in the equatorial upwelling and the NPTG (Supplementary Figure 3). In contrast, integrated rates of HPP remained very low (< 100 mg C m–2 d–1) in the central region of the SPSG. Patterns of prokaryotic bulk growth rates reflected those of HPP, with high rates of 2.3 d–1, equivalent to generation times of 7 h, at 20 m depth at stations of highest values of HPP (Figure 2C). Further south and north and at 60 m, growth rates were lower and did not exceed 0.4 d–1 (Supplementary Figure 1C).
To assess the partitioning of HPP among free-living and particle-associated prokaryotes, we measured HPP in the size-fractions 0.2–3.0, 3–8 and > 8 μm at 20, 60, and 100 m depth at stations 22–24 in the south subtropical convergence (SSTC) and SANT. The size-fraction 0.2–3.0 μm comprised at least 78% of total HPP, with a mean 90.7 ± 7.5%, and size-fractions 3–8 μm and > 8 μm 4.3 ± 3.9% and 5.4 ± 5.4% of total HPP, respectively.
Turnover rate constants of DFAA were highest in the equatorial region, with values of up to 0.7 d–1; lower values of < 0.3 and often < 0.1 d–1 were measured further south and north at 20 and 60 m depth (Figure 5A and Supplementary Figure 4A). Turnover rate constants of glucose and acetate were lower than those of DFAA and exhibited opposite patterns at 20 m, with lowest values in the tropics and increasing values poleward of 30°S and N (Figure 5A). Differences between 20 and 60 m depth were less pronounced (Supplementary Figure 4A).
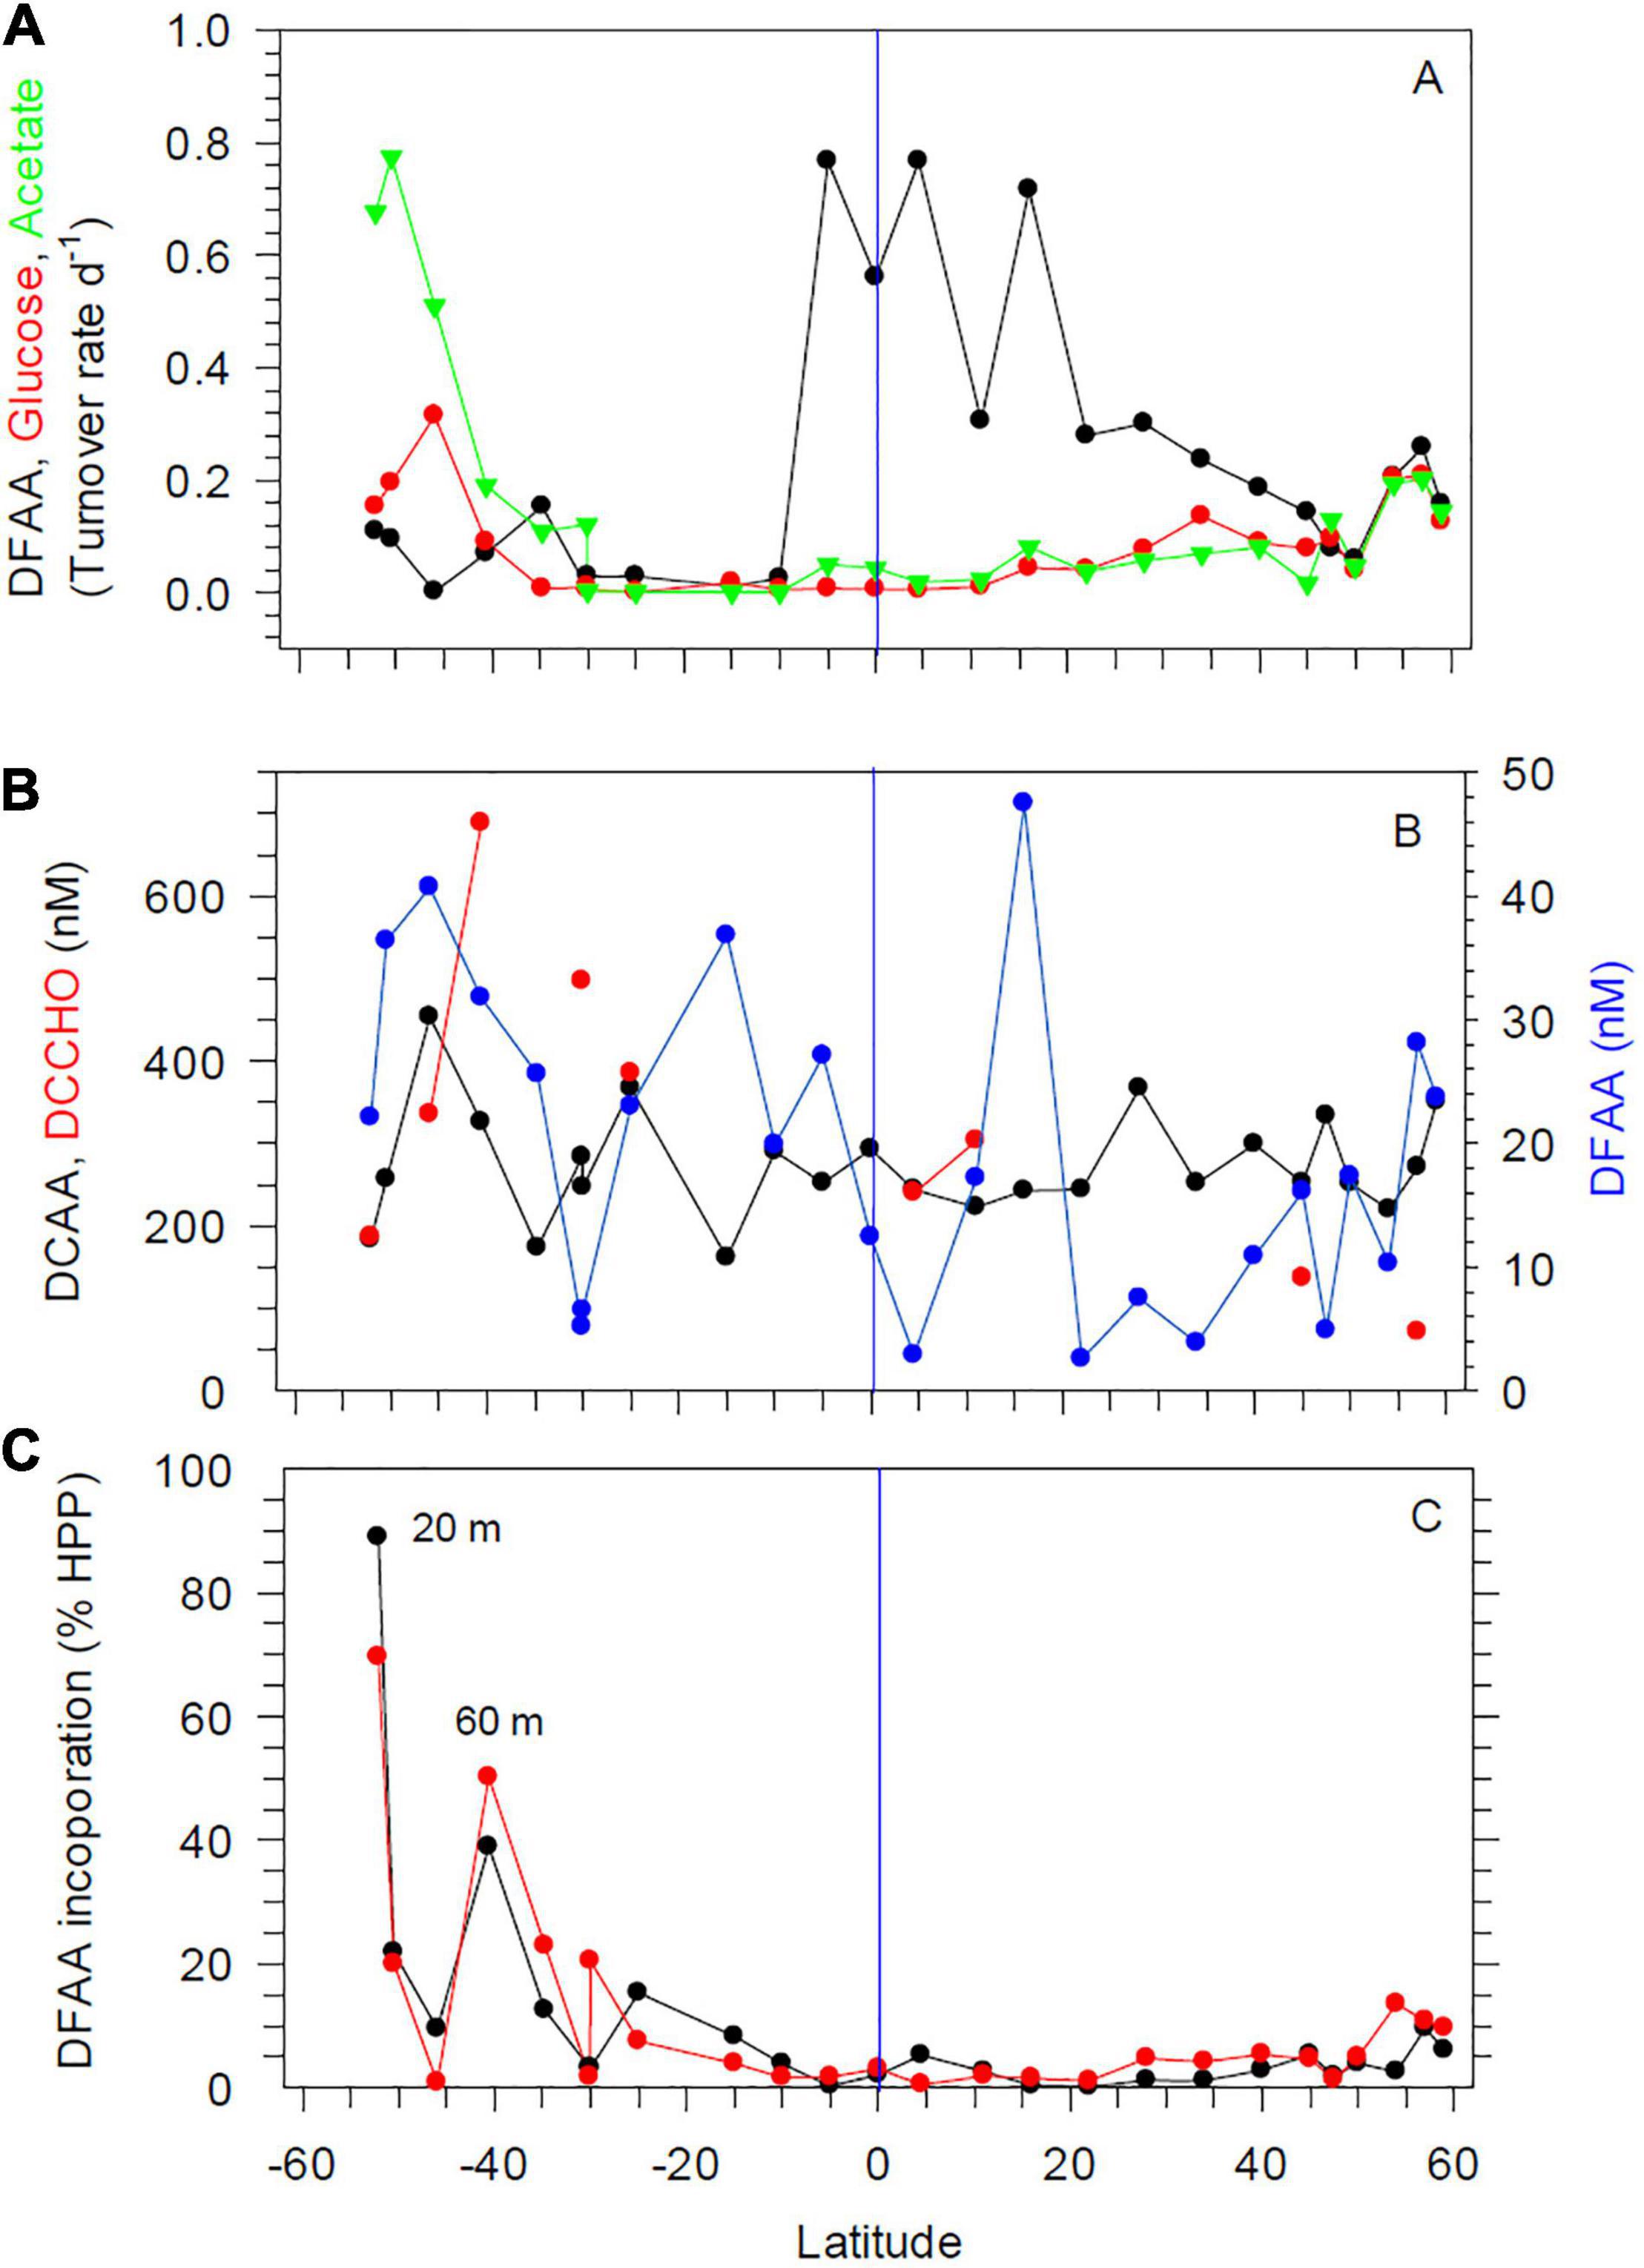
Figure 5. Turnover rate constants of DFAA, glucose and acetate at 20 m depth (A), concentrations of DFAA, DCAA, and DCCHO at 20 m depth (B) and DFAA uptake rates at 20 and 60 m depth (C) between 52°S and 59°N in the Pacific Ocean during cruises SO248 and SO254. The blue vertical lines mark the equator.
Concentrations of total DFAA at 20 and 60 m varied greatly, but remained always below 50 nM (Figure 5B and Supplementary Figure 4B). At several stations, concentrations did not exceed 20 nM. Glycine, serine, alanine, and aspartic acid constituted the highest proportions of DFAA in this decreasing order, with some latitudinal variations, and together accounted for 50–60 mol% of total DFAA. Concentrations of total DCAA varied between 161 and 453 nM and did not covary with hydrographic or microbial variables. Glycine, alanine, serine, threonine, and glutamic acid comprised 60–70 mol% of DCAA in this decreasing order, with some latitudinal variations. From concentrations of DFAA and the turnover rate constants, incorporation rates of DFAA were calculated, as well as its contribution to HPP. Incorporation of DFAA at 20 and 60 m accounted for < 9% of the C demand of HPP between 15°S and 50°N, for 10–15% further north, and for up to 70 and 88% south of 15°S, although with large variations (Figure 5C). Concentrations of dissolved free monosaccharides were only above the detection limit (2 nM) at 3 stations, with concentrations of 2–21 nM, exclusively attributed to glucose (data not shown). Concentrations of dissolved combined monosaccharides (DCCHO) were analyzed only at nine stations, but showed large variations at 20 and 60 m, ranging from 72 to 688 nM, with lowest values in the BERS and highest values in SANT (Figure 5B and Supplementary Figure 4B). Glucose, galactose, and xylose constituted 60–70 mol% of total DCCHO, and rhamnose consistently the lowest mol%, usually < 10 mol%.
Hydrolysis rates of Leu-AMP at 20 m depth remained below 10 nmol L–1 h–1 between 30°S and 22°N and increased further north with the highest values of 28–32 nmol L–1 h–1 in the BERS (Figure 2D). At 60 m depth, low hydrolysis rates of < 9 nmol L–1 h–1 were measured in the SPSG between 30 and 15°S and from the equator to 28°N (Supplementary Figure 1D). Further north, rates increased to values ranging from 13 to 24 nmol L–1 h–1. Hydrolysis rates of β-GlcAse at 20 and 60 m ranged from 0.2 to 1.5 nmol L–1 h–1, but did not exhibit any systematic latitudinal patterns (Figure 2D and Supplementary Figure 1D).
Depth Profiles
Stratification of the upper 200 m varied greatly along the transect and among the regions (Figures 1C,D). This also affected the vertical patterns between 20 and 200 m depth of the biogeochemical and microbial variables assessed. Hence, vertical profiles of temperature, nitrate, POC, Chl a, DFAA, and DCAA and microbial variables (cell numbers, HPP, growth rate, turnover rate constants of DFAA, glucose, acetate) illustrate region-specific patterns and covariations among these variables. They reflect distinct hydrographic and trophic features of the main biogeographic provinces along the transect (Figures 6, 7 and Supplementary Figures 5–8). In the BERS and NPPF, POC, Chl a, prokaryotic cell numbers and HPP decreased continuously from 20 to 60 m and covaried closely (Supplementary Figure 5 and Figure 6). In the NPST with vertically consistently low Chl a concentrations, rates of HPP were very high at 20 m depth, decreased below and covaried with prokaryotic cell numbers and POC between 60 and 200 m (Supplementary Figure 6). In the PNEQ, rates of HPP were also very high at 20 m depth and decreased below, roughly covarying with POC and prokaryotic cell numbers (Figure 7). In the SPSG, the DCM peak at 90 m was also reflected in highest rate of HPP and POC concentrations at this depth (Supplementary Figure 7). At station 24 in SANT, maxima of Chl a, POC, HPP and prokaryotic cell numbers occurred in the upper 40 m and strongly decreased down to 100 m (Supplementary Figure 8). Vertical covariations of these variables differed from their latitudinal covariations along the transect. This was particularly true for HPP, prokaryotic cell numbers and growth and Chl a and POC.
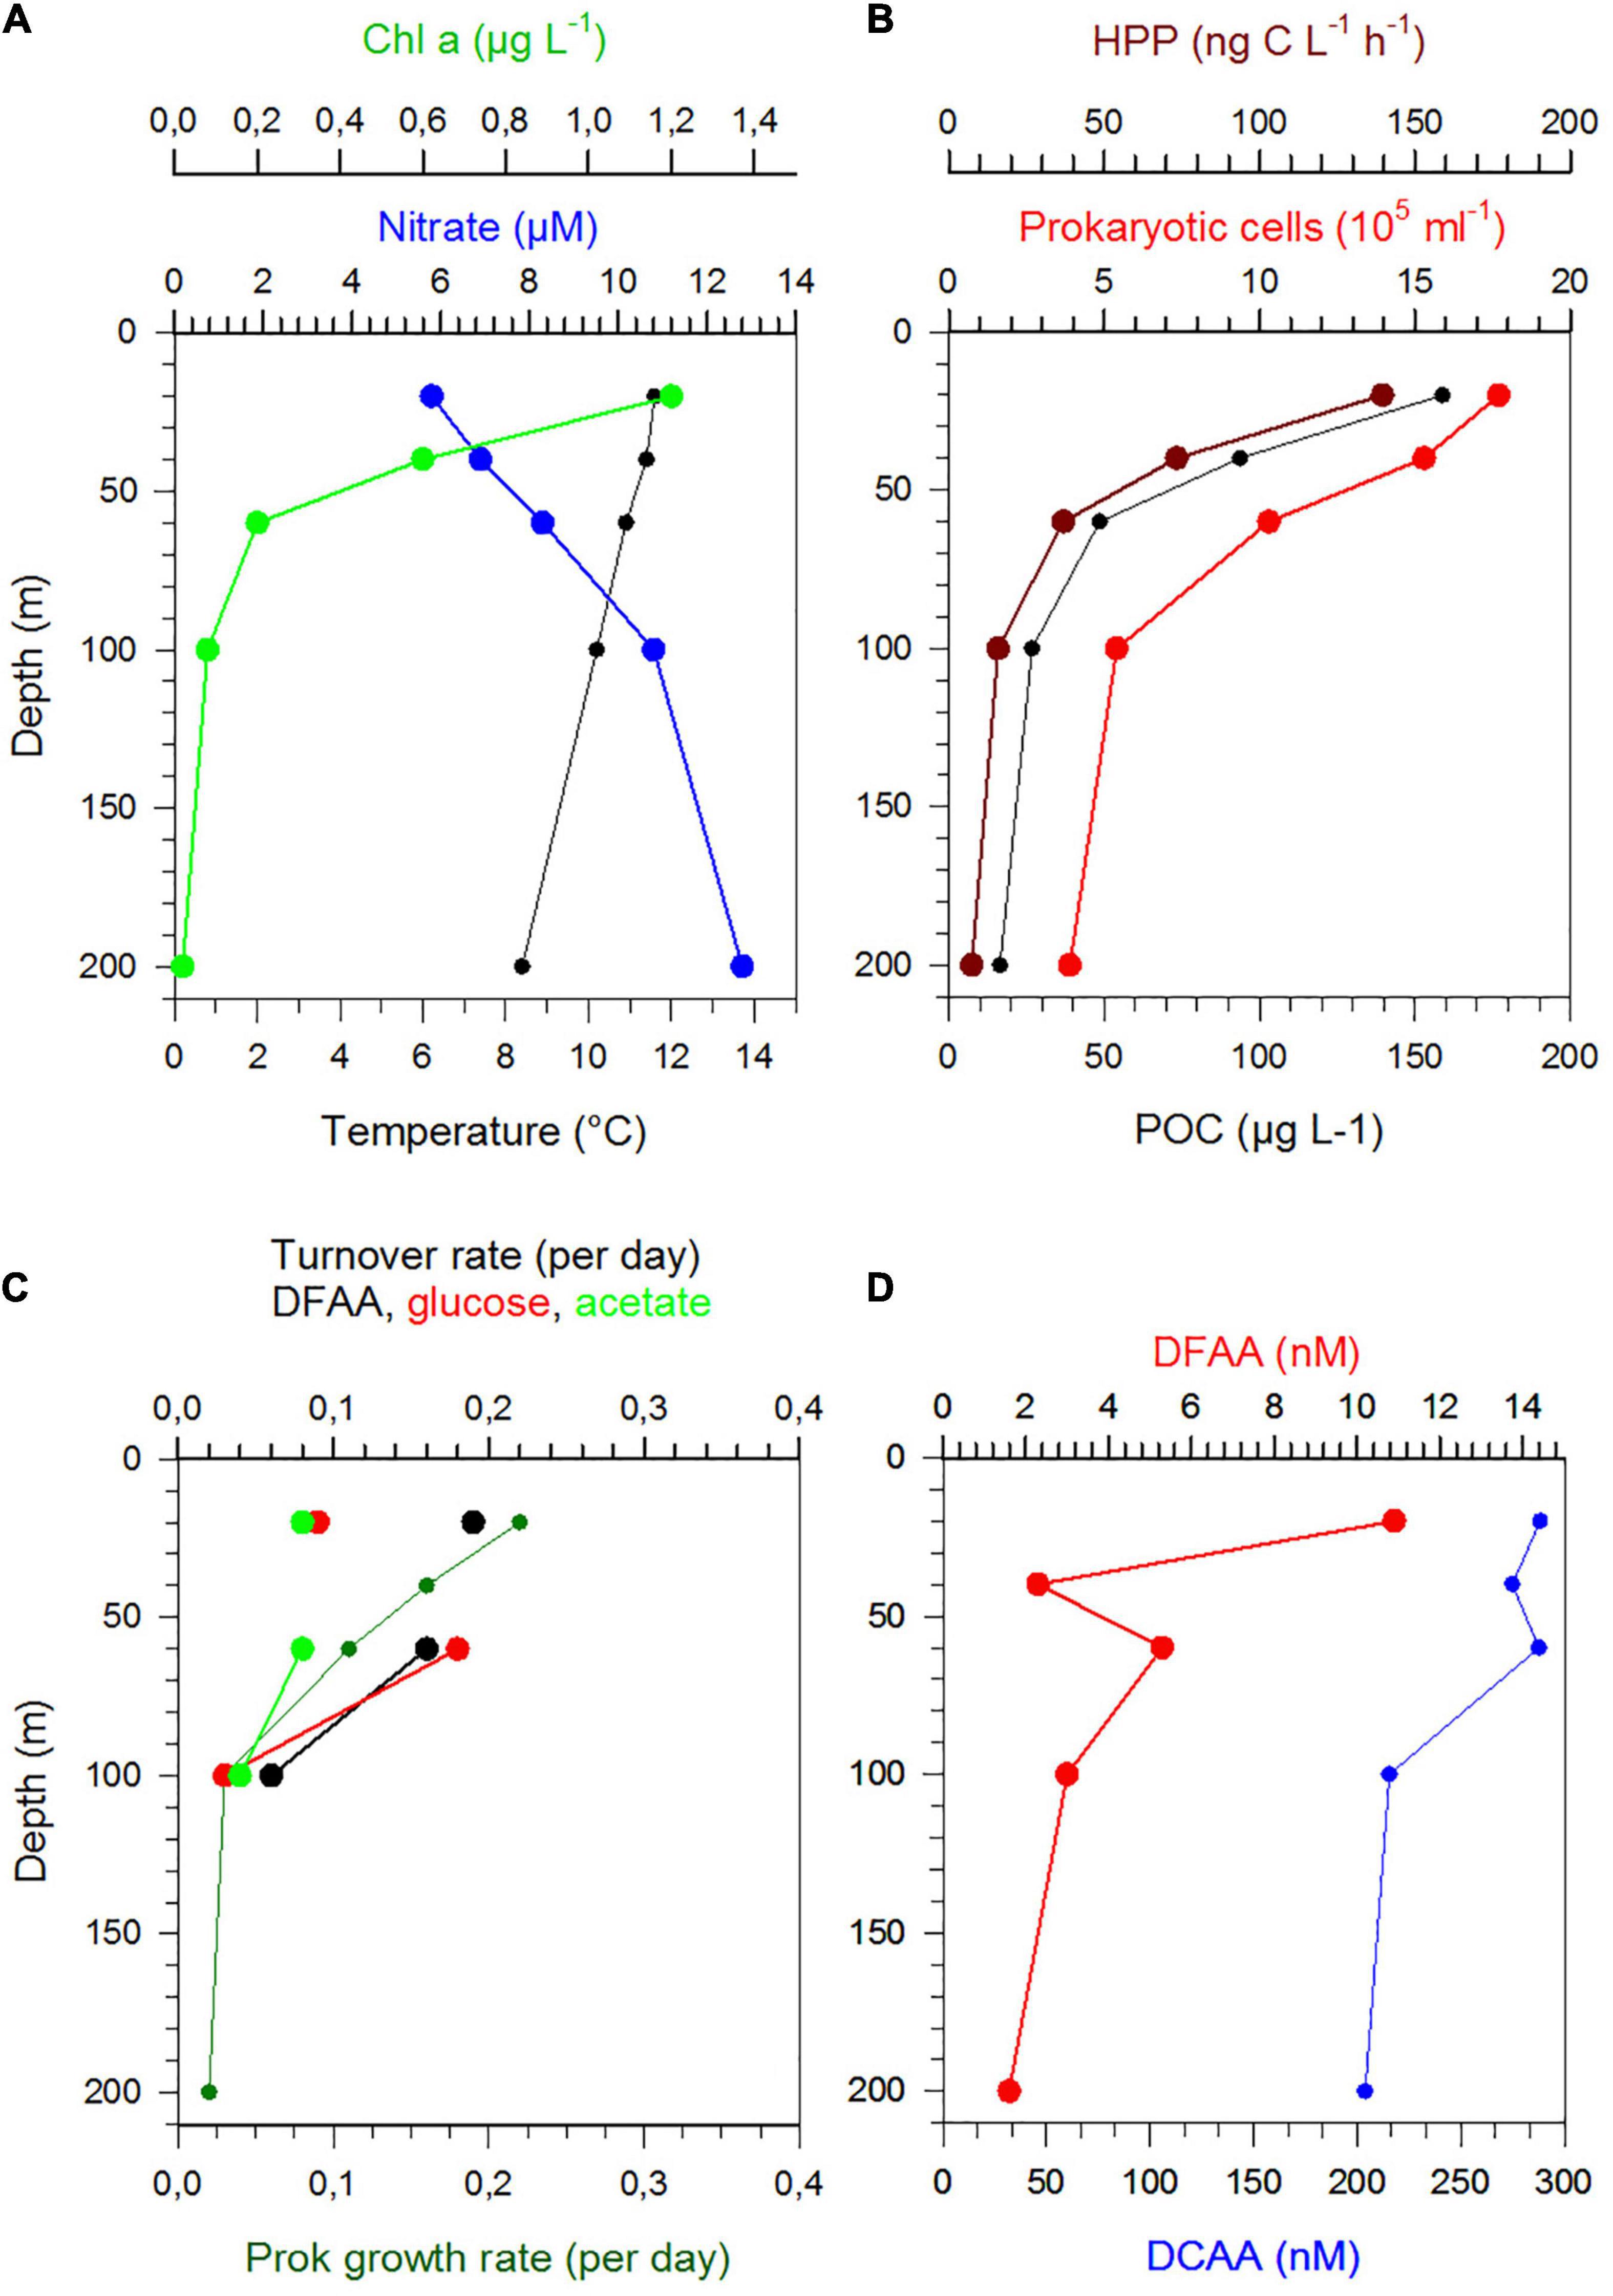
Figure 6. Depth profiles between 20 and 200 m of temperature, nitrate, Chl a (A), POC, prokaryotic cell numbers and HPP (B), Turnover rate constants of DFAA, glucose and acetate and growth rates (C) and concentrations of DFAA and DCAA (D) at station 13 in the NPPF.
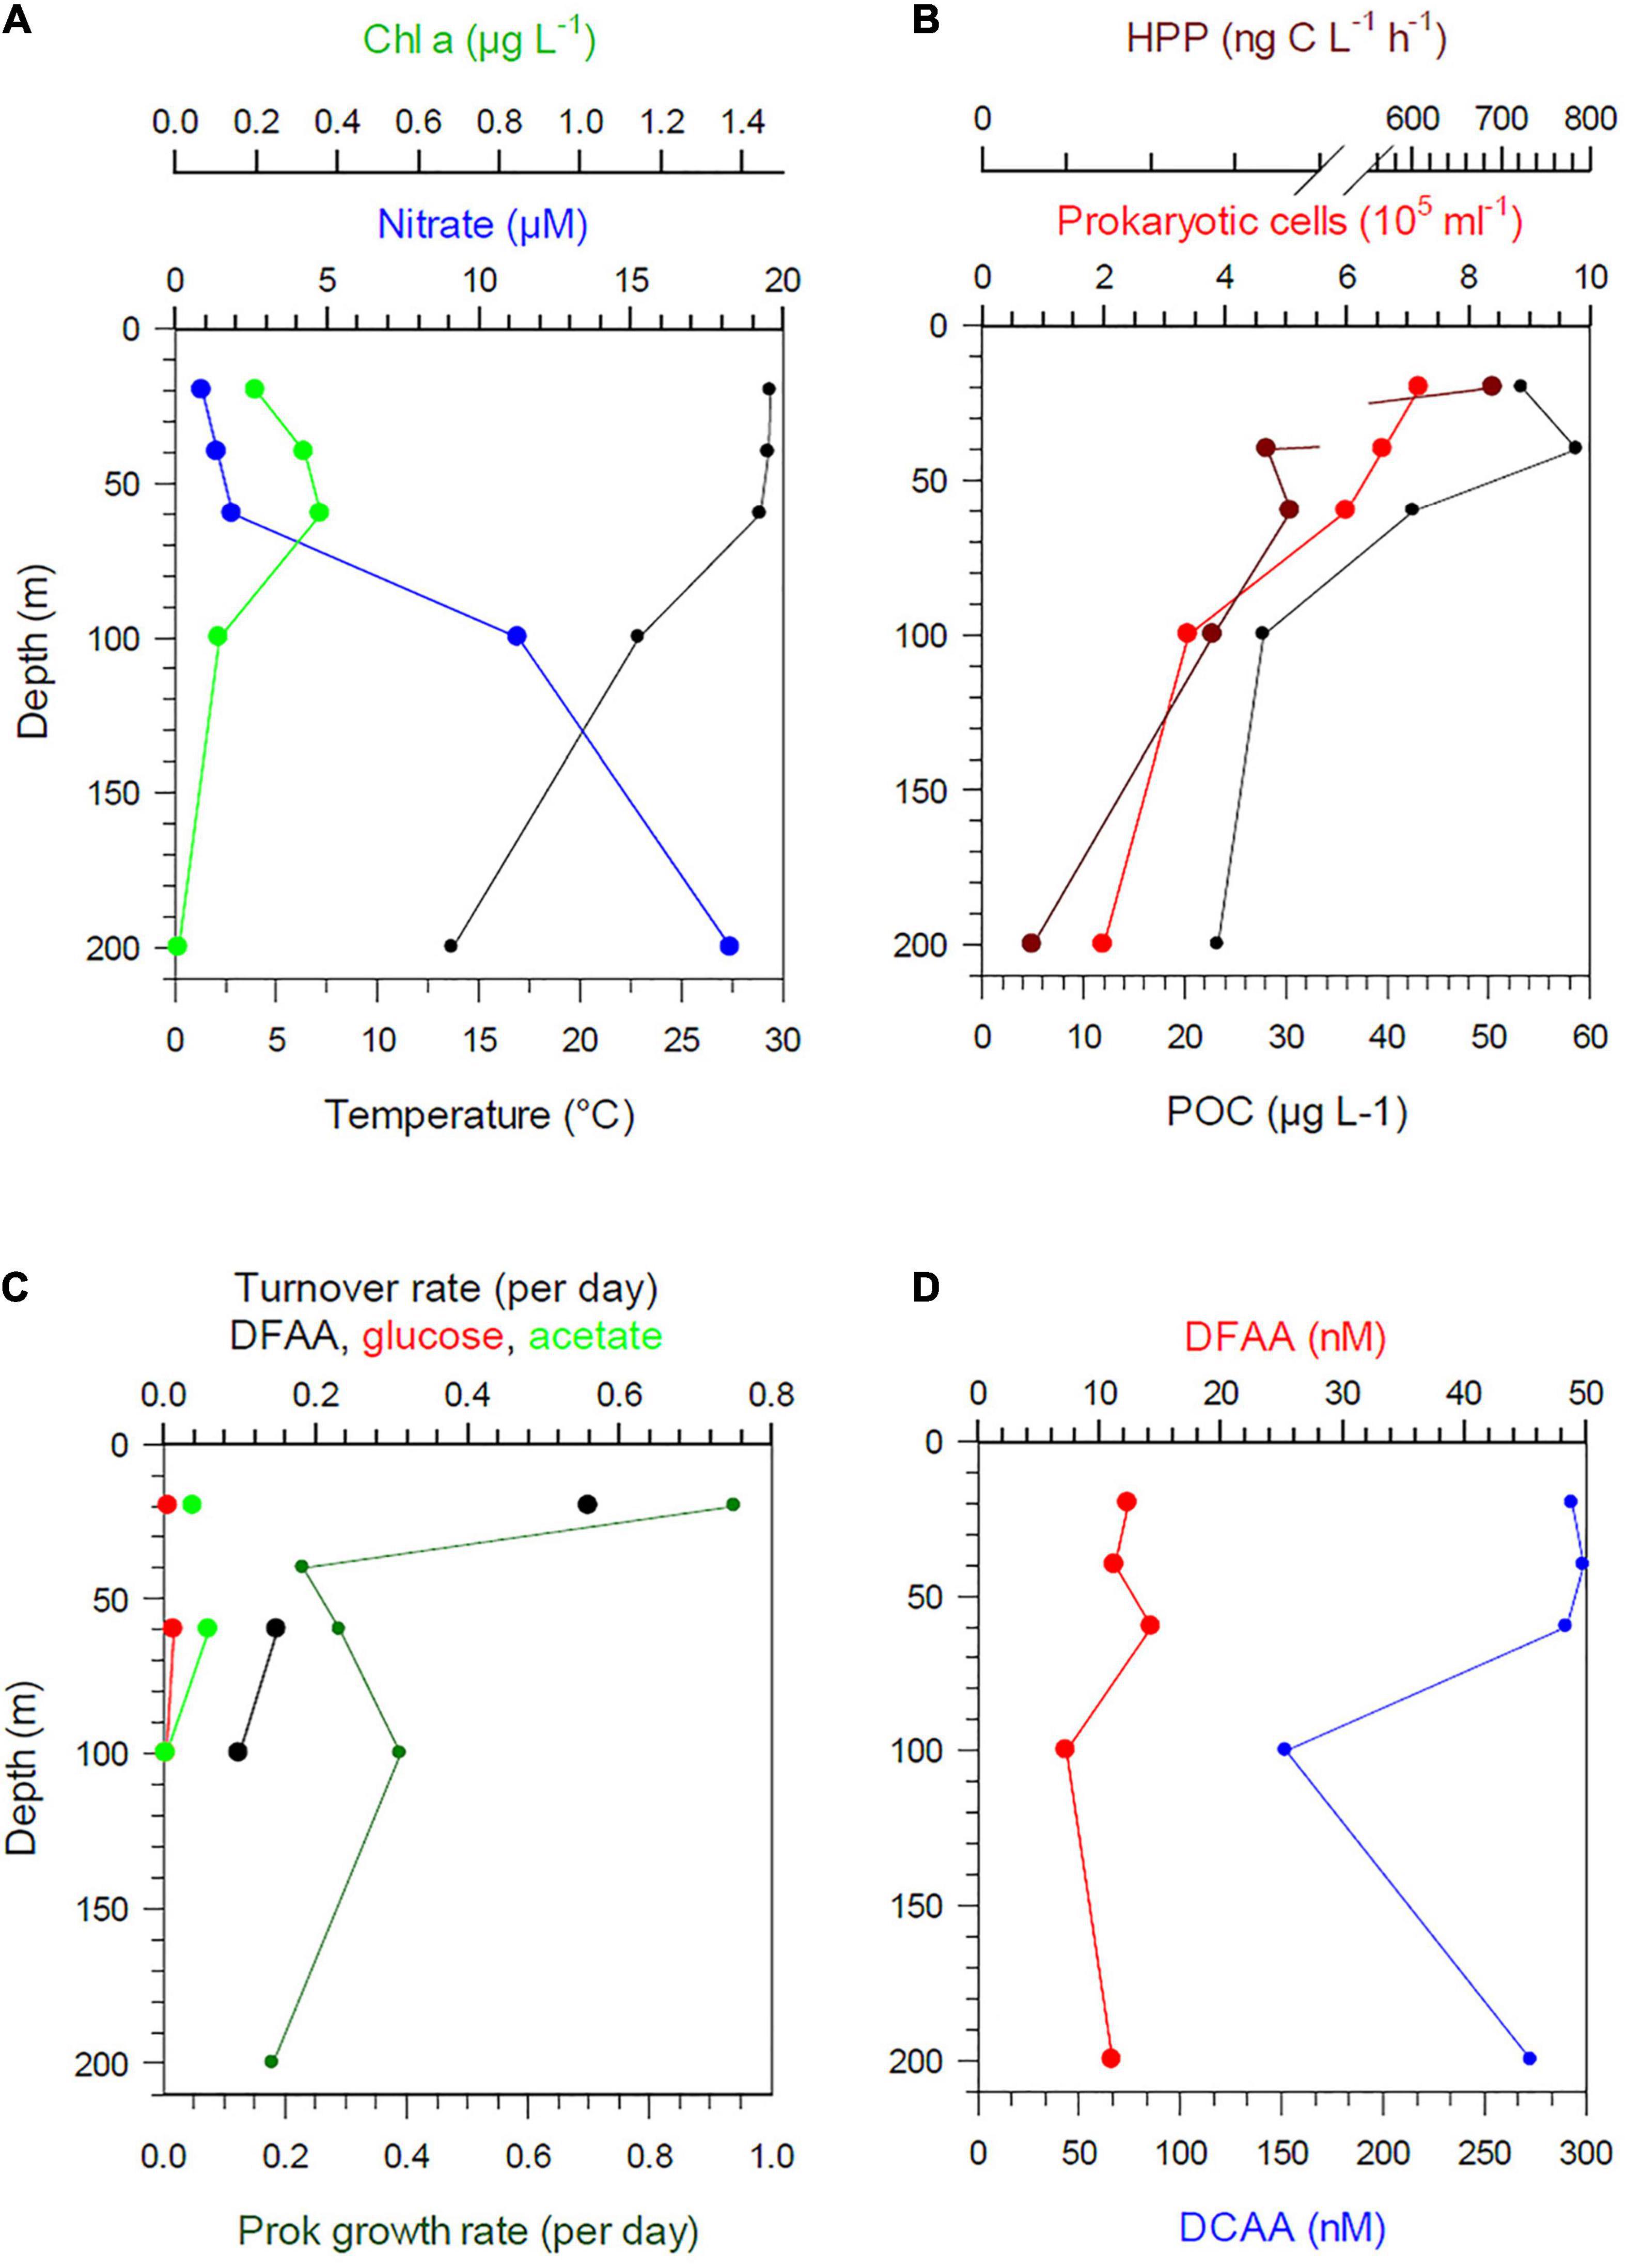
Figure 7. Depth profiles between 20 and 200 m of temperature, nitrate, Chl a (A), POC, prokaryotic cell numbers and HPP (B), Turnover rate constants of DFAA, glucose and acetate and growth rates (C) and concentrations of DFAA and DCAA (D) at station 6 in the PEQD.
Statistics
A PCA of all data along the transect of the upper water column to 100 m depth or the DCM (if the DCM was below 100 m) showed clustering of stations by biogeographic provinces and their separation with temperature (Figure 8) and nitrate concentrations (Supplementary Figure 9). Provinces in the colder and more nutrient-rich regions (BER, PSAG, NPPF, SANT) were clearly separated from the subtropical and tropical regions (NPST, NPTG, PNEC, PEQD, SPSG), in particular along the PCA-axis 1. Temperature, nitrate, Chl a, POC and abundance of prokaryotes contributed most to the explained variance along this axis. Stations within biogeographic provinces showed some subclustering along the PCA-axis 2, with prokaryotic activities (HPP, growth rate, turnover rate constants of DFAA, glucose and acetate) contributing most to the explained variance.
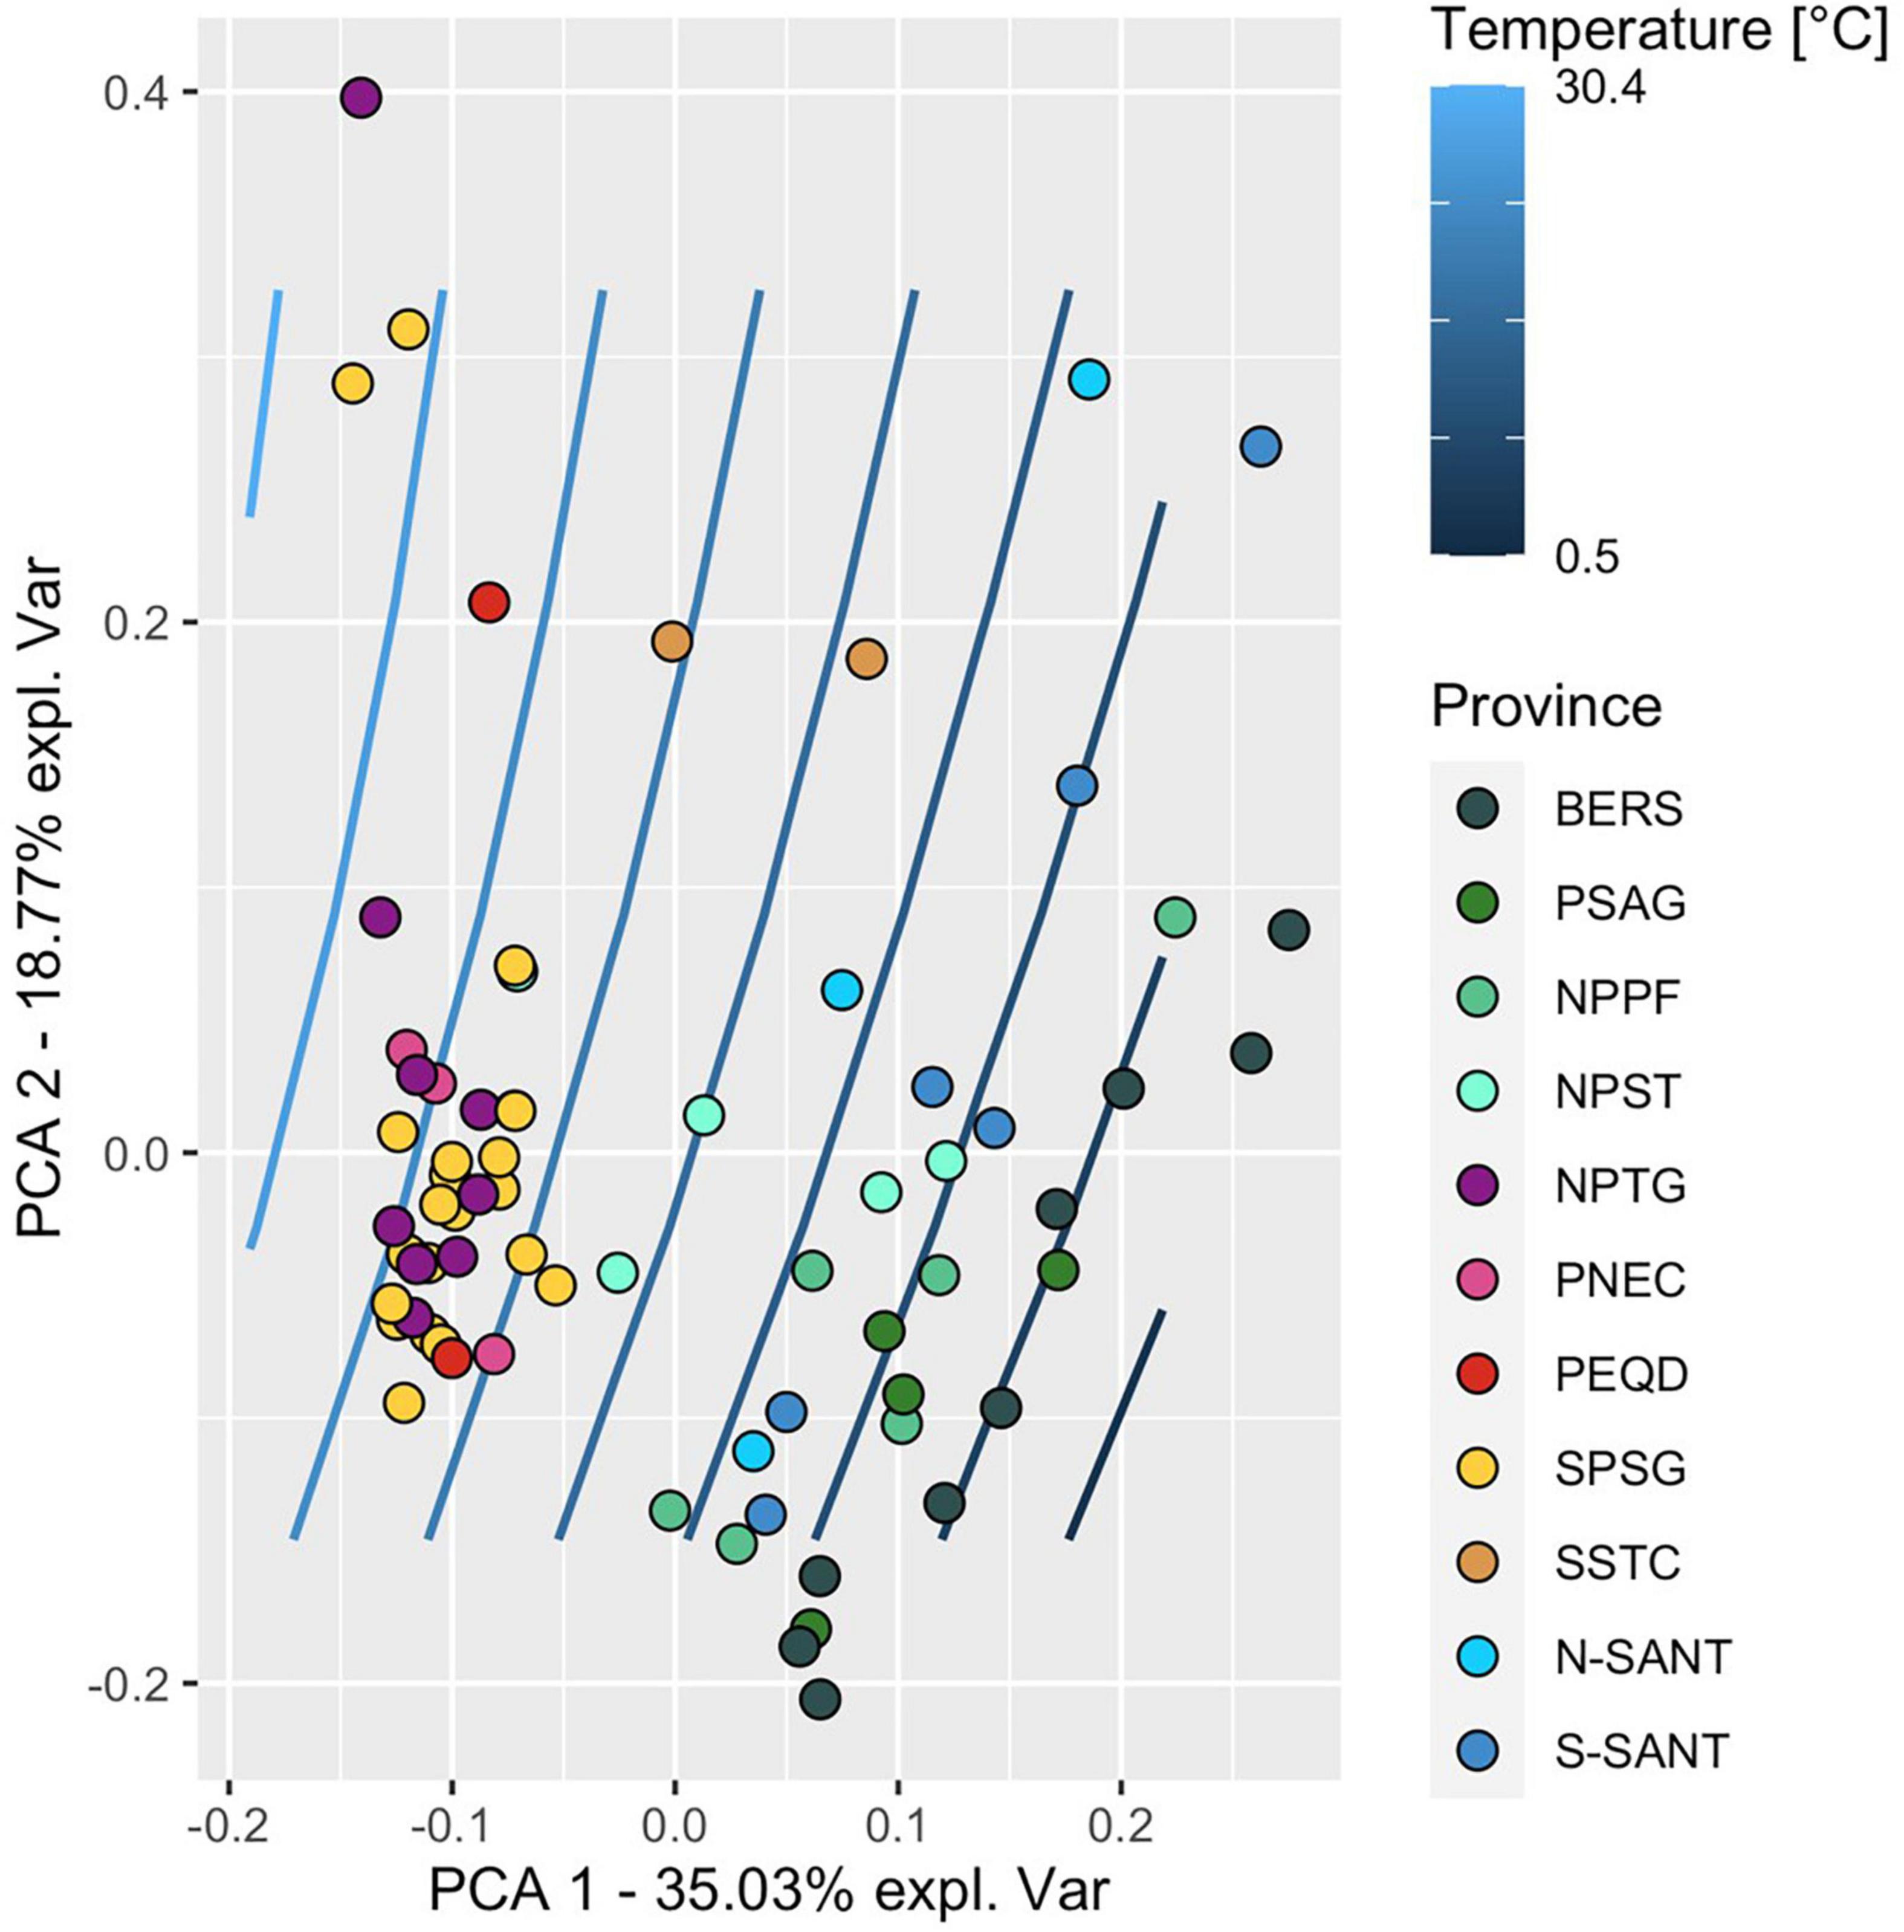
Figure 8. PCA of variables assessed along a transect between 52°S and 59°N at 25 stations and in 10 biogeographic provinces in the upper 100 m and including the depth of the DCM when below 100 m of the Pacific Ocean during cruises SO248 and SO254. Each circle represents the data of one depth (20, 40, 60, 100 m, DCM) at a single station. The color code refers to the affiliated biogeographic provinces. Blue lines indicate the interpolated temperature gradient between 7° and 29°C along the transect. For abbreviations see legend of Figure 1.
To identify relationships among the variables, we performed regressions for the data sets at 20 and 60 m depths and for the upper 100 m of the water columns. These data sets, illustrated in Figures 2, 4, 5 and Supplementary Figure 4, were log-transformed and analyzed using linear regression after Benjamini Hochberg adjustment. Potential temperature, nitrate, Chl a, POC, PON, cell numbers of pico-, nanoplankton, prokaryotes, HNA, Bacteroidetes, the Roseobacter group and SAR11 and Leu-AMP, were significantly correlated (p < 0.05). In addition, 80% of these variables correlated very closely (r2 > 0.60) at 20 m depth (Table 1). At 60 m depth, fewer and weaker correlations between these variables were observed. Rates of HPP and prokaryotic growth were not correlated with other variables. Turnover rate constants of DFAA were correlated to cell numbers of nanoplankton only at 20 m depth, and turnover rate constants of glucose at this depth were correlated only to cell numbers of prokaryotes and Gammaproteobacteria and to the turnover rate constants of acetate. Leu-AMP at 20 m was closely correlated to all biogeochemical variables and cell numbers of prokaryotes, Bacteroidetes and SAR11. Pearson correlations of all variables assessed exhibited clusters of positive and negative correlations (Figure 9) which generally agree with the linear correlations between biogeochemical and microbial variables described above and shown in Table 1.
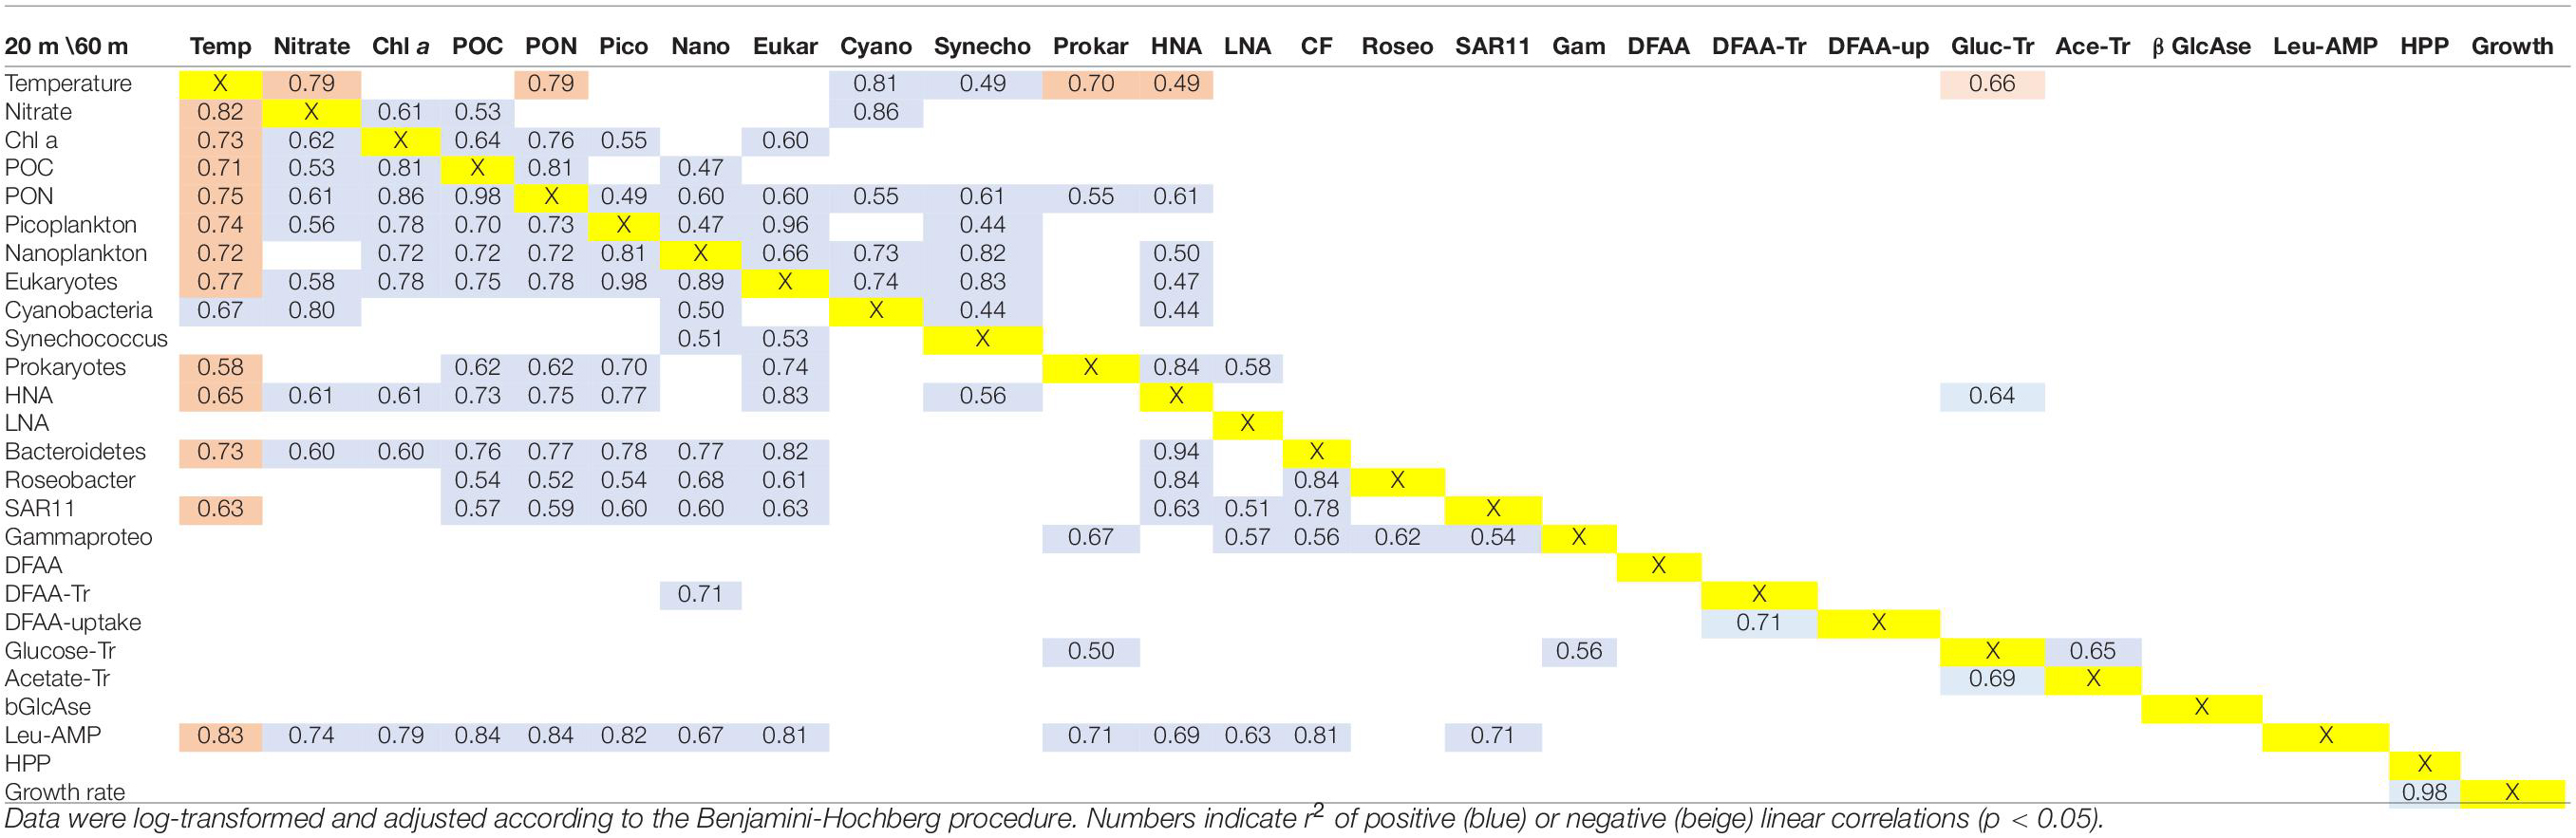
Table 1. Linear regression statistics of the variables assessed along the Pacific Ocean transect between 52°S and 59°N at 20 m (below/above the yellow marked X) and 60 m (above the diagonal).
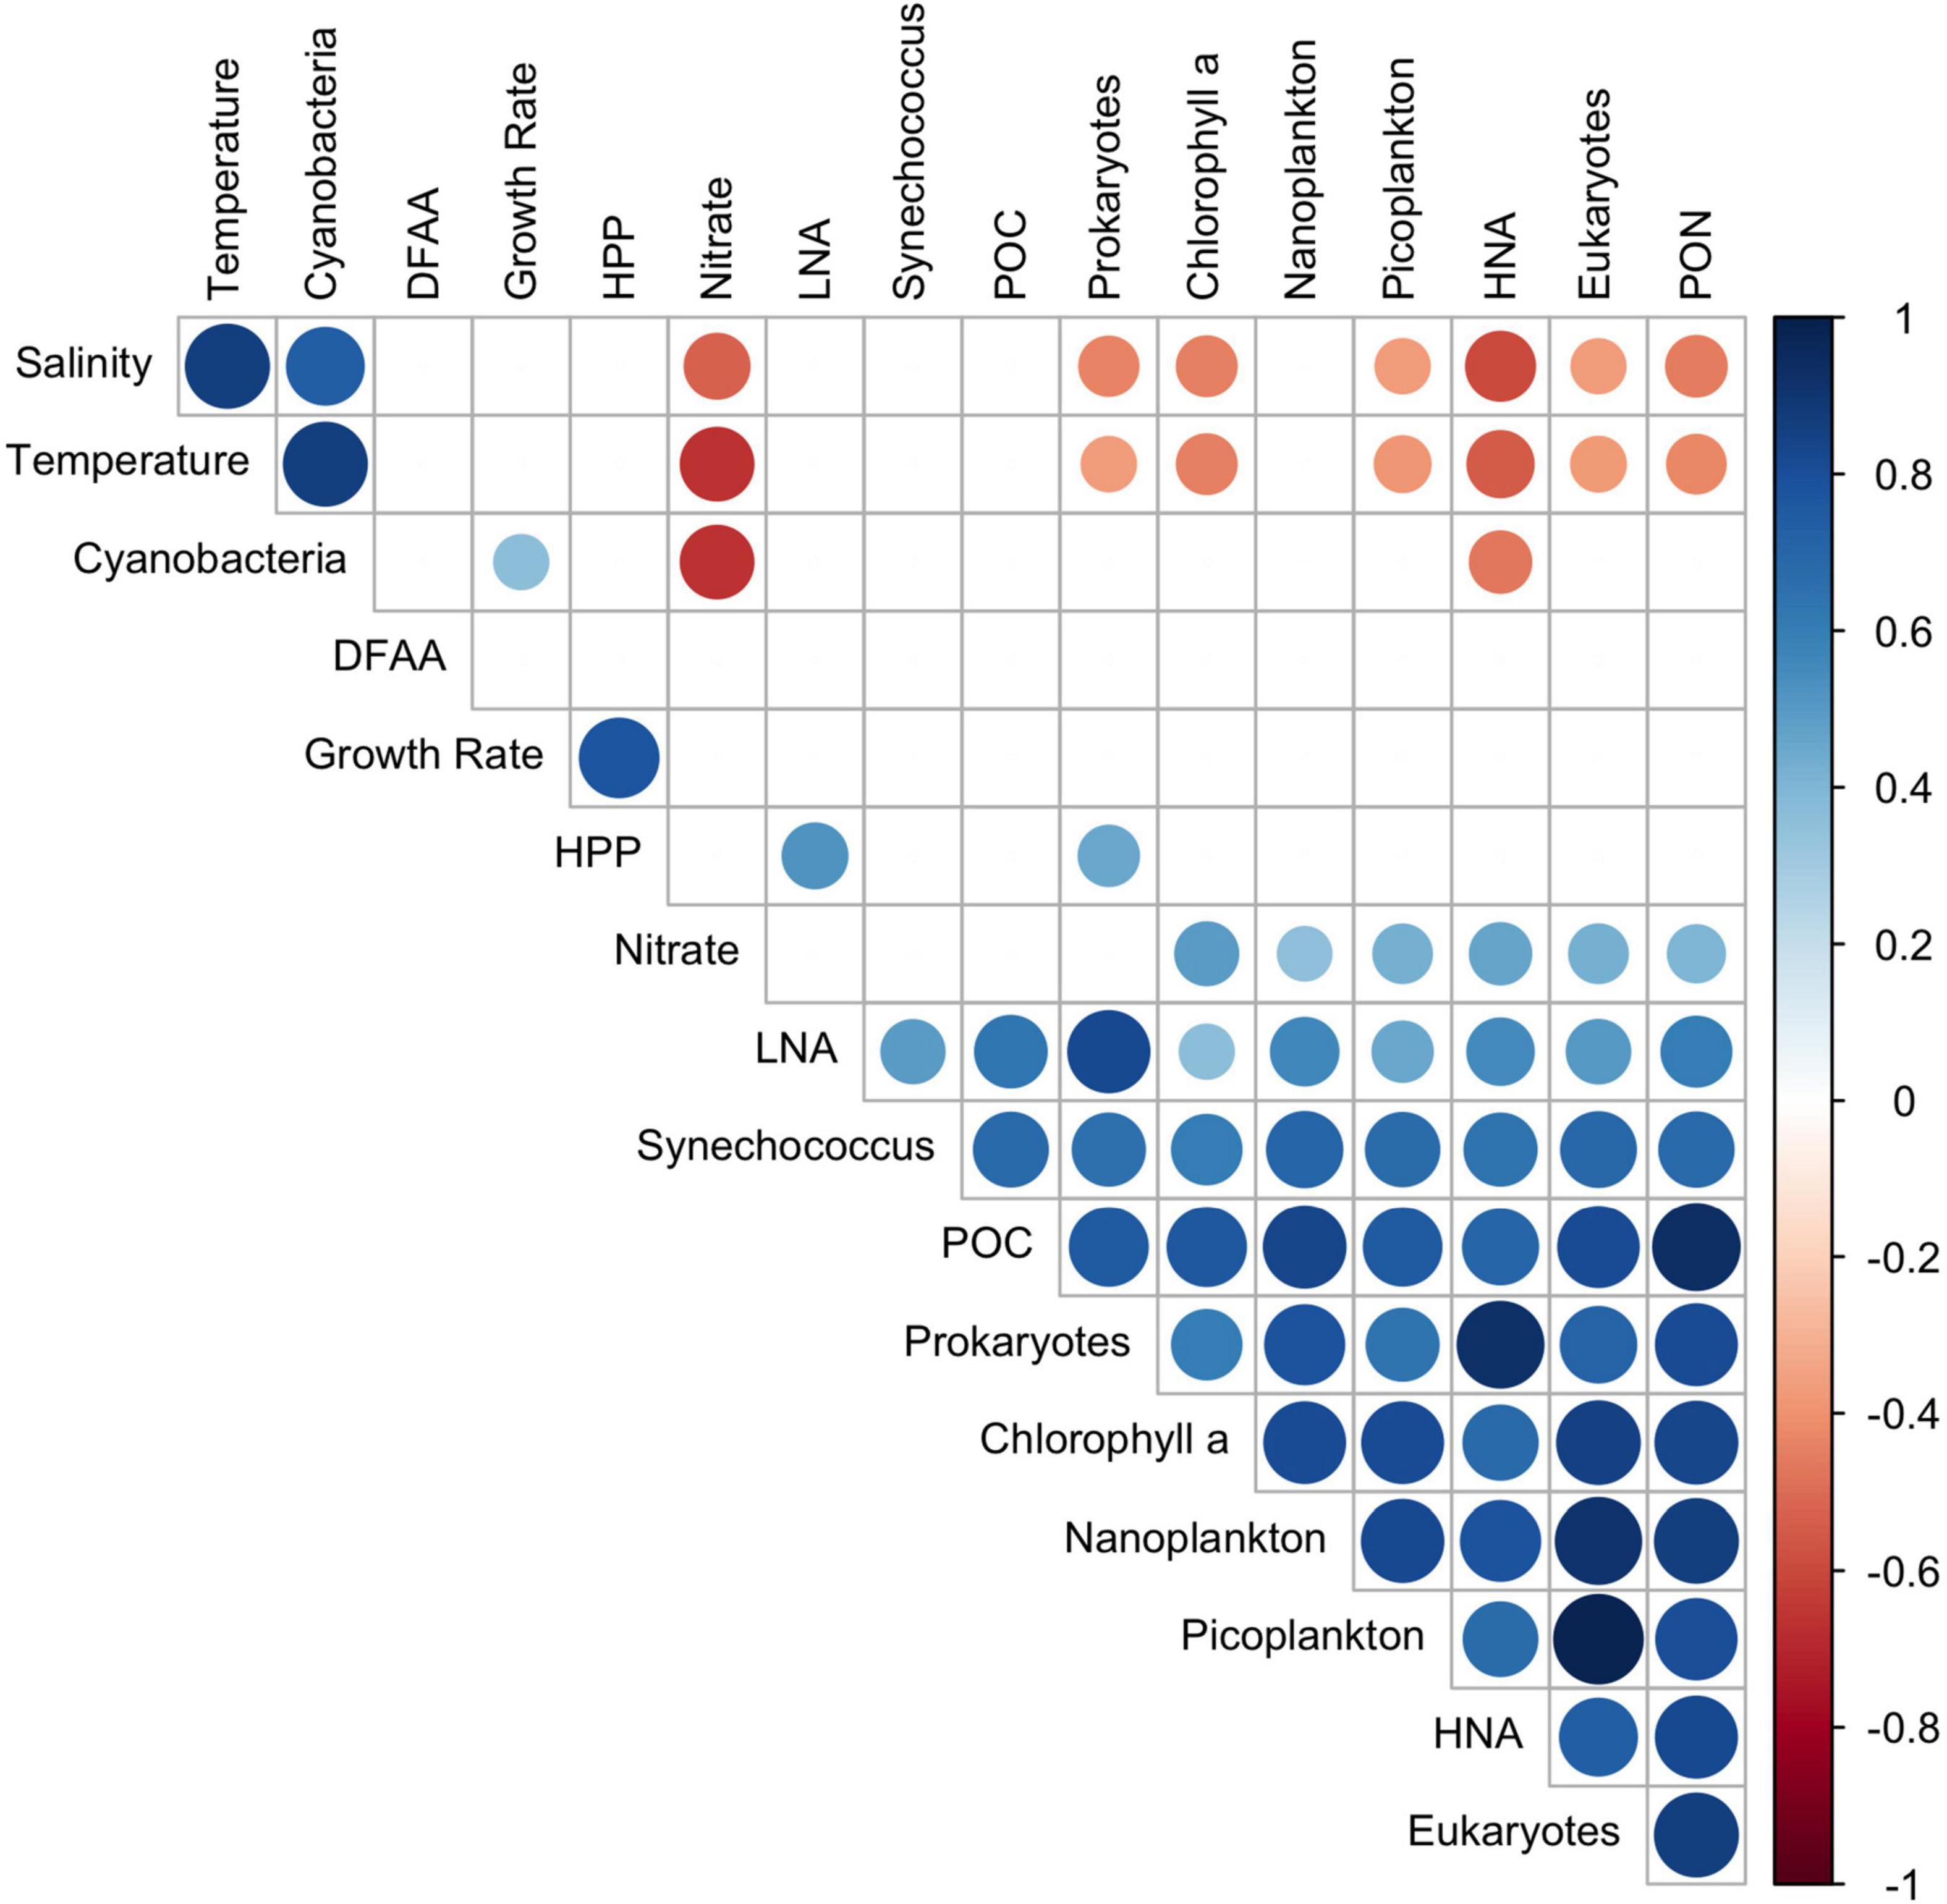
Figure 9. Pearson correlation matrix of pooled data of the depth range 20–100 m (and depth of the DCM) of 25 stations between 52°S and 59°N along the transect across the Pacific Ocean. Given are r-values of positive and negative correlations (p < 0.05).
Discussion
Biogeographic and Biogeochemical Properties
The biogeochemical and microbial data we assessed between subantarctic and subarctic regions of the Pacific Ocean exhibited large variations, reflecting the greatly varying temperature and nutrient regimes and related biogeochemical and microbial features. The PCA of the data in the upper 100 m illustrates these differences and shows a biogeographic clustering of the stations, mainly reflecting the differences in temperature and nitrate (PCA-axis 1). A subclustering along the PCA-axis 2 was evident, with a strong loading of the variables related to prokaryotic activities. This analysis reveals that these activities contributed substantially to the variance along the transect, even though they showed only few linear correlations with other variables. Raes et al. (2018, 2021) showed that numerous hydrographic and physico-chemical variables and the composition and functional traits of the microbial communities exhibited distinct biogeographic patterns between the Antarctic province and the equator in the Pacific Ocean. Hence, these and our data show that microbial features of the Pacific Ocean between the Antarctic province and BERS exhibit distinct biogeographic patterns. These observations generally correlate with the biogeographic provinces in the Pacific Ocean (Longhurst, 2007) and emphasize that this concept is also valid for many microbial features not previously considered in this context.
The latitudinal patterns of our data concur with the only other data set available for ocean basin-scale latitudinal transects in the Pacific Ocean (in addition to that assessed by Raes et al. (2018). Baldwin et al. (2005) assessed inorganic nutrients, Chl a, the abundance of Prochlorococcus, Synechococcus and total prokaryotes and leucine incorporation between Arctic and Antarctic regions of the Pacific. The latitudinal patterns of our data are also comparable to those from Atlantic Ocean transects (Zubkov et al., 2000; Hoppe et al., 2002), highlighting the similar latitudinal gradients in biogeochemical and microbial features of the Pacific and Atlantic Oceans.
All data sets show that variables related to the standing stock and growth of phytoplankton and auto- and heterotrophic prokaryotes have lowest values in the nutrient-depleted central oceanic gyres and the highest values in the frontal transition zones in the temperate and subpolar northern and southern hemisphere. The biogeographic differences in primary productivity and thus the sinking flux across the Pacific Ocean are also evident from sediment signatures. The deposition of biogenic opal was shown to reflect the biogeographic provinces of the Pacific Ocean with different trophic states (Hayes et al., 2014). Further, numbers of prokaryotes and the diversity of bacteria of the Roseobacter group in surface sediments are an imprint of the different biogeographic provinces of strongly different productivity (Pohlner et al., 2017).
Concentrations of Chl a, POC, PON and nitrate in the upper 100 m, which closely correlate with each other, exhibited low values in the permanently nutrient-depleted regions, but high values poleward beyond the subtropical front in both hemispheres. At the equatorial upwelling zone, values of these variables were slightly enhanced. High concentrations of Chl a with large regional and seasonal variations are a typical feature in the frontal zones of the north and south Pacific (Polovina et al., 2001; Longhurst, 2007; Raes et al., 2018). Prokaryotic cell counts, especially of HNA cells, followed the latitudinal patterns of Chl a, POC and PON. These latitudinal patterns are consistent with those of Baldwin et al. (2005). Turnover rate constants of glucose and acetate, proxies of the microbial turnover of carbohydrates and lipids and assessed for the first time in a latitudinal transect across the Pacific Ocean, exhibited similar patterns and indicate that these activities were closely related to prokaryotic abundance. Rates of Leu-AMP, a proxy for exo-peptidolytic activity, were also closely correlated with Chl a, POC, PON and prokaryotic abundance and indicate that proteinaceous substrates from phytoplankton and other particular sources were important substrates for heterotrophic prokaryotes. At least 82% of the Leu-AMP activity was observed in the < 3 μm size fraction, either attributable to free-living prokaryotes or to dissolved enzymes (Balmonte et al., 2021). Endo-peptidolytic activities were more evenly distributed along the latitudinal transect, and these activities by the particle-associated taxa peaked in tropical waters between 4°S and 10°N (Balmonte et al., 2021). Hence, endo-peptidolytic activity may have provided prokaryotes in these warm regions with substrates for HPP, which is in accordance with the enhanced turnover rate constants of DFAA in these regions (see below).
Hydrography, nutrient availability, primary production and related biogeochemical features undergo large seasonal fluctuations in different latitudinal regions of the Pacific Ocean (Kirchman et al., 1992; Polovina et al., 2001; Karl and Church, 2014, 2017). We are aware of the fact that sampling along a latitudinal transect cannot capture such seasonal variations. The intention of splitting the transect into two cruises was to investigate the temperate, subarctic and subantarctic regions, the regions with the most pronounced seasonal differences, during summer. This was achieved by sampling the NPPF and BER in early summer (May) and the SSCT and SANT in late austral summer (February).
Production, Growth and Composition of Heterotrophic Prokaryotic Communities
In contrast to prokaryotic abundance, turnover rate constants of DFAA, HPP and bulk growth rates exhibited the highest values in tropical regions and at the southern margin of the SPSG and low values in the central SPSG and the northern- and southernmost stations. These variables were not correlated to the above-mentioned biogeochemical and microbial variables, and were thus differently controlled. The regionally varying and low values in the colder regions suggest that temperature, substrate pulses, high mortality by grazing and virus infection affected growth of heterotrophic prokaryotic communities (Azam and Malfatti, 2007; Kirchman et al., 2009). DFAA incorporation comprised variable proportions of the C demand of HPP and higher proportions in the colder than in the warmer regions. The proportions we found are in the range reported from other subpolar and polar regions (Keil and Kirchman, 1991; Simon, 1991; Simon and Rosenstock, 2007). Dissolved glucose can also be an important substrate for pelagic prokaryotes (Kirchman et al., 2001). The extremely low concentrations of glucose, as well as the correlation between its turnover rate constant and prokaryotic cell numbers, underscore the importance of glucose as substrate for heterotrophic prokaryotes. As concentrations of glucose at most stations were below the detection limit, we were unable to calculate glucose incorporation rates. The close correlation of the acetate turnover rate constant with that of glucose and its general increase in colder, more nutrient-rich regions suggest that acetate, the final breakdown product of lipid and fatty acid metabolism, was also used as a C source of HPP. Dinoflagellates and diatoms, which exhibit high amounts of lipid storage material (Shin et al., 2000; Grosse et al., 2017), are the major constituents of phytoplankton in the temperate and subpolar regions of the Pacific Ocean (Polovina et al., 2001; Longhurst, 2007; Raes et al., 2018), regions where we measured high concentrations of Chl a, POC, and PON. However, as we did not measure acetate concentrations, we cannot quantify the proportion of the HPP C-demand met by uptake of this compound. In the Baltic Sea, the turnover rate constant of acetate correlated also closely with that of glucose and with HPP, but not with Chl a (Bunse et al., 2019). In the oxic epipelagic zone of the Cariaco Trench, uptake of acetate was reported to be a major substrate of HPP (Ho et al., 2002). These reports provide evidence that acetate is a highly relevant C source for HPP. Other substrates, in particular biopolymers such as dissolved proteins and polysaccharides are equally important substrates for HPP (Keil and Kirchman, 1999; Simon and Rosenstock, 2007; Teeling et al., 2016; Francis et al., 2021; see below).
Bulk growth rates of oceanic prokaryotic communities and along ocean-wide latitudinal transects have been rarely assessed recently, since many studies focus instead on determining the composition of prokaryotic communities by culture-independent approaches. Highest bulk growth rates of 0.4–2.3 d–1 we determined were in the range of those of model isolates of prominent groups of pelagic prokaryotes such as SAR11, SAR92 and Rhodobacteraceae determined in pure cultures (Cottrell and Kirchman, 2016). This indicates that growth of prokaryotic communities in the warm and nutrient-poor tropical Pacific can be as rapid as that of representative members of their most important groups under optimal growth conditions. However, cell numbers at ambient conditions were low, presumably due to low substrate concentrations, intense top-down control by protozoan grazing and viral lysis. We thus assume that the higher cell abundances in the colder regions indicate a relaxed top-down control of prokaryotic growth, a consequence of the lower growth rates in regions where primary producers are dominated by diatoms and dinoflagellates and grazing by crustacean zooplankton is more important (Longhurst, 2007; Raes et al., 2018). Furthermore, the high proportions of LNA prokaryotic cells in the permanently stratified warm (sub)tropical regions may at least partially be a result of the strong top-down control by protozoan grazing, which is size-dependent (Longnecker et al., 2010). In addition, the high proportion of LNA cells in the upper 60 m presumably reflects the dominance of prokaryotes with streamlined genomes such as the SAR11 clade (Giovannoni et al., 2014; Mende et al., 2017).
The prokaryotic communities were largely dominated by the SAR11 clade and Bacteroidetes (Cytophaga/Flavobacteria). Gammaproteobacteria and the Roseobacter group were also consistently detected, but contributed minor proportions to the communities. These findings are in line with previous reports from other oceanic regions in the Pacific and Atlantic Ocean (Schattenhofer et al., 2011; Tada et al., 2011; Alonso-Sáez et al., 2012; Morris et al., 2012; Reintjes et al., 2019b), but extend them across the entire central Pacific Ocean from subantarctic to subarctic regions. The bacterial groups detected by CARD-FISH constituted 21–76% of total prokaryotic cell counts, except for one station with only 7%, leaving room for other phylogenetic groups not targeted by the probes we applied. The highest proportions were detected in temperate and subpolar regions and lower proportions in (sub)tropical regions. Recent reports from the SPSG, NPSG and NPTG showed that SAR116, Aegaean-169, Rickettsiales and Prochlorococcus, groups not targeted by our probes, constitute prominent proportions of the prokaryotic epipelagic communities (Reintjes et al., 2019b; Kong et al., 2021), thus presumably constituting a considerable portion of the unidentified cells. Various studies have shown that the groups we detected dominate the uptake of amino acids and glucose (Mary et al., 2006; Elifantz et al., 2007; Malmstrom et al., 2007; Alonso-Sáez et al., 2012; Bakenhus et al., 2018) and actively dividing cells (Tada et al., 2013; Bakenhus et al., 2017). Our study further shows that at 20 m depth, numbers of Bacteroidetes were closely correlated to Chl a, POC, PON, nitrate and Leu-AMP and numbers of the SAR11 clade and the Roseobacter group also to POC and PON. In contrast, Gammaproteobacteria were only correlated to the turnover rate constant of glucose, in addition to correlations with other prokaryotic groups. These correlations imply that the organic matter cycling of the dominant groups was closely related to the availability of phytoplankton-derived substrates. Metatranscriptomics and metaproteomics have shed light on these metabolic interactions on a more refined taxonomic level (Teeling et al., 2016; Francis et al., 2021; Raes et al., 2021). β-GlcAse activity was not correlated to any of the bacterial groups we targeted by CARD-FISH. This may be due to the complexity of polysaccharide hydrolysis carried out by Carbohydrate Active enZymes (CAZymes) (Teeling et al., 2016; Reintjes et al., 2019a; Francis et al., 2021). These hydrolytic enzymes are key to supplying other bacteria with polysaccharide breakdown products. In fact, the analysis of six different CAZyme activities showed that between the northern margin of SPSG and NPPF laminarinase activity dominated, whereas in PSAG and BERS chondroitin sulfate hydrolysis rates were highest (Balmonte et al., 2021). This observation indicates that the complex pool of polysaccharides was differently composed in the different regions. The very low concentrations of DCCHO north of the NPPF where Bacteroidetes constituted relatively high proportions of the prokaryotic community, may be a result of the intense polysaccharide hydrolysis and subsequent consumption of the breakdown products.
Vertical Patterns
As the stratification of the epipelagic zone varies greatly among the different regions along the latitudinal transect, we assessed the vertical profiles of the biogeochemical and microbial variables. These analyses revealed a distinct vertical structure of the upper 200 m in the various provinces regarding hydrography, nutrient availability, biogeochemical and microbial properties. Profiles illustrate the close covariation of Chl a, POC, prokaryotic abundance, turnover rate constants of DFAA, glucose and acetate, HPP and prokaryotic bulk growth rates. Notably, HPP, growth rates and turnover rate constants of DFAA covaried vertically with Chl a, POC and prokaryotic abundance, whereas in the latitudinal transect they were not correlated. These patterns indicate the close stratification-related short-term and local coupling of abundance, growth and substrate turnover of the prokaryotic communities and substrate supply of the phytoplankton-derived organic matter. These features are not reflected in the analysis of variables at similar depths along the transect. In the other biogeochemical and microbial studies along transects in the Pacific and Atlantic Ocean, the predominant focus was on the latitudinal variability of surface measurements (Hoppe et al., 2002; Baldwin et al., 2005). Only Zubkov et al. (2000) assessed epipelagic depth-resolved prokaryotic abundance and biomass production, but they pooled the upper water column into three layers, limiting the vertical resolution. In order to comprehensively understand how microbial processes are related to and vary with biogeochemical features in different biogeographic provinces and of different hydrographic structures in the major oceans, the assessment of both latitudinal and vertical patterns is important.
Conclusion
Our investigation along a transect across the Pacific Ocean from subantarctic to subarctic regions revealed close correlations among microbial oceanographic and biogeochemical variables that corroborate the existence of distinct biogeographic provinces. Extremely low concentrations of nitrate in the permanently stratified epipelagic warm (sub)tropical gyres coincided with low values of Chl a, POC, PON, prokaryotic cell numbers and a dominance of LNA cells and the SAR11 clade. Turnover rate constants of glucose and acetate and Leu-AMP hydrolytic activities were also low in these gyres. All these variables strongly increased in the temperate transition zones and exhibited highest values in the subpolar regions. In contrast, rates of HPP and DFAA turnover were highest near the equator and exhibited low values in the cold subpolar regions, indicating different controls of these properties along the transect as compared to the microbial standing stock and phytoplankton biomass-related properties. In contrast to latitudinal variations, vertical profiles revealed close covariations among HPP, DFAA turnover and the other microbial and biogeochemical variables. This emphasizes the importance to assess both latitudinal and vertical patterns of such variables in large-scale transect studies. All these features together reveal distinct signatures of the different biogeographic provinces across the Pacific Ocean and show the usefulness to characterize oceanic biogeographic provinces also by microbial variables. Overall, this complementary picture of microbial activity and diversity in the hydrographic context substantially advances the ecological and biogeochemical understanding of the world’s largest ocean.
Data Availability Statement
The datasets presented in this study can be found in online repositories. The names of the repository/repositories and accession number(s) can be found below: https://doi.org/10.1594/PANGAEA.864673; https://doi.org/10.1594/PANGAEA.890453; https://doi.pangaea.de/10.1594/PANGAEA.918500.
Author Contributions
H-AG coordinated sampling on board, contributed to analysis and evaluation of hydrography, inorganic nutrients, Chl a, POC, PON, flow cytometric data, and contributed to writing the manuscript. CA and JB carried out the Leu-AMP and β-GlcAse analyses. TB coordinated and supervised the CTD-team during cruise SO248. IB carried out the CARD-FISH analyses. SB, GW, and MWi coordinated sample processing on board. RH coordinated the CTD-team during cruise SO254. BK prefiltered samples for amino acid and carbohydrate analyses on board, carried out part of the radioisotope work on board, and carried out the HPLC-analyses of DFAA and DCAA. FM carried out the statistical evaluations. LD provided statistical tools for flow cytometric data analysis on cyanobacteria. JM carried out the CTD-work during cruise SO254 and did the hydrographic analyses to characterize water masses. HW carried out the CTD-work during cruise SO248. MWo carried out flow cytometric analyses. MS designed the study, chief scientist of the cruises, carried out the radioisotope work and analyses, and wrote large parts of the manuscript. All authors read, revised, and approved the manuscript.
Funding
This work was supported by grants from the German Ministry of Education and Research (BMBF), BacGeoPac 03G0248A and PoriBacNewZ 03G0254A, and by Deutsche Forschungsgemeinschaft within the Collaborative Research Center TRR51 Roseobacter. CA and JB were supported by NSF OCE-1332881 and NSF OCE-1736772. CA would like to thank the Hanse Institute for Advanced Study (Delmenhorst, Germany) for a fellowship that helped support her participation in SO248.
Conflict of Interest
The authors declare that the research was conducted in the absence of any commercial or financial relationships that could be construed as a potential conflict of interest.
Publisher’s Note
All claims expressed in this article are solely those of the authors and do not necessarily represent those of their affiliated organizations, or those of the publisher, the editors and the reviewers. Any product that may be evaluated in this article, or claim that may be made by its manufacturer, is not guaranteed or endorsed by the publisher.
Acknowledgments
We thank Captain L. Mallon of RV Sonne and his entire crew for the excellent assistance during cruises SO248 and SO254. We gratefully acknowledge the help of N. Bergen, M. Dogs, B. Heyerhoff, and L. Wolter on board for sample processing, R. Weinert for analyses of DCCHO and C. Lehners and M. Habermann for assistance in the nitrate analysis. We thank C. Nagott for the chlorophyll analyses, P. Aldag for flow cytometric analyses of cyanobacteria and L. Wöhlbrand for technical support.
Supplementary Material
The Supplementary Material for this article can be found online at: https://www.frontiersin.org/articles/10.3389/fmars.2021.764383/full#supplementary-material
Footnotes
References
Alonso-Sáez, L., Sánchez, O., and Gasol, J. M. (2012). Bacterial uptake of low molecular weight organics in the subtropical Atlantic: are major phylogenetic groups functionally different? Limnol. Oceanogr. 57, 798–808. doi: 10.4319/lo.2012.57.3.0798
Arnosti, C. (2020a). Microbial enzyme activities: glucosidase and peptidase activities of bulk seawater samples from the RV\Sonne cruise SO248 in the South and North Pacific, along 180 W, May, 2016. Falmouth: Biological and Chemical Oceanography Data Management Office (BCO-DMO). doi: 10.26008/1912/bco-dmo.743224.1
Arnosti, C. (2020b). Microbial enzyme activities: glucosidase and peptidase activities of gravity filtered seawater samples from the RV\Sonne cruise SO248 in the South and North Pacific, along 180 W, May, 2016. Falmouth: Biological and Chemical Oceanography Data Management Office (BCO-DMO). doi: 10.26008/1912/bco-dmo.743320
Arnosti, C. (2020c). Microbial enzyme activities: polysaccharide hydrolase activities in bulk seawater samples from the RV\Sonne cruise SO248 in the South and North Pacific, along 180 W, May, 2016. Falmouth: Biological and Chemical Oceanography Data Management Office (BCO-DMO). doi: 10.26008/1912/bco-dmo.743054.1
Arnosti, C. (2020d). Microbial enzyme activities: polysaccharide hydrolase activities of gravity filtered seawater samples from the RV\Sonne cruise SO248 in the South and North Pacific, along 180 W, May, 2016. Falmouth: Biological and Chemical Oceanography Data Management Office (BCO-DMO). doi: 10.26008/1912/bco-dmo.743274.1
Arnosti, C., Steen, A. D., Ziervogel, K., Ghobrial, S., and Jeffrey, W. H. (2011). Latitudinal gradients in degradation of marine dissolved organic carbon. PLoS One 6:e28900. doi: 10.1371/journal.pone.0028900
Azam, F., and Malfatti, F. (2007). Microbial structuring of marine ecosystems. Nat. Rev. Microbiol. 5, 782–791. doi: 10.1038/nrmicro1747
Badewien, T. H., Winkler, H., Arndt, K. L., and Simon, M. (2016). Physical oceanography during SONNE cruise SO248 (BacGeoPac). Germany: Institute for Chemistry and Biology of the Marine Environment, Carl-von-Ossietzky University of Oldenburg, doi: 10.1594/PANGAEA.864673
Bakenhus, I., Dlugosch, L., Billerbeck, S., Giebel, H.-A., Milke, F., and Simon, M. (2017). Composition of total and cell-proliferating bacterioplankton community in early summer in the North Sea – roseobacters are the most active component. Front. Microbiol. 8:1771. doi: 10.3389/fmicb.2017.01771
Bakenhus, I., Dlugosch, L., Giebel, H.-A., Beardsley, C., Simon, M., and Wietz, M. (2018). Distinct biogeographic patterns of bacterioplankton composition and single-cell activity between the subtropics and Antarctica. Environ. Microbiol. 20, 3100–3108. doi: 10.1111/1462-2920.14383
Baldwin, A. J., Moss, J. A., Pakulski, J. D., Catala, P., Joux, F., and Jeffrey, W. H. (2005). Microbial diversity in a Pacific Ocean transect from the Arctic to Antarctic circles. Aquat. Microb. Ecol. 41, 91–102. doi: 10.3354/ame041091
Balmonte, J. P., Simon, M., Giebel, H.-A., and Arnosti, C. (2021). A sea change in microbial enzymes: heterogeneous latitudinal and depth-related gradients in bulk water and particle-associated enzymatic activities from 30°S to 59°N in the Pacific Ocean. Limnol. Oceanogr. 66, 3489–3507. doi: 10.1002/lno.11894
Brinkmeyer, R., Rappé, M., Gallacher, S., and Medlin, L. (2000). Development of clade- (Roseobacter and Alteromonas) and taxon-specific oligonucleotide probes to study interactions between toxic dinoflagellates and their associated bacteria. Eur. J. Phycol. 35, 315–329. doi: 10.1080/09670260010001735921
Bunse, C., Israelson, S., Baltar, F., Bertos-Fortis, M., Fridolfsson, E., Legrand, C., et al. (2019). High frequency multi-year variability in Baltic Sea microbial plankton stocks and activities. Front. Microbiol. 9:3296. doi: 10.3389/fmicb.2018.03296
Church, M. J., Ducklow, H. W., Letelier, R. M., and Karl, D. M. (2006). Temporal and vertical dynamics in picoplankton photoheterotrophic production in the subtropical North Pacific Ocean. Aquat. Microb. Ecol. 45, 41–53. doi: 10.3354/ame045041
Cottrell, M. T., and Kirchman, D. L. (2016). Transcriptional control in marine copiotrophic and oligotrophic bacteria with streamlined genomes. Appl. Environ. Microbiol. 82, 6010–6018. doi: 10.1128/AEM.01299-16
Ducklow, H. W. (1999). The bacterial component of the oceanic euphotic zone. FEMS Microbiol. Ecol. 30, 1–10. doi: 10.1111/j.1574-6941.1999.tb00630.x
Elifantz, H., Dittel, A. I., Cottrell, M. T., and Kirchman, D. L. (2007). Dissolved organic matter assimilation by heterotrophic bacterial groups in the western Arctic Ocean. Aquat. Microb. Ecol. 50, 39–49. doi: 10.3354/ame01145
Francis, T. B., Bartosik, D., Sura, T., Sichert, A., Hehemann, J. H., Markert, S., et al. (2021). Changing expression patterns of TonB-dependent transporters suggest shifts in polysaccharide consumption over the course of a spring phytoplankton bloom. ISME J. 15, 2336–2350. doi: 10.1038/s41396-021-00928-8
Ghiglione, J. F., Galand, P. E., Pommier, T., Pedrós-Alió, C., Maas, E. W., Bakker, K., et al. (2012). Pole-to-pole biogeography of surface and deep marine bacterial communities. Proc. Natl. Acad. Sci. U. S. A. 109, 17633–17638. doi: 10.1073/pnas.1208160109
Giebel, H.-A., Aldag, P., Arndt, K. L., Arnosti, C., Badewien, T. H., and Bakenhus, I. (2020). Hydrography, Biogeochemistry, Microbial Population, Growth and Substrate Dynamics Between Subarctic and Subantarctic Waters in the Pacific Ocean During the Cruises SO248 and SO254 with RV Sonne. Bremerhaven: PANGAEA. doi: 10.1594/PANGAEA.918500
Giebel, H.-A., Wolterink, M., Brinkhoff, T., and Simon, M. (2019). Complementary energy acquisition via aerobic anoxygenic photosynthesis and carbon monoxide oxidation by Planktomarina temperata of the Roseobacter group. FEMS Microb. Ecol. 95:fiz050. doi: 10.1093/femsec/fiz050
Giovannoni, S. J., Thrash, J. C., and Temperton, B. (2014). Implications of streamlining theory for microbial ecology. ISME J. 8, 1553–1565. doi: 10.1038/ismej.2014.60
Grosse, J., Burson, A., Huisman, J., and Boschker, H. T. S. (2017). From ecological stoichiometry to biochemical composition: variation in N and P supply alters key biosynthetic rates in marine phytoplankton. Front. Microbiol. 8:1299. doi: 10.3389/fmicb.2017.01299
Hahnke, S., Sperling, M., Langer, T., Wichels, A., Gerdts, G., and Beardsley, C. (2013). Distinct seasonal growth patterns of the bacterium Planktotalea frisia in the North Sea and specific interaction with phytoplankton algae. FEMS Microb. Ecol. 86, 185–199. doi: 10.1111/1574-6941.12151
Hayes, C. T., Anderson, R. F., Fleisher, M. Q., Serno, S., Winckler, G., and Gersonde, R. (2014). Biogeography in 231Pa/230Th ratios and a balanced 231Pa budget for the Pacific Ocean. Earth Planet. Sci. Lett. 391, 307–318. doi: 10.1016/j.epsl.2014.02.001
Ho, T.-Y., Scranton, M. I., Taylor, G. T., Varela, R., Thunell, R. C., and Muller-Karger, F. (2002). Acetate cycling in the water column of the Cariaco Basin: seasonal and vertical variability and implication for carbon cycling. Limnol. Oceangr. 47, 1119–1128. doi: 10.4319/lo.2002.47.4.1119
Hoppe, H.-G., Gocke, K., Koppe, R., and Begler, C. (2002). Bacterial growth and primary production along a north-south transect of the Atlantic Ocean. Nature 416, 168–171. doi: 10.1038/416168a
Karl, D. M., and Church, M. J. (2014). Microbial oceanography and the Hawaii Ocean Time-series programme. Nat. Rev. Microbiol. 12, 699–713. doi: 10.1038/nrmicro3333
Karl, D. M., and Church, M. J. (2017). Ecosystem structure and dynamics in the north Pacific subtropical gyre: new views of an old ocean. Ecosystems 20, 433–457. doi: 10.1007/s10021-017-0117-0
Kattner, G. (1999). Storage of dissolved inorganic nutrients in seawater: poisoning with mercuric chloride. Mar. Chem. 67, 61–66. doi: 10.1016/S0304-4203(99)00049-3
Keil, R. G., and Kirchman, D. L. (1991). Contribution of dissolved free amino acids and ammonium to the nitrogen requirements of heterotrophic bacterioplankton. Mar. Ecol. Prog. Ser. 73, 1–10.
Keil, R. G., and Kirchman, D. L. (1999). Utilization of dissolved protein and amino acids in the northern Sargasso Sea. Aquat. Microb. Ecol. 18, 293–300. doi: 10.3354/ame018293
Kirchman, D. L., Keil, R. G., Simon, M., and Welschmeyer, N. A. (1992). Biomass and production of heterotrophic bacterioplankton in the oceanic subarctic Pacific. Deep Sea Res. 1 Oceanogr. Res. Pap. 40, 967–988. doi: 10.1016/0967-0637(93)90084-G
Kirchman, D. L., Meon, B., Ducklow, H. W., Carlson, C. A., Hansell, D. A., and Steward, G. F. (2001). Glucose fluxes and concentrations of dissolved combined neutral sugars (polysaccharides) in the Ross Sea and Polar Front Zone, Antarctica. Deep Sea Res. 2 Top. Stud. Oceanogr. 48, 4179–4197. doi: 10.1016/S0967-0645(01)00085-6
Kirchman, D. L., Morán, X. A. G., and Ducklow, H. W. (2009). Microbial growth in the polar oceans — role of temperature and potential impact of climate change. Nat. Rev. Microbiol. 7, 451–459. doi: 10.1038/nrmicro2115
Kong, J., Liu, X., Wang, L., Huang, H., Ou, D., Guo, J., et al. (2021). Patterns of relative and quantitative abundances of marine bacteria in surface waters of the subtropical northwest Pacific Ocean estimated with high-throughput quantification sequencing. Front. Microbiol. 11:599614. doi: 10.3389/fmicb.2020.599614
Longnecker, K., Wilson, M. J., Sherr, E. B., and Sherr, B. F. (2010). Effect of top-down control on cell-specific activity and diversity of active marine bacterioplankton. Aquat. Microb. Ecol. 58, 153–165. doi: 10.3354/ame01366
Lunau, M., Lemke, A., Dellwig, O., and Simon, M. (2006). Physical and biogeochemical controls of microaggregate dynamics in a tidally affected coastal ecosystem. Limnol. Oceanogr. 51, 847–859. doi: 10.4319/lo.2006.51.2.0847
Malmstrom, R. R., Straza, T. R. A., Cottrell, M. T., and Kichman, D. L. (2007). Diversity, abundance, and biomass production of bacterial groups in the western Arctic Ocean. Aquat. Microb. Ecol. 47, 45–55. doi: 10.3354/ame047045
Manz, W., Amann, R., Ludwig, W., Vancanneyt, M., and Schleifer, K.-H. (1996). Application of a suite of 16S rRNA-specific oligonucleotide probes designed to investigate bacteria of the phylum Cytophaga-flavobacter-bacteroides in the natural environment. Microbiology 142, 1097–1106. doi: 10.1099/13500872-142-5-1097
Manz, W., Amann, R., Ludwig, W., Wagner, M., and Schleifer, K.-H. (1992). Phylogenetic oligodeoxynucleotide probes for the major subclasses of Proteobacteria: problems and solutions. Syst. Appl. Microbiol. 15, 593–600. doi: 10.1016/S0723-2020(11)80121-9
Marie, D., Partensky, F., Jacquet, S., and Vaulot, D. (1997). Enumeration and cell cycle analysis of natural populations of marine picoplankton by flow cytometry using the nucleic acid stain SYBR Green I. Appl. Environ. Microbiol. 63, 186–193. doi: 10.1128/aem.63.1.186-193.1997
Mary, I., Heywood, J. L., Fuchs, B. M., Amann, R., Tarran, G. A., Burkill, P. H., et al. (2006). SAR11 dominance among metabolically active low nucleic acid bacterioplankton in surface waters along an Atlantic meridional transect. Aquat. Microb. Ecol. 45, 107–113. doi: 10.3354/ame045107
Mende, D. R., Bryant, J. A., Aylward, F. O., Eppley, J. M., Nielsen, T., Karl, D. M., et al. (2017). Environmental drivers of a microbial genomic transition zone in the ocean’s interior. Nat. Microbiol. 2, 1367–1373. doi: 10.1038/s41564-017-0008-3
Milici, M., Tomasch, J., Wos-Oxley, M. L., Wang, H., Jáuregui, R., and Camarinha-Silva, A. (2016). Low diversity of planktonic bacteria in the tropical ocean. Sci. Rep. 6:19054. doi: 10.1038/srep19054
Mopper, K., Schultz, C. A., Chevolot, L., Germain, C., Revuelta, R., and Dawson, R. (1992). Determinations of sugars in unconcentrated seawater and other natural waters by liquid chromatography and pulsed ampereometric detection. Environ. Sci. Technol. 26, 133–138.
Morris, R. M., Frazer, C. D., and Carlson, C. A. (2012). Basin-scale patterns in the abundance of SAR11 subclades, marine Actinobacteria (OM1), members of the Roseobacter clade and OCS116 in the South Atlantic. Environ. Microbiol. 14, 1133–1144. doi: 10.1111/j.1462-2920.2011.02694.x
Nagata, T., Fukuda, H., Fukuda, R., and Koike, I. (2000). Bacterioplankton distribution and production in deep Pacific waters: large-scale geographic variations and possible coupling with sinking particle fluxes. Limnol. Oceanogr. 45, 426–435. doi: 10.4319/lo.2000.45.2.0426
Oksanen, J., Guillaume Blanchet, F., Friendly, M., Kindt, R., Legendre, P., and McGlinn, D. (2019). vegan: Community Ecology Package. R package version 2.5-6. Available online at: https://CRAN.R-project.org/package=vegan (accessed June 28, 2021).
Pohlner, M., Degenhardt, J., von Hoyningen-Huene, A. J. E., Wemheuer, B., Erlmann, N., and SChnetger, B. (2017). The biogeographical distribution of benthic Roseobacter group members along a Pacific transect is structured by nutrient availability within the sediments and primary production in different oceanic provinces. Front. Microbiol. 8:2550. doi: 10.3389/fmicb.2017.02550
Polovina, J. J., Howell, E., Kobayashi, D. R., and Seki, M. S. (2001). The transition zone chlorophyll front, a dynamic global feature defining migration and forage habitat for marine resources. Prog. Oceanogr. 49, 469–483. doi: 10.1016/S0079-6611(01)00036-2
R Core Team (2019). R: A language and environment for statistical computing. Vienna: R Foundation for Statistical Computing. URL https://www.R-project.org/
Raes, E. J., Bodrossy, L., van de Kamp, J., Bissett, A., Ostrowski, M., and Brown, M. V. (2018). Oceanographic boundaries constrain microbial diversity gradients in the South Pacific Ocean. Proc. Natl. Acad. Sci. U. S. A. 115, E8266–E8275. doi: 10.1073/pnas.1719335115
Raes, E. J., Karsh, K., Sow, S. L. S., Ostrowski, M., Brown, M. V., and van de Kamp, J. (2021). Metabolic pathways inferred from a bacterial marker gene illuminate ecological changes across South Pacific frontal boundaries. Nat. Commun. 12:2213. doi: 10.1038/s41467-021-22409-4
Rappé, M. S., Connon, S. A., Vergin, K. L., and Giovannoni, S. J. (2002). Cultivation of the ubiquitous SAR11 marine bacterioplankton clade. Nature 418, 630–633. doi: 10.1038/nature00917
Reintjes, G., Tegetmeyer, H. E., Bürgisser, M., Orlic, S., Tews, I., and Zubkov, M. (2019b). On-site analysis of bacterial communities of the ultraoligotrophic south Pacific gyre. Appl. Environ. Microbiol. 85, e00184–19. doi: 10.1128/AEM.00184-19
Reintjes, G., Arnosti, C., Fuchs, B., and Amann, R. (2019a). Selfish, sharing and scavenging bacteria in the Atlantic Ocean: a biogeographical study of bacterial substrate utilization. ISME J. 13, 1119–1132. doi: 10.1038/s41396-018-0326-3
Ribeiro, C. G., Marie, D., dos Santos, A. L., Bandini, F. P., and Vaulot, D. (2016). Estimating microbial populations by flow cytometry: comparison between instruments. Limnol. Oceanogr. Methods 14, 750–758. doi: 10.1002/lom3.10135
Schattenhofer, M., Wulf, J., Kostadinov, I., Glöckner, F. O., Zubkov, M. V., and Fuchs, B. M. (2011). Phylogenetic characterisation of picoplanktonic populations with high and low nucleic acid content in the North Atlantic Ocean. Syst. Appl. Microbiol. 34, 470–475. doi: 10.1016/j.syapm.2011.01.008
Schlitzer, R. (2015). Data analysis and visualization with Ocean Data View. CMOS Bulletin SCMO 43, 9–13.
Schnetger, B., and Lehners, C. (2014). Determination of nitrate plus nitrite in small volume marine water samples using vanadium(III)chlorid as a reduction agent. Mar. Chem. 160, 91–98. doi: 10.1016/j.marchem.2014.01.010
Shin, K. H., Hama, T., Yoshie, N., Noriki, S., and Tsunogai, S. (2000). Dynamics of fatty acids in newly biosynthesized phytoplankton cells and seston during a spring bloom off the west coast of Hokkaido Island, Japan. Mar. Chem. 70, 243–256. doi: 10.1016/S0304-4203(00)00030-X
Simon, M. (1991). Isotope dilution of intracellular amino acids as a tracer of carbon and nitrogen sources of marine planktonic bacteria. Mar. Ecol. Prog. Ser. 74, 295–301.
Simon, M., and Azam, F. (1989). Protein content and protein synthesis rates of planktonic marine bacteria. Mar. Ecol. Prog. Ser. 51, 201–213.
Simon, M., and Rosenstock, B. (2007). Different coupling of dissolved amino acid, protein, and carbohydrate turnover to heterotrophic picoplankton production in the Southern Ocean in austral summer and fall. Limnol. Oceanogr. 52, 85–95. doi: 10.4319/lo.2007.52.1.0085
Simon, M., Rosenstock, B., and Zwisler, W. (2004). Coupling of epipelagic and mesopelagic heterotrophic picoplankton production to phytoplankton biomass in the Antarctic Polar Frontal Region. Limnol. Oceanogr. 49, 1035–1043. doi: 10.4319/lo.2004.49.4.1035
Sunagawa, S., Coelho, L. P., Chaffron, S., Kultima, J. R., Labadie, K., and Salazar, G. (2015). Structure and function of the global ocean microbiome. Science 348:1261359. doi: 10.1126/science.1261359
Tada, Y., Makabe, R., Kasamatsu-Takazawa, N., Taniguchi, A., and Hamasaki, K. (2013). Growth and distribution patterns of Roseobacter/Rhodobacter, SAR11, and Bacteroidetes lineages in the Southern Ocean. Polar Biol. 36, 691–704. doi: 10.1007/s00300-013-1294-8
Tada, Y., Taniguchi, A., Nagao, I., Miki, T., Uematsu, M., Tsuda, A., et al. (2011). Differing growth responses of major phylogenetic groups of marine bacteria to natural phytoplankton blooms in the western north Pacific Ocean. Appl. Environ. Microbiol. 77, 4055–4065. doi: 10.1128/AEM.02952-10
Teeling, H., Fuchs, B. F., Bennke, C. M., Krüger, K., Chafee, M., and Kappelmann, L. (2016). Recurring patterns in bacterioplankton dynamics during coastal spring algae blooms. Elife 5:e11888. doi: 10.7554/eLife.11888
Tremblay, J. E., Lucas, M. I, Kattner, G., Pollard, R., Strass, V. H., Bathmann, U., et al. (2002). Significance of the Polar Frontal Zone for large-sized diatoms and new production during summer in the Atlantic sector of the Southern Ocean. Deep-Sea Res. II 49, 3793–3812. doi: 10.1016/S0967-0645(02)00111-X
Wilson, S. E., Steinberg, D. K., Chu, F. L. E., and Bishop, J. K. B. (2010). Feeding ecology of mesopelagic zooplankton of the subtropical and subarctic North Pacific Ocean determined with fatty acid biomarkers. Deep Sea Res. I 57, 1278–1294. doi: 10.1016/j.dsr.2010.07.005
Yokokawa, T., Yang, Y. H., Motegi, C., and Nagata, T. (2013). Large-scale geographical variation in prokaryotic abundance and production in meso- and bathypelagic zones of the central Pacific and Southern Ocean. Limnol. Oceanogr. 58, 61–73. doi: 10.4319/lo.2013.58.1.0061
Zielinski, O., Henkel, R., Meier, D., Meyerjürgens, J., Simon, M., and Voß, D. (2018). Physical oceanography during SONNE cruise SO254 (PoriBacNewZ). Germany: Institute for Chemistry and Biology of the Marine Environment, Carl-von-Ossietzky University of Oldenburg. doi: 10.1594/PANGAEA.890453
Zubkov, M. V., Sleigh, M. A., Burkill, P. H., and Leakey, R. J. G. (2000). Bacterial growth and grazing loss in contrasting areas of North and South Atlantic. J. Plankton Res. 22, 685–711. doi: 10.1093/plankt/22.4.685
Keywords: Pacific Ocean, biogeography, chlorophyll, bacteria, growth rates, labile substrates, flow cytometry, CARD-FISH
Citation: Giebel H-A, Arnosti C, Badewien TH, Bakenhus I, Balmonte JP, Billerbeck S, Dlugosch L, Henkel R, Kuerzel B, Meyerjürgens J, Milke F, Voss D, Wienhausen G, Wietz M, Winkler H, Wolterink M and Simon M (2021) Microbial Growth and Organic Matter Cycling in the Pacific Ocean Along a Latitudinal Transect Between Subarctic and Subantarctic Waters. Front. Mar. Sci. 8:764383. doi: 10.3389/fmars.2021.764383
Received: 25 August 2021; Accepted: 23 November 2021;
Published: 13 December 2021.
Edited by:
Jarone Pinhassi, Linnaeus University, SwedenReviewed by:
Peng Xing, Nanjing Institute of Geography and Limnology, Chinese Academy of Sciences (CAS), ChinaKasia Piwosz, National Marine Fisheries Research Institute, Poland
Copyright © 2021 Giebel, Arnosti, Badewien, Bakenhus, Balmonte, Billerbeck, Dlugosch, Henkel, Kuerzel, Meyerjürgens, Milke, Voss, Wienhausen, Wietz, Winkler, Wolterink and Simon. This is an open-access article distributed under the terms of the Creative Commons Attribution License (CC BY). The use, distribution or reproduction in other forums is permitted, provided the original author(s) and the copyright owner(s) are credited and that the original publication in this journal is cited, in accordance with accepted academic practice. No use, distribution or reproduction is permitted which does not comply with these terms.
*Correspondence: Meinhard Simon, bS5zaW1vbkBpY2JtLmRl
†Present address: John Paul Balmonte, HADAL and NordCEE, Department of Biology, University of Southern Denmark, Odense, Denmark; Matthias Wietz, Alfred Wegener Institute Helmholtz Centre for Polar and Marine Research, Am Handelshafen, Bremerhaven, Germany