 Giulia Vitale
 Arnau L. Dedeu
 Marta Pujol1,2
 Valerio Sbragaglia
- 1Department of Marine Renewable Resources, Institute of Marine Sciences (ICM-CSIC), Barcelona, Spain
- 2Catalan Institute for Ocean Governance Research (ICATMAR – Direcció General de Política Marítima i Pesca Sostenible), Barcelona, Spain
Social media may provide information for monitoring recreational fisheries, but several caveats prevent operationalization. Specifically, the fraction and profile of recreational fishers sharing their catches is not known. Our aim was to advance the monitoring capacities of recreational fishing using social media data. We collected data with onsite (face-to-face) survey and online (emails) questionnaires to characterize marine recreational fishers sharing catches on digital platforms (“sharers”) along with other demographic or fishing information. In the online survey we found that 38% of recreational fishers share their catches using digital platforms (including the private messaging platform WhatsApp), but such proportion dropped to 12% when considering only public or semi-public social media (Instagram was the most commonly used platform, followed by Facebook, YouTube, and Twitter). A similar pattern was found with the online questionnaire where sharers represented 37% of recreational fishers (including WhatsApp), while such proportion dropped to 21% when considering only public or semi-public social media. In general, sharers were more avid (24 and 35 yearly fishing trips for onsite and online survey, respectively) compared to non-sharers (18 and 31 yearly fishing trips). Sharers also spent more money on each fishing trip (on average 26 and 31 euro for onsite and online survey, respectively) than non-sharers (on average 21 and 28 euro for onsite and online survey, respectively), but they had similar chances of catching something. However, for fishers with catches, the harvest per unit effort of sharers was higher than that of non-sharers (0.4 and 0.5 kg/h with respect to 0.3 and 0.4 kg/h, for onsite and online survey, respectively). Moreover, recreational fishers that caught trophy, iconic, or emblematic species were more inclined to share their catches. This study represents an important advancement for integrating social media data into the monitoring of recreational fishing.
Introduction
Recreational fisheries represent an important component of global fisheries (Cooke and Cowx, 2004; Arlinghaus et al., 2019), as worldwide recreational fishers represent more than 5 times the number of professional fishers (Bank, 2012; Arlinghaus et al., 2019). For example, European marine recreational fishers are estimated to add up to 8.7 million (1.6% of the total population); they take an estimated 77.6 million fishing trips per year and spend €5.9 billion annually (Hyder et al., 2018). Despite their relevance, recreational fisheries have historically lacked robust data collection systems. Most common monitoring approaches for recreational fisheries are on-site surveys (e.g., face-to-face interviews) or off-site methods such as mail, telephone, or e-mail questionnaires (Pollock et al., 1994; Peramos and Andersens, 2016). However, these methods are generally expensive, time-consuming, and often limited in space and time. The digital transformation of societies offers novel alternative monitoring methods such as smartphone applications, which are gaining increasing attention as recreational fishing monitoring tools (Venturelli et al., 2017; Skov et al., 2021).
In recent years, several studies have found uses for data mining on digital platforms to inform about recreational fisheries (Shiffman et al., 2017; Giovos et al., 2018; Monkman et al., 2018; Giglio et al., 2020; Sbragaglia et al., 2020). For example, data mined on YouTube allowed finding that recreational fishing catches in Mediterranean EU countries target similar species, and that potential differences are mainly related to the use of different fishing techniques (Giovos et al., 2018). Similarly, Sbragaglia et al. (2020), showed that data mined on YouTube can reveal differences in harvesting patterns and social dimensions between recreational spearfishers and anglers. Although data mining on digital social platforms has been considered a promising method for monitoring recreational fishing (Brownscombe et al., 2019), there are several caveats and limitations that prevent the operationalization of these methodologies (Jarić et al., 2020). We designed this study to address some of these limitations and to contribute to the integration and operationalization of monitoring recreational fishing using social media data.
The main current limitation for monitoring recreational fishing catches using data from social media is that the proportion of recreational fishers sharing their catches on digital platforms is unknown; consequently, extrapolations to whole recreational fishers’ populations are unadvisable. Moreover, it is crucial to understand whether recreational fishers who share their catches on social media differ in their demographic parameters and fishing characteristics from those who do not share their catches. For example, recreational fishers sharing their catches on social media are expected to be younger than those who do not share them, because social media users are younger than non-social media users (Anderson and Center, 2018). In terms of fishing modalities, recreational spearfishers could share more frequently on social media, since their catches usually generate more social engagement (Sbragaglia et al., 2020). Moreover, recreational fishers that share their activity on social media can also be expected to be more avid (i.e., they spend much of their spare time fishing; Griffiths et al., 2013; Rocklin et al., 2014). Similarly, specialized anglers are more prone to appear in traditional media such as magazines (Ditton et al., 1992), a trend that could be replicated in some measure by social media users. It is also conceivable that fishers who share on social media may spend more money on their activity due to their higher avidity and degree of specialization. Finally, recreational fishers who share their catches on social media could be more specialized in fishing trophy, iconic, or emblematic species because these posts could receive higher engagement by followers (Sbragaglia et al., 2020). Data mined from social media therefore cannot be used as a robust monitoring tool until the subset of recreational fishers sharing their catches are adequately profiled. The aim of this work is to fill this knowledge gap by providing instrumental information to advance monitoring capacities of recreational fishing using social media.
To do so, we used data from an ongoing monitoring program in Catalonia (north-western Mediterranean Sea, Spain). In particular, we used data collected during onsite (face-to-face interviews) and on-line questionnaires (sent by e-mail) to estimate the proportion of recreational fishers sharing their catches on different digital platforms in relation with other information such as age, fishing modality, avidity, catch per unit effort, economic expenditure, and species caught.
Materials and Methods
Data used for this study were provided by the Catalan Institute of Research for Ocean Governance (ICATMAR) that recently began a comprehensive marine recreational fishing monitoring program that includes data collection from on-site surveys conducted along the Catalan coast (north-western Mediterranean Sea, Spain), and from online questionnaires that were sent to license holders. The two methods are used in parallel to minimize data quality issues following previous knowledge on methodological strengths and shortcomings (Pollock et al., 1994; Andersens, 2010; Zarauz et al., 2015; Peramos and Andersens, 2016; Lewin et al., 2021). The combined methodology was first tried in a pilot test conducted in 2019 (ICATMAR, 2021) and was expanded in 2020 to become a long-term monitoring system.
Data collected from both the online and onsite surveys were provided voluntarily by respondents and were stored in a database subjected to the EU 2016/679 personal data protection regulation. Data obtained from both surveys are anonymous; online questionnaires specifically could not track back the license user responding the survey.
Onsite Surveys
The data presented here represent 84 days of onsite sampling from January to December 2020. The sampling effort was spatially distributed according to the subdivision of the Catalan coast into 11 zones (Figure 1). The sample plan distributed effort equally across seasons and zones, but in several cases re-programming was made due to COVID-19 restrictions, which were in place from March 14th until June 1st (see Supplementary Table 2 and Supplementary Text 1). Sampling days within the seasons were semi-randomized (attributing a 70% chance to weekends and holidays and a 30% chance to weekdays). The sampled segments within the zones were chosen according to fisher frequency in order to maximize responses according to previous knowledge (ICATMAR, 2021). Three different types of sampling approaches were conducted: access point surveys (at ports) and roving creel surveys (on foot and on motorboat). Port samplings were designed to obtain responses from boat fishers and spearfishers who initiate the activity from a boat. The ports within each zone with highest marine recreational fishing activity were selected according to previous knowledge (ICATMAR, 2021). Sampling outings lasted 6 h and were conducted around noon, which is the time most recreational fishers come back to port. Land and motorboat samplings interviewed shore fishers and spearfishers during their activity. Land surveys were conducted in specific zones (Figure 1), by scanning segments by car or other vehicles in search for shore recreational fishing activity; fishers were identified, approached by foot and interviewed on the spot. Samplings lasted 6 h and were conducted at peak frequency times (noon and midnight; ICATMAR, 2021). Motorboat samplings were conducted only during daytime peak activity (from 09:00 to 15:00; ICATMAR, 2021). Spearfishers were approached and interviewed in situ. Shore fishing was sampled by disembarking near the fishing spot and interviewing fishers on land. Of the two seasonal sampling days programmed per zone, one was conducted in a port, and one was done either by foot or by motorboat depending on the segment’s accessibility (see whole 2020 survey sampling and COVID-19 re-programming in Supplementary Text 1). Surveyors were expert marine recreational fishers with knowledge about the sector and experience in identifying target species. Questions included information on fishing modality, social profile (age and gender), use of digital platforms to share catches (Facebook, Instagram, WhatsApp, YouTube, and others), number of fishing trips during the past 12 months (hereafter referred to as “avidity”) and hours spent fishing, economic expenditure (on bait and gear, boat fuel, meals, accommodation, and port services), and catches (species identified, measured, and weighted; Table 1).
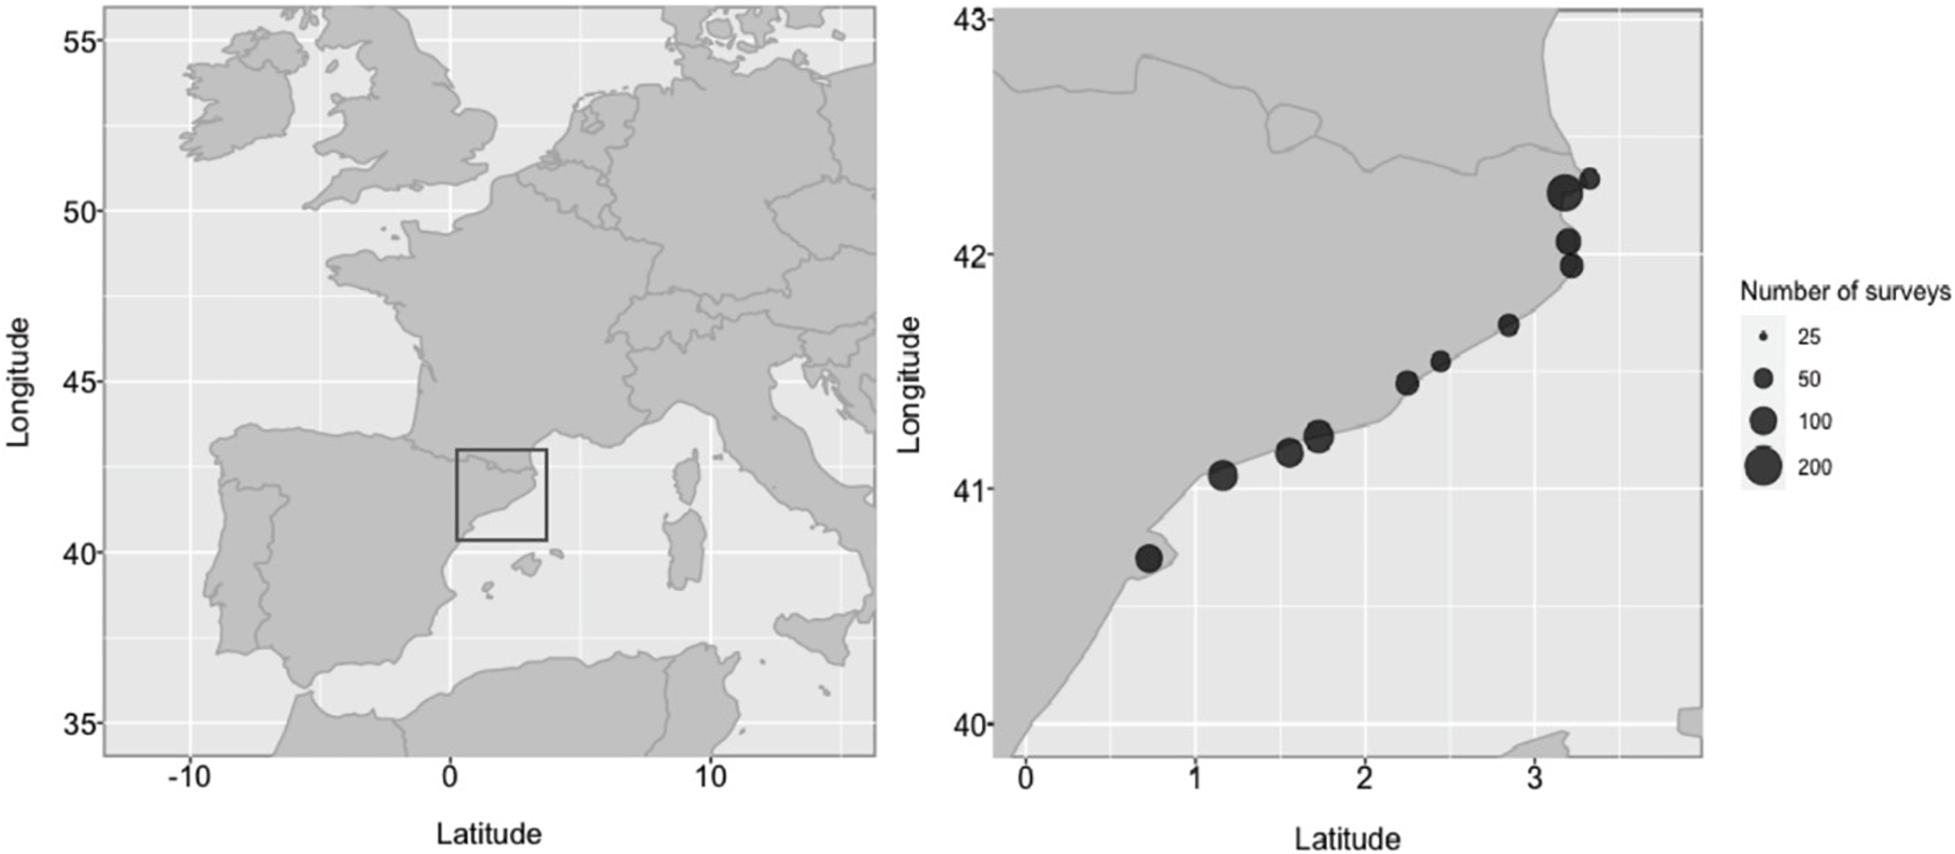
Figure 1. Area of study (Catalonia, NW Spain; left) and sample size obtained from each of the 11 surveyed zones (right).
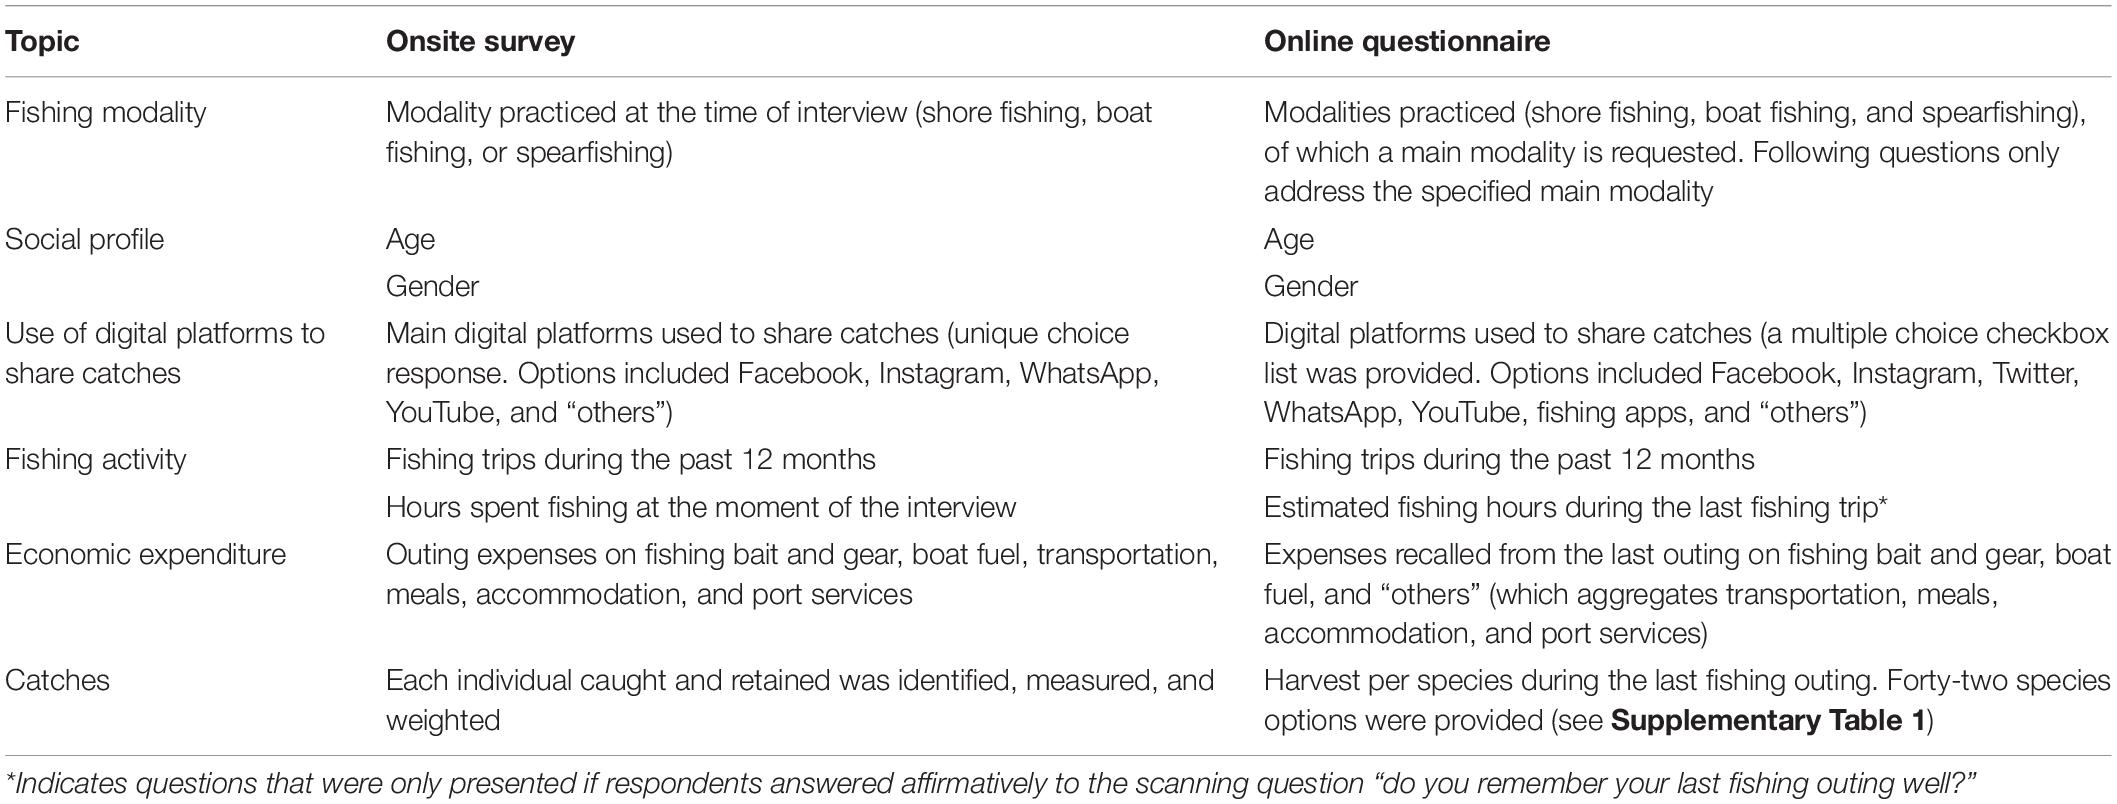
Table 1. A schematic representation of the information collected during the onsite and online surveys.
Online Questionnaires
The data presented here are the results of a total 37,057 online questionnaires sent from the 25th of August 2020 to the 5th of April 2021. The survey was sent by personal e-mail to recreational fishers that pursued a license, which is required to practice recreational fishing in Catalonia. The questionnaire was sent each month to at about 4000 unique e-mails that were randomly sampled from the license registry.
The survey software used was the Qualtrics XM platform, which includes logic features such as branching, question skips, and carrying forward selected options. This allowed presenting respondents only those questions and question options that were relevant to them. The application was responsive to PCs, smartphones, and tablets and to the major operating systems (Microsoft, Android, iOS, and Ubuntu). Questionnaires were unipersonal and could only be answered by the recipient IP address; they could be paused and retaken within a 2-week period, and were available in Catalan, Spanish, English, and French. The questionnaire addressed the same topics as the onsite survey, with some differences in question format or presentation (Table 1): the use of digital platforms allowed responding multiple options; a specific question asked if the last fishing outing was well remembered, after which economic recall expenditure estimates were requested (transportation, meals, and accommodation were requested in aggregate form); catches were also recalled from the past outing, including number of individuals caught and total weight harvested per species according to a precompiled list (Supplementary Table 1).
Data Analysis
The data collected were screened for quality control. Online questionnaires are particularly vulnerable to response errors, and their quality control consisted in the identification of unrealistic outliers (e.g., expenses of thousands of euros in daily usage fishing gear and transportation, or catches weighing only a few grams) due to question misunderstandings, miss-clicks, or values outside of maximum and minimum known weights for each species. Questions of both the online and the onsite surveys involving personal estimations received a special treatment in order to mechanically eliminate highly unrealistic values: for the recall question asking about the number of days fished during the past 12 months, we removed the upper 5% values (many of which chose the maximum possible value). For the questions on economic expenditure, we removed both the upper and lower 5% values (many respondents unrealistically declared not spending any money at all, or reported spending thousands of euros on a single trip). For the harvest per unit effort (HPUE), we removed the upper 5% values of the online questionnaires data, since online results were personal estimates and therefore highly subjected to recall and perception biases; the HPUE results of the onsite survey were deemed reliable, since catches were directly weighted by the surveyors. Data from the onsite and online surveys were presented separately in order to highlight different patterns emerging from each monitoring method. Recreational fishers were subdivided into three modalities: shore anglers, boat anglers, and spearfishers (note that anglers include shore and boat fishers but not spearfishers). HPUE was calculated for each respondent by dividing the total daily catch by the hours spent fishing. Data related to fishers’ age and economic expenditure were analyzed using linear models and, when needed, we transformed the response variable by finding the exponent (lambda), which made the values of the response variable as normally distributed as possible with a power transformation. When needed, differences in the proportions were analyzed using a two-tailed z-test. Avidity was analyzed using generalized linear models with a negative binomial distribution to account for over-dispersion of count data (Bliss and Fisher, 1953; Gardner et al., 1995). Finally, HPUE was analyzed as a semicontinuous variable by first using a generalized linear model with a binomial distribution with “probit” link to model binary transformed data (i.e., catch or not-catch; Boulton and Williford, 2018). Then, HPUE different from zero were modeled with liner models as described above. In all the cases we used a 95% confidence interval. We ran all the analyses in R (version 3.5.01).
Results
During the onsite survey, we interviewed a total 1047 recreational fishers (625 shore anglers; 273 boat anglers; 149 spearfishers, Figure 2A; overall 3% were females). After applying data quality control, we retained 4687 online questionnaires (13% response rate; 3226 shore anglers; 1002 boat anglers; 459 spearfishers; Figure 2B; overall 5% were females). Results of the onsite survey revealed a significant (F2,1043 = 47.89; p < 0.001; inlet Figure 2A) effect of fishing modality on the age of recreational fishers. Recreational spearfishers were significantly younger (p < 0.001; median = 37 years) than boat anglers (median = 53 years) and shore anglers (median = 48 years; inlet Figure 2A). Moreover, boat anglers were also significantly older than shore anglers (p < 0.001; inlet Figure 2A). Similarly, results of online questionnaires revealed a significant (F2,4385 = 71.93; p < 0.001; inlet Figure 2B) effect of fishing modality on the age of recreational fishers. Specifically, boat anglers were older (median = 51 years) than both spearfishers (median = 45 years) and shore anglers (median = 44 years; inlet Figure 2B).
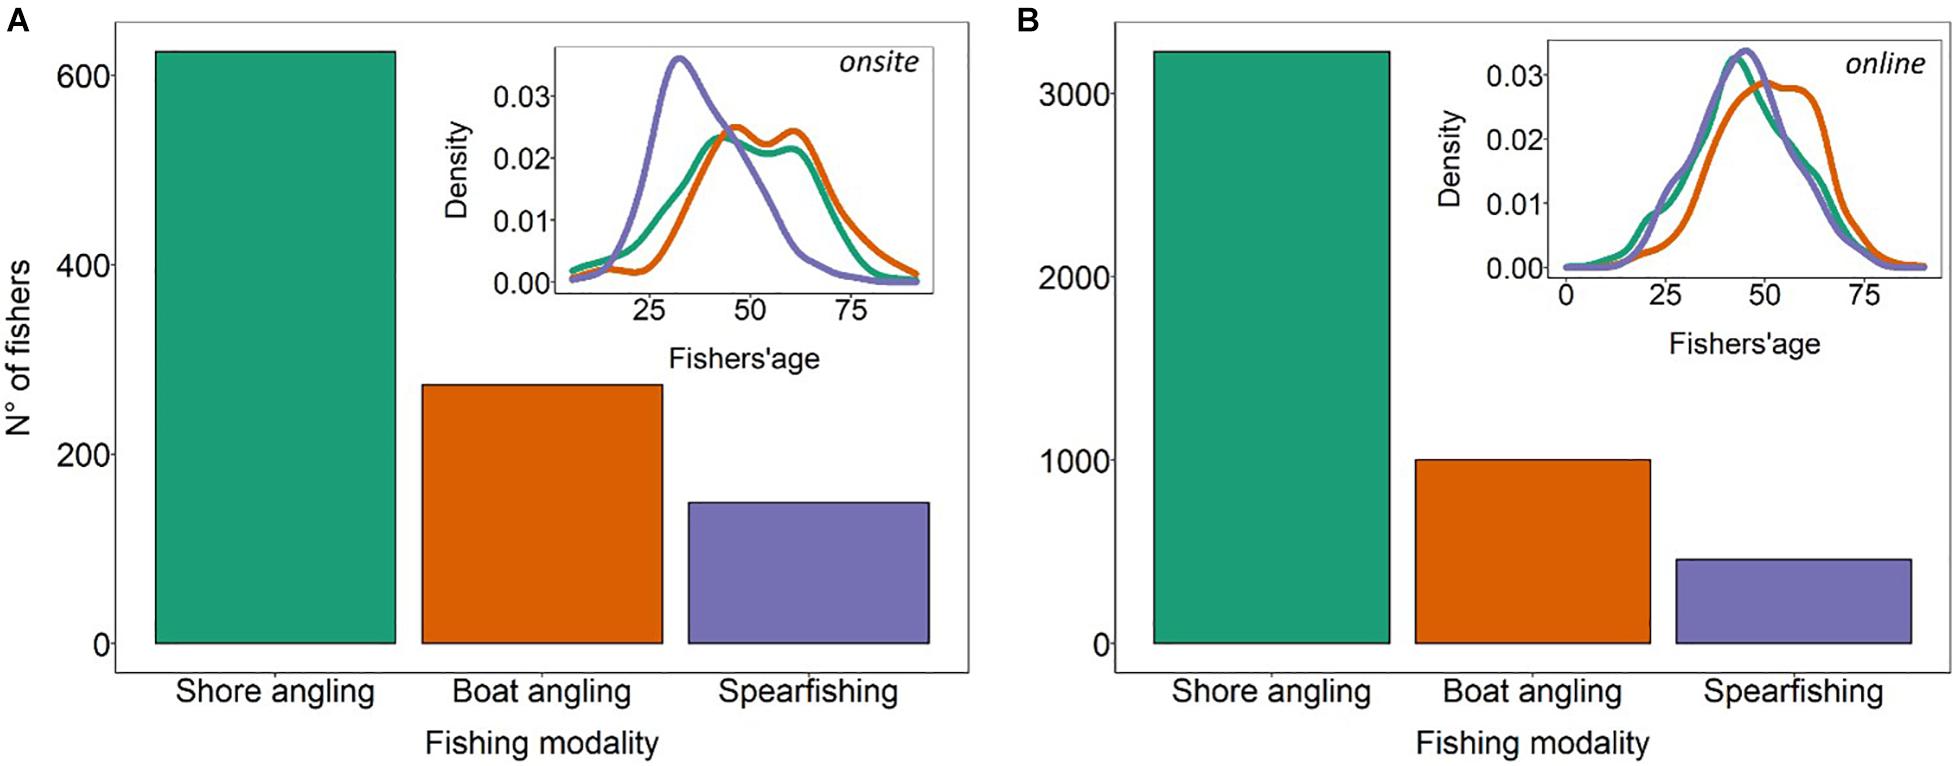
Figure 2. Total number of recreational fishers interviewed during the onsite survey (main plot in A) and that replied to the online survey (main plot in B) for each of the three main fishing modalities. Age distributions are presented in the inlets of both panels (A,B). In the onsite survey (A), the median ages of spearfishers, shore anglers, and boat anglers were 37, 48, and 53 years, respectively. In the online questionnaire (B), the median ages of spearfishers, shore anglers, and boat anglers were 45, 44, and 51 years, respectively.
We found a similar proportion of fishers sharing their catches on digital platforms (hereinafter referred to as “sharers,” which includes WhatsApp) for the onsite (38%) and online (37%) surveys (inlets in Figures 3A,B). Moreover, we showed similar patterns in the proportion of sharers within each modality (from 35 to 38%; Figures 3C,D), except for recreational spearfishers in the onsite survey, for which the proportion was of 50% (Figure 3C). The proportion of recreational fishers sharing their catches dropped to 12% for the onsite survey and to 21% for the online questionnaire when only considering public or semi-public social media platforms (like Instagram, Facebook, YouTube, and Twitter, Table 2). In terms of the different digital platforms used, we found the following results (note that onsite surveys collected the preferred digital platform, while the online questionnaire allowed choosing multiple digital platforms; see section “Materials and Methods” for more details). In the onsite survey (Figure 3A), the preferred digital platform was the messaging service WhatsApp (26% of total surveyed fishers; 67% of sharers), followed by Instagram (8% of total; 22% of sharers), Facebook (4% of total; 11% of sharers), and YouTube (<1%; only two responses). None of the onsite respondents declared using “other” platforms. In the online survey (Figure 3B), the most used digital platform was WhatsApp (24% of total; 50% of sharers), followed by Instagram (11% of total; 23% of sharers), Facebook (9% of total; 19% of sharers), Fishing apps (2% of total; 4% of sharers), YouTube (<1% of total; 2% of sharers), and others including Twitter (1% of total, 2% of sharers). Interestingly, we found overall similar patterns in the use of digital platforms among the different modalities (Figures 3E,F). The most notable difference was found for recreational spearfishers in the online questionnaire, in which they significantly used more YouTube (6% of sharers) than shore anglers (1%; χ2 = 26.7; p < 0.001) and boat anglers (2%; χ2 = 8.8; p < 0.01; Figure 3F).
Figure 3. Percentage of sharers using different digital platforms (A for onsite and B for online surveys). The inlets in (A,B) represent the total proportion of sharers and non-sharers. Proportion of sharers for each fishing modality (C for onsite and D for online surveys). Use of different digital platforms for each fishing modality (E for onsite and F for online surveys).
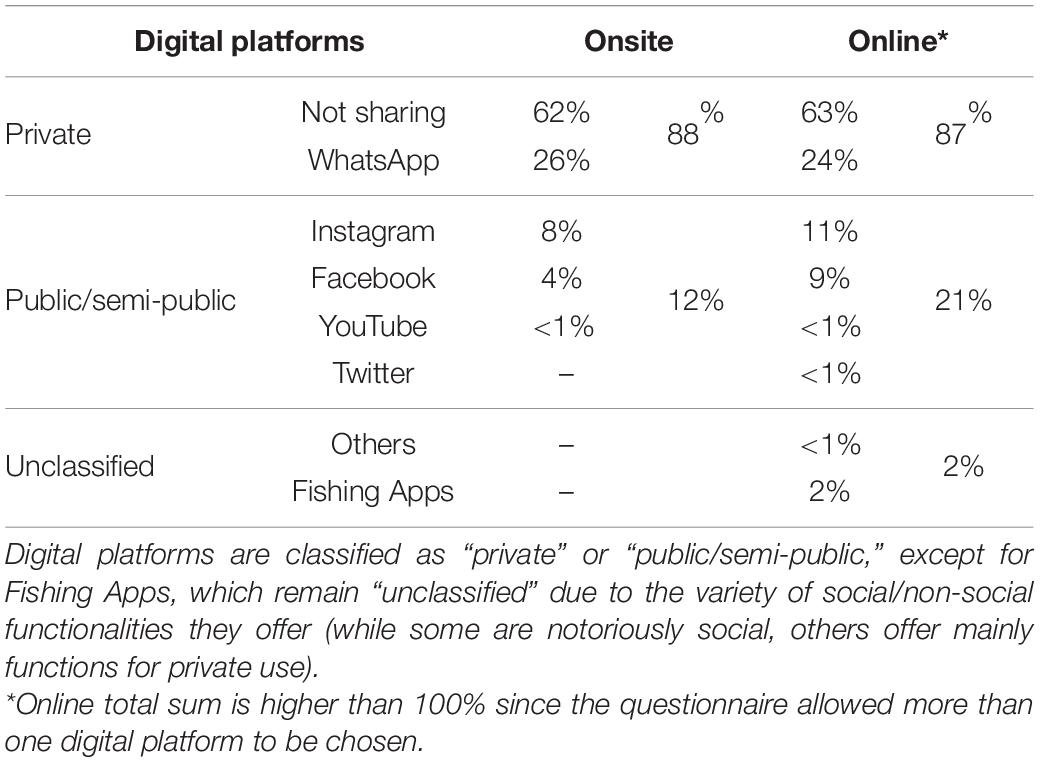
Table 2. Percentage of recreational fishers sharing and not sharing their catches on digital platforms for online and onsite survey respondents.
Regarding recreational fishers’ age related to their sharing activity, we found similar results both in the onsite and online surveys. In the onsite survey, sharers were significantly younger (F1,1044 = 108.7; p < 0.001; median = 41 years) than non-sharers (median = 53 years; inlet Figure 4A). Sharers were also significantly younger (F1,4386 = 97.8; p < 0.001; median = 43 years) than non-sharers in the online questionnaire (median = 47 years; Figure 4B), but the age difference was reduced.
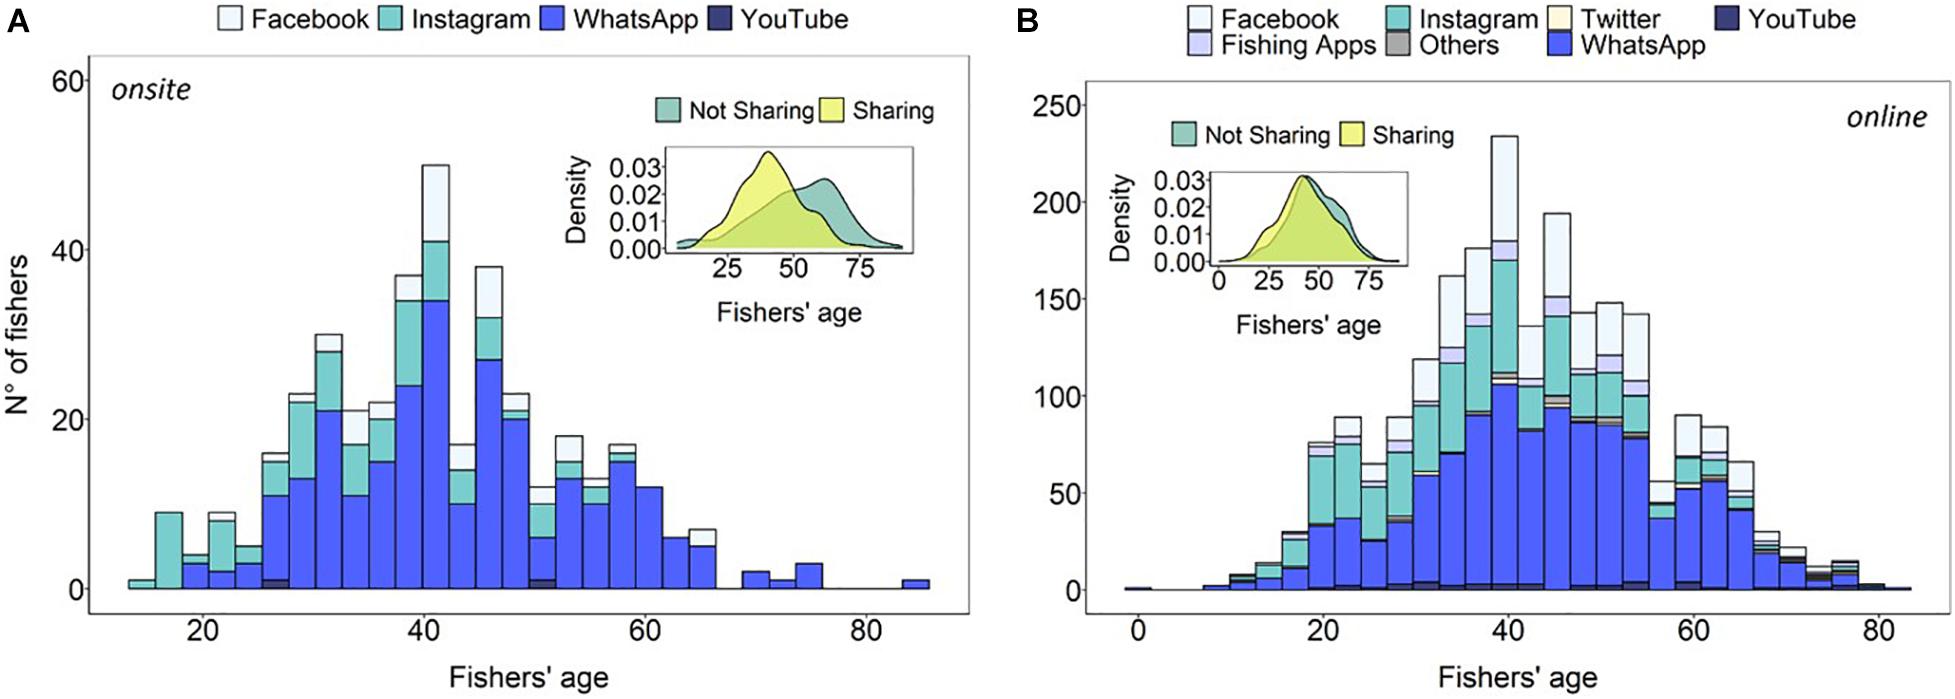
Figure 4. Age distribution of sharers and non-sharers (inlets) for different digital platforms (A for onsite and B for online surveys). In the onsite survey (A), the median age of non-sharers was 53 years; for sharers median age was 41 years (Instagram: N = 86, 35 years; YouTube: N = 2, 39 years; Facebook: N = 43, 42 years; and WhatsApp: N = 267, 42 years). In the online questionnaire (B), the median age of non-sharers was 47; for sharers, the median age was 43 (Instagram: N = 509, 36 years; YouTube: N = 40, 42 years; Fishing Apps: N = 97, 43 years; Facebook: N = 421, 43 years; Twitter: N = 21, 47 years; and other platforms: N = 29, 45 years).
Regarding avidity, both surveys found that sharers took a significantly higher amount of yearly fishing outings with respect to non-sharers [onsite: Rate Ratio = 0.12 (0.02–0.21); χ2 = 6.30; p < 0.05; inlet Figure 5A; online: Rate Ratio = 0.27 (0.22–0.32); χ2 = 98.73; p < 0.001; inlet Figure 5B]. Results from the onsite survey did not show significant effects relating digital platforms and avidity (χ2 = 3.46; p = 0.326; Figure 5A), whereas in the online questionnaire, we found a significant effect of the different digital platforms (χ2 = 35.74; p < 0.001; Figure 5B). In particular, sharers who use mainly Fishing Apps were significantly more avid than those mainly sharing on WhatsApp [Rate Ratio = 0.34 (0.61–0.07); p < 0.01; Figure 5B]. WhatsApp also showed a significantly lower pattern of avidity compared to Instagram [Rate Ratio = 0.15 (0.29–0.02); p < 0.05; Figure 5B] and YouTube [Rate Ratio = 0.55 (0.13–0.97); p < 0.01; Figure 5B].
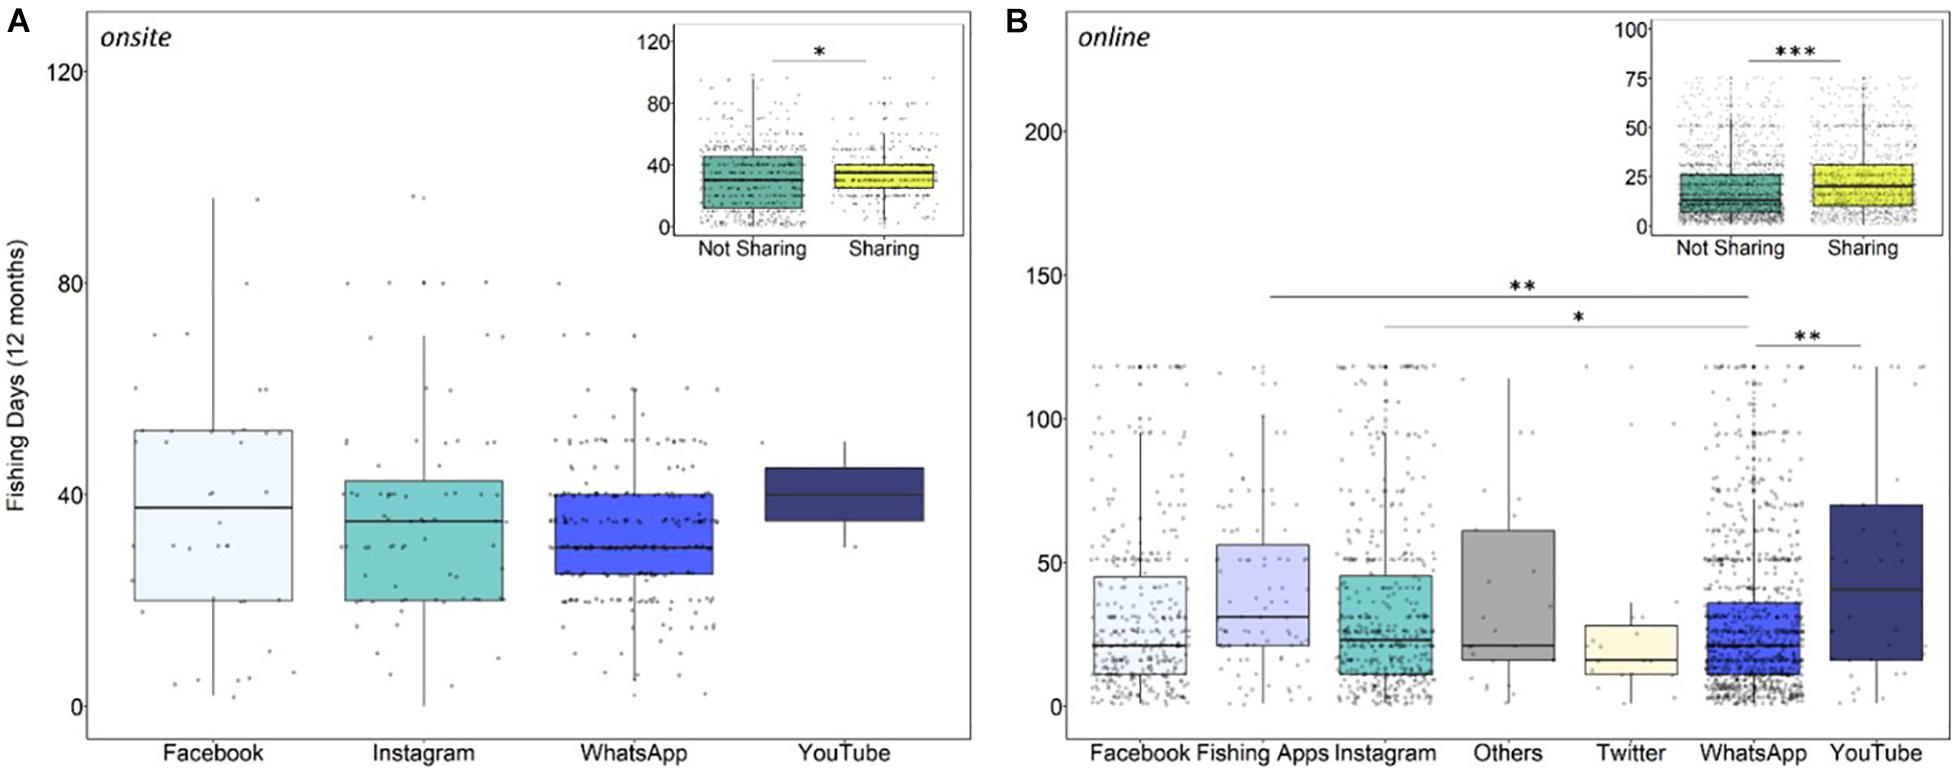
Figure 5. Boxplots of the days spent fishing by recreational fishers during the past 12 months (A for onsite and B for online surveys; inlets), and by each digital platform used (main plots). In the onsite survey (A), non-sharers spent, on average, 30 days fishing during the past 12 months, while sharers spent 35 days on average (WhatsApp: N = 255, 30 days; Instagram: N = 75, 35 days; Facebook: N = 40, 38 days; and YouTube: N = 2, 40 days). In the online questionnaire (B), non-sharers spent an average 13 days fishing during the last 12 months, while sharers averaged 20 days of activity (Twitter: N = 21, 16 days; other platforms: N = 29, 21 days; Facebook: N = 421, 21 days; Instagram: N = 509, 23 days; Fishing Apps: N = 97, 31 days; and YouTube: N = 40, 41 days). Boxplots represent the median (bold centreline), the 25th (top of the box) and 75th percentile (bottom of the box). Significant differences are reported as follow: ∗∗∗p < 0.001; ∗∗p < 0.01; ∗p < 0.05.
Regarding economic expenditures, for both onsite and online surveys, we found that sharers spent significantly more money than non-sharers (onsite: F1,918 = 33.97; p < 0.001; inlet of Figure 6A; online: F1,2791 = 24.78; p < 0.001; inlet of Figure 6B). Still, expenses were consistent within different digital platform users in both the onsite (F3,348 = 0.37; p = 0.773; Figure 6A) and the online surveys (F6,1567 = 1.14; p = 0.336; Figure 6B).
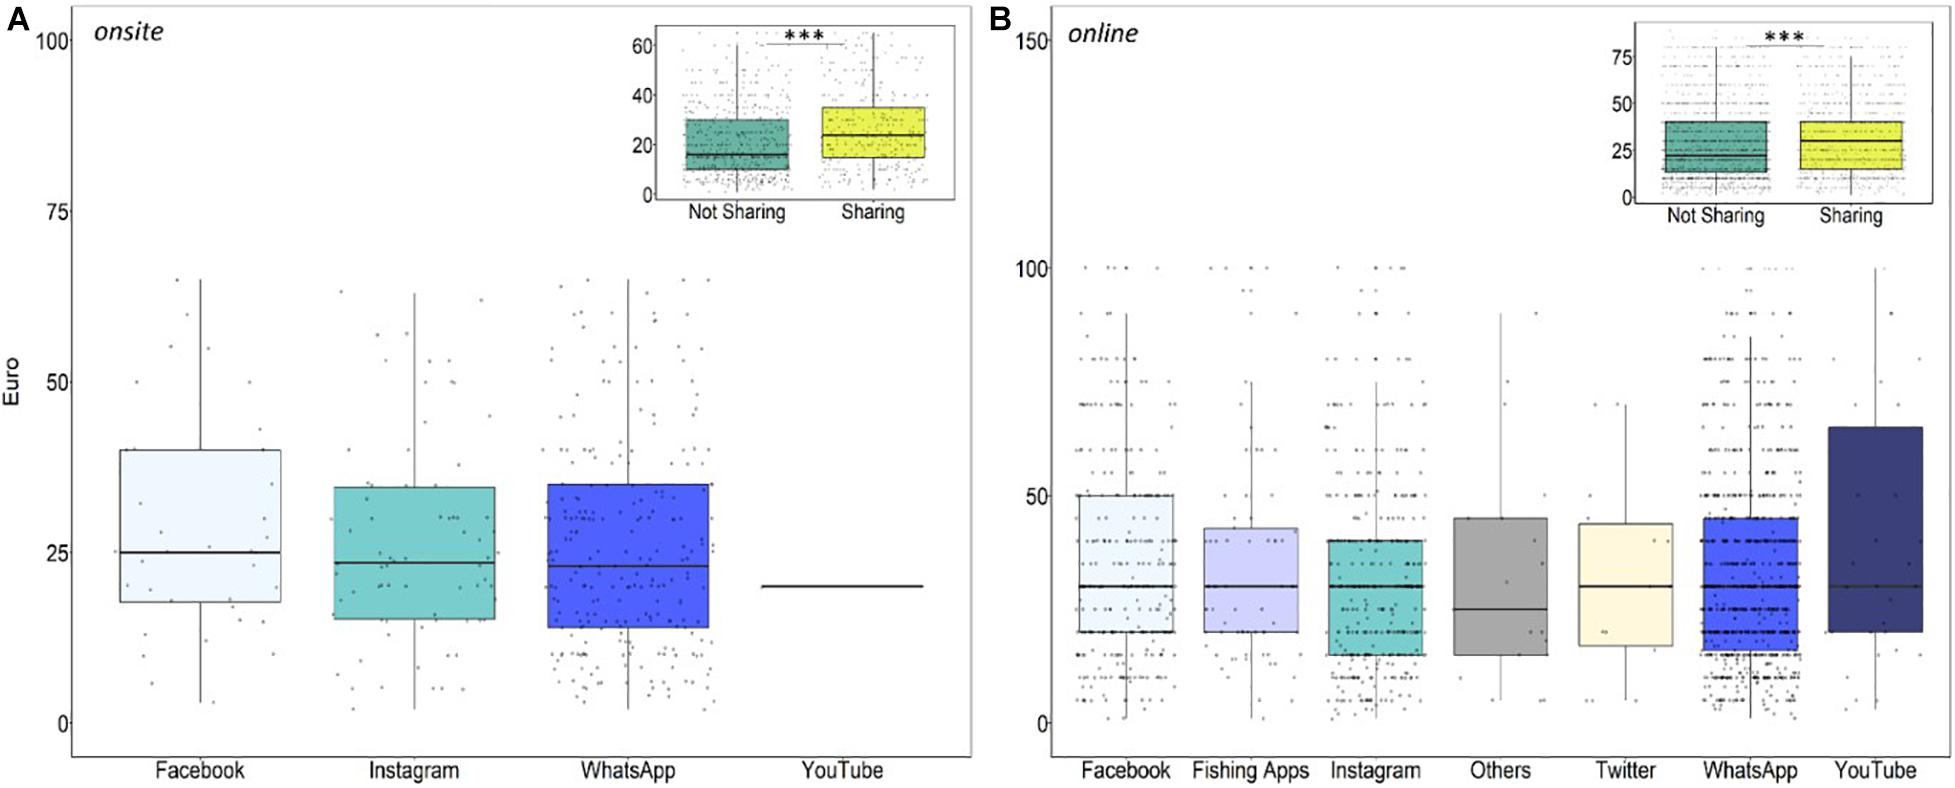
Figure 6. Boxplots comparing total expenditure during the past fishing trip for sharers and non-sharers (inlets), and according to the different platform used to share, from the onsite (A) and the online (B) surveys. In the onsite survey (A), daily expenditure of non-sharers averaged 21 euro, while it was 26 euro for sharers (YouTube: N = 1, 20 euro; WhatsApp: N = 241, 26 euro; Instagram: N = 74, 26 euro; and Facebook: N = 36, 28 euro). In the online questionnaire (B), the expenditure of non-sharers was, on average, 28 euro, while it was 31 euro for sharers (Instagram: N = 354 and Twitter: N = 14, mean = 32 euro; WhatsApp: N = 797 and other platforms: N = 19, mean = 33 euro; Fishing Apps: N = 70, mean = 35 euro; and Facebook: N = 290, mean = 36 euro and YouTube: N = 30, mean = 40 euro). Boxplots represent the median (bold centreline), the 25th (top of the box) and 75th percentile (bottom of the box). Significant differences are reported as follow: ∗∗∗p < 0.001.
Concerning the HPUE (kg harvested per fishing hour), we found that sharers did not have different chances to catch something than non-sharers (onsite: Z = 0.69; p = 0.492; Figure 7A; online: Z = 1.75; p = 0.080; Figure 7B). When we only considered HPUE different from zero, we found that sharers had a higher HPUE than non-sharers (onsite: F1,516 = 15.62; p < 0.001; Figure 7A; online: F1,473 = 4.02; p ≤ 0.05). However, no significant differences in HPUE were found when considering the different digital platforms used to share catches, neither for the onsite (F2,199 = 0.34; p = 0.714; Figure 7A), nor for the online surveys (F6,355 = 0.87; p = 0.517; Figure 7B).
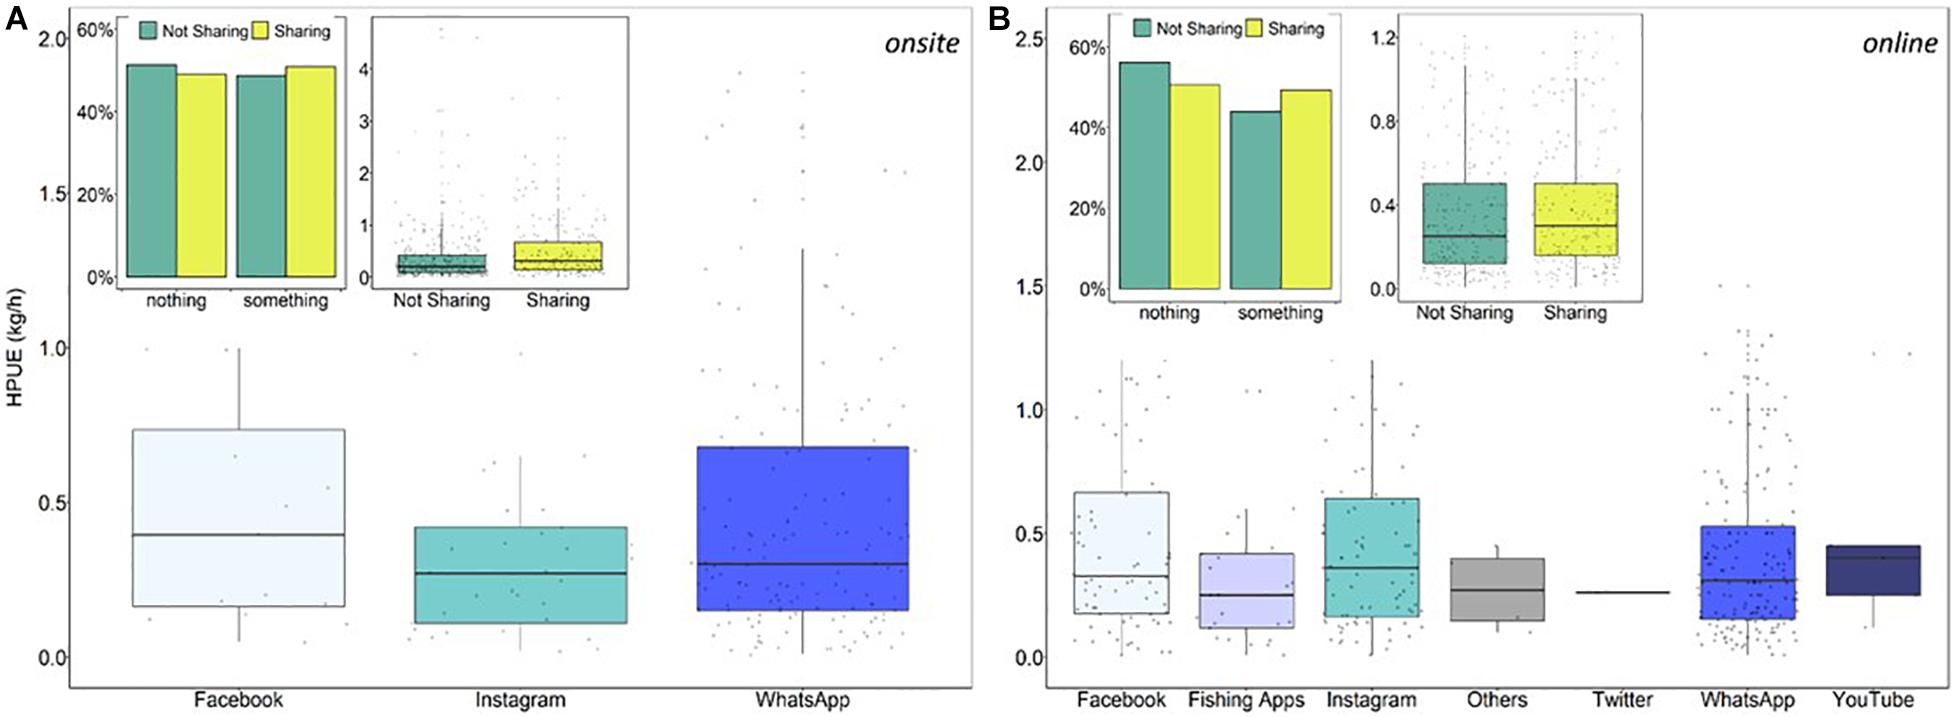
Figure 7. Barplots describing the percentage of fishers that harvested something (“something”) or did not harvest (“nothing”) according to the sharing activity [left inlet for both onsite (A) and online (B) surveys]. Boxplots represent kg of fish harvested per hour (HPUE) for sharers and non-sharers (inlet to the right), and according to the type of digital platform used to share (main plot). In the onsite survey (A), the percentage of fishers that harvested something was 49% for sharers and 51% non-sharers, while for those that did not harvest was 51% for sharers and 49% for non-sharers. Recreational fishers that caught something showed that average HPUE for sharers was 0.5 kg/h, while for non-sharers was 0.4 kg/h. In the online questionnaire (B), the percentage of fishers that harvested something was 49% for sharers and 44% non-sharers, while for those that did not harvest was 51% for sharers and 56% for non-sharers. Recreational fishers that caught something showed that average HPUE for sharers was 0.4 kg/h, while for non-sharers was 0.3 kg/h. Boxplots represent the median (bold centreline), the 25th (top of the box) and 75th percentile (bottom of the box).
Finally, regarding the most frequent species caught, we found similar overall patterns in both survey methods. The most frequently caught species were the gilthead seabream (Sparus aurata; 14% for sharers and 10% for non-sharers in the onsite survey; 18% for sharers and 19% for non-sharers in the online questionnaire), followed by the white seabream (Diplodus sargus) or Diplodus spp. (13.3% for sharers and 9% for non-sharers in the onsite survey; 13% of sharers and 14% of non-sharers in the online questionnaire; Figure 8). However, there were some differences that are worth mentioning: In the onsite survey, the greater amberjack (Seriola dumerili) and the common dentex (Dentex dentex) were caught more frequently by sharers (Figure 8B), while these species did not appear among the most frequently caught in the online questionnaire (Figure 8D).
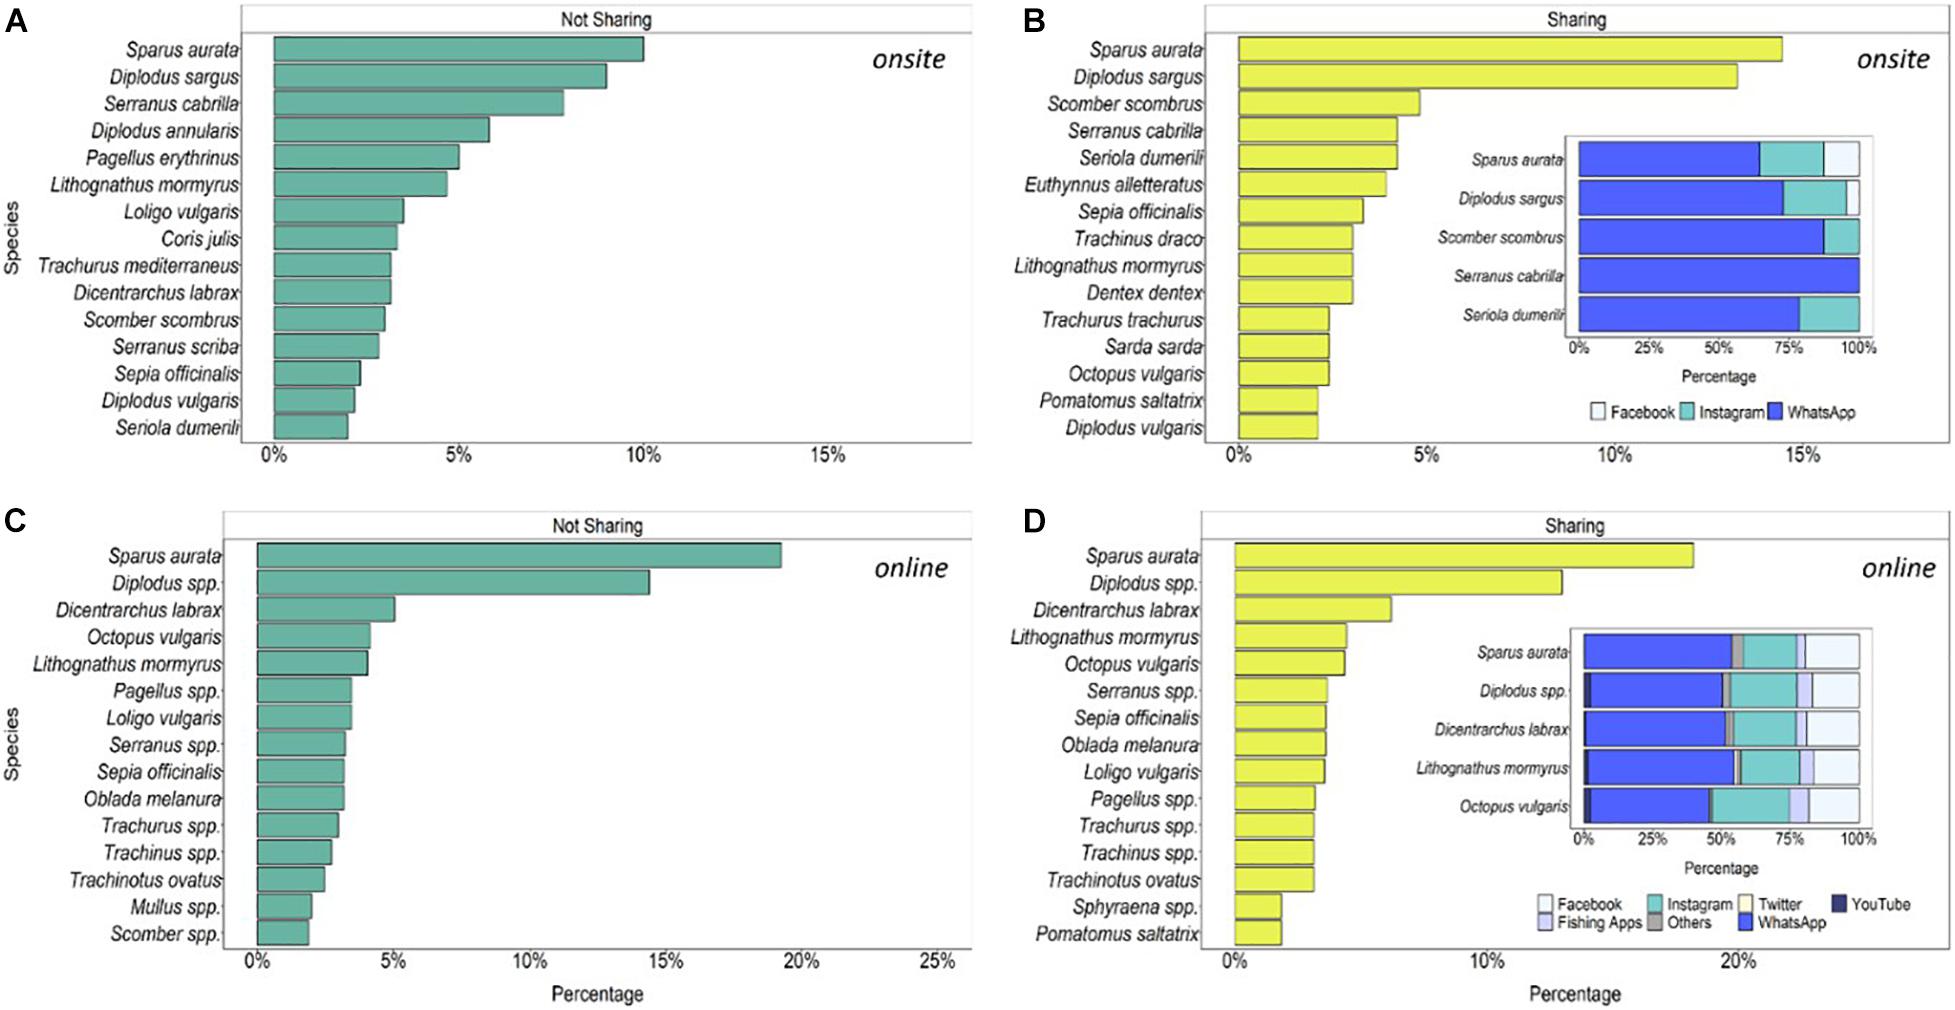
Figure 8. Frequency distribution of the most caught species by recreational fishers during their last fishing trip, according to their sharing habits on digital platforms (A,C for non-sharers, B,D for sharers), and according to the different digital platforms used to share (inlets of panels C,D), for the onsite (A,B), and the online surveys (C,D).
Discussion
Our study indicates that a consistent 35–38% of recreational fishers shared their catches on digital platforms (including the private messaging WhatsApp). Such percentage drops (12% in the onsite survey and 21% in the online questionnaire, Table 2) when only public or semi-public social media are considered (e.g., Instagram, Facebook, YouTube, and Twitter). Patterns of platform usage were considerably uniform between modalities for both surveying methods; Instagram being the most common social media used, followed by Facebook and YouTube, with some key differences standing out for spearfishers (see below). Our results suggest that the profile of recreational fishers sharing their catches on digital platforms is characterized by higher avidity and economic expenditures than non-sharers, but they had similar chances of catching something than non-sharers. However, when they did catch something, HPUE of sharers was higher than that of non-sharers. Moreover, recreational fishers who tend to catch trophy, iconic, or emblematic species were more inclined to sharing catches on digital platforms. Our results also highlighted important differences between onsite and online surveys; these are expected due to their intrinsic biases (Lewin et al., 2021), each of which are discussed in detail for all the variables analyzed. Specific biases that may be important for the interpretation of the results of the different surveys are identified, as well as those related to the validity and use of data mined from digital platforms.
The private messaging service WhatsApp was the most used digital platform, both according to the onsite and the online surveys. This highlights that recreational fishers are willing to use smartphones to share their catches, but they mostly prioritize private digital environments. Social media had a much lower use in both survey methods. The most striking difference we observed was that sharers were younger in the onsite survey, while such age difference almost disappeared in the online questionnaire. This suggests that older recreational fishers were less likely to respond to the online questionnaire. Moreover, we found that spearfishers surveyed onsite used digital platforms more frequently than anglers, something not observed in the online questionnaire. The reason behind this could be related to the fact that they were younger, on average, which is in accordance with the fact that social media users are younger than non-social media users (Anderson and Center, 2018). Moreover, we observed age differences in the use of specific social media platforms in both survey methods; for example, sharers using Instagram were younger (median = 35 and 36 for onsite and online surveys, respectively) than those using Facebook (median = 43 for both surveys). However, some interesting differences emerged from the online questionnaire; specifically, the social media YouTube seemed more popular among spearfishers than anglers. The main reason for this could be related to the fact that videos could be more effective in triggering enhanced appreciation for fishing skills and athletic performance for spearfishing than for shore and boat angling (Sbragaglia et al., 2020). Therefore, a potential interesting topic for future research is related to characterize whether recreational anglers and spearfishers differ in sharing photos and video content of social media.
Recreational fishers sharing catches on digital platforms were more involved in the activity in terms of avidity (i.e., time spent fishing in the last 12 months) in both survey methods. This confirms and quantifies the non-random representation of data mined from digital platforms that have been already suggested for recreational fishing apps, which are likely to suffer from representation issues causing avidity bias (Jiorle et al., 2016; Venturelli et al., 2017; Skov et al., 2021). The most interesting result is that, according to the online questionnaire, fishers sharing catches on public social media such as YouTube and Instagram showed higher avidity patterns than those sharing catches on the private messaging service WhatsApp (the same is also true for Fishing Apps). These findings suggest a certain showcasing effect, which would either be increasing avid fishers’ willingness to share their catches, or causing fishers who wish to display their catches to become more involved. Differences in terms of avidity among fishers using the different digital platforms have not been detected in the onsite survey. This was probably due to our onsite avidity question type, which could not be optimal to reveal such potential differences: onsite survey interviewees were asked to indicate the main digital platform used with a unique choice, while recreational fishers were able to indicate multiple choices in the online questionnaire.
Sharers were also likely to spend more money than non-sharers. Even though this result is consistent for both survey methods, we did not detect significant differences between the different digital platforms. The main reason could be related to the fact that we only considered expenses associated to the latest fishing trip, which included consumable bait and gear, boat fuel, transportation, meals, accommodation, and port services; however, other long-term expenses, such as fishing equipment and accessories, boat maintenance, or fishing-related holidays could show different patterns. The results of both survey methods indicated no significant differences in the chances of catching something between sharers and non-sharers. However, when sharers did catch something, their HPUE was higher than that of non-sharers, which could be related to catch showcasing effects and targeted species, as highlighted in the following section.
The results of the onsite survey highlighted that recreational fishers sharing their activity on digital platforms caught more frequently trophy, iconic, or emblematic species such as the greater amberjack (S. dumerili) and the common dentex (D. dentex). Such information may be extremely relevant to refine the interpretation of some recent studies that used social media data for characterizing recreational fisheries in the Mediterranean Sea. For example, in a recent study, Giovos et al. (2018), provided the percentage of occurrence of S. dumerili and D. dentex using YouTube videos, while (Sbragaglia et al., 2020) characterized Italian recreational fishing of D. dentex on YouTube. Our study suggests that the abovementioned studies should be interpreted with caution, as some species may be overrepresented in the catches of social media users. By contrast, the results of the online questionnaires did not show major differences in terms of catch composition. However, this result is highly liable to recall and perception biases (see below), which could be large enough to muffle potential existing differences. Some species such as the gilthead seabream (S. aurata) and seabreams (Diplodus spp.) were among the most frequently caught species in both surveys, independently of whether recreational fishers were sharing their catches or not. These species have been confirmed to be among the most frequently caught species by recreational fishers in the area of study (Dedeu et al., 2019; ICATMAR, 2021). It is worth mentioning that the differences in species composition among the onsite and online survey could be related to implicit methodological biases as recently highlighted in other studies (Lewin et al., 2021). Therefore, our results suggest that data mined on social media could prove useful to monitor recreational fishing catches of the most frequent targeted species such as the gilthead seabream (S. aurata).
There are some aspects that must be remarked regarding the interpretation of our results. Firstly, the two sampling methods used are affected by different sources of bias. The online questionnaires were affected by well-known biases of recall and perception (Lyle et al., 2002; Dillman, 2011; Jones and Pollock, 2013; Lewin et al., 2021), as well as coverage-bias (only recreational fishers in possession of a license could receive the online questionnaire), and self-recruitment, as surveys were voluntary (Andersens, 2009). These biases have likely interfered with fishing avidity, HPUE estimations, economic expenditure and catches. Specifically, self-recruitment could also have caused a bias toward younger respondents with higher rate of engagement in online digital platforms, as respondents would have already overcome a digital barrier when acceding to answer the survey (Wallen et al., 2016). Moreover, we found that the response rate in the online questionnaire was 13%. This is similar to previous studies (10%; Zarauz et al., 2015), but it should be noted that at about 30% of license holders that received the questionnaire only practiced freshwater recreational fishing (ICATMAR, 2021), which means that the response rate of marine recreational fishers is likely underestimated. Onsite surveys would not be subjected to coverage or self-selection biases, and could more effectively represent the digital platform use of the local recreational fisher population. Nevertheless, it is important to highlight that onsite surveys intrinsically over-represent highly avid fishers, due to probability of encounter (the more you go fishing the more likely it is that you will be interviewed; e.g., Board and Council, 2006; Hindsley et al., 2011), which could potentially cause an over-estimation of digital platform users. Additionally, social media users could potentially over-represent catches from urbanized regions, an issue that has already been found for fishing apps, which are biased toward high-density coastal areas (Jiorle et al., 2016). Moreover, these biases could in turn over-represent users from particular spatial or temporal dimensions, which could involve further biasing effects on measures of HPUE (Cabanellas-Reboredo et al., 2017). Most importantly this study did not characterize how often and consistently recreational fishers share their catches on social media, and whether fishers preferentially share a specific species of trophy size fishes. These are important aspects to clarify in future studies. Besides, the onset of mobility and activity restrictions that were set in place in the area of study due to COVID-19 significantly affected the onsite model representing the spatial and temporal recreational fishing activity (Pita et al., 2021). Most importantly, adaptations due to changing normative conditions impeded sampling ports during spring; they also caused all spring surveys conducted by boat and on foot to be condensed within the month of June (see Supplementary Text 1 for further details). Moreover, since the end of the major restrictions (June 2020), there were still numerous national, regional, and local rules affecting citizen mobility between different areas and at different times, which will have very likely affected recreational fishing activity during this period, particularly in terms of effort. Additionally, the changing social and economic scenario could also have altered fisher’s expenses, as well as the general activity in other unpredictable ways.
In conclusion, we provided the first characterization of the profile of marine recreational fishers sharing their catches on digital platforms, including public social media and fishing apps. Such information is crucial for the proper integration of social media data in the monitoring of recreational fishing. The recent expansion of research approaches using digital data is providing quantitative tools that can inform recreational fishing management both from an ecological and social perspective (Jarić et al., 2020; Sbragaglia et al., 2021). Our study filled some of the major gaps of knowledge associated to the representativeness of social media data for monitoring recreational fishing and moves this promising monitoring approach a step forward in developing new applications such as large scale, real-time, and low-cost monitoring.
Data Availability Statement
The raw data supporting the conclusions of this article will be made available by the authors, without undue reservation.
Author Contributions
VS conceived the study. AD and MP coordinated and executed the data collection. GV and VS analyzed the data and led the writing of the manuscript with inputs by all other co-authors. GV, VS, and AD interpreted the data. All authors gave final approval for publication.
Funding
Data used were obtained by the Catalan Institute for Ocean Governance Research (ICATMAR) recreational fishing monitoring system, which has been financed by European Maritime and Fisheries Fund (EMFF) and the Catalan General-Directorate of Marine Policy and Sustainable Fisheries by projects PESCAT (ARP029/18/00003) and CGCAT (ARP140/20/000006). GV was supported by an ERASMUS+ traineeship grant in agreement with the “School of Nature Sciences” of the University of Turin, while VS was supported by a “Juan de la Cierva Incorporación” research fellowship (IJC2018-035389-I) granted by the Spanish Ministry of Science and Innovation. VS and GV acknowledge the Spanish government through the “Severo Ochoa Centre of Excellence” accreditation to ICM-CSIC (#CEX2019-000928-S).
Conflict of Interest
The authors declare that the research was conducted in the absence of any commercial or financial relationships that could be construed as a potential conflict of interest.
Publisher’s Note
All claims expressed in this article are solely those of the authors and do not necessarily represent those of their affiliated organizations, or those of the publisher, the editors and the reviewers. Any product that may be evaluated in this article, or claim that may be made by its manufacturer, is not guaranteed or endorsed by the publisher.
Supplementary Material
The Supplementary Material for this article can be found online at: https://www.frontiersin.org/articles/10.3389/fmars.2021.768047/full#supplementary-material
Footnotes
References
Andersens, H. C. (2009). ICES WKSMRF REPORT 2009 ICES ADVISORY COMMITTEE Report of the Workshop on Sampling Methods for Recreational Fisheries (WKSMRF) Nantes, France International Council for the Exploration of the Sea Conseil International pour l’Exploration de la Mer. Copenhagen: ICES.
Andersens, H. C. (2010). ICES PGRFS REPORT 2010 ICES ADVISORY COMMITTEE Report of the Planning Group on Recreational Fisheries (PGRFS) International Council for the Exploration of the Sea Conseil International pour l’Exploration de la Mer. Copenhagen: ICES.
Anderson, M., and Center, J. J. (2018). Teens, social media & technology 2018. Available online at: http://publicservicesalliance.org/wp-content/uploads/2018/06/Teens-Social-Media-Technology-2018-PEW.pdf (accessed April 10, 2018)
Arlinghaus, R., Abbott, J. K., Fenichel, E. P., Carpenter, S. R., Hunt, L. M., Alos, J., et al. (2019). Erratum: Opinion: Governing the recreational dimension of global fisheries. Proc. Nat. Acad. Sci. USA 116, 5209–5213. doi: 10.1073/pnas.1902796116
Bank, W. (2012). Hidden Harvest?: The Global Contribution of Capture Fisheries. Washington, DC: The World Bank Group.
Bliss, C., and Fisher, R. (1953). Fitting the negative binomial distribution to biological data. JSTOR 1953:1850.
Board, O., and Council, N. R. (2006). Review of recreational fisheries survey methods. Washington, DC: The National Academies Press.
Boulton, A., and Williford, W. (2018). Analyzing skewed continuous outcomes with many zeros: A tutorial for social work and youth prevention science researchers. J. Uchicago.Edu. 9, 721–740. doi: 10.1086/701235
Brownscombe, J. W., Hyder, K., Potts, W., Wilson, K. L., Pope, K. L., Danylchuk, A. J., et al. (2019). The future of recreational fisheries: Advances in science, monitoring, management, and practice. Fish. Res. 211, 247–255. doi: 10.1016/j.fishres.2018.10.019
Cabanellas-Reboredo, M., Palmer, M., Alós, J., and Morales-Nin, B. (2017). Estimating harvest and its uncertainty in heterogeneous recreational fisheries. Fish. Res. 188, 100–111. doi: 10.1016/J.FISHRES.2016.12.008
Cooke, S., and Cowx, I. G. (2004). The role of recreational fishing in global fish crises. Bioscience 54, 857–859.
Dedeu, A. L., Boada, J., and Gordoa, A. (2019). The first estimates of species compositions of Spanish marine recreational fishing reveal the activity’s inner and geographical variability. Fish. Res. 216:25. doi: 10.1016/j.fishres.2019.03.025
Dillman, D. (2011). Mail and Internet surveys: The tailored design method-2007 Update with new Internet, visual, and mixed-mode guide. Hoboken: John Wiley & Sons.
Ditton, R., Loomis, D., and Research, S. C. (1992). Recreation specialization: Re-conceptualization from a social worlds perspective. Taylor & Francis. Available online at: https://www.tandfonline.com/doi/abs/10.1080/00222216.1992.11969870 (accessed July 14, 2021)
Gardner, W., Mulvey, E., and Bulletin, E. S. (1995). Regression analyses of counts and rates: Poisson, overdispersed Poisson, and negative binomial models. Available online at: https://psycnet.apa.org/record/1996-93539-001 (accessed July 22, 2021)
Giglio, V., Suhett, A., and Zapelini, C. (2020). Assessing captures of recreational spearfishing in Abrolhos reefs, Brazil, through social media. Reg. Stud. Mar. Sci. 34:100995. doi: 10.1016/j.rsma.2019.100995
Giovos, I., Keramidas, I., Antoniou, C., Deidun, A., Font, T., Kleitou, P., et al. (2018). Identifying recreational fisheries in the Mediterranean Sea through social media. Fish. Manag. Ecol. 25, 287–295. doi: 10.1111/fme.12293
Griffiths, S., Tonks, M. L., and Zischke, M. (2013). Efficacy of novel sampling approaches for surveying specialised recreational fisheries. New York, NY: Springer.
Hindsley, P., Landry, C., and Economics, B. G. (2011). Addressing onsite sampling in recreation site choice models. Amsterdam: Elsevier.
Hyder, K., Weltersbach, M. S., Armstrong, M., Ferter, K., Townhill, B., Ahvonen, A., et al. (2018). Recreational sea fishing in Europe in a global context—Participation rates, fishing effort, expenditure, and implications for monitoring and assessment. Fish. Fish. 19, 225–243. doi: 10.1111/faf.12251
ICATMAR (2021). Departament d’Acció Climàtica, Alimentació i Agenda Rural. Available online at: http://agricultura.gencat.cat/ca/departament/dar_plans_programes_sectorials/politica-maritima/icatmar/ (accessed July 21, 2021)
Jarić, I., Roll, U., Arlinghaus, R., Belmaker, J., Chen, Y., China, V., et al. (2020). Expanding conservation culturomics and iEcology from terrestrial to aquatic realms. PLoS Biol. 18:1–13. doi: 10.1371/journal.pbio.3000935
Jiorle, R., Ahrens, R., and Allen, M. S. (2016). Assessing the utility of a smartphone app for recreational fishery catch data. Fisheries 41, 758–766. doi: 10.1080/03632415.2016.1249709
Jones, M., and Pollock, K. H. (2013). Recreational Google Scholar. Maryland: American Fisher Society.
Lewin, W.-C., Weltersbach, M. S., Haase, K., Riepe, C., Skov, C., Gundelund, C., et al. (2021). Comparing on-site and off-site survey data to investigate survey biases in recreational fisheries data. ICES J. Mar. Sci. 2021:131. doi: 10.1093/ICESJMS/FSAB131
Lyle, J., West, L., and Coleman, A. L. W. (2002). New large-scale survey methods for evaluating sport fisheries. Economic and social. Hobart: University Of Tasmania.
Monkman, G., Hyder, K., and Kaiser, M. (2018). Text and data mining of social media to map wildlife recreation activity. Amsterdam: Elsevier.
Peramos, N., and Andersens, H. C. (2016). ICES WGRFS REPORT 2008 ICES SSGIEOM COMMITTEE International Council for the Exploration of the Sea Conseil International pour l’Exploration de la Mer. Copenhagen: ICES.
Pita, P., Ainsworth, G. B., Alba, B., Anderson, A. B., Antelo, M., Alós, J., et al. (2021). First assessment of the impacts of the COVID-19 pandemic on global marine recreational fisheries. Front. Mar. Sci. 8:735741. doi: 10.3389/FMARS.2021.735741
Pollock, K., Jones, C., and Brown, T. (1994). Angler survey methods and their applications in fisheries management. Rome: Food And Agriculture Organization Headquarters.
Rocklin, D., Levrel, H., Drogou, M., Herfaut, J., and Veron, G. (2014). Combining telephone surveys and fishing catches self-report: the french sea bass recreational fishery assessment. PLoS One 9:87271. doi: 10.1371/JOURNAL.PONE.0087271
Sbragaglia, V., Coco, S., Correia, R. A., Coll, M., and Arlinghaus, R. (2021). Analyzing publicly available videos about recreational fishing reveals key ecological and social insights: A case study about groupers in the Mediterranean Sea. Sci. Total Environ. 765:142672. doi: 10.1016/j.scitotenv.2020.142672
Sbragaglia, V., Correia, R. A., Coco, S., and Arlinghaus, R. (2020). Data mining on YouTube reveals fisher group-specific harvesting patterns and social engagement in recreational anglers and spearfishers. ICES J. Mar. Sci. 77, 2234–2244. doi: 10.1093/ICESJMS/FSZ100
Shiffman, D., Macdonald, C., and Ganz, H. Y. (2017). Fishing practices and representations of shark conservation issues among users of a land-based shark angling online forum. Fish.Res. 196, 13–26. doi: 10.1016/j.fishres.2017.07.031
Skov, C., Hyder, K., Gundelund, C., Ahvonen, A., Baudrier, J., Borch, T., et al. (2021). Expert opinion on using angler Smartphone apps to inform marine fisheries management: status, prospects, and needs. ICES J. Mar. Sci. 2021:243. doi: 10.1093/icesjms/fsaa243
Venturelli, P. A., Hyder, K., and Skov, C. (2017). Angler apps as a source of recreational fisheries data: opportunities, challenges and proposed standards. Fish Fish. 18, 578–595. doi: 10.1111/faf.12189
Wallen, K. E., Landon, A. C., Kyle, G. T., Schuett, M. A., Leitz, J., and Kurzawski, K. (2016). Mode effect and response rate issues in mixed-mode survey research: implications for recreational fisheries management. Chang. Publis. Wiley 36, 852–863. doi: 10.1080/02755947.2016.1165764
Keywords: social media, digital data, avidity, expenditure, recreational fishing, Spain, Mediterranean Sea
Citation: Vitale G, Dedeu AL, Pujol M and Sbragaglia V (2021) Characterizing the Profile of Recreational Fishers Who Share Their Catches on Social Media. Front. Mar. Sci. 8:768047. doi: 10.3389/fmars.2021.768047
Received: 31 August 2021; Accepted: 19 October 2021;
Published: 11 November 2021.
Edited by:
Tomaso Fortibuoni, Istituto Superiore per la Protezione e la Ricerca Ambientale (ISPRA), ItalyReviewed by:
Miguel Cabanellas-Reboredo, Spanish Institute of Oceanography (IEO), SpainPhilip A. Loring, University of Guelph, Canada
Pedro Veiga, University of Algarve, Portugal
Copyright © 2021 Vitale, Dedeu, Pujol and Sbragaglia. This is an open-access article distributed under the terms of the Creative Commons Attribution License (CC BY). The use, distribution or reproduction in other forums is permitted, provided the original author(s) and the copyright owner(s) are credited and that the original publication in this journal is cited, in accordance with accepted academic practice. No use, distribution or reproduction is permitted which does not comply with these terms.
*Correspondence: Valerio Sbragaglia, dmFsZXJpb3NicmFAZ21haWwuY29t