 Anna B. Costanza1*
 Chiara Guidino2,3
 Jeffrey C. Mangel2,4
 Joanna Alfaro-Shigueto2,3,4Gregory Verutes5Marjolaine Caillat1
 Aritree Samanta6
 Ellen Hines1,7
- 1Estuary and Ocean Science Center, San Francisco State University, Tiburon, CA, United States
- 2ProDelphinus, Lima, Peru
- 3Carrera de Biologia Marina, Universidad Cientifica del Sur, Lima, Peru
- 4Centre for Ecology and Conservation, University of Exeter, Penryn, United Kingdom
- 5CRETUS-Department of Applied Economics, University of Santiago de Compostela, Santiago de Compostela, Spain
- 6School of Public Affairs and Civic Engagement, San Francisco State University, San Francisco, CA, United States
- 7Department of Geography & Environment, San Francisco State University, San Francisco, CA, United States
Uncertainties about the magnitude of bycatch in poorly assessed fisheries impede effective conservation management. In northern Peru, small-scale fisheries (SSF) bycatch negatively impacts marine megafauna populations and the livelihoods of fishers which is further elevated by the under-reporting of incidents. Within the last decade, accounts of entangled humpback whales (HBW) (Megaptera novaeangliae) off the northern coast of Peru have increased, while Eastern Pacific leatherback turtles (LBT) (Dermochelys coriacea) have seen over a 90% decline in nesting populations related in large part to bycatch mortality. By leveraging the experience and knowledge of local fishers, our research objectives were to use a low-cost public participation mapping approach to provide a spatio-temporal assessment of bycatch risk for HBW and LBT off two Peruvian fishing ports. We used an open-source, geographic information systems (GIS) model, the Bycatch Risk Assessment (ByRA), as our platform. Broadly, ByRA identifies high bycatch risk areas by estimating the intersection of fishing areas (i.e., stressors) with species habitat and evaluating the exposure and consequence of possible interaction between the two. ByRA outputs provided risk maps and gear risk percentages categorized as high, medium, and low for the study area and seven subzones for HBW in the austral winter and LBT in the austral summer. Overall, the highest bycatch risk for both species was identified within gillnet fisheries near the coast. Bycatch risk for most gear types decreased with distance from the coast. When we separated the ByRA model by port, our map outputs indicate that bycatch management should be port specific, following seasonal and spatial variations for HBW, and specific fishing gear impacts for HBW and LBT. Combined with direct bycatch mitigation techniques, ByRA can be a supportive and informative tool for addressing specific bycatch threats and marine megafauna conservation goals. ByRA supports a participatory framework offering rapid visual information via risk maps and replicable methods for areas with limited resources and data on fisheries and species habitat.
Introduction
Fisheries bycatch, defined here as interactions of accidental capture, entanglement, injury, and mortality of non-target species, has been largely accepted as one of the primary threats and drivers of marine megafauna decline (sharks, marine mammals, seabirds, and sea turtles), pushing various species toward extinction (Hall and Roman, 2013; Hamer et al., 2013; Lewison et al., 2014; Hashimoto et al., 2015). Continued losses of individuals from bycatch alter food web dynamics, cause shifts in ecosystem function and services, and can further endanger already depleted or at-risk populations (Worm et al., 2006; Roman and McCarthy, 2010; Estes et al., 2011; Roman et al., 2014; McCauley et al., 2015; Kroodsma et al., 2018).
Megafauna bycatch is a high conservation concern for which there is often inadequate data (Figueiredo et al., 2020; Mannocci et al., 2020). Specifically, in data-poor regions, accessing data required for assessments may be difficult due to the natural complexities of fisheries, especially among artisanal or small-scale fisheries (SSF) (FAO, 2020; Verutes et al., 2020). SSF’s are broadly defined as smaller vessels with lesser tonnage, that largely use manual labor as opposed to mechanical equipment, and fish predominately in neritic waters. As SSF’s tend to involve fishers who often use more than one gear type, may move between ports with seasonal changes, and have no monitoring technologies, few data are available that capture the intricate details of their gear use, spatial extent, and experience, especially concerning bycatch (Berkes et al., 2001; Cashion et al., 2018; Castillo et al., 2018). SSF’s, as do all fisheries, have varying amounts of bycatch, with many unknowns related to risk factors, spatial extent, and quantity (Alfaro-Shigueto et al., 2010, 2011; Alava et al., 2017; Gray and Kennelly, 2018).
Among less accessible SSF’s, conducting surveys and hosting participatory workshops with fishers are methods that have proven promising in incorporating local knowledge in the data sharing process and aid in bycatch estimates and mitigation efforts (Mancini et al., 2012; Thiault et al., 2017; Ayala et al., 2019; Mason et al., 2019). Direct fisher interviews used for rapid assessments of bycatch have offered a low-cost and approximate measure of incidental capture of marine megafauna allowing for proper risk assessments, including spatial components of information (Moore et al., 2010; Pilcher et al., 2017).
To support effective conservation that truly includes communities, thorough analyses are needed of the social, biological, and economic factors involved in conservation efforts such as understanding various threats to species vulnerable to bycatch. This process of combining many factors to assess risk and possible consequences contribute to risk assessments (Holsman et al., 2017). Risk assessments are a quantification of an uncertainty which examines both a threat’s probability of occurrence and the consequence of that threat (Gibbs and Browman, 2015). In an environmental context, these assessments often narrow in on anthropogenic threats to an environment or species of interest while also emphasizing geographic locations as an important component in quantifying levels of risk (Arkema et al., 2014; Brown et al., 2015; Breen et al., 2017). Within fisheries, for example, risk assessments supported by local knowledge help managers, local community, and stakeholders understand challenges attributed to diverse fishing practices and identify areas of conservation needs that may be overlooked if not well-examined, such as bycatch (Hobday et al., 2011).
In data-poor regions, stakeholder input and consultation not only fill data gaps but offer opportunities for communities to acquire ownership of resource management and resource-related decision-making (Yang and Pomeroy, 2017; Zolkafli et al., 2017; Castellanos-Galindo et al., 2018). Community ownership over conservation measures can be supported by researchers and local non-profits by collaborating with local fishers and community members to aid in documenting data, facilitating projects, and synthesizing community needs (Moore et al., 2017; Szostek et al., 2017; Chung et al., 2019; Brandt et al., 2020).
For example, participatory mapping exercises with stakeholders have encouraged the development of more holistic environmental analyses by using maps to initiate conversation and incorporate different perspectives and knowledge (Levine and Feinholz, 2015; Luizza et al., 2016; Leis et al., 2019). Online and digital mapping platforms such as Geographic Information Systems (GIS) offer a powerful tool for spatial analysis and visualizations to support the collection and organization of data from varying sources (Nelson and Burnside, 2019). GIS has been especially beneficial to the field of conservation when the relationship between people and environment can be explicitly visualized spatially and temporally (Noble et al., 2019).
This process of collaboration with community members, transferring their experiences and understanding of their environments via mapping exercises is called Participatory GIS (PGIS) (Dunn, 2007). PGIS is a low-cost method that has been used in many studies to guide ecosystem management (Croll et al., 2005; Levine and Feinholz, 2015; Strickland-Munro et al., 2016), estimate fishing effort (Thiault et al., 2017), provide location data for rare or endangered species distributions (Rajamani, 2013; Mason et al., 2019), assess anthropogenic threats to coastal environments (Moore et al., 2017; Castellanos-Galindo et al., 2018), and estimate the distribution and magnitude of bycatch (Moore et al., 2010; Pilcher et al., 2017). The various obstacles and challenges associated with identifying the risk of bycatch in SSF can benefit from incorporating different pieces of the puzzle by using PGIS (Lewison et al., 2018). Problems as complex as bycatch can use risk assessments to examine opportunities for marine megafauna conservation among fisheries by simulating complex processes.
Risk assessments are more likely to reflect on-the-ground conditions if coastal community members are actively involved in the discussion and implementation of the risk assessment process (Campbell and Cornwell, 2008; Sawchuk et al., 2015; Visalli et al., 2020). The Bycatch Risk Assessment (ByRA) (Figure 1), a spatially explicit analysis that can integrate PGIS data collection methods, was first tested in several southeastern Asian fisheries (Hines et al., 2020; Verutes et al., 2020). The ByRA model offers a structural framework specifically for assessing bycatch in data-poor fisheries by making use of available information and incorporating expert opinion and local stakeholder input via fisher interviews to guide place-based management recommendations for reducing bycatch. Fisher interviews are inevitably dependent on fisher’s experiences and willingness to contribute to the sharing of bycatch data (Arlidge et al., 2020). However, by including fisher input, final outputs are more likely to be applicable to end-users and can be tailored to fisher’s needs (Scholz et al., 2004; Aburto-Oropeza et al., 2018). In areas with partial data due to limited personnel, training, and funding to support bycatch mitigation strategies, a participatory risk assessment framework, such as ByRA, may be an effective option to examine bycatch and initiate fisher input (Alava et al., 2017).
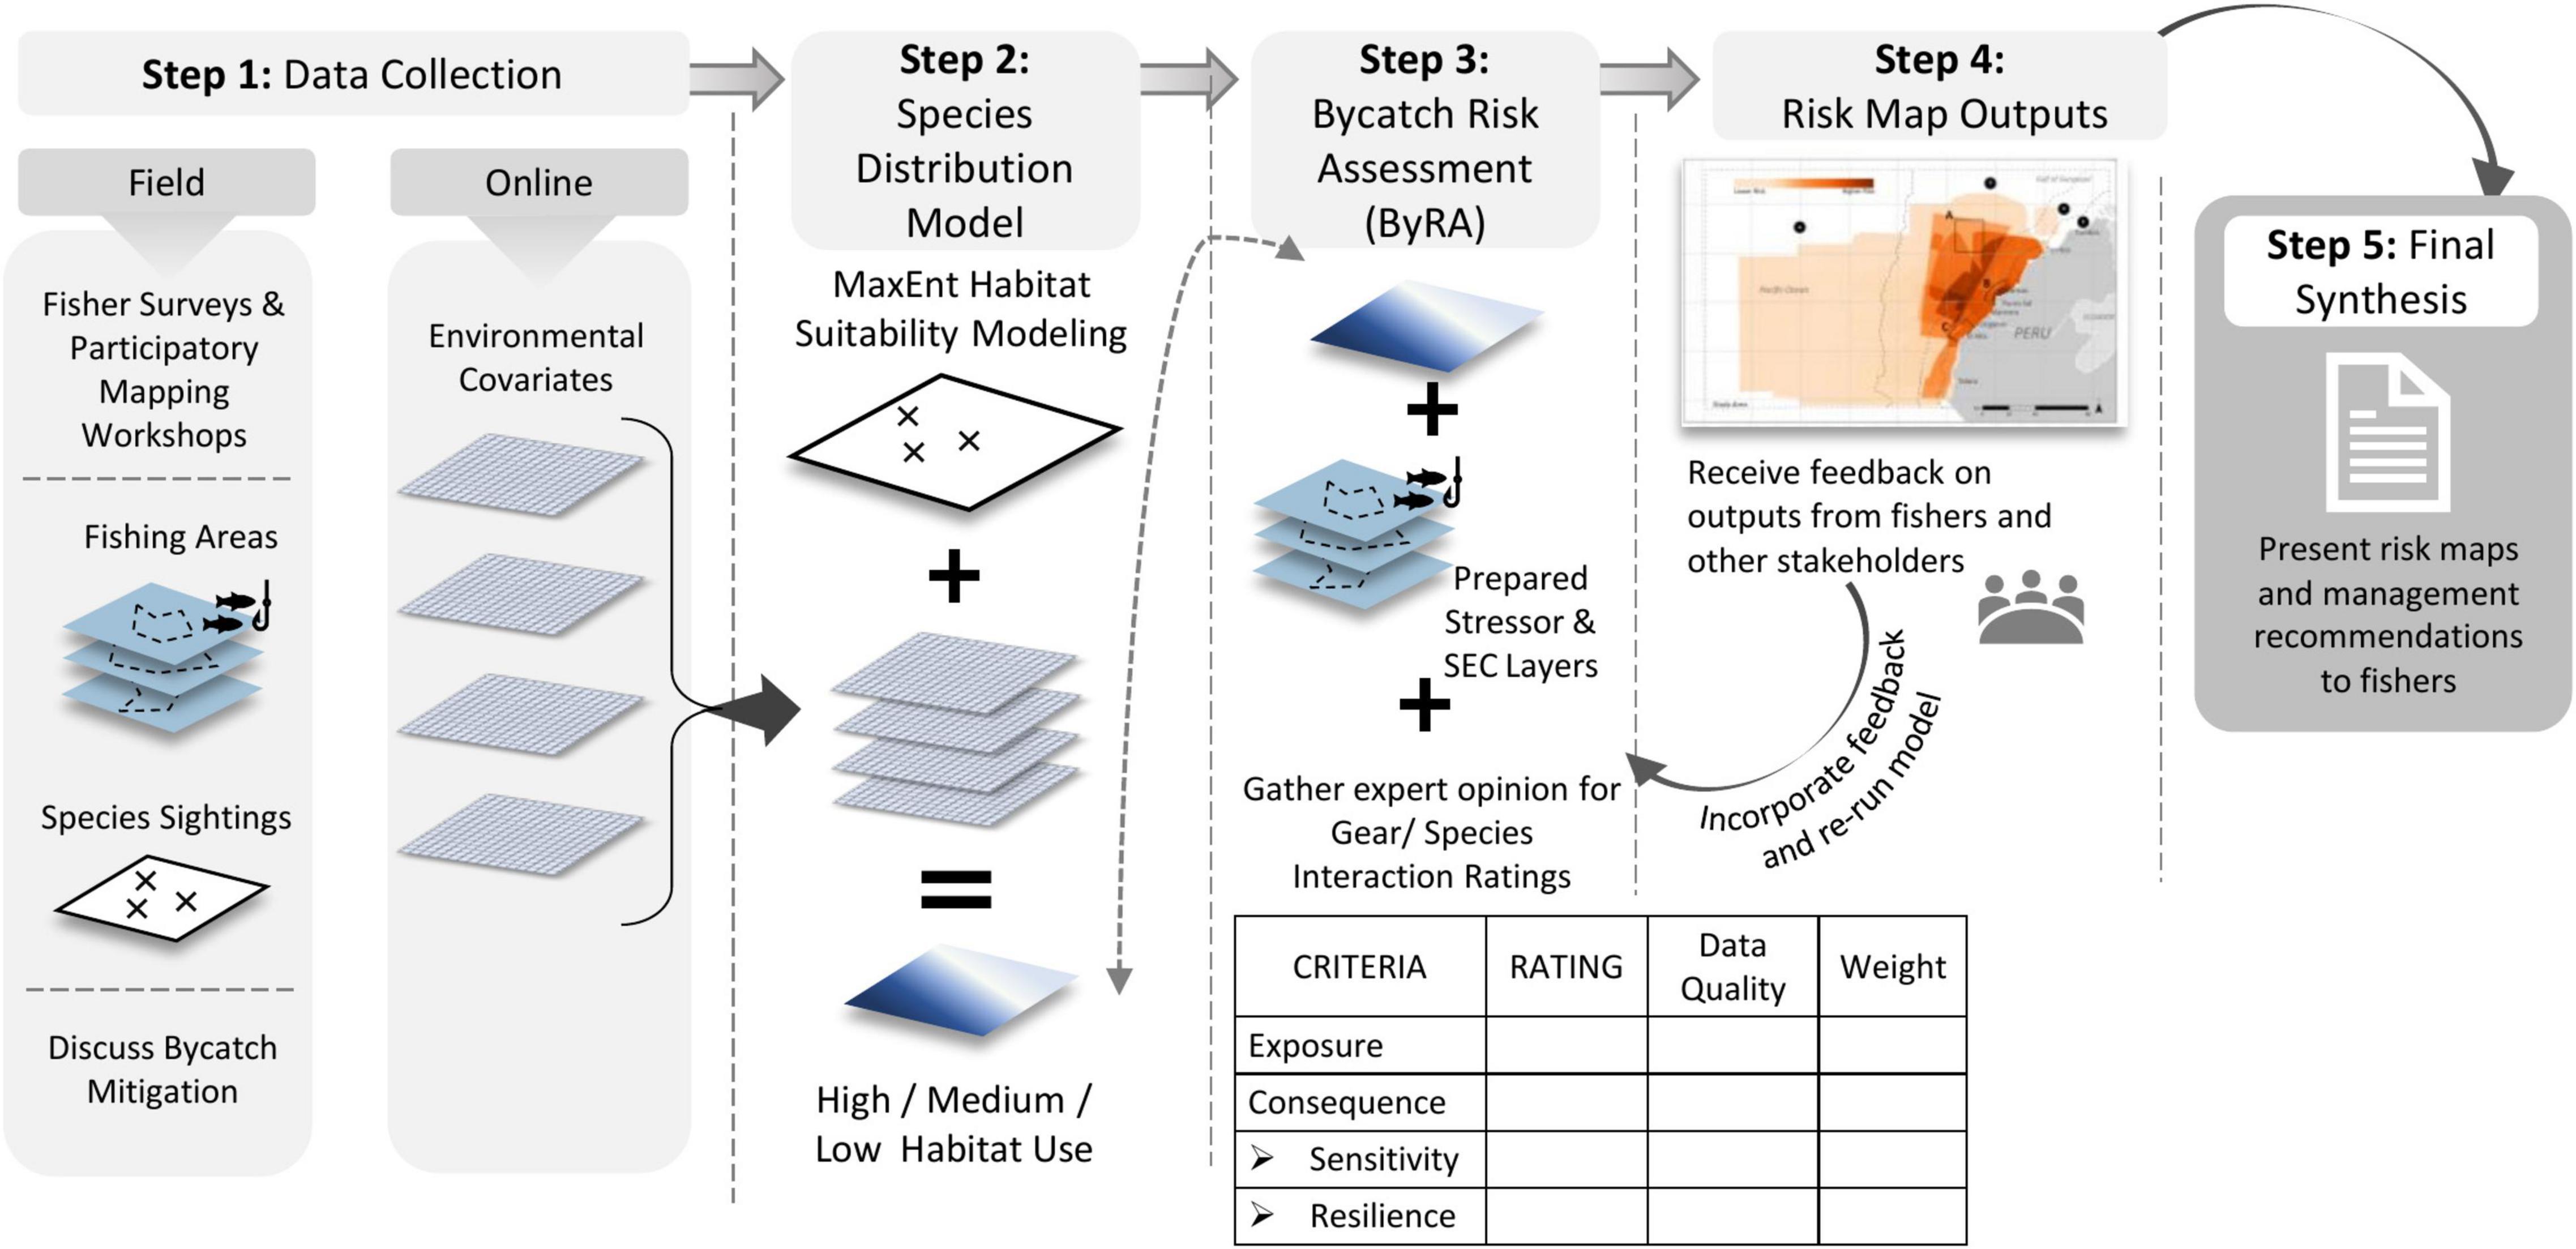
Figure 1. Conceptual model of the Bycatch Risk Assessment (ByRA) process used in our case study. ByRA begins with data collection in Step 1 and ends with the Final Synthesis of the risk maps and recommended management strategies. Each step depicts the basic spatial layers necessary for completing the step and how the output of one process flows into the next. Fisher participation was prevalent in Step 1, 4, and 5 for data collection, data review, and output presentation and discussions. See Verutes et al. (2020) for further description on ByRA model including how ratings scores are assembled, and risk plots are determined.
For this case study, we applied the ByRA model with the following specific objectives: (1) use PGIS to identify areas of fishing and high risk for bycatch of two marine megafauna, (2) provide a spatio-temporal assessment of bycatch risk, and (3) identify gaps in current data monitoring. The ByRA model, run through the freely downloadable software, can be broken down into four phases: (1) conduct a species distribution model for each species, (2) identify and prepare models of fisheries stressors, (3) complete interaction ratings from expert opinion (i.e., bycatch exposure and consequence criteria) for each species (Table 1), and (4) produce risk maps that interpret findings to non-expert stakeholders.
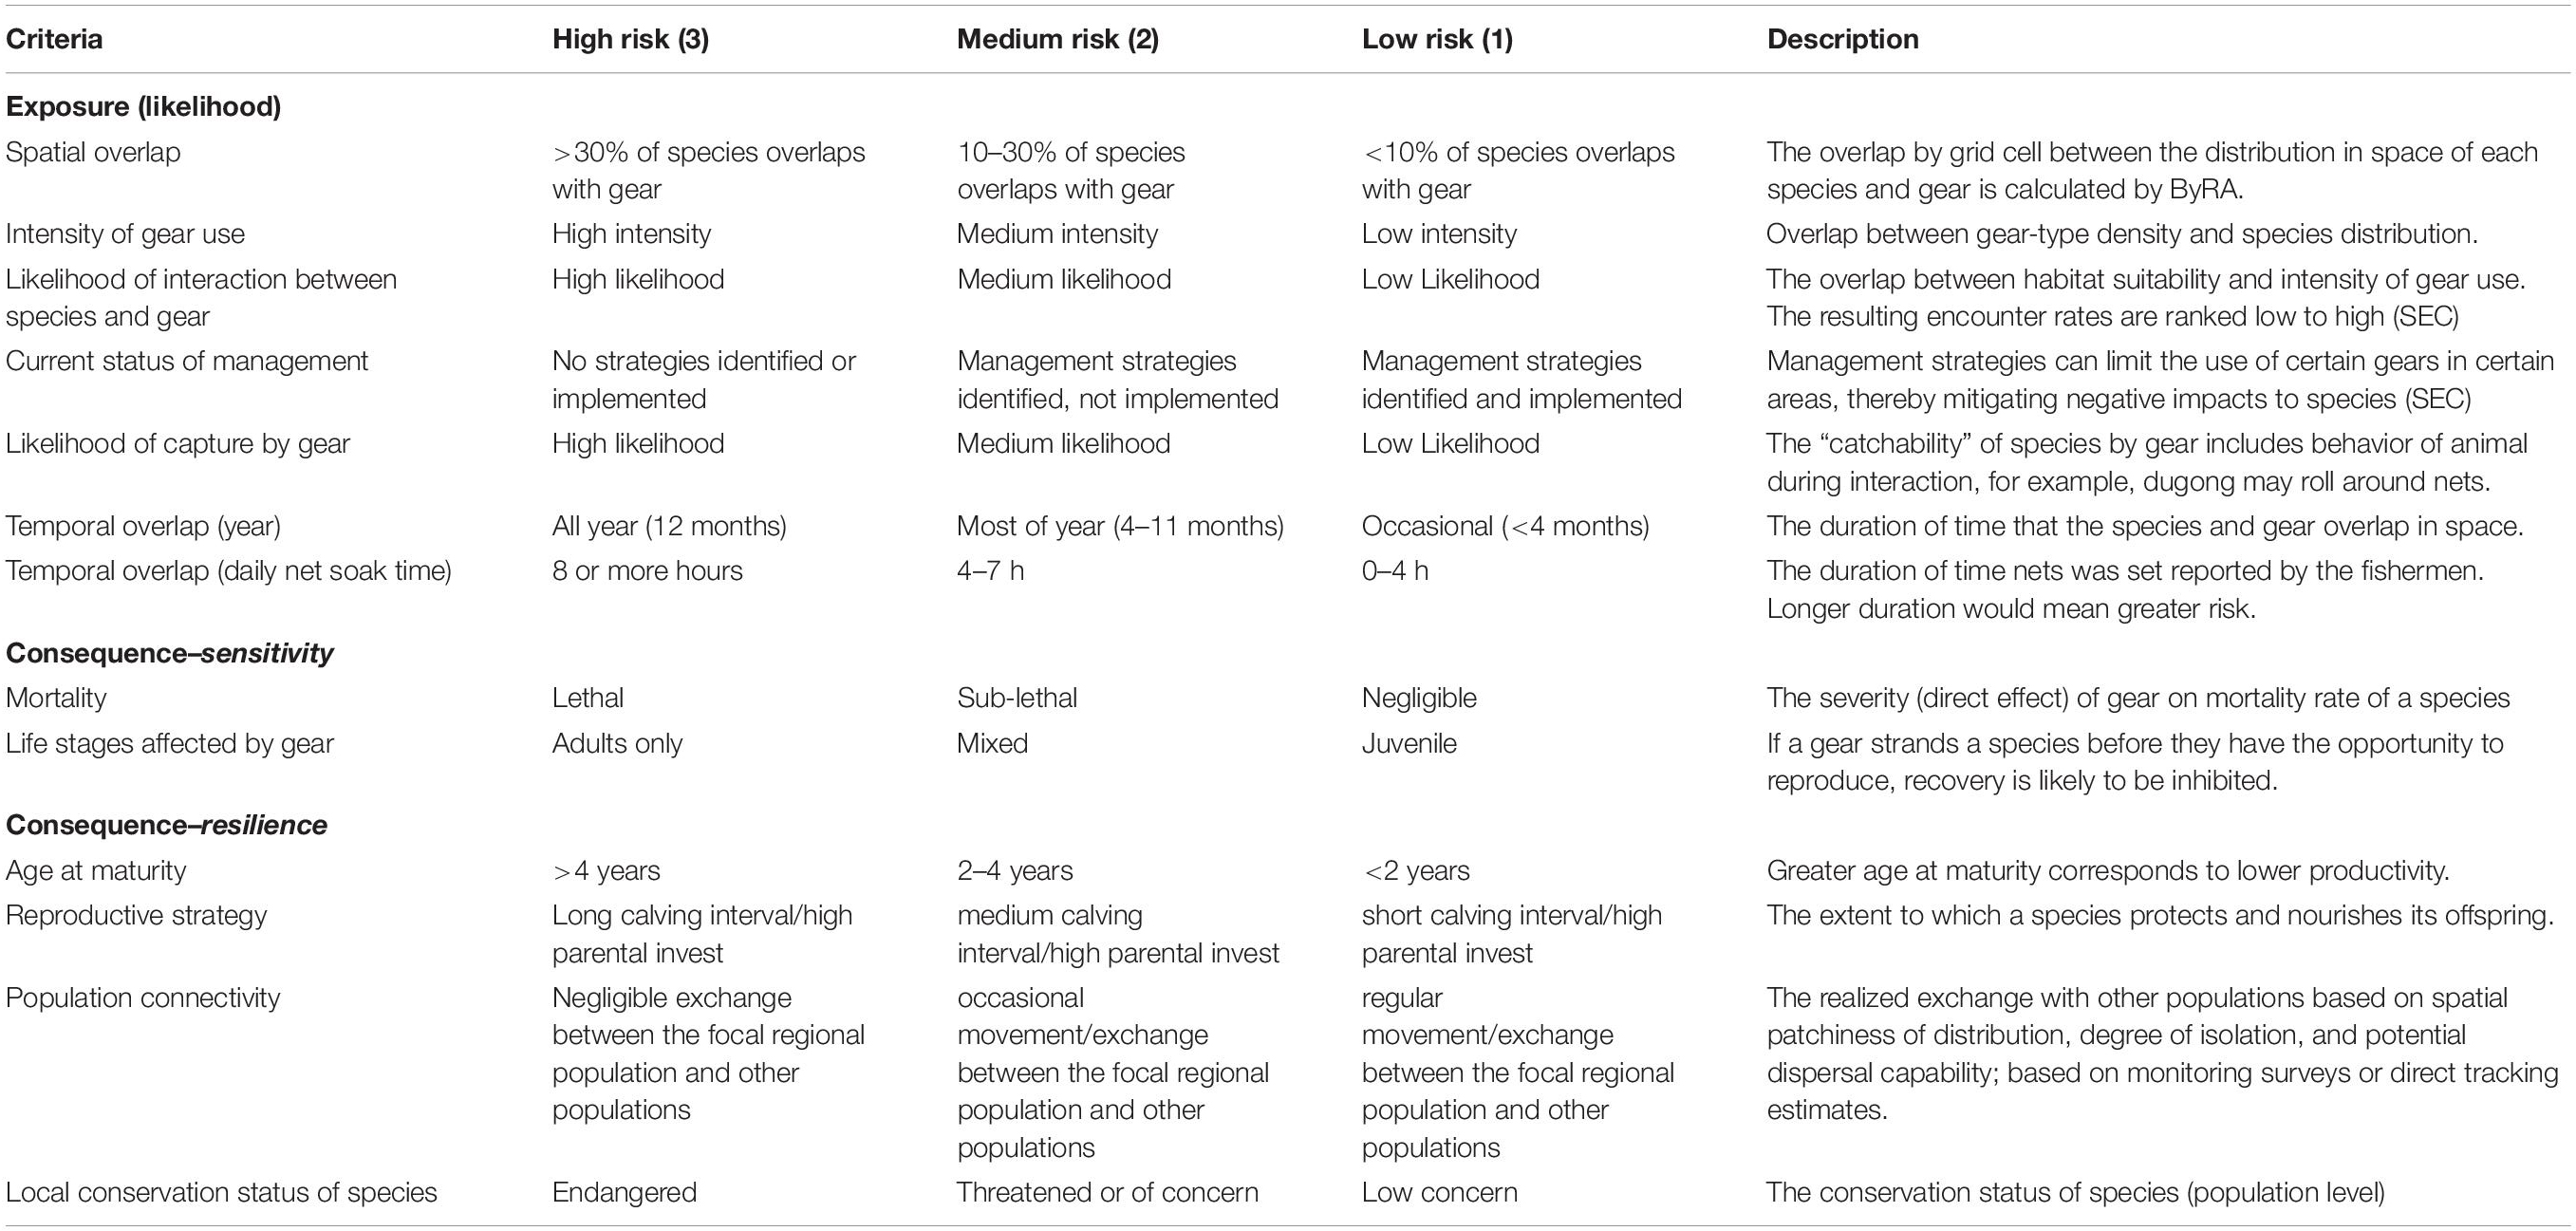
Table 1. Exposure and Consequence scoring criteria and definitions used to guide final ratings derived from Verutes et al. (2020).
Case Study
Along the northern coast of Peru, two large oceanic current systems converge and mix to create the highly biodiverse Tropical Eastern Pacific Bioregion, hosting over 70% of Peru’s marine biodiversity (Spalding et al., 2007; Hooker, 2016). This overlap of productive, nutrient-rich waters supports both diverse marine life and fishers who harvest the commercially valuable fish [e.g., tuna (Thunnus albacares), smooth hammerhead sharks (Sphyrna zygaena), swordfish (Xiphias gladius), thresher sharks (Alopias spp.), among others]. By 2015, an average of 5,100 SSF vessels were operating in the northern regions of Piura and Tumbes, Peru, providing vital sources of direct consumption of protein at local and national scales, as well as job security, employing over 27,500 fishers (Castillo et al., 2018). These waters also present a persistent risk of bycatch of non-targeted species (Alfaro-Shigueto et al., 2011; García-Godos et al., 2013). Various species of conservation concern within this area such as small cetaceans, sea turtles, sea birds, sharks, and large cetaceans have been documented as bycatch, which predominantly occurs in gillnets and longline gear in these regions. Gillnets act like underwater spiderwebs able to capture many marine megafaunal species that can become entangled and drown. This outcome is similar to that of baited longlines that attract unwanted catch via the bait hooked on the lines. Some government organizations interact with SSFs including the Dirección de Capitanías y Puertos (DICAPI) who is the regional government authority who patrols the coast, Pesquería del Ministerio de la Producción (PRODUCE) who monitor fisheries, and the Instituto del Mar del Perú (IMARPE) who is the research arm of PRODUCE. Though there is an active presence of these organizations in the region, there is currently little to no bycatch regulation enforcement, and bycatch incidents go unreported (Van Waerebeek et al., 1997; Mangel et al., 2010; Arlidge et al., 2020).
Two species that highlight this national issue are the Southeast Pacific humpback whale (HBW) (Megaptera novaeangliae), and the Eastern Pacific leatherback turtle (LBT) (Dermochelys coriacea). These two large, charismatic megafaunas have differing conservation status, yet share similar severe threats, including bycatch (Alfaro-Shigueto et al., 2008; Félix et al., 2011; García-Godos et al., 2013; Ortiz-Alvarez et al., 2020).
The Southeast Pacific HBW population is listed as Least Concern in the IUCN Red List (Cooke, 2018). García-Godos et al. (2013) published the only account of HBW bycatch in northern Peru, documenting a total of ten stranding events between 1995 and 2012 gathered from local news, online evidence, and direct observations. Of these events, nine were entanglements due to drift nets and one from a longline. There have since been continued accounts of entanglements as the humpbacks’ coastal migratory route and the southern limit of their winter breeding grounds overlap with SSF operations in northern Peru (Rasmussen et al., 2007; Félix and Botero-Acosta, 2011; Guidino et al., 2014; Pacheco et al., 2021). This threat heightens from mid-July through October when whale presence peaks in northern Peru (Félix and Guzmán, 2014). Rope entanglements can be debilitating to whales by weakening their ability to swim, forage, and mate, increasing their susceptibility to infection (Félix et al., 2011; Moore and van der Hoop, 2012).
The Eastern Pacific population of LBT is listed as Critically Endangered by the International Union for the Conservation of Nature (IUCN) Red List, highlighting bycatch as a primary threat (Wallace et al., 2013). In the last three decades, the EP leatherback turtle population has experienced a greater than 90% decline (Spotila et al., 2000; Shillinger et al., 2008). Predominantly during the austral summer (November–May), adult EP leatherbacks travel from nesting sites in southern Mexico, Costa Rica, and Nicaragua, crossing paths with numerous fisheries, to forage for jellyfish, including to waters off northern Peru (Alfaro-Shigueto et al., 2011; Hoover et al., 2019). Juvenile EP leatherbacks may also be present year-round in and around the study area (Hoover et al., 2019). Leatherback turtle bycatch has been noted from strandings, on-board reporting, and shore-based surveys with fishers (Alfaro-Shigueto et al., 2018; Arlidge et al., 2020; Ortiz-Alvarez et al., 2020).
Bycatch, especially entanglements of large whales, also places burdens on fisher’s funds, time and safety. Whale entanglements cause an estimated average loss of $300 USD to the fisher per gillnet pane, which can be a high financial loss given that each vessel has ca.30 panes (Alfaro-Shigueto et al., 2010). Fishers also lose time when fishing, spent on disentangling and discarding unwanted catch, and can risk their lives if they decide to engage in disentangling larger whales. De la Puente et al. (2020) demonstrates that bycatch of megafauna is a significant economic burden that has become debilitating to fishers over time. Due to Peru’s dependence on fisheries and the rapid growth of the SSF industry, bycatch management is essential to support megafauna welfare and ecosystem health, as well as support the ability of fishers to continue their trade (De la Puente et al., 2020).
A 2017 provision under the United States Marine Mammal Protection Act (MMPA) will play a role in motivating the development of national regulations (Williams et al., 2016). This provision requires foreign fisheries that export seafood to the U.S. to develop regulatory management that includes estimates of marine mammal abundance, bycatch assessments as well as the implementation of mitigation efforts, and the establishment of programs to monitor and report bycatch (Oceanic National and Administration Atmospheric [NOAA], 2016). SSF’s may struggle to comply with these provisions, though building relationships between managers and other stakeholders is encouraged to guide initial regional programs and data collection (Johnson et al., 2017). Although not all fishers in the northern Peru region export to U.S. markets, the presence of conservation measures may have a spill-over effect on SSF practices and handling of bycatch (Williams et al., 2016).
Methods
Study Sites
We conducted the ByRA model in two fishing ports in northern Peru: Mancora (4° 06′ 38″ S, 81° 04′ 01″ W) and Cancas (3° 56′ 41″ S, 80° 56′ 25″ W) (Figure 2). The adjacent coastal and open-water study area spans over 125 mi (>200 km) of coast from Talara to Tumbes, Peru and west across the ocean to the 82° 40’ W longitudinal coordinate, covering a total area of just over 40,000 km2 (15,000 mi2). These sites were selected because they fall within the core seasonal distribution of SP humpback whales and seasonal foraging range of EP leatherback turtles (Bailey et al., 2012; Guidino et al., 2014) and have well-established small-scale net fisheries with known but poorly quantified bycatch interactions (García-Godos et al., 2013). This region also has growing tourism industries (including whale-watching), and ProDelphinus, a Peru-based NGO and the local collaborator, has a few established contacts in the region. Additionally, the Tropical Eastern Pacific Bioregion has received national conservation interest for possible implementation of several marine protected areas in part due to a prominent seamount, locally known as Banco de Mancora, situated northwest approximately 60 km off the coast, considered an area of high importance for marine biodiversity (Figure 2; Nakandakari, 2012; Servicio Nacional de Áreas Naturales Protegidas por el Estado, n.d.). Predominant gear types operating out of these ports are gillnets, longlines, and handlines, with fewer vessels using purse seines (Guevara-Carrasco and Bertrand, 2017). The most recent national fisheries survey from 2018 reports 5,601 and 21,943 small-scale fishers operating out of Tumbes and Piura regions, respectively, with estimated numbers increasing over the last near decade (Castillo et al., 2018).
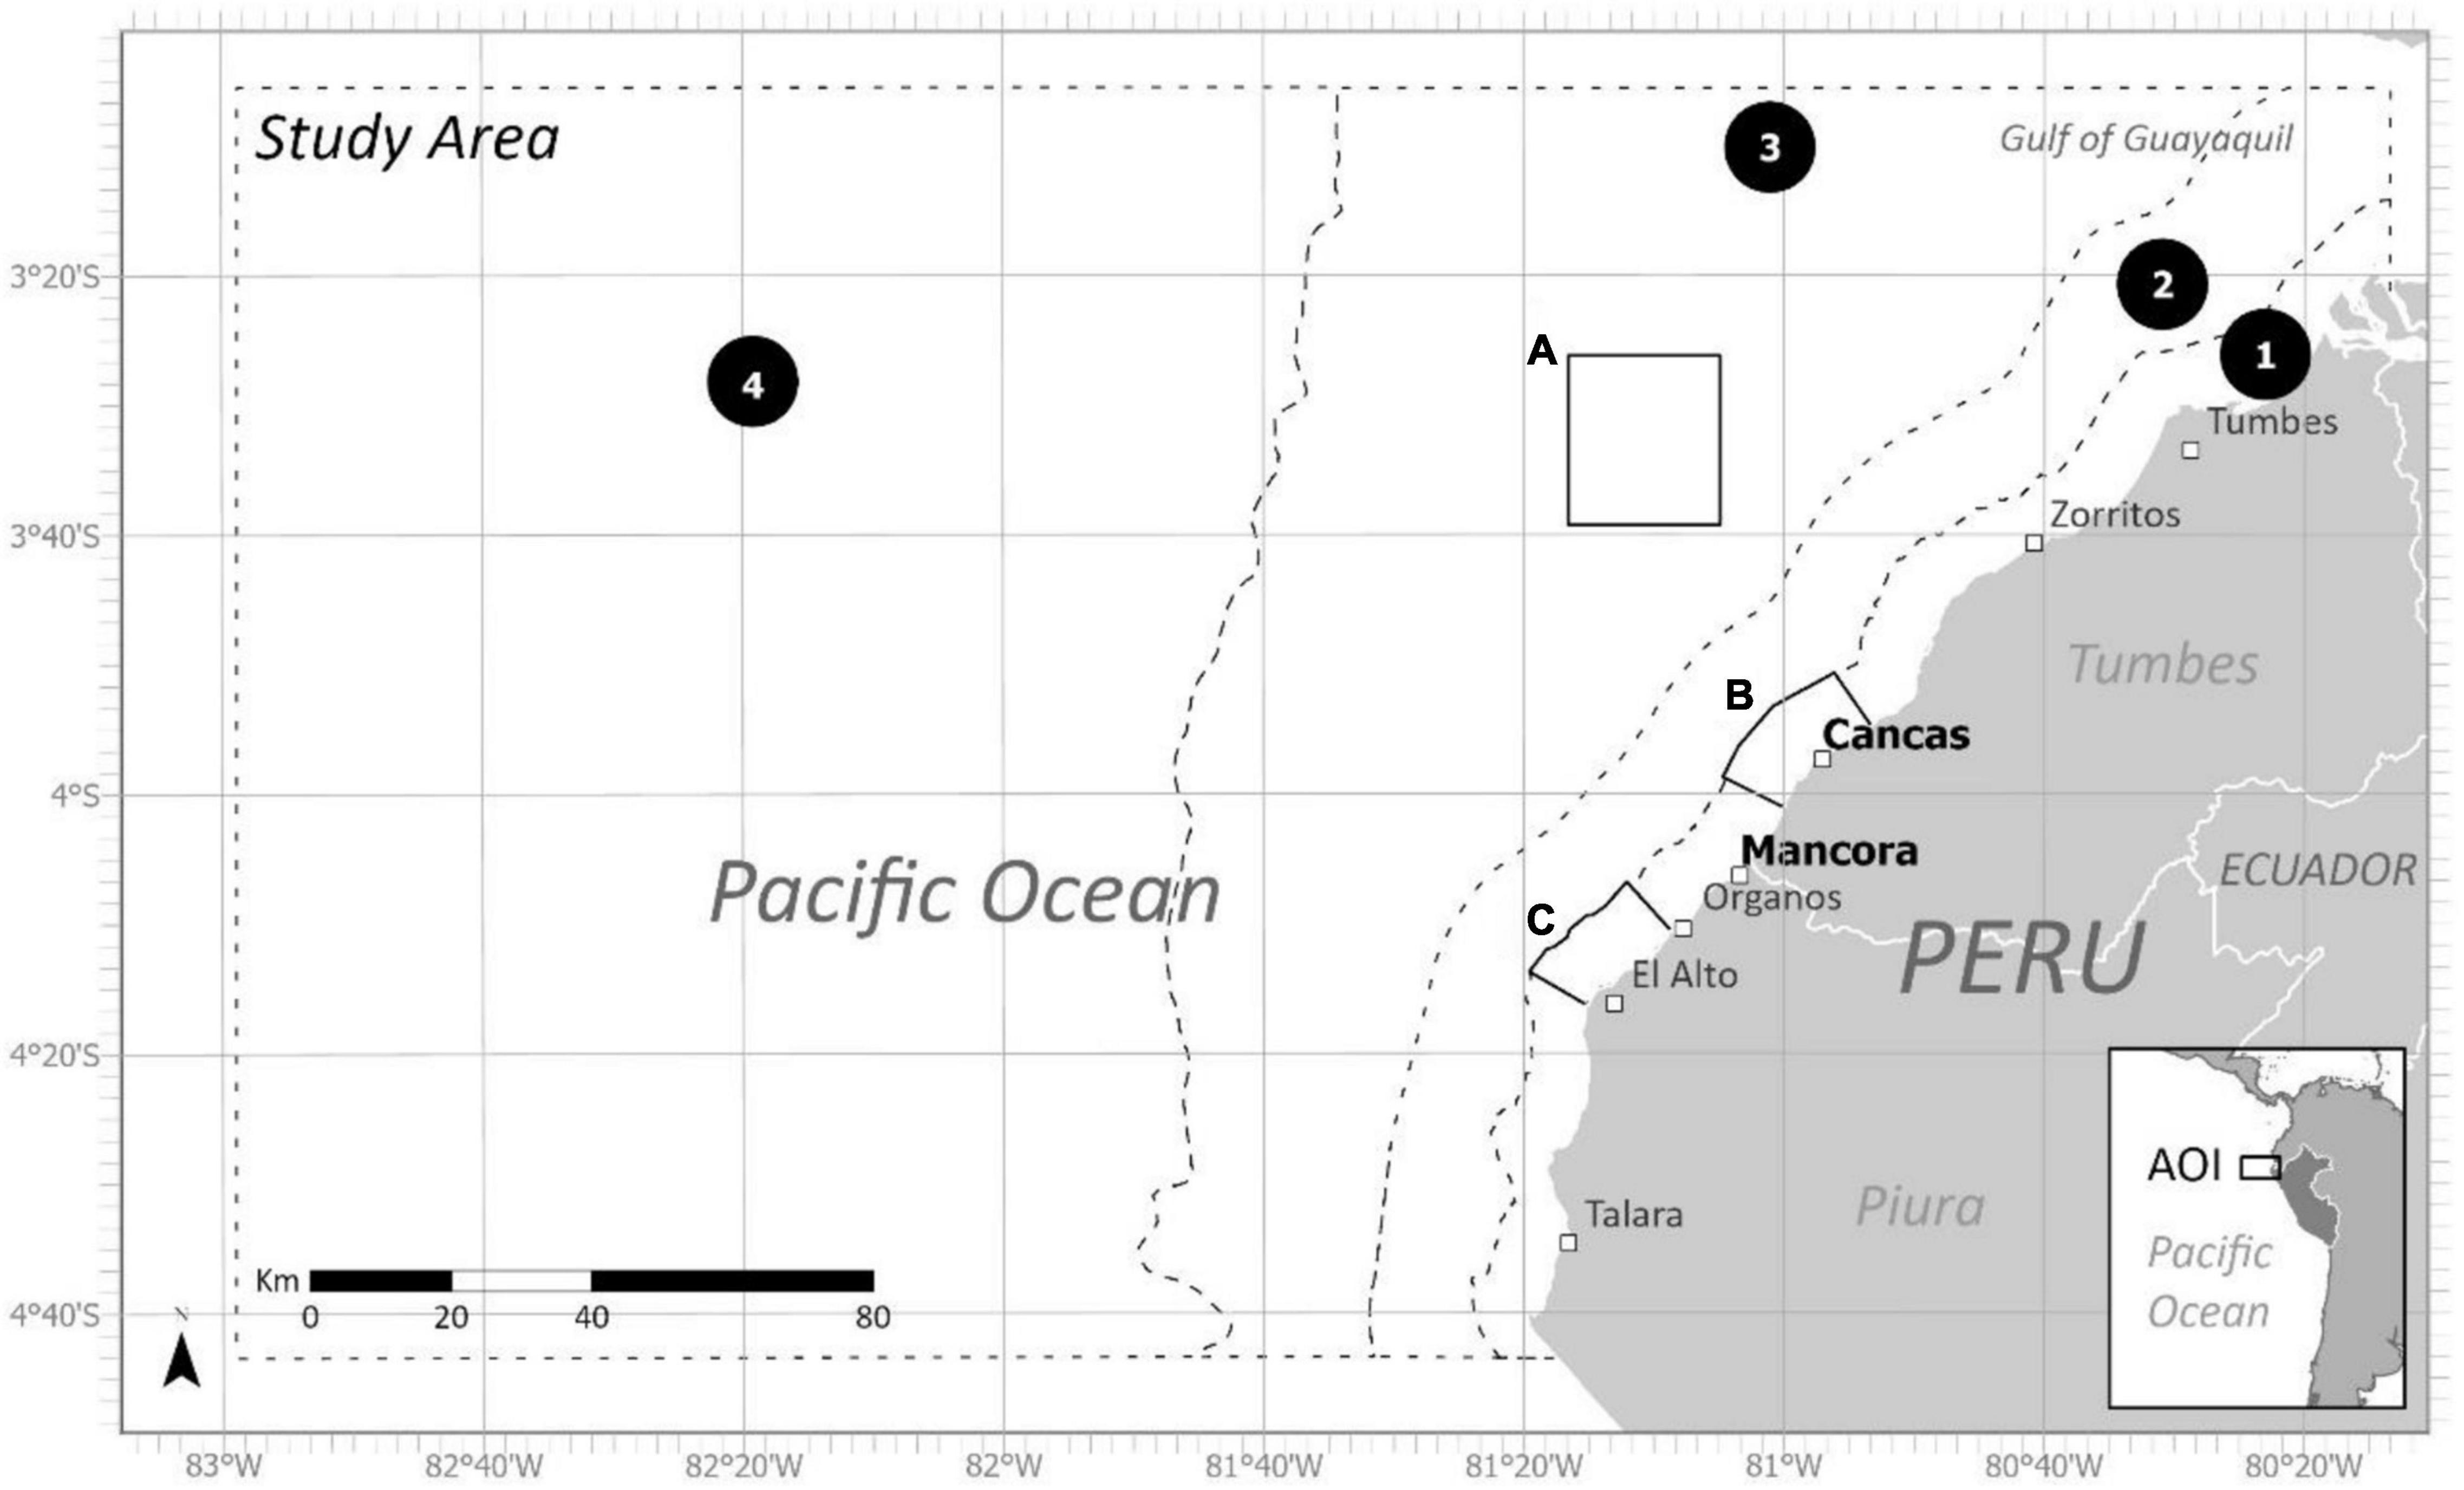
Figure 2. Northern Peruvian coastline and the two fishing ports where interviews were conducted- Mancora and Cancas. Map is divided into study area and seven additional subzones. Zone (1) delineates the 5 nm artisanal fisheries boundary, Zone (2) delineates the 12 nm territorial seas boundary, Zone (3) delineates the cut-off for the bathymetric shelf, and Zone (4) contains the waters beyond the shelf. The second group of subzones were the boundaries of three proposed Marine Protected Areas including (A) Banco de Mancora, (B) Arrecifes de Punta Sal, and (C) Cabo Blanco–El Ñuro.
Initial Interviews and Workshop
A total of 85 semi-structured, one-on-one, GIS-based interviews were conducted by our team between July and August of 2019 in two ports, Mancora (n = 55) and Cancas (n = 30) (Figure 2). The questionnaire was based on Pilcher et al. (2017) and translated into Spanish. The questionnaire contained 72 questions that covered topics of basic demographics, fisheries data, previous animal sightings, vessel-animal interactions, and conservation perceptions (Supplementary Appendix A). For the PGIS part of the interview, using paper maps of the study area (Supplementary Appendix B), we requested that respondents draw polygons for fishing areas they used, and HBW and LBT habitat areas, and points for animal sightings and locations where they had entangled or seen entangled HBW or LBT. We first asked the fishers to mark the map where they sighted HBW and LBT from the previous year, previous 5 years, and then any remaining information from the fisher’s lifetime. A table was used to record attributes of the point data (e.g., date, number of individuals, animal condition). We shared a base map with several local geographic references to help guide the fishers, including bathymetry contours of 200 m and names of coastal towns (Supplementary Appendix B). We documented and grouped fishing gear into a total of six common gear type categories: (1) gillnet surface, (2) gillnet bottom, (3) longline surface, (4) longline bottom, (5) purse seine, and (6) hook and line.
We used both purposive and snow-ball sampling methods for finding interview participants (Goodman, 1961; Denzin and Lincoln, 2018). Key contacts, who were either well-connected fishers, respected port leaders, or local officials, assisted in introducing us to interview participants. With their help, we specifically sought out captains to avoid duplicate information from individuals on the same vessel (83 and 76% of participants were captains from Mancora and Cancas, respectively). Additionally, we believed captains would be more familiar with, and knowledgeable of our study area due to their longer years of fishing experience. We sought to interview one third of vessels at each port with a focus on the gear types that have been documented previously in local bycatch events (longlines and gill nets). We estimated total vessels for both ports by conducting shore counts of vessels docked at the harbors (Mancora = ∼200, Cancas = ∼100). For our research, the sample group attained was meant for a qualitative analysis of the fishers at each port as well as attain key information regarding fishing activity. Two of the interview participants were not active fishers, but rather worked in the local whale-watching and tourism industry and only offered data on animal sightings. Interviews took under an hour to complete, were conducted in Spanish, and then translated into English for analysis. Each interview began with a statement describing the project goals, and our emphasis on using information for research purposes only. We also explained that the data collected would not be shared with other entities and would be used for research purposes only. This research protocol was approved by the San Francisco State University Institutional Review Board for Human-Subject research on June 20, 2019, Protocol number X19-30.
Interviews were divided into species-specific sections. We used a skip pattern where if a participant stated they never saw a humpback whale (Q17) or a leatherback turtle (Q47), we would end that section of the interview and continue to the next section or go to the final question (Q71). All interview responses were recorded using physical copies of the questionnaire where answers were marked, though three interviews were audio recorded with permission from fishers to recall details later for analysis. Additionally, in August 2019, we hosted a mapping workshop with fishers from Mancora. The goal of the meeting was to review the study area maps as a whole and have an open discussion on the solutions and concerns of bycatch.
Analysis of Interviews and Participatory Maps
All interview responses were transcribed into a spreadsheet, then coded to identify emergent themes from the qualitative responses (Saldanþa, 2009). Participatory maps from interviews were photographed and imported into a GIS where map images were georeferenced and overlaid atop a base map in the GIS. Hand drawn polygons and point features were digitized in order to transfer information as accurately as possible. Associated table data were attributed to each polygon (e.g., gear characteristics, months fished, target species, etc.) and animal sightings point data (e.g., date and time observed, number and condition of individuals, etc.) (Supplementary Appendix B). Fishery polygons were divided among two seasons: austral winter and austral summer, based on fisher input and oceanic conditions (Pennington et al., 2006; Bakun and Weeks, 2008). We recognize that seasonal transitions exist between winter and summer, but for simplicity in describing oceanic conditions and the regional peak whale season, we chose to capture two temporal scenarios. Winter season was defined as June through November, and summer season as December through May. Participants who declared they fished all year were attributed to both summer and winter groupings.
After digitizing the participatory paper maps, all category specific polygons were combined into groups. The groups were: (1) fishing areas by port, season, and gear type (example: Mancora, winter, longline surface) and (2) fisher-perceived habitat of humpback whales and leatherback turtles. We used a count of overlapping polygons on the groups to create density maps of all group specific overlapping polygons. These maps roughly identified where the fishers perceived the greatest fishing density area and the spatial extent of the study species’ habitat within the study area (Appendices C, D). The second group of maps consisted of previous animal sightings as point data. These data were run through a kernel density estimation (KDE) that interpolates a surface by estimating the spatial extent and density of species presence (Kenchington et al., 2014) (Supplementary Appendix E). Species maps were printed in large poster format for group review, whereas gear maps were printed on standard letter size for individual reviewers.
Map Review Workshops
Researchers returned to northern Peru for mid-project map review workshops on the 22nd and 23rd of January 2020 in Cancas and Mancora, respectively. The goal of the workshops was to present data collection results and receive feedback on combined data input for corrections and clarifications into the ByRA model. Specific feedback focused on winter and summer season divisions, accuracy of gear use locations, and accuracy of species sightings and habitat.
In the workshops we presented maps containing all of the spatial data gathered from initial interviews. Participants were encouraged to invite other fishers to gather as much feedback as possible in the workshop, regardless of whether they had previously participated in the initial interviews conducted months before. For Cancas, both returning (3) and new participants (15) attended the workshop. We asked the fishers whether the maps generally reflected where they see the species. If not, they were asked to mark on the map the correct locations. The maps were marked using a dry-erase marker as appropriate or were noted OK if approved by participants. After this, we distributed individual, gear-specific paper maps to each participant depending on the type of fishing gear they used. Each paper showed a fisheries density map on one side and two questions on the back asking if the map reflects their own and other fisher’s fishing areas, with an area to elaborate on their response. Papers were collected and photographed to be transcribed and later incorporated to revise or reaffirm input into the ByRA.
We hosted two smaller map reviews in Mancora. Three fishers and one whale-watching employee attended the map review. Four additional fishers were also identified and participated in a review on a fishing boat. The same questions were asked, and paper maps distributed, reviewed, marked, and re-collected to be photographed and transcribed.
Building Habitat Models
Sightings data gathered from our PGIS exercises were then used as input into presence-only models to determine the distributions of our study animals. We chose a maximum entropy likelihood model, MaxEnt, to model habitat preferences from a combination of environmental variables and known species occurrences (Phillips et al., 2017). Maxent is one of the most prevalent models of choice among ecologists due to its simple user interface, predictive power, and presence-only inputs. Maxent accepts smaller sample sizes at a minimum of 30 occurrence points to produce outputs with acceptable statistical power (Tobeña et al., 2016).
A total of 215 previous animal sighting points were collected for humpback whales, and 79 for leatherback turtles. We removed sighting points that had no specified month or year. Additional sighting points were removed that came from surveys where the interviewer did not feel confident in the fisher’s ability to distinguish among the species reported (Question 80, n = 5). To remove spatial autocorrelation and reduce sample bias, we used the SDMtoolbox v2.0 to spatially rarefy the presence points with a 5 km buffer for humpbacks and a 2 km buffer for leatherbacks (Kramer-Schadt et al., 2013; Brown et al., 2017). These values were chosen based on the size of the study area, the distribution of the animal presence points, and the scale of which the species’ have occupied space in the area (Guidino et al., 2014; Hoover et al., 2019). Due to a recommended minimum number of 30 occurrence points to show any reasonable statistical power within MaxEnt, we were unable to model either humpback habitat for the austral summer (n = 27), or leatherback habitat for austral winter (n = 17) (Tobeña et al., 2016). Total presence points used for humpback whales were reduced to 75 for the austral winter months (i.e., local whale season), and 35 presence points for leatherback turtles for the austral summer.
A total of eight candidate environmental variables were selected based on previous animal habitat suitability studies and features of ecological importance which have influence on physical processes that may signal safe havens for the species or promote prey availability (Fiedler et al., 2018). The eight included: sea surface temperature (sst), bathymetry (bathy), chlorophyll a (chlora), and k490 coefficient (k490), as well as GIS derived variables: Euclidean distance to bathymetric shelf break (distShelf), distance to shore (dist0), and distance to 200 m isobath (dist200) (Dransfield et al., 2014; Derville et al., 2018; Hoover et al., 2019; Table 2). All variables were plotted on a 1.67 km2 grid of cells, the smallest cell size of the covariate data sources. This spatial scale helped capture the high resolution of fisher-drawn polygons to aid in management recommendations and the practical use of map outputs. Monthly averages of covariates were then averaged for each seasonal range, resulting in eight layers for each season with the same spatial extent, cell size, and coordinate system. Values were extracted for each presence sighting point from appropriate months and years, then were modeled against randomized background points as pseudo-absences in the MaxEnt program. Final distribution models were assessed using two metrics: (1) area under the receiver operating characteristic curve (AUC ROC), and (2) a true skills statistic (TSS) test, in addition to visual comparisons between the Maxent output maps if AUC and TSS were comparable between the final models. Model selection and evaluation is described further in Supplementary Material under Species Distribution Models.
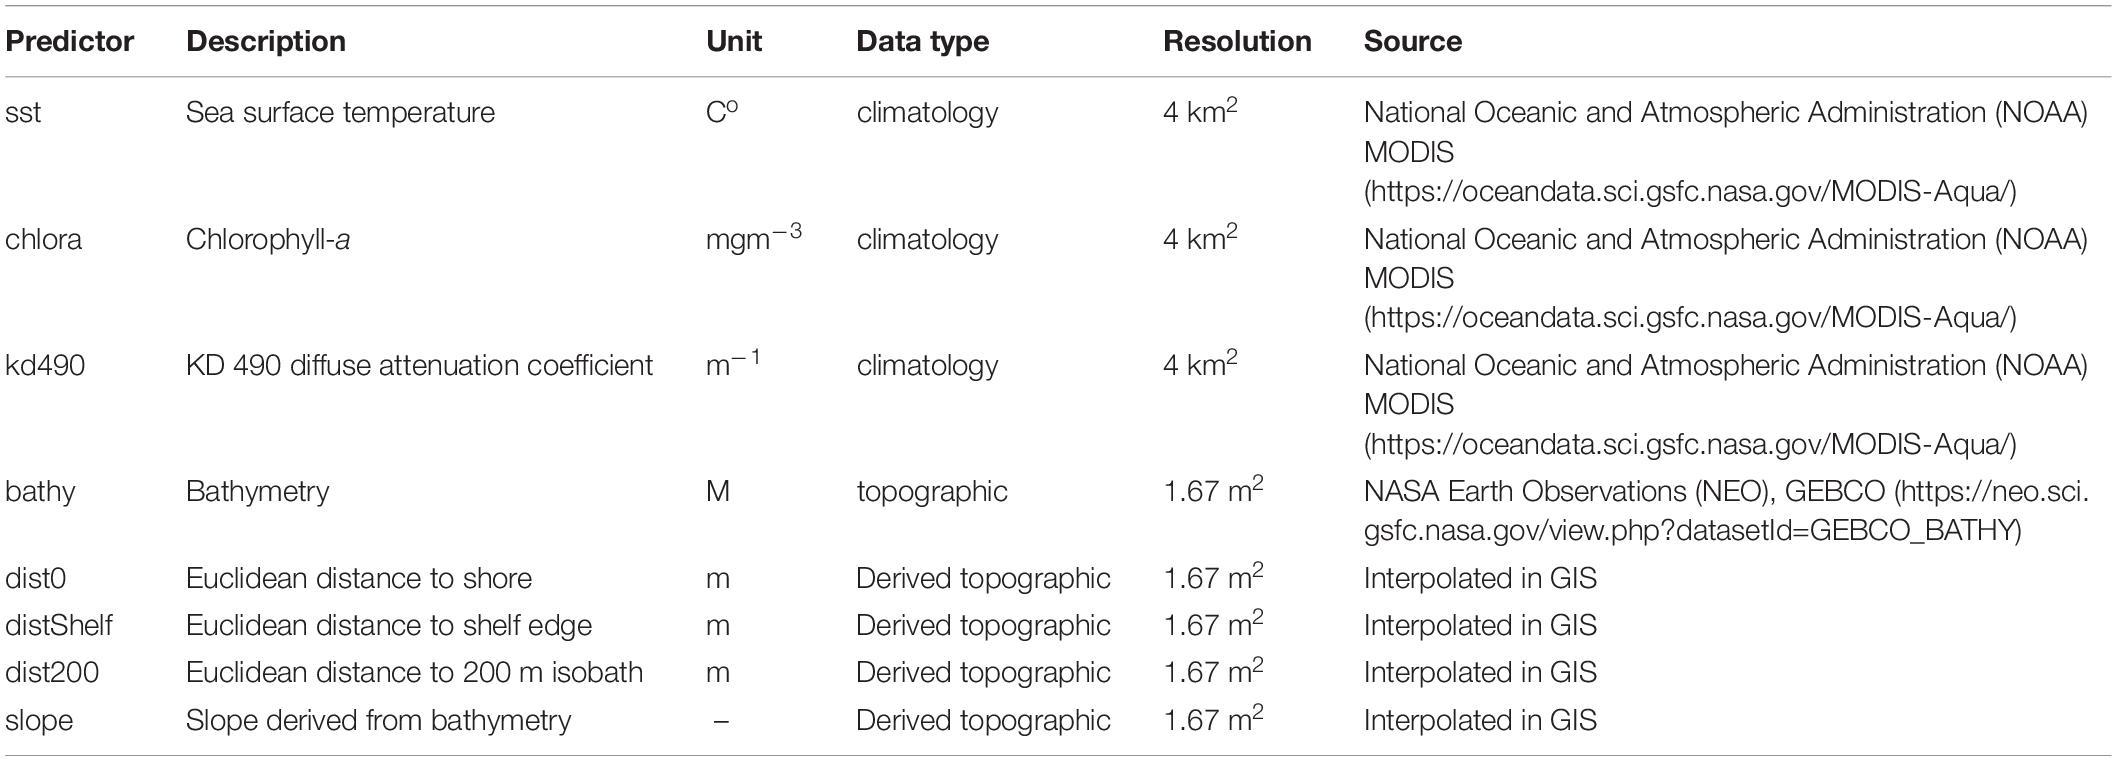
Table 2. Candidate environmental variables used in model selection process.
Bycatch Risk Assessment
Assessing Risk to Species
The Bycatch Risk Assessment (ByRA) model was adapted from the Habitat Risk Assessment tool (version 3.8.9) made freely available from the Stanford Natural Capital Project InVEST software suite.1 The overall function of the ByRA model is to identify and assess bycatch risk, built on the combination of spatially explicit geospatial layers of both species’ distribution and fishing areas (Hines et al., 2020; Verutes et al., 2020). Within the ByRA model, the software requires following a template to add direct numerical input by the user to give objective weights to each category of gear type and their impact on a species (Table 1). These weights are incorporated into ByRA where cumulative risk to a species is calculated from an exposure and consequence matrix (Stephenson et al., 2020). Exposure is the degree a species experiences stress, injury, or mortality due to an anthropogenic source or activity, which, in this case is exposure to fishing gear (Samhouri and Levin, 2012). For our research, exposure was measured by seven specific risk factors that contribute to fisheries bycatch, of which four relied on spatially explicit criteria (SEC) data. Rather than a numerical input, the input in the table for the SEC required a file path to a preformatted GIS layer depicting the criteria. These four SEC were (1) spatial overlap between the species and stressors, (2) likelihood of animal interaction with gear type based on the output of the species distribution layers and it’s overlap with fishing density, (3) temporal overlap of gear soak time, and (4) intensity of fishing area used as a proxy for the number of vessels or gear in the water at a given time.
Consequence is the impact to a species from a possible interaction with fishing gear. Consequence criteria contain two subcategories: sensitivity and resilience (Sharp et al., 2019). Respectively, these categories provide an opportunity to include information on the vulnerability, population dynamics, and health of a species, as well as the traits of a species or population that would encourage a recovery from a fishing interaction (Hobday et al., 2011). Criteria for species-specific sensitivity to a stressor includes: (1) life stages affected bycatch, and (2) the severity of the possible interaction. Criteria for species-specific resilience to a stressor includes: (1) age of maturity, (2) reproductive strategy, (3) population connectivity, and (4) local conservation status (Supplementary Tables 3, 4).
Expert Literature Input
Following the criteria definitions and rating scheme provided by ByRA and previously applied by Hines et al. (2020) and Verutes et al. (2020), all collaborators discussed and assigned scores for each category and binned gear type. Final scores were reviewed among the research team on the basis of their expert knowledge, interview responses, field observations, and previous literature. The ratings given ranged between 1 (low risk) to 3 (high risk) or marked as 0 if a matrix score was unavailable or not applicable (Supplementary Tables 3–5).
Preparing Bycatch Risk Assessment Data Input
Fishing area polygons were prepared for each geospatial fishing area layer (Verutes et al., 2020). If the information exists, the ByRA tool allows users to create spatially explicit criteria (SEC) scores that vary throughout the study area and for each species-gear interaction. For our research we incorporated three SEC: temporal overlap of gear soak time, intensity of fishing area, and likelihood of species/gear interaction.
For temporal overlap of gear soak time, 49% (n = 39) of the gillnet fishing areas identified from the interviews had distinguishable variation on length of soak time. Longer soak times, alluding to overnight or half day sets, may create higher risk for an animal interaction (Shester and Micheli, 2011). When we recorded a soak time of 6 h or more for gillnet fishing polygons, a rating score of 3 was assigned to the rating field, though those with soak times between 3 and 6 h were scored a 2 and time less than 3 h scored a 1 and unknown a zero.
For the intensity criteria, we generated the GIS layer by creating individual polygons for each intersecting fisher-drawn polygon and recorded as attributes the number of overlapping polygons in each polygon. For example, in areas where there are ten overlapping fishing areas, a newly created polygon delineated from the mutual overlap was given the value 10 in the rating field of the gear-specific GIS layer. Values were reclassified into three categories using the classification algorithm Natural Breaks, which divides similar values together and maximizes the differences between the groups, to fit the risk value schema (1–3). More popular or dense fishing areas were then captured in the model as a proxy for determining higher density areas of gear use.
For the third SEC for likelihood of species/gear interaction, we overlaid the categorized species distribution and intensity SEC layers. The resulting encounter rates were scored in the rating field and were classified into three categories similarly as above. These SEC and related ratings helped differentiate specific fishing areas and identify possible higher bycatch risk zones.
Bycatch Risk Assessment was run a total of six times. We ran the model for both species using all fishing areas, then we divided the fishing areas by port and ran the models again. Two groupings of subzones were created to assess risk (Figure 2). These groupings were chosen to give practical applications of risk outputs based on distance to shore and potential regional protected areas. The first grouping of subzones included four zones delineated by the 5 nm artisanal fisheries boundary (1), the 12 nm territorial seas boundary (2), the cut-off for the bathymetric shelf (3) and the waters beyond the shelf (4). The second group of subzones were the boundaries of three proposed Marine Protected Areas including Banco de Mancora (A), Arrecifes de Punta Sal (B), and Cabo Blanco–El Ñuro (C). Risk percentages for each gear type within each subzone were calculated and classified as low, medium, and high risk (Figures 3A, 4, 5A, 6). These percentages were determined by the combination of the spatial input data (i.e., fishing areas, and SDM layers) combined with the rating scores, associated weights and data quality ratings assigned by our team in the exposure and consequence tables. As part of the ByRA model outputs, exposure and consequence (ExC) scores were also estimated and plotted for each gear and species combination (Figures 3B, 5B).
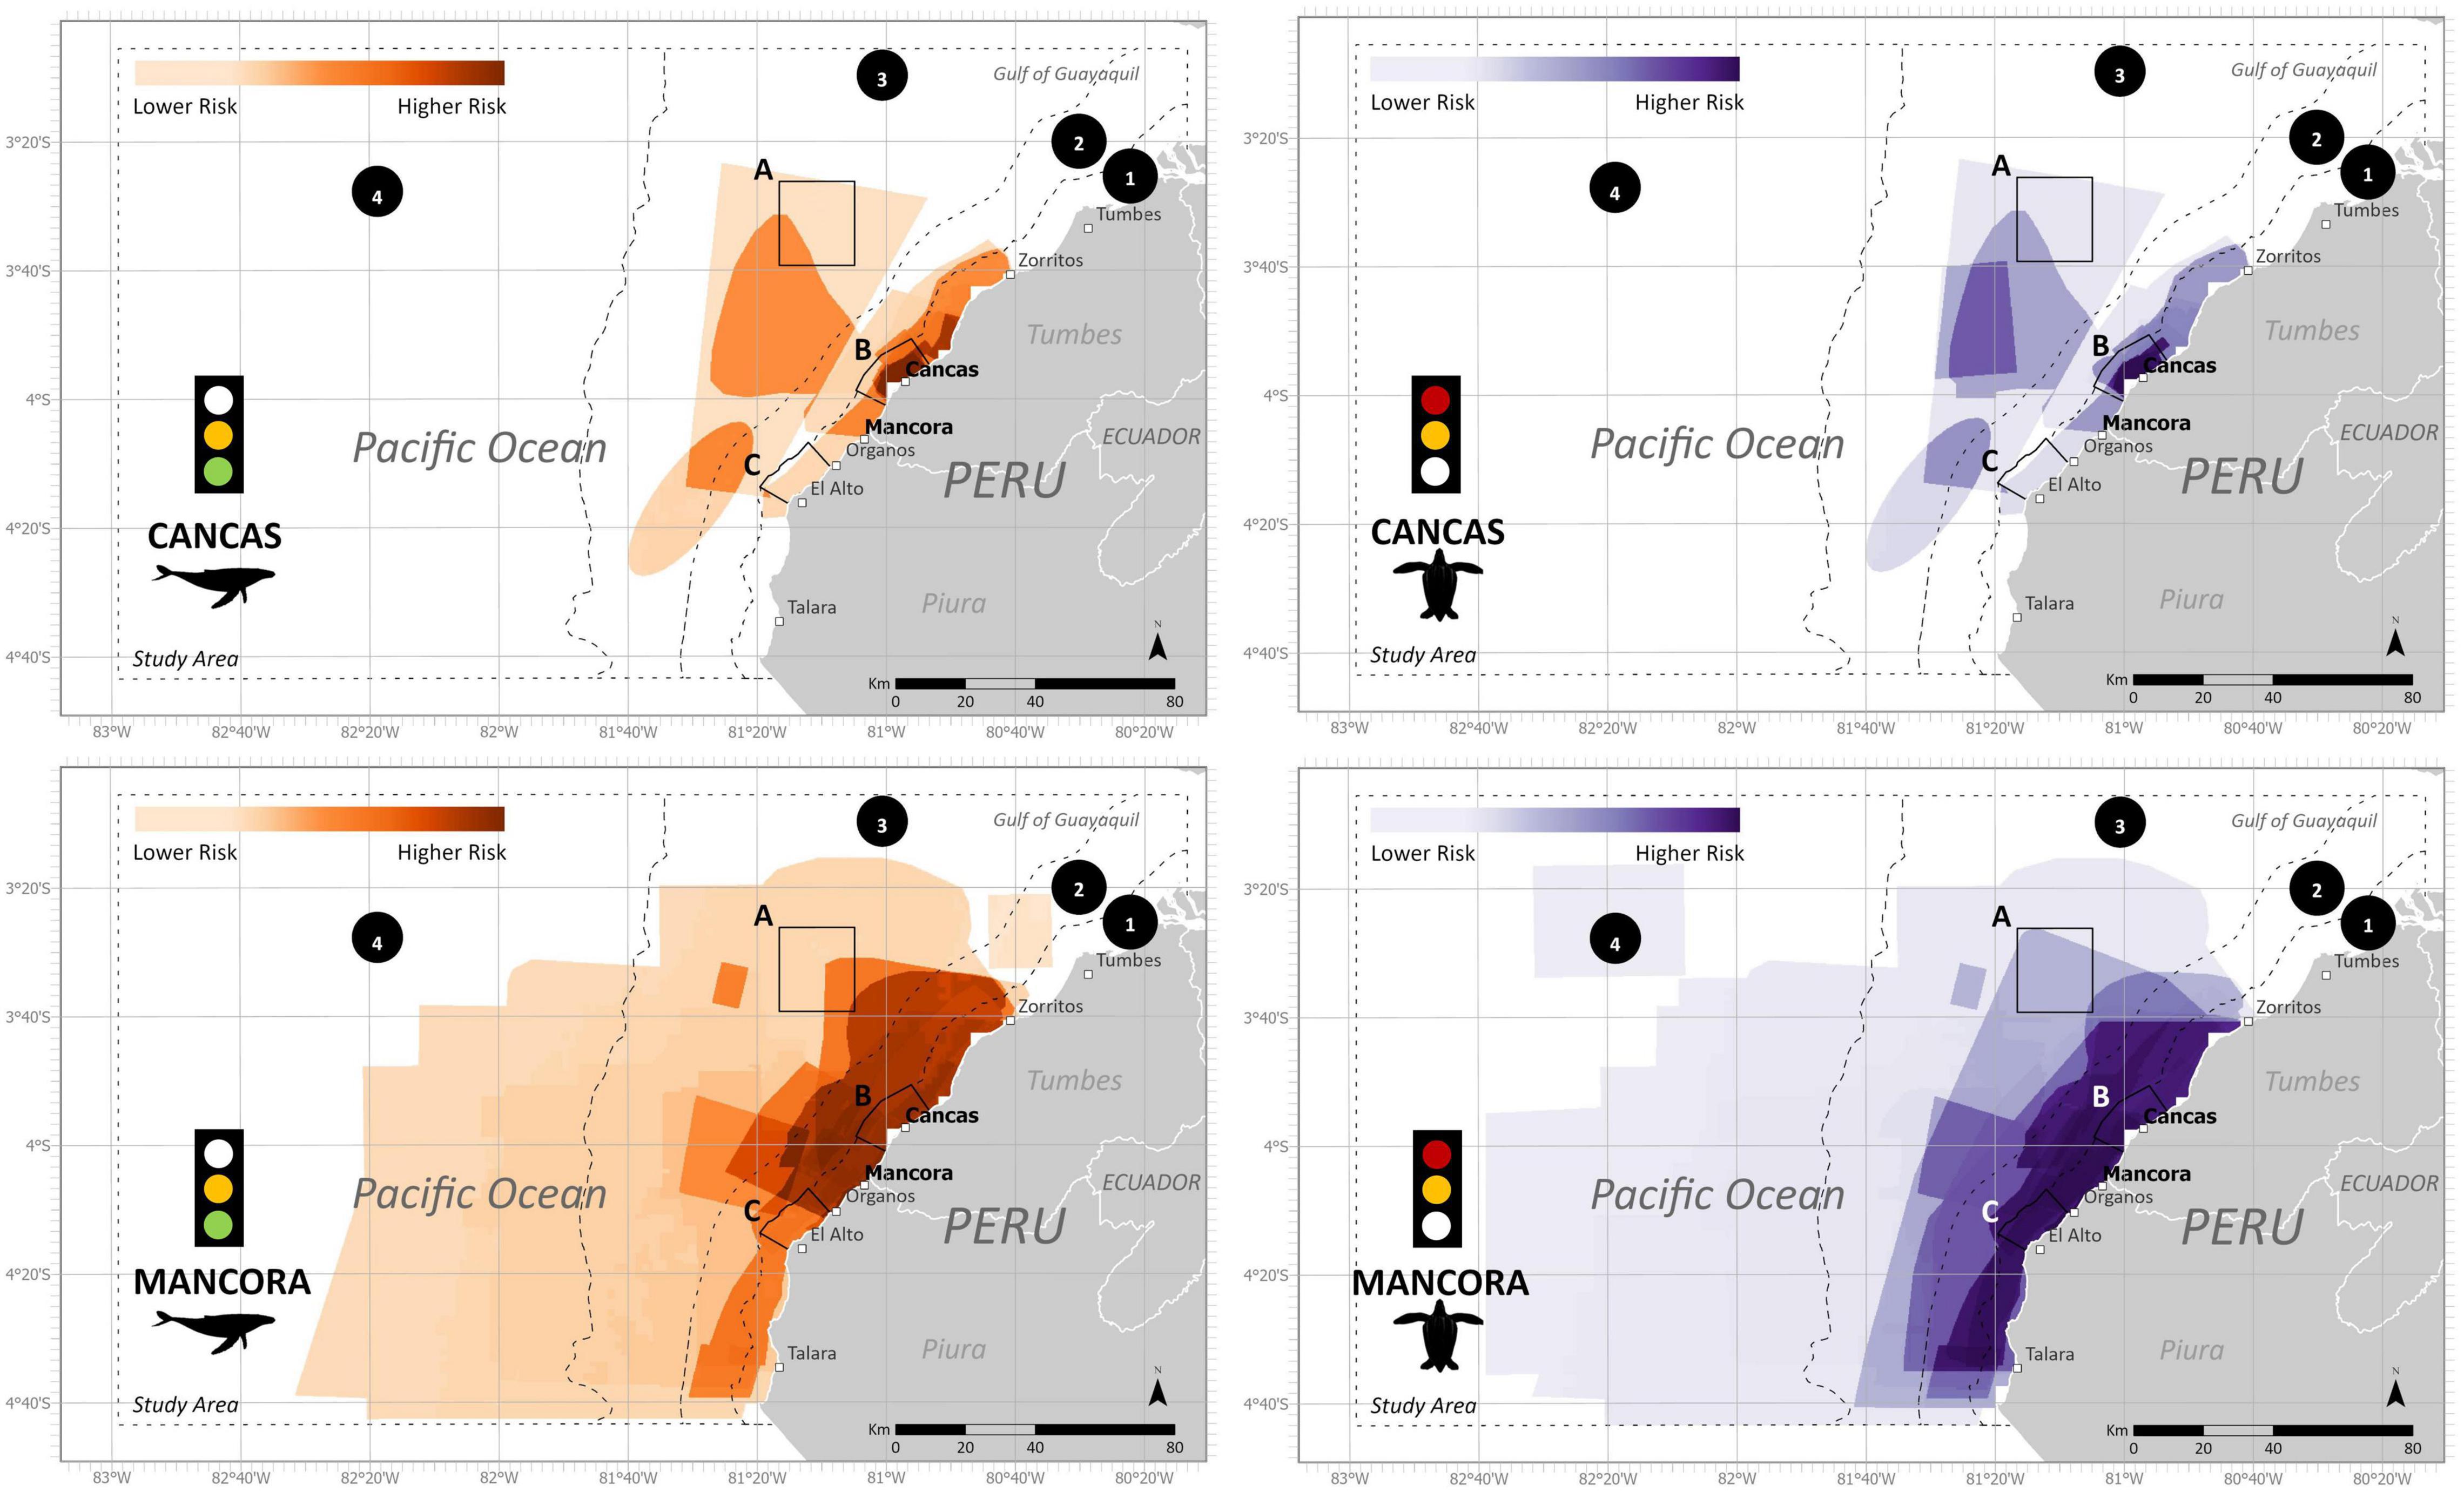
Figure 3. Final estimated bycatch risk split by ports (Mancora and Cancas) for humpback whales and leatherback turtles during the austral winter (June- November) and austral summer (December-May), respectively. Subzones include (1) Artisanal fishing zone (5 nm), (2) Territorial seas zone (12 nm), (3) Shelf zone, (4) Beyond shelf zone, (A) Banco de Mancora, (B) Arrecifes de Punta Sal, and (C) Cabo Blanco–El Ñuro. Data uncertainty depicted in stoplight and described further in Table 3.
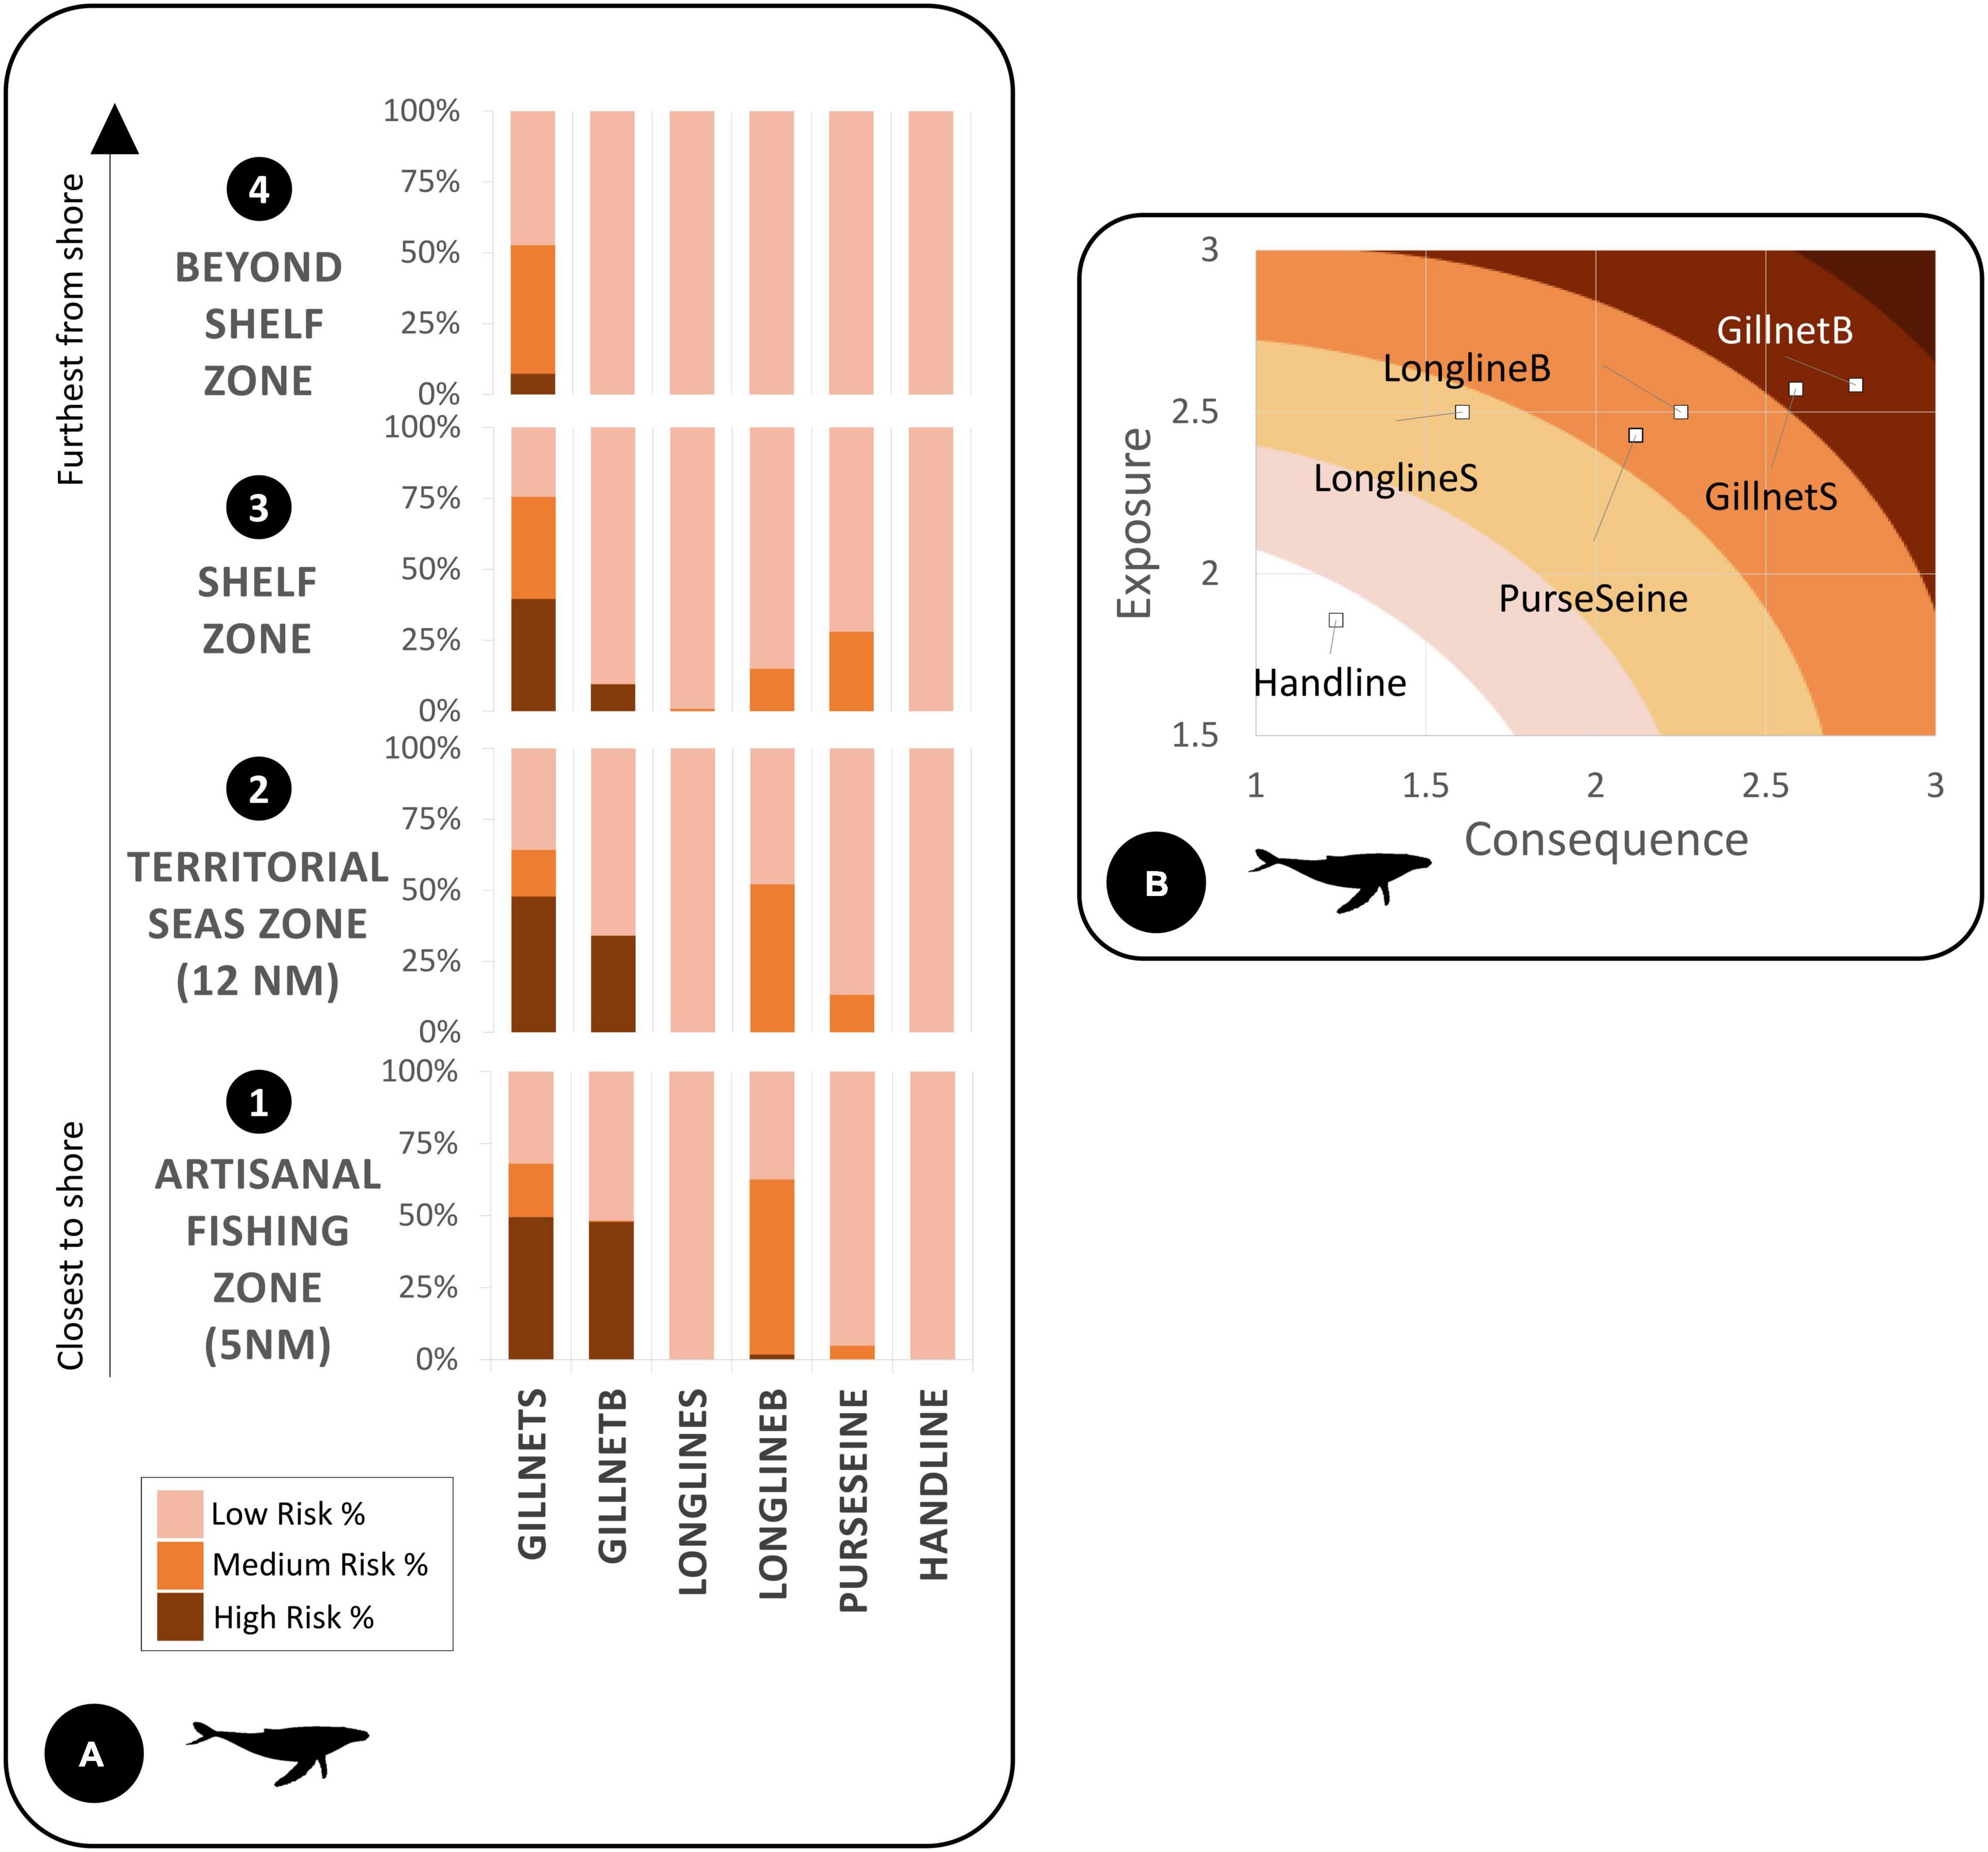
Figure 4. (A) We calculated humpback whale bycatch risk percentages for each subzone by gear type divided into low, medium, and high risk. (B) Exposure and consequence plots depict gear impact on species based on the spatial exposure or consequence criteria ratings (Supplementary Material).
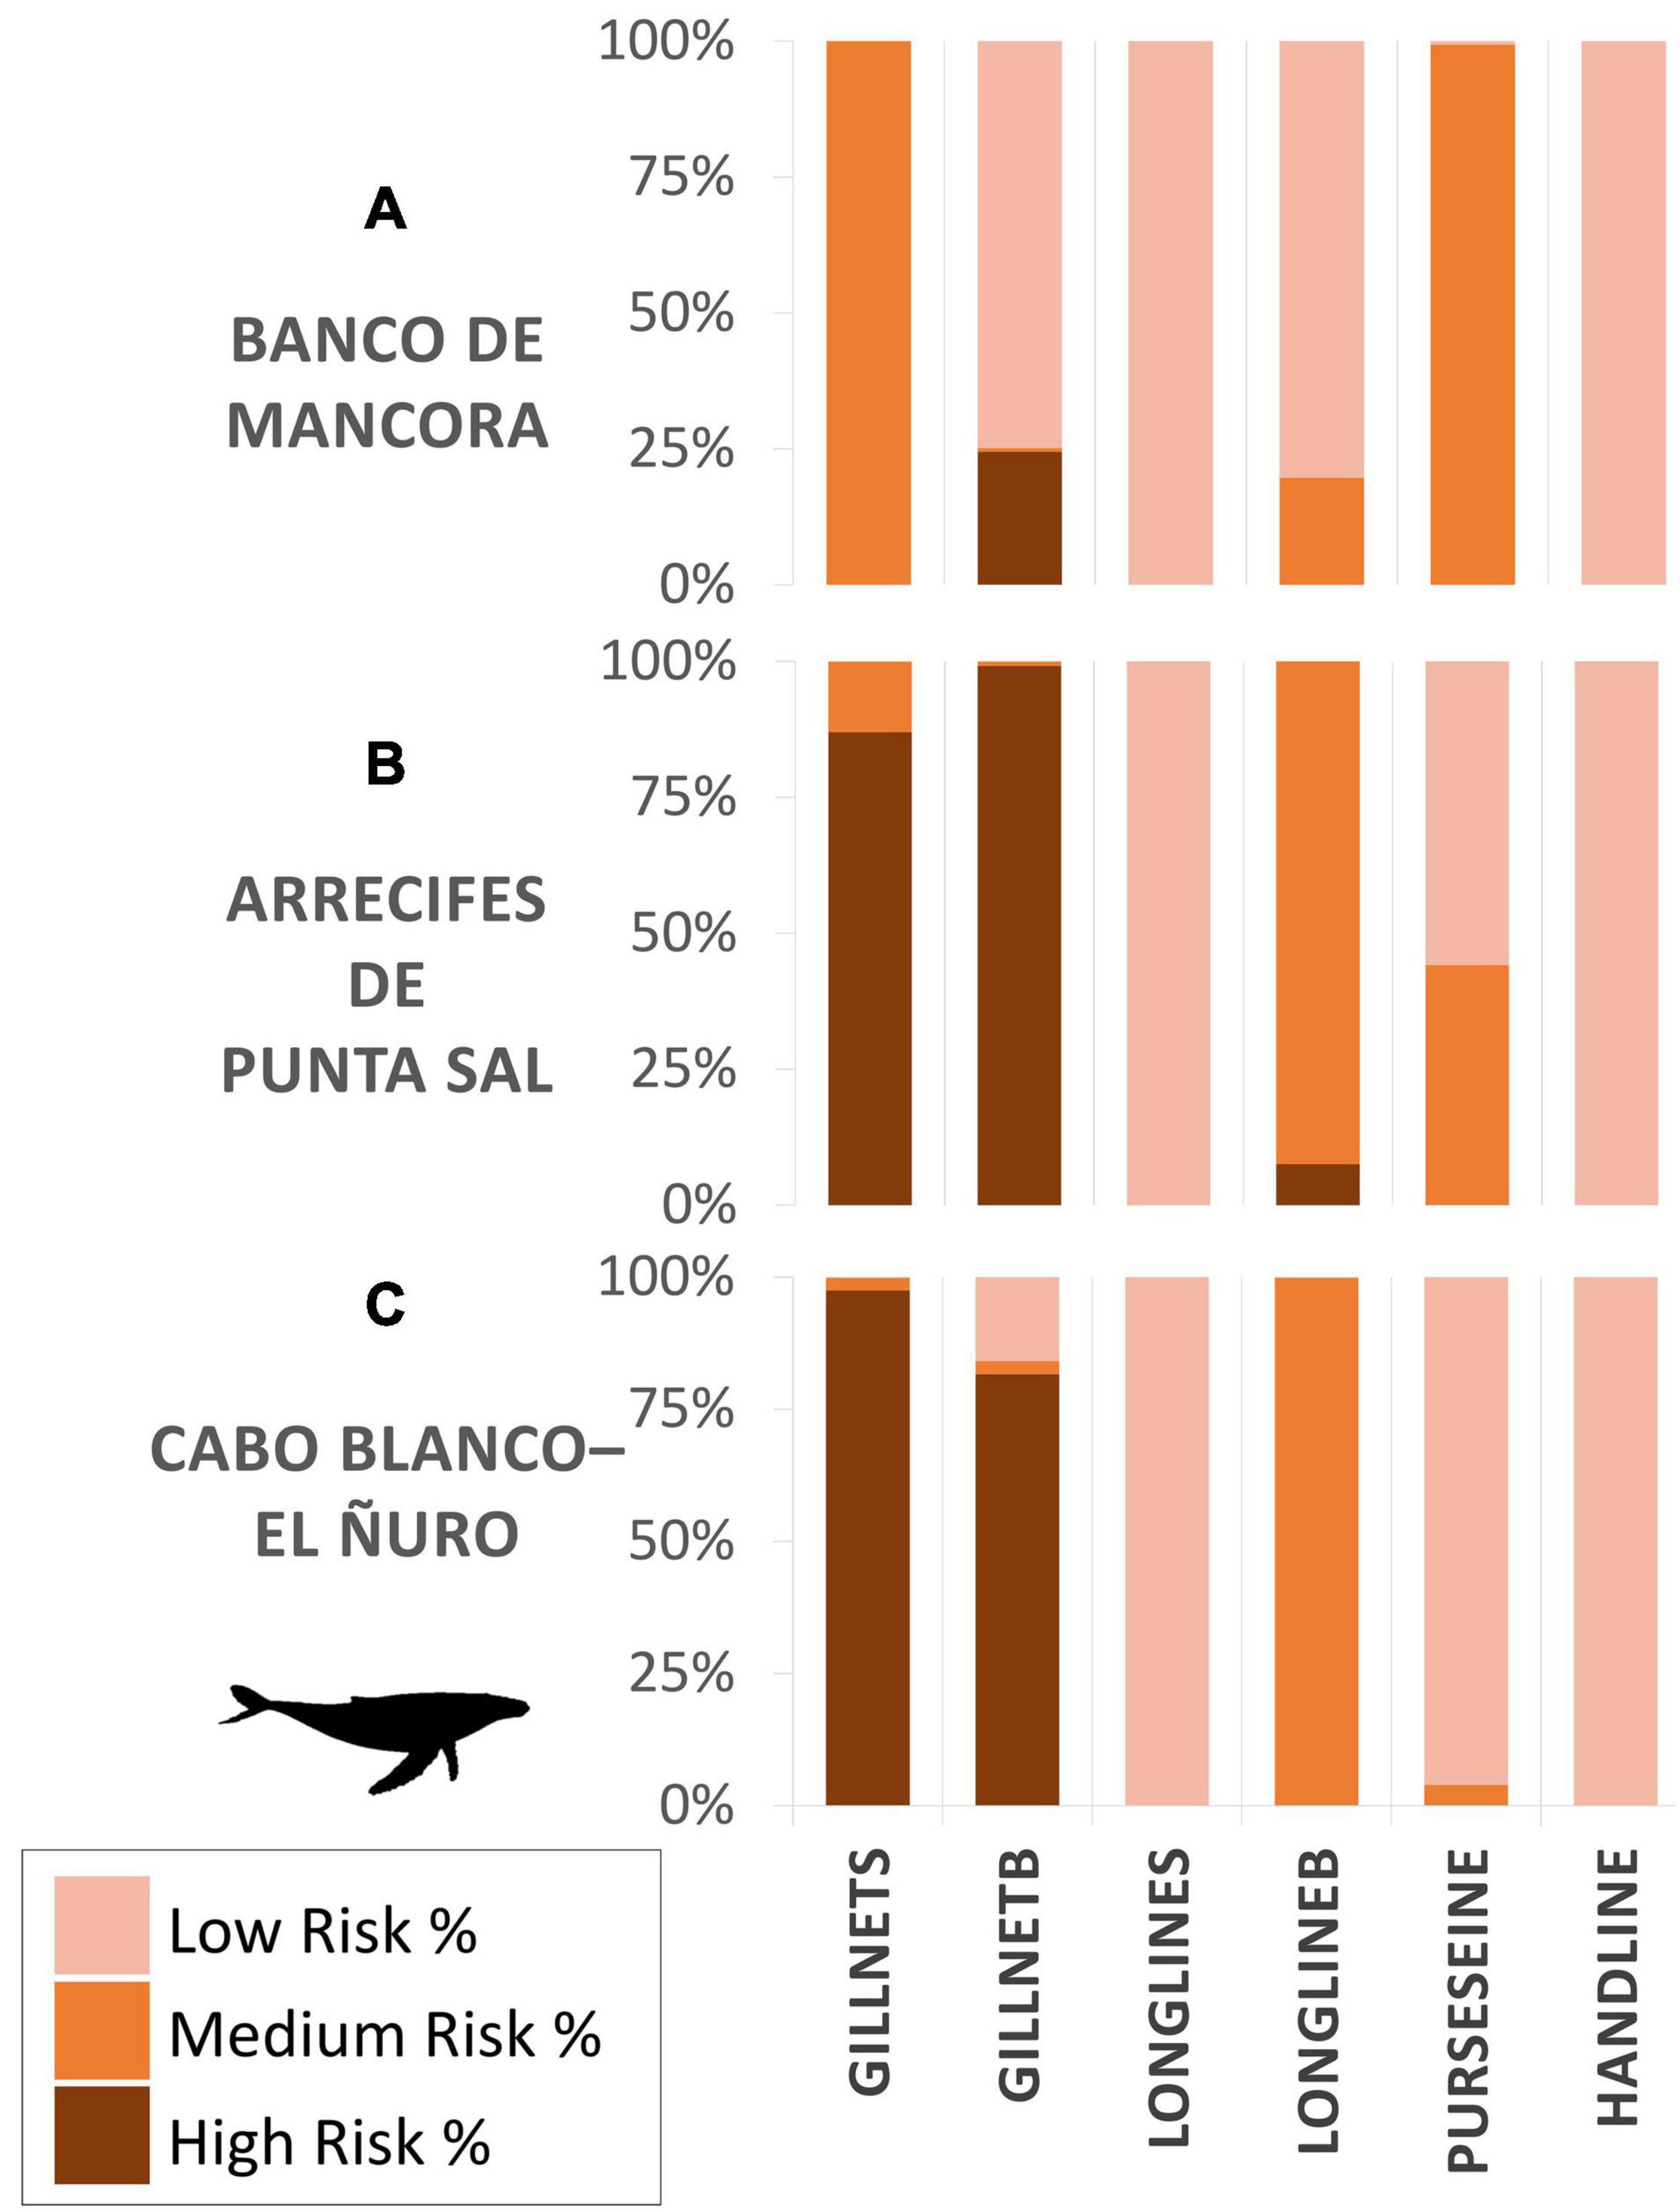
Figure 5. Bycatch risk percentages calculated for humpback whales for each gear type. Subzones assessed are composed of proposed marine protected areas: (A) Banco de Mancora, (B) Arrecifes de Punta Sal, and (C) Cabo Blanco–El Ñuro, as part of the Grau Tropical Marine Reserve.
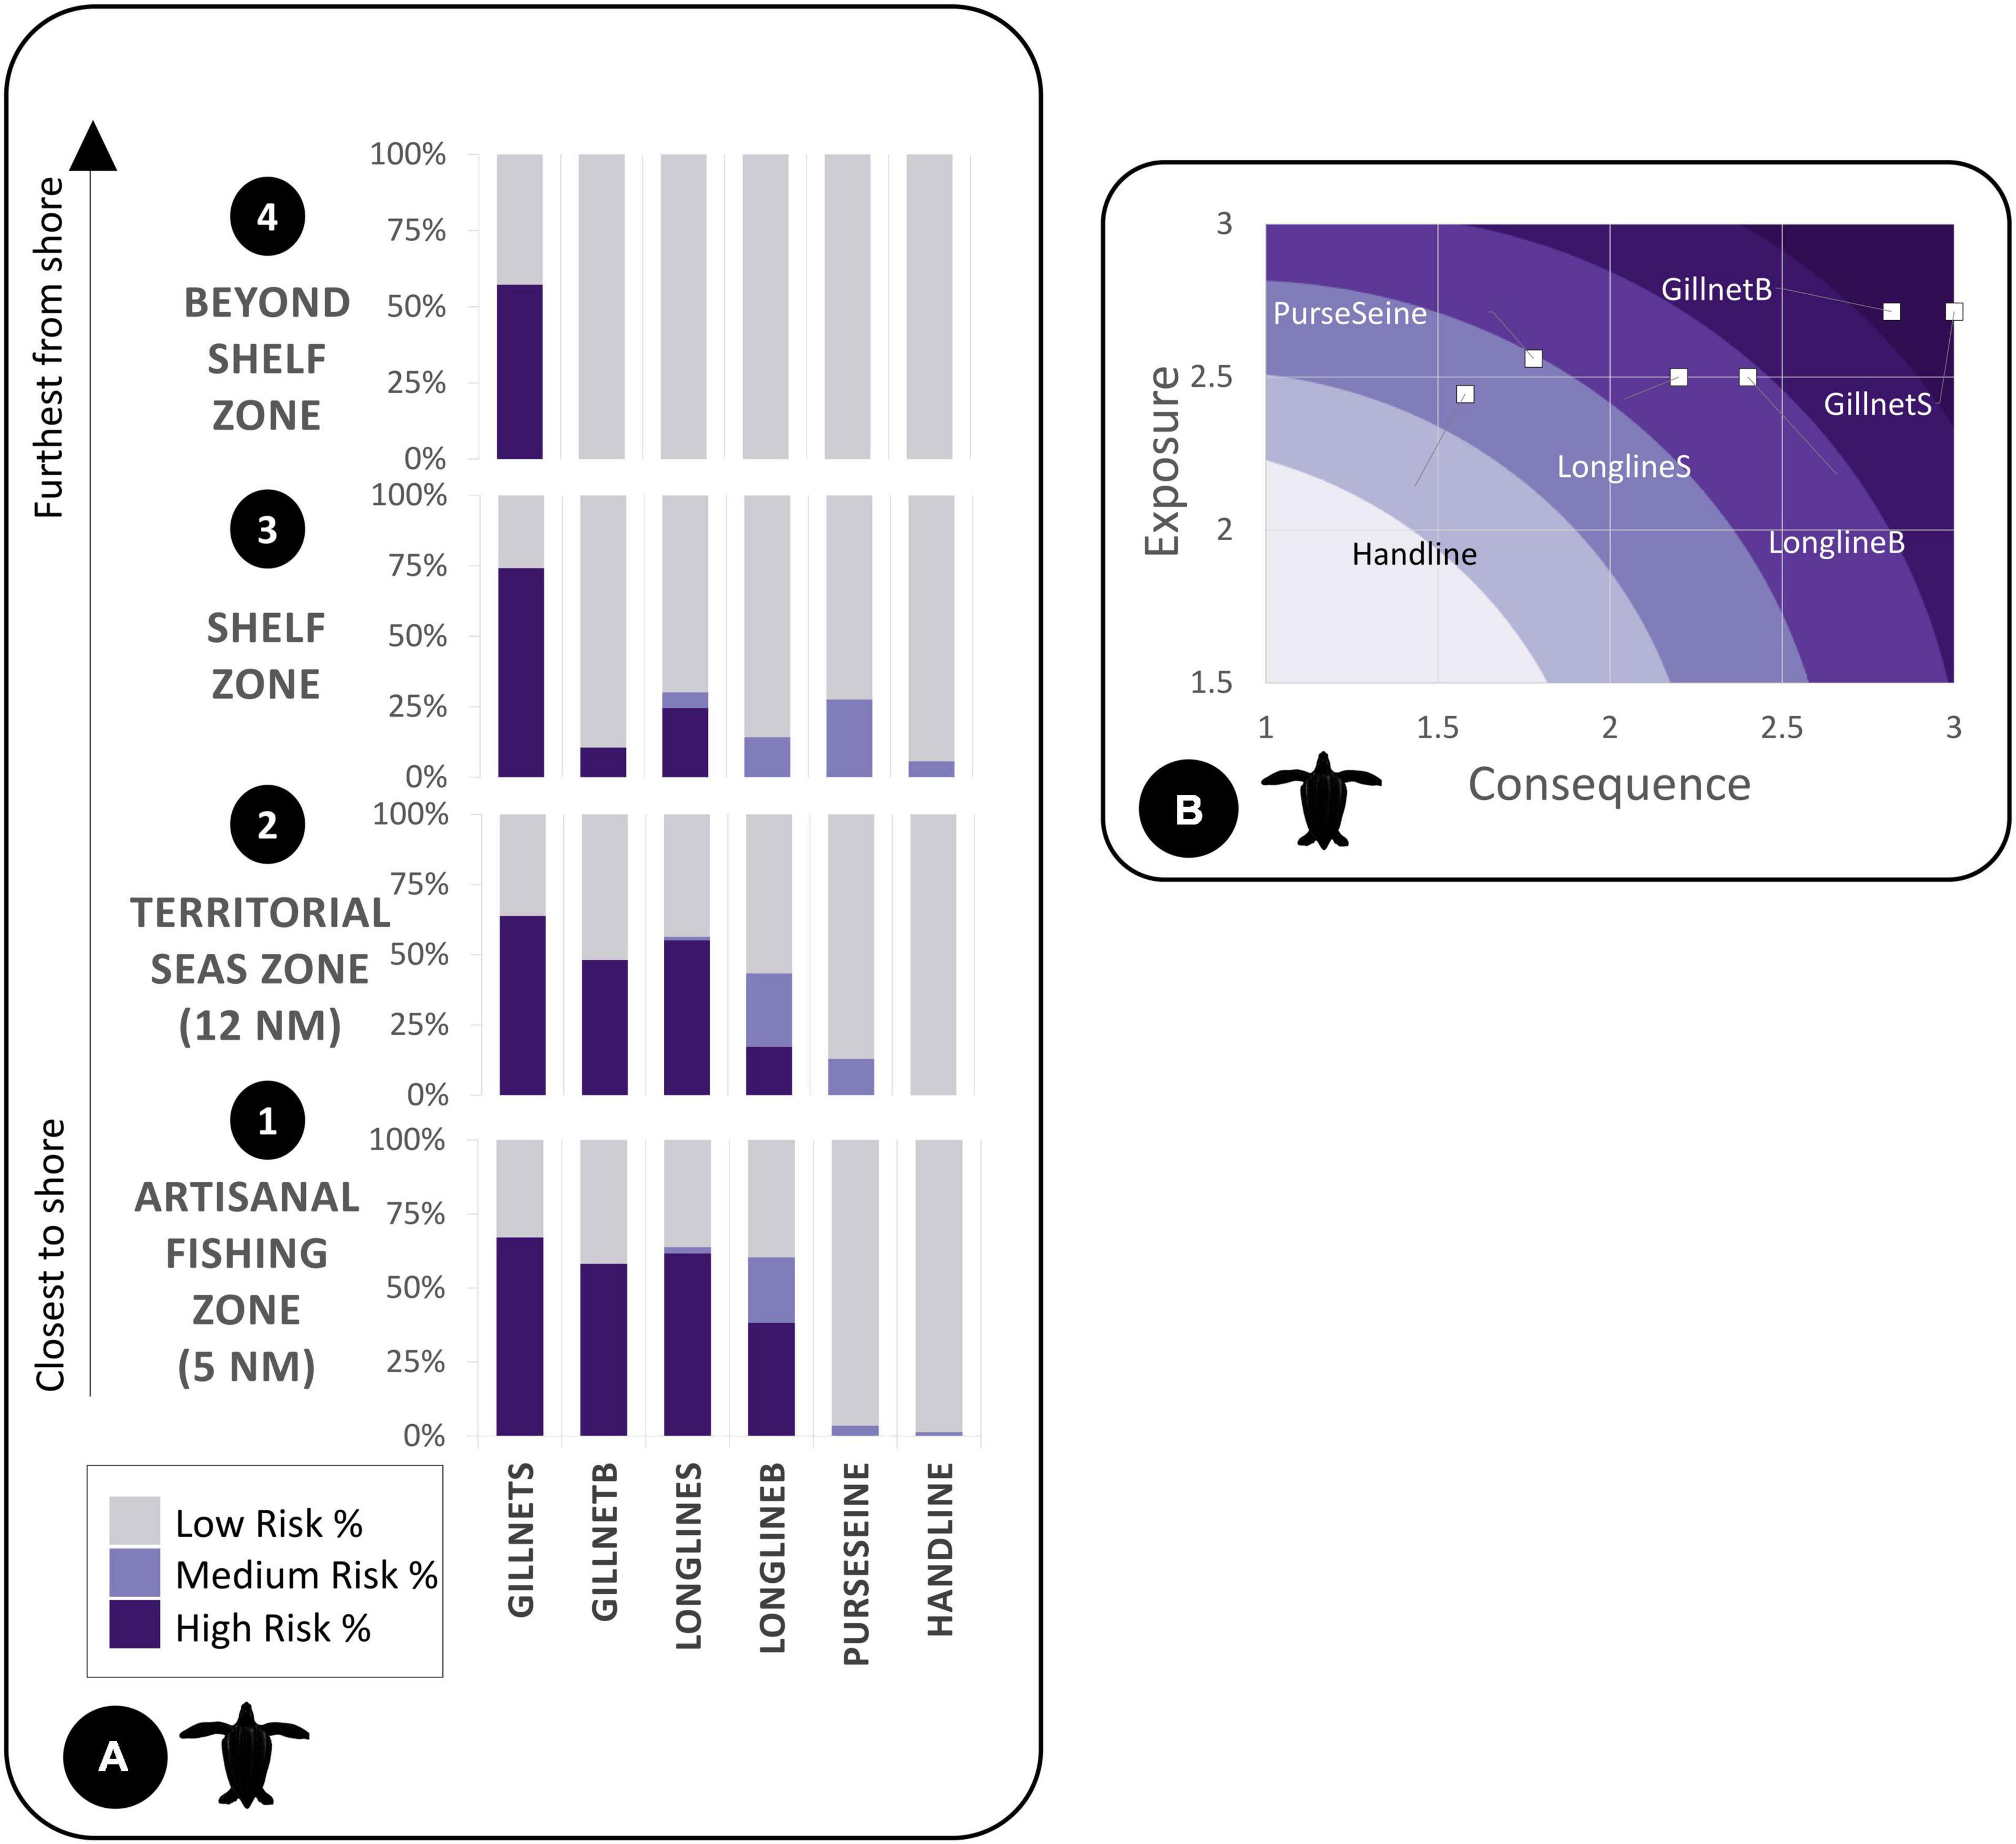
Figure 6. (A) We calculated bycatch risk percentages for leatherback turtles for each subzone by gear type divided into low, medium, and high risk. (B) Exposure and consequence plots depict gear impact on species based on the spatial exposure or consequence criteria ratings (Supplementary Material).
Characterizing Data Uncertainties and Importance
To address the various sources of data availability and quality used to support the model, we incorporated uncertainty metrics and importance weights for each data source and category bin in the exposure and consequence table. Transparency in data quality within risk assessments is important for stakeholder awareness so model outputs are perceived appropriately and data gaps can be clearly defined for future research (Harwood, 2000). A column specifically for scoring data quality was presented to the user of the ByRA model to allocate quality of data source and importance of criteria used to substantiate the risk scores given. Additionally, data input was characterized visually as part of the final risk maps. Data inputs were given a color scoring of green, yellow or red for four categories of our data: (1) animal sightings distribution, (2) habitat suitability, (3) fishing occurrence/gear type densities, and (4) bycatch/stranding data (Table 3; Hines et al., 2020). Among these categories, inputs were tagged green if they contained substantial data, yellow for limited data availability, and red for unknown or incomplete data. Stoplight figures were incorporated in the maps. By incorporating uncertainties regarding inputs, the model outputs offered more realistic perceptions of our findings and provided quick visual cues for communicating data standards with stakeholders.
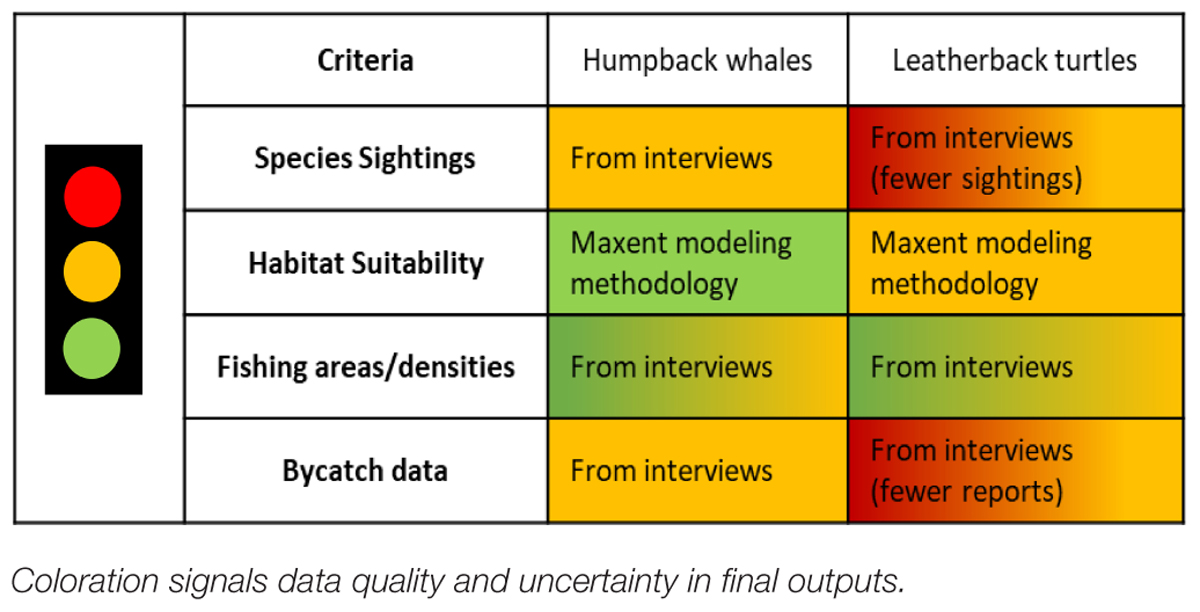
Table 3. We assigned uncertainty signals using the stoplight approach from Hines et al. (2020).
Results
Fishing Areas
During the PGIS section of the interviews, 85 interview respondents drew a total of 104 polygons that represented their fishing grounds. This total area spanned 1 degree 30’S of latitude (3 degrees 15’- 4 degrees 44’S) and 2 degrees 10’W of longitude (82 degrees 45’W–80 degrees 35’W) covering an overall area of 43,000 km2 (Figure 2). Fishing grounds for all gear types covered an area of ∼7,000 km2 for Cancas and ∼37,000 km2 for Mancora. The greatest overlap of fishing polygons was for the surface gillnets, for a total of 25 overlapping polygons during the austral summer season (Supplementary Appendix D). The distance to the center of the densest fishing area from shore was 32 km from the port of Mancora and 3 km from the port in Cancas. Most participants identified their fishing behavior as year-round (63%), with 15% exclusively fishing during the winter months and 23% during the summer months.
Fisher Demographics
Fisher demographics between Mancora and Cancas varied in several characteristics, although all fishers were men. Our sample group in Mancora on average fished in larger vessels (mean vessel length = 10 meters), employed larger crew sizes (mean = 5 fishers), and were younger (mean age = 43), compared to Cancas (mean vessel length = 6 meters, crew size = 3 fishers, and mean age = 53). The fishers we interviewed ranged from 25 to 72 years of age. The number of years reported as working in the fisheries trade varied from 2 to 58 years (Mancora mean = 21 years, Cancas mean = 34 years). Due to complex fishing schedules and limited access to all fishers, we are aware that representative samples for extrapolation of fisher responses were not attainable. Rather, sample group responses and results portray a qualitative analysis of the fishers at each port.
Conservation Perceptions
We asked several questions regarding conservation perceptions during the one-on-one interviews to gauge fishers’ understanding of the population growth or declines over time and attitudes toward HBW and LBT populations (Supplementary Appendix A). For fisher’s who had been fishing for more than 35 years, 85% (n = 20) of respondents stated that there were either more or the same number of humpback whales in the area. This was the same percentage for those who had been fishing for <15 years (n = 20), and 91.5% for folks who had been fishing between 15 and 35 years (n = 40). Comments included legal protections, prohibitions on hunting, and access to anchovies as prey. Two-thirds of the respondents (n = 58) stated there will always be humpback whales off the coast of Peru. Of these, 18.4% (n = 16) of respondents believed this was due to fishers not hunting humpbacks, 16% (n = 14) of respondents cited humpback migrations, 7% (n = 6) mentioned that they reproduce, and only 5% (n = 4) of respondents gave a scenario stating humpback whale populations would only be sustainable if they were protected. Sixty percent (n = 57) of respondents agreed that humpback whales were important to very important for the ocean. However, 18.6% (n = 16) stated humpbacks were not important to the ocean, because whales damage their fishing gear or have no function in the ocean. Those that did believe humpbacks were important, mentioned that the ocean is the species’ natural habitat, and that the whales support local tourism (Table 4).
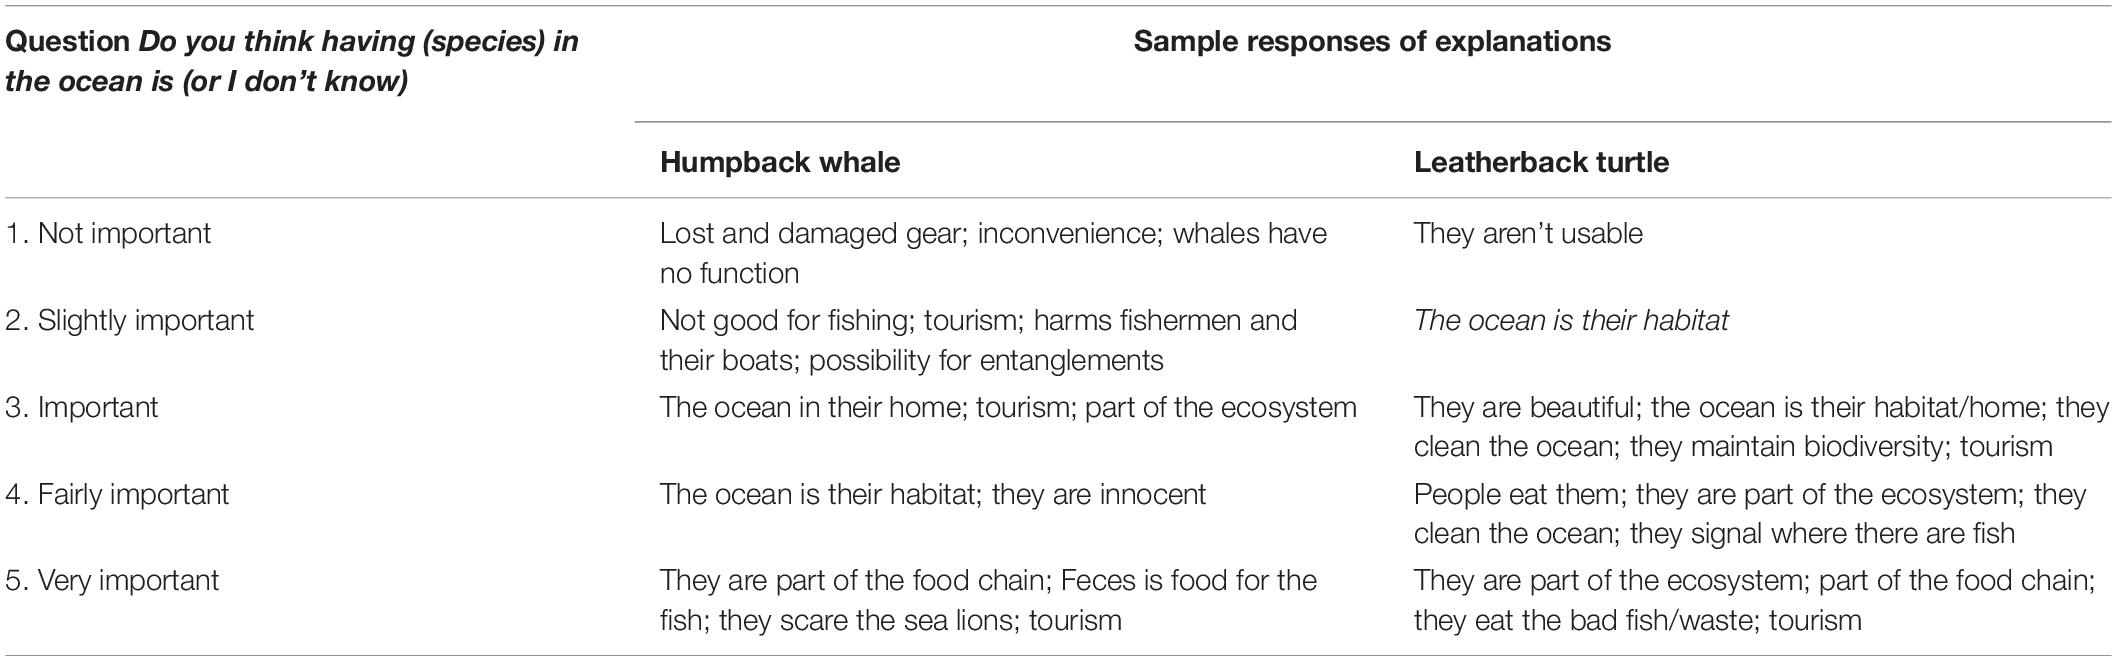
Table 4. Summary of responses to questions 40 and 68 on the perceived importance of species.
As for the 67 respondents who stated they had seen a leatherback turtle in their life, those who had been fishing for more than 35 years, 50% (n = 6) believed leatherback turtle numbers have decreased or remained about the same with four individuals unsure. Overall, respondents were split between whether they believed leatherback turtle populations were increasing (n = 6), decreasing (n = 12), or were unsure (n = 11). Seventy-six percent (n = 51) of respondents believed that having leatherback turtles in the ocean is important (Q 68) (Supplementary Appendix A). When asked why, the fishermen mentioned the species’ role in the ecosystem and food chain, tourism, and their beauty (Table 4). For both Cancas and Mancora, 36.8% of respondents (n = 32) stated there would always be leatherback turtles in the ocean, because of legal protections, no hunting, and prey availability. Only two fishers believed there would be a time when there would be no leatherbacks in the ocean, stating that they were being found further offshore, and are nearing extinction.
Synthesizing Fisher Knowledge and Perspectives
Fisher participation throughout different points of the research were key in providing a two-way conversation with the participants, allowing us to prepare the input data and present the outputs of the risk assessment more accurately. Both interviews and mapping workshops offered an opportunity for fishers to express their concerns and experiences with bycatch in a one-on-one and group setting. For example, at the first workshop, our research team presented on HBW and LBT population statuses, migrations, and the benefits of the species to the ecosystem. In response, fishers attending the meeting were able to share their knowledge on the species presence in the area via group mapping, their concerns about gear loss from entanglements, and talked about possible solutions to bycatch such as avoiding high density areas of HBW during the season, switching gear types or using bycatch reduction technologies such as acoustic pingers. For our second trip to the ports, fishers helped review the maps of fishing area and habitat layers. Fishers emphasized data that reflected the use of the area and of their peers, and in contrast were able to reject data that did not align with their experience and knowledge of the area. In our final meeting, after a year we initiated the project, we realized that the majority of the fishers had already decided to change gear from surface gillnets to longline, and bottom set nets.
With these group meetings fishers provided valuable feedback, so the input data into ByRA reflected closer the reality of their experiences. Additionally, hearing the fishers’ perspectives on the severity and high cost of losing their gear (estimated at $300 per pane of net) helped us synthesize the ByRA outputs and management recommendations knowing what changes they would be willing to make to reduce unwanted interactions (Alfaro-Shigueto et al., 2010). Because of these meetings, fishers expressed that they felt valued and that their opinions on management issues mattered. Fishers agreed that more formal conversations between the fishing associations, port administration and each other within a participatory framework could galvanize interest and initiate collaborative ideas in how to mitigate bycatch.
Species Distribution Model
Final contributing environmental covariates from greatest to least contributing were Euclidean distance to shore (dist0) (PI = 72.7%), chlorophyll-a (chlora) (PI = 16.3%), and slope (PI = 11%) (Table 5). Predicted habitat was close to the coast within 50 km and above the shelf break (Figure 2). The final SDM results for the two species differed in parameter settings and most environmental variables. In the austral winter SDM for humpback whales, the final Maxent model used features Linear, Quadratic and Hinge (LQH), with a 1.5 regularization parameter, and showed predictive performance with an AUC of 0.88 and a TSS of 0.89 (Table 6).
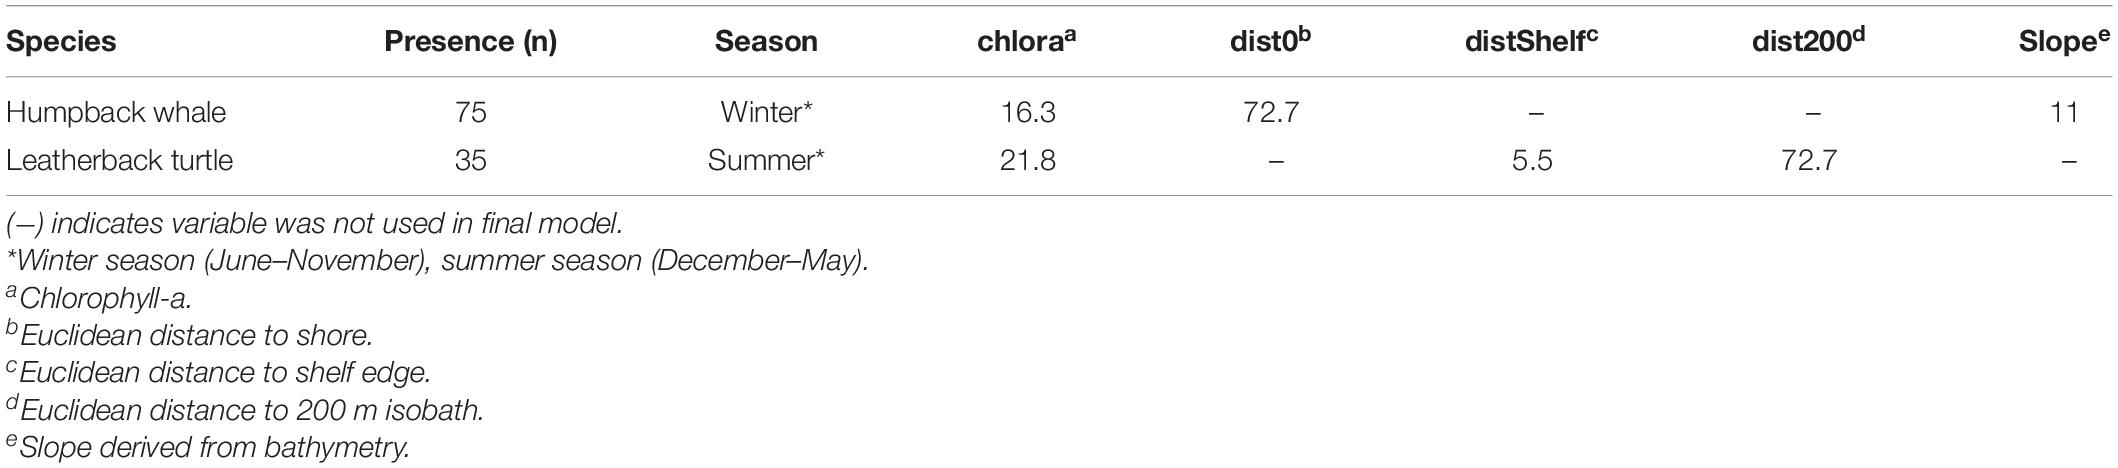
Table 5. Selected environmental variables after pruning the covariates (Supplementary Material) as well as permutation importance used for final species distribution models.
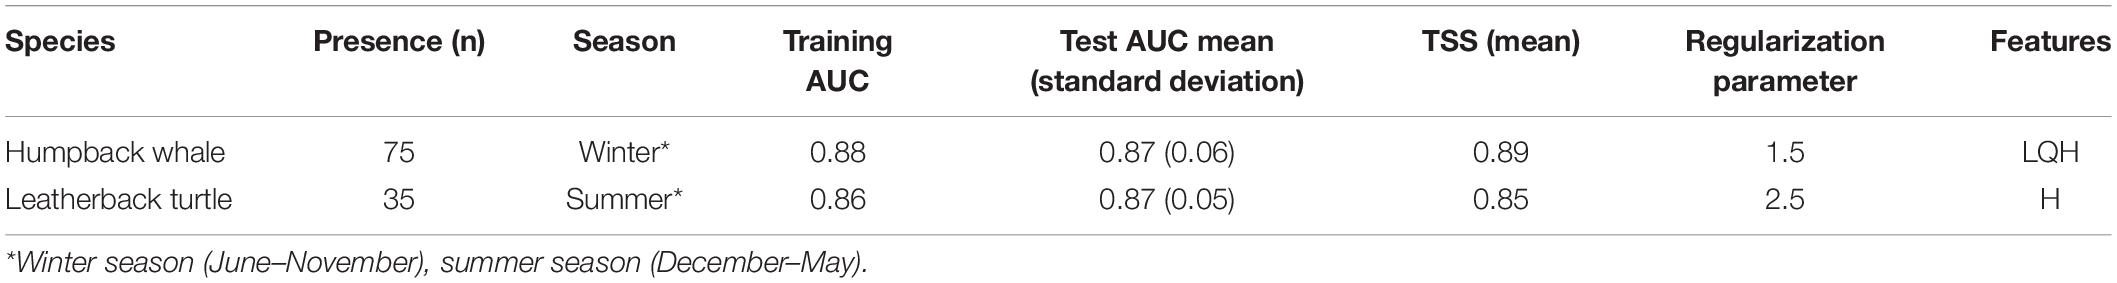
Table 6. Model parameters and performance statistics of final models calculated from biomod2 package for R.
The greatest variable contributor for the leatherback SDM was distance to 200 m depth (dist200) (PI = 72.7%), following chlorophyll-a (chloral) (PI = 21.8%) and Euclidean distance to shelf (dist0) (PI = 5.5%) (Table 5). For leatherback turtles, the best SDM for the summer season used only the Hinge feature within Maxent, with a 2.5 regularization parameter and scoring similar performance metrics with an AUC of 0.86 and a TSS score of 0.85 (Table 6). Leatherback turtle habitat preference showed highest within a 200 m depth, which includes the elevated seamount area known as Banco de Mancora. Both SDMs showed possible evidence of sampling bias with the highest predicted habitat preference nearest to the study sites (Figure 7).
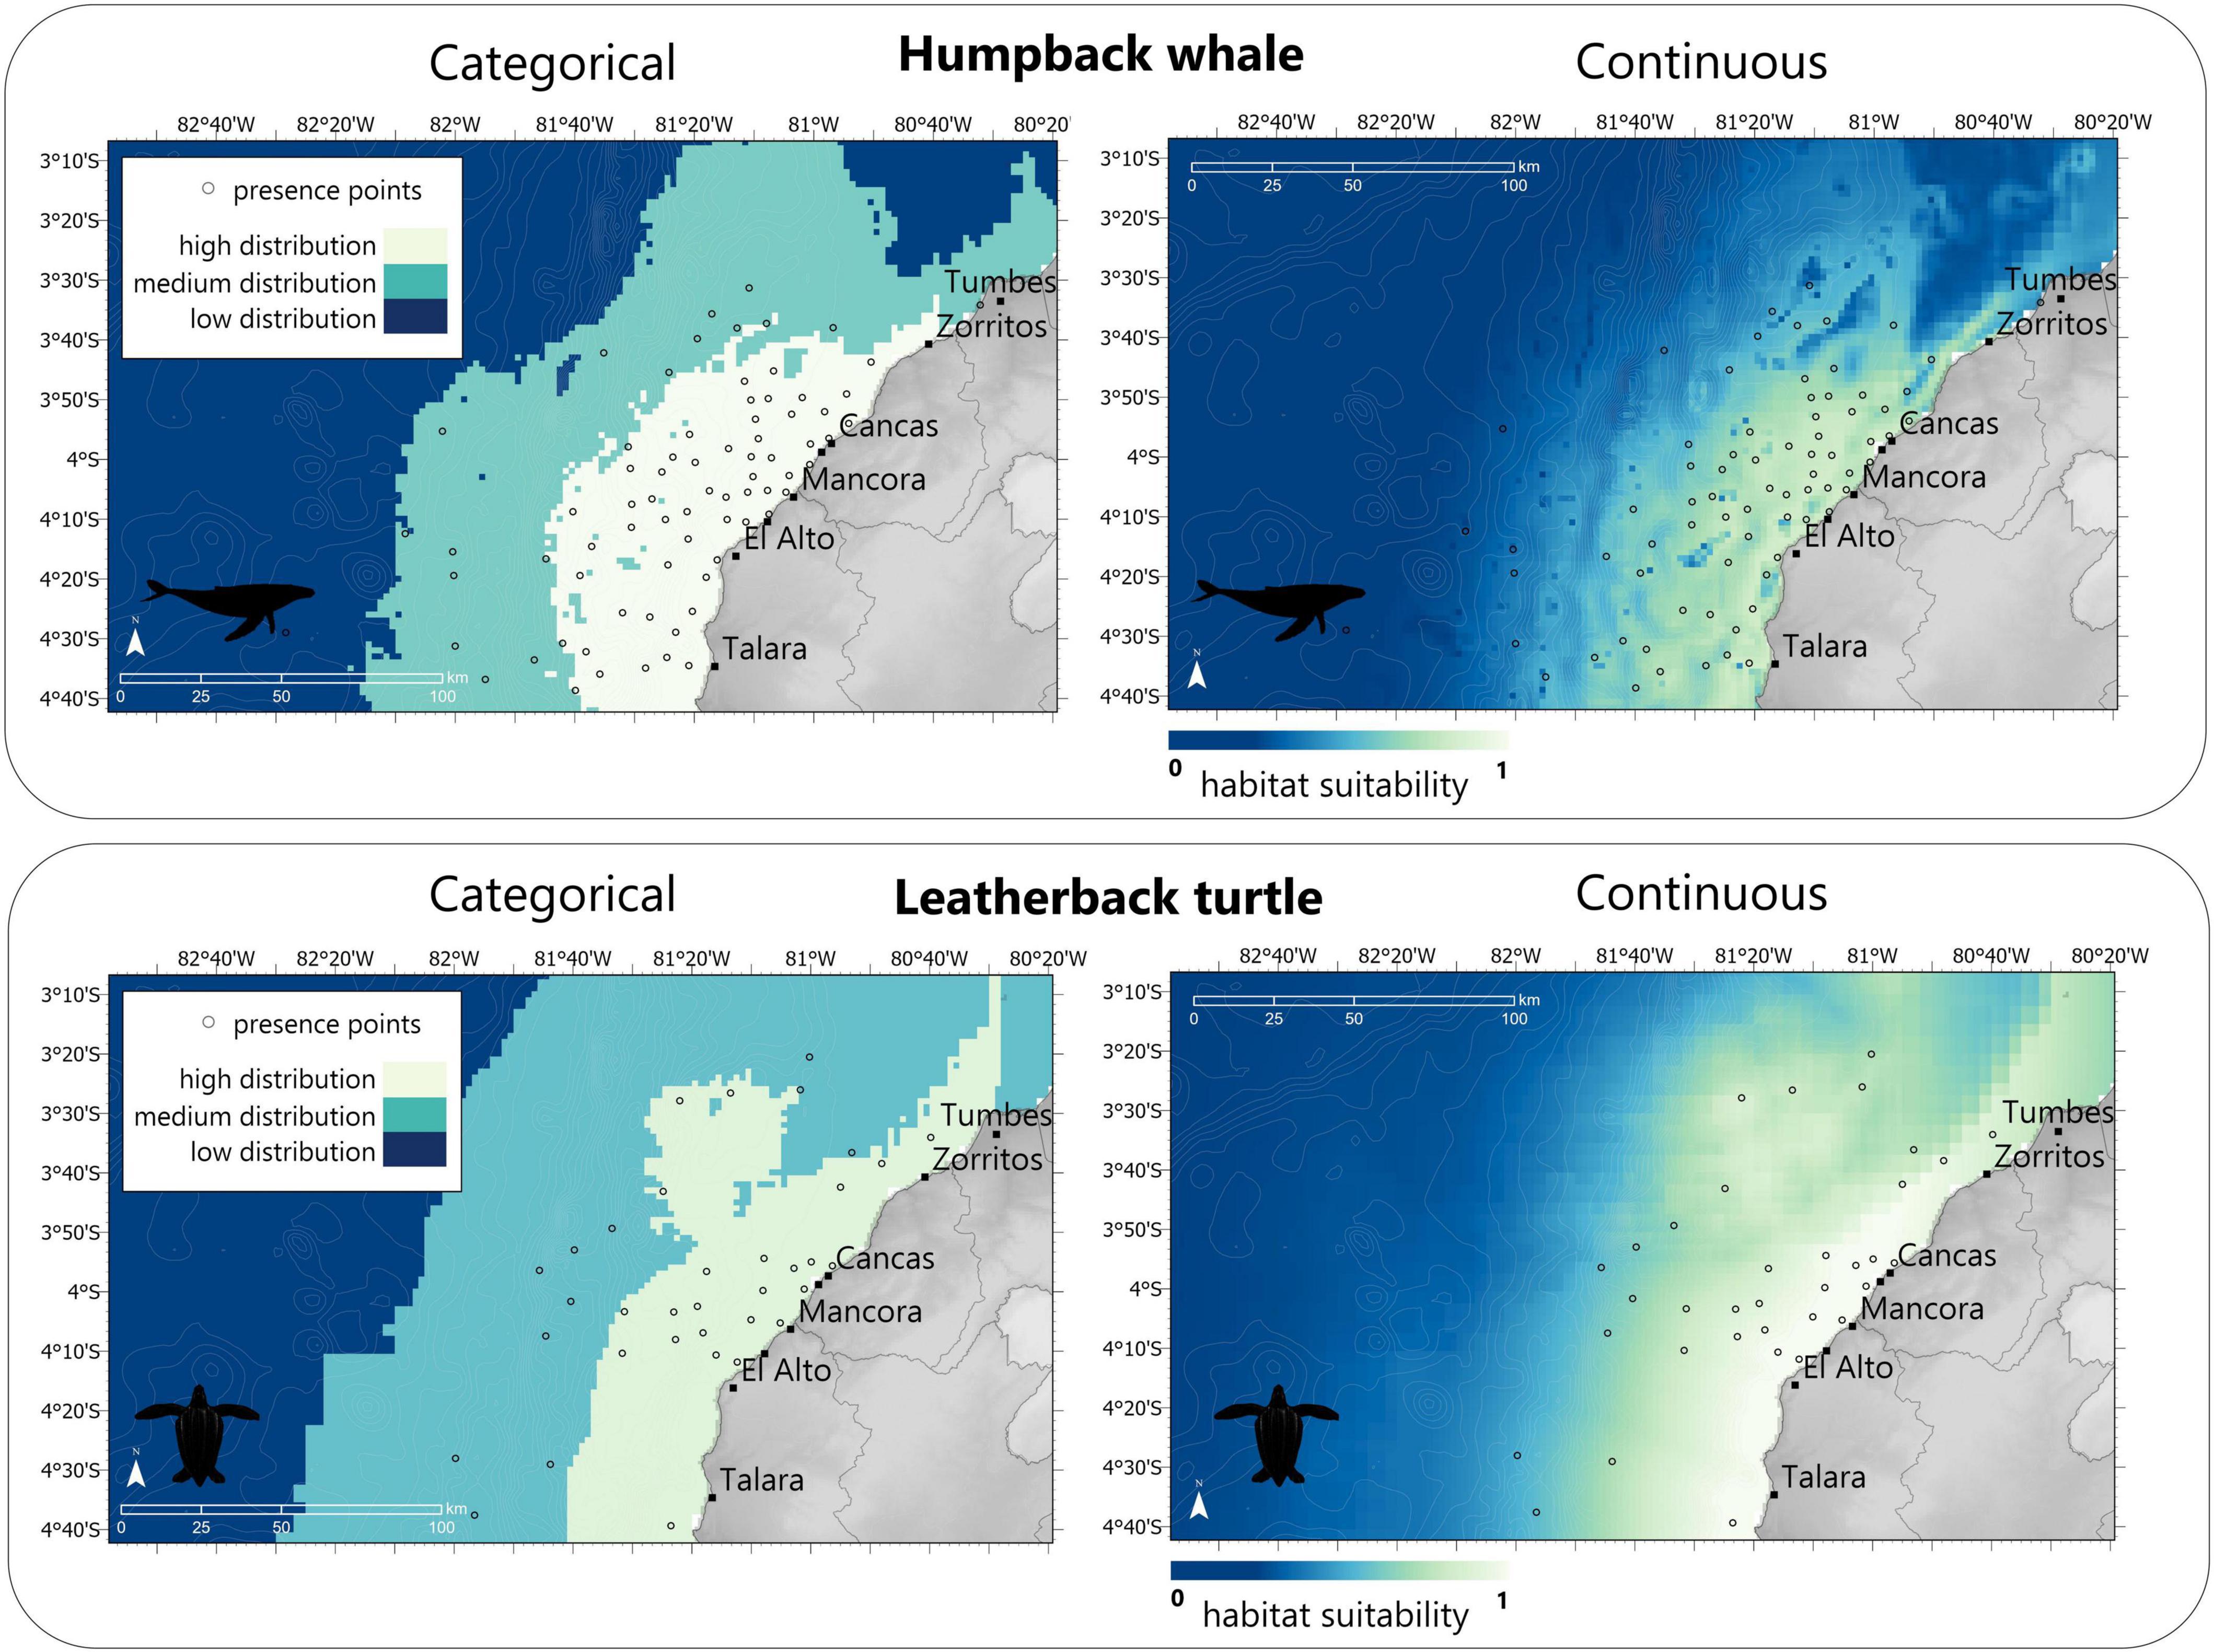
Figure 7. Final Maxent model outputs for humpback whales and leatherback turtles were built based on interview responses from PGIS mapping. The top row are the habitat suitability predictions as continuous data with values ranging between 0 and 1. The second row of maps are discretized into three classification levels using the Relative Occurrence Rate (ROR). The low category ranges from 0 to 10% of the maximum ROR. The medium category ranges from 10% of the maximum ROR to 50% of the maximum ROR, and the high category ranges from 50% of the maximum ROR to the maximum ROR.
Uncertainty Scores
We determined separate uncertainty scores for each category and species based on standards from Hines et al. (2020). Red represents high uncertainty, yellow for medium and green for low. All species sightings data was retrieved from interviews (as opposed to formal transect surveys) which we labeled a blend of yellow and red for HBW and LBT. From these sightings, we were able to construct habitat suitability models using a collection of environmental variables to predict high, medium, and low habitat preferences. Because of the fewer sightings gathered for LBT, we labeled the output risk maps with a stronger uncertainty (labeled yellow and red). Fishing areas were also gathered from our PGIS exercise, which incorporated temporal and spatial variations in gear use. From these we were able to estimate fishing area densities and therefore labeled this criterion as a blend of green and yellow. Although we gathered information on previous bycatch incidents from the fisher interviews, we were not able to give estimates on bycatch rate for either species or ports. Due to this, our data quality on bycatch was labeled a blend of green and yellow for HBW. For LBT, interviewed reported bycatch was gathered from fewer fishers which we labeled a blend of yellow and red to signal greater uncertainty. All uncertainty criteria were considered for stoplight labels shown in the final bycatch risk maps (Figures 3, 8, 9). For the HBW bycatch maps, we labeled the overall data uncertainty a green and yellow label. For LBT, our overall uncertainty score was yellow and red.
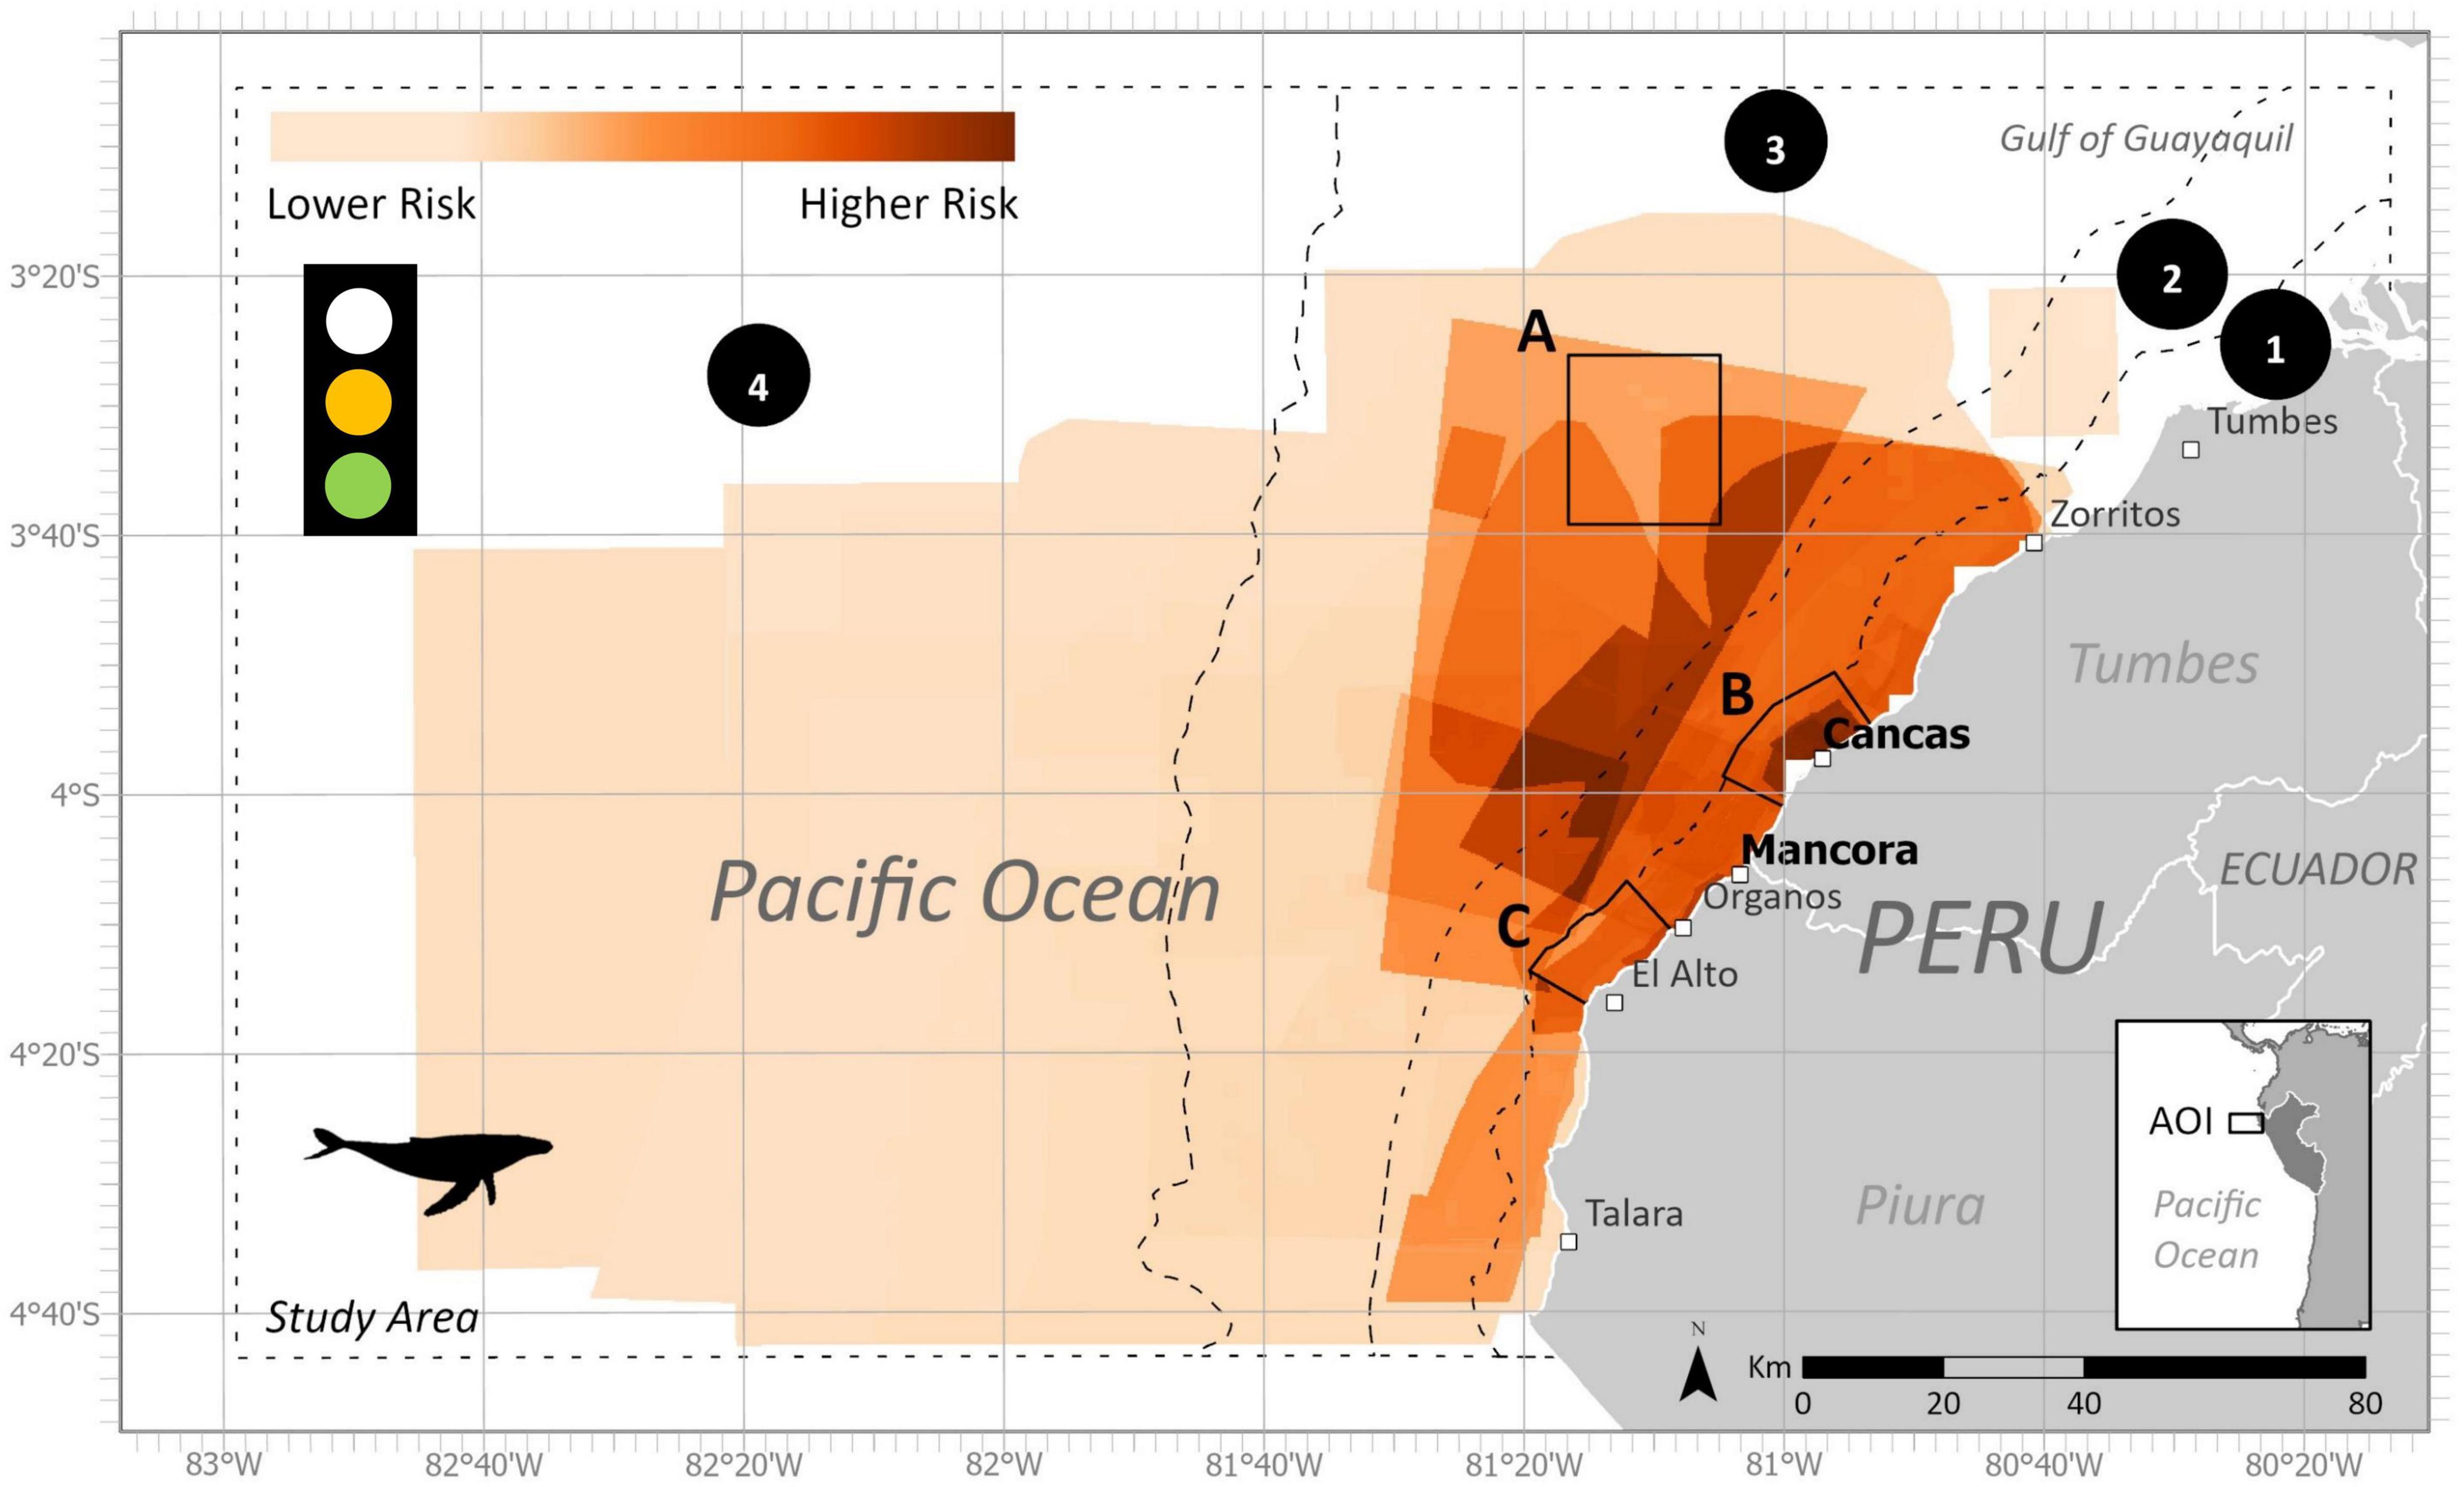
Figure 8. Final estimated bycatch risk within the study area and subzones for humpback whales during the austral winter (June-November). This model output included fishing polygons from both ports. Subzones are represented by black dotted and solid lines. (1) Artisanal fishing zone (5 nm), (2) Territorial seas zone (12 nm), (3) Shelf zone, (4) Beyond shelf zone, (A) Banco de Mancora, (B) Arrecifes de Punta Sal, and (C) Cabo Blanco–El Ñuro. Data uncertainty depicted in stoplight and described further in Table 3.
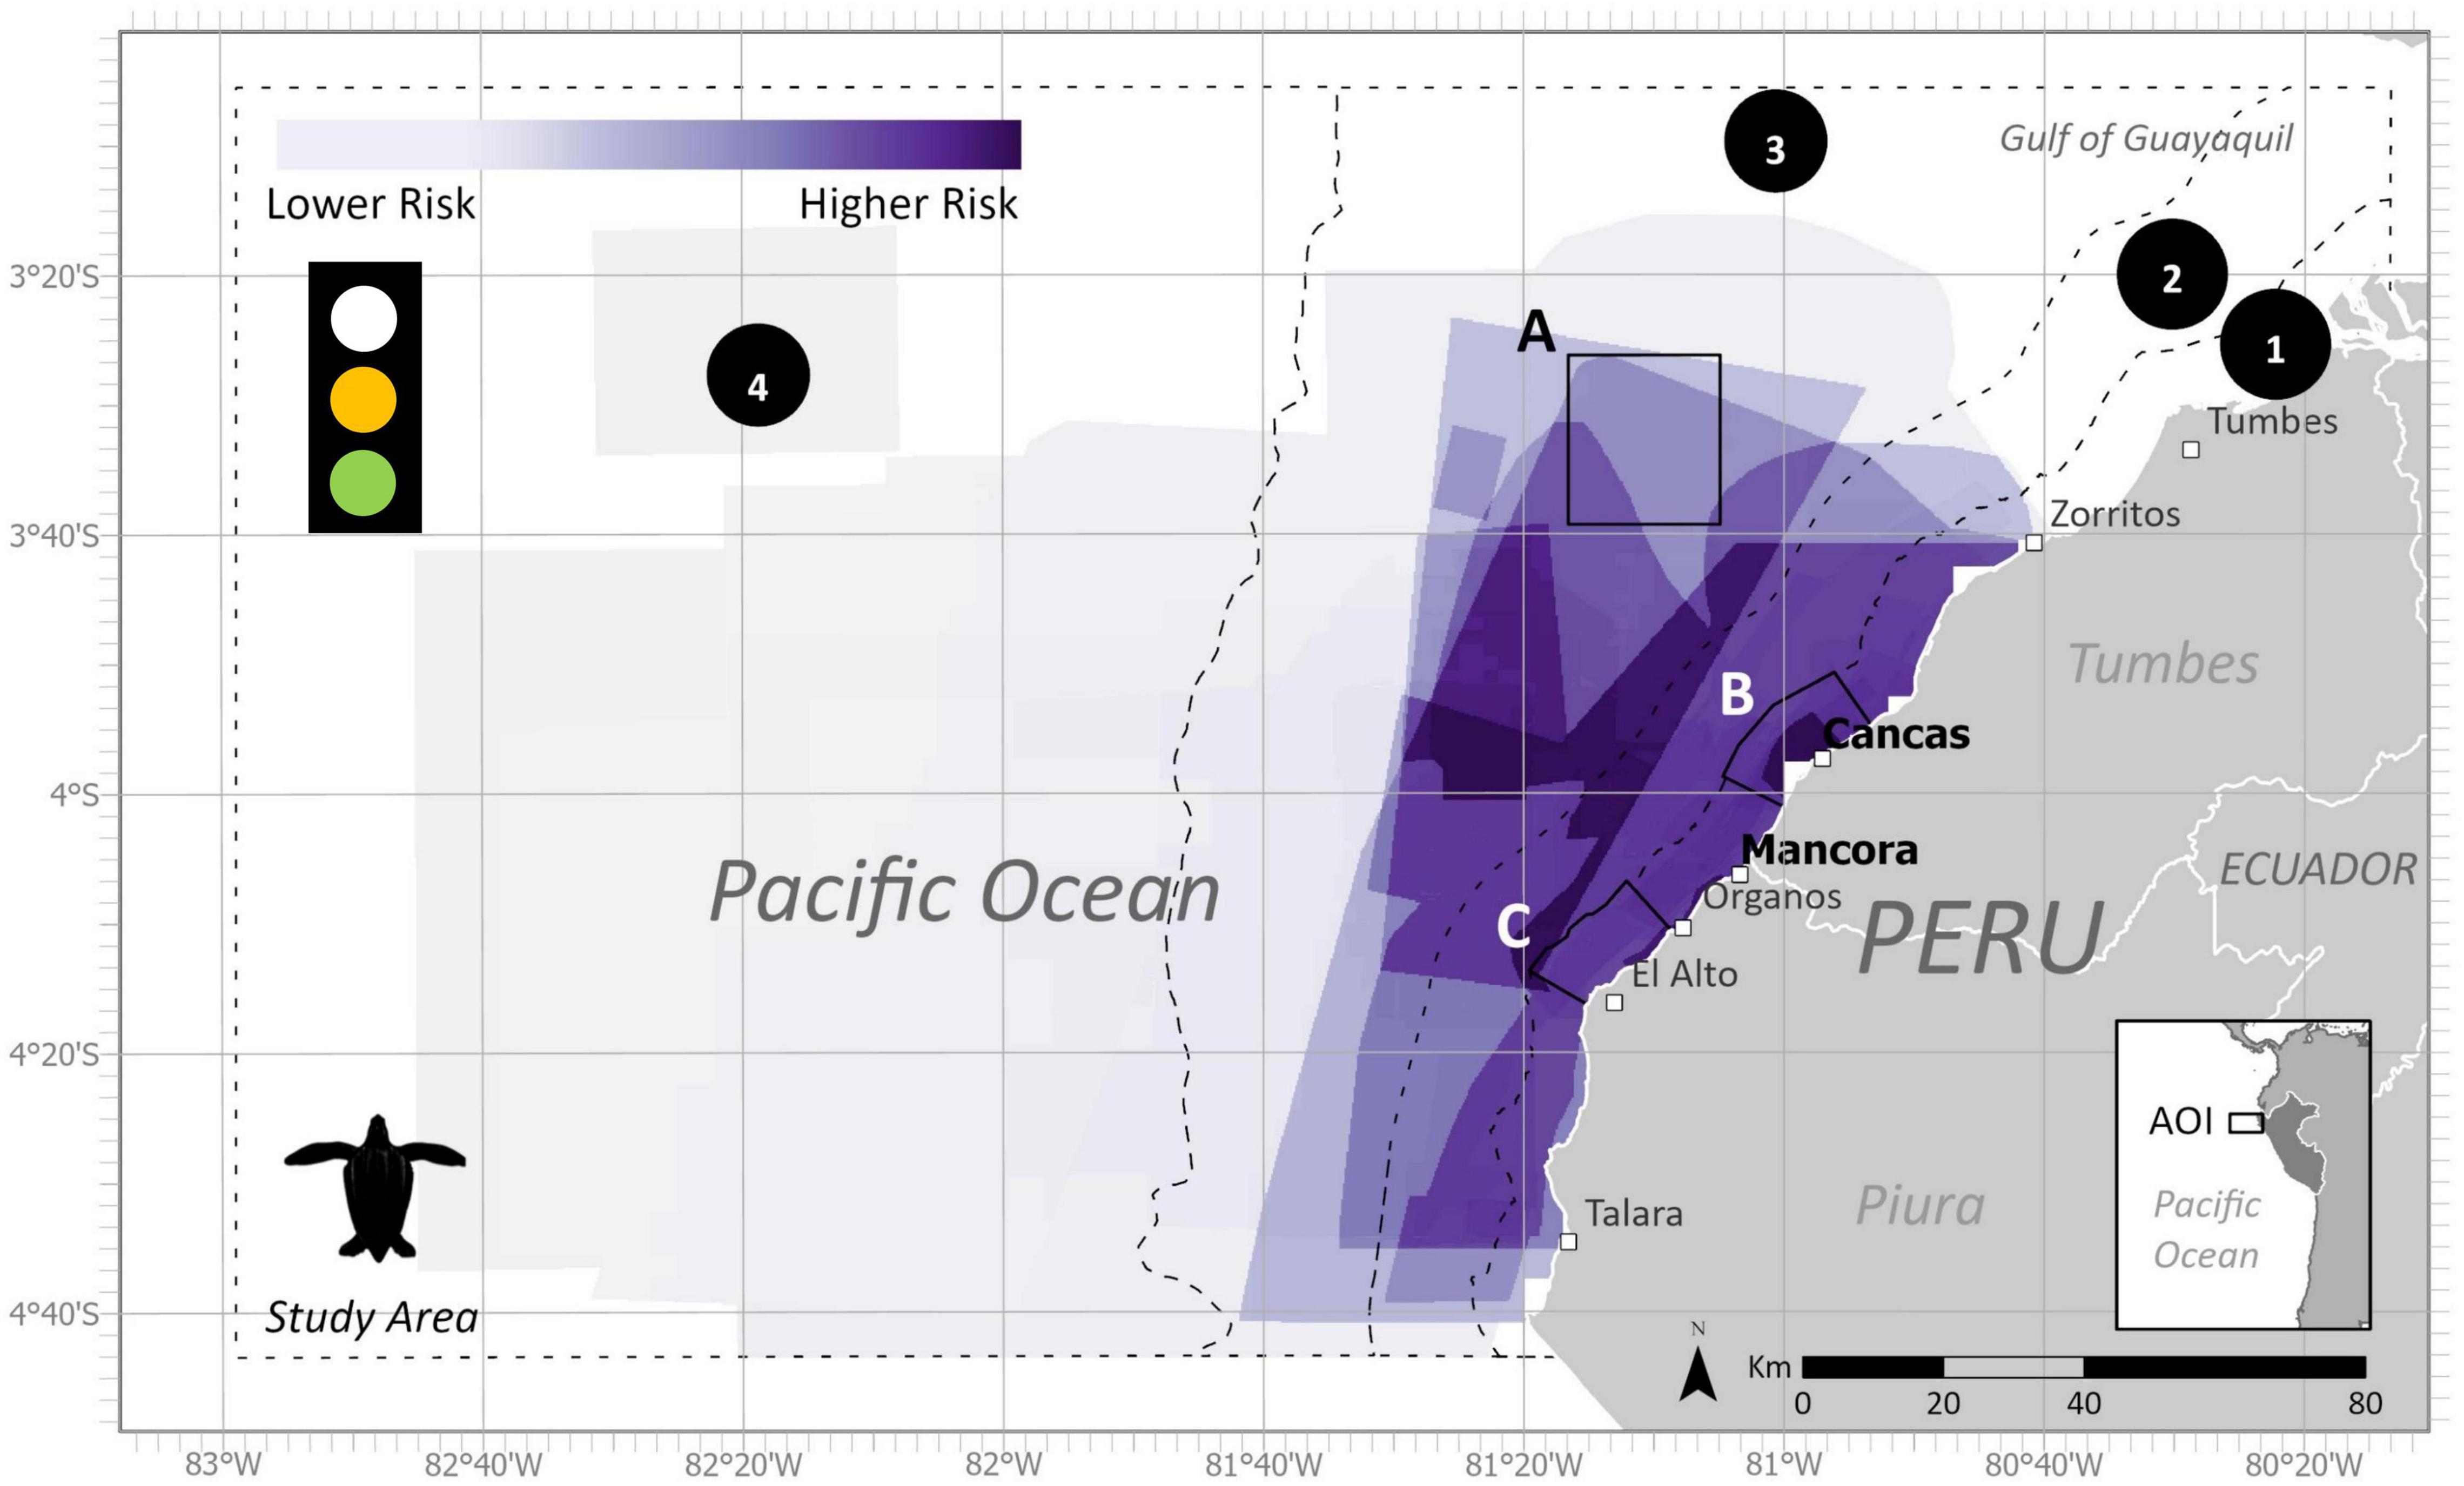
Figure 9. Final estimated bycatch risk within the study area and subzones for leatherback turtles during the austral summer (December-May) with all fishing polygons. (1) Artisanal fishing zone (5 nm), (2) Territorial seas zone (12 nm), (3) Shelf zone, (4) Beyond shelf zone, (A) Banco de Mancora, (B) Arrecifes de Punta Sal, and (C) Cabo Blanco–El Ñuro. Data uncertainty depicted in stoplight and described further in Table 3.
Bycatch Risk Estimates
The ByRA outputs are risk plots and a series of GIS map layers classified by the modeled amount of bycatch risk (Figures 3, 8, 9). Spatially assessed bycatch risk followed patterns associated with high habitat suitability of the study species and where there was high overlap among the seven fishing gear stressors and the spatially explicit criteria (SEC) (likelihood of interaction with species, intensity, and temporal soak time). The HBW risk map showed that the greatest risk was centralized off the coast of Mancora and Cancas, and medium to lower risk further from shore (Figure 8). The highest bycatch risk areas for LBT were present in zones 1, 2, and 3, predominantly centered off the coast between the towns of Cancas and El Alto (Figure 9).
Model outputs that were split by port showed stark differences in the spatial distribution of risk between Cancas and Mancora (Figure 3). For both species, the Cancas risk maps had a smaller range of risk closer to the shore (Figure 3). The risk outputs for Mancora cover a larger region with highest risk spanning a larger coastal area.
For the exposure and consequence (ExC) scores, points plotted higher along the x-axis (consequence) and y-axis (exposure) posed the greatest risk to the species (Figures 4B, 5B). For example, points that had high exposure but lower consequence from a species/gear occurrence were plotted more in the left side of the plot (i.e., handline). Overall, gillnets (surface and bottom) were the riskiest gear type for both species within the ExC plots with similar exposure scores and very small differences in consequence. Bottom longlines were second in overall risk (Figures 4B, 5B). Handlines showed the lowest risk in the ExC plots for both species, in all subzones and the overall study area.
Numbered Zones
Following the spatial distribution of fishing grounds reported by fishers, bycatch risk for most gear types decreased with distance from the coast. For the LBT risk map, there were large proportions of higher risk areas within all subzones for each gear category (Figure 6A). For the HBW risk map, out of the four zones, the largest percentage of highest risk was for bottom gillnets in zone A (Figure 4A).
Proposed Marine Protected Areas
Within the three proposed MPA boundaries, the highest bycatch risk for both species occurred in zone B, Arrecifes de Punta, with the highest risk being associated to surface set gillnets (HBW 87%, LBT 99%), bottom set gillnets (HBW 99%, LBT 99%) and bottom set longlines (HBW 8%, LBT 99%), and additionally surface set longlines (99%) solely for LBT (Figures 5, 10). Closely following was zone C, Cabo Blanco–El Ñuro, with similar risk percentages. Risk assessed in zone A, Banco de Mancora, differed most between the species. Bycatch risk for HBW was greatest for bottom gillnets (24% high risk), though there was 100% medium risk for surface gillnets and purse seine gear types (Figure 5). Compared to the LBT risk map within zone A, highest risk percentages for LBT were present for surface gillnets (100%) and longlines (87%) with a 99% medium risk for purse seines (Figure 10).
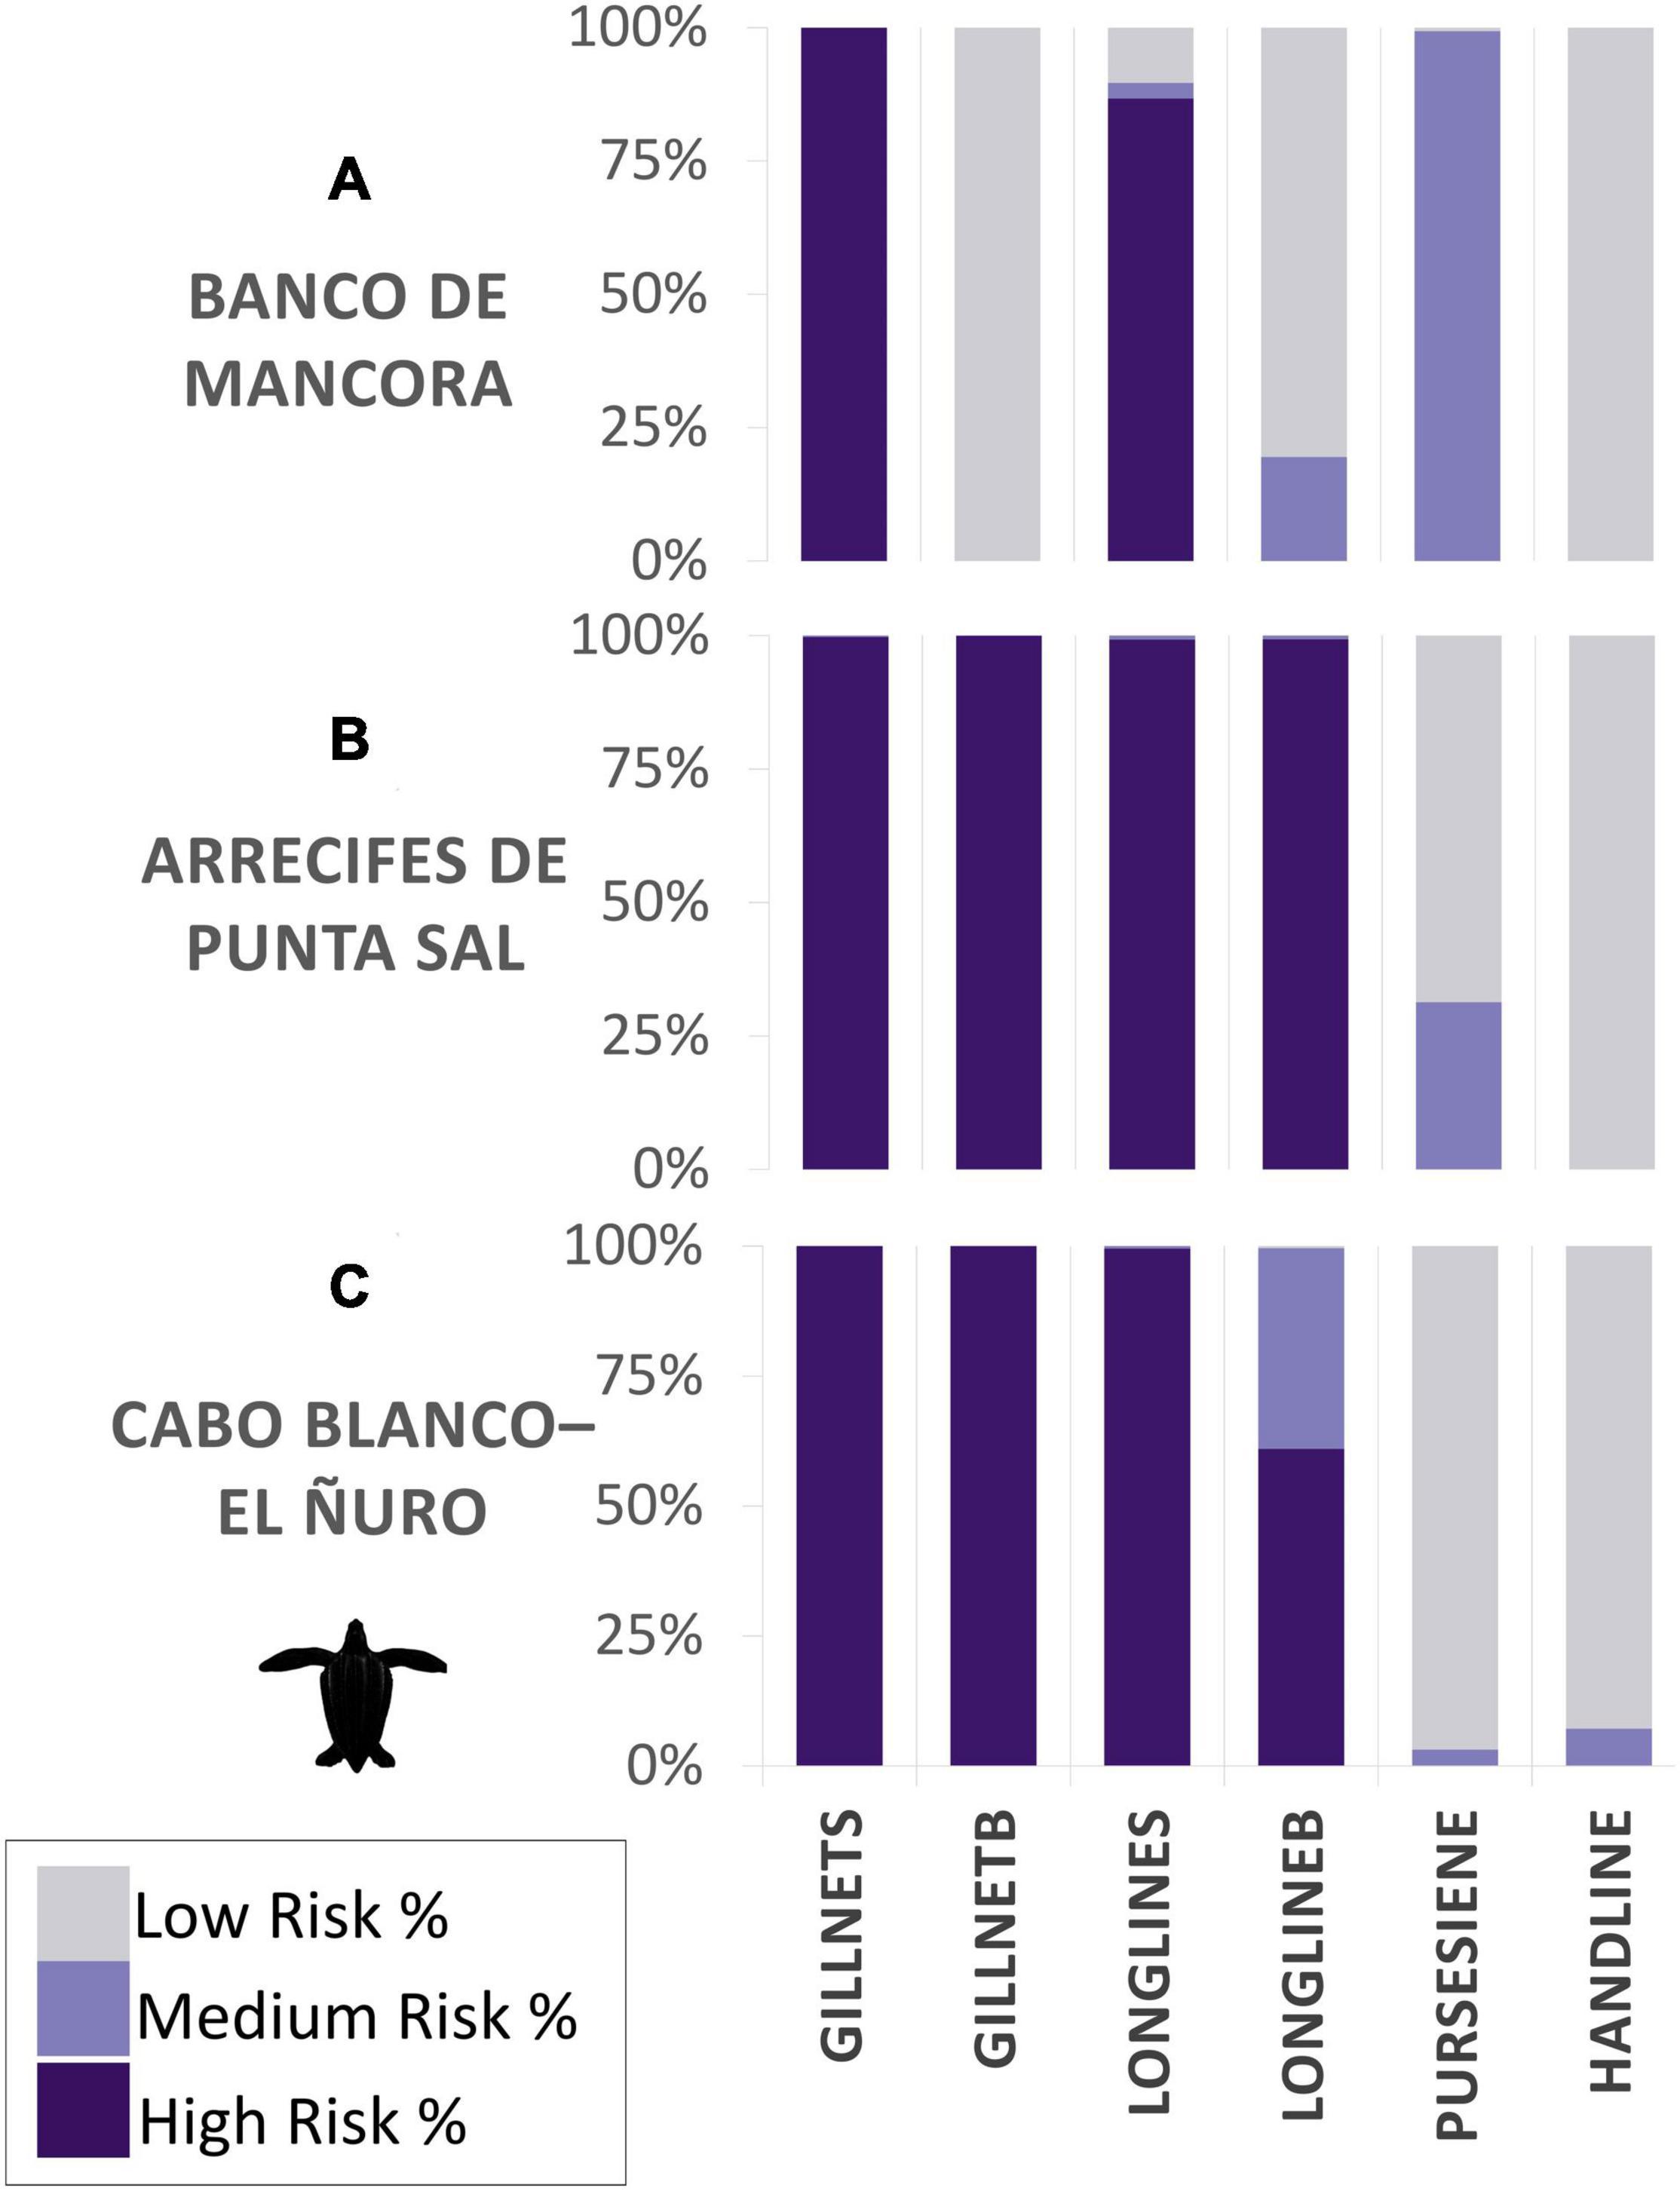
Figure 10. Bycatch risk percentages calculated for leatherback turtles for each gear type. Subzones assessed are composed of proposed marine protected areas: (A) Banco de Mancora, (B) Arrecifes de Punta Sal, and (C) Cabo Blanco–El Ñuro, as part of the Grau Tropical Marine Reserve.
Discussion
By applying the Bycatch Risk Assessment (ByRA) model we were able to map areas of high bycatch risk for two marine megafauna species in two highly active artisanal fishing ports in northern Peru. Our assessment outputs and participatory approach are applicable to both localized bycatch mitigation and broader bycatch reduction efforts in data deficient areas as well as generating initial bycatch estimates by identifying areas of bycatch concern and building connections with fishers.
Bycatch Risk Assessment offered a way to engage fishers and provide a platform for collaboration. The project stimulated discussions in the fishing community and provided repeated opportunities for feedback. This was done by using PGIS and returning to the study sites to talk with fishers about the research. We found it especially valuable to collaborate with local organizations, to build upon established relationships and familiarity with the communities. Local groups help access key points of contacts both with direct fisher communities or with other respected members among fisher organizations, admin of the ports, knowledge holders, and/or experts. Historically, bycatch management and legislation in Peru has come from a top-down approach with a heavier focus on small cetaceans (Van Waerebeek et al., 1997, 2002). Engaging key stakeholders (i.e., the fishers) can help strengthen local capacity for assessing large cetacean entanglements (Johnson et al., 2017; Aburto-Oropeza et al., 2018). Overall, we received positive feedback from the map outputs from fishers, who expressed a specific interest in the temporal overlap of the species distributions and fishing areas. For both seasons, our results showed similar geographic areas of high bycatch risk for HBW and LBT. Similar to other studies, higher risk was concentrated nearer to shore where coastal fisheries overlap with productive habitats. For our study area, highest risk was identified within 20 nm offshore and spanned the coastal distance from Talara to Zorritos (Figures 3, 8, 9). These areas are reflective of the data we used as input into the model. High bycatch risk follows patterns of high habitat preference, fishing intensity, and likelihood of species/gear interaction.
We identified gillnets as the riskiest gear type for both species. Gillnets (surface or demersal) are lethal to many marine species (D’Agrosa et al., 2000; Mangel et al., 2010; Alfaro-Shigueto et al., 2011; Reeves et al., 2013). They create large obstacles for foraging and migratory species (Brown et al., 2015). Also, in alignment with other studies, respondents mentioned that entanglements of HBW in gillnets reported in our study did not always result in mortality. Continued entanglement in gear after being released or separated from a vessel can yield sublethal conditions and excessive energy costs, which in some cases eventually leads to death (van der Hoop et al., 2017). Within the boundaries of the study area specifically, demersal gillnets ranked as the highest risk for HBW, and surface gillnets ranked most risky for LBT. All proposed marine protected areas (Zones A, B, C) contained some level of high risk of bycatch for one or more gear types, specifically gillnets for HBW and longlines and gillnets for LBT.
More refined spatial information was revealed when we analyzed our data by port. Different characteristics between the ports may provide insight into why one port experienced greater risk for entanglements. For Cancas, bycatch risk was centered nearby to the port, and most bycatch risk diminished beyond 5 nm. In Mancora, overall fishing activity covered larger coastal and further offshore areas. Fishers had more days at sea, used thickly threaded gillnets, fished with longer nets, more hooks, and fished for an array of larger target species (sharks, tuna). It was important to separate data to visually map the spatial differences between the ports. The port-specific maps revealed localized differences in fishing areas and, consequently, bycatch risk.
Different characteristics from each ports’ fisheries may have also impacted fishers’ perspectives about the longevity, ecological function and importance of humpbacks and leatherbacks to marine biodiversity in Peruvian waters. Responses and comments from the subsample of fishers in Mancora indicated that they considered humpback whales less important than the subsample of fishers from Cancas. This could be because fishers from Mancora experienced more entanglements where the whale was found entangled on site. This could create negative perceptions for the fishers of Mancora, who directly see humpbacks as a nuisance or threat to their fishing and livelihood. This differs from fishers from Cancas who were often left with a large hole in their net and less evidence as to which animal created it. Regardless, most fishers believed that HBW and LBT are important for the ocean. These responses are derived from a subsample and might not be representative of the communities as a whole. Nonetheless, this shows the complexity of positive and negative attitudes between fishers and their relationships with marine megafauna (Seminara et al., 2019). Any mitigation planning within fishing communities going forward should consider these differences in ports and attitudes that can impact effective management or fishers’ willingness to participate.
Limitations and Biases
Our results showed greatest risk nearest to the ports we assessed, which can be attributed to higher densities of fishing activity but also biased reporting and recall error. Naturally, there is sample bias in the sightings data since fishers would see animals where they fish, unless the animal was seen in passing from fishing grounds to the port. Our use of a combination of purposive and snowball sampling methods was drawn from our positionality as researchers, access of field site/fishers and their ability and willingness to engage with the research team, and field-specific recommendations of the partner institute Pro-Delphinus. Therefore, the results of our study are neither representative of other fishers/fishery locations nor are our results generalizable. However, in our study, 70 of the 85 participants had over 15 years of experience in the trade and a thorough understanding of their local marine environment from within a fisheries context. Our goal was to conduct a qualitative exploration into the spatial extent of bycatch with little aim in generalizing results to the broader community. We were able to gather consensus-based insights from our target population in both fisheries data and fisher perspectives specific to our study sites.
Furthermore, there is no full way to assess the accuracy of the animal identification and fishing locations that the fishers marked on the maps. One way we addressed this was by using vetting tools to assure that interview participants were speaking of humpbacks and leatherbacks when asked questions about these species (Pilcher et al., 2017). Additionally, our methods relied on recall, or the fishers’ memories, to report on previous animal sightings and interactions. Based on a study by O’Donnell et al. (2012), fishers’ recall error was shown to be less when inquiring about rare, positive, or extreme events (O’Donnell et al., 2012). We used methods from Moore et al. (2010) and Pilcher et al. (2017) to reduce this error. For example, one way we did this was by inquiring about events in specific moments in time (i.e., within the past year, within the past five years and beyond 5 years).
Another limitation in our data collection was in incorporating fisher-derived opportunistic sightings into the species distribution models. Often, predictive models of species distributions rely on the quality of data used as input in the model (Derville et al., 2018). Our process for building these models was through participatory GIS (PGIS). For us, PGIS filled in gaps where data were either non-existent or lacking (Thiault et al., 2017). Several studies have adopted PGIS methods for various marine conservation efforts (for example, Levine and Feinholz, 2015; Moore et al., 2017). In addition to species data, tracking vessel coverage, movement, and effort of SSF is difficult, if not impossible to obtain. Our incorporation of PGIS to map not only fisheries but species sightings required additional layers of caution that we incorporated in our methodology to reduce bias and consequent misidentification of habitat (van Strien et al., 2013; Pennino et al., 2019).
Lastly, PGIS methods used to collect data on animal sightings and previous bycatch incidents have given us insights into lesser-known habitat use, especially when systematic transect surveys are logistically infeasible, prohibitively expensive or when detection probability is low (Di Febbraro et al., 2018). The latter could be the case for the EP leatherback turtles, which are rare given their small population size and predominantly use pelagic habitat (Giraud et al., 2016). Using PGIS for species occurrence is an effective route for creating a baseline understanding of species distribution with data uncertainty (Rocchini et al., 2011; Guillera-Arroita et al., 2015).
Bycatch Within a Regional Context
Interviews with fishers suggested higher numbers of HBW entanglements than had been previously documented (Félix et al., 2011; García-Godos et al., 2013). To date, Peruvian SSF bycatch estimates have relied on various short-term collection methods completed by government or non-profit agencies (Mangel et al., 2010; Alfaro-Shigueto et al., 2011; Arlidge et al., 2020). These include onboard observers, fisher interviews, and early testing of remote electronic monitoring (Bartholomew et al., 2018; Ayala et al., 2019; Campbell et al., 2020). Interviews and mapping workshops helped identify areas of greatest risk and improve quantifications of entanglements. From our research, focused on two ports (of the 100+ landing sites along the Peruvian coast), about half of the fishers (n = 41, Mancora = 30, Cancas = 11) self-reported a total range of between 64 and 100 HBW bycatch events in 2018 alone. Of these, 64 were mapped with an estimated location of interaction. Of the 85 fishermen interviewed, 28 individual fishers said they have entangled more than 10 HBW in their lifetime and for LBT, only 4 individual fishers reported accidentally capturing more than 10 in their lifetime. These larger estimates of bycatch far surpass previous counts and provide some evidence for a large number of bycatch events that may be occurring but lack an avenue for continuous reporting.
As our ByRA outputs suggests, there is a wide coastal area identified as medium to high bycatch risk for both species, with a high likelihood that this area will increase in size. According to a recent study on the growth and economic status of the Peruvian SSF fleet, SSF fishing effort is increasing, covering larger fishing areas, while landing less catch (De la Puente et al., 2020). If this national trend of vessel expansion and fishing effort is reflective in our study area, larger areas of habitat would be expected to be at risk as well. Recent review of the Southeast Pacific HBW population, reveals that as a whole, HBW are arriving a month earlier to the northern tropical waters (Avila et al., 2020). This would add to a longer temporal overlap with fisheries as HBW’s approach their wintering habitat, especially putting adult whales at higher risk (Pacheco et al., 2021).
Trends in SSF status may also impact LBT’s. While the majority of LBT life history is pelagic (Hoover et al., 2019), based on our findings, these turtles also occur in neritic waters, close enough to shore to overlap with artisanal fisheries. Final SDM outputs for leatherback turtles showed greater preference to coastal regions within the depths of 200 m. Though coastal presence has been less commonly reported, nearshore sightings of LBT’s have been documented previously via bycatch monitoring or surveys in coastal SSF in northern Peru, western Mexico, the central Americas and Colombia (Alfaro-Shigueto et al., 2008; Arlidge et al., 2020; Ortiz-Alvarez et al., 2020). Given the critical status of the EP leatherback turtle, even a few fishing-related deaths (like those reported here) could further drive declines in the population (Arlidge et al., 2020; Laúd, 2020).
Future Directions
There is no one path to bycatch reduction. The ByRA model and risk maps offer a more accurate way of understanding and framing that enable more informed decisions about how to reduce bycatch. Our outputs seek to guide conversations leading to effective marine management planning. However, these outputs can be viewed as flexible with an option to be continuously adjusted and updated. Especially within the exposure and consequence table, as new information arises on the local fisheries and species, revising ByRA inputs would allow for refined and more accurate risk assessment scenarios. For example, from our interviews, we discovered greater variations between gear types that could be included in the model to further parse out consequences of bycatch interaction between more specified gear variations and individual species. Additionally, as De la Puente et al. (2020) notes, since 2015, gillnet and handline fishers have consistently made below minimum wage, while those using trawl nets, purse seine, longlines and squid gigs have made more. For our research we did not assess bycatch risk for two of these gear types (trawl nets due to their illegal status in the area, and squid jigs). It may be important to include additional gear types that have been identified as fisheries with potentially greater profits that could become more favorable financially to fishers in the near future.
Bycatch Risk Assessment is a robust tool that can facilitate greater empowerment of local fishers and lead to a variety of management and legislative actions. Any form of successful mitigation efforts benefit from fishers’ interest and participation beginning with the early steps of planning (Campbell and Cornwell, 2008; Aburto-Oropeza et al., 2018; Twichell et al., 2018). To truly involve fishers in bycatch mitigation process, ByRA provides structured opportunities to engage in sharing information with the possibility to be representative, and having fishers influence the outcomes. If management tools such as dynamic and seasonal fishing bans and MPA no-take areas are not immediately possible or desired, various practices such as limited soak times, net patrolling, and safe post-capture handling can be applied to areas of highest identified bycatch. This way, limited resources and personnel can be directed to where they can be most effective and where key stakeholder buy-in is strongest. As previous studies suggest, fisher participation is strongly dependent on the process and facilitation of collaboration among parties (Reed, 2008). We learned from our conservations with fishers that they had already taken voluntary actions to minimize HBW entanglements during whale season and continued to do so after our project, such as switching gear types, fishing further offshore, or temporarily stopping fishing to avoid HBW’s.
Future use of the ByRA model could expand beyond our study area or be applied to other ports along the coast and extend risk analysis to other taxa and species (Hines et al., 2020). Within our study site are several other marine megafauna species with similar bycatch vulnerability, such as small cetaceans or other species of sea turtles. Future habitat modeling should link climatology data to species presence by incorporating El Nino and El Nina seasonal variations to better reflect oceanographic variations (Estrella Arellano and Swartzman, 2010). It may also be desirable to incorporate sightings data from local whale-watching companies as input into species models and build upon local knowledge of whale entanglements (Pacheco et al., 2021).
Bycatch Risk Assessment is a model that is strengthened through careful, representative participation that combined several means of data collection from community members, marine scientists, existing databases, and previous research within the area. ByRA outputs offer spatial, and temporal specific recommendations by gear type, subzone, and species to better engage future management and support marine policy. ByRA can help identify possible other scenarios helpful for fishers and animals, such as switching to other economic activities during the whale entangle season, or temporarily switching to other fishing gears. The tool can help fishers act upon diversification based on real data. Bycatch reduction requires multifaceted approaches, working alongside agencies and across broader regions and countries. Given the pyramidal structure of traditional management measures by developing countries with high numbers of SSF, ByRA could also serve as a method where fishermen have a voice and can be part of local management measures.
Data Availability Statement
The raw data supporting the conclusions of this article will be made available by the authors, without undue reservation.
Ethics Statement
The studies involving human participants were reviewed and approved by the San Francisco State University Institutional Review Board, Protocol number X19-30. Written informed consent for participation was not required for this study in accordance with the national legislation and the institutional requirements.
Author Contributions
AC, CG, and JA-S: fieldwork, logistics, and interviews. AC, MC, and GV: data analysis. AC, CG, EH, JM, and JA-S: study design. AC, CG, JM, JA-S, GV, EH, and AS: writing and editing the manuscript. All authors contributed to the manuscript and approved the submitted version.
Funding
This research was funded by the Rufford Foundation grant 27741-1, the American Cetacean Society, San Francisco Chapter-Jonathon Stern Research grant, the Society for Conservation Biology Marine Section Small Grant Program, and a NSF Research Traineeship Grant (award no. DGE-1633336) through the Estuary and Ocean Science Center, at San Francisco State University.
Conflict of Interest
The authors declare that the research was conducted in the absence of any commercial or financial relationships that could be construed as a potential conflict of interest.
Publisher’s Note
All claims expressed in this article are solely those of the authors and do not necessarily represent those of their affiliated organizations, or those of the publisher, the editors and the reviewers. Any product that may be evaluated in this article, or claim that may be made by its manufacturer, is not guaranteed or endorsed by the publisher.
Acknowledgments
We have the greatest gratitude for all of the fishers who participated in the interviews and workshops in Mancora, Cancas, and Los Organos. We especially want to thank Carlos Belupu, who was crucial during fisher interviews. We thank the ProDelphinus staff who helped with the data collection in the field: Clara Ortiz, Kelly Dias, Adriana Gonzalez, Elizabeth Campbell, and Daniela Thorne.
Supplementary Material
The Supplementary Material for this article can be found online at: https://www.frontiersin.org/articles/10.3389/fmars.2021.776965/full#supplementary-material
Footnotes
References
Aburto-Oropeza, O., López-Sagástegui, C., Moreno-Báez, M., Mascareñas-Osorio, I., Jiménez-Esquivel, V., Johnson, A. F., et al. (2018). Endangered species, ecosystem integrity, and human livelihoods. Conserv. Lett. 11:e12358. doi: 10.1111/conl.12358
Alava, J., Tatar, B., José Barragán, M., Castro, C., Rosero, P., Denkinger, J., et al. (2017). Mitigating cetacean bycatch in coastal Ecuador: governance challenges for small-scale fisheries. Mar. Policy 110:102769. doi: 10.1016/j.marpol.2017.05.025
Alfaro-Shigueto, J., Dutton, P. H., Van Bressem, M., and Mangel, J. (2008). Interactions between leatherback turtles and peruvian artisanal fisheries. Chelonian Conserv. Biol. 6, 129–134.
Alfaro-Shigueto, J., Mangel, J. C., Bernedo, F., Dutton, P. H., Seminoff, J. A., and Godley, B. J. (2011). Small-scale fisheries of Peru: a major sink for marine turtles in the Pacific. J. Appl. Ecol. 48, 1432–1440. doi: 10.1111/j.1365-2664.2011.02040.x
Alfaro-Shigueto, J., Mangel, J. C., Darquea, J., Donoso, M., Baquero, A., Doherty, P. D., et al. (2018). Untangling the impacts of nets in the southeastern Pacific: rapid assessment of marine turtle bycatch to set conservation priorities in small-scale fisheries. Fish. Res. 206, 185–192. doi: 10.1016/j.fishres.2018.04.013
Alfaro-Shigueto, J., Mangel, J. C., Pajuelo, M., Dutton, P. H., Seminoff, J. A., and Godley, B. J. (2010). Where small can have a large impact: structure and characterization of small-scale fisheries in Peru. Fish. Res. 106, 8–17. doi: 10.1016/j.fishres.2010.06.004
Arkema, K. K., Verutes, G., Bernhardt, J. R., Clarke, C., Rosado, S., Canto, M., et al. (2014). Assessing habitat risk from human activities to inform coastal and marine spatial planning: a demonstration in Belize. Environ. Res. Lett. 9:114016. doi: 10.1088/1748-9326/9/11/114016
Arlidge, W. N. S., Squires, D., Alfaro-Shigueto, J., Booth, H., Mangel, J. C., and Milner-Gulland, E. J. (2020). A mitigation hierarchy approach for managing sea turtle captures in small-scale fisheries. Front. Mar. Sci. 7:49. doi: 10.3389/fmars.2020.00049
Avila, I. C., Dormann, C. F., García, C., Payán, L. F., and Zorrilla, M. X. (2020). Humpback whales extend their stay in a breeding ground in the Tropical Eastern Pacific. ICES J. Mar. Sci. 77, 109–118. doi: 10.1093/icesjms/fsz251
Ayala, L., Ortiz, M., and Gelcich, S. (2019). Exploring the role of fishers knowledge in assessing marine megafauna bycatch: insights from the Peruvian longline artisanal fishery. Anim. Conserv. 22, 251–261. doi: 10.1111/acv.12460
Bailey, H., Benson, S. R., Shillinger, G. L., Bograd, S. J., Dutton, P. H., Eckert, S. A., et al. (2012). Identification of distinct movement patterns in Pacific leatherback turtle populations influenced by ocean conditions. Ecol. Appl. 22, 735–747. doi: 10.1890/11-0633
Bakun, A., and Weeks, S. J. (2008). The marine ecosystem off Peru: what are the secrets of its fishery productivity and what might its future hold? Progr. Oceanogr. 79, 290–299. doi: 10.1016/j.pocean.2008.10.027
Bartholomew, D. C., Mangel, J. C., Alfaro-Shigueto, J., Pingo, S., Jimenez, A., and Godley, B. J. (2018). Remote electronic monitoring as a potential alternative to on-board observers in small-scale fisheries. Biol. Conserv. 219, 35–45. doi: 10.1016/j.biocon.2018.01.003
Berkes, F., Mahon, R., Mcconney, P., Pollnac, R., and Pomeroy, R. (2001). Managing Small-scale Fisheries. Ottawa: IDRC.
Brandt, K., Graham, L., Hawthorne, T., Jeanty, J., Burkholder, B., Munisteri, C., et al. (2020). Integrating sketch mapping and hot spot analysis to enhance capacity for community-level flood and disaster risk management. Geogr. J. 186, 198–212. doi: 10.1111/geoj.12330
Breen, P., Brown, S., Reid, D., and Rogan, E. (2017). Where is the risk? Integrating a spatial distribution model and a risk assessment to identify areas of cetacean interaction with fisheries in the northeast Atlantic. Ocean Coast. Manag. 136, 148–155. doi: 10.1016/j.ocecoaman.2016.12.001
Brown, J. L., Bennett, J. R., and French, C. M. (2017). SDMtoolbox 2.0: the next generation Python-based GIS toolkit for landscape genetic, biogeographic and species distribution model analyses. PeerJ 5:e4095. doi: 10.7717/peerj.4095
Brown, S. L., Reid, D., and Rogan, E. (2015). Spatial and temporal assessment of potential risk to cetaceans from static fishing gears. Mar. Policy 51, 267–280. doi: 10.1016/j.marpol.2014.09.009
Campbell, E., Pasara-Polack, A., Mangel, J. C., and Alfaro-Shigueto, J. (2020). Use of small cetaceans as bait in small-scale fisheries in Peru. Front. Mar. Sci. 7:534507. doi: 10.3389/fmars.2020.534507
Campbell, L. M., and Cornwell, M. L. (2008). Human dimensions of bycatch reduction technology: current assumptions and directions for future research. Endanger. Species Res. 5, 325–334. doi: 10.3354/esr00172
Cashion, T., Al-Abdulrazzak, D., Belhabib, D., Derrick, B., Divovich, E., Moutopoulos, D. K., et al. (2018). Reconstructing global marine fishing gear use: catches and landed values by gear type and sector. Fish. Res. 206, 57–64. doi: 10.1016/j.fishres.2018.04.010
Castellanos-Galindo, G. A., Chong-Montenegro, C., Baos, R. A., Zapata, L. A., Tompkins, P., Graham, R. T., et al. (2018). Using landing statistics and fishers’ traditional ecological knowledge to assess conservation threats to Pacific goliath grouper in Colombia. Aquat. Conserv. 28, 305–314. doi: 10.1002/aqc.2871
Castillo, G., Fernández, J., Medina, A., and Guevara-Carrasco, R. (2018). Third structural survey of the artisanal fishery in the Peruvian littoral. Gen. Results Inf. Inst. Mar. Peru 45, 299–388.
Chung, M.-K., Lu, D.-J., Tsai, B.-W., and Chou, K.-T. (2019). Assessing effectiveness of PPGIS on Protected Areas by Governance Quality: a case study of community-based monitoring in wu-wei-kang wildlife refuge, Taiwan. Sustainability 11:4154. doi: 10.3390/su11154154
Cooke, J. G. (2018). Megaptera novaeangliae. IUCN Red List Threatened Species 2018:e.T13006A50362794.
Croll, D. A., Marinovic, B., Benson, S., Chavez, F. P., Black, N., Ternullo, R., et al. (2005). From wind to whales: trophic links in a coastal upwelling system. Mar. Ecol. Progr. Series 289, 117–130. doi: 10.3354/meps289117
D’Agrosa, C., Lennert-Cody, C. E., and Vidal, O. (2000). Vaquita bycatch in Mexico’s artisanal gillnet fisheries: driving a small population to extinction. Conserv. Biol. 14, 1110–1119. doi: 10.1046/j.1523-1739.2000.98191.x
De la Puente, S., López de la Lama, R., Benavente, S., Sueiro, J. C., and Pauly, D. (2020). Growing into poverty: reconstructing peruvian small-scale fishing effort Between 1950 and 2018. Front. Mar. Sci. 7:681. doi: 10.3389/fmars.2020.00681
Denzin, N. K., and Lincoln, Y. S. (2018). The SAGE Handbook of Qualitative Research (Fifth edition.). Thousand Oaks: SAGE.
Derville, S., Torres, L. G., Iovan, C., and Garrigue, C. (2018). Finding the right fit: comparative cetacean distribution models using multiple data sources and statistical approaches. Divers. Distrib. 24, 1657–1673. doi: 10.1111/ddi.12782
Di Febbraro, M., Sallustio, L., Vizzarri, M. De Rosa, D. De Lisio, L., Loy, A., et al. (2018). Expert-based and correlative models to map habitat quality: which gives better support to conservation planning? Glob. Ecol. Conserv. 16:e00513. doi: 10.1016/j.gecco.2018.e00513
Dransfield, A., Hines, E., McGowan, J., Holzman, B., Nur, N., Elliott, M., et al. (2014). Where the whales are: using habitat modeling to support changes in shipping regulations within national marine sanctuaries in central California. Endanger. Species Res. 26, 39–57. doi: 10.3354/esr00627
Dunn, C. E. (2007). Participatory GIS - A people’s GIS? Progr. Hum. Geogr. 31, 616–637. doi: 10.1177/0309132507081493
Estes, J. A., Terborgh, J., Brashares, J. S., Power, M. E., Berger, J., Bond, W. J., et al. (2011). Trophic downgrading of planet earth. Science 333, 301–306. doi: 10.1126/science.1205106
Estrella Arellano, C. E., and Swartzman, G. (2010). The Peruvian artisanal fishery: changes in patterns and distribution over time. Fish. Res. 101, 133–145. doi: 10.1016/j.fishres.2009.08.007
Félix, F., and Botero-Acosta, N. (2011). Distribution and behaviour of humpback whale mother-calf pairs during the breeding season off Ecuador. Mar. Ecol. Progr. Series 426, 277–287. doi: 10.3354/meps08984
Félix, F., and Guzmán, H. M. (2014). Satellite tracking and sighting data analyses of Southeast Pacific humpback whales (Megaptera novaeangliae): is the migratory route coastal or oceanic? Aquat. Mamm. 40, 329–340. doi: 10.1578/AM.40.4.2014.329
Félix, F., Muñoz, M., Falconí, J., Botero, N., and Haase, B. (2011). Entanglement of humpback whales in artisanal fishing gear in Ecuador. J. Cetacean Res. Manage. 3, 283–290.
Fiedler, P. C., Redfern, J. V., Forney, K. A., Palacios, D. M., Sheredy, C., Rasmussen, K., et al. (2018). Prediction of large whale distributions: a comparison of presence-absence and presence-only modeling techniques. Front. Mar. Sci. 5:419. doi: 10.3389/fmars.2018.00419
Figueiredo, I., Maia, C., and Lagarto, N. Serra-Pereira, B. (2020). Bycatch estimation of Rajiformes in multispecies and multigear fisheries. Fish. Res. 232:105727. doi: 10.1016/j.fishres.2020.105727
García-Godos, I., Van Waerebeek, K., Alfaro-Shigueto, J., and Mangel, J. C. (2013). Entanglements of large cetaceans in Peru: few records but high risk. Pac. Sci. 67, 523–532. doi: 10.2984/67.4.3
Gibbs, M. T., and Browman, H. I. (2015). Introduction: risk assessment and risk management: a primer for marine scientists. ICES J. Mar. Sci. 72, 992–996. doi: 10.1093/icesjms/fsu232
Giraud, C., Calenge, C., Coron, C., and Julliard, R. (2016). Capitalizing on opportunistic data for monitoring relative abundances of species. Biometrics 72, 649–658. doi: 10.1111/biom.12431
Gray, C. A., and Kennelly, S. J. (2018). Bycatches of endangered, threatened and protected species in marine fisheries. Rev. Fish Biol. Fish. 28, 521–541. doi: 10.1007/s11160-018-9520-7
Guevara-Carrasco, R., and Bertrand, A. (2017). Atlas de la Pesca Artesanal del Mar del Perú. Edición IMARPE-IRD. 183. Available online at: http://biblioimarpe.imarpe.gob.pe/handle/123456789/3167 (accessed January 2, 2021).
Guidino, C., Llapapasca, M. A., Silva, S., Alcorta, B., and Pacheco, A. S. (2014). Patterns of Spatial and Temporal Distribution of Humpback Whales at the Southern Limit of the Southeast Pacific Breeding Area. PLoS One 9:e112627. doi: 10.1371/journal.pone.0112627
Guillera-Arroita, G. Lahoz-Monfort, J. J., Elith, J., Gordon, A., Kujala, H., Lentini, P. E., et al. (2015). Is my species distribution model fit for purpose? Matching data and models to applications. Glob. Ecol. Biogeogr. 24, 276–292. doi: 10.1111/geb.12268
Hall, M., and Roman, M. (2013). Bycatch and Non-Tuna Catch In The Tropical Tuna Purse Seine Fisheries of the World. FAO Fisheries and Aquaculture Technical Paper, (568). Rome: FAO.
Hamer, D. J., Goldsworthy, S. D., Costa, D. P., Fowler, S. L., Page, B., and Sumner, M. D. (2013). The endangered Australian sea lion extensively overlaps with and regularly becomes by-catch in demersal shark gill-nets in South Australian shelf waters. Biol. Conserv. 157, 386–400. doi: 10.1016/j.biocon.2012.07.010
Harwood, J. (2000). Risk assessment and decision analysis in conservation. Biol. Conserv. 95, 219–226. doi: 10.1016/S0006-3207(00)00036-7
Hashimoto, M., Shirakihara, K., and Shirakihara, M. (2015). Effects of bycatch on the population viability of the narrow-ridged finless porpoises in Ariake Sound and Tachibana Bay, Japan. Endanger. Species Res. 27, 87–94. doi: 10.3354/esr00658
Hines, E., Ponnampalam, L., Junchompoo, C., Peter, C., Vu, L., Huynh, T., et al. (2020). Getting to the bottom of bycatch: a GIS-based toolbox to assess the risk of marine mammal bycatch. Endanger. Species Res. 42, 37–57. doi: 10.3354/esr01037
Hobday, A. J., Smith, A. D. M., Stobutzki, I. C., Bulman, C., Daley, R., Dambacher, J. M., et al. (2011). Ecological risk assessment for the effects of fishing. Fish. Res. 108, 372–384. doi: 10.1016/j.fishres.2011.01.013
Holsman, K., Samhouri, J., Cook, G., Hazen, E., Olsen, E., Dillard, M., et al. (2017). An ecosystem-based approach to marine risk assessment. Ecosyst. Health Sustain. 3:e01256. doi: 10.1002/ehs2.1256
Hooker, Y. (2016). Expediente tecnico Zona Reservada Mar Pacifico Tropical Peruano/Technical Report for the Peruvian Tropical Pacific Sea Reserve. Peru: SERNANP.
Hoover, A. L., Liang, D., Alfaro-Shigueto, J., Mangel, J. C., Miller, P. I., Morreale, S. J., et al. (2019). Predicting residence time using a continuous-time discrete-space model of leatherback turtle satellite telemetry data. Ecosphere 10:e02644. doi: 10.1002/ecs2.2644
Johnson, A. F., Caillat, M., Verutes, G. M., Peter, C., Junchompoo, C., Long, V., et al. (2017). Poor fisheries struggle with U.S. import rule. Science 355, 1031–1032. doi: 10.1126/science.aam9153
Kenchington, E., Murillo, F. J., Lirette, C., Sacau, M., Koen-Alonso, M., Kenny, A., et al. (2014). Kernel density surface modelling as a means to identify significant concentrations of vulnerable marine ecosystem indicators. PLoS One 9:e109365. doi: 10.1371/journal.pone.0109365
Kramer-Schadt, S., Niedballa, J., Pilgrim, J. D., Schröder, B., Lindenborn, J., Reinfelder, V., et al. (2013). The importance of correcting for sampling bias in MaxEnt species distribution models. Divers. Distrib. 19, 1366–1379. doi: 10.1111/ddi.12096
Kroodsma, D. A., Mayorga, J., Hochberg, T., Miller, N. A., Boerder, K., Ferretti, F., et al. (2018). Tracking the global footprint of fisheries. Science 359, 904–908.
Laúd, O. P. O. (2020). Enhanced, coordinated conservation efforts required to avoid extinction of critically endangered eastern Pacific leatherback turtles. Sci. Rep. 10:4772. doi: 10.1038/s41598-020-60581-7
Leis, M., de, O., Devillers, R., Medeiros, R. P., and Chuenpagdee, R. (2019). Mapping fishers’ perceptions of marine conservation in Brazil: an exploratory approach. Ocean Coast. Manag. 167, 32–41. doi: 10.1016/j.ocecoaman.2018.09.017
Levine, A. S., and Feinholz, C. L. (2015). Participatory GIS to inform coral reef ecosystem management: mapping human coastal and ocean uses in Hawaii. Appl. Geogr. 59, 60–69. doi: 10.1016/j.apgeog.2014.12.004
Lewison, R. L., Crowder, L. B., Wallace, B. P., Moore, J. E., Cox, T., Zydelis, R., et al. (2014). Global patterns of marine mammal, seabird, and sea turtle bycatch reveal taxa-specific and cumulative megafauna hotspots. Proc. Natl. Acad. Sci. 111, 5271–5276. doi: 10.1073/pnas.1318960111
Lewison, R. L., Johnson, A. F., and Verutes, G. M. (2018). Embracing complexity and complexity-awareness in marine megafauna conservation and research. Front. Mar. Sci. 5:207. doi: 10.3389/fmars.2018.00207
Luizza, M. W., Wakie, T., Evangelista, P. H., and Jarnevich, C. S. (2016). Integrating local pastoral knowledge, participatory mapping, and species distribution modeling for risk assessment of invasive rubber vine (Cryptostegia grandiflora) in Ethiopia’s Afar region. Ecol. Soc. 21:22. doi: 10.5751/ES-07988-210122
Mancini, A., Koch, V., Seminoff, J. A., and Madon, B. (2012). Small-scale gill-net fisheries cause massive green turtle Chelonia mydas mortality in Baja California Sur, Mexico. Oryx 46, 69–77. doi: 10.1017/S0030605310001833
Mangel, J. C., Alfaro-Shigueto, J., Van Waerebeek, K., Cáceres, C., Bearhop, S., Witt, M. J., et al. (2010). Small cetacean captures in Peruvian artisanal fisheries: high despite protective legislation. Biol. Conserv. 143, 136–143. doi: 10.1016/j.biocon.2009.09.017
Mannocci, L., Forget, F., Tolotti, M. T., Bach, P., Bez, N., Demarcq, H., et al. (2020). Predicting bycatch hotspots in tropical tuna purse seine fisheries at the basin scale. Glob. Ecol. Conserv. 24:e01393. doi: 10.1016/j.gecco.2020.e01393
Mason, J. G., Alfaro-Shigueto, J., Mangel, J. C., Brodie, S., Bograd, S. J., Crowder, L. B., et al. (2019). Convergence of fishers’ knowledge with a species distribution model in a Peruvian shark fishery. Conserv. Sci. Pract. 1:e13. doi: 10.1111/csp2.13
McCauley, D. J., Pinsky, M. L., Palumbi, S. R., Estes, J. A., Joyce, F. H., and Warner, R. R. (2015). Marine defaunation: animal loss in the global ocean. Science 347:1255641.
Moore, J. E., Cox, T. M., Lewison, R. L., Read, A. J., Bjorkland, R., McDonald, S. L., et al. (2010). An interview-based approach to assess marine mammal and sea turtle captures in artisanal fisheries. Biol. Conserv. 143, 795–805. doi: 10.1016/j.biocon.2009.12.023
Moore, M. J., and van der Hoop, J. M. (2012). The painful side of trap and fixed net fisheries: chronic entanglement of large whales. J. Mar. Biol. 2012, 1–4. doi: 10.1155/2012/230653
Moore, S. A., Brown, G., Kobryn, H., and Strickland-Munro, J. (2017). Identifying conflict potential in a coastal and marine environment using participatory mapping. J. Environ. Manag. 197, 706–718. doi: 10.1016/j.jenvman.2016.12.026
Nakandakari, A. (2012). Determinación de áreas Prioritarias Para la Conservación de la Biodiversidad Marina del Perú. Ph.D. thesis. Lima: Universidad Peruana Cayetano Heredia.
Nelson, K., and Burnside, N. G. (2019). Identification of marine management priority areas using a GIS-based multi-criteria approach. Ocean Coast. Manag. 172, 82–92. doi: 10.1016/j.ocecoaman.2019.02.002
Noble, M. M., Harasti, D., Pittock, J., and Doran, B. (2019). Linking the social to the ecological using GIS methods in marine spatial planning and management to support resilience: a review. Mar. Policy 108:103657. doi: 10.1016/j.marpol.2019.103657
Oceanic National and Administration Atmospheric [NOAA] (2016). Oceanic national and administration atmospheric. Fed. Regist. 81:54390.
O’Donnell, K. P., Molloy, P. P., and Vincent, A. C. J. (2012). Comparing fisher interviews, logbooks, and catch landings estimates of extraction rates in a small-scale fishery. Coast. Manag. 40, 594–611. doi: 10.1080/08920753.2012.727734
Ortiz-Alvarez, C., Pajuelo, M., Grados, D., Abrego, M. E., Rebeca Barragán-Rocha, A., Barrantes, M., et al. (2020). Rapid assessments of leatherback small-scale fishery bycatch in internesting areas in the Eastern Pacific Ocean. Front. Mar. Sci. 6:813. doi: 10.3389/fmars.2019.00813
Pacheco, A., Llapapasca, M., López-Tejada, N., Silva, S., and Alcorta, B. (2021). Modeling breeding habitats of humpback whales Megaptera novaeangliae as a function of group composition. Mar. Ecol. Progr. Series 666, 203–215. doi: 10.3354/meps13686
Pennington, J. T., Mahoney, K. L., Kuwahara, V. S., Kolber, D. D., Calienes, R., and Chavez, F. P. (2006). Primary production in the eastern tropical Pacific: a review. Progr. Oceanogr. 69, 285–317. doi: 10.1016/j.pocean.2006.03.012
Pennino, M. G., Paradinas, I., Illian, J. B. Muñoz, F., Bellido, J. M. López-Quílez, A., et al. (2019). Accounting for preferential sampling in species distribution models. Ecol. Evol. 9, 653–663. doi: 10.1002/ece3.4789
Phillips, S. J., Anderson, R. P., Dudík, M., Schapire, R. E., and Blair, M. E. (2017). Opening the black box: an open-source release of Maxent. Ecography 40, 887–893. doi: 10.1111/ecog.03049
Pilcher, N. J., Adulyanukosol, K., Das, H., Davis, P., Hines, E., Kwan, D., et al. (2017). A low-cost solution for documenting distribution and abundance of endangered marine fauna and impacts from fisheries. PLoS One 12:e0190021. doi: 10.1371/journal.pone.0190021
Rajamani, L. (2013). Using community knowledge in data-deficient regions: conserving the Vulnerable dugong Dugong dugon in the Sulu Sea, Malaysia. Oryx 47, 173–176. doi: 10.1017/S0030605312000154
Rasmussen, K., Allen, J. M., Palacios, D. M., Calambokidis, J., Saborı′o, M. T., Dalla Rosa, L., et al. (2007). Southern Hemisphere humpback whales wintering off Central America: insights from water temperature into the longest mammalian migration. Biol. Lett. 3, 302–305. doi: 10.1098/rsbl.2007.0067
Reed, M. S. (2008). Stakeholder participation for environmental management: a literature review. Biol. Conserv. 141, 2417–2431. doi: 10.1016/j.biocon.2008.07.014
Reeves, R. R., McClellan, K., and Werner, T. B. (2013). Marine mammal bycatch in gillnet and other entangling net fisheries, 1990 to 2011. Endanger. Species Res. 20, 71–97. doi: 10.3354/esr00481
Estado, and Servicio Nacional de Áreas Naturales Protegidas por el Servicio Nacional de Áreas Naturales Protegidas por el Estado (n.d.). Propuesta de Reserva Nacional mar Tropical de Grau. Reserva Nacional Mar Tropical de Grau. Available online at: https://www.sernanp.gob.pe/reserva-nacional-mar-tropical-de-grau (accessed April 10, 2019).
Rocchini, D., Hortal, J., Lengyel, S., Lobo, J. M. Jimenez-Valverde, A., Ricotta, C., et al. (2011). Accounting for uncertainty when mapping species distributions: the need for maps of ignorance. Prog. Phys. Geogr. 35, 211–226. doi: 10.1177/0309133311399491
Roman, J., and McCarthy, J. J. (2010). The whale pump: marine mammals enhance primary productivity in a coastal basin. PLoS One 5:e13255. doi: 10.1371/journal.pone.0013255
Roman, J., Estes, J. A., Morissette, L., Smith, C., Costa, D., McCarthy, J., et al. (2014). Whales as marine ecosystem engineers. Front. Ecol. Environ. 12, 377–385. doi: 10.1890/130220
Saldanþa, J. (2009). The Coding Manual for Qualitative Researchers. Thousand Oaks: SAGE Publications.
Samhouri, J. F., and Levin, P. S. (2012). Linking land-and sea-based activities to risk in coastal ecosystems. Biol. Conserv. 145, 118–129.
Sawchuk, J. H., Beaudreau, A. H., Tonnes, D., and Fluharty, D. (2015). Using stakeholder engagement to inform endangered species management and improve conservation. Mar. Policy 54, 98–107. doi: 10.1016/j.marpol.2014.12.014
Scholz, A., Bonzon, K., Fujita, R., Benjamin, N., Woodling, N., Black, P., et al. (2004). Participatory socioeconomic analysis: drawing on fishermen’s knowledge for marine protected area planning in California. Mar. Policy 28, 335–349. doi: 10.1016/j.marpol.2003.09.003
Seminara, C. I., Barbosa-Filho, M. L. V., and Le Pendu, Y. (2019). Interactions between cetaceans and artisanal fishermen from Ilhéus, Bahia – Brazil. Biota Neotropica 19, 1–13. doi: 10.1590/1676-0611-bn-2019-0742
Sharp, R., Douglass, J., Wolny, S., Arkema, K., Bernhardt, J., Bierbower, W., et al. (2019). InVEST 3.7.0 User Guide. Collaborative publication by The Natural Capital Project, Stanford University, the University of Minnesota, The Nature Conservancy, and the World Wildlife Fund). Stanford: Stanford University.
Shester, G. G., and Micheli, F. (2011). Conservation challenges for small-scale fisheries: bycatch and habitat impacts of traps and gillnets. Biol. Conserv. 144, 1673–1681. doi: 10.1016/j.biocon.2011.02.023
Shillinger, G. L., Palacios, D. M., Bailey, H., Bograd, S. J., Swithenbank, A. M., Gaspar, P., et al. (2008). Persistent leatherback turtle migrations present opportunities for conservation. PLoS Biol. 6:e171. doi: 10.1371/journal.pbio.0060171
Spalding, M. D., Fox, H. E., Allen, G. R., Davidson, N., Ferdaña, Z. A., Finlayson, M., et al. (2007). Marine ecoregions of the world: a bioregionalization of coastal and shelf areas. BioScience 57, 573–583. doi: 10.1641/B570707
Spotila, J. R., Reina, R. D., Steyermark, A. C., Plotkin, P. T., and Paladino, F. V. (2000). Pacific leatherback turtles face extinction. Nature 405, 529–530. doi: 10.1038/35014729
Stephenson, F., Goetz, K., Sharp, B. R., Mouton, T. L., Beets, F. L., Roberts, J., et al. (2020). Modelling the spatial distribution of cetaceans in New Zealand waters. Divers. Distrib. 26, 495–516. doi: 10.1111/ddi.13035
Strickland-Munro, J., Kobryn, H., Brown, G., and Moore, S. A. (2016). Marine spatial planning for the future: using Public Participation GIS (PPGIS) to inform the human dimension for large marine parks. Mar. Policy 73, 15–26. doi: 10.1016/j.marpol.2016.07.011
Szostek, C. L., Murray, L. G., Bell, E., and Kaiser, M. J. (2017). Filling the gap: using fishers’ knowledge to map the extent and intensity of fishing activity. Mar. Environ. Res. 129, 329–346. doi: 10.1016/j.marenvres.2017.06.012
Thiault, L., Collin, A., Chlous, F., Gelcich, S., and Claudet, J. (2017). Combining participatory and socioeconomic approaches to map fishing effort in smallscale fisheries. PLoS One 12:e0176862. doi: 10.1371/journal.pone.0176862
Tobeña, M., Prieto, R., Machete, M., and Silva, M. A. (2016). Modeling the potential distribution and richness of cetaceans in the Azores from fisheries observer program data. Front. Mar. Sci. 3:202. doi: 10.3389/fmars.2016.00202
Twichell, J., Pollnac, R., and Christie, P. (2018). Lessons from Philippines MPA management: social ecological interactions, participation, and MPA performance. Environ. Manag. 61, 916–927. doi: 10.1007/s00267-018-1020-y
van der Hoop, J., Corkeron, P., and Moore, M. (2017). Entanglement is a costly life-history stage in large whales. Ecol. Evol. 7, 92–106. doi: 10.1002/ece3.2615
van Strien, A. J. van Swaay, C. A., and Termaat, T. (2013). Opportunistic citizen science data of animal species produce reliable estimates of distribution trends if analysed with occupancy models. J. Appl. Ecol. 50, 1450–1458. doi: 10.1111/1365-2664.12158
Van Waerebeek, K., Alfaro-Shigueto, J., Montes, D., Onton, K., Santillan, L., Van Bressem, M. F., et al. (2002). Fisheries Related Mortality of Small Cetaceans in Neritic Waters of Peru in 1999–2001. International Whaling Commission, Scientific Committee Document SC/54/SM10. Cambridge: International Whaling Commission.
Van Waerebeek, K., Van Bressem, M. F., Félix, F., Alfaro-Shigueto, J., García-Godos, A., Chávez-Lisambart, L., et al. (1997). Mortality of dolphins and porpoises in coastal fisheries off Peru and southern Ecuador in 1994. Biol. Conserv. 81, 43–49. doi: 10.1016/S0006-3207(96)00152-8
Verutes, G., Andrew, F., Johnson Marjolaine, C., Ponnampalam, L. S., Peter, C., Vu, L., et al. (2020). Using GIS and stakeholder involvement to innovate marine mammal bycatch risk assessment in data-limited fisheries. PLoS One 15:e0237835. doi: 10.1371/journal.pone.0237835
Visalli, M. E., Best, B. D., Cabral, R. B., Cheung, W. W. L., Clark, N. A., Garilao, C., et al. (2020). Data-driven approach for highlighting priority areas for protection in marine areas beyond national jurisdiction. Mar. Pol. 122:103927. doi: 10.1016/j.marpol.2020.103927
Wallace, B. P., Tiwari, M., and Girondot, M. (2013). Dermochelys coriacea (East Pacific Ocean subpopulation). IUCN Red List Threatened Species 2013:e.T46967807A46967809.
Williams, R., Burgess, M. G., Ashe, E., Gaines, S. D., and Reeves, R. R. (2016). U.S. seafood import restriction presents opportunity and risk. Science 354, 1372–1374. doi: 10.1126/science.aai8222
Worm, B., Barbier, E. B., Beaumont, N., Duffy, J. E., Folke, C., Halpern, B. S., et al. (2006). Impacts of biodiversity loss on ocean ecosystem services. Science 314, 787–790. doi: 10.1126/science.1132294
Yang, D., and Pomeroy, R. (2017). The impact of community-based fisheries management (CBFM) on equity and sustainability of small-scale coastal fisheries in the Philippines. Mar. Policy 86, 173–181. doi: 10.1016/j.marpol.2017.09.027
Keywords: bycatch, small-scale fisheries, participatory GIS (PGIS), bycatch risk assessment, ByRA, marine megafauna bycatch, risk modeling
Citation: Costanza AB, Guidino C, Mangel JC, Alfaro-Shigueto J, Verutes G, Caillat M, Samanta A and Hines E (2021) Participatory Risk Assessment of Humpback Whale (Megaptera novaeangliae) and Leatherback Turtle (Dermochelys coriacea) Bycatch in Northern Peru. Front. Mar. Sci. 8:776965. doi: 10.3389/fmars.2021.776965
Received: 14 September 2021; Accepted: 09 November 2021;
Published: 13 December 2021.
Edited by:
Andre Eric Punt, University of Washington, United StatesReviewed by:
Scott Robert Benson, National Marine Fisheries Service (NOAA), United StatesTara Sayuri Whitty, Independent Researcher, United States
Copyright © 2021 Costanza, Guidino, Mangel, Alfaro-Shigueto, Verutes, Caillat, Samanta and Hines. This is an open-access article distributed under the terms of the Creative Commons Attribution License (CC BY). The use, distribution or reproduction in other forums is permitted, provided the original author(s) and the copyright owner(s) are credited and that the original publication in this journal is cited, in accordance with accepted academic practice. No use, distribution or reproduction is permitted which does not comply with these terms.
*Correspondence: Anna B. Costanza, YW5uYWJjb3N0YW56YUBnbWFpbC5jb20=