 Lisa M. Erdle
 Dorsa Nouri Parto
 David Sweetnam
 Chelsea M. Rochman1
- 1Department of Ecology and Evolutionary Biology, University of Toronto, Toronto, ON, Canada
- 2The 5 Gyres Institute, Santa Monica, CA, United States
- 3Georgian Bay Forever, Toronto, ON, Canada
Washing clothing is a known pathway for microfibers to reach the environment. Previous research has investigated microfiber capture close to the source (i.e., the washing machine), and demonstrated washing machine filters as a potential mitigation strategy. Widespread deployment into homes may be an effective solution to prevent microfiber emissions. Here, we investigated the effectiveness of washing machine filters at the level of a community. We installed filters in 97 homes in a small town, representing approximately 10% of households connected to the municipal wastewater treatment plant (WWTP). We evaluated treated final effluent and found a significant reduction in microfibers after filter installation. Furthermore, lint samples from filters revealed an average weekly lint capture of 6.4 g, equivalent to 179,200–2,707,200 microfibers. This research shows that microfiber filters on washing machines are effective at scale, and this result can help inform policy decisions to reduce microfiber emissions from laundering textiles.
Introduction
Researchers estimate that 4.8 million tons of synthetic microfibers (e.g., polyester and nylon) have entered water bodies and terrestrial environments since 1950 (Gavigan et al., 2020). If we include natural, but anthropogenically modified, microfibers (e.g., cotton and wool) and semi-synthetic microfibers (e.g., rayon) in this estimate, microfiber emissions to the environment would likely be far greater. Consequently, researchers report a diversity of synthetic, semi-synthetic, and natural microfibers (anthropogenic fibers < 5 mm in size) in habitats and wildlife around the world (Gago et al., 2018; Nelms et al., 2018; Sanchez-Vidal et al., 2018). Once microfibers are released to the environment, they become exceedingly difficult to remove. Thus, researchers have recently focused their attention on understanding ways in which microfibers shed, sources and pathways to the environment, and technologies to capture microfibers at their emission source.
There is clear evidence that laundering textiles is one major contributor of microfibers to the environment (Browne et al., 2011; Carr, 2017; Gavigan et al., 2020; Kapp and Miller, 2020). During laundering, microfibers shed from clothing into wash water. Researchers estimate an average household load of laundry can shed thousands to millions of microfibers in a single wash (Napper and Thompson, 2016; De Falco et al., 2018). Several factors have been found to influence the amount of shedding. First, the age of garments can impact microfiber shedding. Several studies found that new garments, both synthetic and natural, release more microfibers than old garments (Napper and Thompson, 2016; Pirc et al., 2016; Sillanpää and Sainio, 2017; Athey et al., 2020; Cesa et al., 2020). However, other studies have observed no effect of age (Hernandez et al., 2017), or the opposite trend whereby aged garments shed more than new (Hartline et al., 2016). Second, natural textiles shed more than synthetic textiles, which has been attributed to the staple fibers in natural materials, which shed more easily than the filament yarn in synthetic material (Lant et al., 2020). Third, the type of washing machine matters; researchers have reported more microfibers in effluent from top loading machines than in front loaders (Hartline et al., 2016). Moreover, hot cycles have also been found to lead to more shedding of fibers than cold (De Falco et al., 2020; Lant et al., 2020). Other factors, such as detergent type and fabric softener appear to have variable effects, either leading to increased microfiber shedding, decreased microfiber shedding, or no effects (Napper and Thompson, 2016; Pirc et al., 2016; Almroth et al., 2018; De Falco et al., 2018; Cesa et al., 2020). Despite this, even if a consumer follows all recommended care instructions, microfibers will not be eliminated from washing machine effluent, and microfibers will still enter wastewater streams.
Microfibers can enter the environment directly from washing machine effluent via untreated wastewater, and indirectly through treated wastewater and biosolid application in terrestrial environments. Traditional secondary and tertiary treatment wastewater treatment plants (WWTPs) are effective at removing microfibers (and other microplastics) from final effluent, removing up to 98% of particles (Carr et al., 2016; Murphy et al., 2016; Gies et al., 2018; Conley et al., 2019). New filtration technologies can remove an additional 98–99% from what is left after secondary treatment using methods such as membrane filtration (0.4 μm membranes) (Lares et al., 2018) and biologically active filters (Talvitie et al., 2017a). Despite the high removal efficiencies in final effluent, microplastics and microfibers are still in final effluent, and although the number has been largely reduced, discharge rates can be significant (Talvitie et al., 2017a,b; Ziajahromi et al., 2017). For example, if 99% of microparticles are captured in treatment, the remaining 1% can still amount to millions of microplastics and microfibers per day, which are then directly released to aquatic environments (Murphy et al., 2016). Additionally, since microfibers removed from the final effluent are captured in the sludge, microfibers can enter the environment through the terrestrial application of biosolids on agricultural land (Zubris and Richards, 2005; Crossman et al., 2020). As such, upstream mitigation strategies closer to the source may be more effective as an intervention point to capture microfibers.
Previous laboratory research has demonstrated that washing machine filters are effective at capturing microfibers from domestic laundry before they are released into wastewater. A range of technologies are now available, and lab studies have evaluated the effectiveness of after-market devices and filters (McIlwraith et al., 2019; Napper et al., 2020). Research shows that washing machine filters can have an average microfiber capture up to 78–80% by weight (McIlwraith et al., 2019; Napper et al., 2020). By count, McIlwraith et al. (2019) found that filters captured 87% of microfibers from the wash. These studies also highlight that microfiber capture can vary based on the type of microfiber-capturing device, garments washed, and the filter mesh size (McIlwraith et al., 2019; Napper et al., 2020). To take filter mesh size as an example, Napper et al. (2020) did not observe significant reductions in microfibers when testing filters with a pore size greater than 175 μm, although significant microfiber reductions have been observed for filters with a pore size less than or equal to 150 μm (McIlwraith et al., 2019; Napper et al., 2020). Given that washing machines are a source of microfibers to the environment, and that filters are effective when tested in the lab, it is worth investigating whether this technology can be scaled up and implemented as an effective mitigation strategy.
For any proposed intervention, a pilot project can provide valuable information about the effectiveness of a solution. Microfiber filters are demonstrated to be effective in the laboratory (McIlwraith et al., 2019; Napper et al., 2020). Still, it is unknown how that effectiveness translates into measurable results when scaled up to a community, i.e., how much microfiber pollution can be diverted and whether a measurable difference can be observed at the WWTP scale. Here, we deployed filters into the homes of nearly 100 participants. We quantified microfiber capture, and measured microfibers and microplastics in treated final effluent at the municipal WWTP before and after deployment. Results from this study can inform whether filters on washing machines are an effective solution to prevent one source of microfiber emissions.
Materials and Methods
Participant Recruitment and Filter Installation
A total of 97 households in Parry Sound, Ontario were included in this study. Each household added an after-market washing machine filter to their washing machines. Parry Sound is a great site for a case study because it has approximately 1,050 households connected to the municipal WWTP (O’Donnell, personal communication, September 27, 2019), which means these households represent approximately 10% of those connected to the plant. During recruitment, participation requirements were the following: (1) connection to the municipal WWTP (i.e., no septic tank), (2) sufficient space to install the filter, and (3) a commitment to collect the lint captured in their filter for a 2-year period.
The device tested was the Filtrol 160 (Wexco Environmental, United States), which contains a 100 μm polyester mesh and has a microfiber capture rate of 89% of microfibers shed from laundry into wash water by weight (Filtrol, 2021). This microfiber capture rate is greater than those reported for the Lint-LUV-R filter (McIlwraith et al., 2019; Napper et al., 2020). We chose the Filtrol160 for two main reasons: (1) the filter is easy to clean and (2) the filter contains a bypass, meaning if the filter is full the water will bypass the filter and prevent flooding. A downside of this bypass feature is that in the case of a bypass, the filter would no longer capture microfibers, but this would only occur when the filter is completely full, and we had no reports of bypasses in our experiment. The Filtrol160 is installed externally on the washing machine effluent pipe and collects microfibers and microplastics prior to their release to the sanitary sewer system. The filter units were purchased and installed in 2019. In June and July 2019, filters were installed by a professional plumber, wherein we also recorded each washing machine type (front loader or top loader). Three participants opted to self-install their filters. All filter units and instillation costs were provided to participants free of change. Participants officially “turned on” their filters by connecting the filter to their washing machine and installing the filter mesh on August 1st, 2019.
Analysis of Household Lint Samples
Measuring Lint Capture by Mass
Lint samples were collected by each household to determine the mass of material diverted and estimated count of diverted microfibers. Participants were instructed to remove all material captured in the Filtrol 160 filter bag every 1–2 weeks using a metal spoon, and to store the material in a pre-labeled Ziplock bag. Samples from each household were stored in home freezers, then were collected and sent to the laboratory every 3–6 months for further analysis.
In the laboratory, lint samples corresponding to different household numbers and collection periods were weighed in sample bags. The wet weights for lint samples were determined by recording the weight for each full bag and subtracting the weight of the empty bag. To determine the weekly lint capture, we divided the weight of lint in each collection period by the number of weeks in that collection period. To maintain a safe working environment during the COVID-19 outbreak, the third and fourth batch of lint samples remained sealed in the bags, and an average bag weight was used for subtraction.
Estimating Lint Capture by Count
Additionally, 5 mg wet weight sub-samples were taken from some households to estimate microfiber counts. To represent different households, we randomly selected 10 different households; five households from the first collection and five households from the second collection. For each of the 10 households (n = 10), three 5 mg sub-samples were taken to determine a representative count per replicate. A solution of 10% Alcojet and RO (reverse osmosis) water was used to separate the individual particles within each sub-sample. In the first collection of samples, the number of microfibers in each subsample were counted under the microscope and categorized by particle color and shape. In the second collection of samples, we also quantified the number of suspected anthropogenic fragments. With this information, we estimated a count of microfibers per mg of sample. In addition, the second collection of samples provided an estimate of the count of other anthropogenic particles per mg of sample.
Analysis of Wastewater Treatment Plant Final Effluent
The final effluent of the Parry Sound WWTP was collected in four sample periods to determine whether the addition of filters affected the number of microfibers in final effluent. We sampled twice before filter installation in March and July 2019, and twice after filter installation in August 2019 and March 2020. Sampling was performed at the UV-treatment stage. Three 24-h composite samples (approx. 3.6 L volume) were collected on 3 consecutive days at each sampling event using a pre-programmed ISCO 3710 sampler, set to collect 150 mL per hour. We selected this method since composite sampling is a common technique used in sampling microfibers, microplastics, and persistent organic pollutants (POPs) (Reynolds and Ahmad, 1997; Yargeau et al., 2014; Talvitie et al., 2017b). One field blank was sampled during each sample period to account for any procedural contamination that may occur during sampling and/or processing. Field blanks were taken using identical methods to the samples but contained reverse osmosis (RO) water from the laboratory. They were also analyzed using the same methods as the samples, and thus also served as a laboratory blank. All sample bottles were 4 L amber glass jugs, which were pre-washed with soap and water, then triple rinsed with RO water to remove any background contamination prior to sampling. Samples were taken back to the laboratory for processing, enumeration, and chemical identification.
In the laboratory, the samples were processed using a stack of stainless steel sieves. Tyler sieves with mesh size fractions of 1 mm, 500, 355, 125, and 45 μm, were stacked in decreasing mesh size. The sieve stack was placed on top of a collecting bucket. Prior to use, the sieves and the bucket were washed with soap and rinsed with tap and RO water three times. In order to prevent contamination, a natural sponge was used to wash the sieves, white cotton lab coats were worn, and the sieves were covered with clean aluminum foil. Additionally, the laboratory contained a HEPA filter, and surfaces were wiped down daily to prevent contamination from dust. Prior to processing, the exterior of the sample bottles were washed with soap and the bottles were placed in the clean cabinet. Each sample was extracted by pouring it through the sieve stack. The volume of the sieved sample was measured using a large graduated cylinder. Particles collected in each sieve were rinsed into separate clean glass jars using RO water, which were subsequently analyzed under a Leica M80 stereo microscope. Extracts from the smallest sieve size fraction (45 μm) underwent an additional filtration step through a 10 μm polycarbonate filter (45 mm diameter) so they could be counted on a filter. The remaining size fractions were wet sorted in clean glass petri dishes.
Using clean tweezers, particles were removed and placed on double-sided tape for length measurements and Raman Spectroscopy. All the particles were counted in covered petri dishes to prevent contamination and the lids were only removed to extract a particle. The same extraction and analysis methods were used for each field blank, and the particles detected were used for blank subtraction (see below). Particles in the size fraction between 45 and 125 μm were counted but were not picked due to their small size. Thus, all particles that were measured and used for chemical identification had a lower size limit of 125 μm.
For blank subtraction, we subtracted the number of particles within each color and morphology in each field blank from each sample taken from the same sample period. Since particles in the 45–125 μm size fraction underwent additional filtration, particles were blank subtracted by size fractions>125 μm and 45–125 μm. After blank correction, particle counts were divided by the volume in each sample to obtain a blank-corrected concentration of particles per liter of wastewater effluent.
Particles mounted on double-sided tape were photographed using an Olympus SZ61 microscope with a camera attachment. ToupView Software (OMAX) was calibrated, and the trace function was used to measure particle length. A subset of particles was selected for chemical identification using Raman spectroscopy. For each color and morphology combination, 20% of particles were analyzed. When 20% was not a whole number, we would round up to the nearest whole number. The instrument and software used was a Xplora Plus (Horiba Scientific) with LabSpec 6 software.
Data Analysis
The differences in lint captured per week were compared across the four collection periods using a Kruskal-Wallis test (n = 51–73 households per period; α = 0.05). To compare the average lint captured per week in front loading (n = 34) vs. top loading (n = 42) washing machines, we ran a Welch’s t-test (α = 0.05), a two-sample t-test for groups with unequal variances.
To determine whether there was a significant difference in microfiber concentrations in WWTP effluent across seasons and before vs. after installing the filters, a two-factor analysis of variance (ANOVA) was used (n = 3; α = 0.05). The factor “season” had two levels (winter and summer), and the factor “filter” had two levels (before and after). Normality and homogeneity of variance were confirmed using Shapiro-Wilks and Levene tests (α = 0.05). A post hoc Tukey test was conducted when a factor was significant. All analyses were conducted in R version 3.6.3.
Results
Household Microfiber Capture
We aimed to install 100 Filtrol 160 units. In total, we were only able to recruit 97 households that met the participation requirements in this study. Of these 97 households, we got information about the washing machine types from 82 of them; there was a total of 38 front-loader and 44 top-loader machines. Across all households, we quantified the amount of total captured household lint (i.e., microfibers, microplastics, dust, hair, etc.). Within each collection period, we received samples from 53 to 75% of all households. Across all collection periods, we received lint samples from 63% of households. Participation declined in the second collection compared to the first, followed by a slight increase in the third and fourth collection periods (Table 1).
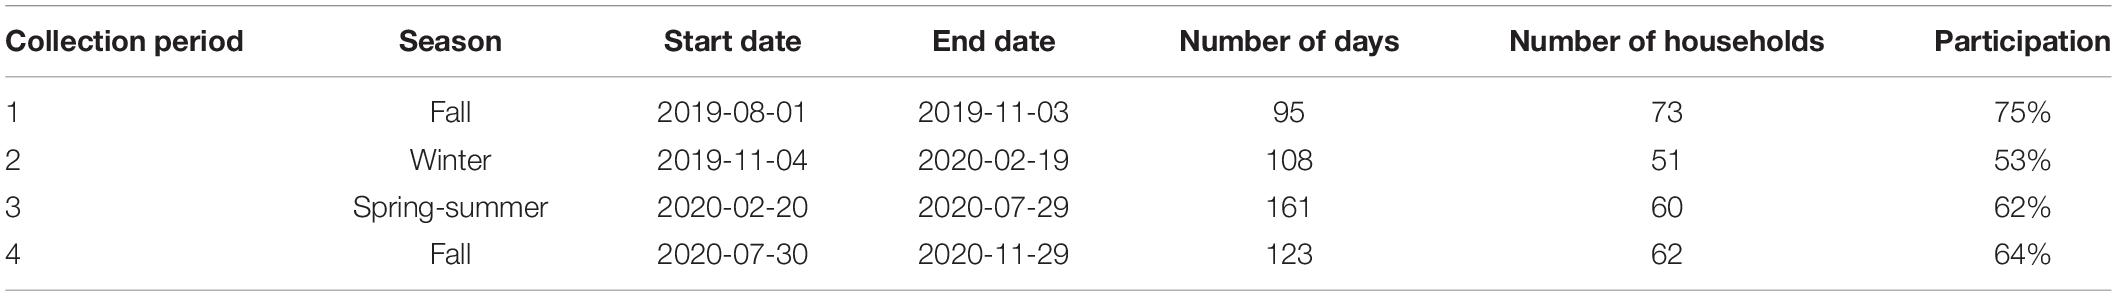
Table 1. Collection period dates and the participation in household lint collection over the course of our study.
We recorded a total lint mass of 22,824 g (wet weight). Lint mass varied between households and ranged from 0.1 to 32.5 g/week, with an overall average lint mass of 6.4 ± 6.0 g/week (mean ± SD). The amount of lint captured was generally consistent across the four collection periods, suggesting that season does not have an effect on total lint (Figure 1). The average household lint captured for each collection was 6.7 ± 5.7 g/week (mean ± SD) for the first collection, 5.9 ± 5.1 for the second, 6.2 ± 6.6 for the third, and 5.7 ± 5.2 for the fourth. Although our aim was to collect samples at regular intervals, the third collection was at a peak of the COVID-19 pandemic in Ontario, and we chose to delay the pick-up time. We did not observe significant differences in lint capture per week between any of the collection periods (p = 0.48), which were fall 2019, winter 2019–2020, spring-summer 2020, and fall 2020.
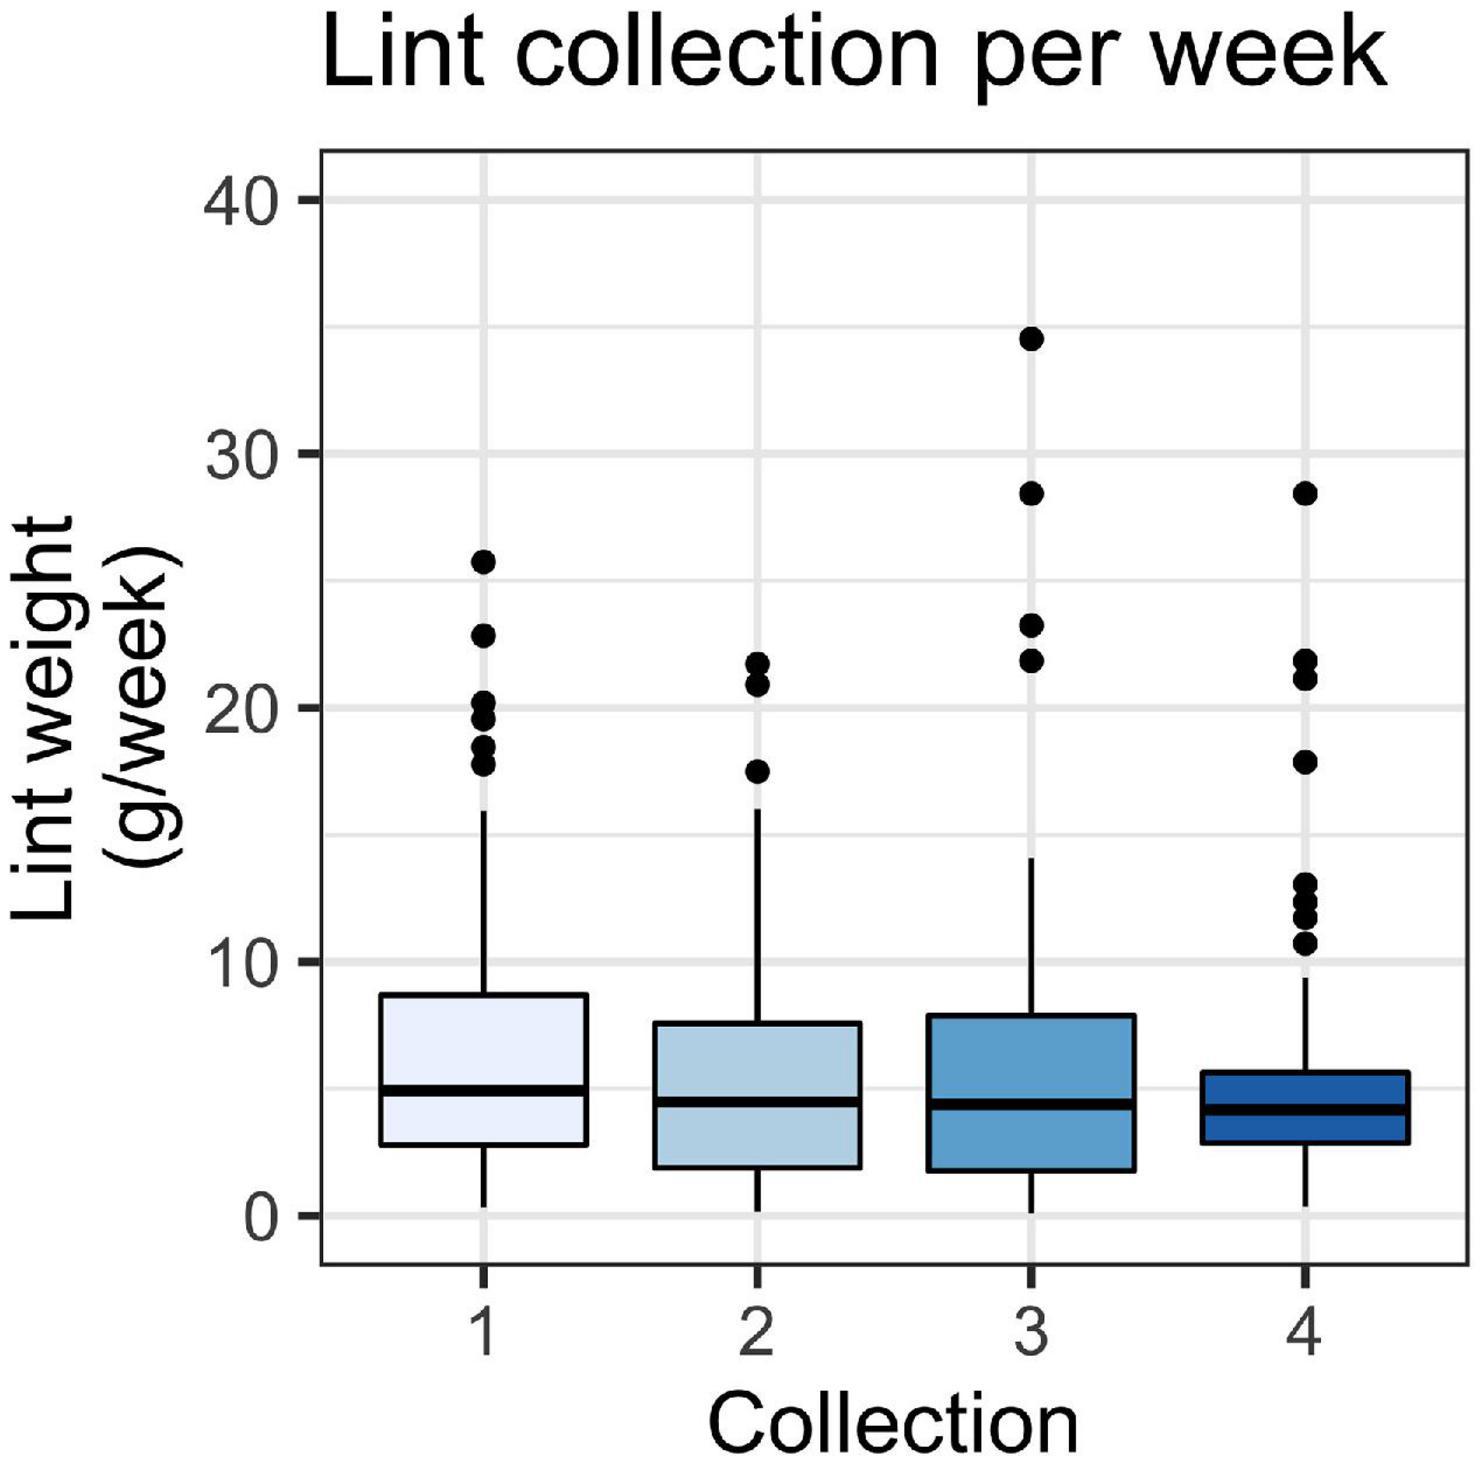
Figure 1. Weight of lint in g/week for lint captured in household filters across four collection periods (n1 = 73, n2 = 51, n3 = 60, and n4 = 62). A Kruskal-Wallis test showed no significant difference between collection periods (p > 0.05). Boxes represent 25th–75th percentiles; dark lines, medians; whiskers, 1.5 × the interquartile range (IQR); points, values outside 1.5 × the IQR.
There was a significant relationship between washing machine type and the amount of lint captured (Figure 2). Top loader washing machines yielded more lint than front loaders (p < 0.01). The average household lint capture was 4.7 ± 3.7 g/week (mean ± SD) for front loaders and 7.2 ± 5.5 for top loaders.
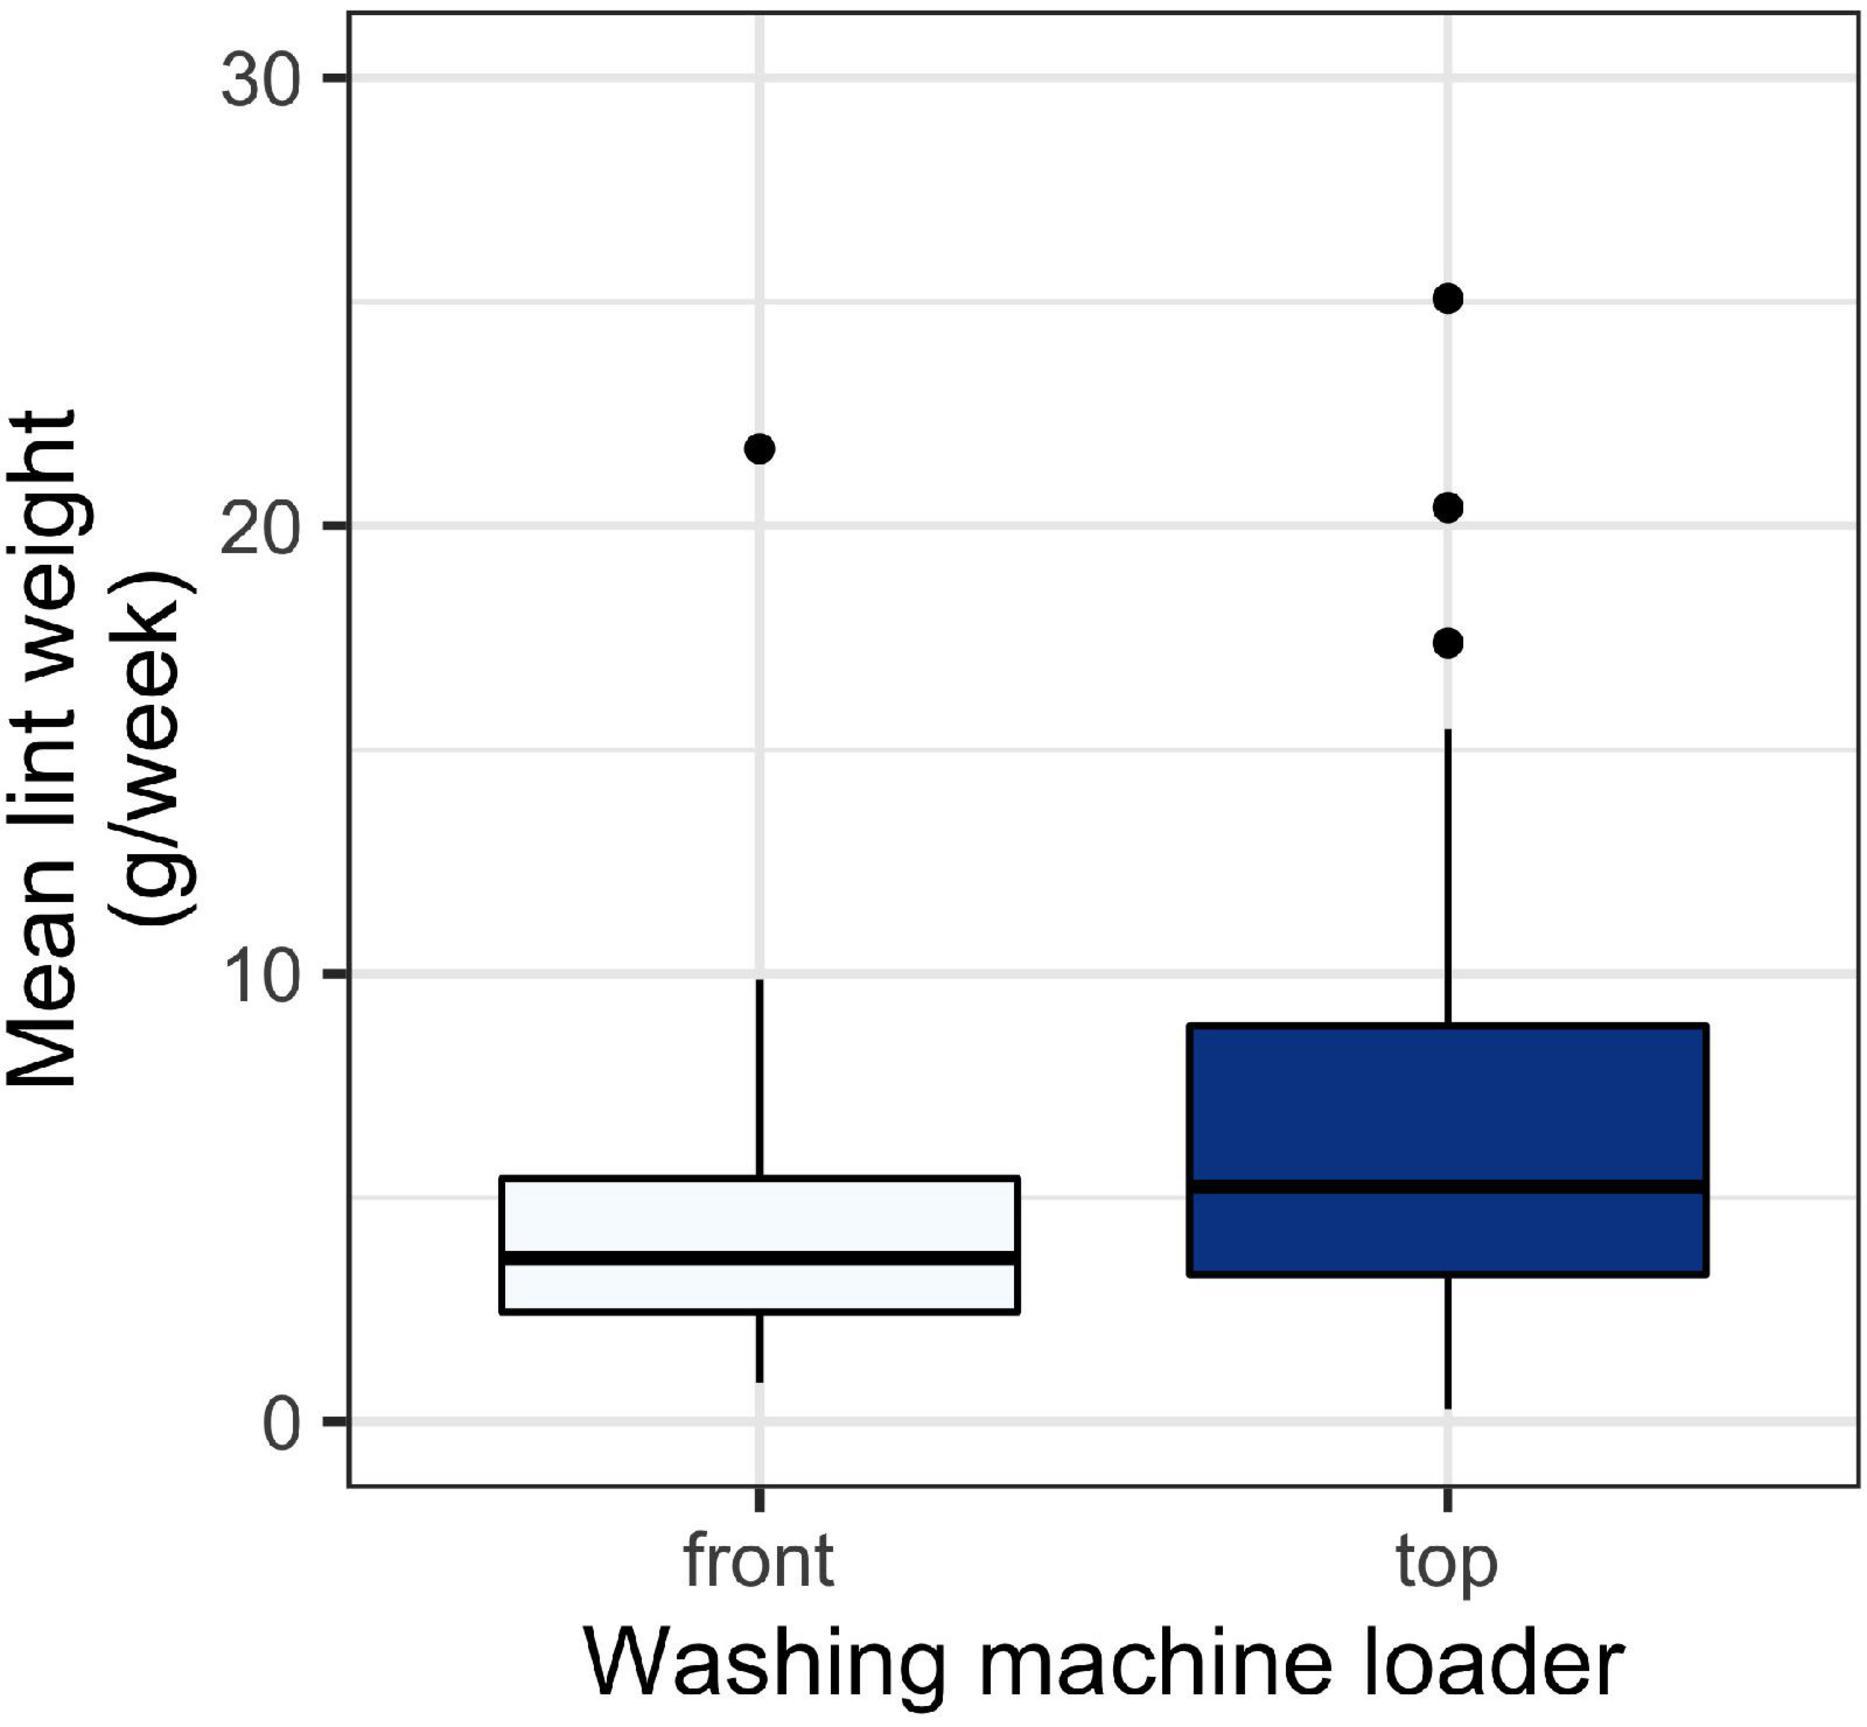
Figure 2. Weight of lint in g/week for lint captured in household filters across different washing machine types. A t-test test revealed a significant difference between collection periods (p < 0.05). Boxes represent 25th–75th percentiles; dark lines, medians; whiskers, 1.5 × the interquartile range (IQR); points, values outside 1.5 × the IQR.
Since lint is a combination of microfibers and other materials, we also aimed to determine the microfiber count per known mass of sample. The average microfiber count per mg of lint analyzed was 45.5 ± 21.4 microfibers per mg (mean ± SD; n = 10). While there was relatively low variability in microfiber count within a household (suggesting the validity in our subsampling method), we observed substantial variability between households (Figure 3). The minimum microfiber count was 28 microfibers per mg, and the maximum was 423 microfibers per mg. Households 1–5, which were from the first collection, showed less variability compared to households 6–10 from the second collection. Generally, microfibers were the most common particle type found within lint.
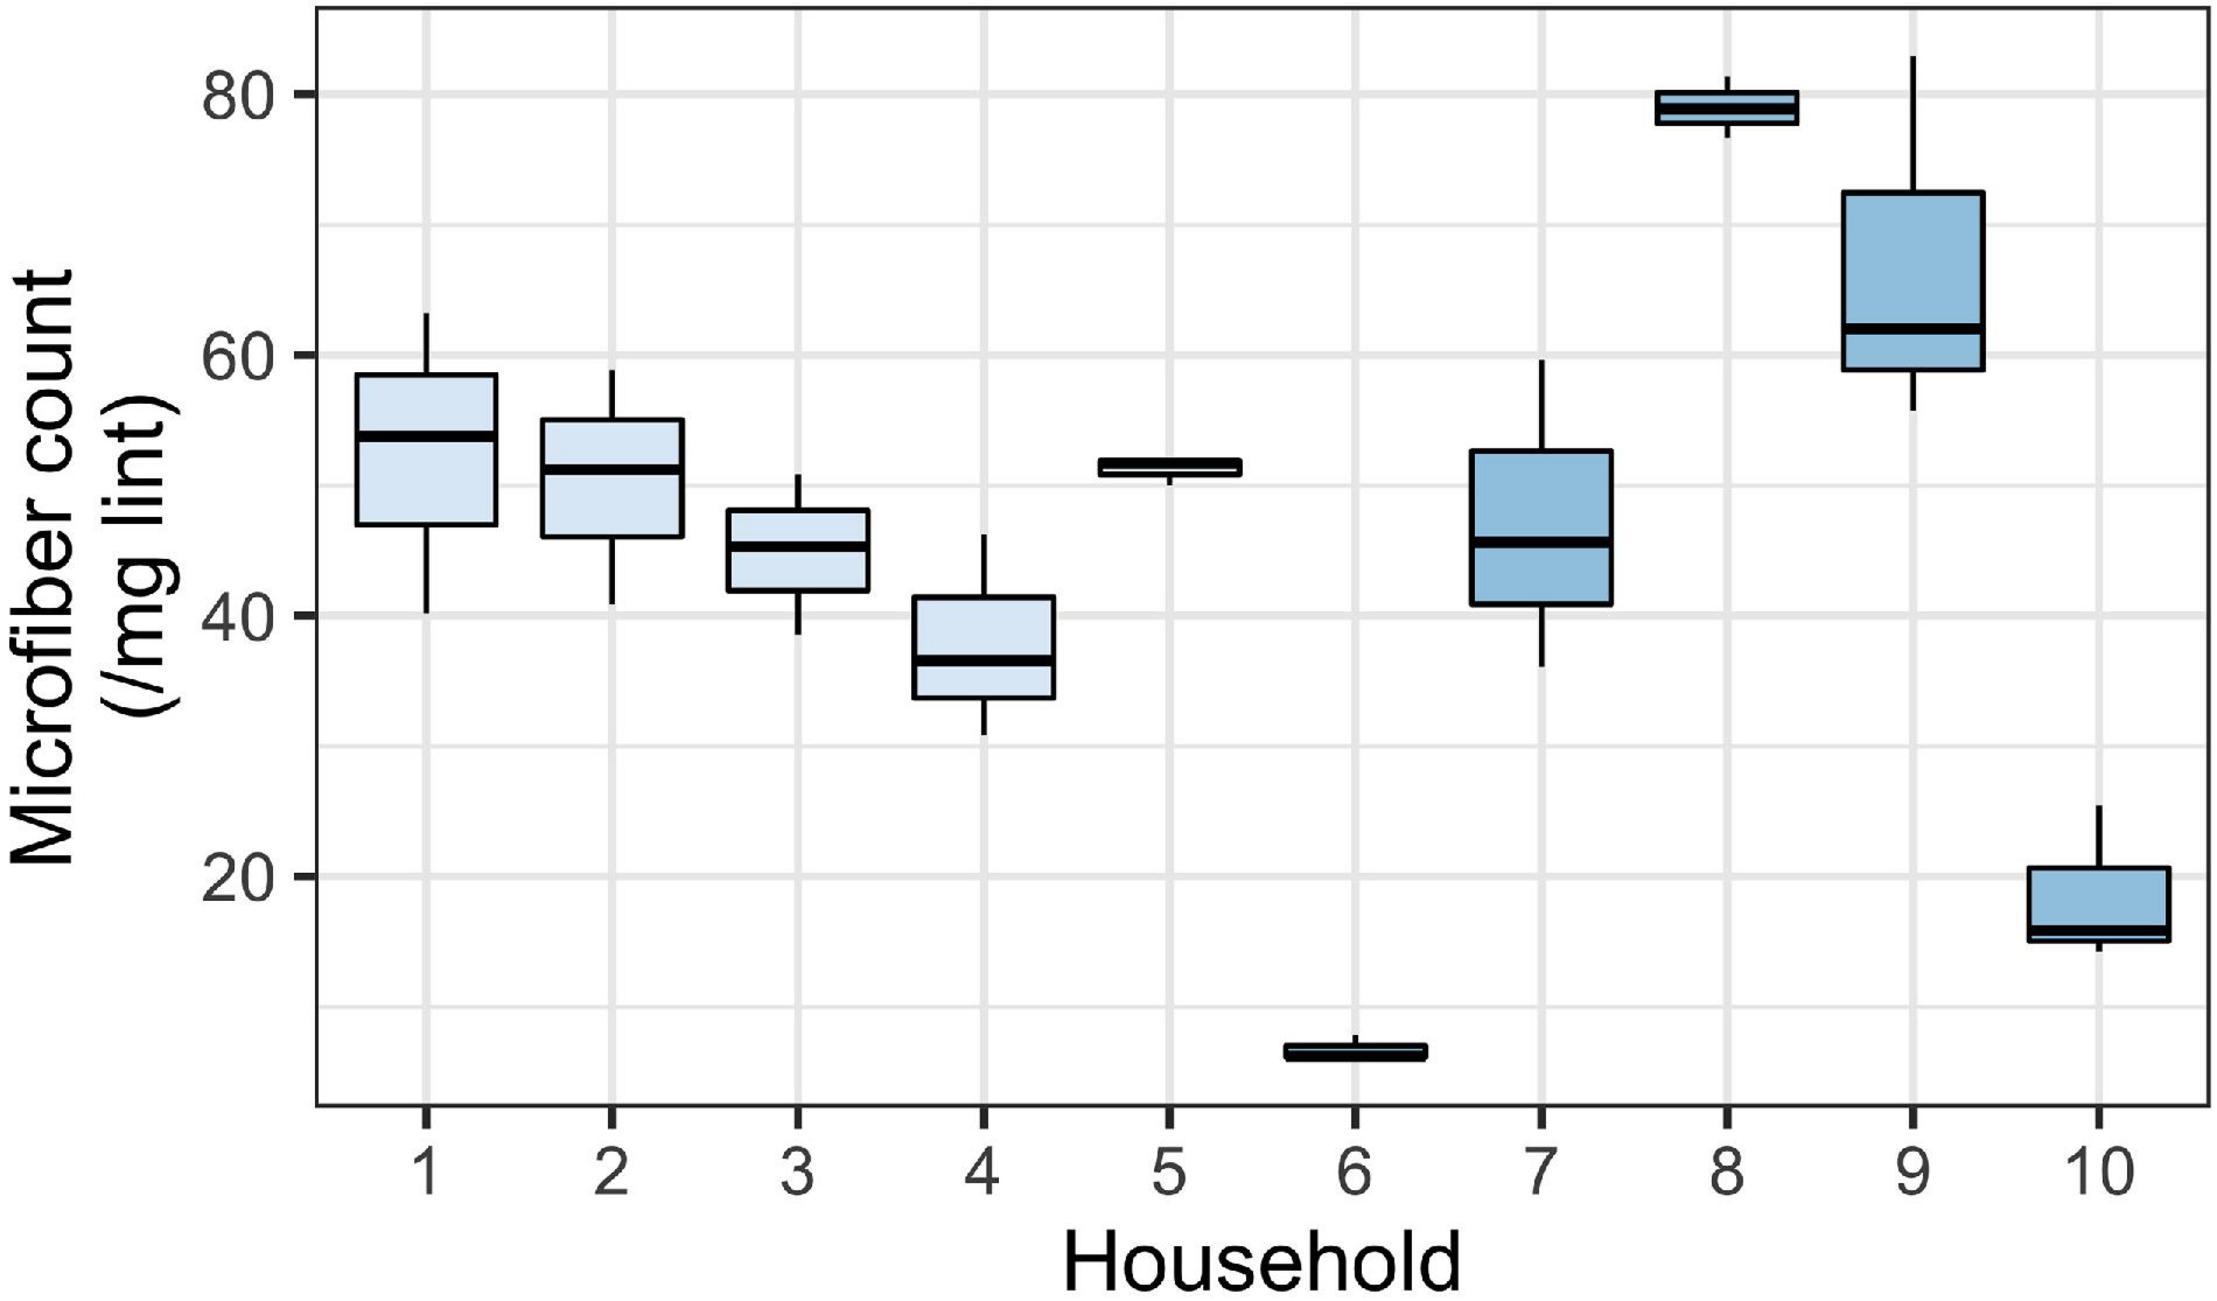
Figure 3. Mean number of microfibers per mg of household lint (across 10 replicate households). Boxes show the distribution of microfibers across the three subsamples per household sample. Household 1–5 were sampled during the first collection and household 6–10 were sampled during the second collection. The values plotted here are microfibers only (i.e., fragments and foam not included in these counts). Boxes represent 25th–75th percentiles; dark lines, medians; whiskers, 1.5 × the interquartile range (IQR).
From households 6–10 we also performed an additional count of other anthropogenic particles per mg of sample (e.g., microplastic fragments). Other particle types were not uncommon. Among anthropogenic particles in sample, one household had 18% fragments and foam (household #6), and another had 53% fragments (household #10). Glitter, sequins, and foam were the most common non-fiber anthropogenic particle in lint sub-samples. The average count for non-fiber anthropogenic particles was 11.9 ± 11.2 (mean ± SD) per mg lint (n = 5 households; 3 subsamples were taken from each replicate). The minimum subsample had 0 per mg, and the maximum 41 per mg.
Wastewater Treatment Plant Final Effluent
The effluent samples collected before installing filters contained an average of 4.6 ± 1.6 microparticles per L (mean ± SD) of treated wastewater (Figure 4). This was significantly greater than the concentration of microparticles in samples collected after installing filters, which contained 1.9 ± 0.7 microfibers per L. A 2-factor ANOVA showed a significant difference among effluent samples collected before and after installing filters (p < 0.01), and no significant difference amongst seasons (p = 0.8) or the interaction (p = 0.4).
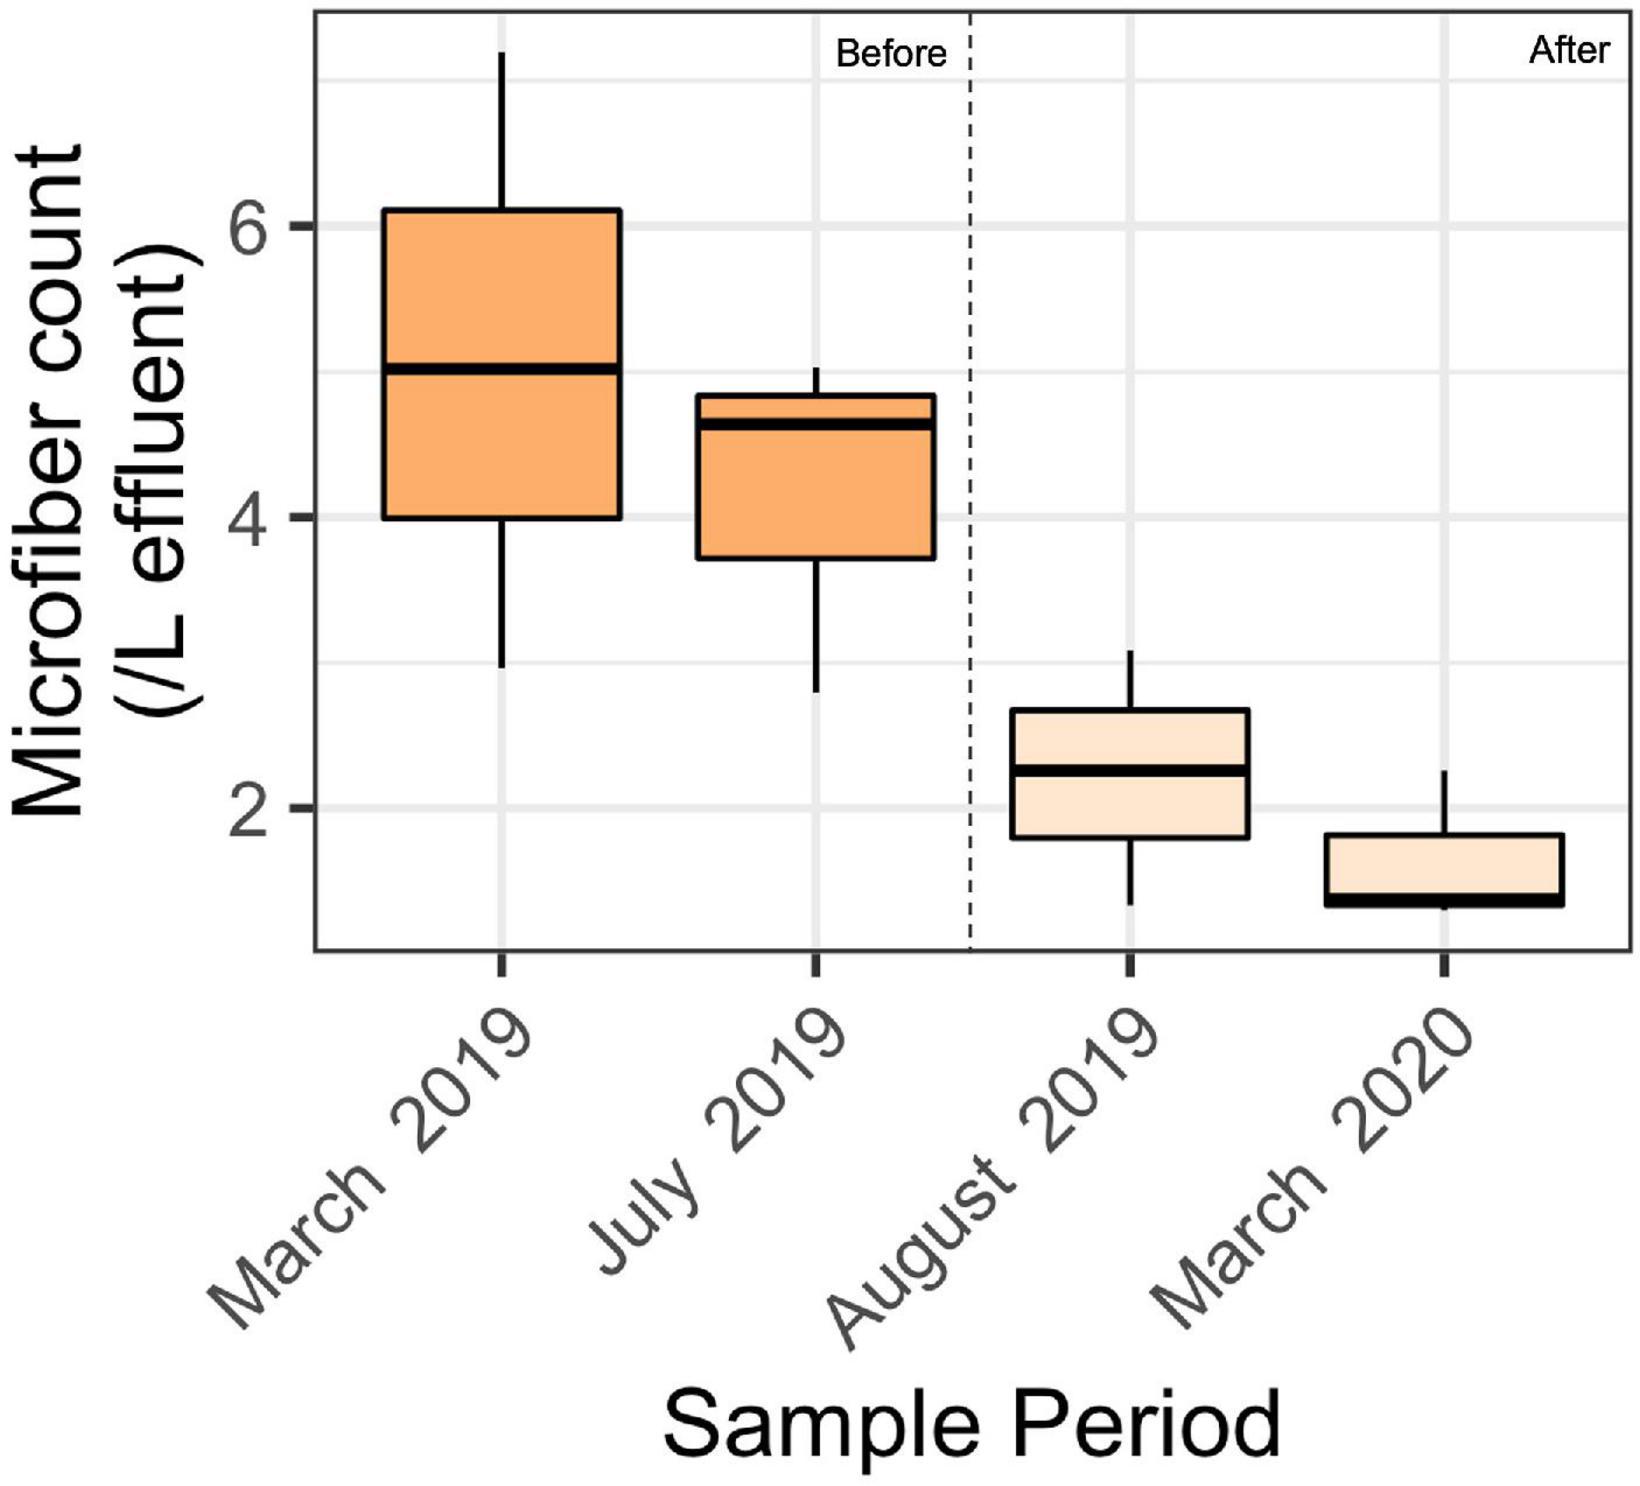
Figure 4. Boxplot showing microfiber count for each sample period before the filter installation (March 2019 and July 2019) and after filter installation (August 2019 and March 2020). Results presented here are after blank subtractions. A 2-factor ANOVA showed a significant difference before and after filter installation (*p < 0.01), and no significant difference amongst seasons (p = 0.8) or the filter-season interaction (p = 0.4). The middle black bar represents the median, and each box represents the first to third quantile of the data. The whiskers represent the minimum and the maximum number of fibers/L of the sample.
Except for two fragments, all the particles in the WWTP samples were microfibers. The most common colors were blue (32%), clear (29%), and black (22%) (Figure 5A). On average, the microfiber particle lengths (size fraction > 125 μm) were 1.77 ± 0.94 mm in March 2019, 2.38 ± 1.67 mm in July 2019, 2.16 ± 2.04 mm in August 2019 and 1.34 ± 0.68 mm in March 2020. Most microfibers were anthropogenic cellulose (52%), informed by the presence of a dye and a cellulosic chemical identification match (e.g., cotton) with Raman spectroscopy (Figure 5B). If a microfiber was undyed and had a cellulosic chemical signature, it could not be determined whether the particle was anthropogenic and was thus classified as cellulosic. In total, 30% of all particles fell into this unknown cellulosic category, which may be natural or anthropogenic. Dyed black microfibers were prone to burning, and were thus categorized as anthropogenic unknown (8.7% of all particles). 8.7% of particles were confirmed synthetic—all of which were Acrylic.
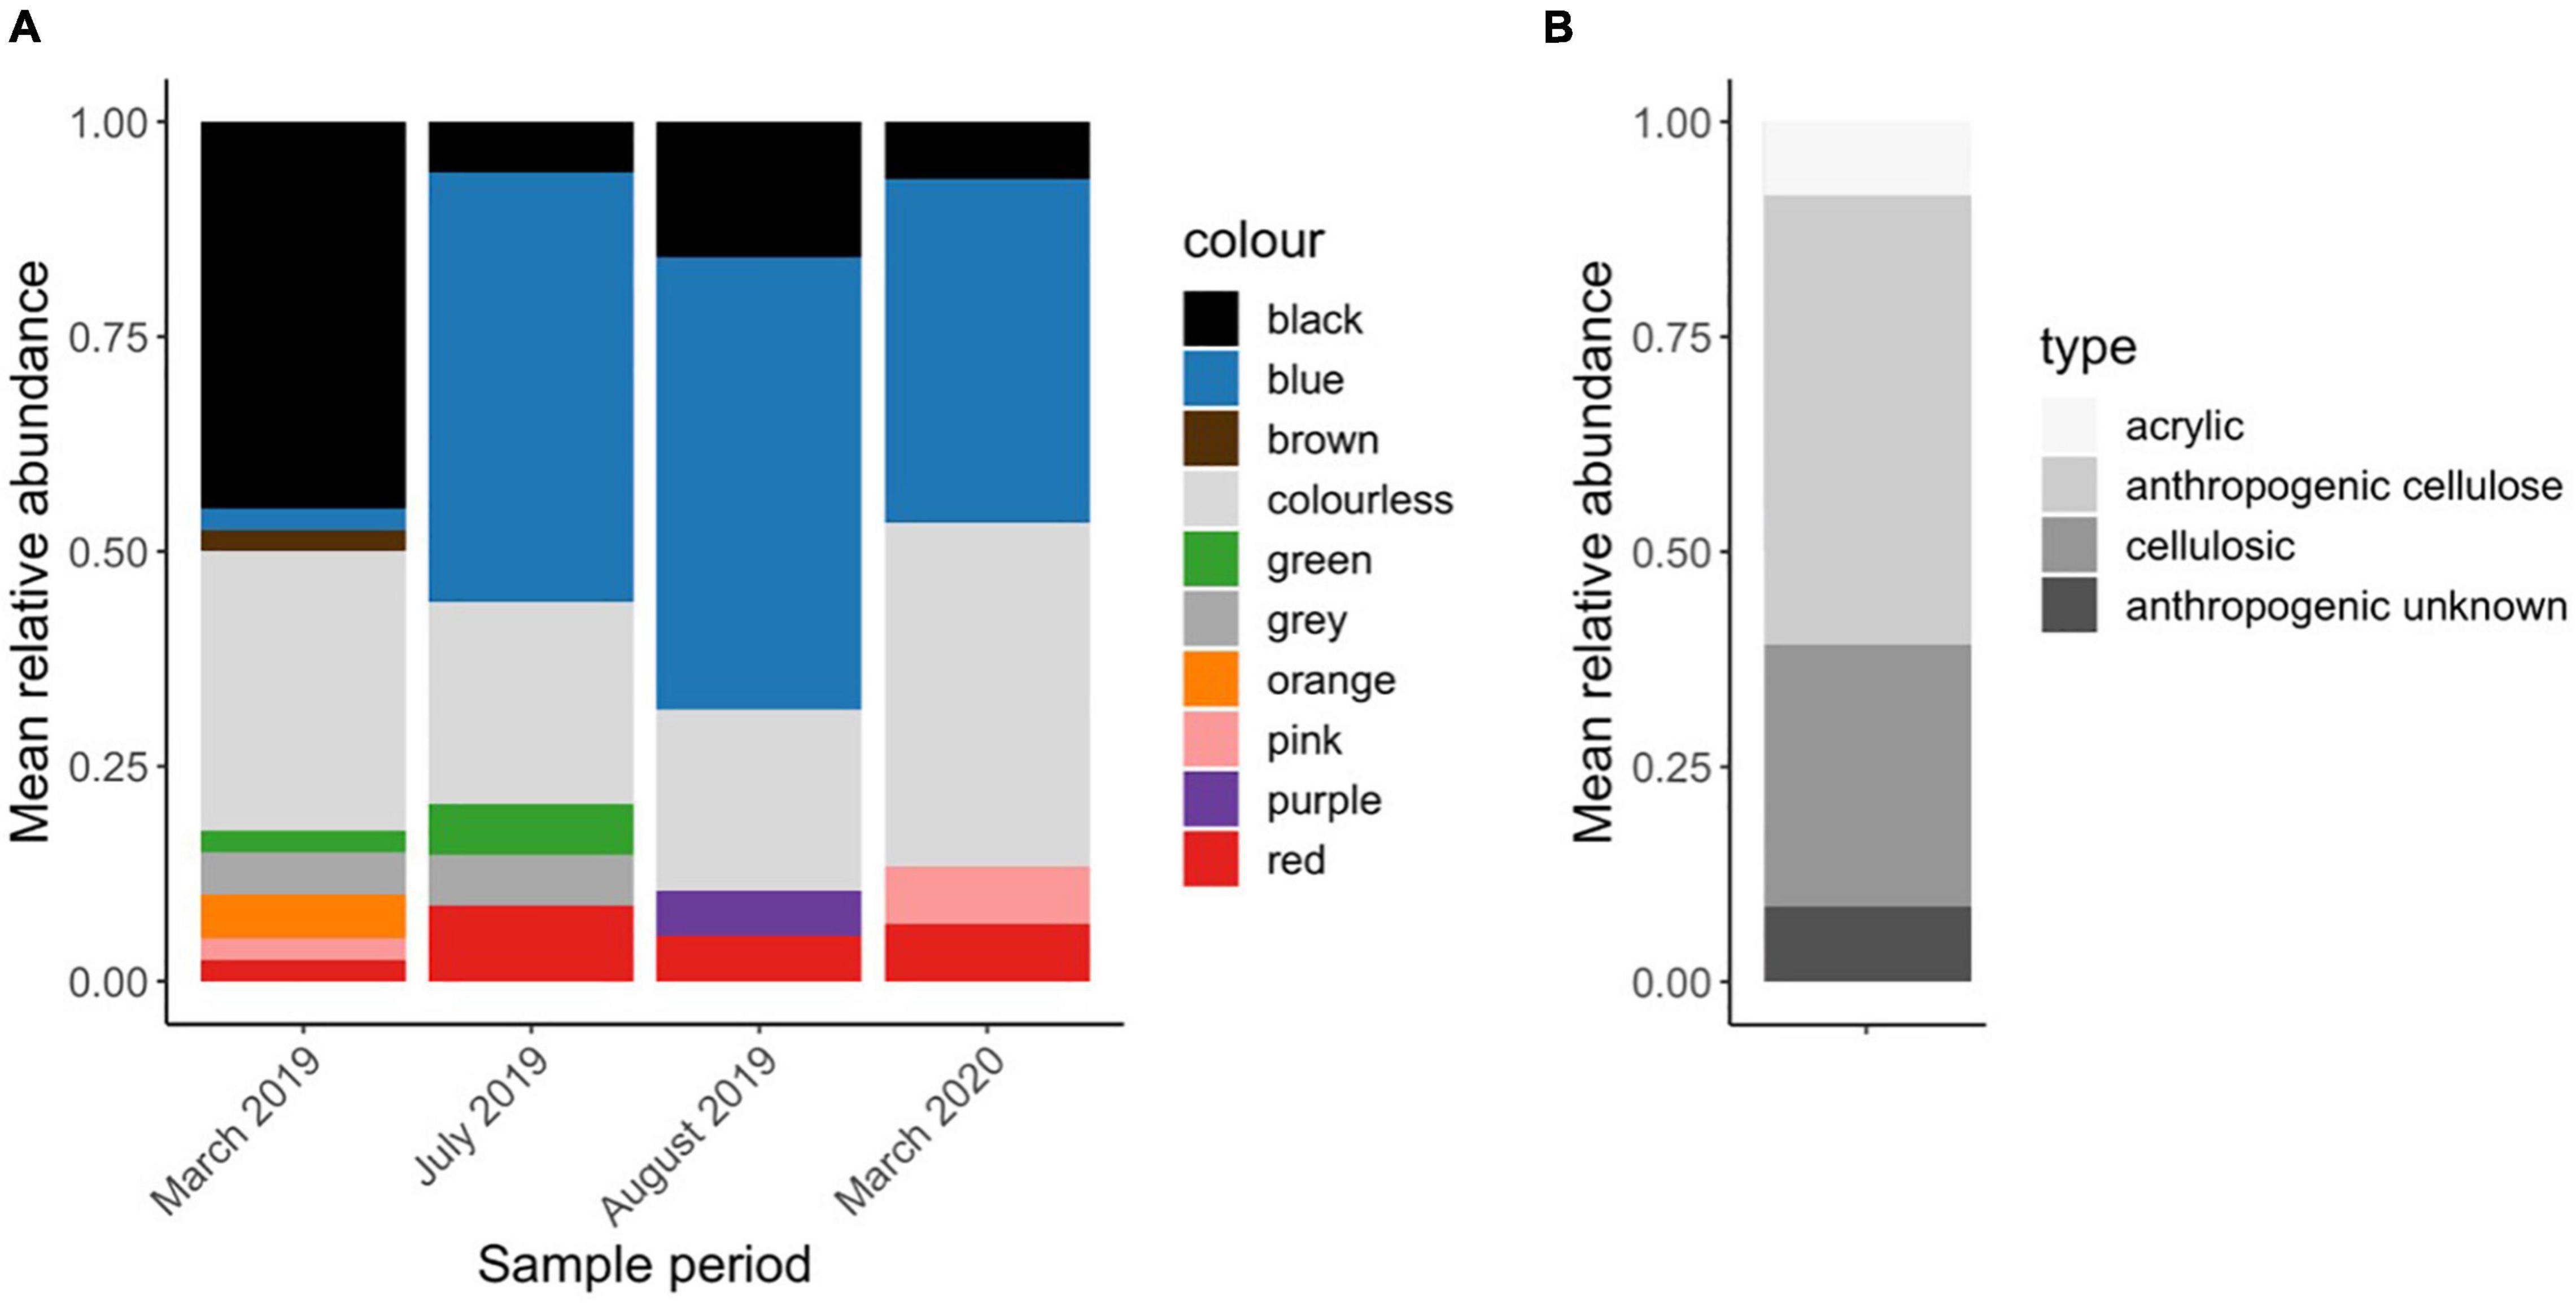
Figure 5. Patterns of microfiber color and type in WWTP samples (n = 3) across 4 sample periods. Results presented here are (A) the relative abundance of each color after blank subtractions in each sample period and (B) microfiber type as determined by chemical identification using Raman spectroscopy.
Discussion
Our study, conducted in nearly 100 homes within a local community, demonstrates that washing machine filters effectively capture microfibers and other particles before they are released to wastewater. The town where we did our study applies biosolids as a fertilizer, which is a common practice in Canada and many other parts of the world. Thus, filters reduced emissions of microfibers to ecosystems via final effluent and sewage sludge. Since textiles can also carry chemical contaminants into wastewater, these filters may also reduce emissions of chemical pollutants such as per- and polyfluoroalkyl substances (PFASs), brominated flame retardants (BFRs) and organophosphate esters (OPEs) (Saini et al., 2016; Schellenberger et al., 2019). As such, this study prevented emissions of microfibers and other particles/chemicals to Lake Huron and other local waterbodies.
The first studies on microfiber capturing devices showed that washing machine filters are effective and capture up to 87% of microfibers in a load of laundry when tested in the laboratory (McIlwraith et al., 2019; Napper et al., 2020). This present study now shows that washing machine filters are also effective when implemented at the scale of a small town. We diverted at least 22.8 kg of lint over the course of our study, as measured by the 63% of households that provided samples. Based on the range of 28–423 microfibers per mg of lint, this equates to 639 million to 9.7 billion microfibers. If we extrapolate up to 97 households with washing machine filters, this would equate to roughly 1.2–18.2 billion microfibers over the course of our 487-day study. Since we did not collect lint from each household, this microfiber capture is instead based on the average capture of 6.4 g lint per household per week, which is equivalent to 179,200–2,707,200 microfibers per week. If we estimate for just 1 year, for the households in our study, we estimate we diverted 934 million to 14.1 billion microfibers from WWTPs annually. If we were to scale up to a large city like Toronto (1,179,057 households) or Los Angeles (3,316,795 households), and assume all households had washing machine filters, then the annual microfiber capture could be in the range of 12–166 trillion microfibers for Toronto or 30–468 trillion for the county of Los Angeles.
In addition to household capture of microfibers in laundry lint, we observed a significant decline in the number of microfibers in final effluent at the municipal WWTP. This directly equates to less microfibers entering Lake Huron via treated effluent. After installing washing machine filters, we observed a reduction in microfibers in final effluent by an average of 41%. This significant difference in microfiber count pre- and post- filter deployment suggests that adding filters to washing machines reduces microfiber emissions to water bodies via treated wastewater. We are, however, surprised at such a large decrease in microfibers, especially since filters were only installed in 10% of homes. A possible explanation for a more substantial decrease than what we expected could be related to behavioral change. Due to local recruiting efforts and awareness campaigns, microfiber awareness may have increased in this community, which could have indirect effects. For example, if awareness campaigns led to changes in washing habits (i.e., washing less, washing with cold cycles, using a washing bag), this could contribute to further microfiber emission reductions. To test whether applying filters in a community can lead to indirect reductions in microfiber emissions from modified laundering practices, future work could focus on whether community-wide pilots impact behavior. This could help elucidate whether any additional impacts exist beyond the obvious microfiber capture via washing machine filters.
We found both natural and synthetic microfibers in wastewater samples, although natural anthropogenic microfibers were by far the most common material type. Even though research suggests that some types of fibers can degrade in the environment, others are more persistent (Zambrano et al., 2019; Bonanomi et al., 2020; Sørensen et al., 2021). In addition, there is a growing concern over synthetic and natural microfiber emissions due to additive chemicals (e.g., treatments and dyes; Lacasse and Baumann, 2004; Xue et al., 2017; Schellenberger et al., 2019), bioavailability to organisms (Gago et al., 2018; Athey et al., 2020), and toxicity (Kim et al., 2021; Mateos-Cárdenas et al., 2021).
In addition to measuring microfiber capture efficiency within homes and at the WWTP scale, we were able to measure a few other parameters. Previous research shows that top loader washing machines shed more microfibers than front loading washing machines (Hartline et al., 2016), and our results support this finding. We found that filters from top loader washing machines captured 1.5× more lint per week than front loading washing machines. This is equivalent to an additional 70,000–1,057,500 microfibers per week, assuming top loading machines captured an average of 2.5 g lint per household per week more than front loading machines and lint contains 28–423 microfibers/mg. This suggests that front loader machines result in the shedding of less fibers, and that top loading machines should receive filters first if efforts aim to retrofit existing washing machines with filters. In terms of the particle types, we found that lint from filters contained more than microfibers. Microfibers were the most common particle type in nearly every sample we examined. However, we additionally captured other particles, such as glitter and sequins. Glitter has been previously reported in wastewater systems (Napper et al., 2015).
Limitations and Future Directions
In our study, we evaluated lint and microfibers in a small town in Canada. While we did not see an effect of season in lint capture, the demographics where we conducted this study may be different from other locations. Also, participants were all volunteers who received directions on how to operate and empty the filters. More work should be included to evaluate consumer behavior to see whether filters are emptied properly, the time it takes to empty filters, and any other barriers to successful scaling. In our study we observed that participants regularly emptied filters, but it is unclear whether the volunteer component of this study created a sense of accountability whereby participants were encouraged to regularly empty and save their lint. Further investigations should also investigate in-line filters for both quantitative microfiber reductions and behavioral research. For effective studies, social research should be cross-sectional to collect quality data on behavior (Pahl and Wyles, 2017).
Future work should also investigate other sources of microfibers. Although the relative contributions of other microfiber sources are still unknown, recent research suggests that other microfiber sources such as wet wipes, dryers, and cigarette butts may also be significant contributors and deserve further attention (Kapp and Miller, 2020; Ó Briain et al., 2020; Belzagui et al., 2021). Solutions to address other microfiber sources will depend on the emission type, and may include solutions such as public awareness campaigns, and technologies such as filters and trash capture devices.
Implications for Policy Change
The question remains; is it feasible to have everyone install an external washing machine filter to capture microfibers and other microplastics? Although we were able to recruit nearly 100 participant households in this study, we needed to turn away many households due to limitations of the filter. These limitations included: (1) lack of space to mount the filter, (2) inaccessible effluent drains, such as plumbing behind drywall, and (3) accessibility issues where participants could not reach behind their washing machine to empty the filter. In total, we had to turn away 20 households due to one or more limitation, meaning that approximately one in five households that wanted a filter were unable to install and/or operate it. Another consideration is that washing machine filters are expensive (roughly $150 USD per unit) and take time and energy to install. While cost was not a limitation in our study (filters and professional installations were provided to study participants free of charge), it is important to recognize that filter cost may limit many consumers in purchasing an after-market filter unit.
The next logical step would be having filters built directly into washing machines. This takes the onus away from the consumer and normalizes filters on washing machines. Legislation is currently underway to address microfiber pollution via this mechanism. Several jurisdictions have either passed legislation (e.g., France 2020-105, Article 79) or introduced bills (e.g., California AB 622, Ontario Bill 279 and US BreakFreeFromPlastic Bill).
This pilot study shows that filters on washing machines are an effective intervention to capture microfibers from washing effluent—diverting one source of microfiber emissions from aquatic ecosystems. Although we do not yet know how other intervention points compare in microfiber capture, our results show that reducing microfibers from washing machine effluent is an effective intervention to reduce microfiber pollution. Other interventions have also been proposed to curb microfiber emissions. Further upstream, textile redesign efforts to reduce microfiber shedding are currently underway. Since microfibers are also released from clothing during regular use (De Falco et al., 2020), as well as during washing, redesign could help limit microfiber shedding. Downstream, efforts to innovate in WWTPs have also been discussed. Access to wastewater treatment and the level of treatment varies considerably across Canada and around the world. Many systems in coastal communities discharge untreated wastewater directly into the environment. New wastewater infrastructure and/or upgrades may be a solution, but we must consider that microfiber capture currently is in the sludge, and some communities use sludge as fertilizer. In combination, different solutions may offer multiple points of intervention to limit microfiber release. As we determine other solutions to different sources and pathways of microfibers, we show that implementing filters at the level of the washing machine is effective. Many consumers already capture and dispose of lint from dryers. Why not also capture lint from washing machines and prevent microfibers from going down the drain?
In conclusion, we demonstrated that microfiber filters are effective at the community and WWTP scale. We installed 97 washing machine filters in people’s homes, and our results show a significant decrease in microfibers at the municipal WWTP after installing filters. Analysis of household lint samples also revealed that filters captured microplastics in addition to microfibers. While future investigations are still needed to address other sources of microfibers release to the environment, this work shows that washing machine filters are an effective tool to capture microfibers when applied in people’s homes. Washing machine filters may be a key milestone on the path toward reducing microfibers in the environment. The implementation of filters as a solution will also require support by legislation, innovation, and awareness to drive change.
Data Availability Statement
The original contributions presented in the study are included in the article/Supplementary Material, further inquiries can be directed to the corresponding author/s.
Author Contributions
LE and CR designed the experiment. LE and DN conducted the experiment. DN conducted the sample processing and particle counting. LE analyzed the data and wrote the initial draft of the manuscript. All authors contributed to drafts of the manuscript.
Funding
This work was supported by an NSERC USRA to DN, an NSERC PGSD to LE, and a Discovery Grant to CR. The Geoff Peach Scholarship Fund to LE. A Center for Global Change Studies fellowship to DP and several funding sources to DS including the ECCC EcoAction Community Funding Program, Lush Handmade Cosmetics Ltd., Patagonia Environmental Grants Fund of Tides Foundation, RBC Foundation, Charles H. Ivey Foundation, J. P. Bickell Foundation, LeVan Family Foundation and Georgian Bay Forever Donors. Funding sources had no such involvement in study design; collection, analysis and interpretation of data; in the writing of the report; or the decision to submit the article for publication.
Conflict of Interest
The authors declare that the research was conducted in the absence of any commercial or financial relationships that could be construed as a potential conflict of interest.
Publisher’s Note
All claims expressed in this article are solely those of the authors and do not necessarily represent those of their affiliated organizations, or those of the publisher, the editors and the reviewers. Any product that may be evaluated in this article, or claim that may be made by its manufacturer, is not guaranteed or endorsed by the publisher.
Acknowledgments
We would like to thank Paul Helm (Ontario Ministry of the Environment Conservation and Parks) for providing in-kind support for WWTP sampling, and for helping develop sampling protocols. We are grateful to the Town of Parry Sound for allowing us to conduct this study and to the WWTP staff for assistance in sample collection. Also, we are grateful to all the volunteers that installed washing machine filters, kept laundry lint in their freezers, and provided valuable feedback. We would also like to thank Brooke Harrison for coordinating with volunteers and reviewing our manuscript. Lastly, we would like to thank Hayley McIlwraith for assistance with Raman spectroscopy.
Supplementary Material
The Supplementary Material for this article can be found online at: https://www.frontiersin.org/articles/10.3389/fmars.2021.777865/full#supplementary-material
References
Almroth, B. M. C., Åström, L., Roslund, S., and Petersson, H. (2018). Quantifying shedding of synthetic fibers from textiles; a source of microplastics released into the environment. Environ. Sci. Pollut. Res. Int. 25, 1191–1199. doi: 10.1007/s11356-017-0528-7
Athey, S. N., Adams, J. K., Erdle, L. M., Jantunen, L. M., Helm, P. A., Finkelstein, S. A., et al. (2020). The widespread environmental footprint of indigo denim microfibers from blue jeans. Environ. Sci. Technol. Lett. 7, 840–847. doi: 10.1021/acs.estlett.0c00498
Belzagui, F., Buscio, V., Gutiérrez-Bouzán, C., and Vilaseca, M. (2021). Cigarette butts as a microfiber source with a microplastic level of concern. Sci. Total Environ. 762:144165. doi: 10.1016/j.scitotenv.2020.144165
Bonanomi, G., Maisto, G., De Marco, A., Cesarano, G., Zotti, M., Mazzei, P., et al. (2020). The fate of cigarette butts in different environments: decay rate, chemical changes and ecotoxicity revealed by a 5-years decomposition experiment. Environ. Pollut. 261:114108. doi: 10.1016/j.envpol.2020.114108
Browne, M. A., Crump, P., Niven, S. J., Teuten, E., Tonkin, A., Galloway, T., et al. (2011). Accumulation of microplastic on shorelines woldwide: sources and sinks. Environ. Sci. Technol. 45, 9175–9179. doi: 10.1021/es201811s
Carr, S. A. (2017). Sources and dispersive modes of micro-fibers in the environment. Integr. Environ. Assess. Manag. 13, 466–469. doi: 10.1002/ieam.1916
Carr, S. A., Liu, J., and Tesoro, A. G. (2016). Transport and fate of microplastic particles in wastewater treatment plants. Water Res. 91, 174–182. doi: 10.1016/j.watres.2016.01.002
Cesa, F. S., Turra, A., Checon, H. H., Leonardi, B., and Baruque-Ramos, J. (2020). Laundering and textile parameters influence fibers release in household washings. Environ. Pollut. 257:113553. doi: 10.1016/j.envpol.2019.113553
Conley, K., Clum, A., Deepe, J., Lane, H., and Beckingham, B. (2019). Wastewater treatment plants as a source of microplastics to an urban estuary: removal efficiencies and loading per capita over one year. Water Res. X 3:100030. doi: 10.1016/j.wroa.2019.100030
Crossman, J., Hurley, R. R., Futter, M., and Nizzetto, L. (2020). Transfer and transport of microplastics from biosolids to agricultural soils and the wider environment. Sci. Total Environ. 724:138334. doi: 10.1016/j.scitotenv.2020.138334
De Falco, F., Cocca, M., Avella, M., and Thompson, R. C. (2020). Microfiber release to water, via laundering, and to air, via everyday use: a comparison between polyester clothing with differing textile parameters. Environ. Sci. Technol. 54, 3288–3296. doi: 10.1021/acs.est.9b06892
De Falco, F., Gullo, M. P., Gentile, G., Di Pace, E., Cocca, M., Gelabert, L., et al. (2018). Evaluation of microplastic release caused by textile washing processes of synthetic fabrics. Environ. Pollut. 236, 916–925. doi: 10.1016/j.envpol.2017.10.057
Filtrol. (2021). The Filtrol Solution. Available online at: https://filtrol.net/about/ (Accessed October 16, 2021).
Gago, J., Carretero, O., Filgueiras, A. V., and Viñas, L. (2018). Synthetic microfibers in the marine environment: a review on their occurrence in seawater and sediments. Mar. Pollut. Bull. 127, 365–376. doi: 10.1016/j.marpolbul.2017.11.070
Gavigan, J., Kefela, T., Macadam-Somer, I., Suh, S., and Geyer, R. (2020). Synthetic microfiber emissions to land rival those to waterbodies and are growing. PLoS One 15:e0237839. doi: 10.1371/journal.pone.0237839
Gies, E. A., LeNoble, J. L., Noël, M., Etemadifar, A., Bishay, F., Hall, E. R., et al. (2018). Retention of microplastics in a major secondary wastewater treatment plant in Vancouver, Canada. Mar. Pollut. Bull. 133, 553–561. doi: 10.1016/j.marpolbul.2018.06.006
Hartline, N. L., Bruce, N. J., Karba, S. N., Ruff, E. O., Sonar, S. U., and Holden, P. A. (2016). Microfiber masses recovered from conventional machine washing of new or aged garments. Environ. Sci. Technol. 50, 11532–11538. doi: 10.1021/acs.est.6b03045
Hernandez, E., Nowack, B., and Mitrano, D. M. (2017). polyester textiles as a source of microplastics from households: a mechanistic study to understand microfiber release during washing. Environ. Sci. Technol. 51, 7036–7046. doi: 10.1021/acs.est.7b01750
Kapp, K. J., and Miller, R. Z. (2020). Electric clothes dryers: an underestimated source of microfiber pollution. PLoS One 15:e0239165. doi: 10.1371/journal.pone.0239165
Kim, L., Kim, S. A., Kim, T. H., Kim, J., and An, Y. J. (2021). Synthetic and natural microfibers induce gut damage in the brine shrimp Artemia Franciscana. Aquat. Toxicol. 232:105748. doi: 10.1016/j.aquatox.2021.105748
Lant, N. J., Hayward, A. S., Peththawadu, M. M. D., Sheridan, K. J., and Dean, J. R. (2020). Microfiber release from real soiled consumer laundry and the impact of fabric care products and washing conditions. PLoS One 15:e0233332. doi: 10.1371/journal.pone.0233332
Lares, M., Ncibi, M. C., Sillanpää, M., and Sillanpää, M. (2018). Occurrence, identification and removal of microplastic particles and fibers in conventional activated sludge process and advanced MBR technology. Water Res. 133, 236–246. doi: 10.1016/j.watres.2018.01.049
Mateos-Cárdenas, A., O’Halloran, J., van Pelt, F. N. A. M., and Jansen, M. A. K. (2021). Beyond plastic microbeads – short-term feeding of cellulose and polyester microfibers to the freshwater amphipod Gammarus duebeni. Sci. Total Environ. 753:141859. doi: 10.1016/j.scitotenv.2020.141859
McIlwraith, H. K., Lin, J., Erdle, L. M., Mallos, N., Diamond, M. L., and Rochman, C. M. (2019). Capturing microfibers – marketed technologies reduce microfiber emissions from washing machines. Mar. Pollut. Bull. 139, 40–45. doi: 10.1016/j.marpolbul.2018.12.012
Murphy, F., Ewins, C., Carbonnier, F., and Quinn, B. (2016). Wastewater treatment works (WwTW) as a source of microplastics in the aquatic environment. Environ. Sci. Technol. 50, 5800–5808. doi: 10.1021/acs.est.5b05416
Napper, I. E., Bakir, A., Rowland, S. J., and Thompson, R. C. (2015). Characterisation, quantity and sorptive properties of microplastics extracted from cosmetics. Mar. Pollut. Bull. 99, 178–185. doi: 10.1016/j.marpolbul.2015.07.029
Napper, I. E., Barrett, A. C., and Thompson, R. C. (2020). The efficiency of devices intended to reduce microfibre release during clothes washing. Sci. Total Environ. 738:140412. doi: 10.1016/j.scitotenv.2020.140412
Napper, I. E., and Thompson, R. C. (2016). Release of synthetic microplastic plastic fibres from domestic washing machines: effects of fabric type and washing conditions. Mar. Pollut. Bull. 112, 39–45. doi: 10.1016/j.marpolbul.2016.09.025
Nelms, S. E., Galloway, T. S., Godley, B. J., Jarvis, D. S., and Lindeque, P. K. (2018). Investigating microplastic trophic transfer in marine top predators. Environ. Pollut. 238, 999–1007. doi: 10.1016/j.envpol.2018.02.016
Ó Briain, O., Marques Mendes, A. R., McCarron, S., Healy, M. G., and Morrison, L. (2020). The role of wet wipes and sanitary towels as a source of white microplastic fibres in the marine environment. Water Res. 182, 116021. doi: 10.1016/j.watres.2020.116021
Pahl, S., and Wyles, K. J. (2017). The human dimension: how social and behavioural research methods can help address microplastics in the environment. Anal. Methods 9, 1404–1411. doi: 10.1039/C6AY02647H
Pirc, U., Vidmar, M., Mozer, A., and Kržan, A. (2016). Emissions of microplastic fibers from microfiber fleece during domestic washing. Environ. Sci. Pollut. Res. Int. 23, 22206–22211. doi: 10.1007/s11356-016-7703-0
Reynolds, D. M., and Ahmad, S. R. (1997). Rapid and direct determination of wastewater BOD values using a fluorescence technique. Water Res. 31, 2012–2018. doi: 10.1016/S0043-1354(97)00015-8
Saini, A., Thaysen, C., Jantunen, L., McQueen, R. H., and Diamond, M. L. (2016). From clothing to laundry water: investigating the fate of phthalates, brominated flame retardants, and organophosphate esters. Environ. Sci. Technol. 50, 9289–9297. doi: 10.1021/acs.est.6b02038
Sanchez-Vidal, A., Thompson, R. C., Canals, M., and De Haan, W. P. (2018). The imprint of microfibres in Southern European deep seas. PLoS One 13:e0207033. doi: 10.1371/journal.pone.0207033
Schellenberger, S., Jönsson, C., Mellin, P., Levenstam, O. A., Liagkouridis, I., Ribbenstedt, A., et al. (2019). Release of side-chain fluorinated polymer-containing microplastic fibers from functional textiles during washing and first estimates of perfluoroalkyl acid emissions. Environ. Sci. Technol. 53, 14329–14338. doi: 10.1021/acs.est.9b04165
Sillanpää, M., and Sainio, P. (2017). Release of polyester and cotton fibers from textiles in machine washings. Environ. Sci. Pollut. Res. Int. 24, 19313–19321. doi: 10.1007/s11356-017-9621-1
Sørensen, L., Groven, A. S., Hovsbakken, I. A., Del Puerto, O., Krause, D. F., Sarno, A., et al. (2021). UV degradation of natural and synthetic microfibers causes fragmentation and release of polymer degradation products and chemical additives. Sci. Total Environ. 755:143170. doi: 10.1016/j.scitotenv.2020.143170
Talvitie, J., Mikola, A., Koistinen, A., and Setälä, O. (2017a). Solutions to microplastic pollution – removal of microplastics from wastewater effluent with advanced wastewater treatment technologies. Water Res. 123, 401–407. doi: 10.1016/j.watres.2017.07.005
Talvitie, J., Mikola, A., Setälä, O., Heinonen, M., and Koistinen, A. (2017b). How well is microlitter purified from wastewater? – A detailed study on the stepwise removal of microlitter in a tertiary level wastewater treatment plant. Water Res. 109, 164–172. doi: 10.1016/j.watres.2016.11.046
Xue, J., Liu, W., and Kannan, K. (2017). Bisphenols, benzophenones, and bisphenol a diglycidyl ethers in textiles and infant clothing. Environ. Sci. Technol. 51, 5279–5286. doi: 10.1021/acs.est.7b00701
Yargeau, V., Taylor, B., Li, H., Rodayan, A., and Metcalfe, C. D. (2014). Analysis of drugs of abuse in wastewater from two Canadian cities. Sci Total Environ 487, 722–730. doi: 10.1016/j.scitotenv.2013.11.094
Zambrano, M. C., Pawlak, J. J., Daystar, J., Ankeny, M., Cheng, J. J., and Venditti, R. A. (2019). Microfibers generated from the laundering of cotton, rayon and polyester based fabrics and their aquatic biodegradation. Mar. Pollut. Bull. 142, 394–407. doi: 10.1016/j.marpolbul.2019.02.062
Ziajahromi, S., Neale, P. A., Rintoul, L., and Leusch, F. D. L. (2017). Wastewater treatment plants as a pathway for microplastics: development of a new approach to sample wastewater-based microplastics. Water Res. 112, 93–99. doi: 10.1016/j.watres.2017.01.042
Keywords: microfibers, microplastics, textiles, washing machines, mitigation, wastewater treatment
Citation: Erdle LM, Nouri Parto D, Sweetnam D and Rochman CM (2021) Washing Machine Filters Reduce Microfiber Emissions: Evidence From a Community-Scale Pilot in Parry Sound, Ontario. Front. Mar. Sci. 8:777865. doi: 10.3389/fmars.2021.777865
Received: 15 September 2021; Accepted: 26 October 2021;
Published: 18 November 2021.
Edited by:
Tieyu Wang, Shantou University, ChinaReviewed by:
Monica F. Costa, Federal University of Pernambuco, BrazilTania Martellini, University of Florence, Italy
Copyright © 2021 Erdle, Nouri Parto, Sweetnam and Rochman. This is an open-access article distributed under the terms of the Creative Commons Attribution License (CC BY). The use, distribution or reproduction in other forums is permitted, provided the original author(s) and the copyright owner(s) are credited and that the original publication in this journal is cited, in accordance with accepted academic practice. No use, distribution or reproduction is permitted which does not comply with these terms.
*Correspondence: Lisa M. Erdle, bGVyZGxlQGdtYWlsLmNvbQ==
†These authors have contributed equally to this work and share first authorship