 Lauren E. Wiesebron
 Leonardo R. Castro
 Samuel Soto1
 Jorge Castillo
- 1Laboratorio de Oceanografía Pesquera y Ecología Larval, Departamento de Oceanografía and Centro FONDAP-COPAS, Universidad de Concepción, Concepción, Chile
- 2Royal Netherlands Institute for Sea Research, Department of Estuarine and Delta Systems, Utrecht University, Yerseke, Netherlands
- 3Departamento de Evaluaciones Directas, Instituto de Fomento Pesquero, Valparaíso, Chile
Forage fish play the crucial role of transferring energy from lower to upper trophic levels. These small pelagic fish feed on plankton and can compete with each other for food, leading to potentially complex interactions. Three forage fish species (Sprattus fuegensis, Strangomera bentincki, and Engraulis ringens) are commonly found in the inshore waters of Northern Chilean Patagonia, a region with large spatial variability in oceanographic conditions and in the zooplankton community. To better understand what factors may explain coexistence among these three forage fish species, we examined differences in resource availability (zooplankton community and abundances) in three locations (Chiloé, Cordillera, and Aysén regions) within Northern Patagonia. We compared the diet of the three fish species using both stable isotope and stomach content analyses, and we measured their gill rakers. S. fuegensis, the only species found in all three regions, had flexible diets which lent it greater success than the other two species at foraging in waters with fewer prey. We found little diet differentiation among the three species in the copepod-rich Cordillera region, but the diverging diets of S. bentincki and S. fuegensis in the copepod-poor Chiloé region suggest that diet partitioning in areas with fewer resources is due to competition. The small differences in diet facilitates coexistence among the three species, which may help explain the lack of correlation between the three species’ population abundances in the Cordillera region over the past 6 years. Finally, our results show that the high degree of oceanographic heterogeneity in Northern Patagonia may encourage species separation based on their specific environmental requirements.
Introduction
Forage fish are a key component of the marine ecosystem as they transfer energy from lower to upper trophic levels (Cury, 2000; Bakun et al., 2010; Pikitch et al., 2014). This functional group is characterized by short-lived species with rapid reproductive turnovers (Peck et al., 2013) and highly fluctuating abundances (Cury, 2000) driven by large scale climactic changes to their environment (Tourre et al., 2007). Many upwelling systems are dominated by one or two small pelagic fish species, however there are also other type of systems where several of these species coexist (Engelhard et al., 2014). Because of the similarities in the life history and function of small pelagic forage fish species, it is important to understand what factors may facilitate or impede coexistence in different regions.
Multi-decadal alternations in abundances between of anchovy and sardine in upwelling systems have long been observed (Chavez, 2003). This population dynamic is illustrated by biomass trends in the last two decades of Strangomera bentincki and Engraulis ringens in Central Chile to the north of our study area (Figure 1; data from acoustic surveys carried out by the Instituto de Fomento Pesquero provided by Jorge Castillo) where, from 1999 to 2019, the abundances of E. ringens and S. bentincki were negatively correlated with a lag of 2 years (correlation coefficient = –0.74, p < 0.01). In addition, the abundances of E. ringens declined sharply in 2006 while the S. bentincki experienced a rapid increase (e.g., in 2010, S. bentincki biomass was 150 times greater than E. ringens, Figure 1), which suggests that these populations are alternating in abundances on a decadal scale. Hypotheses for regime change point to recruitment strategies (Cury and Roy, 1989) or environmental factors such as temperature effects on growth (Takasuka et al., 2007). However, there has been less of a focus on understanding how these similar forage fish species coexist in the same habitat, especially in upwelling systems. Studies have examined diet overlap in forage fish, especially in anchovy and sardine, demonstrating that these species can exhibit prey preferences (Louw et al., 1998; Espinoza et al., 2009; Chouvelon et al., 2015), which can minimize competition for food (Van der Lingen et al., 2006), as well as help explain large scale regime shifts between the species (Shannon et al., 2004). While diet-mediated interactions between sardine and anchovy in upwelling systems are well-understood, it is less clear whether a similar mechanism facilitates coexistence in non-upwelling systems where several small pelagic fish species co-occur.
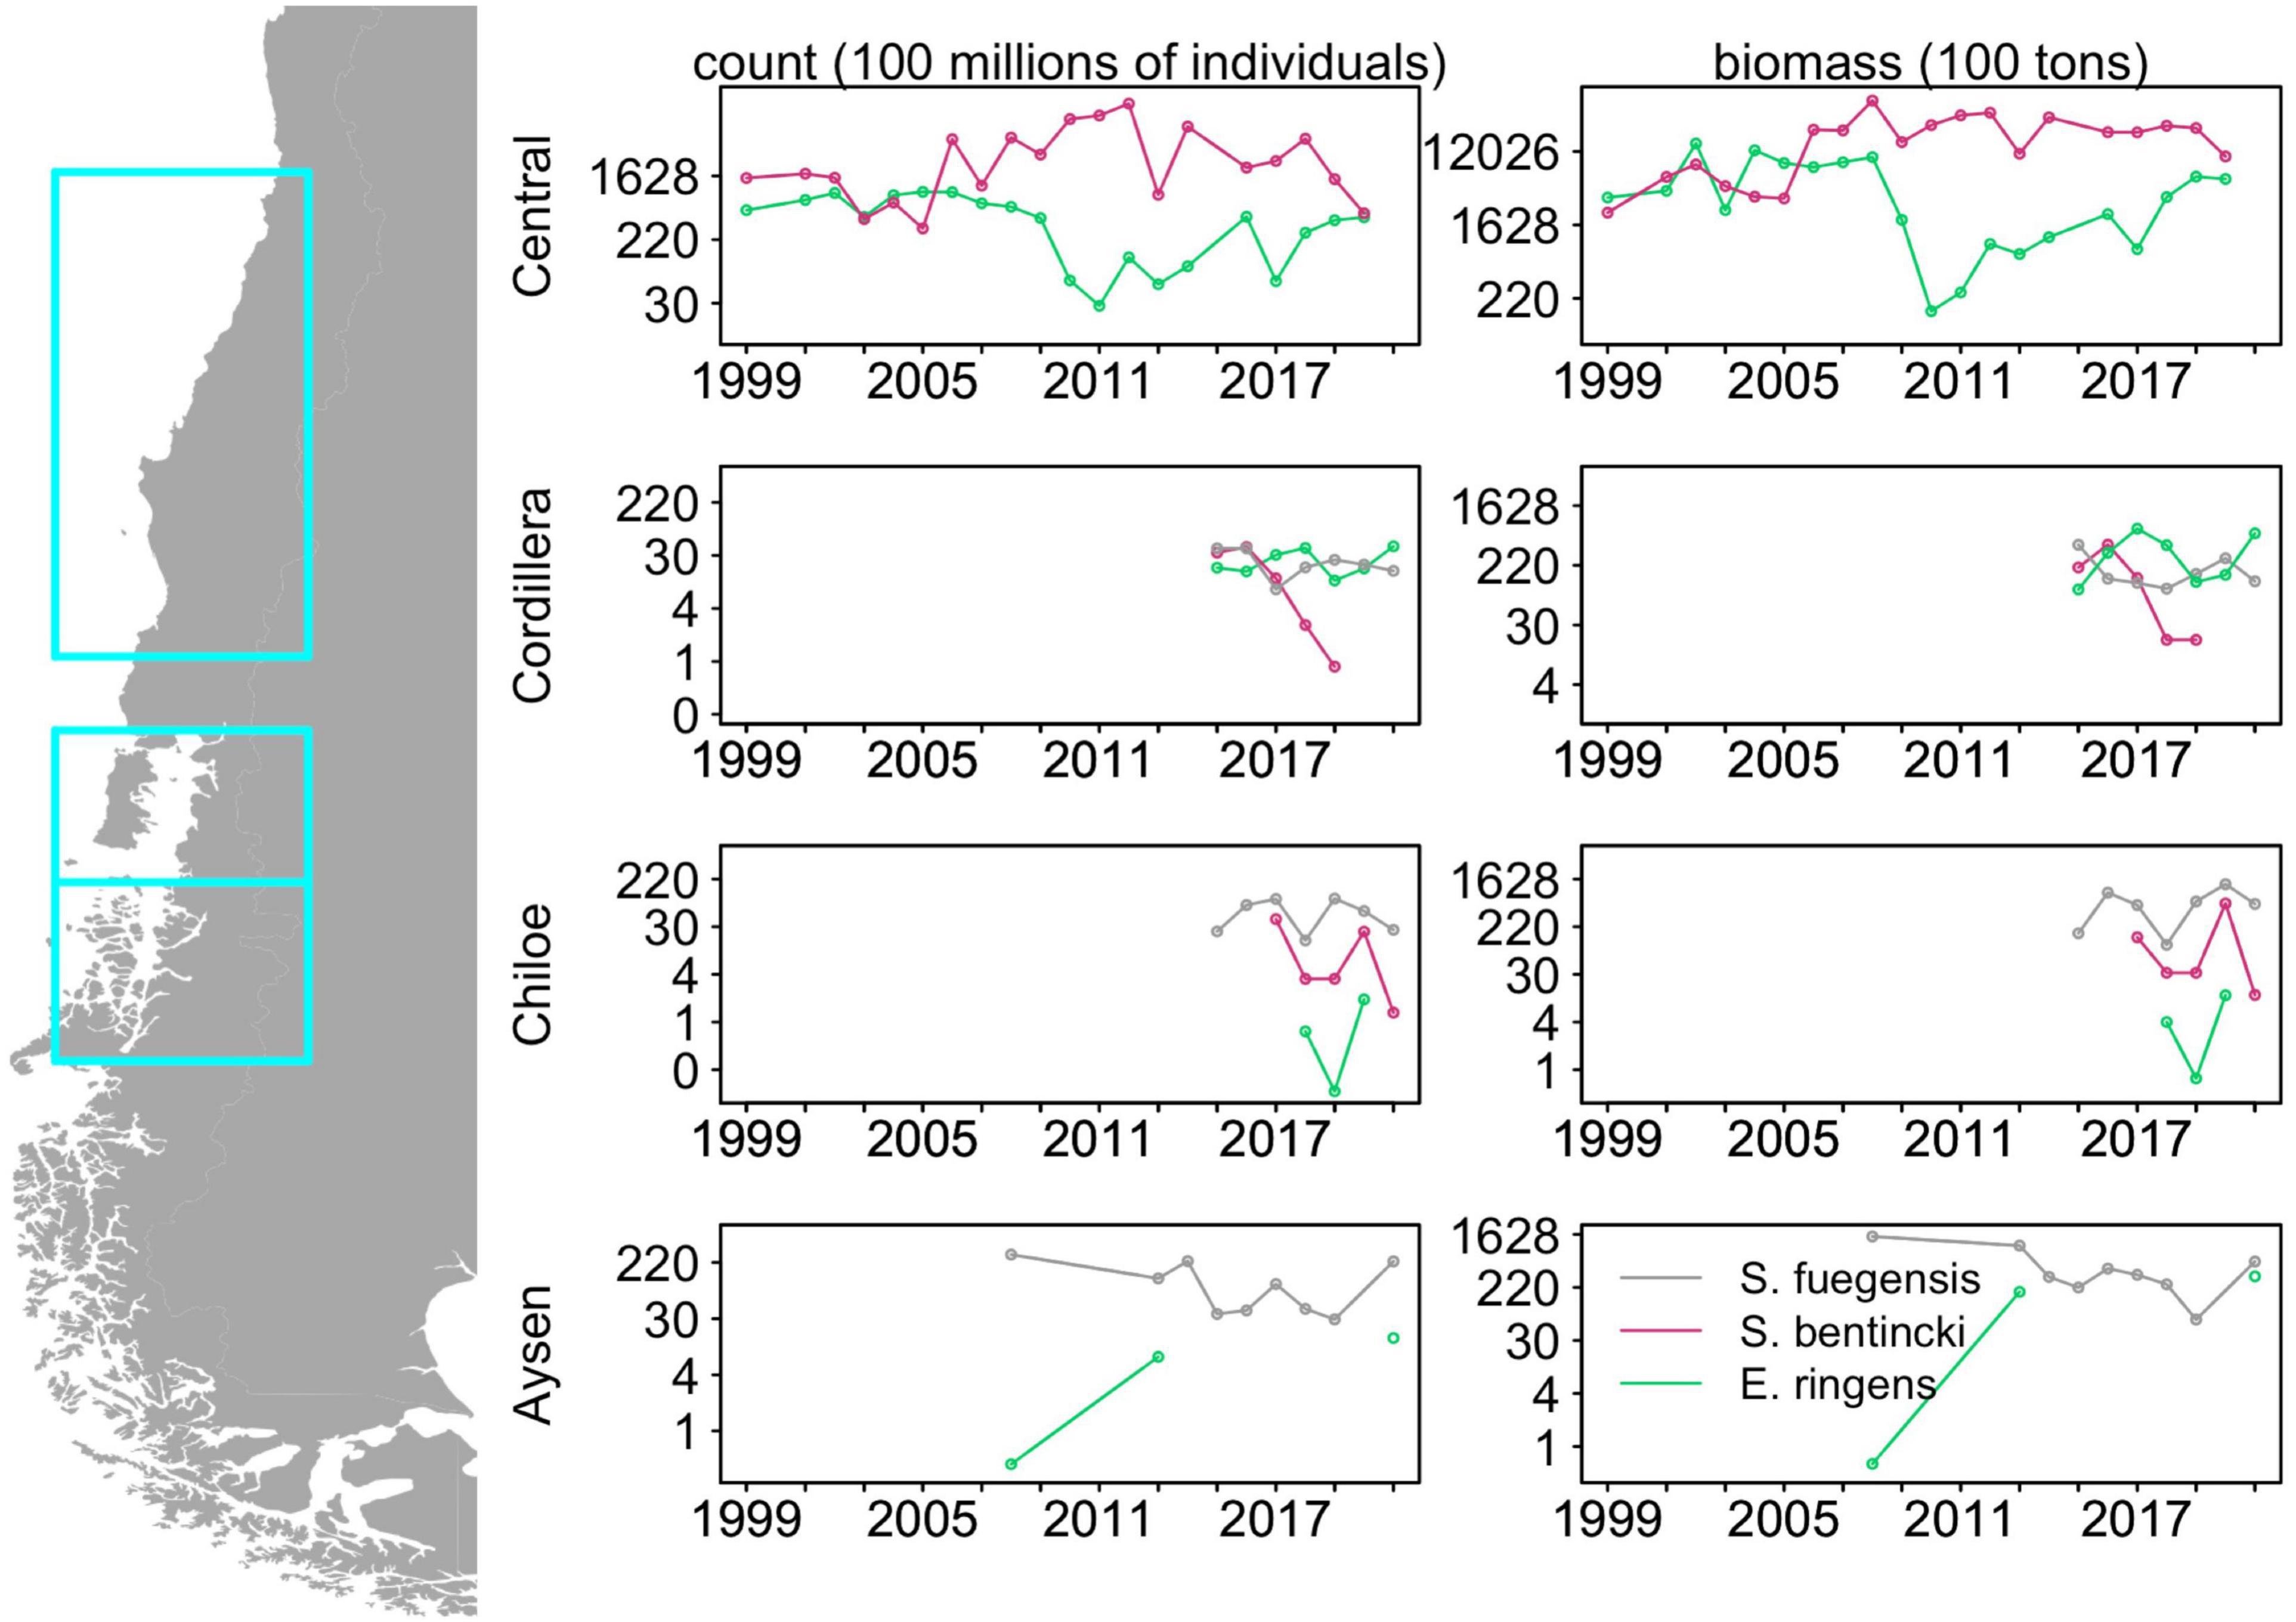
Figure 1. Historical abundances and biomass for the three fish species in Central Chile (32°40′S to 40°20′S), Chiloé and Cordillera (41°30′S to 43°55′S) and Aysén (43°55′S to 46°44′S) derived from acoustic surveys. Note the log scale in the y-axis. Data were provided by Jorge Castillo from the Instituto de Fomento Pesquero. See Supplementary Table 5 for associated abundances and biomass data.
Northern Chilean Patagonia, located at the northern sector of the Taitao peninsula (40–47°S), is home to a confluence of ocean currents, innumerable channels, fjords, and freshwater sources, which make it oceanographically very complex (Silva et al., 1998). The ecosystem undergoes drastic seasonal changes in productivity (Iriarte et al., 2007). It is also home to three species of forage fish: Strangomera bentincki (Clupeidae), Engraulis ringens (Engraulidae), and Sprattus fuegensis (Clupeidae). These three fish are economically important species. To the north of our study area, along the coast of Central Chile (32°40′S to 40°20′S) the S. bentincki and E. ringens have long fueled large industrial fisheries. Their combined biomass comprised 65% of Chilean catches in 2018, and the E. ringens fishery in Chile and Peru was 10% of 2018 global fisheries catch (FAO, 2020). Further South, in our study area (from 41°30′S to 46°44′S) the three fish sustain a purse seine fishery with the S. fuegensis comprising more than 50% of the fisheries catch, followed by E. ringens and S. bentincki. The S. fuegensis was historically observed on the South Atlantic coast off Argentina (Ramírez, 1976; Nakamura et al., 1986) and was only first recorded in our study system in 2005. However, it probably was present in Northern Patagonia earlier as it strongly resembles S. bentincki and was likely misidentified as such (Aranis et al., 2007).
Northern Patagonia represents the limit of distribution for these three small pelagic fish: the southernmost limit for E. ringens and S. bentincki, and the northernmost in the Pacific Ocean for S. fuegensis. Diet partitioning between the three species may facilitate coexistence among the three functionally similar fish. The diets of S. bentincki and E. ringens are relatively well-known further north along the Humboldt Current, compared to that of S. fuegensis which resides mostly further south in Patagonia. In these species, the phytoplankton contribution to their diet, although numerically higher than of zooplankton, has been cited as negligible compared with that of zooplankton, based on carbon contribution (Van der Lingen et al., 2006; Espinoza and Bertrand, 2008; Espinoza et al., 2009), especially in autumn when phytoplankton consumption by small pelagic fish is low (Espinoza and Bertrand, 2008; Garrido et al., 2008). Furthermore, it is known that anchovy can select for larger food than sardine because the spaces between their gill raker spines are larger (Louw et al., 1998; Van der Lingen et al., 2006). While there have been previous studies examining the trophic position of S. fuegensis in Northern Patagonia (Montecinos et al., 2016) and its diet in the Southern Patagonia (Riccialdelli et al., 2020), this is the first study to examine the diet of the three species during a same season and in a same region. Investigating diet as a mechanism for coexistence will help us better understand the forces driving the fish’s population dynamics, as well as characterize the region’s resilience to fishing pressure and to future environmental changes.
Our aim for this study was to examine if food resource partitioning occurred among the three species. We conducted cruises in mid-autumn (April and May 2019) when food production starts to decrease, to collect adult fish, zooplankton, and oceanographic data for this region. We characterized the zooplankton community in terms of composition and abundance to examine the availability of prey for these forage fish in three different regions in the inshore zone of Northern Patagonia. We used two different and complementary diet methods to compare among fish species: stable isotope and stomach content analyses. Stomach content analysis provides a detailed view of the what the fish ate, but it is a snapshot in time (Hynes, 1950), whereas stable isotope analysis can give us an idea of the fish’s diet over a longer period of time (weeks-months) (Peterson and Fry, 1987; Boecklen et al., 2011) but lacks the fine resolution of itemized stomach contents. While δ15N are used as indicators of trophic position, carbon stable isotopes δ13C can indicate the relative importance of marine vs. terrestrial organic carbon in a fish’s diet, which is highly relevant for our study area given the regional differences in freshwater influx. We hypothesized that there were small differences in the diet of the three fish species that facilitated coexistence. Furthermore, because S. fuegensis was present in the entire studied region, unlike the other two species, we hypothesized that it had a more flexible diet than the other two species.
Materials and Methods
Sampling Area Description
Chilean Patagonia contains some of the most extensive channel and fjord systems in the world and is characterized by complex oceanographic processes (Sievers and Silva, 2006). From outside the study system, Surface Subantarctic Water (year round) and Equatorial Subsurface Water (mainly in spring and summer) enter our study region through the Guafo Mouth (Silva et al., 1998) carrying zooplankton and nutrients (Palma and Silva, 2004; Figure 2). This salty water then mixes inshore with estuarine water of low salinity that results from runoff, rivers, glacier melt and precipitation (Silva et al., 1998). Inside our study region, narrow and deep fjords contain many islands which create micro-basins and hinder exchanges of ocean water between channels (Sievers and Silva, 2006), resulting in heterogeneous oceanographic conditions.
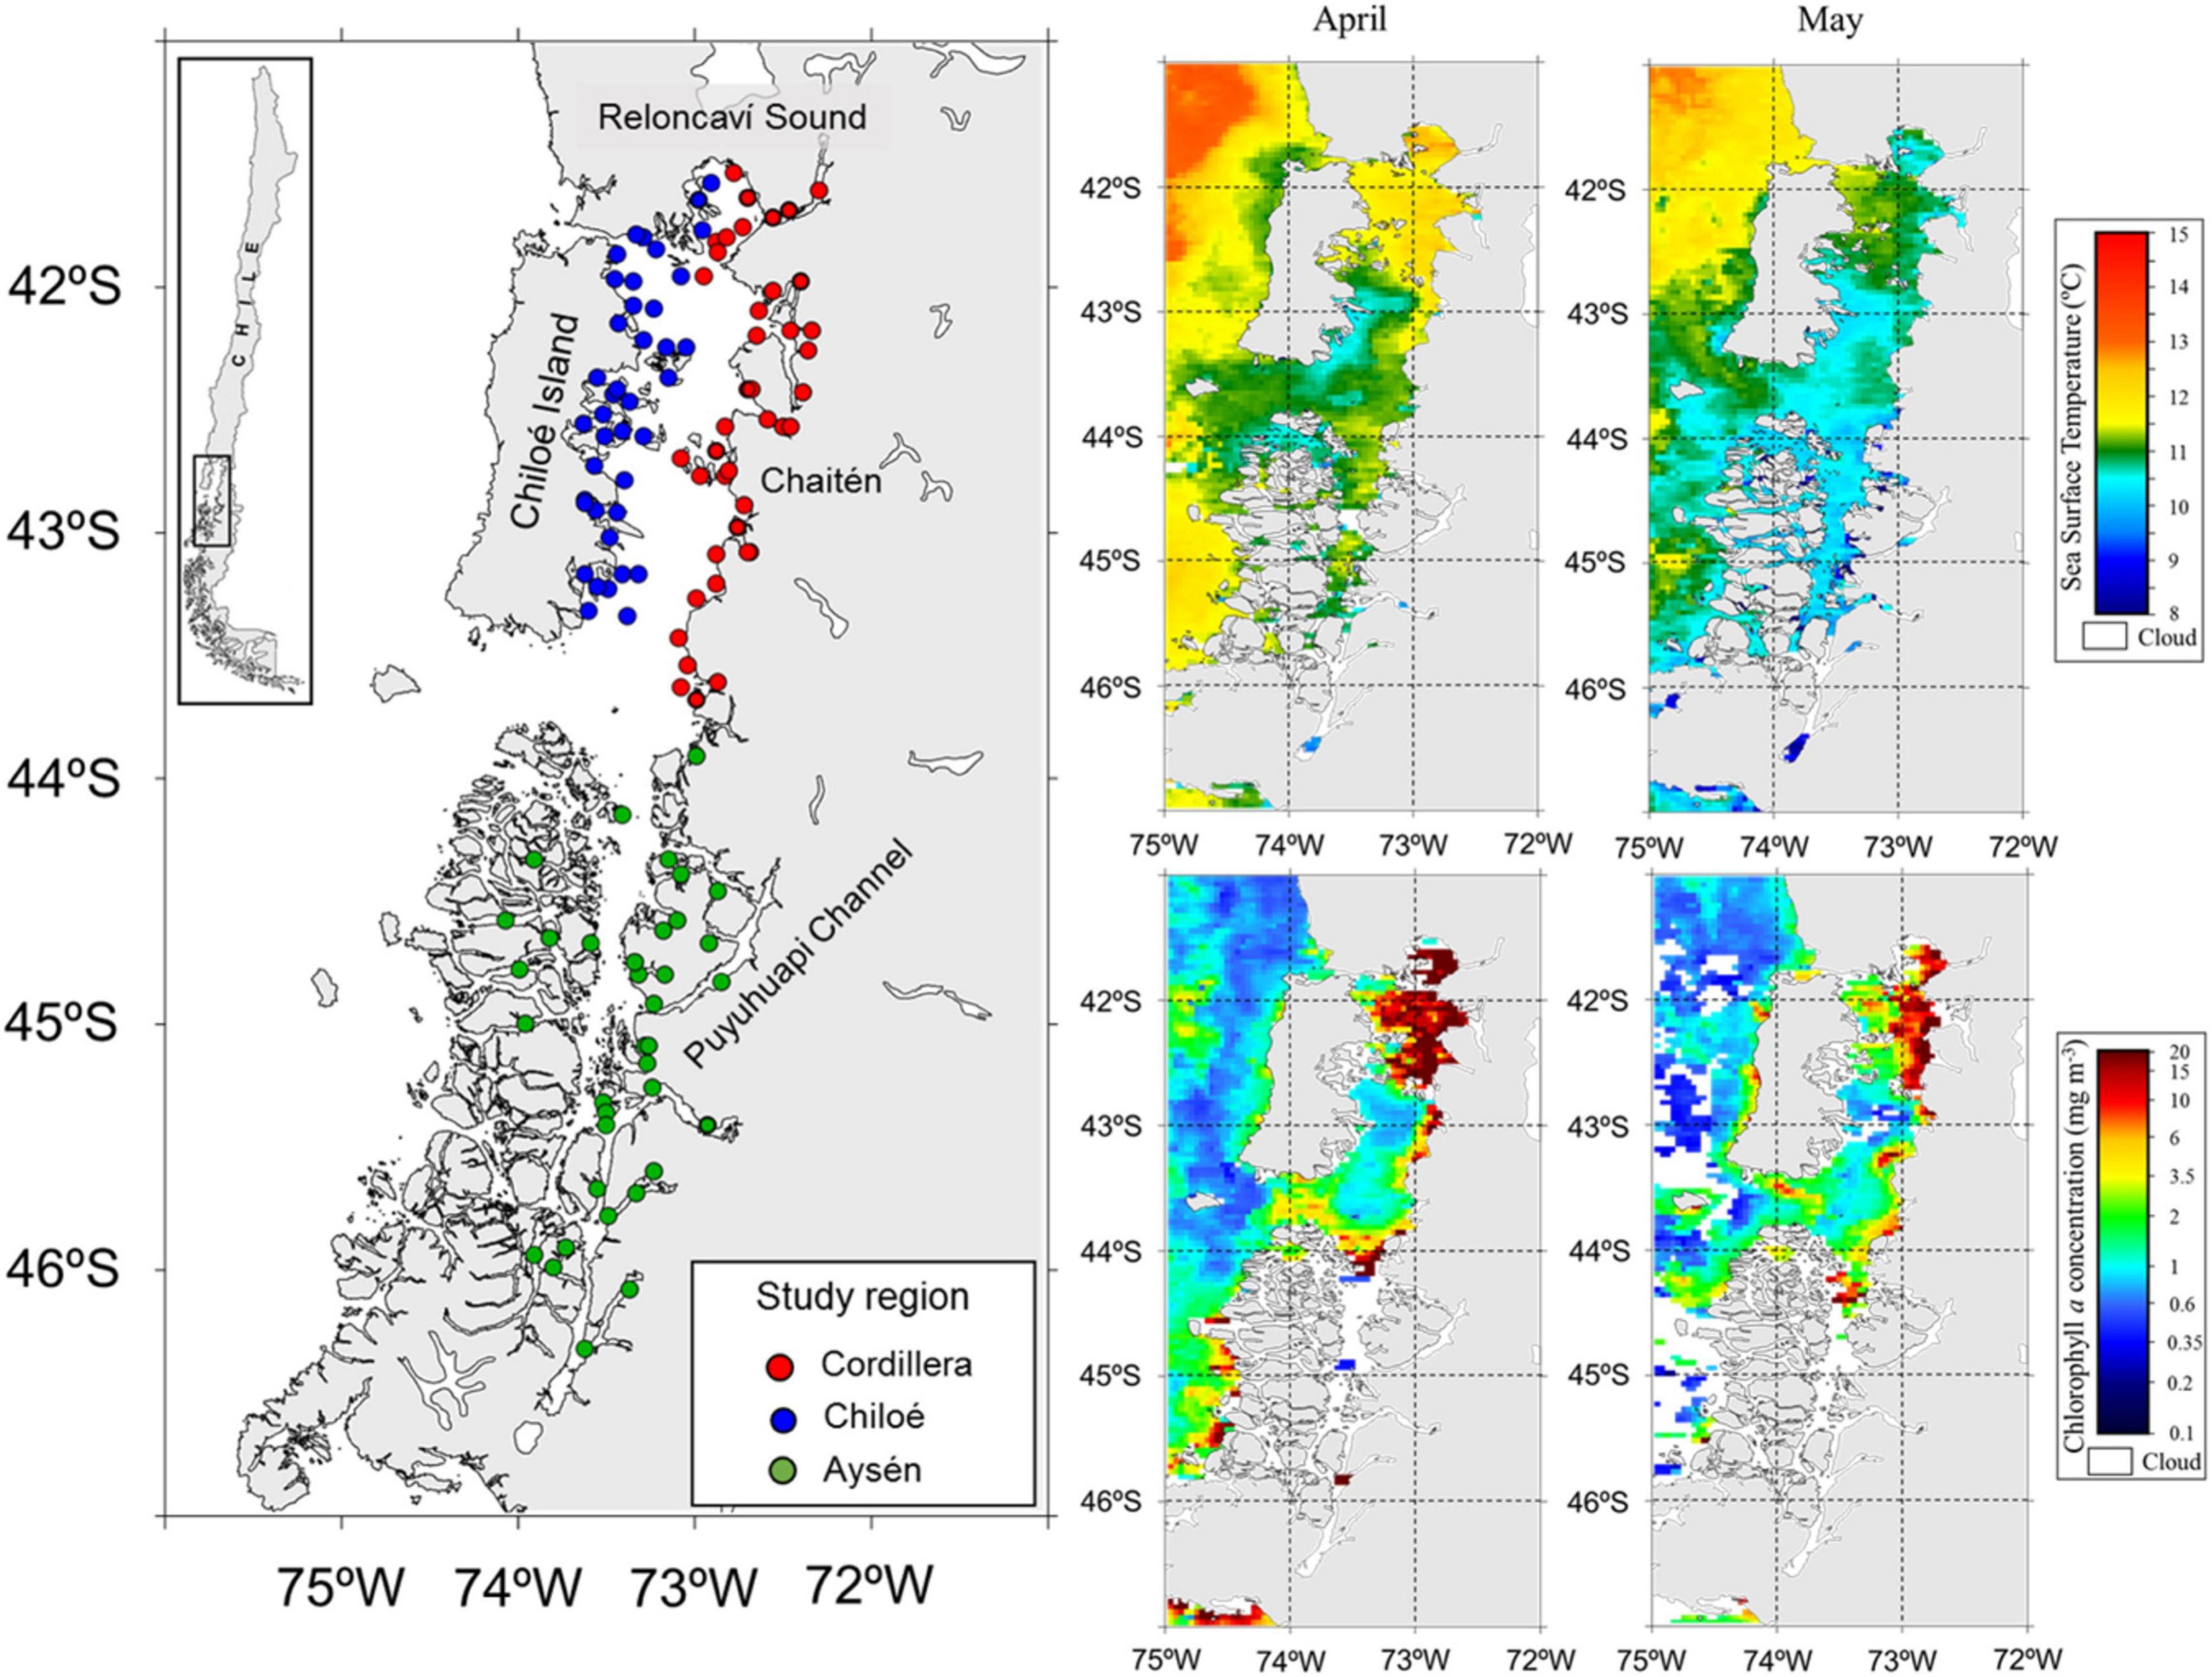
Figure 2. Study area (left panel) in Northern Chilean Patagonia with zooplankton sampling stations in the three regions during cruises in April and May 2019. On the right, satellite images showing the sea surface temperature (°C, top) and chlorophyll a concentration (mg m–3, bottom) during the sampling period from April to May 2019. Source: http://oceancolor.gsfc.nasa.gov.
Fish and Zooplankton Collection
We divided our study area into three regions, Cordillera: the continental side of the Sea of Chiloé (41°30′S to 43°55′S), Chiloé: the island side of the Sea of Chiloé, and Aysén: the fjord region to the South of the Sea of Chiloé (43°55′S to 46°20′S) (Figure 2).
The zooplankton and fish samples were collected during two simultaneous cruises in April–May 2019. The Cordillera (41 zooplankton stations) and Chiloé (40 zooplankton stations) region were sampled from April 10th to April 29th (Table 1). The Aysén region (37 zooplankton stations) was sampled from April 11th to May 25th. The samples were collected using a vertical conical plankton net (0.25 m2) with a 300 μm mesh, from 0 to 100 m depth. The samples were fixed in a 10% formalin solution onboard. Additional zooplankton samples were collected at the three regions, sieved and immediately frozen for stable isotope analyses. CTD casts (Seabird 25) from 0 to 100 m deep were made at every station in the three regions. In addition, we obtained satellite images of sea surface temperature and sea surface chlorophyll a from the MODIS-Aqua satellite1 averaged for April and May 2019.
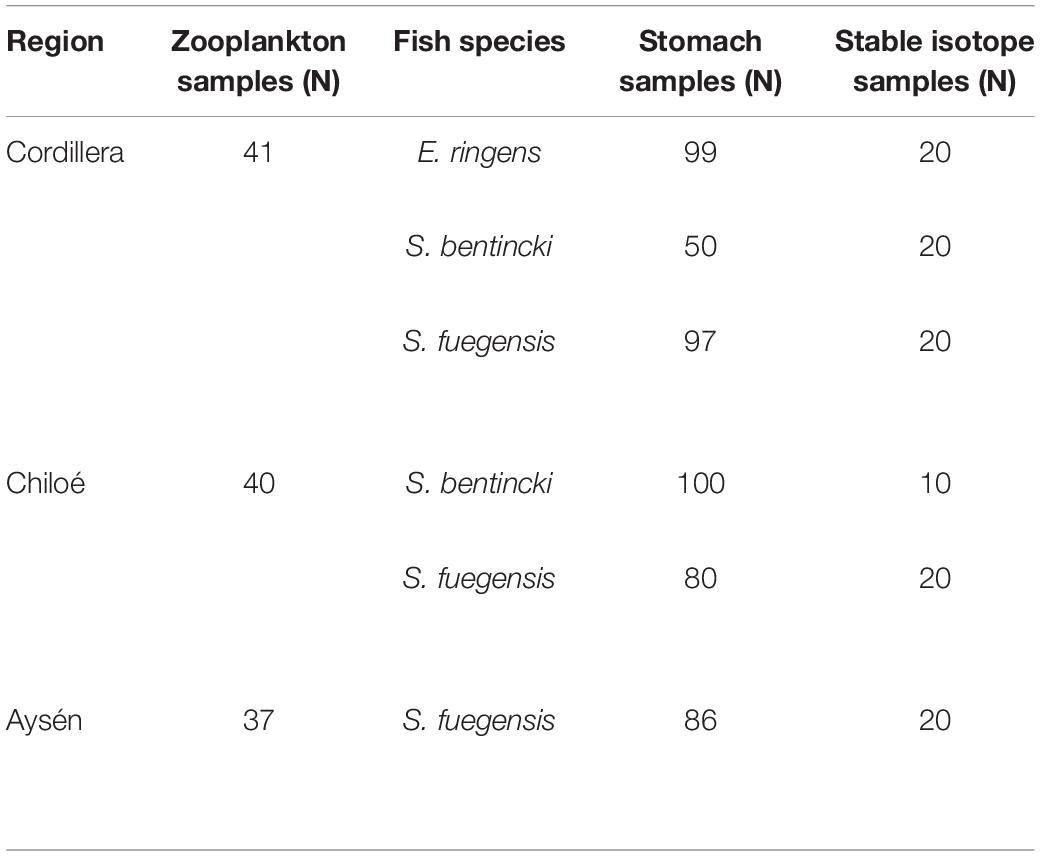
Table 1. Number of zooplankton samples collected per region, and number of fish used for stomach content and stable isotope analyses per region and species.
The fish used for the stable isotope and stomach content analyses were collected during the same cruises with purse seines. There were 13 fish stations in Cordillera, 10 in Chiloé, and 11 in Aysén. In Cordillera, all three fish species (Sprattus fuegensis, Strangomera bentincki, and Engraulis ringens) were found, with 55% of stations containing a mixture of species. S. fuegensis comprised the entire catch at 5 stations and E. ringens comprised the entire catch at 1 station. The catch in the Chiloé region was mixed between S. fuegensis and S. bentincki for 90% of the stations, and in Aysén, the catch was almost exclusively S. fuegensis.
Lab Analysis
Zooplankton
The individuals from the formalin preserved zooplankton samples were identified to lowest possible taxonomical group (genus or family) and counted under a stereoscopic microscope at the Laboratorio de Oceanografía Pesquera y Ecología Larval (LOPEL) at the Universidad de Concepción. The copepods were classified by size as “small”: <1mm and “large”:> 1mm prosome length. Abundances were standardized as number of individuals × 10 m–3.
Fishes
Stable Isotopes
We sampled a small piece of dorsal muscle tissue from individuals of the three small pelagic fishes for the stable isotope analysis (Table 1). We chose fish from two stations per region (when available) to give us the maximal spatial coverage for that region. We selected the individuals so that they covered the size range for the station in 0.5 cm increments. The tissue samples were dried at 60°C for 48 h. We then packed 1.5 mg pieces in tin capsules for the stable isotope analysis, with triplicate samples per individual. The samples were analyzed for carbon and nitrogen stable isotopes at University of California Davis by continuous flow isotope ratio mass spectrometry (20–20 mass spectrometer, PDZ Europa) after sample combustion to CO2 and N2 at 1000°C in an on-line elemental analyzer (PDZ Europa ANCA-GSL). Precision was 0.2‰ and 0.3‰ for δ13C and δ15N.
Differences in δ15N are frequently used to indicate variations in prey items, but these differences can also be caused by isotopic shifts in habitat. The feeding depth of the fish overlapped in some species/regions combinations (i.e., S. fuegensis and S. bentincki in Cordillera), but not all (see Supplementary Table 4 for descriptions of fish school depths). We interpreted these δ15N differences as differences in diet, which we supported through the gut content analysis. However, for certain species/region comparisons, differences in δ15N could be also attributed to habitat partitioning.
Stomach Contents
A total of 301 S. fuegensis, 150 S. bentincki, and 99 E. ringens individuals were collected for stomach content analyses from the three locations (Table 1). All fishes were measured for length and weighed. The stomachs were removed from the fish and dissected. The items in the stomachs were counted and identified to the lowest possible taxonomical group under a stereoscopic microscope at LOPEL. We did not include phytoplankton in our analysis as it is usually a negligible contributor to these fish’s dietary carbon (Espinoza and Bertrand, 2008; Espinoza et al., 2009). Even in cases where phytoplankton was found to be an important contributor to dietary carbon, such as in the sardine Sardina pilchardus off the Iberian coast, it was a major contributor during the spring and summer months when phytoplankton blooms occur (Garrido et al., 2008, 2015) and not in the autumn when this study took place. In addition, we did not distinguish between taxa at the species level, which means that we may not have detected nuances in the fish’s diet partitioning, especially between copepod species. The taxonomic groups were the same as for the zooplankton samples. We excluded fish with empty stomachs from the stomach content analyses. Only S. fuegensis were found with empty stomachs [n = 13 (13%) in Aysén, n = 22 (22%) in Chiloé, and n = 3 (3%) in Cordillera].
The distribution of E. ringens lengths was bimodal with sizes ranging between 92 and 160 mm (see Supplementary Figure 1 for length histograms). The limit between the two modes was at 120 mm, which matches values for age of maturity of acoustic surveys of anchoveta in the region (Aranis et al., 2012; Cubillos et al., 2015; Castillo et al., 2020). The S. fuegensis had individuals with lengths ranging from 42 to 155 mm. The S. bentincki were composed of individuals with lengths ranging from 63 to 103 mm.
Gill Rakers
We removed the gill rakers from the fish that were used for stable isotope samples and photographed them under a dissecting scope. We measured: the total gill raker length, the length of the five central spines, and the spaces between the five central spines. We used these results to expand the explanation for diet partitioning in the section “Discussion.”
Statistical Analysis
Stable Isotope Analysis
Stable isotopes were expressed in delta (δ) notation, defined as the parts per thousand (‰) that deviate from a standard material (Pee Dee Belemnita for δ13C and atmospheric nitrogen for δ15N) according to:
where X = 13C or 15N, and R = 13C/12C or 15N/14N (Peterson and Fry, 1987). A correction to the δ13C due to lipid content was made to fish isotopes values following Kiljunen et al. (2006).
We averaged the triplicate value for each individual. We used linear models to make pairwise comparisons the isotopic composition between species and regions, with fish length as a covariate.
Zooplankton Community Indices
We characterized the abundance and the diversity of the zooplankton by region to estimate the differences in prey availability for the three fish by region. We used the following metrics to describe the zooplankton community, both in the environment (see Supplementary Table 1) and in fish stomachs:
Percent abundance:
where Nj is the number of individuals in zooplankton taxon j and Ny is the total number of individuals in region or stomach y.
Alpha and Beta Diversity
We examined the alpha diversity, or diversity of taxa within a sample, either in a water sample or fish stomach. We used two alpha diversity metrics: the number of taxa within a sample (Ntaxa) and the Shannon-Weaver index of diversity (H′):
where Ntaxa is the total number of taxa in a fish stomach or water sample and pi is the percent abundance of taxa i.
We also assessed the beta diversity of zooplankton samples in both regions and fish stomachs. Beta diversity is a measure of the homogeneity of variances among samples. We examined the beta diversity of zooplankton assemblages using “betadisper” from the R package “vegan” (Oksanen et al., 2020). The test uses the Bray-Curtis dissimilarity as distances between samples, and determines how the distance of each sample varies from the group’s centroid, or central point (Anderson et al., 2006). The larger the mean distance to the centroid, the greater the group’s heterogeneity, or beta dispersion.
We used ANOVAs and post hoc Tukey tests to compare indicators of alpha diversity (Shannon-Weaver index and Ntaxa). We also used ANOVAs and post hoc Tukey tests to evaluate the betadisper models and compare variances of zooplankton samples between regions and fish groups.
Stomach Content Indices
To characterize dietary overlap between different fish species/region classes, we calculated Schoener’s percent similarity index (Schoener, 1970) index:
where pjk is the percentage overlap between diets of fish group j and fish group k; pij and pik are the proportions of prey I in the stomachs of fish groups j and k.
We calculated a selection index (Manly, 1993) to compare the fish’s preference for prey items between fish species and regions. The selection index is the proportion of an item in a fish’s stomach divided by the proportion of the item in the environment. We normalized the selection index so that it was bounded by 0 and 1 instead of 0 and infinity, which allows for easier interpretation:
where pRi is the mean proportion of taxa I in the region and pFi is the mean proportion of taxa I in the fish’s stomach. A selection index (Dnorm) above 0.5 indicates preference, a selection index less than 0.5 indicates avoidance. We also assigned the category of medium preference to items with a selection index > 0.7, and high preference to items with a selection index > 0.8.
Note that since we calculated the zooplankton availability as an average for the region, we did not calculate the Schoener’s index and the selection index for individual fish, rather, we calculated these for the overall group using mean proportions of prey items for each group.
Multivariate Analyses
We examined which taxa contributed the most to difference in zooplankton assemblages between regions by using multivariate generalized linear models (mvGLMs), using the “manyglm” function from R package “mvabund” (Wang et al., 2020). These were fitted using a binomial distribution for multivariate abundances data. This function fits glms to each taxa separately but resamples the observations to accurately estimate error. To then identify which taxa contributed most to the difference between regions, we performed post hoc univariate tests with adjusted p-values corrected for performing the pairwise comparisons fitted to each taxa (Wang et al., 2012).
Results
Oceanographic Conditions and Zooplankton Prey Availability in the Three Regions
Differences in oceanographic condition were observed among regions (Kruskal–Wallis, p < 0.01, for all regional comparisons of oceanographic conditions, Figures 2, 3). The Cordillera region had the warmest waters on average (12.0 ± 0.47°C at 10 m depth), followed by the Chiloé region (11.6 ± 0.76°C at 10 m depth) and the Aysén region (11.3 ± 0.41°C at 10 m depth). The Aysén region, with the deepest channels in our study area and the highest influx of freshwater, had the lowest temperatures and salinity on average (30.6 ± 1.80 psu at 10 m depth), but the highest dissolved oxygen content (4.8 ± 0.44 ml/L at 10 m depth). The Chiloé region had the highest salinity on average (33 ± 33.1 psu at 10 m depth) and the lowest dissolved oxygen content (4.4 ± 0.60 ml/L at 10 m depth). The areas with the greatest chlorophyll a production were in the northernmost part of the study area in the Reloncaví Sound and in the Cordillera region (Figure 2).
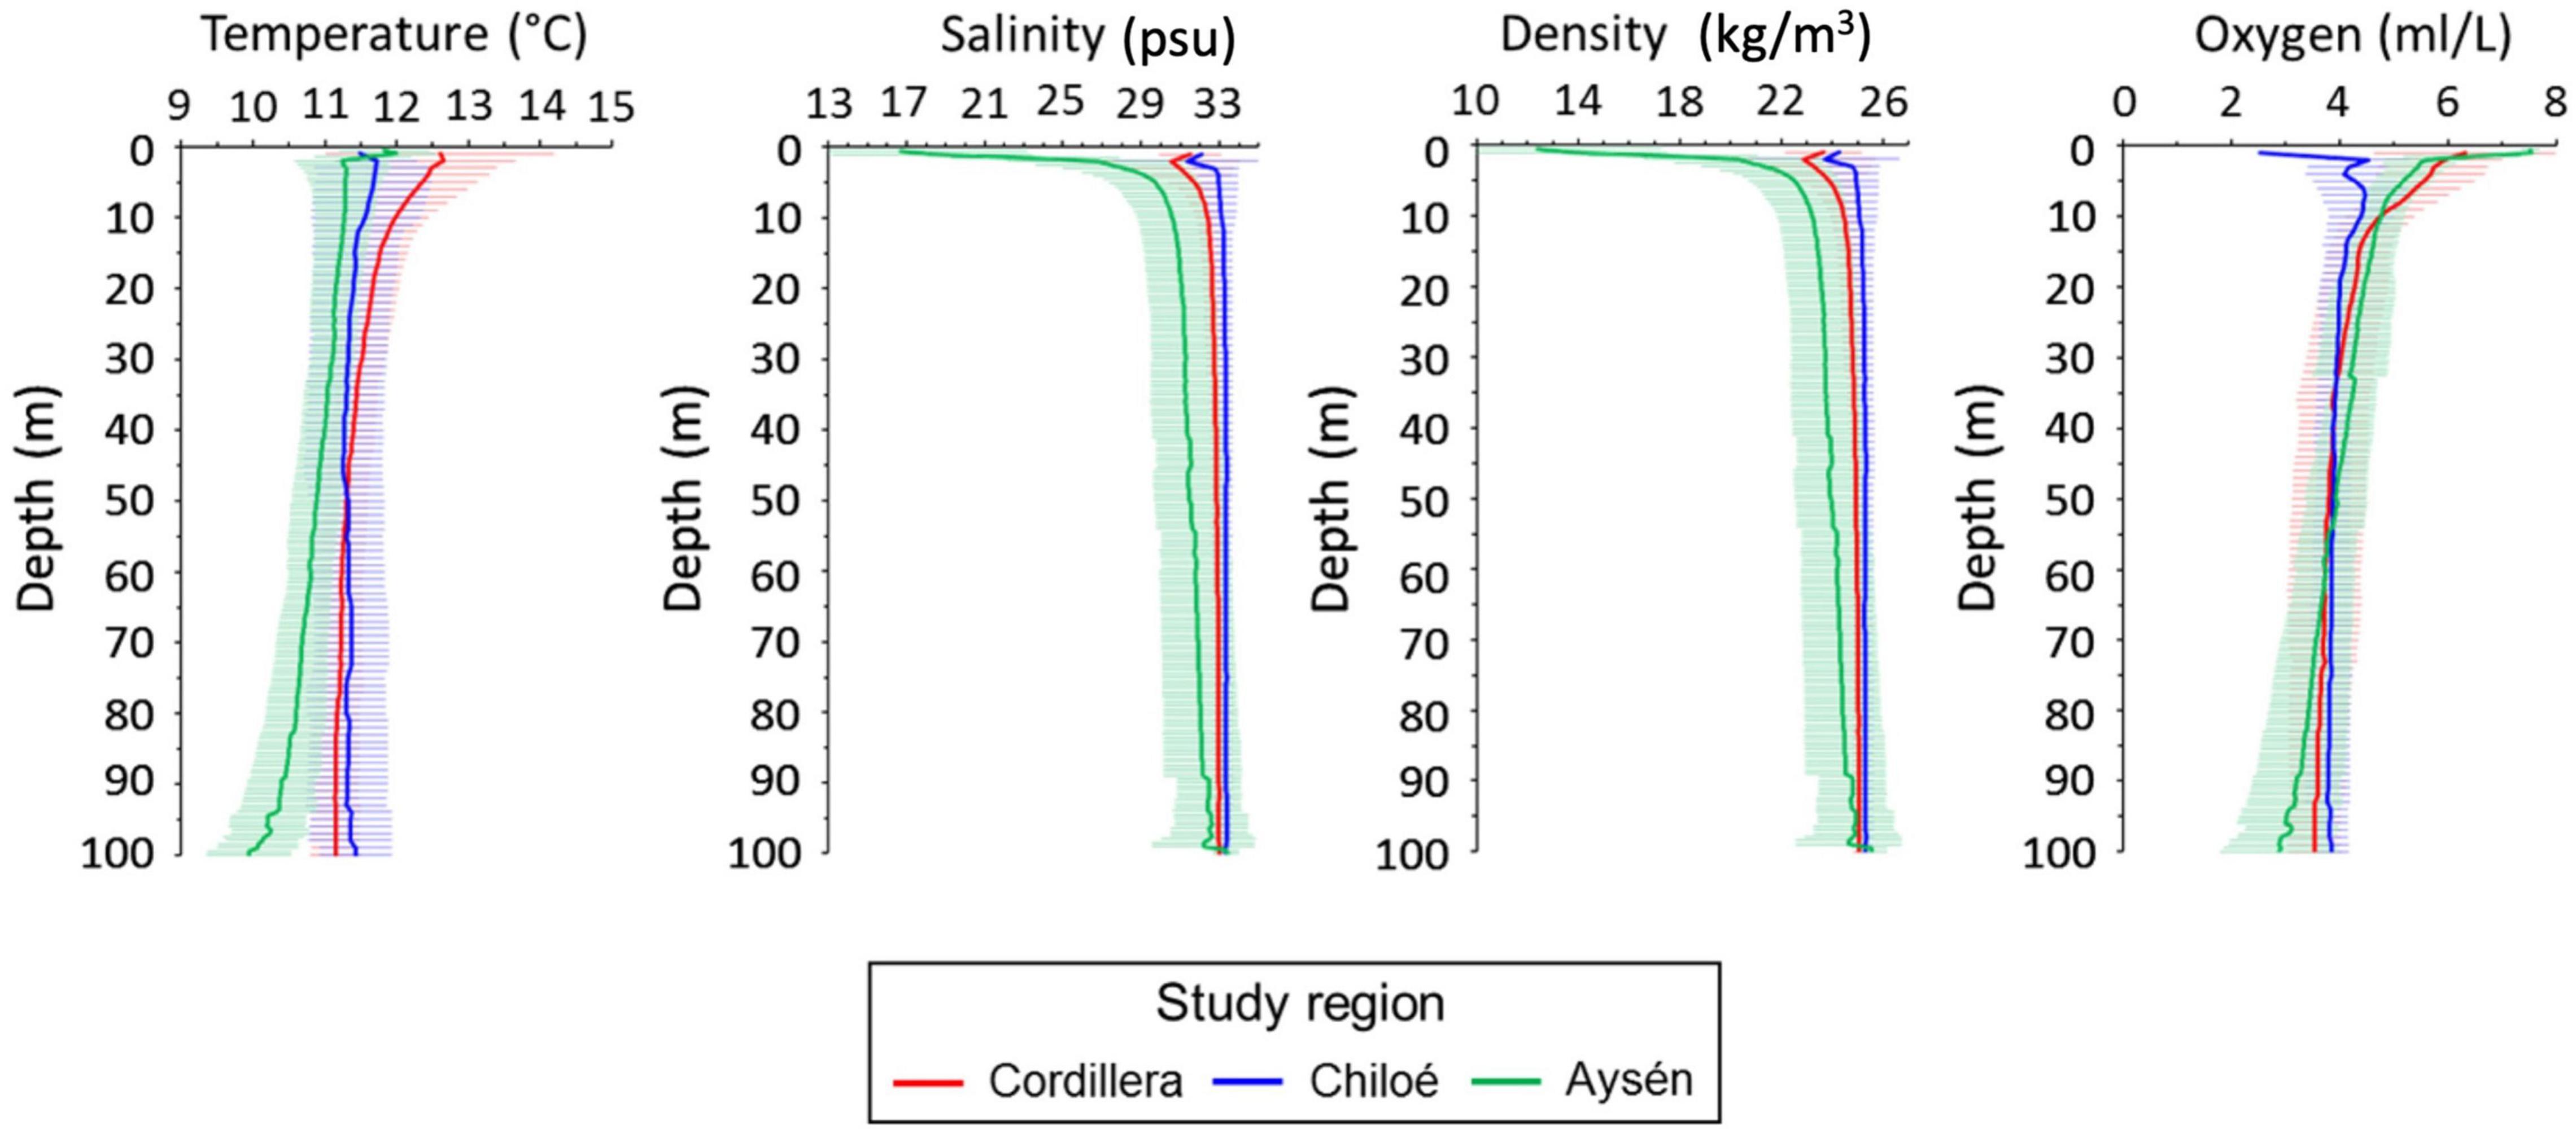
Figure 3. Mean profile and standard deviations (horizontal line) for temperature (°C), salinity (psu), density (kg/m3) and oxygen (ml/L) in the Cordillera region (red line), Chiloé (blue line), and Aysén (green line) during 2019.
Copepods were by far the most abundant taxonomical group, making up on average 45% of Cordillera samples, 55% of Chiloé samples, and 69% of Aysén samples (Figure 4). While the average overall copepod abundance was similar between regions (around 1000 per sample for Chiloé and Aysén and 1100 per sample for Cordillera), we observed differences between regions when copepods were broken up into large and small sizes (Figure 4). While the copepods in Aysén and Cordillera regions were split evenly between large and small sizes, the Chiloé region samples had 88% small copepods.
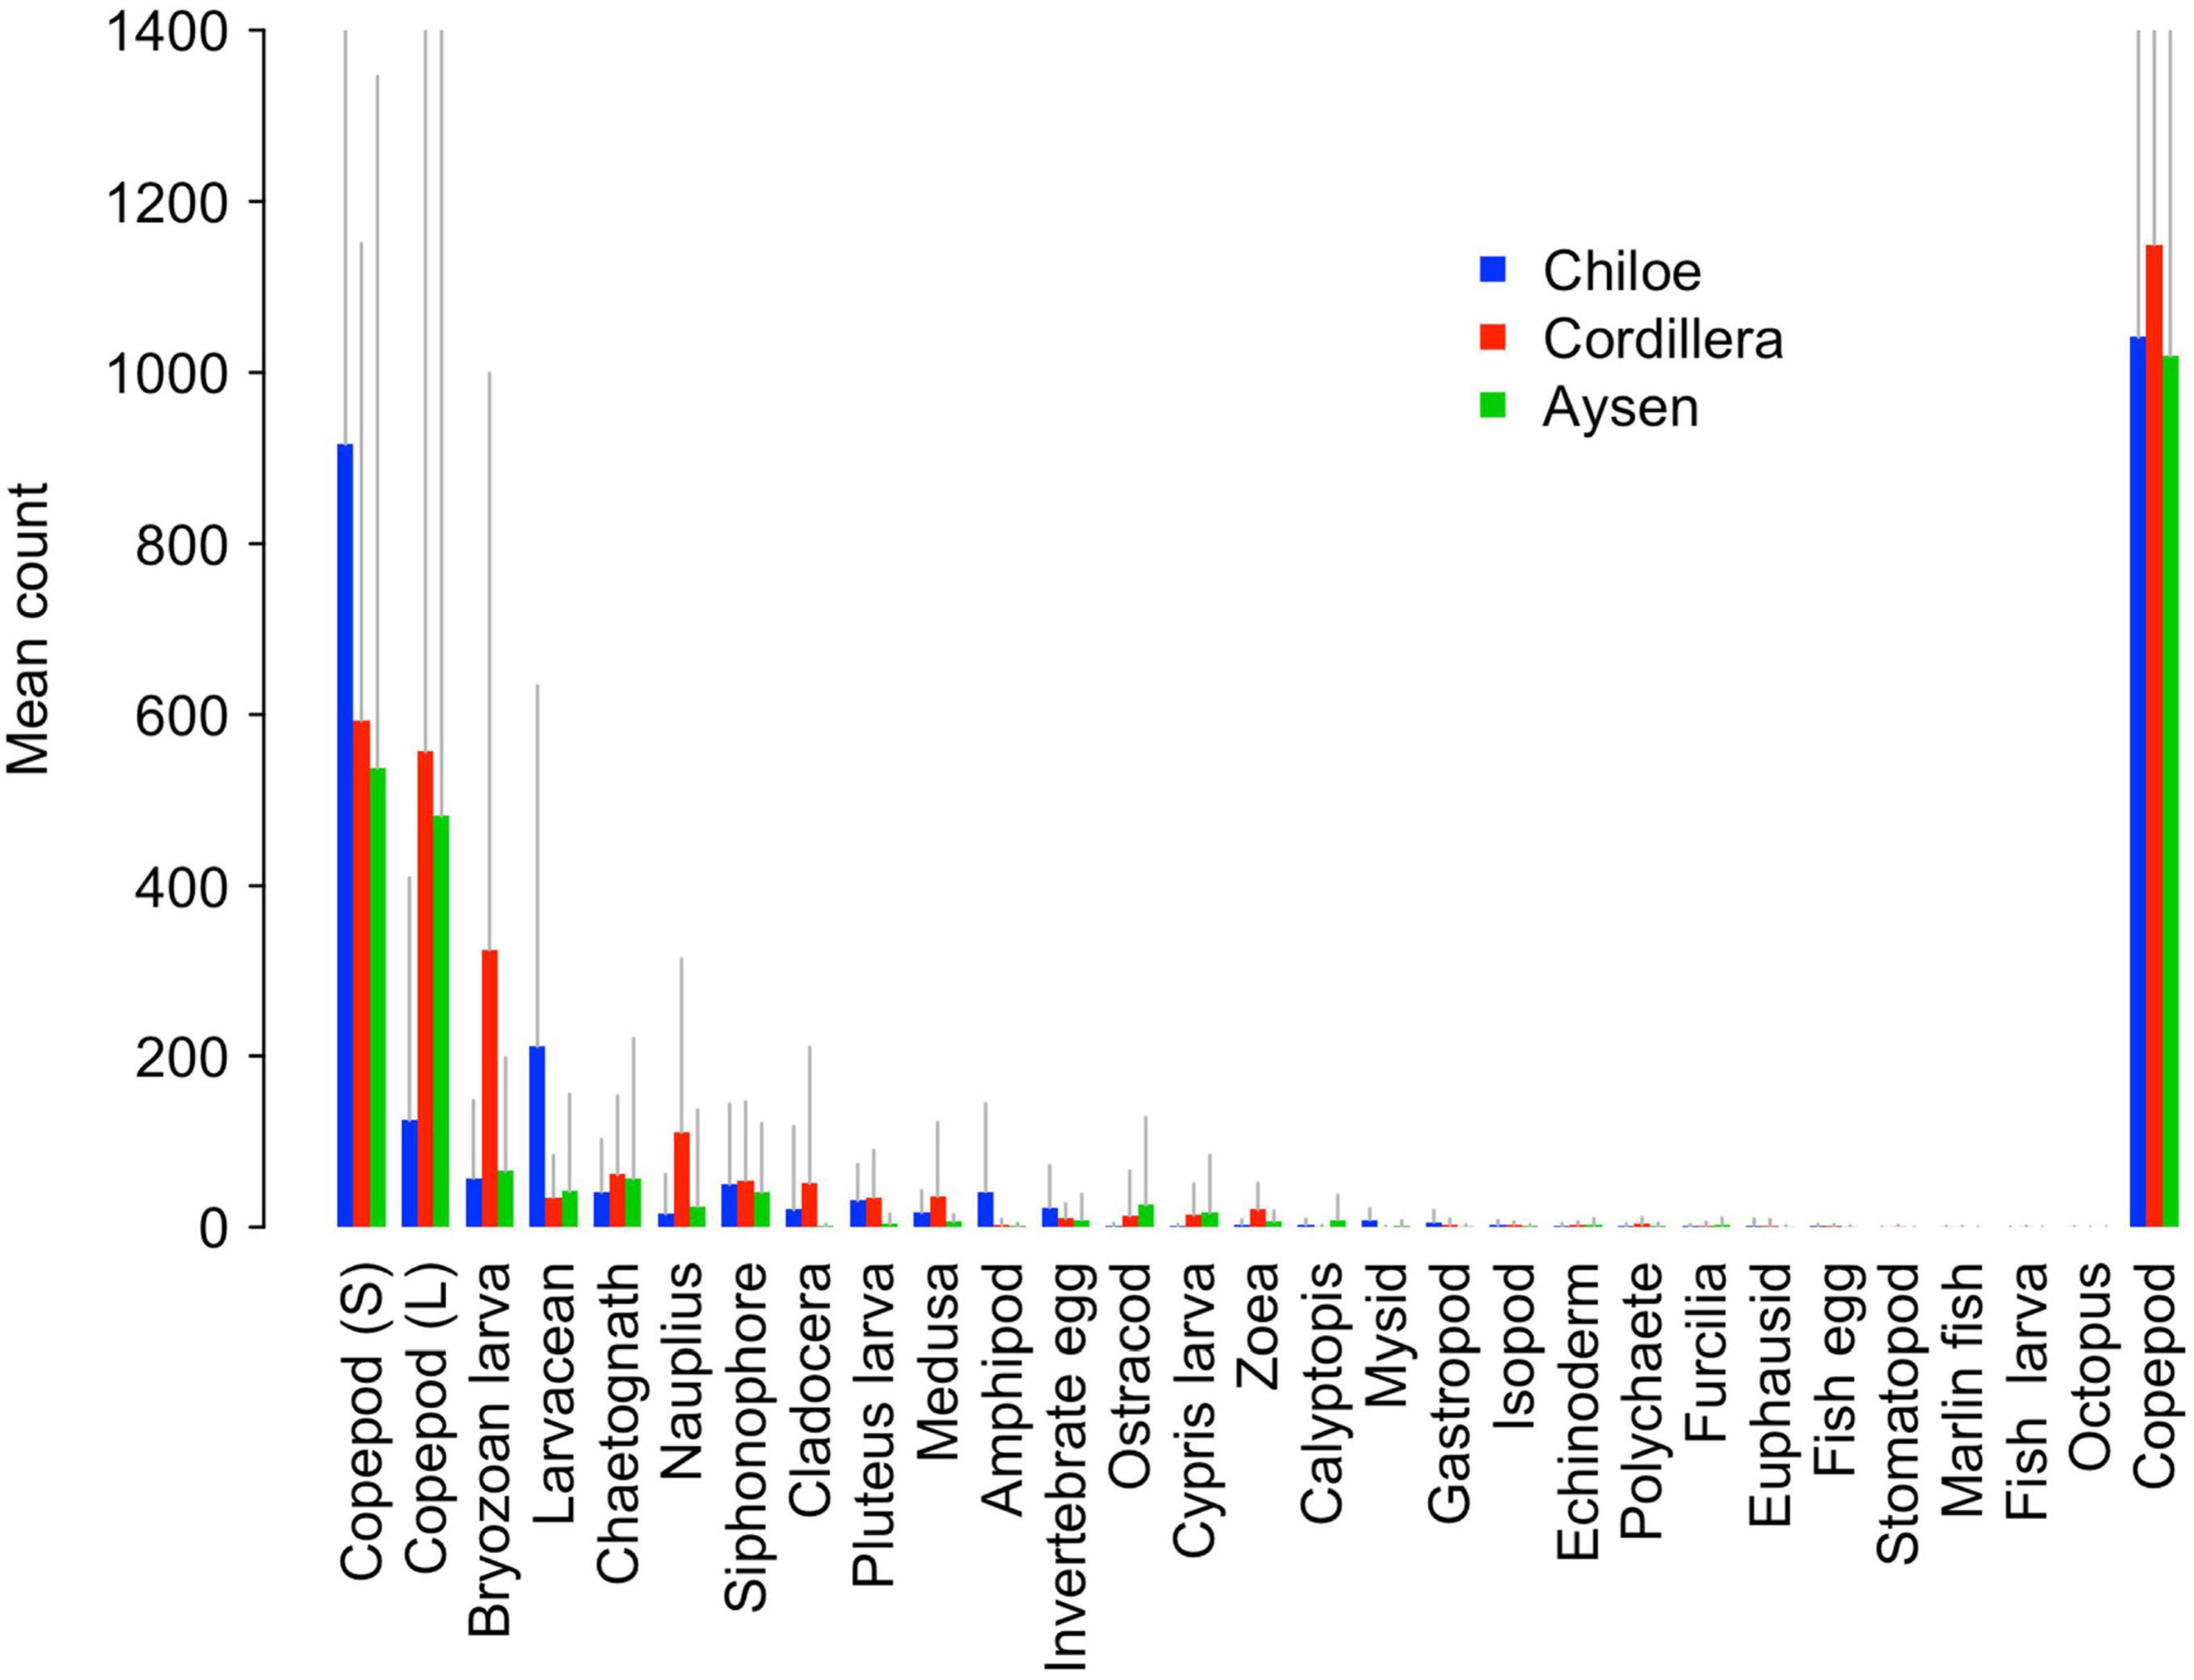
Figure 4. Barplot of mean counts of zooplankton in Cordillera (red), Chiloé (blue), and Aysén (green). Gray lines represent positive standard deviations. The copepod category on the far right represents the pooled value for large (L) and small (S) copepods.
The Cordillera region, which had the highest water temperature and chlorophyll-a concentration out of the three, had the largest average abundance of zooplankton, followed by the Chiloé and Aysén regions (Figure 4 and Supplementary Table 1). The Aysén region had significantly lower average number of taxa per site (Ntaxa = 8.8) than Chiloé and Cordillera (Ntaxa ∼12), F (2,115) = 15.11, p < 0.01, Tukey post hoc p < 0.01 for comparisons with Aysén. Aysén appeared to have lower taxonomic diversity (H′ = 1.17 ± 0.39) than Chiloé (H′ = 1.35 ± 0.35) and Cordillera (H′ = 1.39 ± 0.40). While the Aysén region was the most different from the other two in terms of alpha diversity, the Chiloé region was the most different in terms of beta diversity (Supplementary Table 2). The zooplankton assemblages of the Chiloé region were less variable than those of the Cordillera region while the Cordillera and Aysén region had similar variances among zooplankton assemblages (Supplementary Table 2).
The regions were significantly different from each other in terms of taxa abundances (Table 2). The taxa that drove the differences between the three regions were the bryozoan larvae, amphipods, larvaceans, pluteus larvae, and mysids (Table 2). They respectively explained, 15, 14, 11, and 8% of the total deviance (Table 2). The large copepods explained 3.5% of the deviance and the small ones 1.8%. Chiloé, besides having a lower abundance of large copepods than the other two regions, had significantly more larvaceans and amphipods, whereas Cordillera had significantly more bryozoan larvae, nauplius, and zoea (Figure 4 and Table 2).
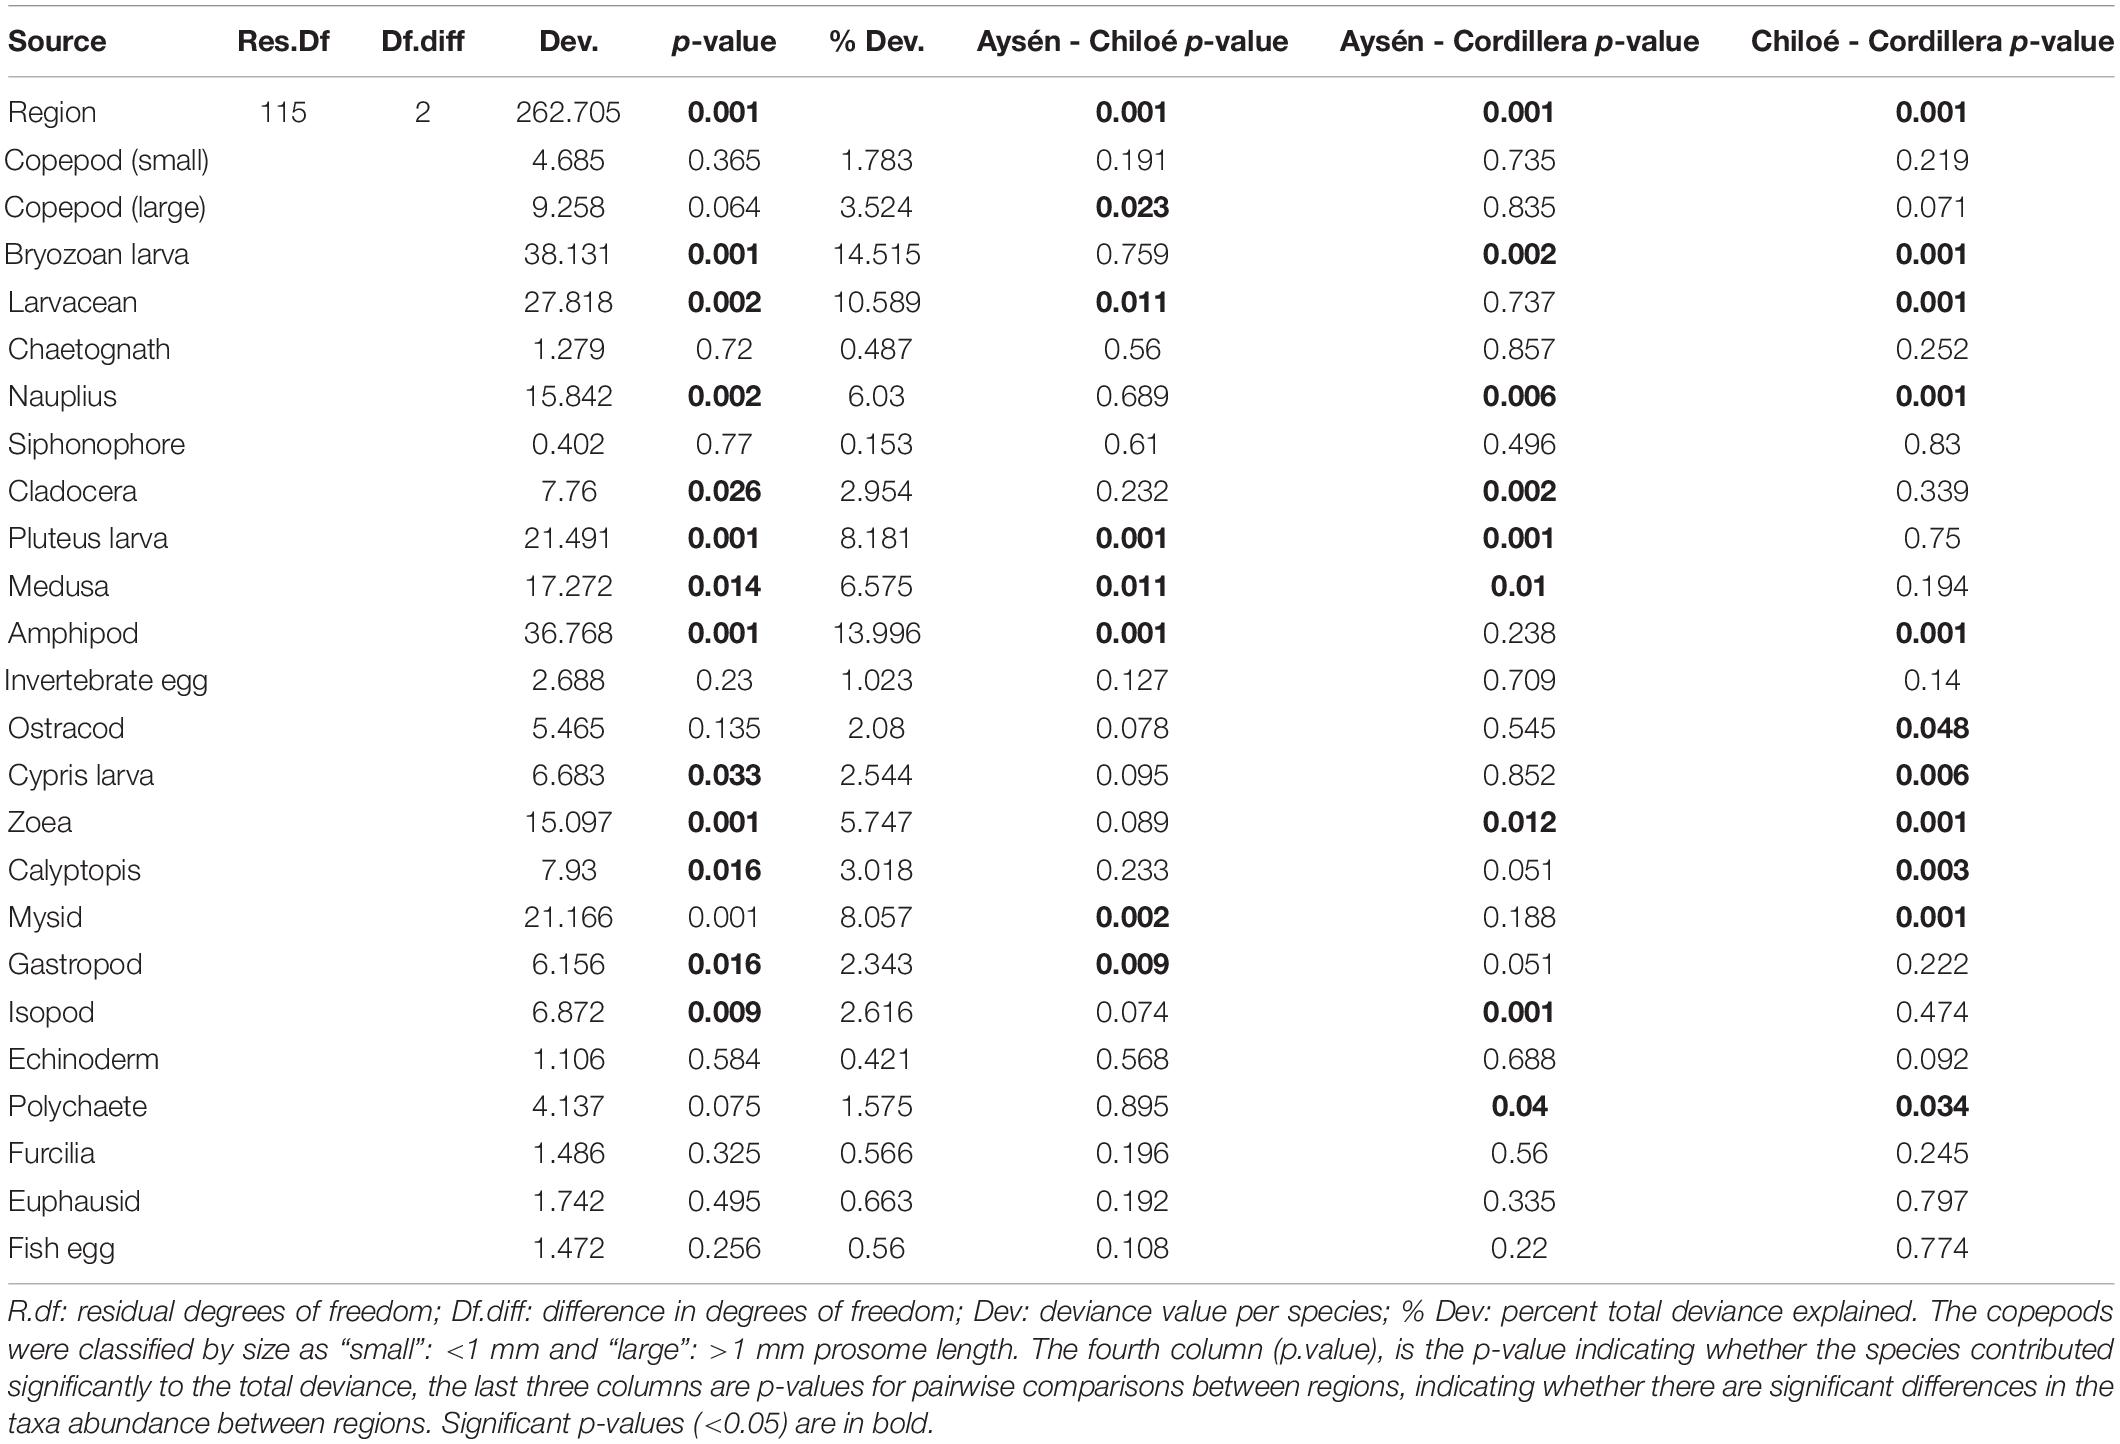
Table 2. Model results from multivariate zooplankton abundances comparison between the three regions.
Among Species Comparison of Diet in Cordillera
In Cordillera, the only region where all three fish species were found, the three species’ stomach contents were similar. All three fish species exhibited a similar mild preference for copepods (Supplementary Table 3), the most numerous item by far in both the fish stomachs and in the zooplankton community (Figures 4, 5). The three fish species also showed high selection for larvaceans (Figure 6). There was a high percent overlap between the diet of all three species (Schoener’s index > 70%, Table 4). Despite the high overlap, the E. ringens had a significantly greater number of taxa in their stomachs on average (Ntaxa = 6.65 ± 1.75) than the S. bentincki (Ntaxa = 5.26 ± 1.32) and S. fuegensis (Ntaxa = 5.31 ± 2.20), F(5, 506) = 18.97, p < 0.01, Tukey post hoc p < 0.01 (Tables 3, 4). In addition, the E. ringens had a high preference for four prey items (selection index > 0.8 for cladocerans, ostracods, larvaceans, and invertebrate eggs), whereas S. fuegensis and S. bentincki had a high preference only for two items or less (Figure 6 and Supplementary Table 3).
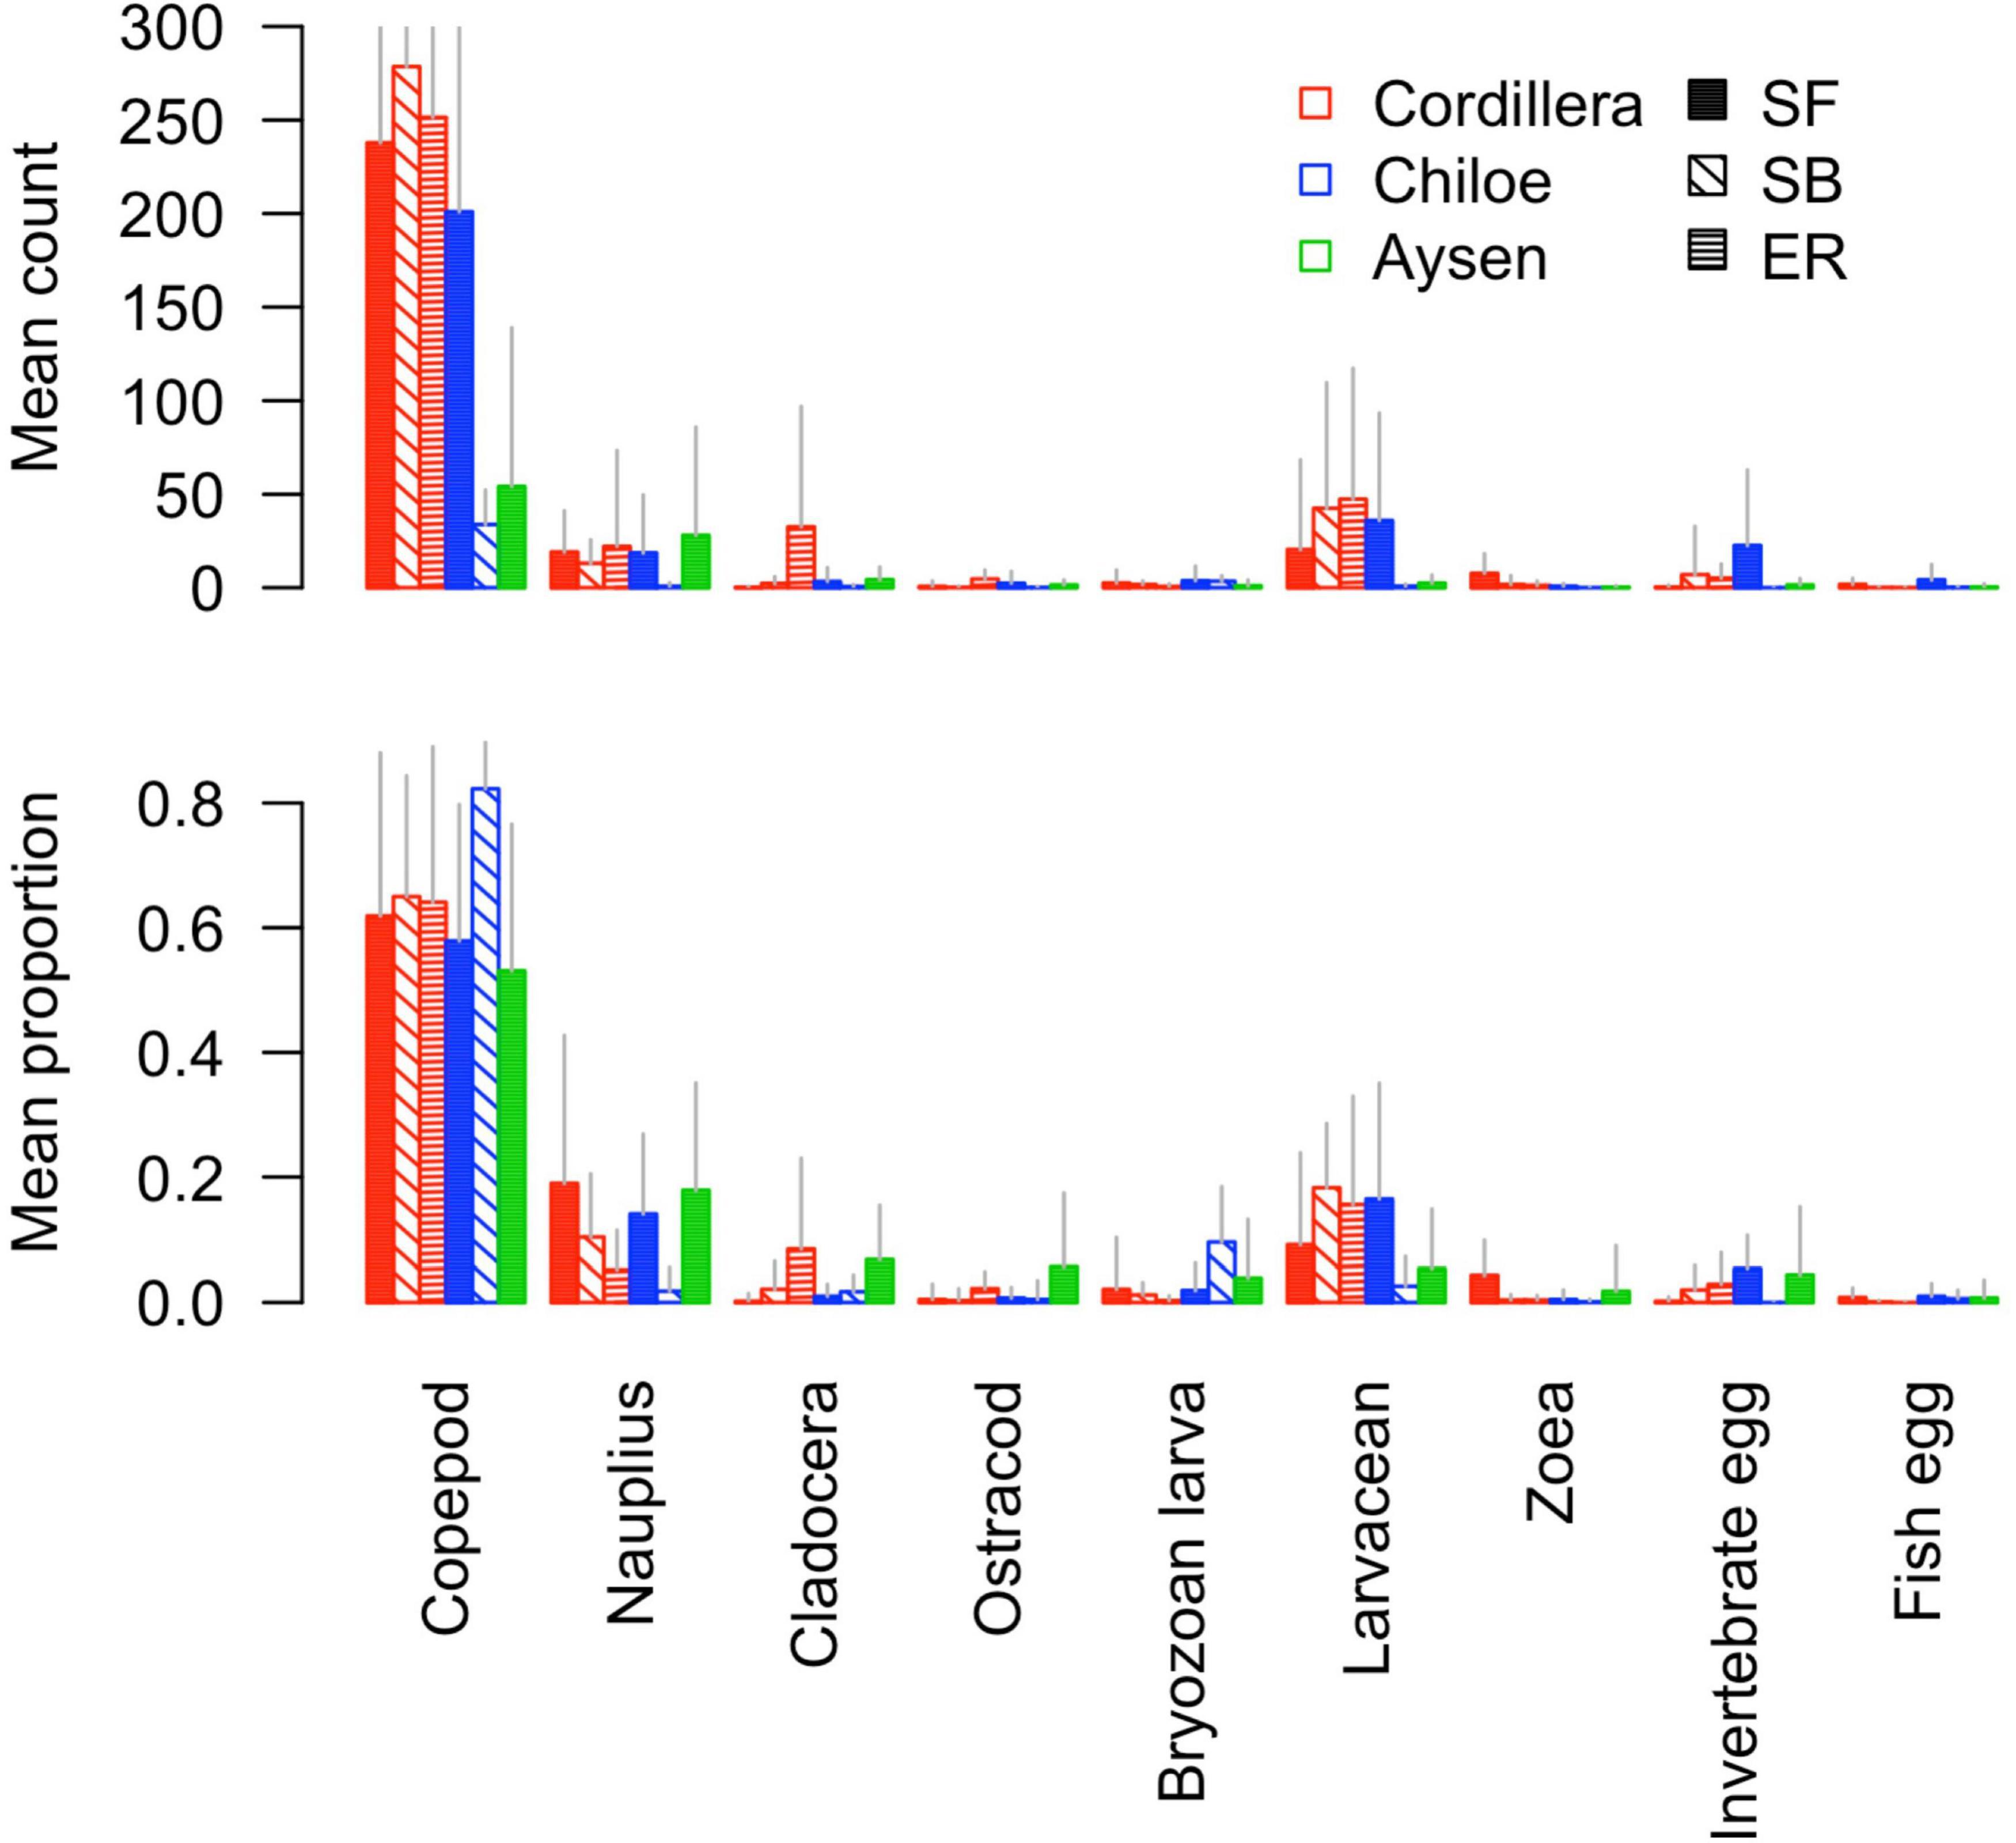
Figure 5. Barplot of the mean count and mean proportion of the nine most abundant taxa in stomach contents for each fish species-region combination.
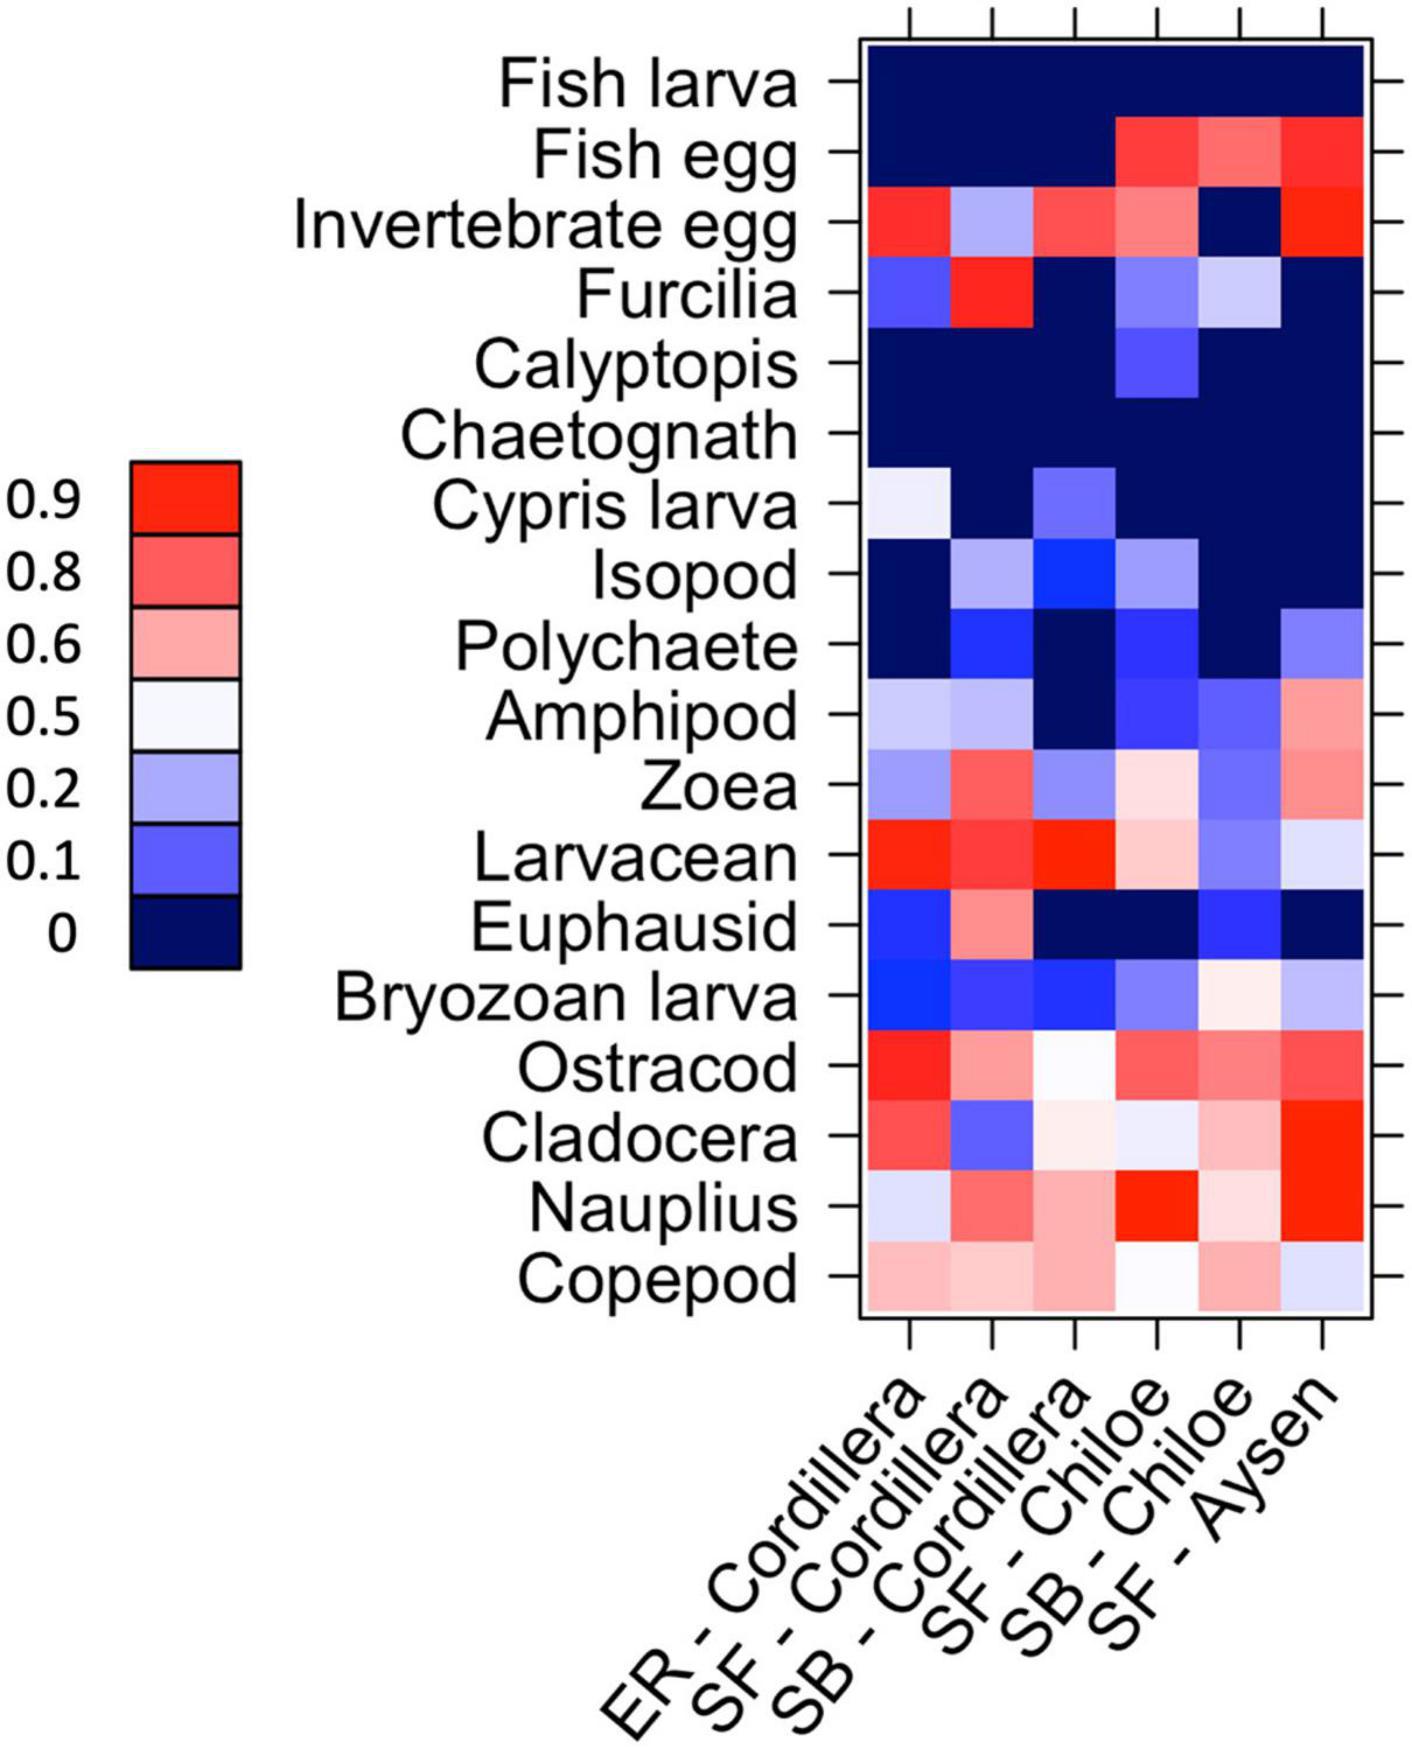
Figure 6. Heatmap of taxa preference for the species-region combinations. 0 < avoidance < 0.5 < preference. 0 values (dark blue) indicate that no individual of that zooplankton taxa was found in the fish’s stomach for that species-region combination. SF = S. fuegensis, SB = S. bentincki, ER = E. ringens.
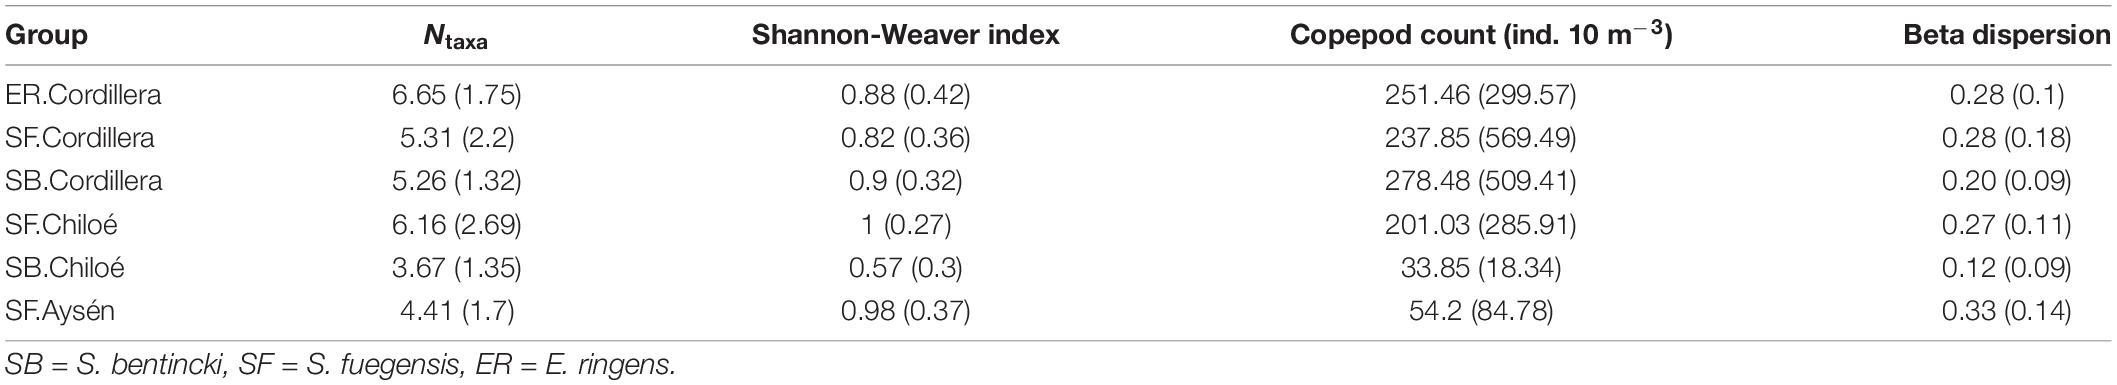
Table 3. Means (and standard deviations) for the alpha diversity (Ntaxa and Shannon-Weaver index), copepod count, and beta dispersion of stomach contents and copepod count (ind. 10 m–3) and species.region groups.
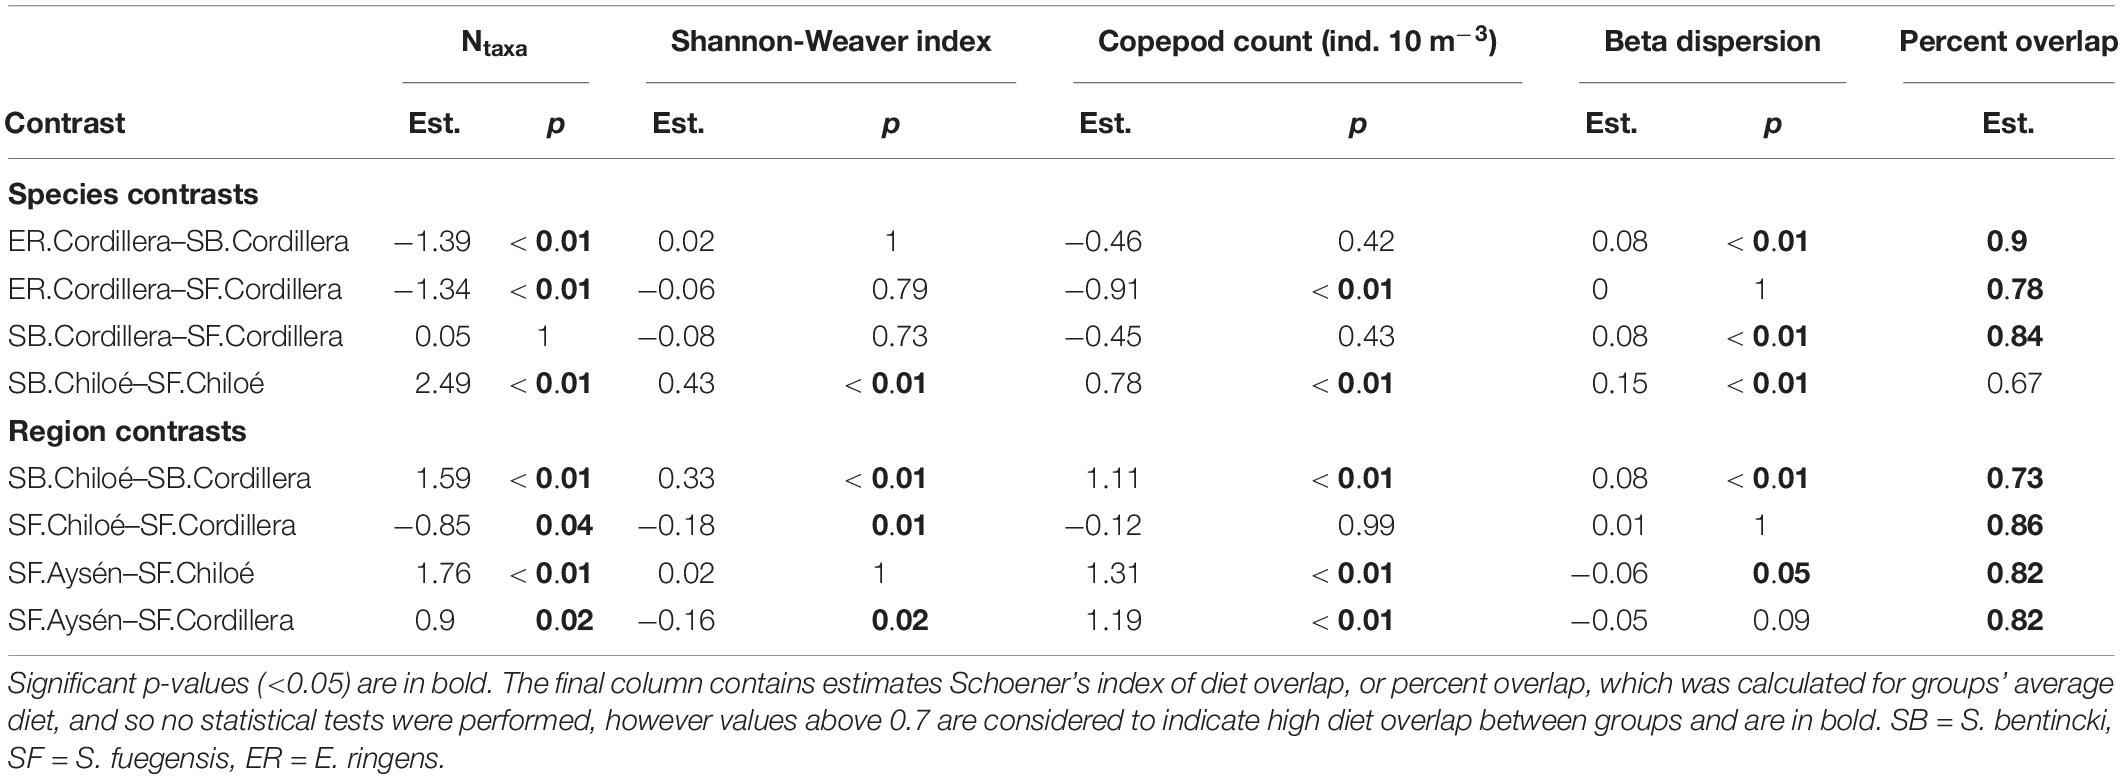
Table 4. Estimates (est.) and p-Values (p) from Tukey HSD post hoc tests for ANOVAs comparing alpha diversity (Ntaxa and Shannon-Weaver index), copepod count and beta dispersion of stomach contents by species.region groups.
The high overlap in the three species stomach contents were echoed in the longer-term stable isotope data (Figure 7 and Tables 5, 6) that showed very narrow range of variation in both δ15N (13.4‰ to 14.4‰) and δ13C (–16.0‰ to –15.1‰) mean values among species and regions. The δ15N values increased with size for all three species, except in the Chiloé region (Figure 7A). In Cordillera, E. ringens had higher δ15N values (14.4‰ ± 0.5) than S. fuegensis (14.3‰ ± 0.5, t = 2.59, p = 0.014) and marginally higher than S. bentincki (13.9‰ ± 0.3, t = 1.79, p = 0.082). The S. fuegensis and S. bentincki had similar δ15N values (t = 0.75, p = 0.46). This suggests that the medium E. ringens are at a slightly higher trophic level than those of the other two species (Figure 7A and Table 5). Finally, the S. bentincki had greater δ13C values than the other two species overall.
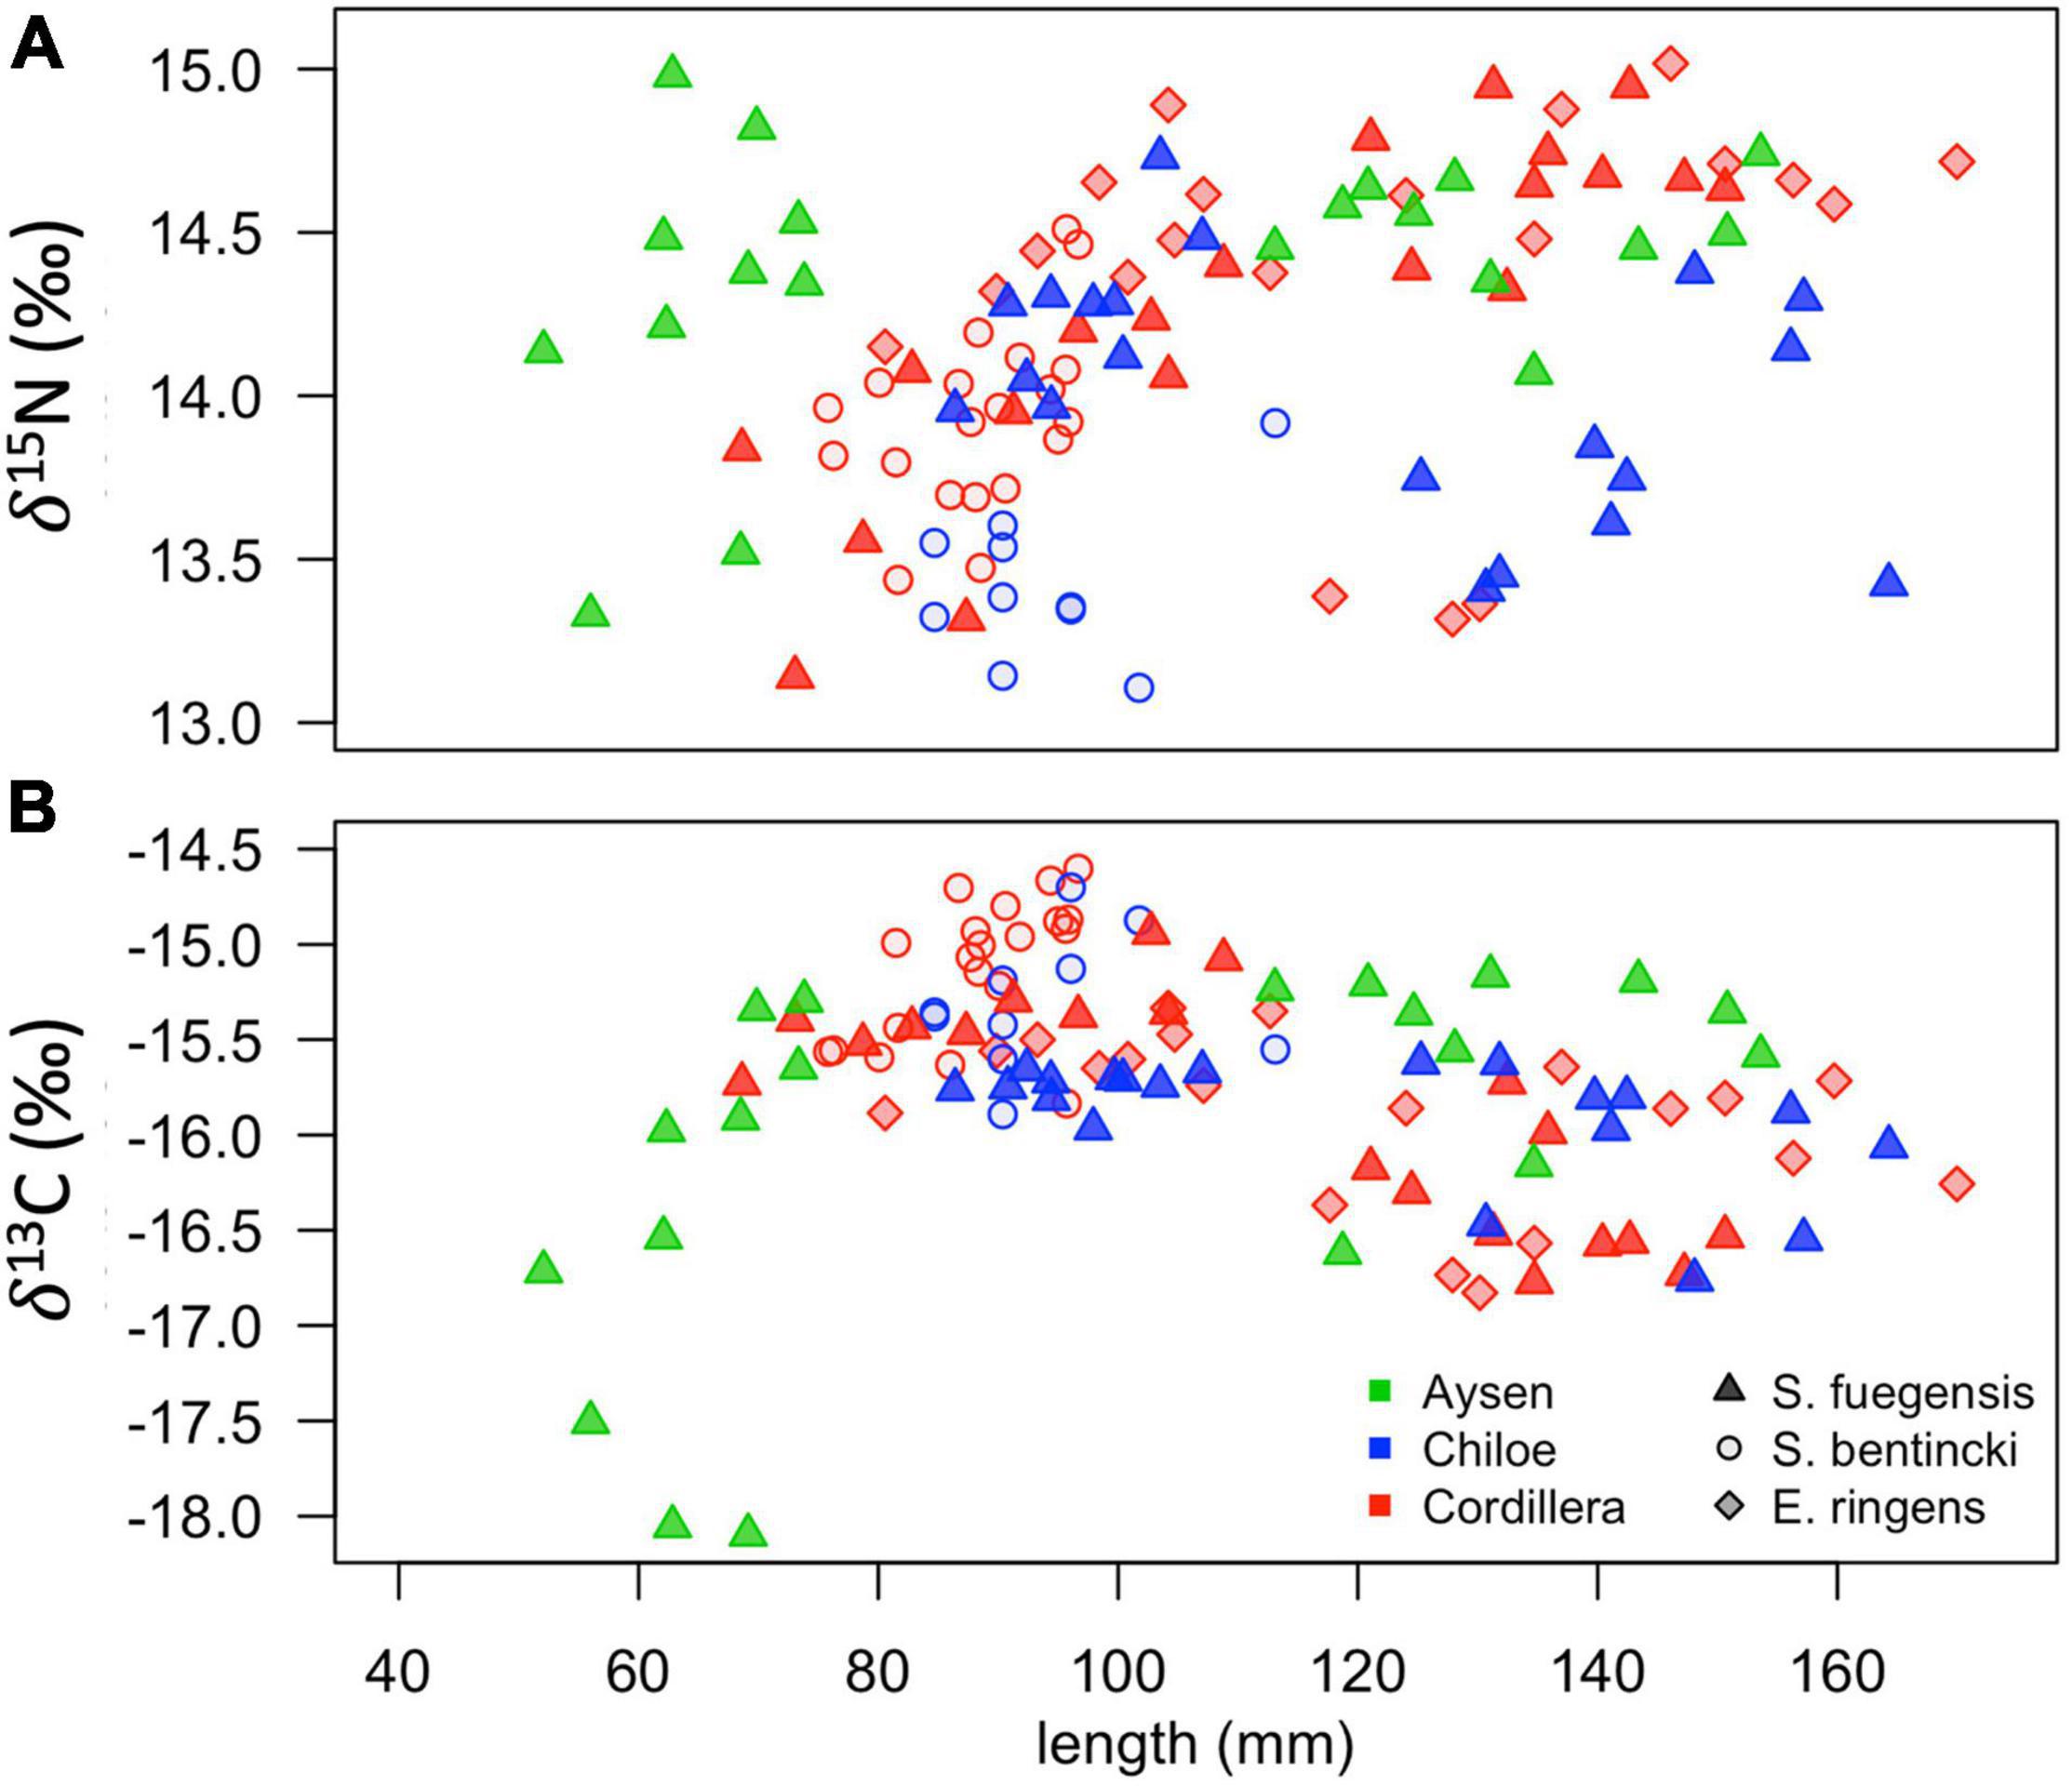
Figure 7. Scatterplots of δ15N (A) and δ13C (B) stable isotope values for fish in the different species-region combinations vs. their total length (mm).
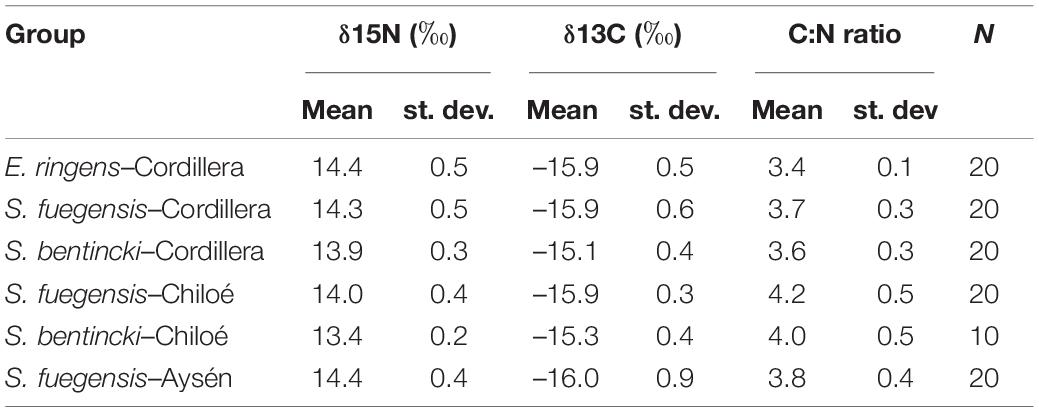
Table 5. Means, standard deviations (st. dev.), and number (N) of samples for δ15N (‰), δ13C (‰) and C:N ratios for species–region groups.
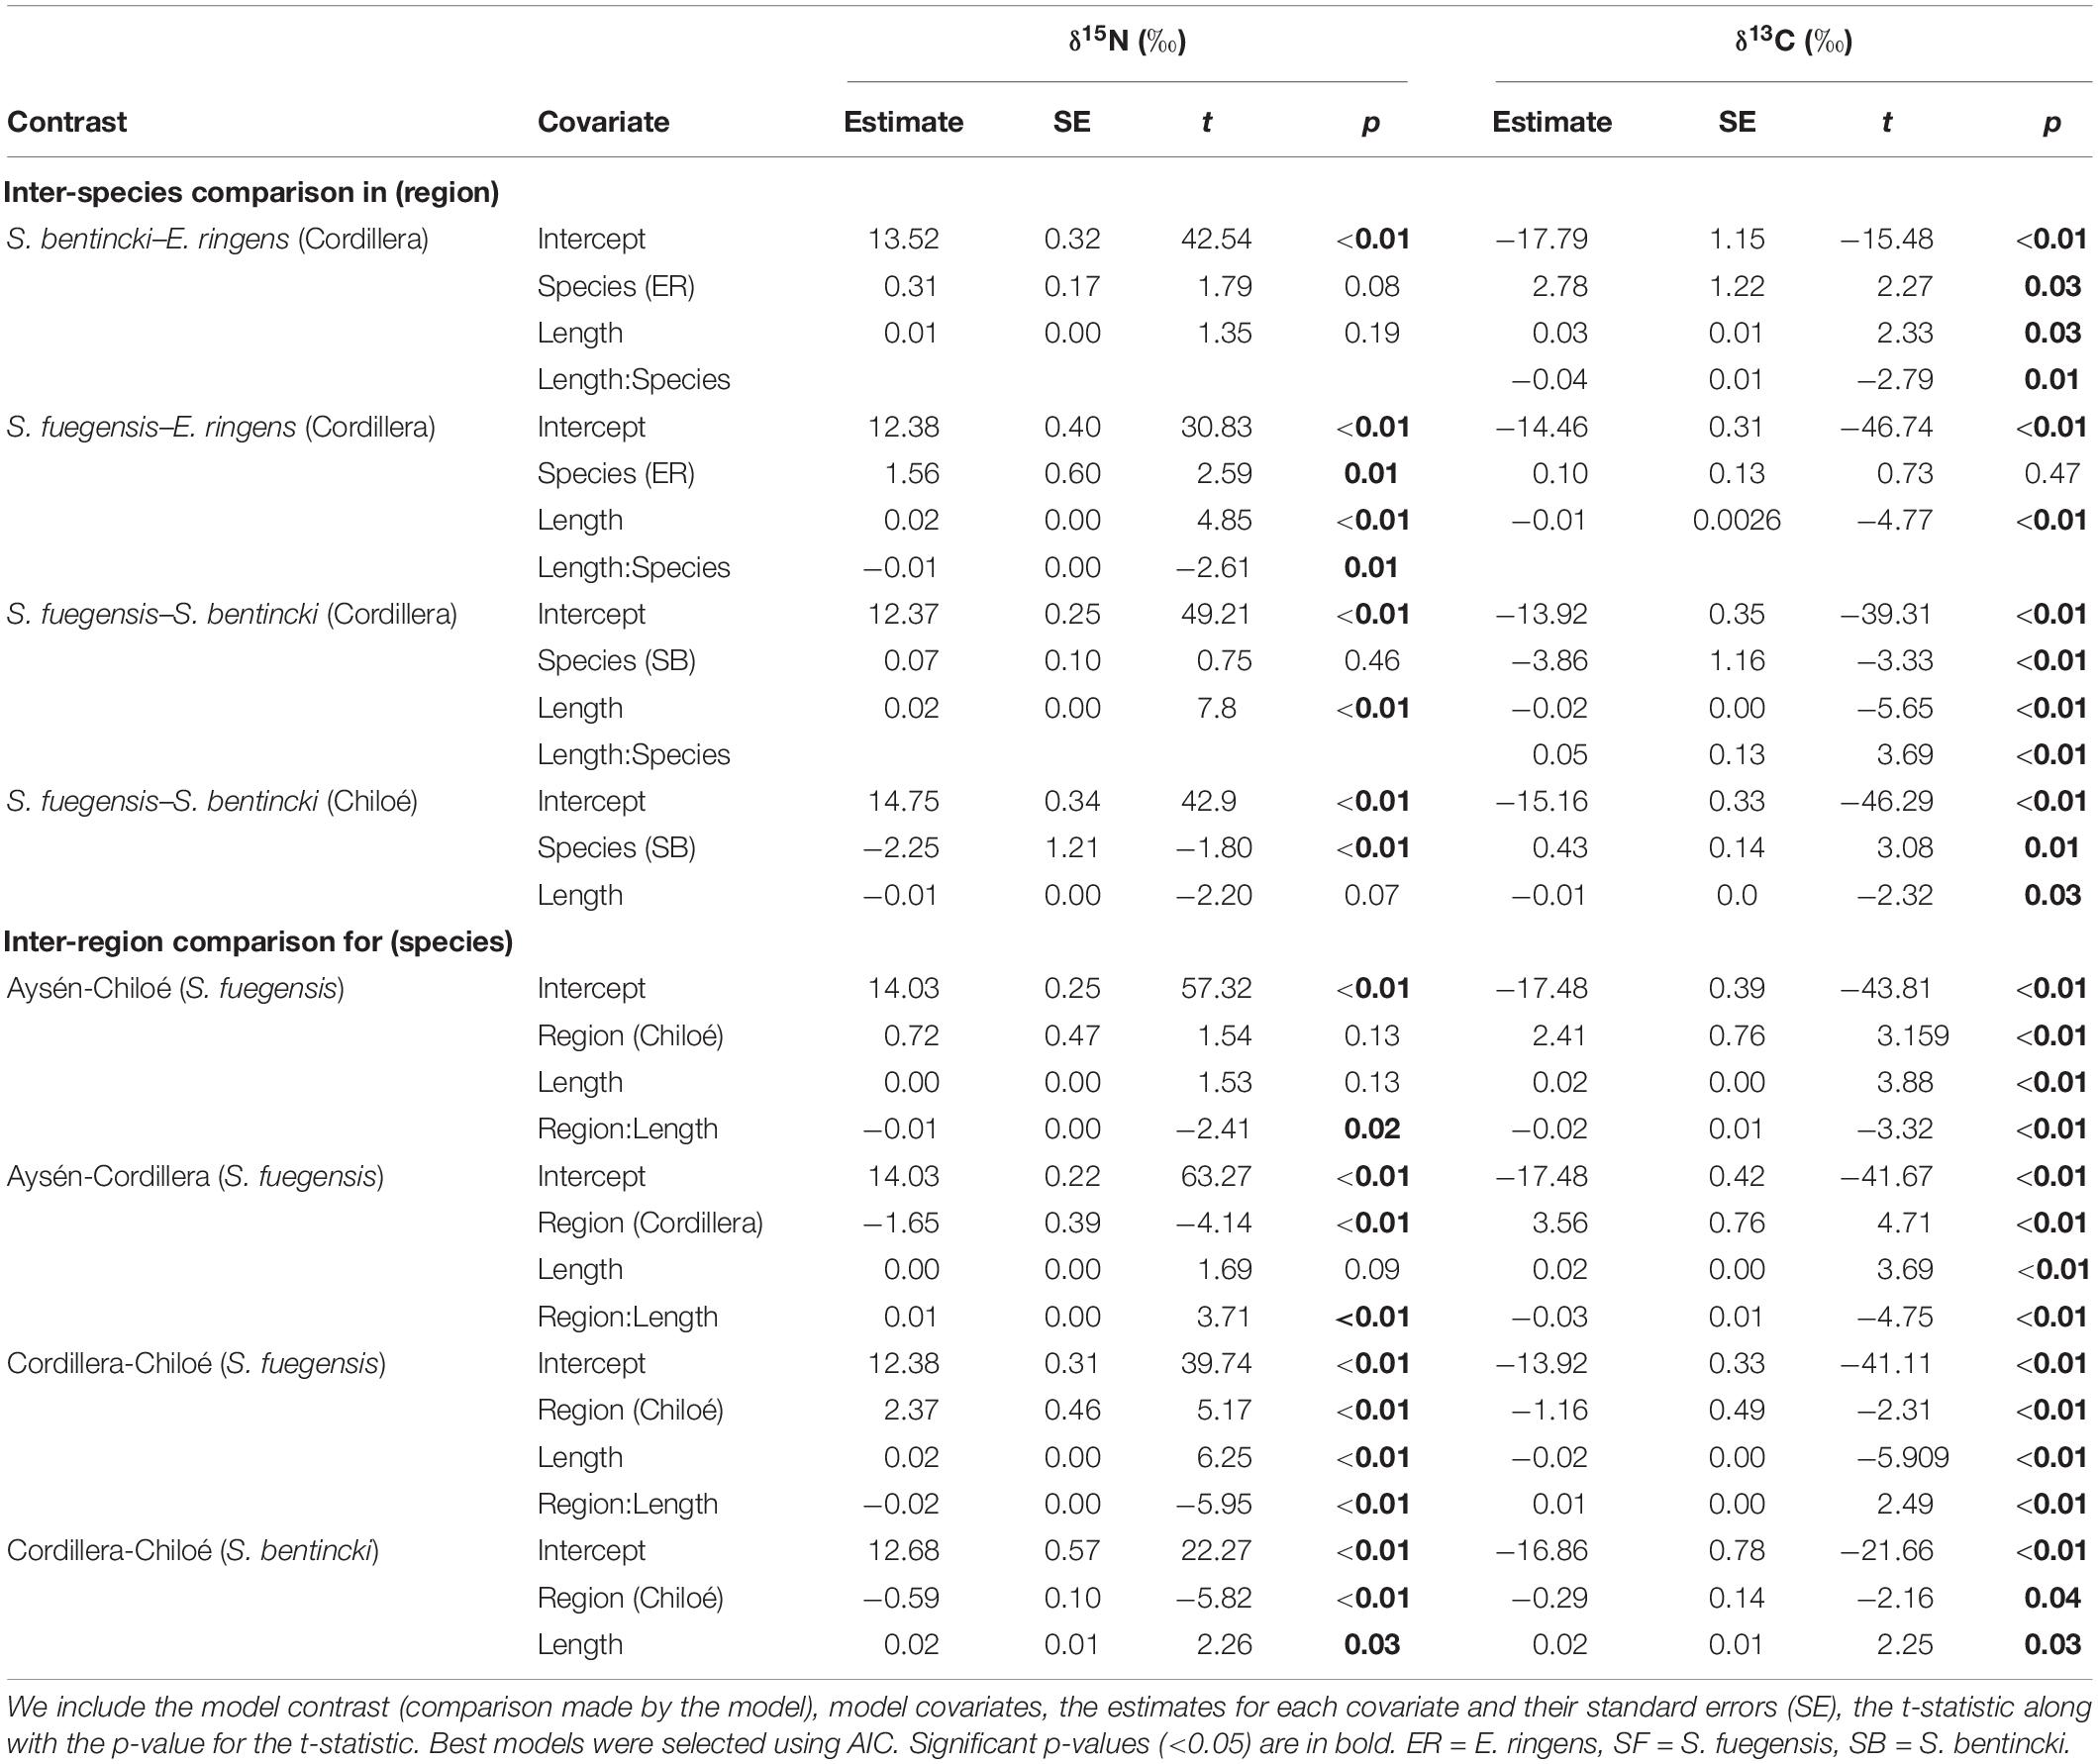
Table 6. Linear model pairwise comparison of stable isotopes between species and regions.
Among Region Comparison of Sprattus fuegensis Diet
The stomach contents of the S. fuegensis in the Aysén region reflected the paucity of the region’s prey availability compared to the other two regions. The S. fuegensis of the Aysén region had stomach contents composed of the smallest number of taxa (Ntaxa = 4.41 ± 1.70), followed by Cordillera (Ntaxa = 5.31 ± 2.20) then Chiloé (Ntaxa = 6.16 ± 2.69), F(5,506) = 31.29, p < 0.01, Tukey post hoc p < 0.05 for all comparisons (Table 4). Though the S. fuegensis in Aysén ate the smallest number of taxa overall, they exhibited the highest prey selectivity out of the three regions, and showed high preference (selection index > 0.8) for nauplius, cladocera, invertebrate eggs, and fish eggs, while the S. fuegensis in Cordillera and Chiloé showed medium and high preference for only 2 items. Furthermore, the small S. fuegensis in Aysén showed a slight preference for bryozoan larvae (selection index = 0.56) an item of low nutritional value which were highly avoided by almost all other species-region combinations (Supplementary Table 3). Finally, the S. fuegensis in Aysén had higher variances among stomach contents than the Cordillera and Chiloé S. fuegensis (Tukey post hoc p < 0.1 for comparisons with Aysén Table 4). The difference in selectivity and stomach content variances between S. fuegensis in Aysén vs. the other two regions shows that they were able to adapt its feeding strategy to lower prey availability.
The difference between the diet of Aysén S. fuegensis with those of the other regions was not so clear in the δ15N stable isotope data as it was in the stomach contents, as Aysén fish had only statistically significant different δ15N values from Cordillera fish (Figure 7 and Table 6). Assuming that the isotopic baseline is the same, this may indicate that the long-term interregional differences in diet are not so large. Overall, S. fuegensis in Chiloé had the lowest δ15N values (14.0 ± 0.4‰), followed by Cordillera (14.3 ± 0.5‰) and Aysén (14.4 ± 0.4‰) (Figure 7A and Table 5). The δ15N values increased in size, except for the Chiloé S. fuegensis (Figure 7A). On the other hand, the δ13C values of S. fuegensis in Aysén were very different from the other two regions (Figure 7B and Tables 5, 6). This is unsurprising as the Aysén region had the greatest input of freshwater, and thus the greatest terrestrial organic carbon entering the aquatic system. The low δ13C values could also be due to the remineralization of terrestrial organic matter, which would lower the DIC values in Aysén water column. Alternatively, the lower δ13C values in Aysén might also result from benthic macroalgae debris (e.g., Macrocystis pyrifera) that are known show high δ13C values in Patagonia (11.2‰–15.2‰; Riccialdelli et al., 2020), and macroalgae that are more abundant in Chiloé and Cordillera than in the Aysén zone.
Species–Region Interaction: Sprattus fuegensis vs. Strangomera bentincki in Chiloé and Cordillera
The stomach contents of S. bentincki and S. fuegensis have a greater overlap in Cordillera (Schoener index = 0.85) than in Chiloé (Schoener index = 0.67). Furthermore, in Chiloé, the S. bentincki had less diverse stomach contents [H′ = 0.57 ± 0.30, F(14, 497) = 18.94, p < 0.01] with almost twice as few taxa [Ntaxa = 3.67 ± 1.35, F(14, 497) = 21.09, p < 0.01] than the S. fuegensis (H′ = 1.0 ± 0.27; Ntaxa = 6.16 ± 2.69). Conversely, S. bentincki and S. fuegensis had a similar alpha diversity of stomach contents in Cordillera (Ntaxa = ∼ 5 for both species, Tukey post hoc p = 1) (Table 3).
The two species showed a similar number of total taxonomic groups selected (>0.5) for their diet in each region (Cordillera: S. bentincki = 6, S. fuegensis = 7; Chiloé: S. bentincki = 6, S. fuegensis = 7) and also shared some of the same groups for which they showed medium (>0.7) or high preference (>0.8) in each region (Cordillera = larvaceans; Chiloé: ostracods and fish eggs; Figure 6). However, a closer inspection also revealed that while those groups selected by S. bentincki were mostly small or mid-sized zooplankters (≤1 mm: invertebrate eggs, fish eggs and ostracods), those preferred by S. fuegensis ranged from small sized to larger sized zooplankters (from invertebrate eggs and nauplii to zoeas, furcilia and adult euphausiids) (Supplementary Table 3).
The differences between the regional diets of S. bentincki and S. fuegensis that we identified in the stomach contents temporal snapshot were confirmed by the longer-term δ15N stable isotope data. The S. bentincki and S. fuegensis had different δ15N values in Chiloé, but similar ones in Cordillera. In both the Cordillera and the Chiloé region, S. bentincki had lower mean δ15N values than S. fuegensis (Figure 7A). This difference was statistically significant in Chiloé (t = –1.8, p < 0.01) but not in the Cordillera region (t = 0.75, p = 0.46). Thus, in the Cordillera region, both species have broader overlapping diets, whereas in the Chiloé region, the diets diverge.
Discussion
Cordillera, the region with the highest phytoplankton biomass (as depicted from chlorophyll a images, Figure 2), richest zooplankton community, and highest copepod abundance, was the only region where all three forage fish species were present, whereas in Aysén, the region with the poorest diversity and lowest zooplankton abundances, we caught only S. fuegensis. S. fuegensis favored copepods; indeed, the greater the copepod abundances in the environment, the more S. fuegensis ate them. As shown by the δ15N values, S. fuegensis had the broadest diet of the three species. Yet, in diversity and copepod-poor Aysén, the S. fuegensis selected for a greater number of prey items than in the copepod-rich Cordillera. Our results show that S. fuegensis were able to adapt their foraging strategy and diet to the varying prey availability of the three regions.
Both the stable isotope and the stomach contents analyses support the conclusion that there is little diet differentiation among the three species in the Cordillera region, though E. ringens had greater δ15N values than S. fuegensis and S. bentincki. The high E. ringens δ15N are supported by other studies of E. ringens in the Northern Humboldt current and Central Chile which highlight the central importance of zooplankton to the E. ringens diet (Hückstädt et al., 2007; Espinoza and Bertrand, 2008; Espinoza et al., 2017; Castro et al., 2020). The difference in the E. ringens δ15N values from the other two species could also be attributed to its shallower foraging depth (around 7 m) than the other two species (around 37 m), which could have shifted the isotopic signature of shared prey. The S. bentincki and S. fuegensis have overlapping diets in copepod-rich Cordillera but diverging diets in copepod-poor Chiloé, which shows that fewer resources leads to diet partitioning due to interspecies competition for food.
Diet Partitioning Among Forage Fish Species
Diet partitioning is an important mechanism for coexistence between similar species (Schoener, 1974) and has been shown to play a large role in mediating dynamics between anchovy and sardine (Van der Lingen et al., 2006). Anchovy are known to be selective particulate eaters while sardine act as passive filter feeders, and what’s more, anchovy select for larger particles than sardine (Balbontín et al., 1979; Louw et al., 1998; Van der Lingen et al., 2006). The difference in selectivity can be partly explained by sardine species having smaller spaces between their gill raker spines than anchovy species (Van der Lingen et al., 2006), which allows them to retain smaller food particles. Indeed, we found that the S. bentincki had smaller spaces between their gill rakers than both the E. ringens and the S. fuegensis (Figure 8), which could help explain why the S. bentincki had a lower δ15N value than the other two species. We also found that S. bentincki displayed a preference for a lower number of taxa than E. ringens which could be attributed to non-selective filter feeding vs. E. ringens’ more selective particulate feeding. Unfortunately, we did not identify gut prey taxa to species level which meant that we may have missed some diet partitioning between the three fish species. In particular, we could not detect whether the fish ate different species of copepods, which is important as sardine have been observed selecting smaller calanoid and cyclopoid copepod species than anchovy (Espinoza et al., 2009) due to filter feeding (Van der Lingen et al., 2006). Changes in zooplankton size structure are linked to temperature shifts, with sizes becoming smaller in warmer temperatures (Rice et al., 2015) which would be detrimental to anchovy (Ayón et al., 2011; Canales et al., 2016). These environmentally driven changes in zooplankton sizes may drive large-scale regime shifts between sardine and anchovy (Shannon et al., 2004). Perhaps the dominance of small-sized copepods in Chiloé vs. a balance between large and small copepods Cordillera helps explain why S. bentincki was present in the Chiloé region, but not E. ringens.
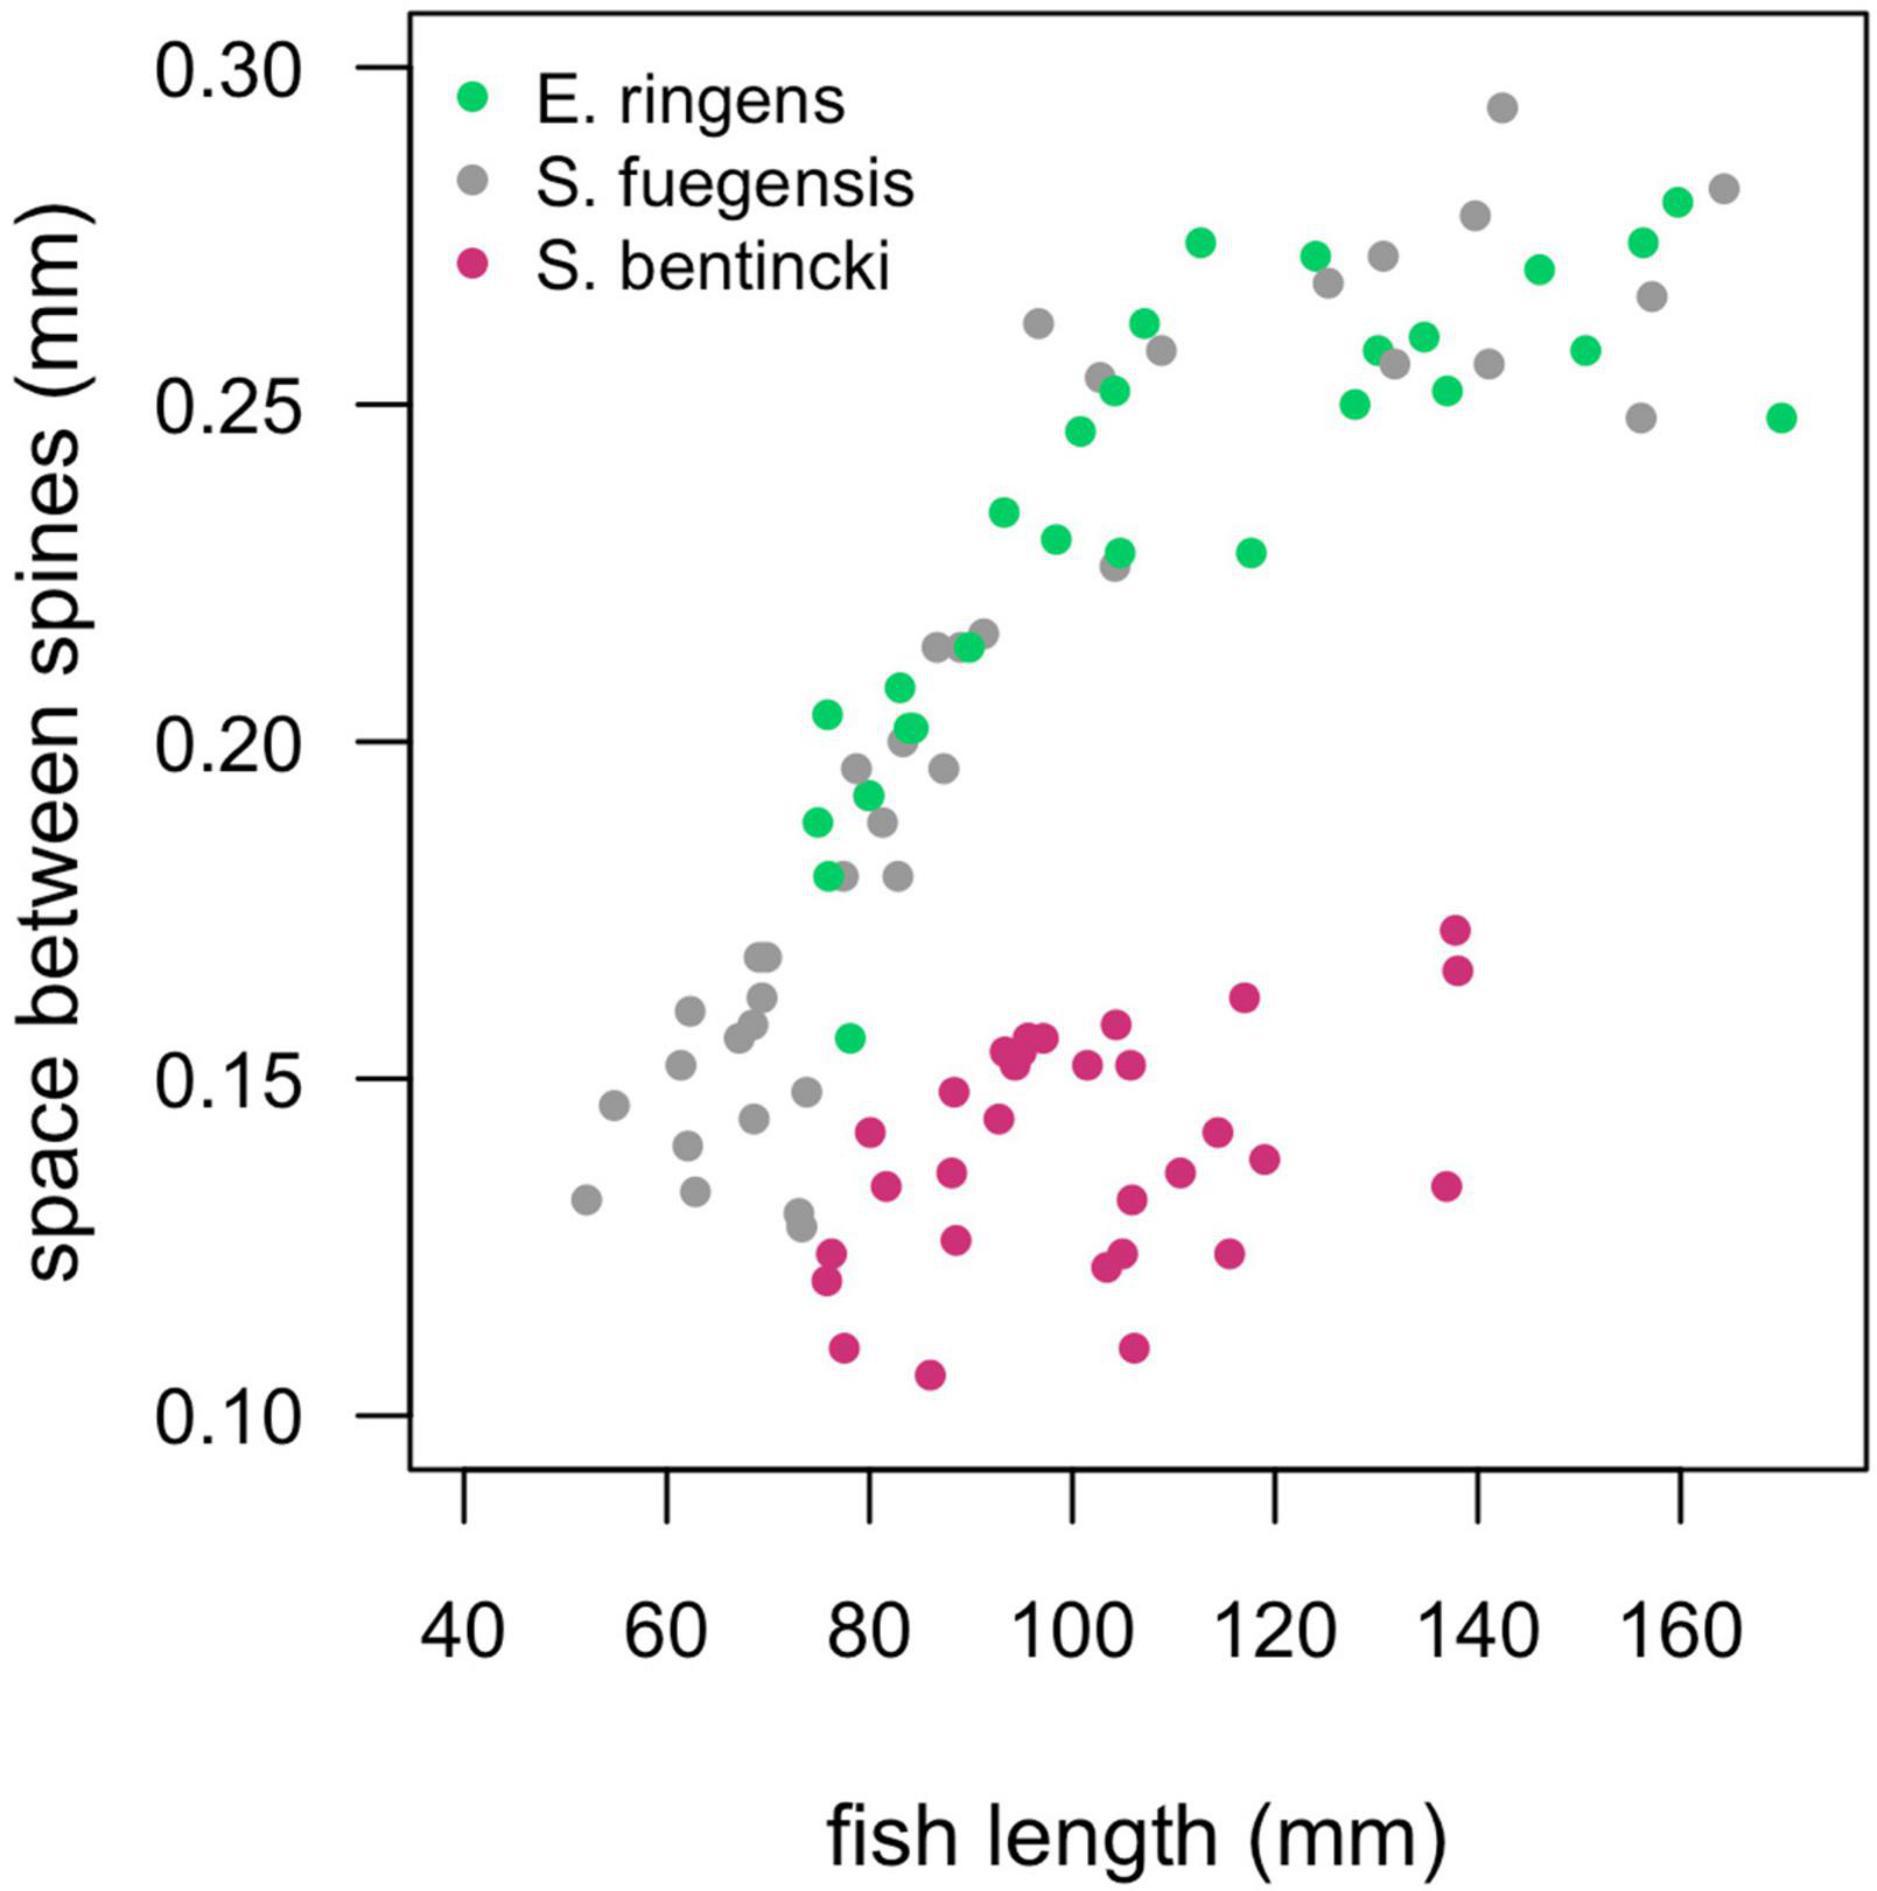
Figure 8. Spaces between the gill raker spines (mm) for individuals of the three species by fish length (mm). We did not separate by region as there was no regional effect on the relationship. The S. fuegensis and E. ringens had the same relationship between fish length and the space between the gill raker spines (p = 0.13), the S. bentincki had a different relationship than the other two species (p < 0.001).
The difference in gill raker morphology between the three species is not enough to explain their difference in diet as the spaces between the gill raker spines were the same width for S. fuegensis and E. ringens (Figure 8). Furthermore, the difference between gill raker spine spacing between S. fuegensis and S. bentincki increases with size, and so we might have expected to observe bigger interspecies differences in diet at larger sizes while in fact we observed the opposite. We propose that S. fuegensis, like E. ringens, show selectivity for their food particles, though with greater flexibility in their selection. Indeed, the S. fuegensis had the greatest intraspecies variability in diet of the three species. The δ15N values of S. fuegensis overlap with those of both S. bentincki and of E. ringens in Cordillera (Figure 7), suggesting that the S. fuegensis ingest food particles of a broader range of sizes than the other two species. In addition, S. fuegensis’s larger spread of δ15N values may indicate that it is able to switch between feeding modes, sometimes a filter feeder like S. bentincki and sometimes a size-selective particle eater like E. ringens (Espinoza et al., 2017; Pizarro et al., 2019). Further studies are necessary to understand the feeding mode of S. fuegensis and how it differs from that of S. bentincki and E. ringens.
While there was high overlap between the diet of the three species, the S. fuegensis’s diet was the most flexible which gives it considerable advantages over the other two species in adapting to environmental changes. The diet flexibility of the European sprat (Sprattus sprattus, a species in the same genus as S. fuegensis) diet compared to anchovy and sardine has been also observed in the Mediterranean, where researchers have posited that the sprat’s greater diet flexibility could explain its increase in abundances compared to the other two species (Brosset et al., 2016). In addition, the flexibility of the S. fuegensis diet is a trait that likely allows it to coexist with species that occupy a similar trophic niche. The S. fuegensis been shown to coexist with squat lobster (Munida sp.) in the Southern Ocean (Diez et al., 2018) and squat lobster and longtail cod (Patagonotothen ramsayi) in the South Atlantic (Riccialdelli et al., 2020). The flexibility of S. fuegensis’s diet might mitigate its vulnerability to climate change driven zooplankton-shift in species (Richardson, 2008) and size (Rice et al., 2015), but the species may be vulnerable to other effects of environmental change, such as impacts on growth and recruitment success (Peck et al., 2013).
Population Dynamics and Competition
Though our study area is adjacent to the Humboldt Current, the population dynamics of the forage fish in our study region do not follow those described for forage fish in boundary condition upwelling systems. Forage fish dynamics in upwelling systems are usually dominated by two or more species that go through multi-decadal alternations in abundances, a pattern driven by shifting environmental conditions (Bakun and Broad, 2003; Shannon et al., 2004; Alheit et al., 2009; Fiechter et al., 2015). Our time series in the Cordillera and Chiloé regions were too short (2015–2021) to detect decadal-scale alternations of abundances, but we examined shorter cross-species correlations in abundance and biomass. In Chiloé, E. ringens was seldom detected (3 out of 7 years) and S. fuegensis consistently had a greater abundance than S. bentincki. Furthermore, S. fuegensis and S. bentincki abundances and biomass were highly negatively correlated with a lag of 2 years (correlation coefficient = –0.91, p = 0.03) which indicates that great abundances of S. fuegensis adults may adversely affect S. bentincki juveniles. On the other hand, in Cordillera, the two population abundances were uncorrelated, though the S. bentincki abundances decreased sharply over the time period (estimate = –1.58, p < 0.01) and the species was not present in the region in 2020 and 2021. The E. ringens abundances in Cordillera were frequently greater than those of S. fuegensis and the abundances of the two species were negatively correlated without a lag (correlation coefficient = 0.81, p = 0.03). Interestingly, unlike in Central Chile, the S. bentincki and E. ringens did not have correlated abundances, even when examining pooled Chiloé and Cordillera values. Though the time series in is short, it shows that other mechanisms besides the environmental factors that characterize forage fish dynamics in upwelling regions are driving the populations of the small pelagics in Northern Patagonia.
The addition of the S. fuegensis to the system may modify the interactions between S. bentincki and E. ringens through competition for food. It is difficult to demonstrate that competition is occurring between species by observation, as it can only be done by indirect inference (Schoener, 1974). Link and Auster (2013) identifies four criteria that can be used to demonstrate that competition for prey between fish species is likely occurring: opposite population trajectories, high dietary overlap, high spatiotemporal overlap, and some indication of resource limitation. Our study has shown that there is high dietary overlap between the three species, and the 2015–2021 time series shows evidence of negative correlation between S. fuegensis and E. ringens abundances in Cordillera and a 2-year lagged negative correlation between S. bentincki and S. fuegensis abundances in Chiloé (Figure 1). The fish overlapped spatially: 67% of Cordillera stations with E. ringens contained S. fuegensis, and all S. bentincki stations contained S. fuegensis in both Cordillera and Chiloé, however we observed spatial partitioning within the water column. Spatial partitioning can be a mechanism for niche differentiation under high diet overlap (Schoener, 1974). In Cordillera, the S. fuegensis and S. bentincki were caught at similar depths which could indicate they have had overlapping foraging depth (S. fuegensis mean school depth = 42.1 ± 20.6 m, S. bentincki mean school depth = 35.8 ± 18.5), but in Chiloé their school depths differed, suggesting spatial partitioning (S. fuegensis mean school depth = 35.3 ± 17.8 m, S. bentincki mean school depth = 14.8 ± 8.7). The E. ringens was found at the shallowest depth in Cordillera (mean school depth = 9.3 ± 7.4), which could mean its foraging habitat overlapped less than with the other two species. Evidence for resource limitation is difficult to obtain, but our study has shown that Chiloé is more resource limited compared to the Cordillera region, particularly as our cruises were carried out in mid-fall when primary production has already decreased (Iriarte et al., 2007). Thus, we can use the criteria of Link and Auster (2013) to show that S. fuegensis and S. bentincki in the Chiloé region are likely competing for prey and perhaps differentiating their niches through spatial partitioning, but competition is not so clearly demonstrable in the copepod-rich Cordillera region because there is less evidence for resource limitation.
The patterns that we have observed in this study of diet partitioning and possible competition between the three fish species may be seasonal. In our region of study, primary production is high from spring to early autumn and decreases sharply in late autumn and winter (Iriarte et al., 2007). In the Cordillera and Chiloé regions, winter primary production is two orders of magnitude lower than the spring primary production, with six times fewer copepods (González et al., 2011). Our study took place in April and May, which is when primary production is decreasing, but before the sharp winter decline. Resource scarcity is an impetus for diet partitioning (Schoener, 1974; Link and Auster, 2013), and as autumn is a season of relative food scarcity, the fish may have a lower need to partition their diet in the spring and summer when food is more plentiful.
The difference in resource availability between the three regions is partially explained by their environmental differences. In inshore Patagonian waters, the zooplankton community follows a temperature gradient, with greater zooplankton biomass being found in warmer waters (Palma and Silva, 2004). Our findings agree with this principle as the most diverse zooplankton community with the highest abundances of copepods was found in the Cordillera region which also had the highest water temperatures with the highest chlorophyll-a content (Figures 2, 4). In addition, physiological differences between the three fish species could also be interacting with resource availability to help explain their geographic distribution. Perhaps the S. fuegensis, which is extending its range northwards, was more tolerant of the colder water temperatures and lower salinities in Aysén than the S. bentincki and E. ringens.
For certain systems, a balance among several forage fish species could be an alternative model to alternating dominances between two or more species. Coexistence among forage fish species has been described for non-upwelling systems (Nikolioudakis et al., 2014; Brosset et al., 2016) as well as in paleo records (Field et al., 2009). However, our system is adjacent to the Humboldt current and thus we could have expected a similar population dynamic between our three forage fish species as the one observed for E. ringens and S. bentincki in Central Chile. The high diet overlap between the three fish species as well as different partitioning of food resources between Cordillera and Chiloé shows that the three species likely compete for food which may play a part in driving the region’s population dynamics. But competition does not preclude coexistence. Besides having small differences in diet, other factors could promote coexistence between the three forage fish species, including our study area’s greater oceanographic complexity compared to Central Chile. The confluence of oceanic and fresh water masses as well as the multitude of small islands and channels create largely heterogeneous oceanographic conditions (Sievers and Silva, 2006) which could provide the fish temporal and spatial refugia from less favorable conditions (Bakun and Broad, 2003). This area also represents the northernmost range of S. fuegensis and the southernmost range of S. bentincki and E. ringens, thus all three species may be pushing the limits of the environmental condition they can physiologically tolerate, keeping all three species at an equal disadvantage. Finally, a mechanism for niche differentiation under high diet overlap is spatial partitioning (Schoener, 1974). S. fuegensis schools were found deeper (mean depth = 36.4 m) than the S. bentincki (mean depth = 26.8 m) and E. ringens (mean depth = 7 m), suggesting that the three species forage at different depths. More research into how a complex environment affects the interactions between the three species is necessary to better understand mechanisms that allow coexistence in this system.
Data Availability Statement
The raw data supporting the conclusions of this article will be made available by the authors, without undue reservation.
Ethics Statement
Ethical review and approval was not required for the animal study because the fish were caught on a Chilean fishing vessel in compliance with national regulations.
Author Contributions
LC and LW contributed to the conception of the study. JC acquired the fish, zooplankton, and hydrographic data. SS performed the analysis of hydrographical data. LW performed the stable isotope and statistical analyses and wrote the first draft of the manuscript. All authors contributed to manuscript revision, read, and approved the submitted version.
Funding
This study was financed by Subsecretaría de Pesca, Copas Sur-Austral Center and Copas Coastal (CONICYT PIA Apoyo CCTE AFB170006, FB 210021).
Conflict of Interest
The authors declare that the research was conducted in the absence of any commercial or financial relationships that could be construed as a potential conflict of interest.
Publisher’s Note
All claims expressed in this article are solely those of the authors and do not necessarily represent those of their affiliated organizations, or those of the publisher, the editors and the reviewers. Any product that may be evaluated in this article, or claim that may be made by its manufacturer, is not guaranteed or endorsed by the publisher.
Acknowledgments
We acknowledge the collaboration of P. Barrientos, V. González, and T. Ponce for conducting some of the fish and plankton analyses at LOPEL. We also thanks IFOP personnel at sea and also captains and crew members of the fishing vessels operating in Northern Patagonia.
Supplementary Material
The Supplementary Material for this article can be found online at: https://www.frontiersin.org/articles/10.3389/fmars.2021.792377/full#supplementary-material
The following supplementary material is available online: Supplementary Figure S1 (length distributions of fish used in this study), Supplementary Tables 1, 2 (summary description of zooplankton species by region), Supplementary Table 3 (diet preferences of the three fish species by region in detail), Supplementary Table 4 (descriptors of fish school vertical position in the water column), and Supplementary Table 5 (historical counts and biomass of the three fish species in Central, Aysén, Chiloé, and Cordillera regions).
Footnotes
References
Alheit, J., Roy, C., and Kifani, S. (2009). “Decadal-scale variability in populations,” in Climate Change and Small Pelagic Fish, eds D. M. Checkley, J. Alheit, Y. Oozeki, and C. Roy (Cambridge: Cambridge University Press), 64–97. doi: 10.1017/CBO9780511596681.007
Anderson, M. J., Ellingsen, K. E., and McArdle, B. H. (2006). Multivariate dispersion as a measure of beta diversity. Ecol. Lett. 9, 683–693. doi: 10.1111/j.1461-0248.2006.00926.x
Aranis, A., Aa Gomez, Munoz, G., Ossa, L., Caballero, L., Cerna, F., et al. (2012). Monitoreo De Anchoveta Y Sardinas En Aguas Interiores De La X Región De Los Lagos. Paris: IFOP.
Aranis, R. A., Meléndez, C. R., Pequeño, R. G., and Cerna, T. F. (2007). Sprattus fuegensis en aguas interiores de chiloé, chile (osteichthyes: clupeiformes: clupeidae). Gayana (Concepción) 71, 102–113.
Ayón, P., Swartzman, G., Bertrand, A., Gutiérrez, M., and Bertrand, S. (2011). Zooplankton and forage fish species off peru: large-scale bottom-up forcing and local-scale depletion. Prog. Oceanogr. 79, 208–214.
Bakun, A., Babcock, E. A., Lluch-Cota, S. E., Santora, C., and Salvadeo, C. J. (2010). Issues of ecosystem-based management of forage fisheries in “open” non-stationary ecosystems: the example of the sardine fishery in the gulf of California. Rev. Fish Biol. Fisher. 20, 9–29. doi: 10.1007/s11160-009-9118-1
Bakun, A., and Broad, K. (2003). Environmental ‘loopholes’ and fish population dynamics: comparative pattern recognition with focus on El Niño effects in the pacific. Fisher. Oceanogr. 12, 458–473.
Balbontín, F., Llanos, A., and Valenzuela, V. (1979). Estudio experimental sobre selección de alimento y comportamiento alimentario en anchoveta y sardina de Chile (pisces, clupeiformes). Revista de Biología Marina, Valparaíso (Chile) 16, 211–220.
Boecklen, W. J., Yarnes, C. T., Cook, B. A., and James, A. C. (2011). On the use of stable isotopes in trophic ecology. Ann. Rev. Ecol. Evol. Syst. 42, 411–440.
Brosset, P., Le Bourg, B., Costalago, D., Bãnaru, D., Van Beveren, E., Bourdeix, J., et al. (2016). Linking small pelagic dietary shifts with ecosystem changes in the gulf of lions. Mar. Ecol. Prog. Ser. 554, 157–171.
Canales, T. M., Law, R., and Blanchard, J. L. (2016). Shifts in plankton size spectra modulate growth and coexistence of anchovy and sardine in upwelling systems. Can. J. Fish. Aquatic Sci. 73, 611–621. doi: 10.1139/cjfas-2015-0181
Castillo, J., Legua, J., Cerna, F., Lopez, A., Leiva, B., Molina, E., et al. (2020). Evaluación Hidroacústica de Pequeños Pelágicos en Aguas Interiores de la X y XI Regiones, año 2019. Informe Final de Proyecto, Convenio Desempeño 2019. Valparaíso: Subsecretaría de Economía y EMT-Instituto de Fomento Pesquero, 254.
Castro, L. R., González, V., Claramunt, G., Barrientos, P., and Soto, S. (2020). Stable isotopes (δ13C, δ15N) seasonal changes in particulate organic matter and in different life stages of anchoveta (Engraulis ringens) in response to local and large scale oceanographic variations in north and central Chile. Prog. Oceanogr. 186:102342.
Chavez, F. P. (2003). From anchovies to sardines and back: multidecadal change in the pacific ocean. Science 299, 217–221. doi: 10.1126/science.1075880
Chouvelon, T., Violamer, L., Dessier, A., Bustamante, P., Mornet, F., Pignon-Mussaud, C., et al. (2015). Small pelagic fish feeding patterns in relation to food resource variability: an isotopic investigation for Sardina pilchardus and Engraulis encrasicolus from the bay of biscay (north-east Atlantic). Mar. Biol. 162, 15–37. doi: 10.1007/s00227-014-2577-5
Cubillos, L. A., Castro, L. R., Gutierrez, M., and Navarro, E. (2015). Evaluación Hidroacústica de Pelágicos Pequeños en Aguas Interiores de la X y XI Regiones, año 2013. Informe Técnico FIP 2013-11. Concepción: Universidad de Concepción.
Cury, P. (2000). Small pelagics in upwelling systems: patterns of interaction and structural changes in “wasp-waist” ecosystems. ICES J. Mar. Sci. 57, 603–618. doi: 10.1006/jmsc.2000.0712
Cury, P., and Roy, C. (1989). Optimal environmental window and pelagic fish recruitment success in upwelling areas. Can. J. Fisher. Aquatic Sci. 46, 670–680.
Diez, M. J., Cabreira, A. G., Madirolas, A., De Nascimento, J. M., Scioscia, G., Schiavini, A., et al. (2018). Winter is cool: spatio-temporal patterns of the squat lobster Munida gregaria and the Fuegian sprat Sprattus fuegensis in a sub-Antarctic estuarine environment. Polar Biol. 41, 2591–2605.
Engelhard, G. H., Peck, M. A., Rindorf, A. C., Smout, S., van Deurs, M., Raab, K., et al. (2014). Forage fish, their fisheries, and their predators: who drives whom? ICES J. Mar. Sci. 71, 90–104.
Espinoza, P., and Bertrand, A. (2008). Revisiting peruvian anchovy (Engraulis ringens) trophodynamics provides a new vision of the humboldt current system. Prog. Oceanogr. 79, 215–227.
Espinoza, P., Bertrand, A., van der Lingen, C. D., Garrido, S., and Rojas de Mendiola, B. (2009). Diet of sardine (Sardinops sagax) in the northern humboldt current system and comparison with the diets of clupeoids in this and other eastern boundary upwelling systems. Prog. Oceanogr. 83, 242–250.
Espinoza, P., Lorrain, A., Ménard, F., Cherel, Y., Tremblay-Boyer, L., Argüelles, J., et al. (2017). Trophic structure in the northern humboldt current system: new perspectives from stable isotope analysis. Mar. Biol. 164:86.
FAO (2020). Fisheries and Aquaculture Software. FishStatJ Software for Fishery and Aquaculture Statistical Time Series. Rome: FAO Fisheries Division.
Fiechter, J., Rose, K. A., Curchitser, E. N., and Hedstrom, K. S. (2015). The role of environmental controls in determining sardine and anchovy population cycles in the California current: analysis of an end-to-end model. Prog. Oceanogr. 138, 381–398. doi: 10.1016/j.pocean.2014.11.013
Field, D. B., Baumgartner, T. R., Ferreira, V., Gutierrez, D., Lozano-Montes, H., Salvatteci, R., et al. (2009). Variability from Scales in Marine Sediments and Other Historical Records. Climate Change and Small Pelagic Fish. Cambridge: Cambridge University Press, 45–63.
Garrido, S., Ben-Hamadou, R., Oliveira, P., Cunha, M., Chícharo, M., and van der Lingen, C. (2008). Diet and feeding intensity of sardine Sardina pilchardus: correlation with satellite-derived chlorophyll data. Mar. Ecol. Prog. Ser. 354, 245–256. doi: 10.3354/meps07201
Garrido, S., Silva, A., Pastor, J., Dominguez, R., Silva, A., and Santos, A. (2015). Trophic ecology of pelagic fish species off the iberian coast: diet overlap, cannibalism and intraguild predation. Mar. Ecol. Prog. Ser. 539, 271–285. doi: 10.3354/meps11506
González, H. E., Castro, L., Daneri, G., Iriarte, J. L., Silva, N., Vargas, C. A., et al. (2011). Seasonal plankton variability in Chilean Patagonia fjords: carbon flow through the pelagic food web of Aysen Fjord and plankton dynamics in the Moraleda Channel basin. Cont. Shelf Res. 31, 225–243. doi: 10.1016/J.CSR.2010.08.010
Hückstädt, L. A., Rojas, C. P., and Antezana, T. (2007). Stable isotope analysis reveals pelagic foraging by the southern sea lion in central Chile. J. Exp. Mar. Biol. Ecol. 2, 123–133. doi: 10.1016/j.jembe.2007.03.014
Hynes, H. B. N. (1950). The food of fresh-water sticklebacks (Gasterosteus aculeatus and Pygosteus pungitius), with a review of methods used in studies of the food of fishes. J. Animal Ecol. 19, 36–58. doi: 10.2307/1570
Iriarte, J. L., González, H. E., Liu, K. K., Rivas, C., and Valenzuela, C. (2007). Spatial and temporal variability of chlorophyll and primary productivity in surface waters of southern Chile (41.5–43° S). Estuar. Coastal Shelf Sci. 74, 471–480. doi: 10.1016/j.ecss.2007.05.015
Kiljunen, M., Grey, J., Sinisalo, T., Harrod, C., Immonen, H., and Jones, R. I. (2006). A revised model for lipid-normalizing δ13C values from aquatic organisms, with implications for isotope mixing models. J. Appl. Ecol. 43, 1213–1222. doi: 10.1111/j.1365-2664.2006.01224.x
Link, J. S., and Auster, P. J. (2013). The challenges of evaluating competition among marine fishes: who cares, when does it matter, and what can one do about it? Bull. Mar. Sci. 89, 213–247. doi: 10.5343/bms.2011.1121
Louw, G. G., van der Lingen, C. D., and Gibbons, M. J. (1998). Differential feeding by sardine Sardinops sagax and anchovy Engraulis capensis recruits in mixed shoals. South Afr. J. Mar. Sci. 19, 227–232.
Manly, B. F. J. (1993). Comments on design and analysis of multiple-choice feeding-preference experiments. Oecologia 93, 149–152. doi: 10.1007/BF00321205
Montecinos, S., Castro, L. R., and Neira, S. (2016). Stable isotope (δ 13 C and δ 15 N) and trophic position of patagonian sprat (Sprattus fuegensis) from the northern chilean patagonia. Fisher. Res. 179, 139–147. doi: 10.1016/j.fishres.2016.02.014
Nakamura, I., Inada, T., Takeda, M., and Hatanaka, H. (1986). Important Fishes Trawled off Patagonia. Tokyo: Japan Marine Fishery Resource Research Center.
Nikolioudakis, N., Isari, S., and Somarakis, S. (2014). Trophodynamics of anchovy in a non-upwelling system: direct comparison with sardine. Mar. Ecol. Prog. Ser. 500, 215–229. doi: 10.3354/meps10604
Oksanen, J., Blanchet, F. G., Kindt, R., Legendre, P., Minchin, P. R., O’hara, R. B., et al. (2020). Package ‘vegan.’ Community Ecology Package, Version 25-7.
Palma, S., and Silva, N. (2004). Distribution of siphonophores, chaetognaths, euphausiids and oceanographic conditions in the fjords and channels of southern Chile. Deep Sea Res. Part II Top. Stud. Oceanogr. 51, 513–535. doi: 10.1016/j.dsr2.2004.05.001
Peck, M. A., Reglero, P., Takahashi, M., and Catalán, I. A. (2013). Life cycle ecophysiology of small pelagic fish and climate-driven changes in populations. Prog. Oceanogr. 116, 220–245.
Peterson, B. J., and Fry, B. (1987). Stable isotopes in ecosystem studies. Ann. Rev. Ecol. Evol. Syst. 18, 293–320.
Pikitch, E. K., Rountos, K. J., Essington, T. E., Santora, C., Pauly, D., Watson, R., et al. (2014). The global contribution of forage fish to marine fisheries and ecosystems. Fish Fisher. 15, 43–64.
Pizarro, J., Docmac, F., and Harrod, C. (2019). Clarifying a trophic black box: stable isotope analysis reveals unexpected dietary variation in the peruvian anchovy Engraulis ringens. PeerJ 7:e6968. doi: 10.7717/peerj.6968
Ramírez, F. C. (1976). Contribución al conocimiento del espectro alimenticio de la sardina fueguina (clupeidae, sprattus fuegensis jenyns). Neotrópica 22, 137–141. doi: 10.1016/s0181-1584(99)80017-7
Riccialdelli, L., Becker, Y., Fioramonti, N., Torres, M., Bruno, D., Raya Rey, A., et al. (2020). Trophic structure of southern marine ecosystems: a comparative isotopic analysis from the beagle channel to the oceanic burdwood Bank area under a wasp-waist assumption. Mar. Ecol. Prog. Ser. 655, 1–27. doi: 10.3354/meps13524
Rice, E., Dam, H. G., and Stewart, G. (2015). Impact of climate change on estuarine zooplankton: surface water warming in long island sound is associated with changes in copepod size and community structure. Estuar. Coasts 38, 13–23.
Richardson, A. J. (2008). In hot water: zooplankton and climate change. ICES J. Mar. Sci. 65, 279–295. doi: 10.1093/icesjms/fsn028
Schoener, T. W. (1970). Nonsynchronous spatial overlap of lizards in patchy habitats. Ecology 51, 408–418. doi: 10.2307/1935376
Schoener, T. W. (1974). Resource partitioning in ecological communities. Science 185, 27–39. doi: 10.1126/science.185.4145.27
Shannon, L. J., Field, J. G., and Moloney, C. L. (2004). Simulating anchovy–sardine regime shifts in the southern benguela ecosystem. Ecol. Mod. 172, 269–281.
Sievers, H., and Silva, N. (2006). “Masas de agua y circulación en los canales y fiordos australes,” in Avances en el Conocimiento Oceanográfico de las Aguas Interiores Chilenas, Puerto Montt a cabo de Hornos, eds N. Silva and S. Palma (Valparaíso: Comité Oceanográfico Nacional, Pontificia Universidad Católica de Valparaíso), 56–58.
Silva, N., Calvete, C., and Sievers, H. (1998). Masas de agua y circulación general para algunos canales australes entre puerto montt y laguna san rafael, Chile (crucero cimar-fiordo 1). Cienc. Tecnol. Mar. 21, 17–48.
Takasuka, A., Aoki, I., and Oozeki, Y. (2007). Predator-specific growth-selective predation on larval Japanese anchovy Engraulis japonicus. Mar. Ecol. Prog. Ser. 350, 99–107. doi: 10.3354/meps07158
Tourre, Y. M., Lluch-Cota, S. E., and White, W. B. (2007). Global multi-decadal ocean climate and small-pelagic fish population. Environ. Res. Lett. 2:034005. doi: 10.1088/1748-9326/2/3/034005
Van der Lingen, C. D., Hutchings, L., and Field, J. G. (2006). Comparative trophodynamics of anchovy Engraulis encrasicolus and sardine Sardinops sagax in the southern benguela: are species alternations between small pelagic fish trophodynamically mediated? Afr. J. Mar. Sci. 28, 465–477.
Wang, Y., Naumann, U., Wright, S., Warton, D., Wang, M. Y., and Rcpp, I. (2020). Package ‘mvabund’. Available online at: http://dk.archive.ubuntu.com/pub/pub/cran/web/packages/mvabund/mvabund.pdf (accessed February 02, 2020).
Keywords: trophic ecology, Northern Patagonia, forage fish, stable isotopes, zooplankton, diet partitioning, competition
Citation: Wiesebron LE, Castro LR, Soto S and Castillo J (2022) Small Differences in Diet Facilitate the Coexistence of Three Forage Fish Species in an Inshore Northern Patagonian Habitat. Front. Mar. Sci. 8:792377. doi: 10.3389/fmars.2021.792377
Received: 10 October 2021; Accepted: 27 December 2021;
Published: 02 February 2022.
Edited by:
Stelios Katsanevakis, University of the Aegean, GreeceReviewed by:
Sharon Z. Herzka, Center for Scientific Research and Higher Education at Ensenada, MexicoJoel Hoffman, United States Environmental Protection Agency, United States
Copyright © 2022 Wiesebron, Castro, Soto and Castillo. This is an open-access article distributed under the terms of the Creative Commons Attribution License (CC BY). The use, distribution or reproduction in other forums is permitted, provided the original author(s) and the copyright owner(s) are credited and that the original publication in this journal is cited, in accordance with accepted academic practice. No use, distribution or reproduction is permitted which does not comply with these terms.
*Correspondence: Lauren E. Wiesebron, bGF1cmVuLndpZXNlYnJvbkBuaW96Lm5s