 Anna Krumpel1,2*
 Ally Rice1
 Kaitlin E. Frasier1
 Fairlie Reese1
 Jennifer S. Trickey1
 Anne E. Simonis1
 John P. Ryan3
 Sean M. Wiggins1
 Annette Denzinger2
 Hans-Ulrich Schnitzler2
 Simone Baumann-Pickering1
- 1Scripps Institution of Oceanography, University of California, San Diego, La Jolla, CA, United States
- 2Department of Animal Physiology, University of Tübingen, Tübingen, Germany
- 3Monterey Bay Aquarium Research Institute, Moss Landing, CA, United States
Acoustic deterrents can reduce marine mammal interactions with fisheries and aquacultures, but they contribute to an increasing level of underwater noise. In Southern California, commercially produced explosive deterrents, commonly known as “seal bombs,” are used to protect fishing gear and catch from pinniped predation, which can cause extensive economic losses for the fishing community. Passive acoustic monitoring data collected between 2005 and 2016 at multiple sites within the Southern California Bight and near Monterey Bay revealed high numbers of these small-charge underwater explosions, long-term, spatio-temporal patterns in their occurrence, and their relation to different commercial purse-seine fishing sectors. The vast majority of explosions occurred at nighttime and at many nearshore sites high explosion counts were detected, up to 2,800/day. Received sound exposure levels of up to 189 dB re 1 μPa2-s indicate the potential for negative effects on marine life, especially in combination with the persistence of recurring explosions during periods of peak occurrence. Due to the highly significant correlation and similar spatio-temporal patterns of market squid landings and explosion occurrence at many sites, we conclude that the majority of the recorded explosions come from seal bombs being used by the California market squid purse-seine fishery. Additionally, seal bomb use declined over the years of the study, potentially due to a combination of reduced availability of market squid driven by warm water events in California and regulation enforcement. This study is the first to provide results on the distribution and origin of underwater explosions off Southern California, but there is a substantial need for further research on seal bomb use in more recent years and their effects on marine life, as well as for establishing environmental regulations on their use as a deterrent.
Introduction
The increased occurrence, power, and pervasiveness of anthropogenic noise sources in the ocean has increased ambient sound levels (Richardson et al., 1995; Hildebrand, 2009). Low-frequency ship noise has increased average ambient noise levels recorded in the Southern California Bight by about 2–3 dB per decade since the 1960s (Andrew et al., 2002; McDonald et al., 2006; Haren, 2007). While low-frequency ship noise affects both basin-wide and regional areas, other underwater noise sources, such as sonar, acoustic deterrents and explosives, can have strong local impacts on marine life (Hildebrand, 2009). It is important to determine acoustic impacts of all potentially harmful noise sources, to support well-informed and sustainable management decisions and mitigation policies for the marine environment.
Within fisheries and aquaculture, noise-generating acoustic deterrents are used to minimize interactions with marine mammals that prey on the catch or stock, damage fishing gear or become fatally entangled in nets as bycatch, and cause extensive economic losses for the fishing industry (Jefferson and Curry, 1996; Shapiro et al., 2009; Schakner and Blumstein, 2013). However, acoustic deterrents also have been shown to cause habituation or “dinner bell” effects, large-scale noise exposure, and potential habitat exclusion for target and non-target species (Götz and Janik, 2013). Commercial fisheries are an important sector of Southern California’s economy and there is potential for adverse effects from interactions with the area’s two most abundant pinniped species: California sea lions (Zalophus californianus) and Pacific harbor seals (Phoca vitulina richardsii; Beeson and Hanan, 1996; Scordino, 2010). A variety of deterrents have been used to keep these species away from fishing operations and areas.
One type of deterrent uses small charges of chemical explosives. Common types of explosive deterrents are cracker shells and seal bombs. Cracker shells, which are fired from a pistol and detonate in air or at the water surface, usually produce less energy than seal bombs (Awbrey and Thomas, 1987). More commonly used are seal bombs, or seal control devices, which consist of 2–6 g (depending on type and fabrication origin) of explosive flash powder mixture (mostly with potassium perchlorate as an oxidizer, pyro-aluminum powder and sulfur fuel as a fire starter) in a sealed cardboard tube. Fitted to the tube is an 8-s waterproof fuse at one end. The tube is weighted with sand or silica at the other end so that it will sink and explode approximately 1–4 m below the water surface (Myrick et al., 1990a). Common United States made seal bombs usually contain about 2.3 g explosive charge mixture and are similar to M-80 firecrackers. They are assumed to produce at least 80% of the pressure of an equivalent charge of Trinitrotoluene (TNT; Myrick et al., 1990a). In general, explosions are relatively broadband in frequency, with most sound energy in the low-frequency range of <1 kHz. Awbrey and Thomas (1987) reported seal bombs to produce a flash of light and a 30 ms impulse resulting in sound exposure levels of 190 dB re 1 μPa2-s @ 1 m. Wiggins et al. (2021) recently conducted a field experiment with seal bombs and calculated a peak source pressure level of 234 dB re 1 μPa m and a sound exposure source level of 203 dB re 1 μPa2 m2s over a 100 ms window.
Seal bomb use in fisheries seems to be mostly concentrated along the North American west coast (this study; Ryan et al., 2016; Wiggins et al., 2017; Simonis et al., 2020). Few studies or even brief references on their use in other areas exist [South Africa: Shaughnessy et al. (1981), Tasmania: Pemberton and Shaughnessy (1993), New-Zealand: Visser (2000) and Kemper et al. (2003)]. Within United States fisheries, the limited amount of published studies referring to seal bombs show that they have been used in a variety of different fishing sectors, including the king mackerel troll fishery (Zollett and Read, 2006), yellowfin tuna (Thunnus albacares) purse-seine fishery (Cassano et al., 1990), various salmon fisheries, and the steelhead trout fishery (Jefferson and Curry, 1996). Seal bombs have been used in the yellowfin tuna purse-seine fishery since at least the 1970s to catch schooling fish, and since the 1980s to control the swimming behavior of dolphins and catch the tuna following them (so called “porpoise fishing”). Cassano et al. (1990) reported no significant effect of seal bomb use on dolphin mortality during this type of procedure, but Myrick et al. (1990b) tested a variety of seal bombs and determined, based on extrapolated impulse pressures and tests with dolphin carcasses, that seal bombs can cause severe to moderate injury (tissue damage) to dolphins when detonated within a 0–4 m distance. A human swimmer was accidentally killed by a similar device when it was detonated 0.3 m away (Hirsch and Ommaya, 1972). Kerr and Scorse (2018) described the lethal injuries of two sea lions that were found by staff of the Marine Mammal Center in Monterey Bay, which were most likely caused by seal bombs. Additionally, a recent review on seal bombs pointed out the potential threat they pose to Monterey Bay harbor porpoises regarding not only hearing damage but also behavioral effects like displacement or disturbance which possibly result in reduced foraging effort and success (Simonis et al., 2020).
Due to these adverse effects, a complete ban of seal bombs for the tuna purse-seine fishery was declared in March 1990 (55 Federal Register 11588) and in 1995 NOAA proposed to prohibit the selective use of seal bombs for deterring cetaceans, but not pinnipeds (NOAA, 1995). The Bureau of Alcohol, Tobacco, Firearms and Explosives (ATF) has enforced the regulations of the Safe Explosives Act on seal bombs and similar pest control devices since May 2011. As a reaction to this law enforcement, groups such as the Alaska Trollers Association, which represents salmon fishermen in Southeast Alaska, called out for an exemption for the commercial fishing community because seal bombs were an important tool for fishermen and represented the most effective, non-lethal deterrent for sea lions (Alaska Trollers Association, 2012). However, while explosive deterrents appear effective initially, scientific studies have shown them to be ineffective in the long-term. While pinnipeds were sometimes deterred for at least a short period of time, it was common for habituation to occur and the pinnipeds learned to avoid or tolerate the noise [seals and sea lions: Geiger and Jeffries (1987), Scholl and Hanan (1987), South African fur seals: Shaughnessy et al. (1981), and Australian fur seals: Pemberton and Shaughnessy (1993)]. Seal bombs were also ineffective at keeping cetacean species away from fishing activities or preventing entanglement for killer whales (Dahlheim, 1988) and harbor porpoises (Hall et al., 2002). More recent pinniped deterrence programs, to prevent sea lions from feeding on endangered salmon species, included a combination of vessel hazing and explosives (Brown et al., 2008, 2013). Jefferson and Curry (1996) provide a review summarizing the effectiveness of explosive and other harassment devices. For most of these studies, the underlying data came from interviews with fishermen or data coverage was low. However, the overall conclusion was that explosives are not very helpful for deterring pinnipeds or increasing catch success.
Since the 1990s the issue of seal bombs has been largely overlooked. When explosions have been discussed in the literature, the focus has been on explosions with a much higher charge weight (several kilograms) compared to that of explosive deterrents (a few grams; Hubbs and Rechnitzer, 1952; Saila et al., 1993; Todd et al., 1996; Finneran et al., 2000; Fox et al., 2003; Woodman et al., 2003; Fox and Caldwell, 2006; Govoni et al., 2008; Viada et al., 2008; Dos Santos et al., 2010; Koschinski, 2012; Buckstaff et al., 2013). But with increasing awareness of the impact of anthropogenic sounds on marine life (Popper and Hawkins, 2012; Shannon et al., 2015; Williams et al., 2015), seal bombs have more recently moved back into scientific and public focus (e.g., Baumann-Pickering et al., 2013; Kerr and Scorse, 2018; Simonis et al., 2020). In August 2020, NOAA officially proposed Guidelines for Safely Deterring Marine Mammals (NOAA, 2020) which regulate the use of seal bombs as marine mammal deterrents (these guidelines don’t have jurisdiction if seal bombs are being used for other fishing practices besides deterrence). However, no long-term studies on the spatio-temporal distribution of seal bomb use in fisheries or their large-scale contribution to noise pollution in the marine environment have been conducted. To provide insight on the use of seal bombs in fisheries, we evaluated long-term passive acoustic monitoring (PAM) recordings from 2005 to 2016 offshore of California, an area of extraordinary importance for commercial fisheries. The aims of this study were to: (1) investigate the spatio-temporal occurrence, distribution, counts and received sound exposure levels of recorded seal bomb explosions within two important commercial fishing areas, the Southern California Bight and Monterey Bay; (2) analyze long-term trends of explosion occurrence and compare the past and recent state of seal bomb use; (3) assess if and how timing and locations of commercial fishery landings from economically important purse-seine fishing sectors and the occurrence of recorded explosions correlate on different temporal scales.
Materials and Methods
Acoustic Recordings
Between 2005 and 2016, autonomous High-Frequency Acoustic Recording Packages (HARPs; Wiggins and Hildebrand, 2007) collected long-term passive acoustic data at 20 different sites offshore of California: 19 within the Southern California Bight and one close to the Monterey Bay area (Figure 1). Additionally, acoustic data were recorded between 2015 and 2016 at the MARS (Monterey Accelerated Research System) cabled observatory in Monterey Bay (Ryan et al., 2016). Recorders were all bottom-moored at average seafloor depths between 260 and 1,380 m (Supplementary Table 1).
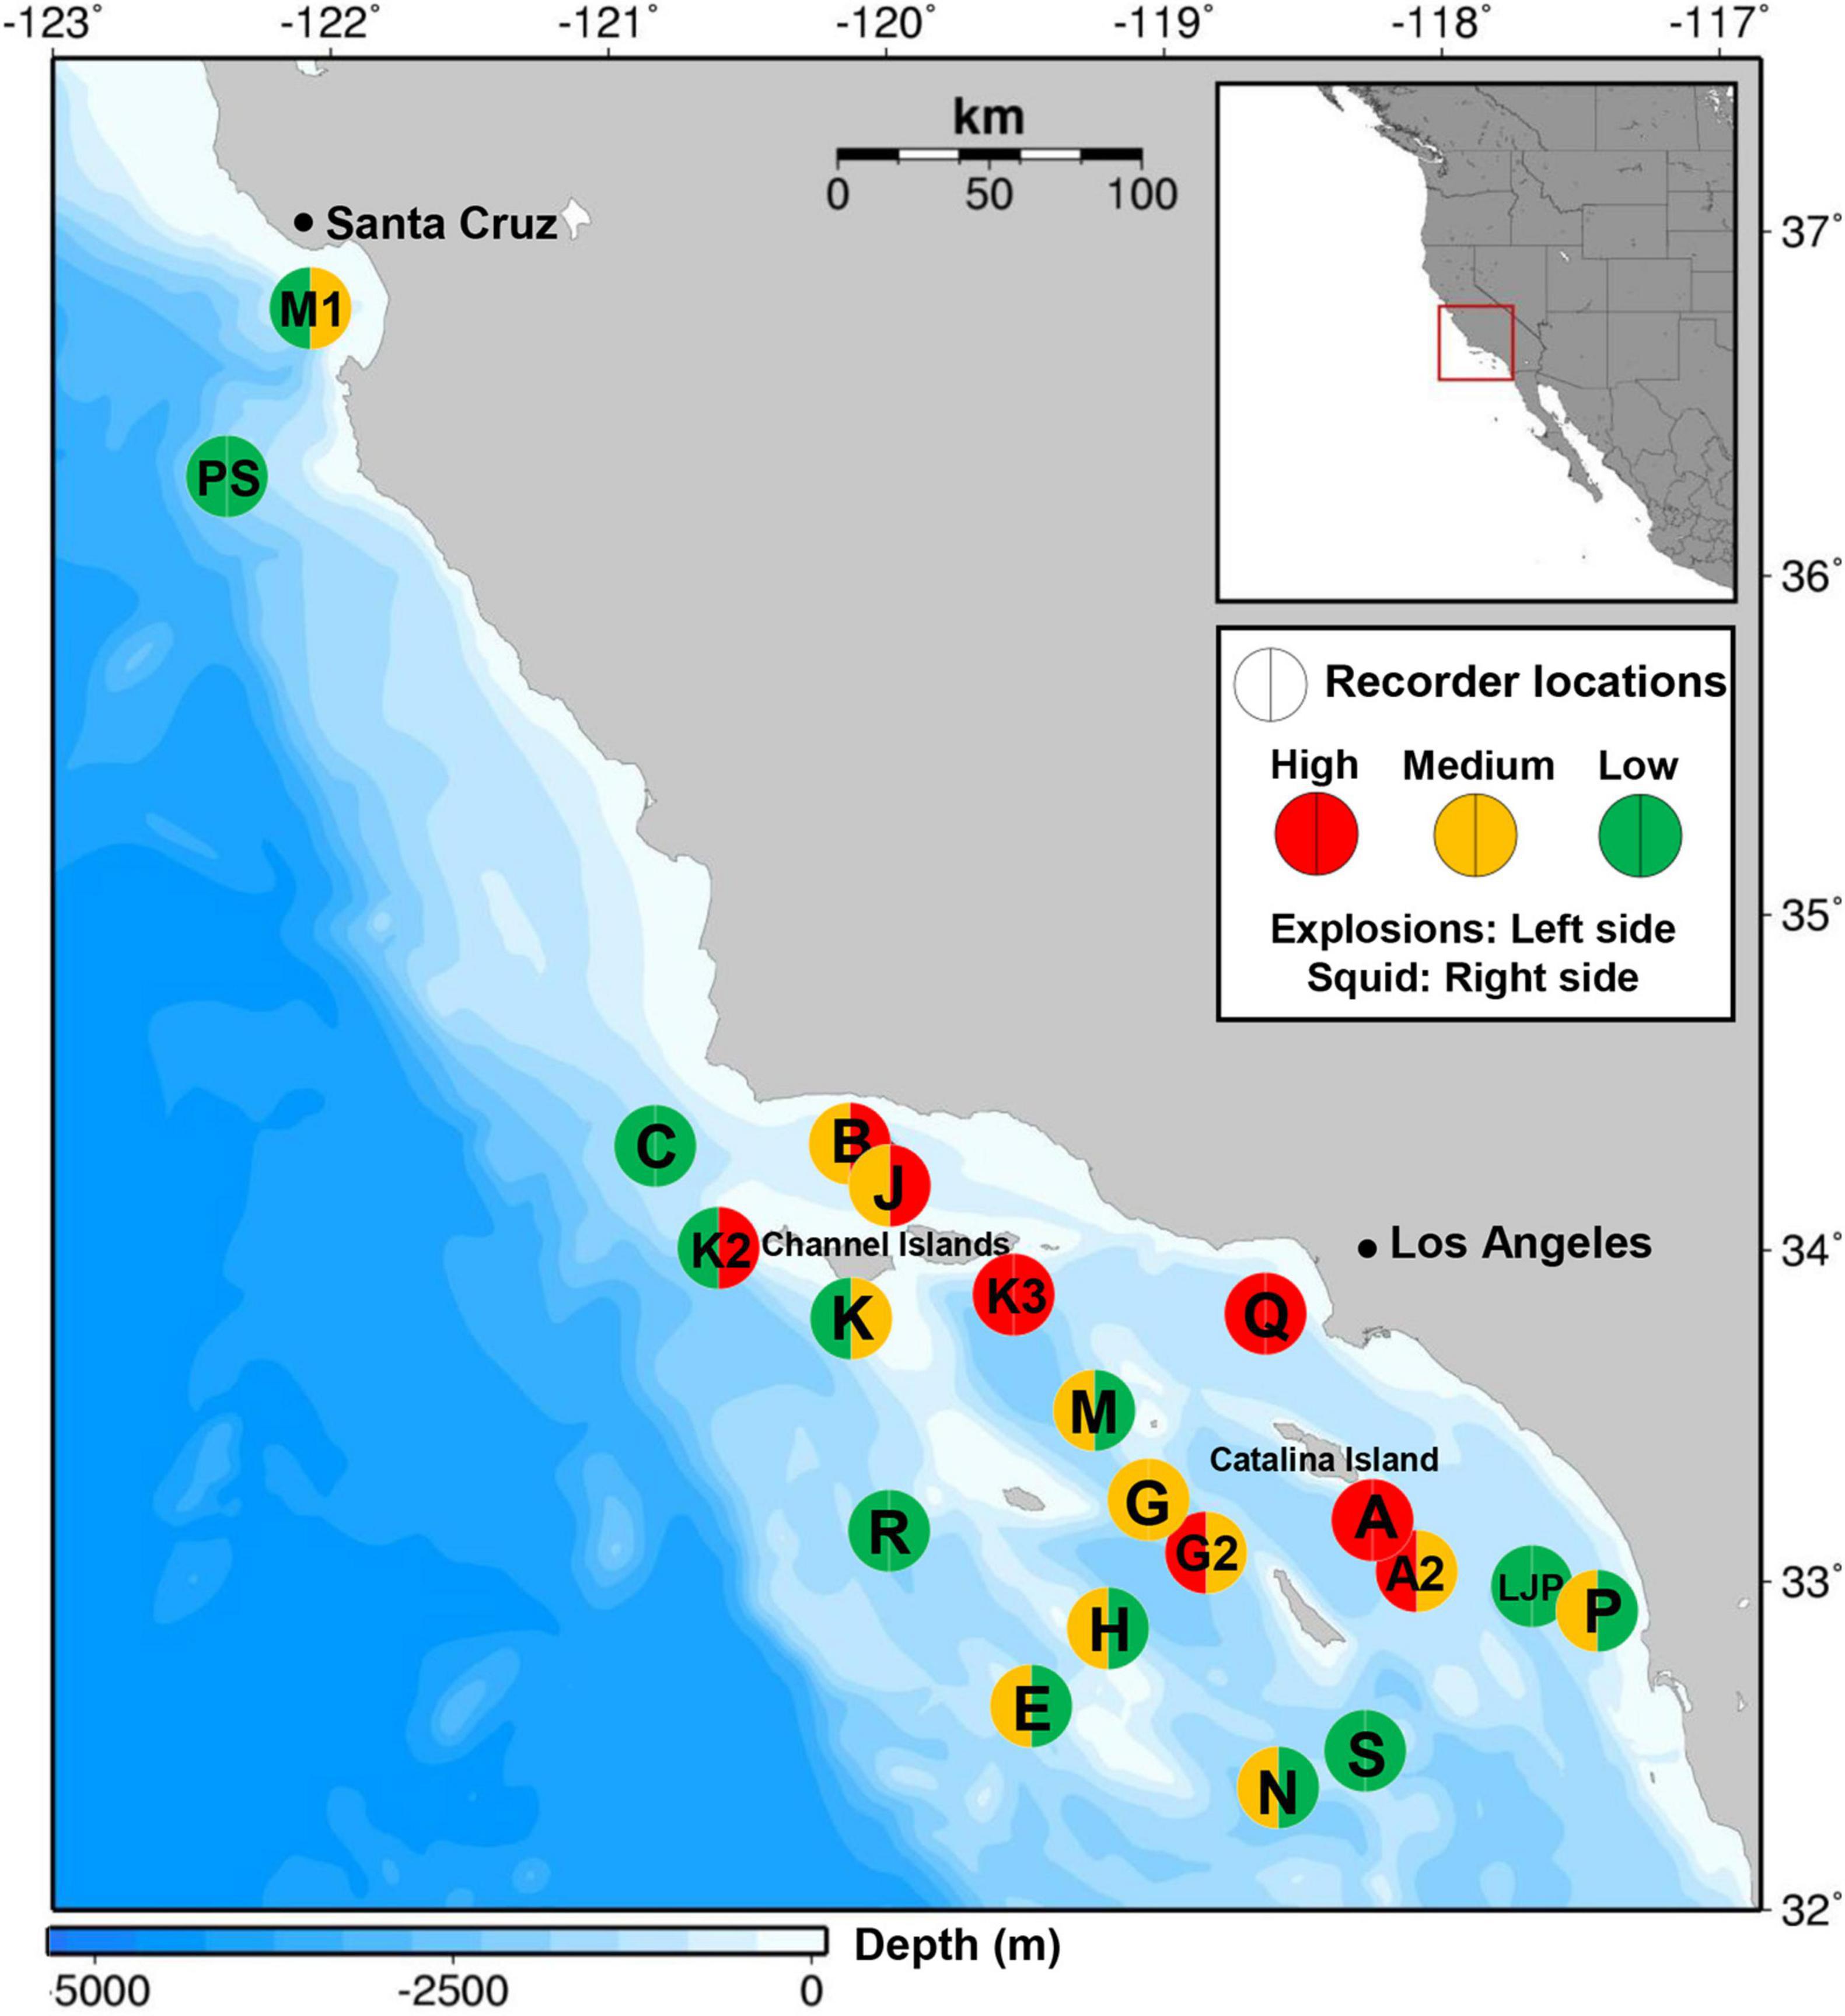
Figure 1. Locations of 21 passive acoustic monitoring sites (circles) deployed between 2005 and 2016 in the Southern California Bight and the Monterey Bay area with high (red), medium (orange) or low (green) explosion occurrence (left side of circle) and market squid landings (right side of circle). For definition of high, medium and low categories for explosions see Table 2. Squid landings were labeled as high, medium or low according to the average daily landings (high > 100,000 lbs, medium 25,000–100,000 lbs, low <25,000 lbs) reported within a 50 km radius and during recording period of the corresponding recording site. Map generated using Maptool. 2002. SEATURTLE.ORG, Inc. http://www.seaturtle.org/maptool/ (2018/08/08).
High-frequency acoustic recording packages are calibrated acoustic recording instruments that have a hydrophone suspended 10 m above the seafloor, are capable of continuous recording up to 160 kHz and are usually deployed for several months up to a year (Wiggins and Hildebrand, 2007, 2016). For this study, HARPs were all set to a sampling frequency of either 200 or 320 kHz with 16-bit quantization (effective bandwidth 10 Hz to 100 or 160 kHz, respectively). Each HARP was equipped with a two-stage hydrophone to cover the broad frequency range. The low-frequency stage (10 Hz to 2 kHz or 25 kHz) was comprised of a bundle of six cylindrical elements (AQ-1, Teledyne Benthos Inc., North Falmouth, MA, United States), while the high-frequency stage (2 or 25 to 100 kHz) used a single spherical element (typically ITC-1042, International Transducer Corporation, Santa Barbara, CA, United States). These sensors were connected to a custom-built preamplifier and low-pass filter circuit board (see Wiggins and Hildebrand, 2007). The calibrated system response was applied to the recordings during data analysis. The MARS cabled observatory was equipped with an icListen Smart hydrophone (Ocean Sonics Ltd., Great Village, NS, Canada), used a sampling frequency of 256 kHz (effective bandwidth 10 Hz–128 kHz) and 24-bit quantization. The manufacturer provided hydrophone calibration.
Individual deployment durations varied from a few weeks to several months while recording schedules were either continuous (87.5% of 208 analyzed deployments in total) or duty cycled (26 deployments, with 5 min of recordings occurring at 7–25 min intervals; Figure 2). To prevent overestimation of explosion counts, we decided on a conservative estimation of explosion counts for statistical analyses by not correcting for differences in duty cycles using a linear normalization scheme because explosions are individual events and are not continuous over time. This likely resulted in underestimating explosion counts at certain sites and times. However, only for calculation of maximum explosion counts per day, corrected values were shown additionally underneath Table 1 (but not used to categorize sites regarding explosion intensity) to highlight the potential extent of noise pollution. The total amount of analyzed data varied between sites, from about 4 months to over 7 years per site. In this study, the cumulative amount of data for all sites exceeds 47.5 years (17,370 days; Figure 2 and Supplementary Table 1). The varying recording effort between sites over the years of this study potentially affects the explanatory power of spatial comparisons between sites, as a site where recordings are only available during peak fishing years (e.g., site Q) is difficult to compare to a site where only more recent data (e.g., sites LJP and M1) were analyzed. Again, to prevent overestimation of explosion noise, we did not sum up explosion counts over multiple sites, as there may have been double counts of some explosions if the same explosion signal was recorded at different sites that were recording simultaneously.
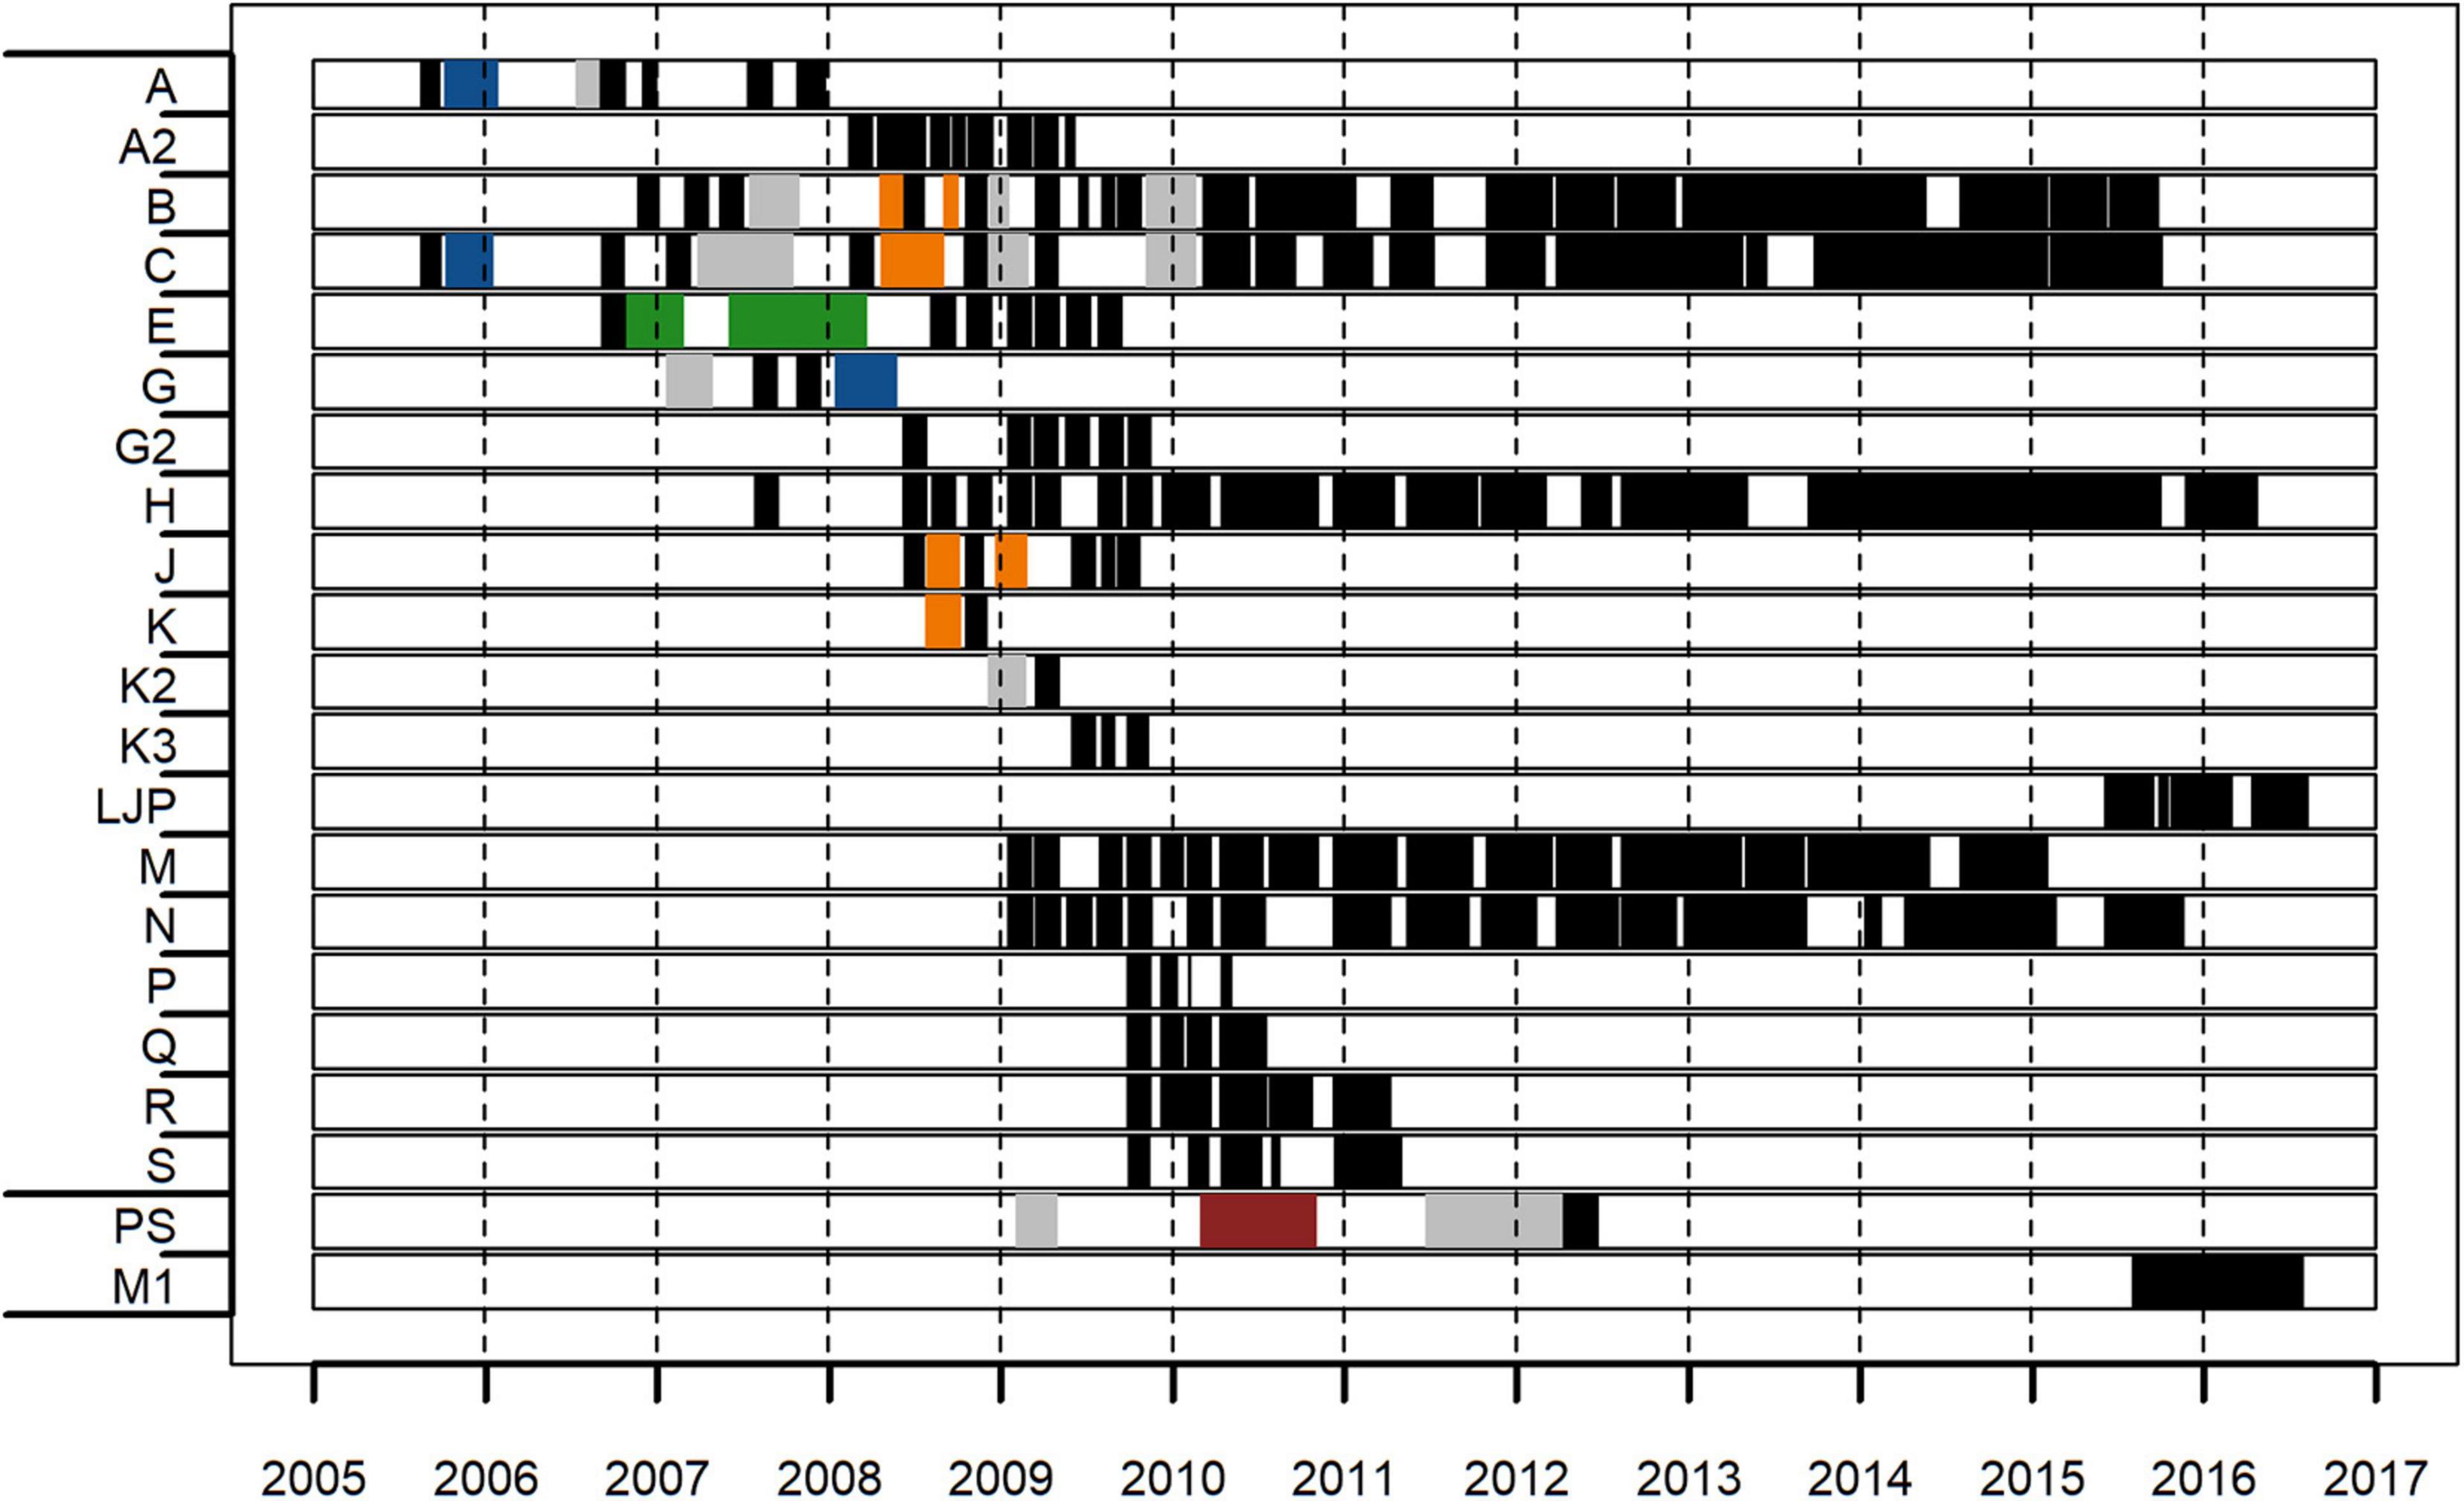
Figure 2. Overview of acoustic recording periods with explosion analysis effort per site between 2005 and 2016; the first 19 sites (A–S) are from the Southern California Bight, the last two sites (PS and M1) are from the Monterey Bay area. Black (continuous recordings) and colored areas (duty-cycled recordings; recording duration (min)/recording interval (min): orange = 5/7, gray = 5/10, blue = 5/15, green = 5/20, red = 5/25) represent times of explosion analysis effort.
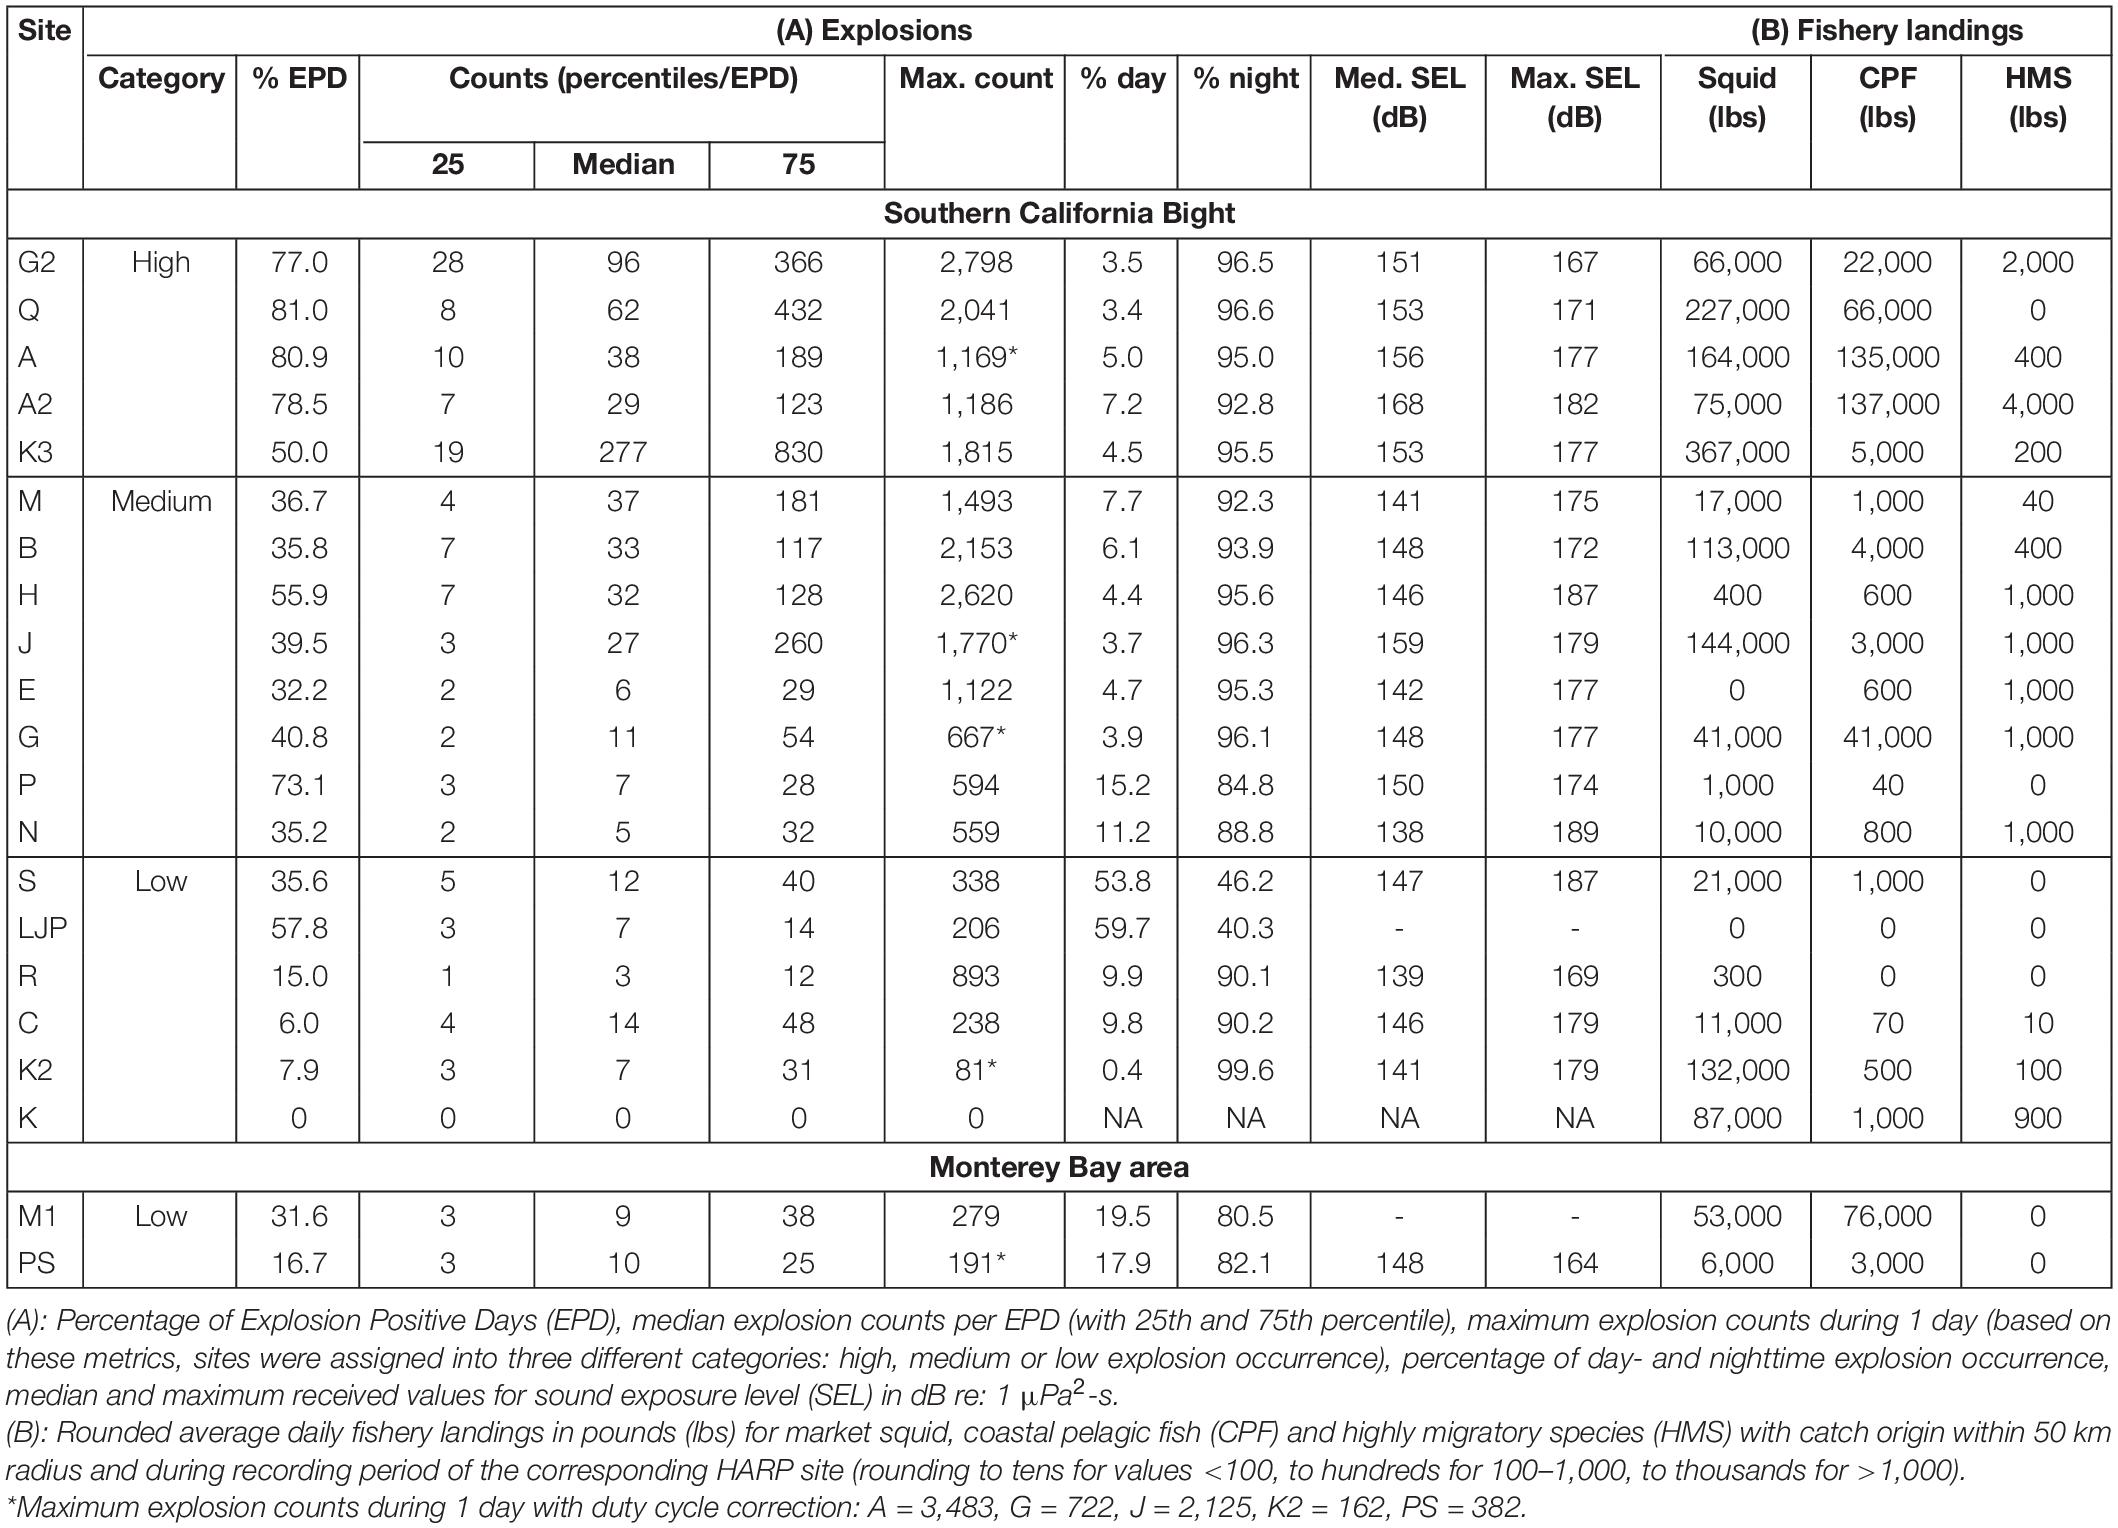
Table 1. Overview of (A) explosion counts and SEL and (B) fishery landings for the monitoring sites across all years.
Explosion Detections and Metrics
All recordings were decimated by a factor of 20 to create an effective acoustic bandwidth from 10 Hz to 5 or 8 kHz (for 200 or 320 kHz sampled HARP data, respectively) and from 10 Hz to 6.4 kHz (for 256 kHz sampled MARS hydrophone data). Effort was directed toward finding explosions, which included seal bombs, military explosions and other explosive events. High explosive detonations are characterized by a sharp onset, a shock wave rising toward a large peak almost instantaneously, followed by a reverberant decay (Cole, 1948). The flash powder in seal bombs deflagrates and does not detonate like high explosives, but overall, they show a similar impulsive signature (Wiggins et al., 2021).
Individual explosion signals (Supplementary Figure 1) were automatically detected using a MATLAB-based (Mathworks, Natick, MA, United States) matched filter detector algorithm. It cross-correlated the envelope (Hilbert transform; Au, 1993) of the template explosion signal (for waveform of template explosion see Supplementary Figure 2A), which is a filtered composite set of recorded example explosions, with the envelope of 75 s recording segments to capture similarities. The cross-correlation was squared to “sharpen” peaks of explosion detections. The time series was digitally filtered with a 10th order Butterworth band-pass filter, with a band-pass between 200 Hz and 2 kHz. The low frequency cutoff was set to minimize the influence from noise from sources such as boats and weather; the high frequency cutoff minimizes interferences with sources such as mid-frequency sonar and odontocete whistles. Once the correlation coefficient exceeded the specified threshold (above the median cross-correlation calculated over each 75 s segment to detect explosions within, e.g., noise from shipping) the time series waveform containing the potential explosion signal was inspected more closely. Consecutive explosions had to have a minimum time difference of 0.5 s to be detected as separate signals. For each detection period, a Hilbert envelope with a floating smoothing window of 300 samples was calculated while explosion signal start and end times were extracted based on a 2 dB above the average envelope threshold. Signal duration and noise before and after the signal (based on peak-peak and root-mean-square (rms) received levels) were computed and used to eliminate false detections. The potential explosion was classified as a false detection and deleted if (a) the signal duration was shorter than 0.03 s or longer than 0.55 s, (b) the dB difference between the signal and the time before the signal for peak-peak and rms received levels were less than 3 and 1 dB, respectively, or (c) the dB difference between the signal and the time after the signal were less than 4 and 1.5 dB, respectively. These thresholds were empirically established based on the histogram distribution of manually verified true and false detections. Additionally, as HARP data contain self-noise every 75 s from disk writing, those periods, of up to several seconds with specific narrowband spectral features, were excluded from the detection algorithm. The detector output was saved into a log file containing information on start and end times, durations and received level differences of explosions and surrounding noise.
The detector algorithm was designed to produce a limited number of false-negative detections in exchange for a high number of false-positive detections (>85% false-positive detection rate for all detected potential explosion signals). Therefore, each automated detection was manually reviewed and verified by trained analysts. To do so efficiently, a MATLAB-based custom graphical user interface (GUI) was used (Helble et al., 2012), which displays time-condensed spectrograms of the detections, provides tools to listen to them (adjustable band-passed audio) and to make a verification decision (accept as true or reject as false-positive detections; for example see Supplementary Figure 2B). The GUI reads in the explosion detector log files as well as the corresponding decimated (factor of 20) .wav files. Afterward, metadata of all positive detections were stored in the Tethys metadata database (Roch et al., 2016).
The sound exposure level (SEL) was calculated for each detected explosion signal using custom MATLAB scripts. For impulse signals, such as explosions, the SEL, calculated by integrating the sum-of-square pressures over the duration of the pulse, is more appropriate than peak or root-mean-squared sound pressure levels, because it accounts for the total energy in the signal, not just the pressure amplitude (Wiggins et al., 2021). For SEL calculation the undecimated and unfiltered raw data were taken as a basis. The time series was then digitally filtered with a 50 Hz high-pass elliptical filter and decimated by a factor of 10. Calculated SEL values are received, not source values, from explosions with unknown distance to the hydrophones and are therefore influenced by various distance and surrounding noise effects.
Commercial Fishery Data
Information on California commercial fishery landings, which are fish and shellfish caught, landed, sold and subsequently reported at California harbors, were provided by the California Department of Fish and Wildlife (CDFW) for target species caught with purse-seine, drum-seine, lampara, half ring and other encircling nets. Only target species caught with these gears were chosen for analyses as (a) they usually belong to the largest volume fisheries in California and (b) information from fishing agencies and fishing experts indicated their use of explosive deterrents. For this analysis, a target species was defined as the species that made up greater than or equal to 50% of the weight recorded on a landing receipt. If the landing was a 50/50% split of two different species, the landing would have two target species (0.09% of the dataset), but if the landing was 51/49% of two different species, the landing would have only one target species. In addition, mixed landings where no single species accounted for greater than 50% of the landing were excluded from the analyses (0.3% of the dataset).
California Department of Fish and Wildlife fishery data included monthly and daily amounts of landings (weight in pounds) and number of landing receipts (number of times a target species was landed) for each purse-seine target species per fishing block (catch origin) for the years 2005 until 2015. Fishing blocks are a grid of rectangular areas within the Exclusive Economic Zone off California and are used to report catch locations on CDFW landing receipts to describe a general location for fishing activity. Their relatively large size, of approximately 11 × 9 nautical miles (except for blocks along coastlines), allow fishermen to keep their specific fishing sites private. The distances between the center of each fishing block and each of the 21 hydrophone sites were calculated, and only landing and receipt data from fishing blocks with up to a maximum distance of 50 km and within the recording period of the HARP sites were included for subsequent statistical analyses and comparisons with acoustic explosion data. Simonis et al. (2020) calculated a transmission loss model for seal bomb noise (at 250 Hz) in California waters; the results show that seal bomb noise is still detectable in 50 km distance. Recreational fisheries were not included as (a) exact catch reports are only legally required for a handful of species and commercial passenger fishing vessels (recreational fishing effort is estimated within the California Recreational Fisheries Survey based on field sampling and telephone surveys) and (b) seal bombs are mostly used by commercial fishermen.
For the correlation analyses and/or comparisons with temporal and spatial explosion patterns, commercial landing and receipt data for ten purse-seine target species were divided into three fishery sections according to the fleets they were caught by: (1) market squid, (2) coastal pelagic fish (CPF), and (3) highly migratory species (HMS). Five of these 10 species are considered coastal pelagic species and represent the largest purse-seine fisheries in California, both in terms of landings volume and value (CDFW landing receipts, 2005–2015). Additionally, these fisheries primarily operate in Southern California and, to a lesser extent, in Central California (Hackett et al., 2009) and are therefore concentrated in our study area. Within this group, market squid (Doryteuthis opalescens) represents the number one fishery in the state, with 11,216 landing receipts for 2005–2015 in total (CDFW landing receipts, 2005–2015). In 2010, for the California commercial market squid fishery permits for 81 market squid vessels (large purse-seine vessels), 25 brail vessels (brail gear) and 53 light boats (used to attract but not catch squid) were issued (California Department of Fish and Wildlife, 2021). The other four coastal pelagic species, Northern anchovy (Engraulis mordax), Pacific sardine (Sardinops sagax caerulea), Pacific mackerel (Scomber japonicus) and Pacific jack mackerel (Trachurus symmetricus), had 8,972 landing receipts for 2005 to 2015 in total and will be referred to as coastal pelagic fish (CPF). For CPF, the main fleet consisted of about 65 participants using primarily purse-seine gear. However, many of the vessels fishing for CPF also fished for market squid and vice versa, when available, or when there were market orders for certain species. The remaining five purse-seine target species, which were considered for this study, are highly migratory species (HMS): Pacific bonito (Sarda lineolata), albacore tuna (Thunnus alalunga), Pacific bluefin tuna (Thunnus orientalis), skipjack tuna (Katsuwonus pelamis), and yellowfin tuna (Thunnus albacares). These HMS species represented the third largest group of fish caught with purse-seine gear in California. Although there were fewer landing receipts of HMS species from 2005 to 2015 than for market squid and CPF (251; CDFW landing receipts, 2005–2015), they were selected for analyses because of the use of seal bombs by the tuna purse-seine fishery in the past (Cassano et al., 1990).
Statistical Analyses
All statistical analyses were done using R 4.0.3 (R Core Team, 2020). For each site, the percentage of explosion positive days (% EPD) over the respective recording period was calculated to describe the degree of explosion persistence. A day was explosion positive if a minimum of one explosion was recorded on that day. Median and maximum explosion counts per EPD were calculated to describe the intensity of explosion occurrence. These metrics were chosen to account for the high degree of variability within the data. Based on these three metrics, each site was assigned to one of three categories: high, medium or low explosion occurrence (Table 2). Classification in one of the categories required at least two out of the three metrics to fall into that category.
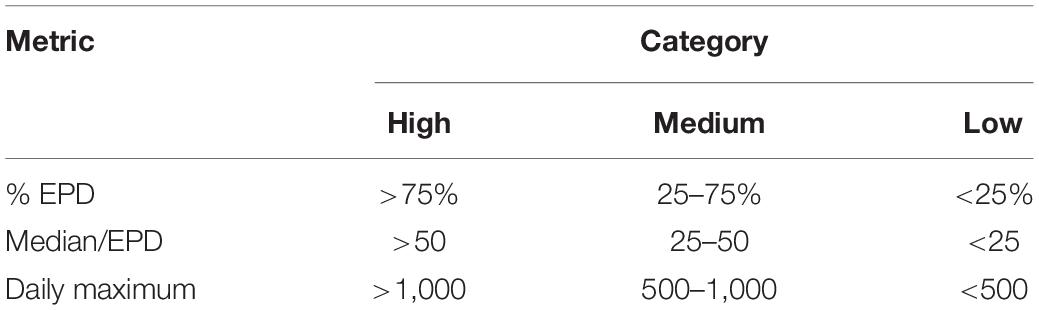
Table 2. Category metrics and threshold values for classification of sites regarding explosion occurrence.
Explosion counts were examined for diel patterns. For each site, daily sunrise and sunset data were obtained from the National Oceanic and Atmospheric Administration Earth System Research Laboratory website (NOAA solar calculator). Each detected explosion was assigned to either a day- or nighttime period, separated by apparent sunset and sunrise times. A Kruskal-Wallis test was used to examine whether differences were significant between day and night. As fishery landings and receipt data were only available per day, no diel pattern was examined. Weekday and annual patterns of explosion occurrence and fishery landings were analyzed and compared for significant differences using a pairwise Wilcoxon rank sum test with p-value correction method after Benjamini and Hochberg (1995). For non-parametric tests the R package zoo (v1.8-9; Zeileis et al., 2021) was used. For analysis of weekday patterns it is important to note that fishery data represents the weight of fish landed at California ports per day, although the day it was actually caught can vary because catches are not always reported the same day (especially on Sundays). Particularly for fisheries operating at night, fish were often caught the day before they were landed.
Seasonal patterns of explosions and fisheries were analyzed via generalized additive modeling (GAM) testing calendar week (as proxy for seasonal development) as predictor (with cyclic cubic smooth function) and year and site as categorical factors. Data sampled within an ecological context, like fishery data, e.g., is often characterized by a large proportion of zeros together with a right skewed distribution and some extreme values, which was also the case here. We accounted for this by selecting a compound-gamma distribution model, a member of the Tweedie family, which are specifically appropriate to handle zero-inflation especially under variable sampling effort by site (Lecomte et al., 2013). A logit link function was used. We simplified the GAM structure through a bottom-up, stepwise procedure, selecting the best model with the minimum Akaike Information Criterion (AIC) that retained significant predictors. Basic residual plots were used for model validation. We did not correct for temporal autocorrelation of the predictor variable in the GAM, as we mainly examined the effects of calendar week, as proxy for seasonal pattern, which itself is depicted by the autocorrelation within the data, and we did not evaluate the effect of any environmental parameters. Important packages in R were mgcv (v.1.8-36; Wood, 2021) for GAM and statmod (v.1.4.36; Smyth et al., 2021) to calculate parameters of Tweedie distributional family.
At five of the 21 stations (sites B, C, H, M, and N) almost 7 years of continuous data were analyzed, collected from January 2009 until September-December 2015 (except site M, until January 2015). Data from these long-term sites were included in a trend analysis for explosion and fishery activities using the Theil-Sen linear regression method for non-parametric data (Sen, 1968). The Theil-Sen method is robust to outliers and is based on Kendall’s rank correlation. Strong seasonal patterns decrease the statistical power for detecting a trend, as they add more variability to the data. Therefore, Seasonal-Trend-Decomposition using LOESS (STL) was applied on the data before the trend analysis was conducted (Cleveland et al., 1990). STL uses a sequence of smoothing fits on localized data subsets to decompose the timeseries and to generate distinct seasonal, trend and remainder (residual) components. The seasonal component was then removed to de-seasonalize the data (Nunifu and Fu, 2019). The data from the five sites were combined to account for an overall trend development throughout the Southern California Bight. The median change of slope (and slope uncertainties) per year was used to compare the extent of trends. This trend analysis was conducted using the openair R package (v.2.8-3; Carslaw and Ropkins, 2012).
To analyze the correlation between explosion occurrence and fishing activity, we also conducted a Theil-Sen regression analysis using the R package mblm (v0.12.1; Komsta, 2019). A Daniels trend test based on Spearman rank correlation coefficient (rho) was conducted as a rank statistic using the package ggpubr (v.0.4.0; Kassambara, 2020). Rho was evaluated based on the guidelines of Cohen (1988). Correlation analyses were applied for explosion counts per week and the weekly amounts of landing receipts for the three defined fishing sectors for each site and for all sites combined. Landing receipts, instead of landings in pounds, were included in correlation analyses, as they represent a proxy for the presence of active fishing vessels potentially using seal bombs in the area. Weeks without fishing activity were excluded from the model, to focus on the analysis of the relationship of the particular fishing sector and explosion occurrence.
Results
Explosion Counts and Sound Exposure Levels
Explosions were detected at all but one (site K) of the 21 monitored sites, resulting in a total of 707,738 explosion signals (actual recorded explosions, without normalized counts for duty cycle correction) detected on a total of 6,307 recording days (36.3% EPD). EPD per site varied from 6.0 to 81.0%. Median and maximum explosion counts per EPD ranged from 3 to 277 and 81 to 2,798, respectively (Table 1). Based on these metrics, five sites were categorized as high, eight as medium and eight as low regarding explosion occurrence. The timeseries of daily explosion counts (and squid landings) for all sites can be found in the supplement (Supplementary Figures 3–5). Median and maximum SEL ranged from 138 to 167 dB re: 1 μPa2-s and 164 to 189 dB re: 1 μPa2-s, respectively (Table 1 and Figure 3).
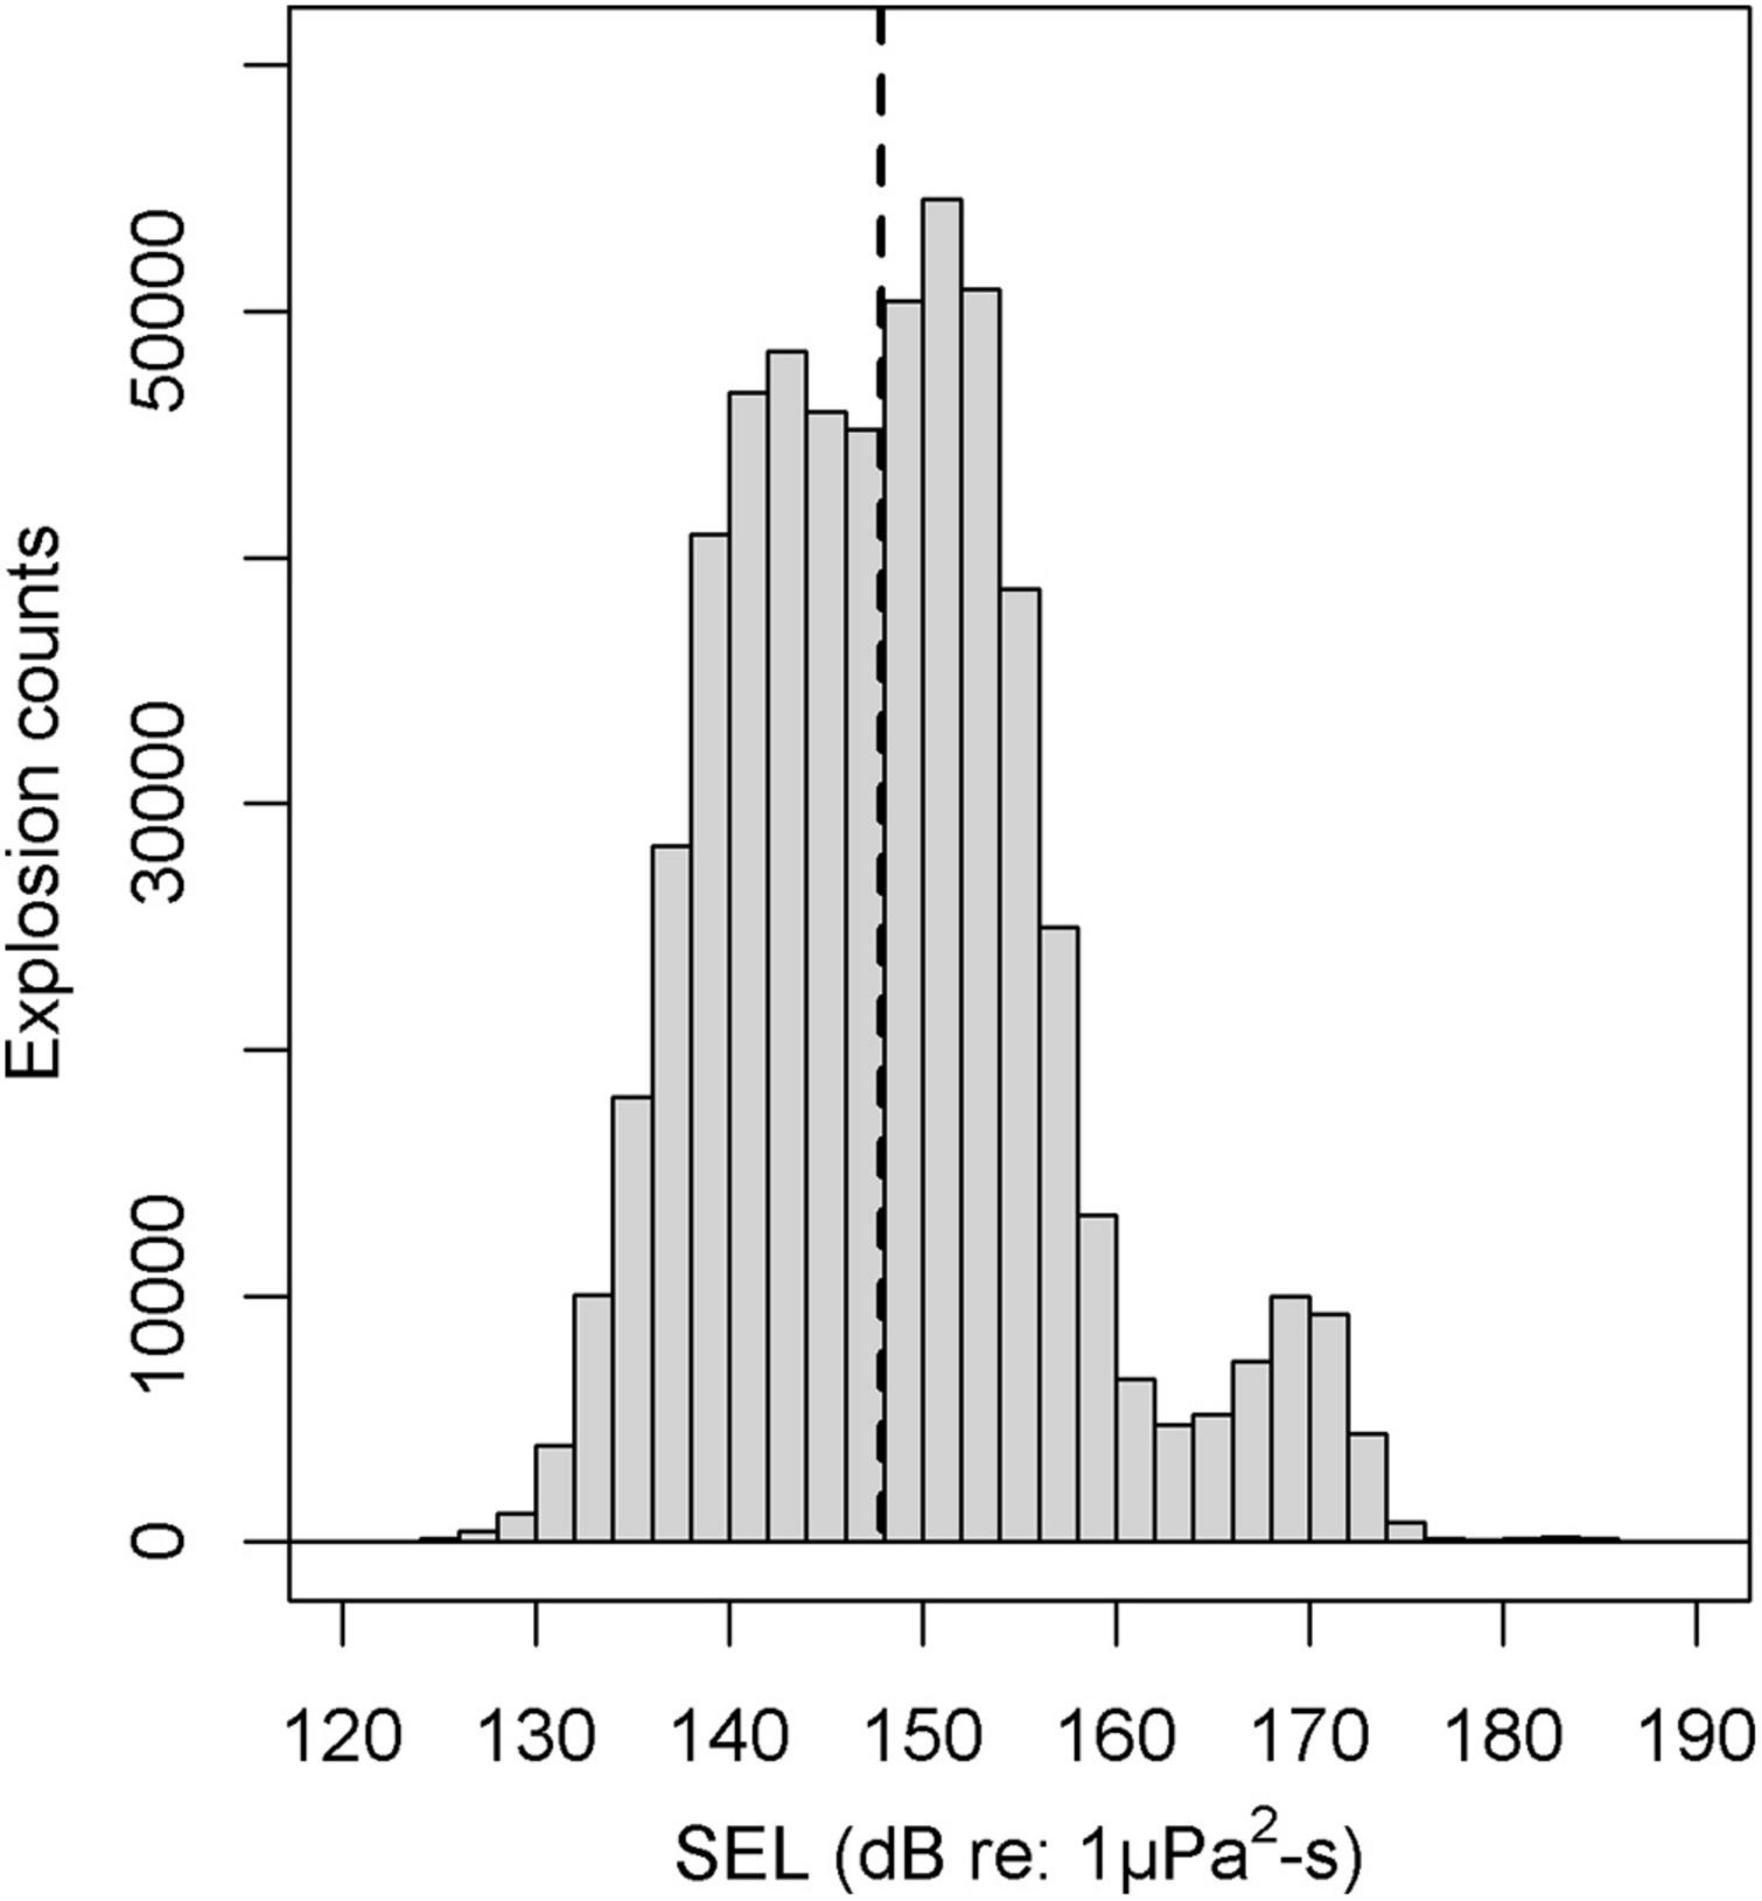
Figure 3. Frequency and distribution of the explosions received sound exposure level (SEL) in dB re: 1 μPa2-s with median (dashed line). Received values are likely influenced by effects of the unknown distance to the source and surrounding noise. SEL values show a small additional peak at around 170 dB indicating signals were above the clipping level of the hydrophone. Decreasing detections between 130 and 140 dB may result from variable signal detectability, e.g., depending on site/bathymetry.
Spatial Explosion and Fishery Landing Patterns
High explosion counts were identified at five nearshore sites (Figure 1 and Table 1): within Santa Monica Bay (site Q), around Santa Cruz Island (Channel Islands National Marine Sanctuary, site K3), at Santa Catalina Island (sites A and A2) and at San Clemente Island (site G2). They accounted for 34.4% of the total recorded explosions, but only for 8.5% of the total recording days. At these sites, median daily explosions varied between 29 and 277, while maximum values of up to 1,170–2,800 explosions per day were detected and 50–81% of the days were EPD (Table 1). Median SEL were highest here as well (151–167 dB re: 1 μPa2-s), except for site J (159 dB re: 1 μPa2-s), categorized as “medium” explosion counts. Other near-shore sites [around Santa Cruz Island (site J), Santa Barbara Island (site M) or within the Santa Barbara Channel (site B)] had overall medium explosion counts, but explosion counts were high within certain seasons, especially during winter 2008/2009 and fall 2009 (Supplementary Figure 4).
Explosion counts at offshore sites were either low (sites R, S, and PS) or medium (sites H, E, and N). But one offshore site at Tanner Bank (site H) showed high explosion counts over multiple seasons between 2009 and 2012 (up to 2,600 per day). Low or medium counts were also detected at the southern nearshore sites close to the San Diego coast (sites LJP and P). Site M1, within the Monterey Bay National Marine Sanctuary, had low explosion counts, although the recordings at site M1 started much later than in the Southern California Bight, making large-scale regional comparisons difficult (Figure 1 and Table 1). At the north-western most sites in the Southern California Bight, such as Point Conception or the western part of the Channel Islands (site C, K2, and K) explosion occurrence was low as well.
The highest amounts of squid landings were reported for fishing blocks around nearshore sites, primarily around the Channel Islands (sites J, K, K2, and K3), within Santa Monica Bay (site Q), around Santa Catalina Island (sites A and A2) and within the Santa Barbara Channel (site B). Few squid were caught around the southern nearshore sites close to the San Diego coast (sites LJP and P) and around offshore sites (E, H, PS, and R; Table 1 and Supplementary Figures 3–5). CPF landings were highest around Santa Catalina Island (sites A and A2), followed by other nearshore sites in Monterey Bay (site M1), within Santa Monica Bay (site Q) and around San Clemente Island (sites G and G2). At all other sites, CPF landings were comparatively low. HMS landings were rare compared to the other two purse-seine fisheries. They were mostly caught around nearshore sites, like A2, G, G2, and J, but also at some offshore sites, like E, H, and N (Table 1).
Diel Explosion Pattern
The majority of explosions (93.9%) were recorded at night. In the Southern California Bight, the percentage of total nighttime explosions varied between 84.8 and 99.6% at 17 sites. At two southern sites, LJP and S, the pattern was different; 53.8–59.7% of all explosions occurred during the day, but both sites had only low explosion counts. At the two sites in the Monterey Bay area, 80.6–82.1% of all explosions were detected during the night (Table 1). At 18 sites, explosion occurrence differed significantly between day- and nighttime (Kruskal-Wallis-Test p < 0.001). At three sites it was not significant (LJP p = 0.866, P p = 0.627, R p = 0.134). Overall, most explosions were recorded within the time between 22:00 and 00:59 (Figure 4). Per hour, 10.7-12.2% of all daily explosions were assigned to each of these three hour-bins. Before and after, hourly explosion counts were decreasing gradually. Explosion counts were lowest between 09:00 and 17:00 with 0.2–0.3% of all daily explosions occurring within each of these hours.
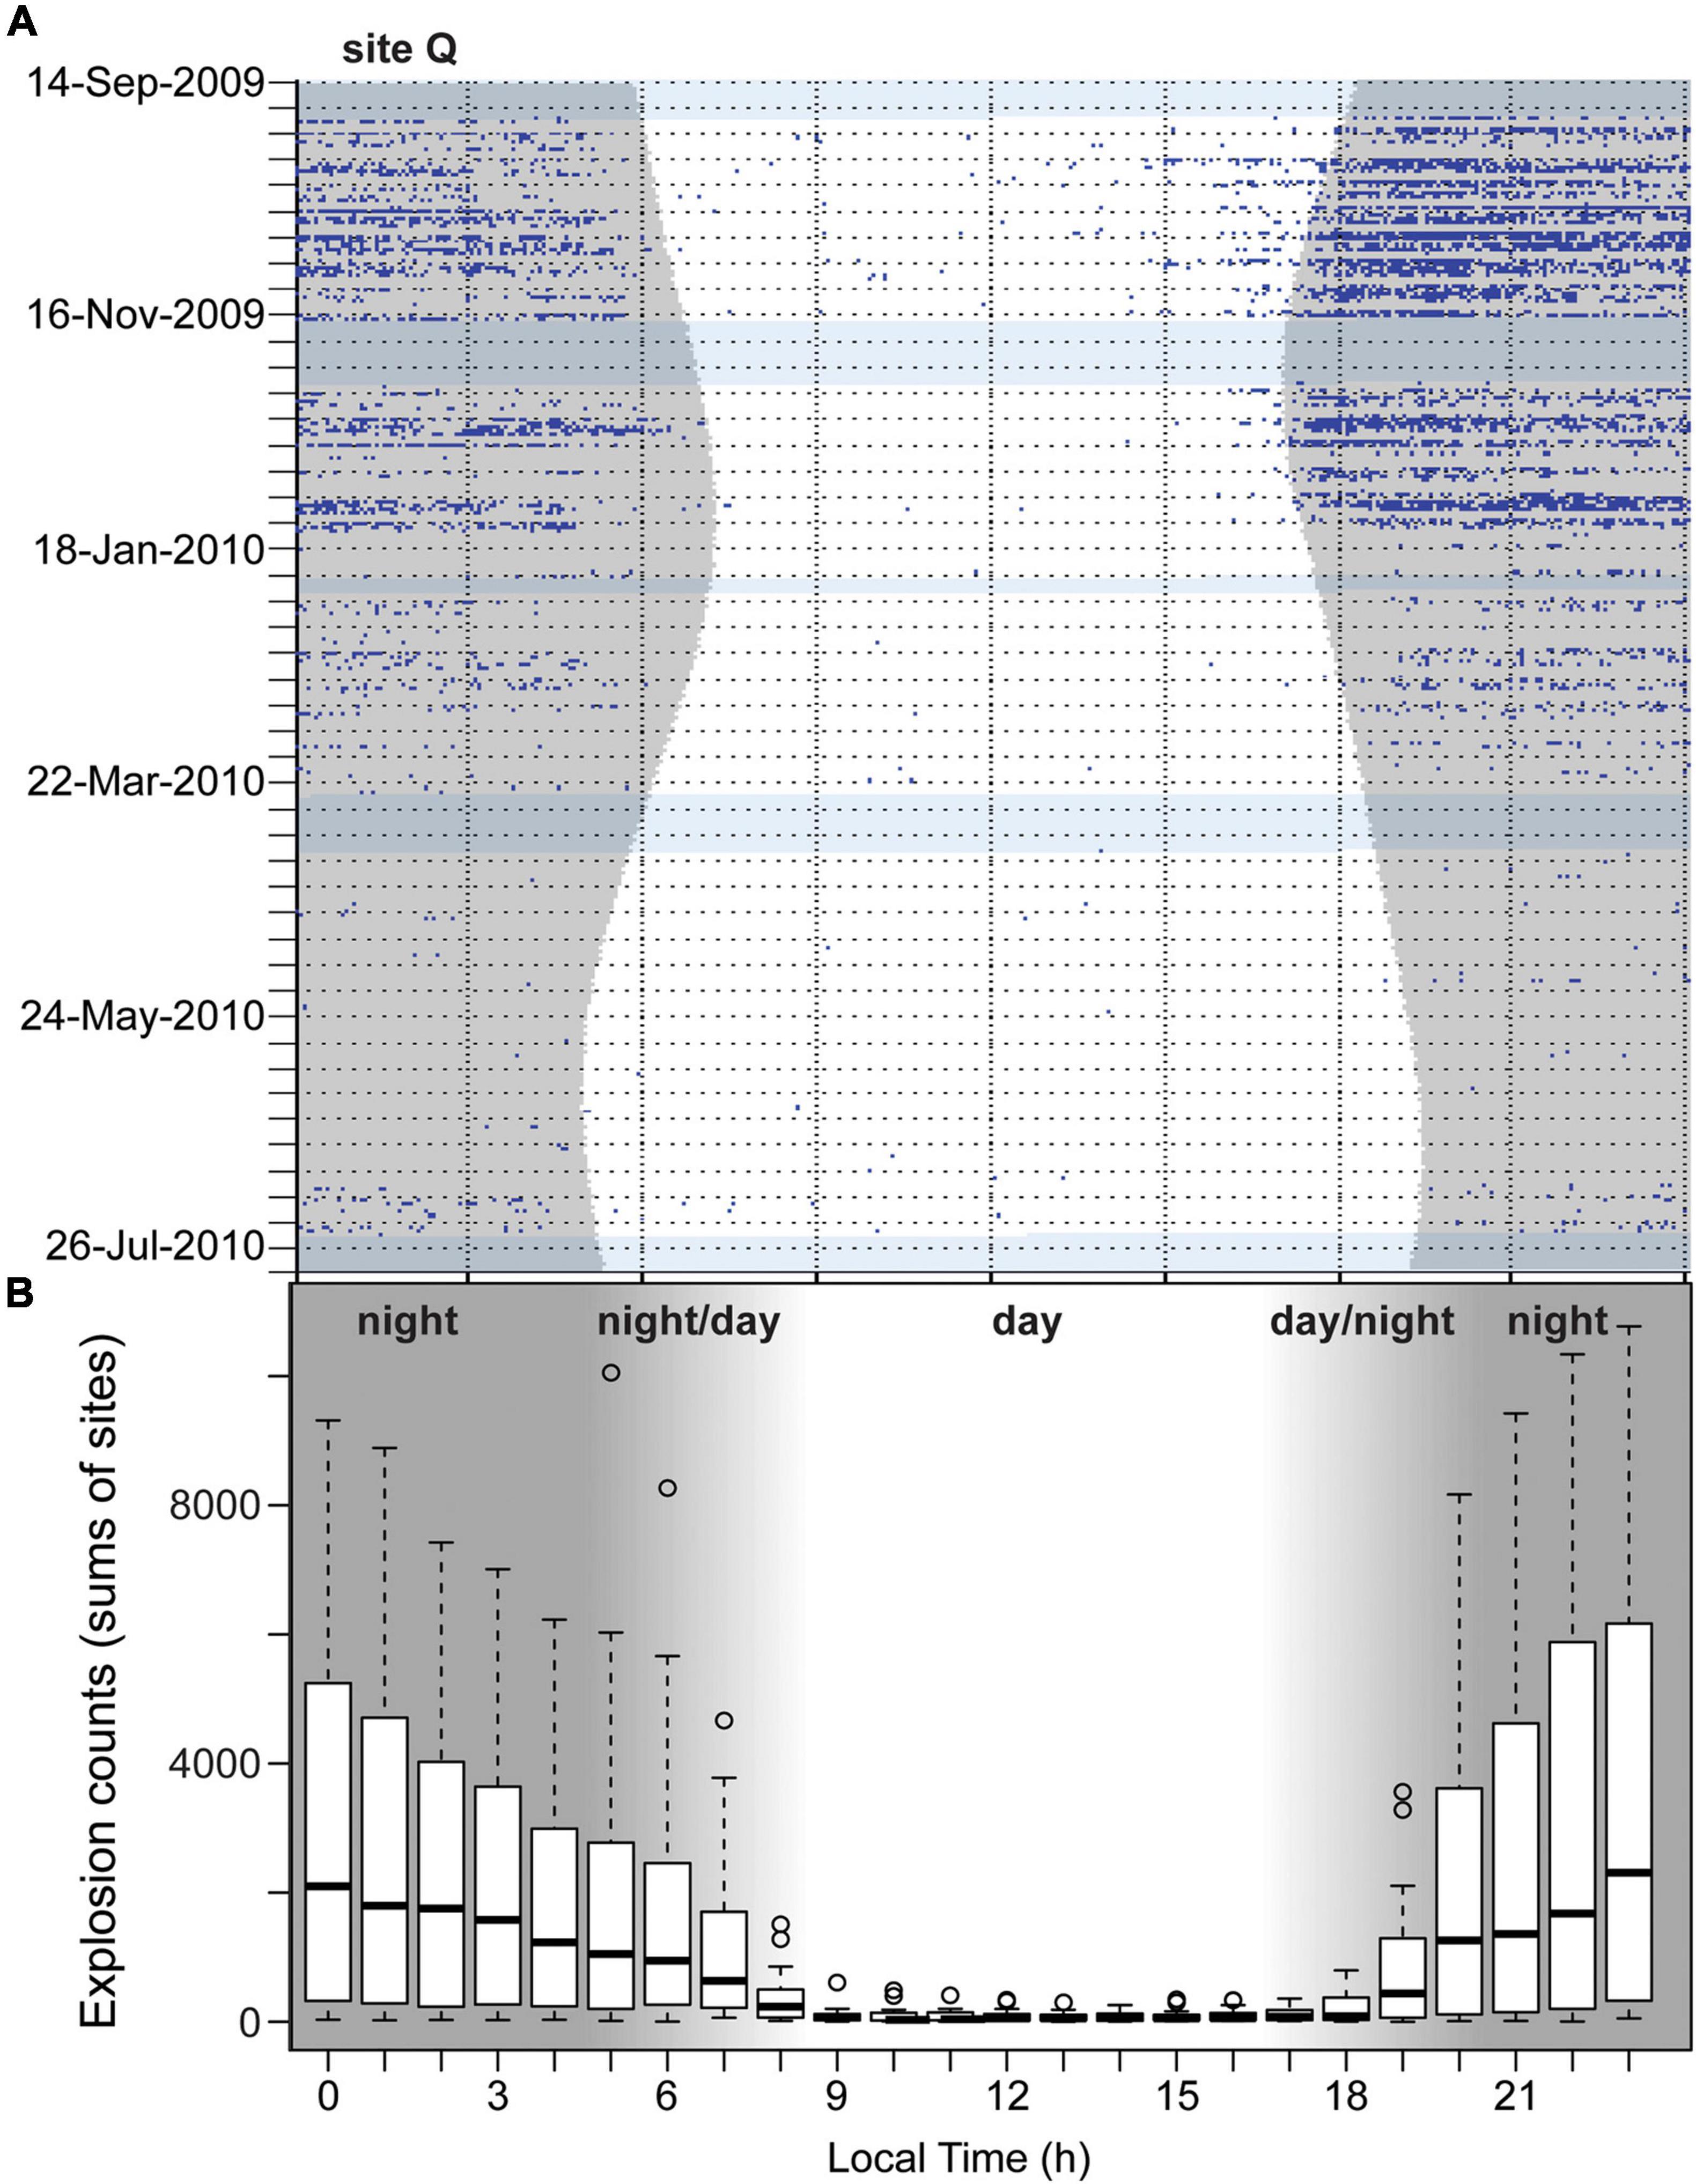
Figure 4. (A) Diel presence of explosions (blue dots) in one minute bins from September 24th, 2009 to July 21st, 2010 at site Q with high explosion counts. Gray hourglass shading denotes nighttime and light blue horizontal shading denotes periods with no recording effort. (B) Boxplot of explosion counts (sums per site) per hour of the day (dark-gray areas: nighttime, white: daytime, light-gray: day- or nighttime depending on season) at all sites.
Weekly Explosion and Fishery Landing Patterns
Explosion counts showed a clear weekly pattern (Figure 5A), with counts peaking between Mondays and Thursdays (each day with 17.9–21.8% of total explosions), decreasing on Fridays (10.0%), being almost absent on Saturdays (1.4%), and then increasing again on Sundays (10.9%). In total, there were no significant differences in daily explosion occurrence from Monday to Wednesday (pairwise Wilcoxon rank sum test, p = 0.38–0.98). Fridays and Sundays did not differ from each other (p = 0.21) and were significantly lower than all the other working days (p < 0.001). Explosion counts on Saturdays were significantly lower than on all the other days (p < 0.001). This pattern with very low explosion counts on Saturdays (0–3.6% of explosions per site) was visible at all sites, except for LJP (11.6%), where no weekly pattern was observed at all.
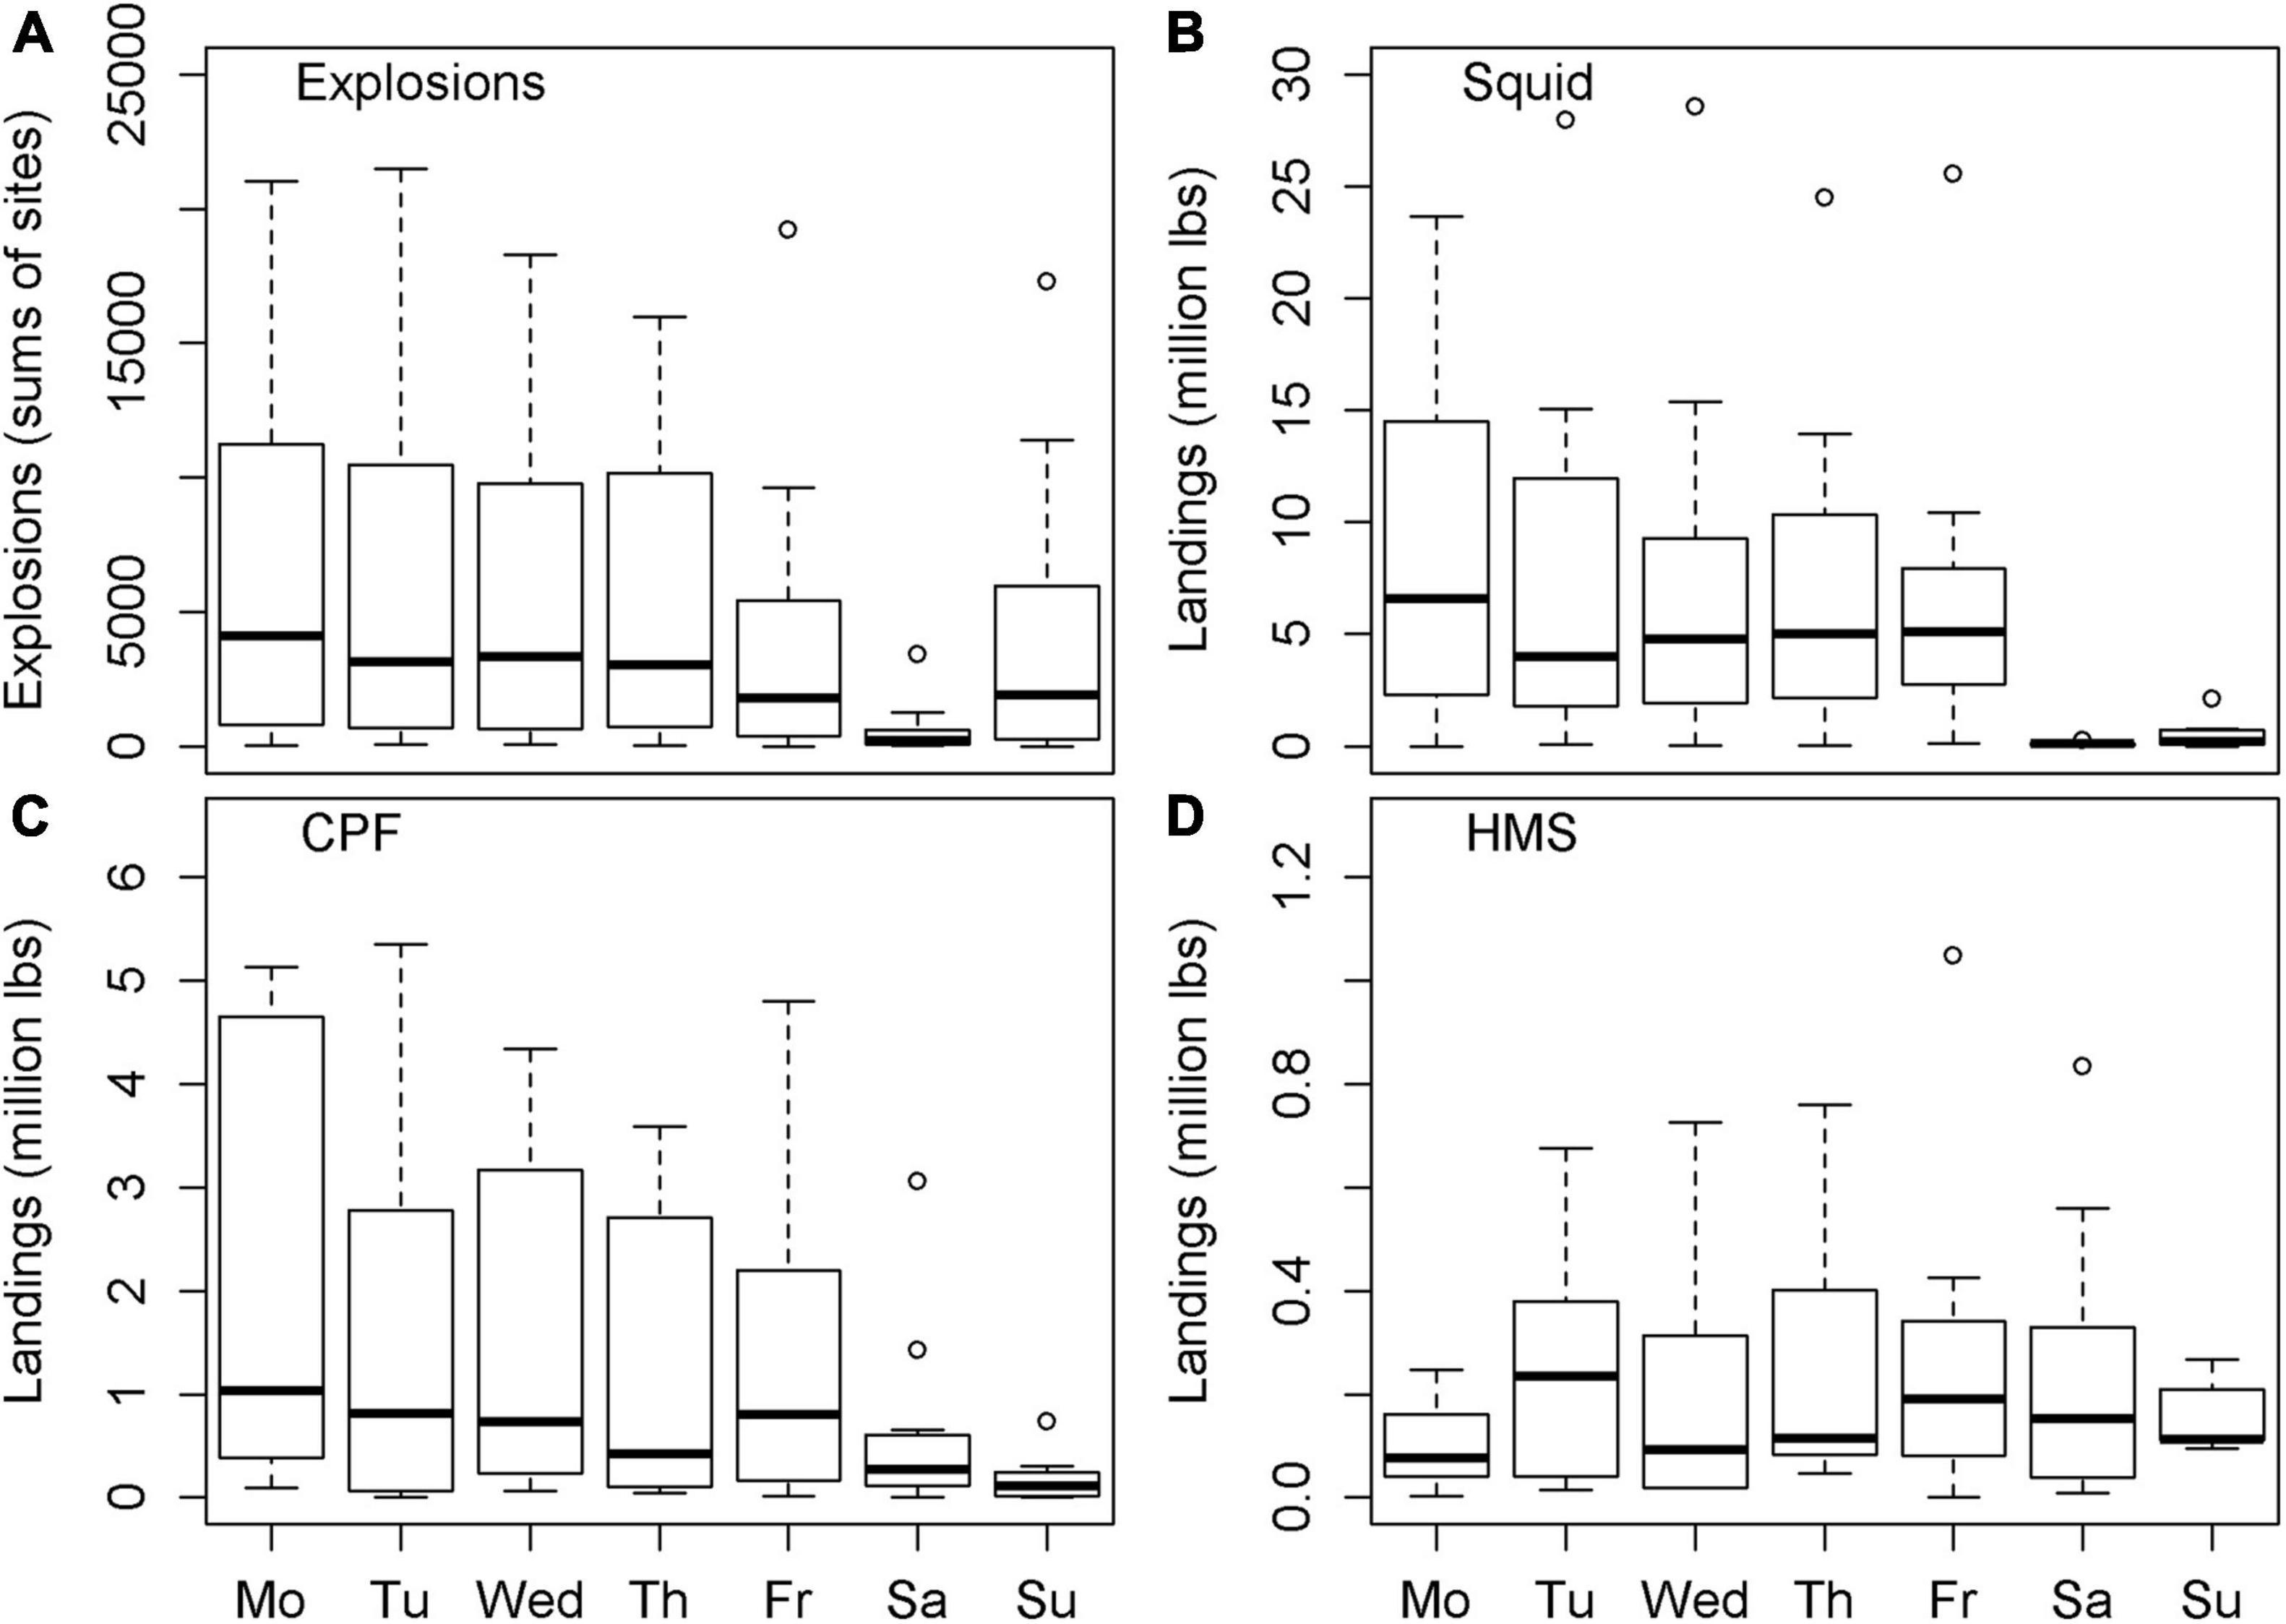
Figure 5. Boxplot of (A) explosion counts, (B) reported market squid, (C) coastal pelagic fish (CPF), and (D) highly migratory species (HMS) landings in million lbs per weekday based on sums per site.
A clear weekly pattern was also observed for reported squid and CPF landings (Figures 5B,C), with highest landings between Mondays and Fridays and almost no landings (significantly lower; p < 0.001) on weekends. HMS landings were rare compared to squid and CPF landings. Between 2005 and 2015 catches were made on only 125 days within the vicinity and the recording period of the HARP sites and thus, no clear weekly pattern was detected (Figure 5D).
Seasonal Explosion and Fishery Landing Patterns
Overall recording effort was evenly distributed over all seasons. In total, most explosions were recorded in fall (38.6% of all explosions), followed by winter and summer (27.0 and 26.4%, respectively), and were lowest during spring (7.9%). However, this pattern was not reflected at every site and the only pattern that was consistent over almost all sites (except for site A2 and G2) was low explosion counts during spring. The highest values were detected in fall, summer and/or winter depending on the site (Supplementary Table 2). For example, at site A2 close to Catalina Island explosion counts were lowest in fall. Highest values were detected much later in February and were still elevated during spring (Figure 6A). At site G2 near San Clemente Island explosion occurrence was much higher in summer and winter than it was in fall, but values also decreased in spring (Figure 6B). At site Q in Santa Monica Bay the highest explosion counts were detected in fall (98.2% EPD, median explosions/EPD 640) with the highest monthly counts of all sites with over 22,650 explosions recorded in October (Figure 6C). Afterward counts were still high but steadily decreased over the course of the winter, until they reached lowest values in spring, especially in April and May.
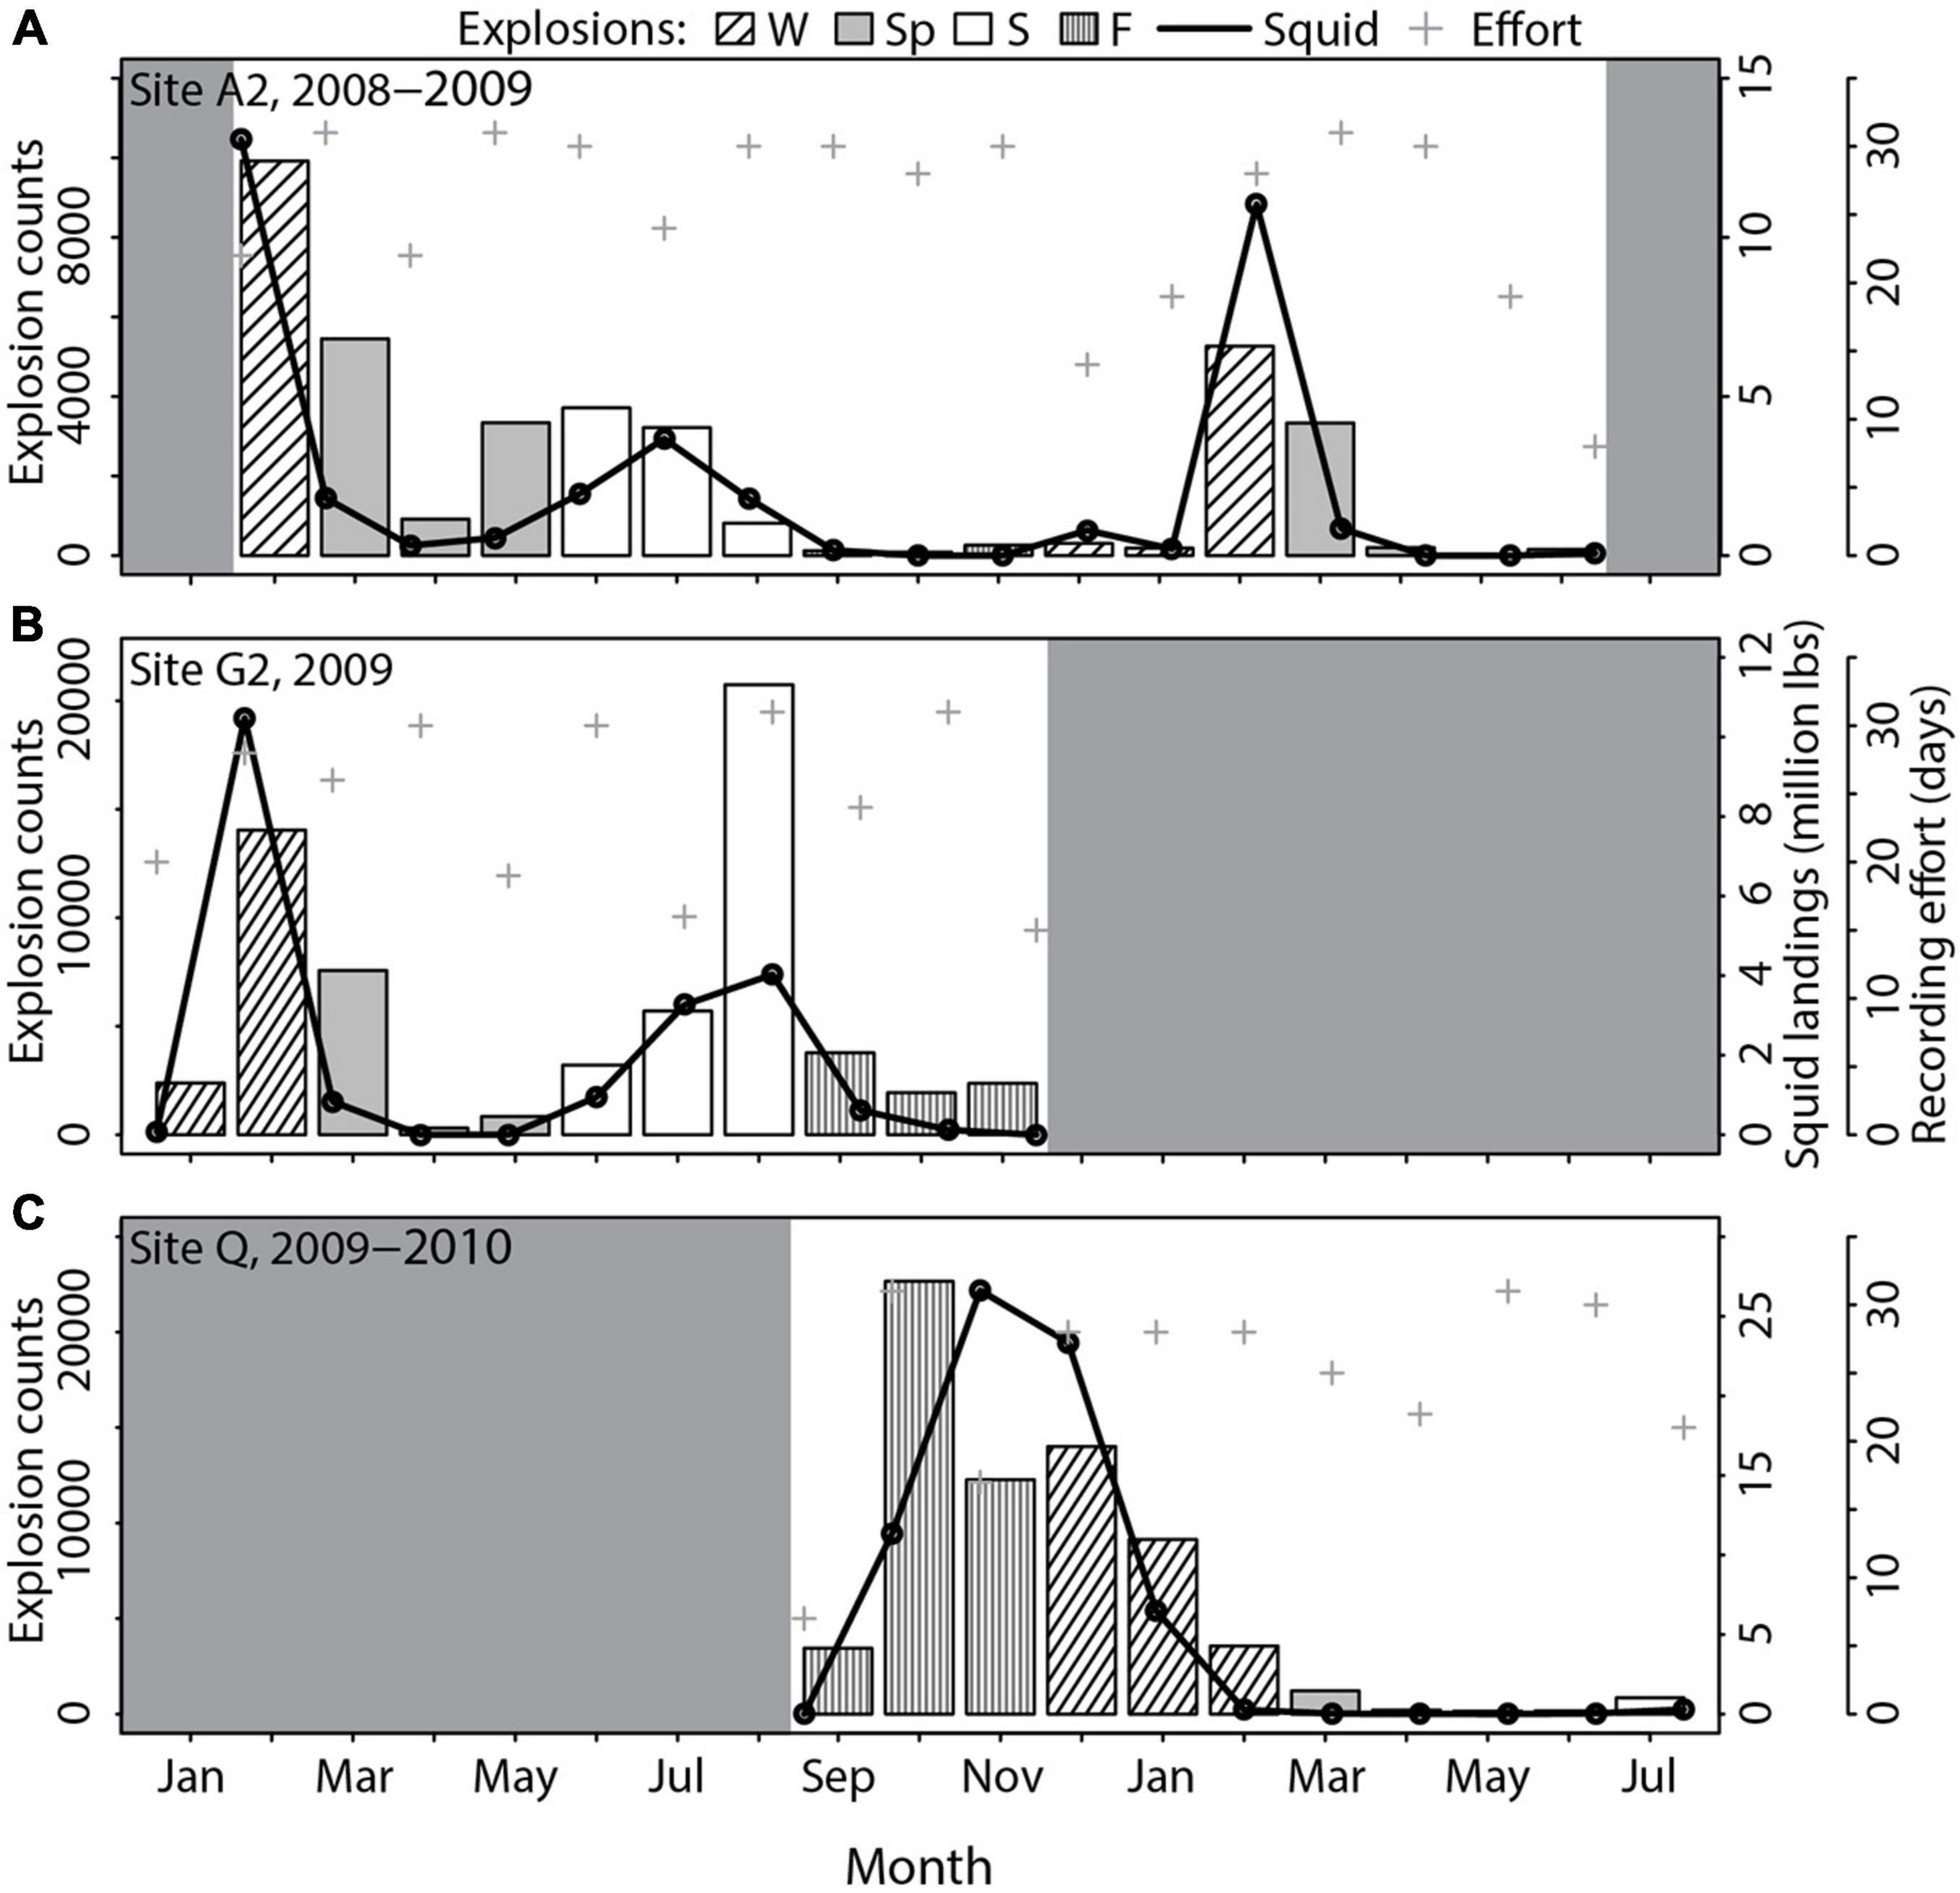
Figure 6. Explosion counts [bars: Winter (W) = black inclined stripes, spring (Sp) = gray, summer (S) = white, fall (F) = gray vertical stripes], market squid landings within a 50 km radius around the site (black line) and days with recording effort (gray cross) per month for (A) site A2, (B) site G2, and (C) site Q. Other fisheries are not shown as no overlapping seasonal pattern with explosions was found.
A GAM revealed highly significant effects of calendar week on explosion occurrence and fishery landings (Figures 7A,B and Supplementary Table 3). Site was a significant predictor for explosions, squid and CPF landings (Figures 7C,E,F), but not for HMS. The inclusion of year only improved the explosion model (Figure 7D). Peaks in overall explosion occurrence were found during summer, fall and, less pronounced, in winter, whereas a strong decrease was found in spring. Squid landings showed a very similar overall seasonal pattern, while CPF landings were lowest in winter and HMS landings showed no clear seasonal pattern.
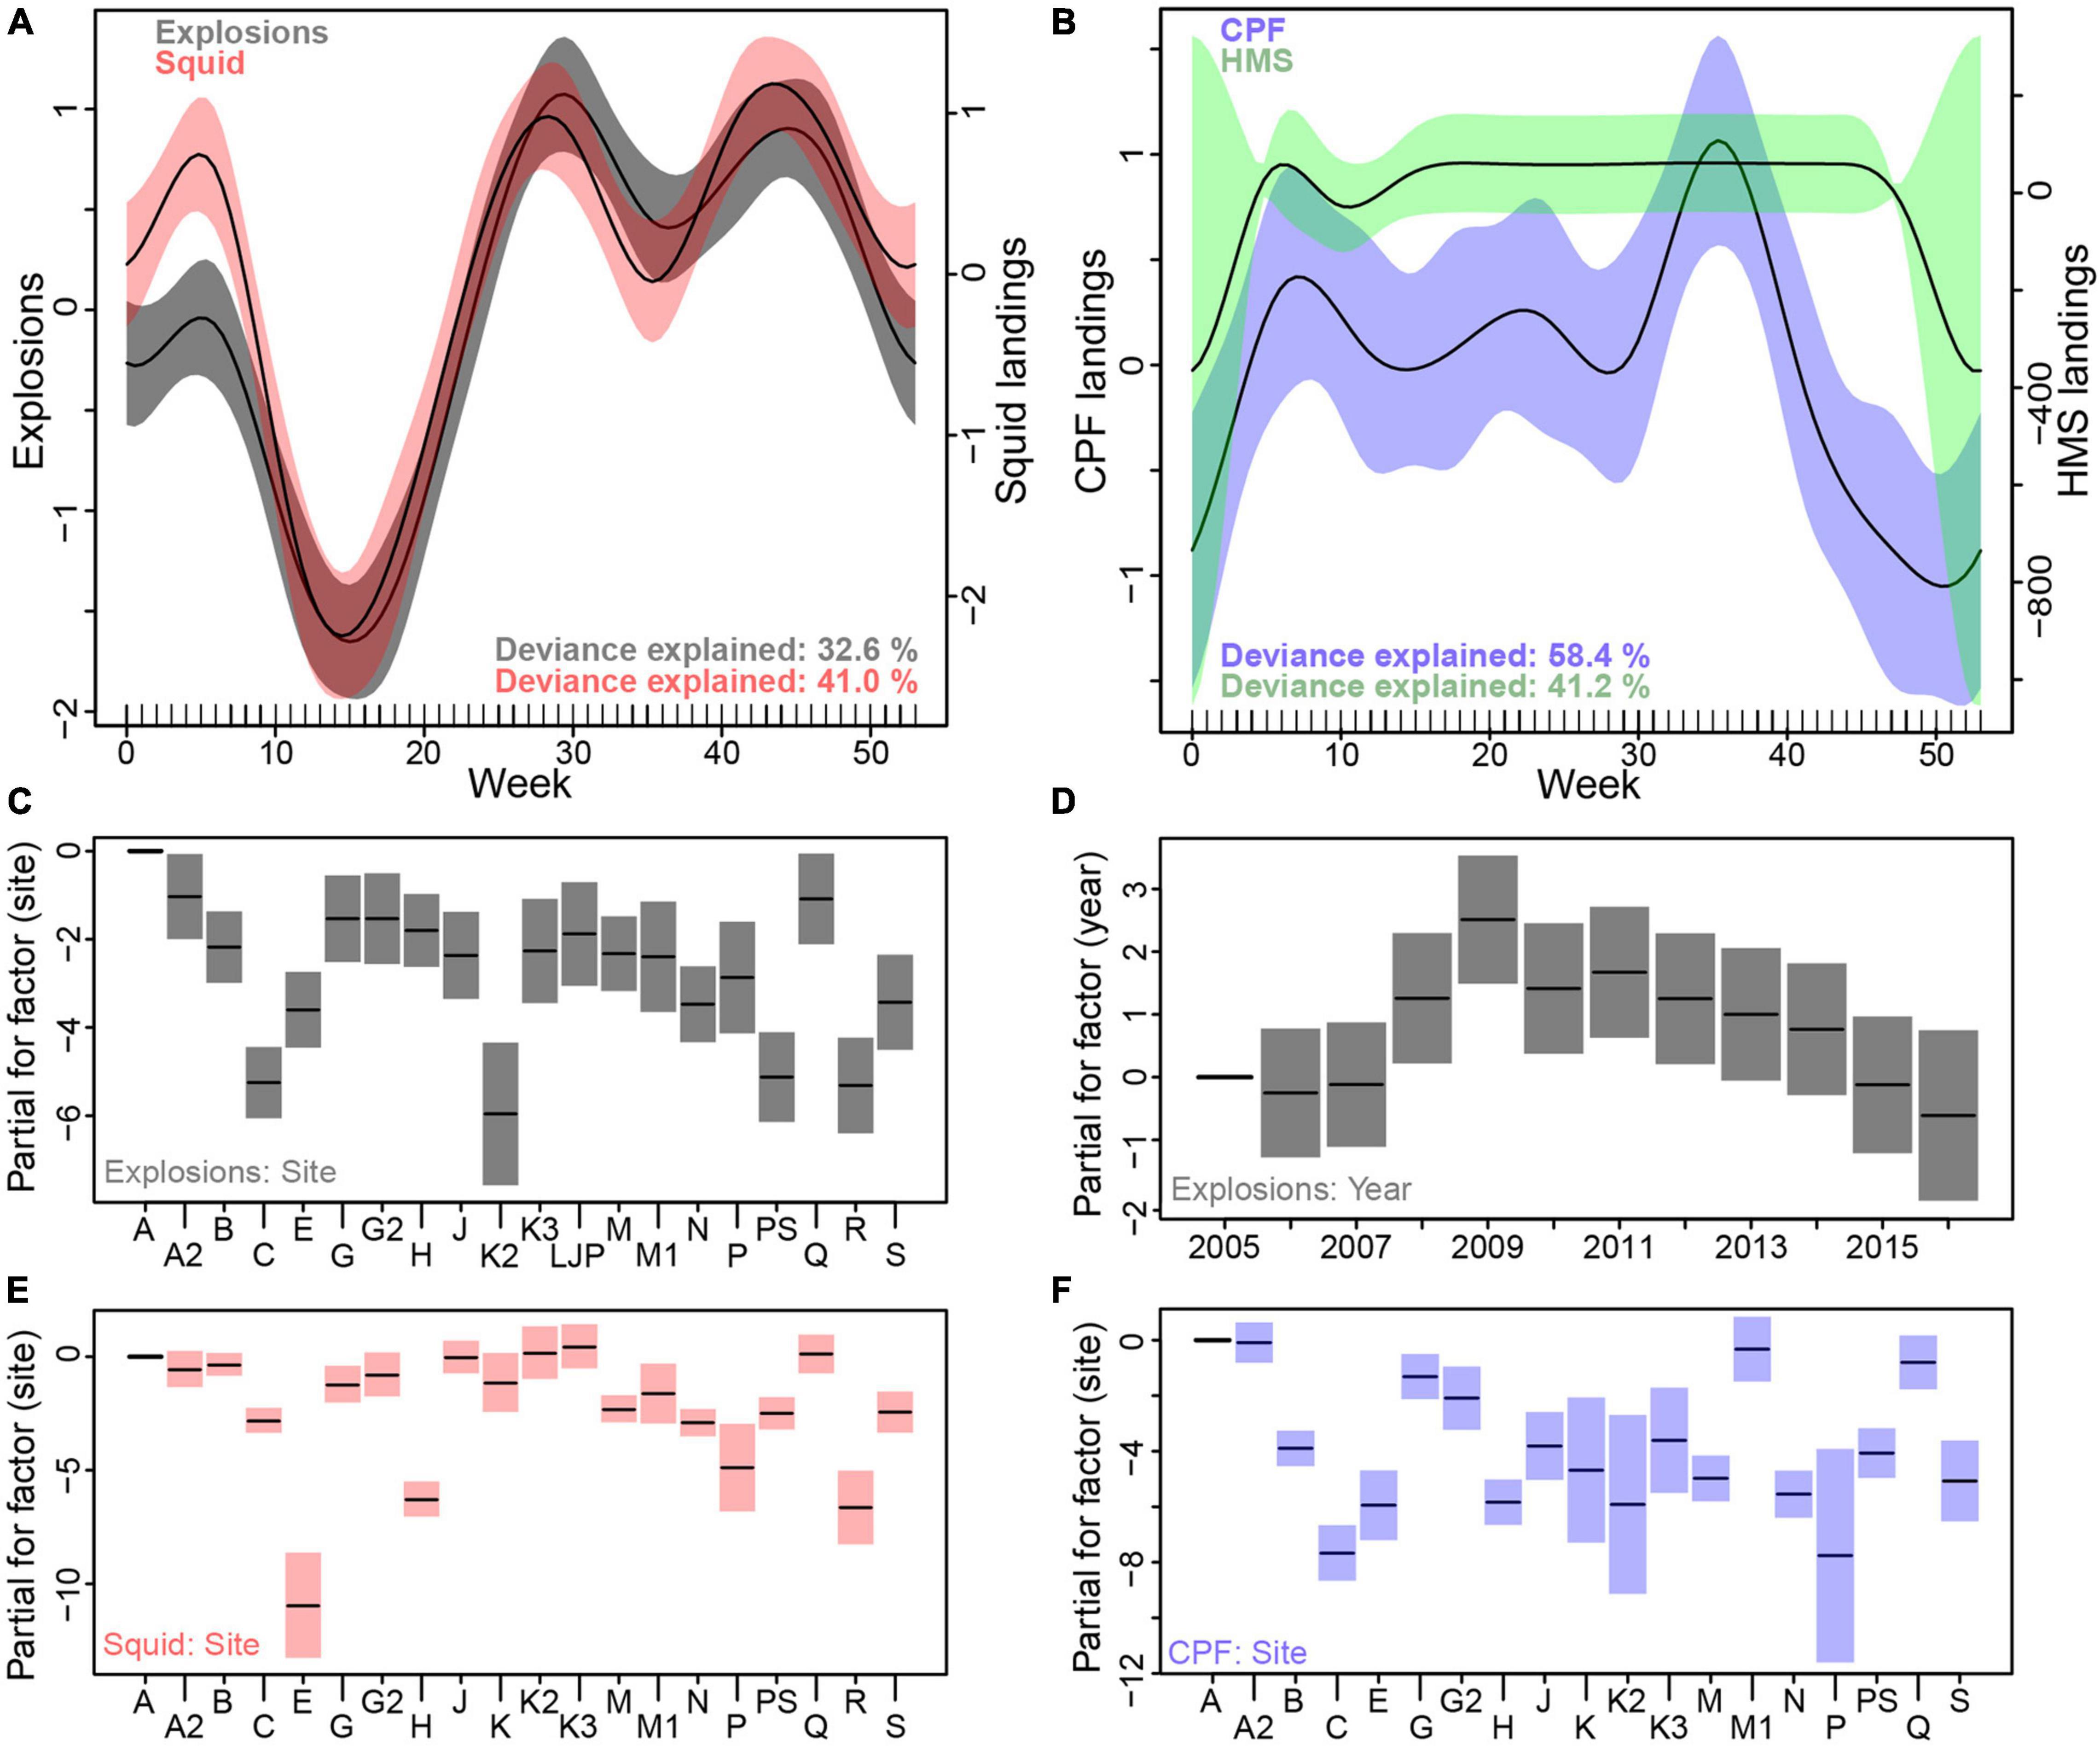
Figure 7. Generalized additive modeling (GAM) results for seasonal patterns of explosions and fisheries with calendar week as predictor (cyclic cubic smooth function) and site and year as factors using a Tweedie (compound Poisson-gamma) distribution. (A) Smooth terms for the influence of week on explosion counts (gray) and squid landings (red) and (B) for CPF (lilac) and HMS landings (green), (C) partial effect of factor site and (D) of factor year on explosion counts (gray), (E) of factor site on squid landings (red) and (F) of factor site on CPF landings (lilac).
Annual Explosion and Fishery Landing Patterns and Trend Analysis
For the sites with concurrent long-term recordings (B, C, H, M, and N), the period of January 2009 until September–December 2015 was analyzed for annual patterns and trend (site M only until January 2015).
Overall explosion occurrence for the five combined sites was significantly highest in 2009 and decreased until it reached its significantly lowest level in 2015 (pairwise Wilcoxon rank sum test; p < 0.001). High maximum daily counts of over 1,000 explosions were only present from 2009 until 2012. From 2010 to 2013, explosion counts were not significantly different (p = 0.52–0.83), but after 2013 counts were significantly lower each following year (p < 0.001 for both 2014 and 2015). Squid landings (fishing blocks within a 50-km radius around the five long-term recording sites) were highest in 2009 and successively decreased until 2012. In 2013 squid landings increased before decreasing again in 2014 and 2015. CPF and HMS landings did not show any comparable annual patterns (Table 3).
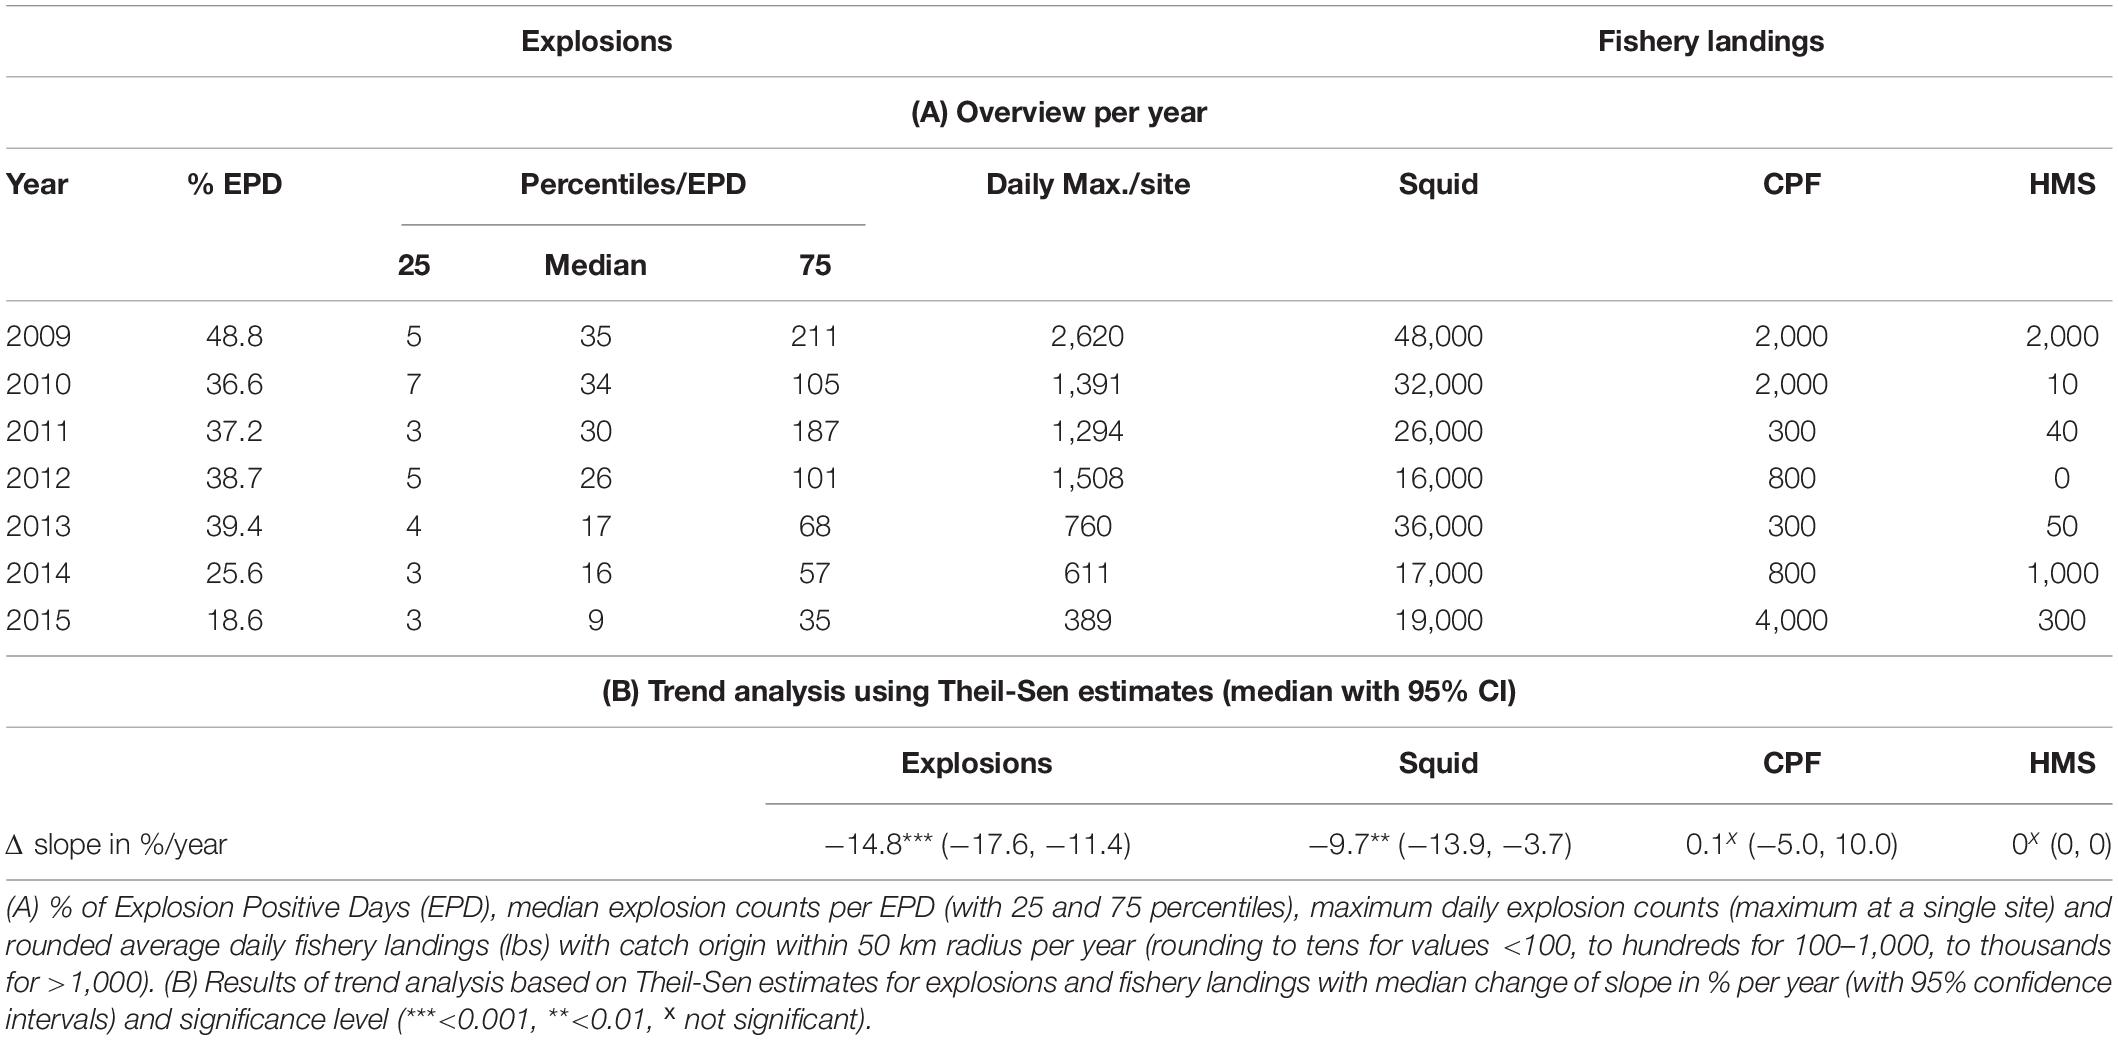
Table 3. Overview of metrics for annual patterns (A) and trend (B) for explosions and fishery landings at the five long-term monitoring sites B, C, H, M, and N combined.
A trend analysis based on de-seasonalized Theil-Sen linear regression estimates revealed a significant negative trend for explosions and a significant negative trend for squid landings, while CPF and HMS landings did not experience any significant linear trend. The median change of slope per year was higher for explosions than it was for squid landings, indicating a stronger decline for explosions compared to squid landings within 50 km around the five recording sites (Table 3 and Figures 8A,B).
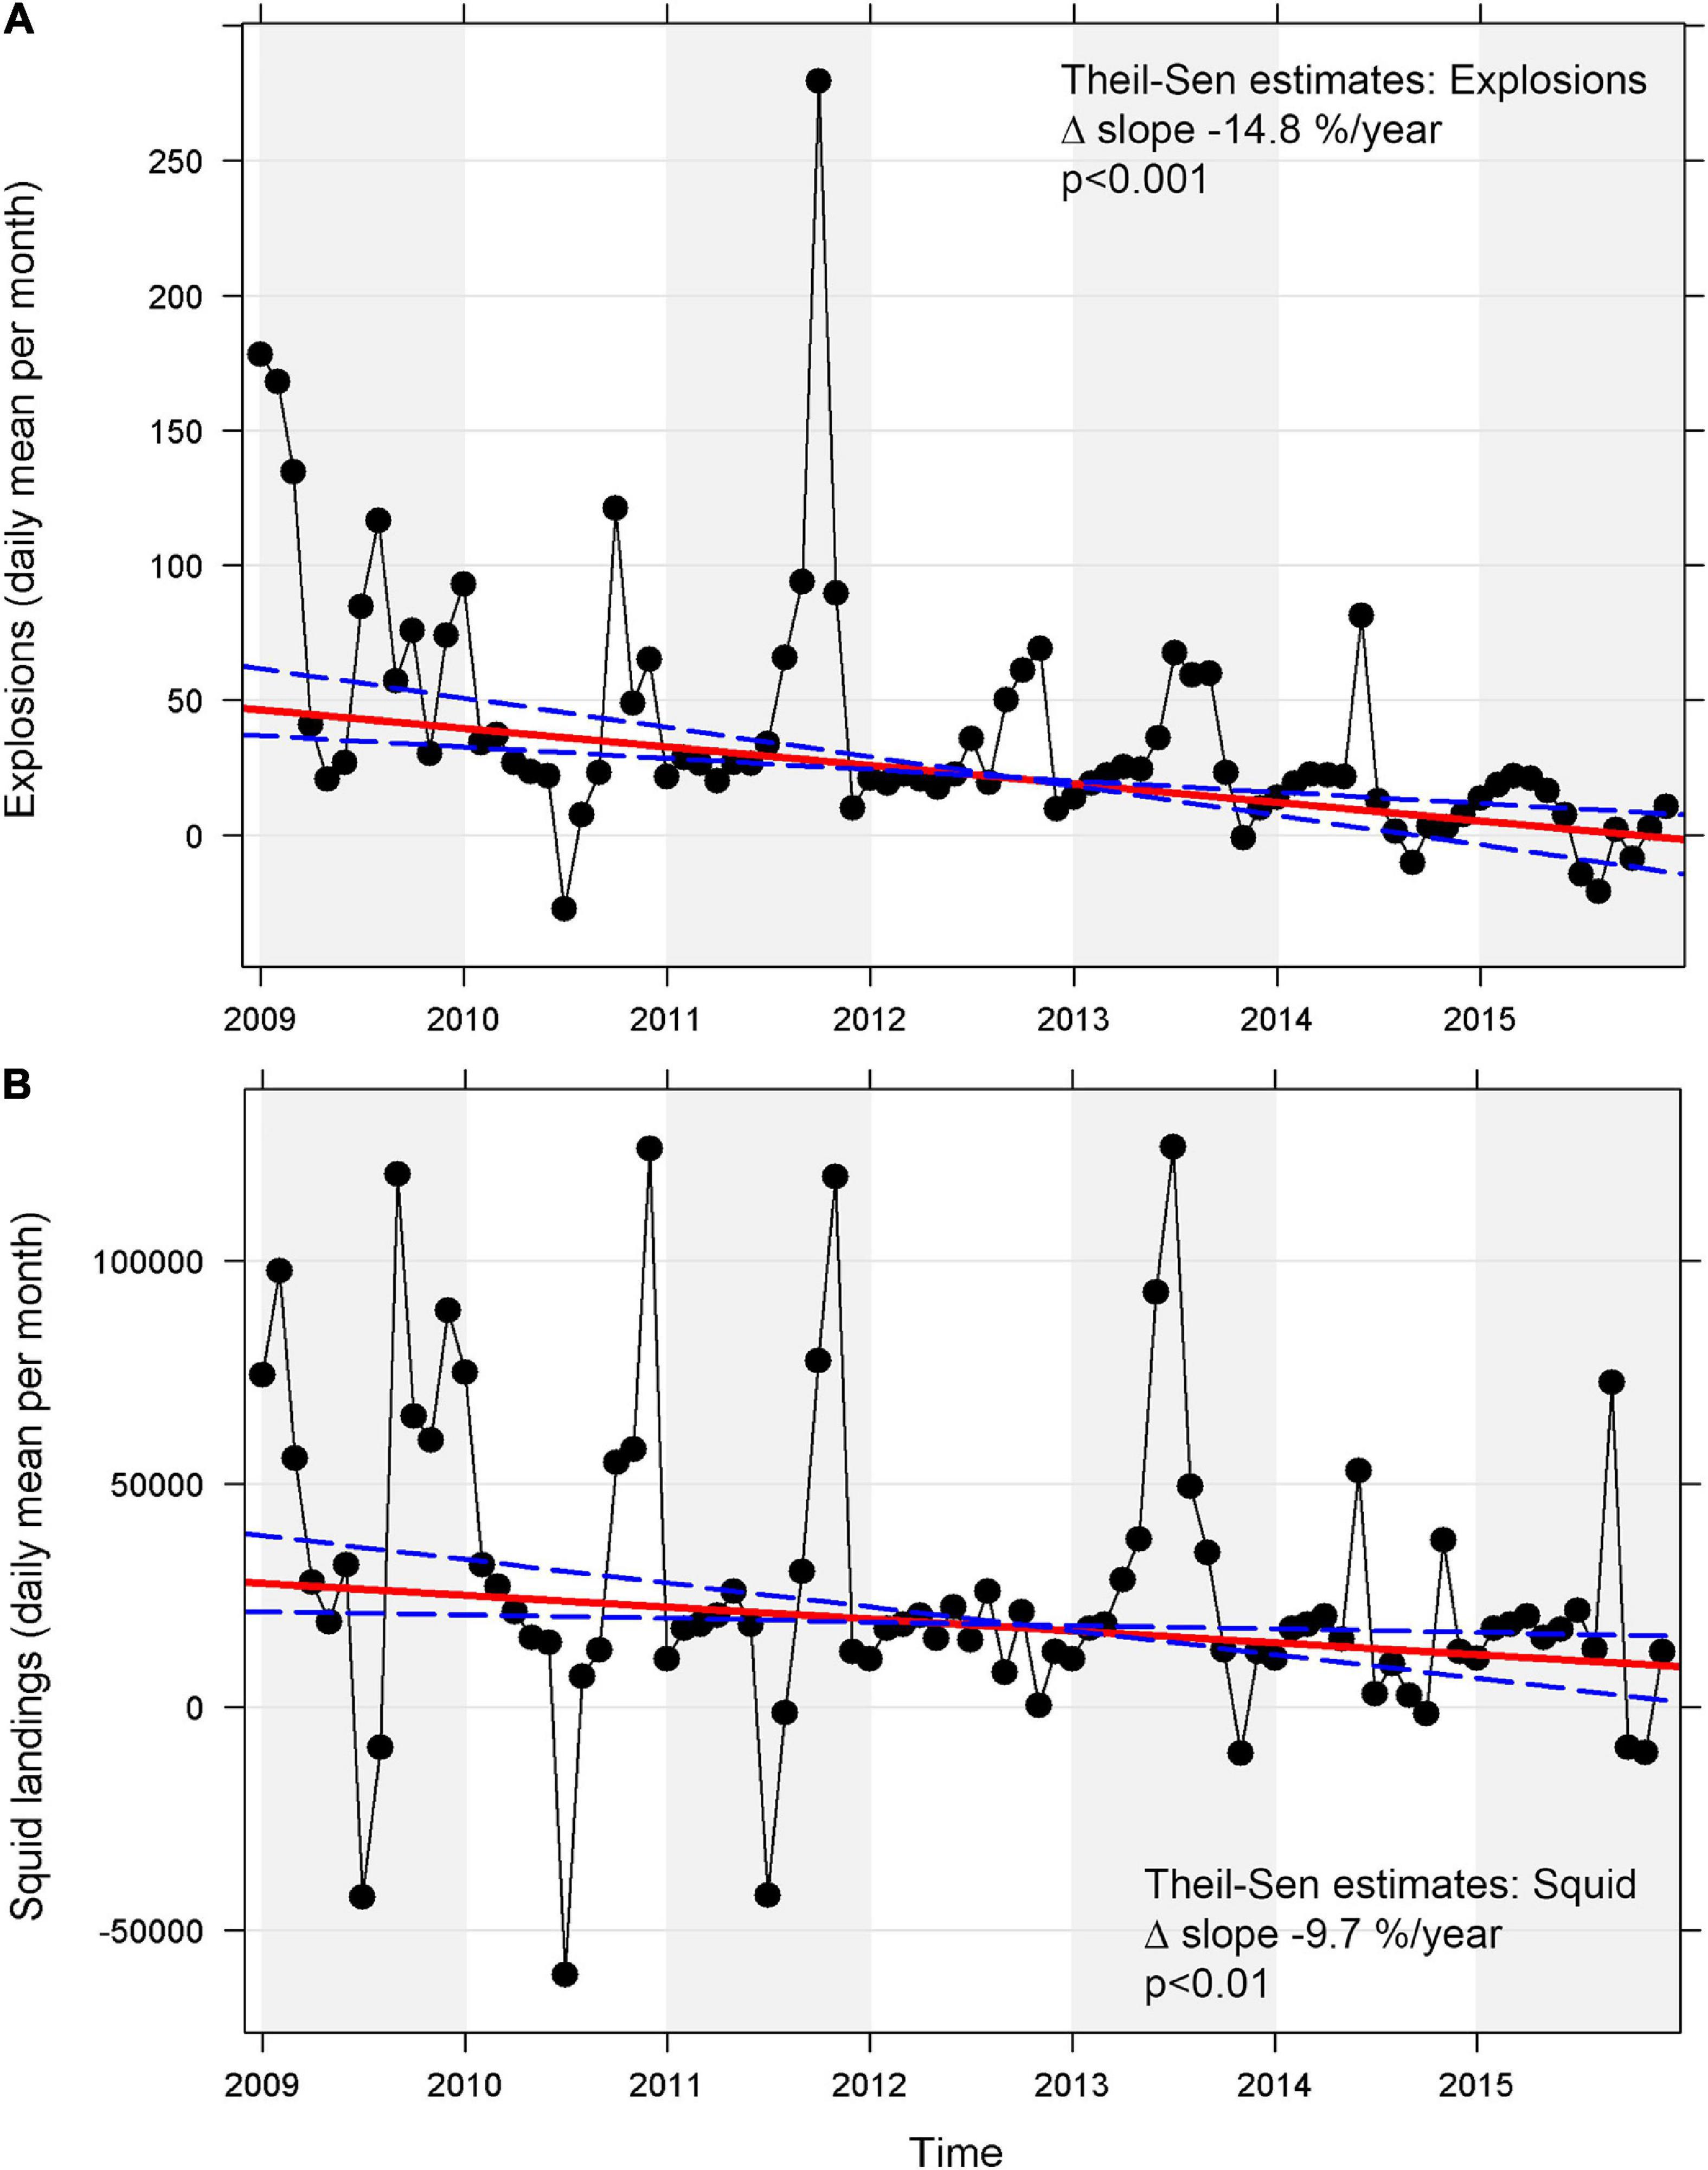
Figure 8. Trend analysis of mean daily values per month using a Theil-Sen regression model for (A) explosions and (B) squid landings at five long-term sites (B, C, H, M, and N) off Southern California between 2009 and 2015 (red line: regression line, blue dashed line: 95% confidence intervals). A Seasonal-Trend-Decomposition using LOESS (STL) was applied to de-seasonalize the data first to account for the strong seasonality. The removal of the seasonal component occasionally resulted in theoretical negative values and peaks within the trend analysis as a product of the remaining trend and residual components.
Regression Analysis for Explosions and Fishery Landing Receipts
The Theil-Sen regression model and Daniel’s trend test for explosion counts and squid landing receipts per week, combined for all sites, were both significant (p < 0.0001) with a high correlation coefficient rho of 0.58 (Figure 9). Per site (Supplementary Table 4), strong and significant correlations of explosions and squid landing receipts were found for all sites categorized as “high” (A, A2, G2, K3, and Q) regarding explosion occurrence (rho = 0.66–0.88, p < 0.001), but correlations were also present at some sites categorized as “medium” (B, J, and M; rho = 0.34–0.46, p < 0.01–0.001) and “low” (C and M1; rho = 0.53–0.76, p < 0.01–0.001). For all other sites, including all offshore sites, like E, H, N, R, and S, etc., no correlation was found, or squid landings were so rare that the analysis could not be conducted. There was no significant correlation for explosions and CPF landing receipts in total (rho = −0.07 with p = 0.28) or at individual sites. For sites A, A2, G, G2, and K3 the results of the Theil-Sen regression were significant, but Daniel’s trend test did not show significant results; rho was low and also negative for three of these sites. For HMS landing receipts and explosions overall, no correlation was found (rho = 0.1 with p = 0.53). Per site, only the two offshore sites E and H showed significant results for the Theil-Sen regression (p < 0.001) and at the same time meaningful values for rho (0.55–0.57), although they were not significant (p = 0.06–0.11).
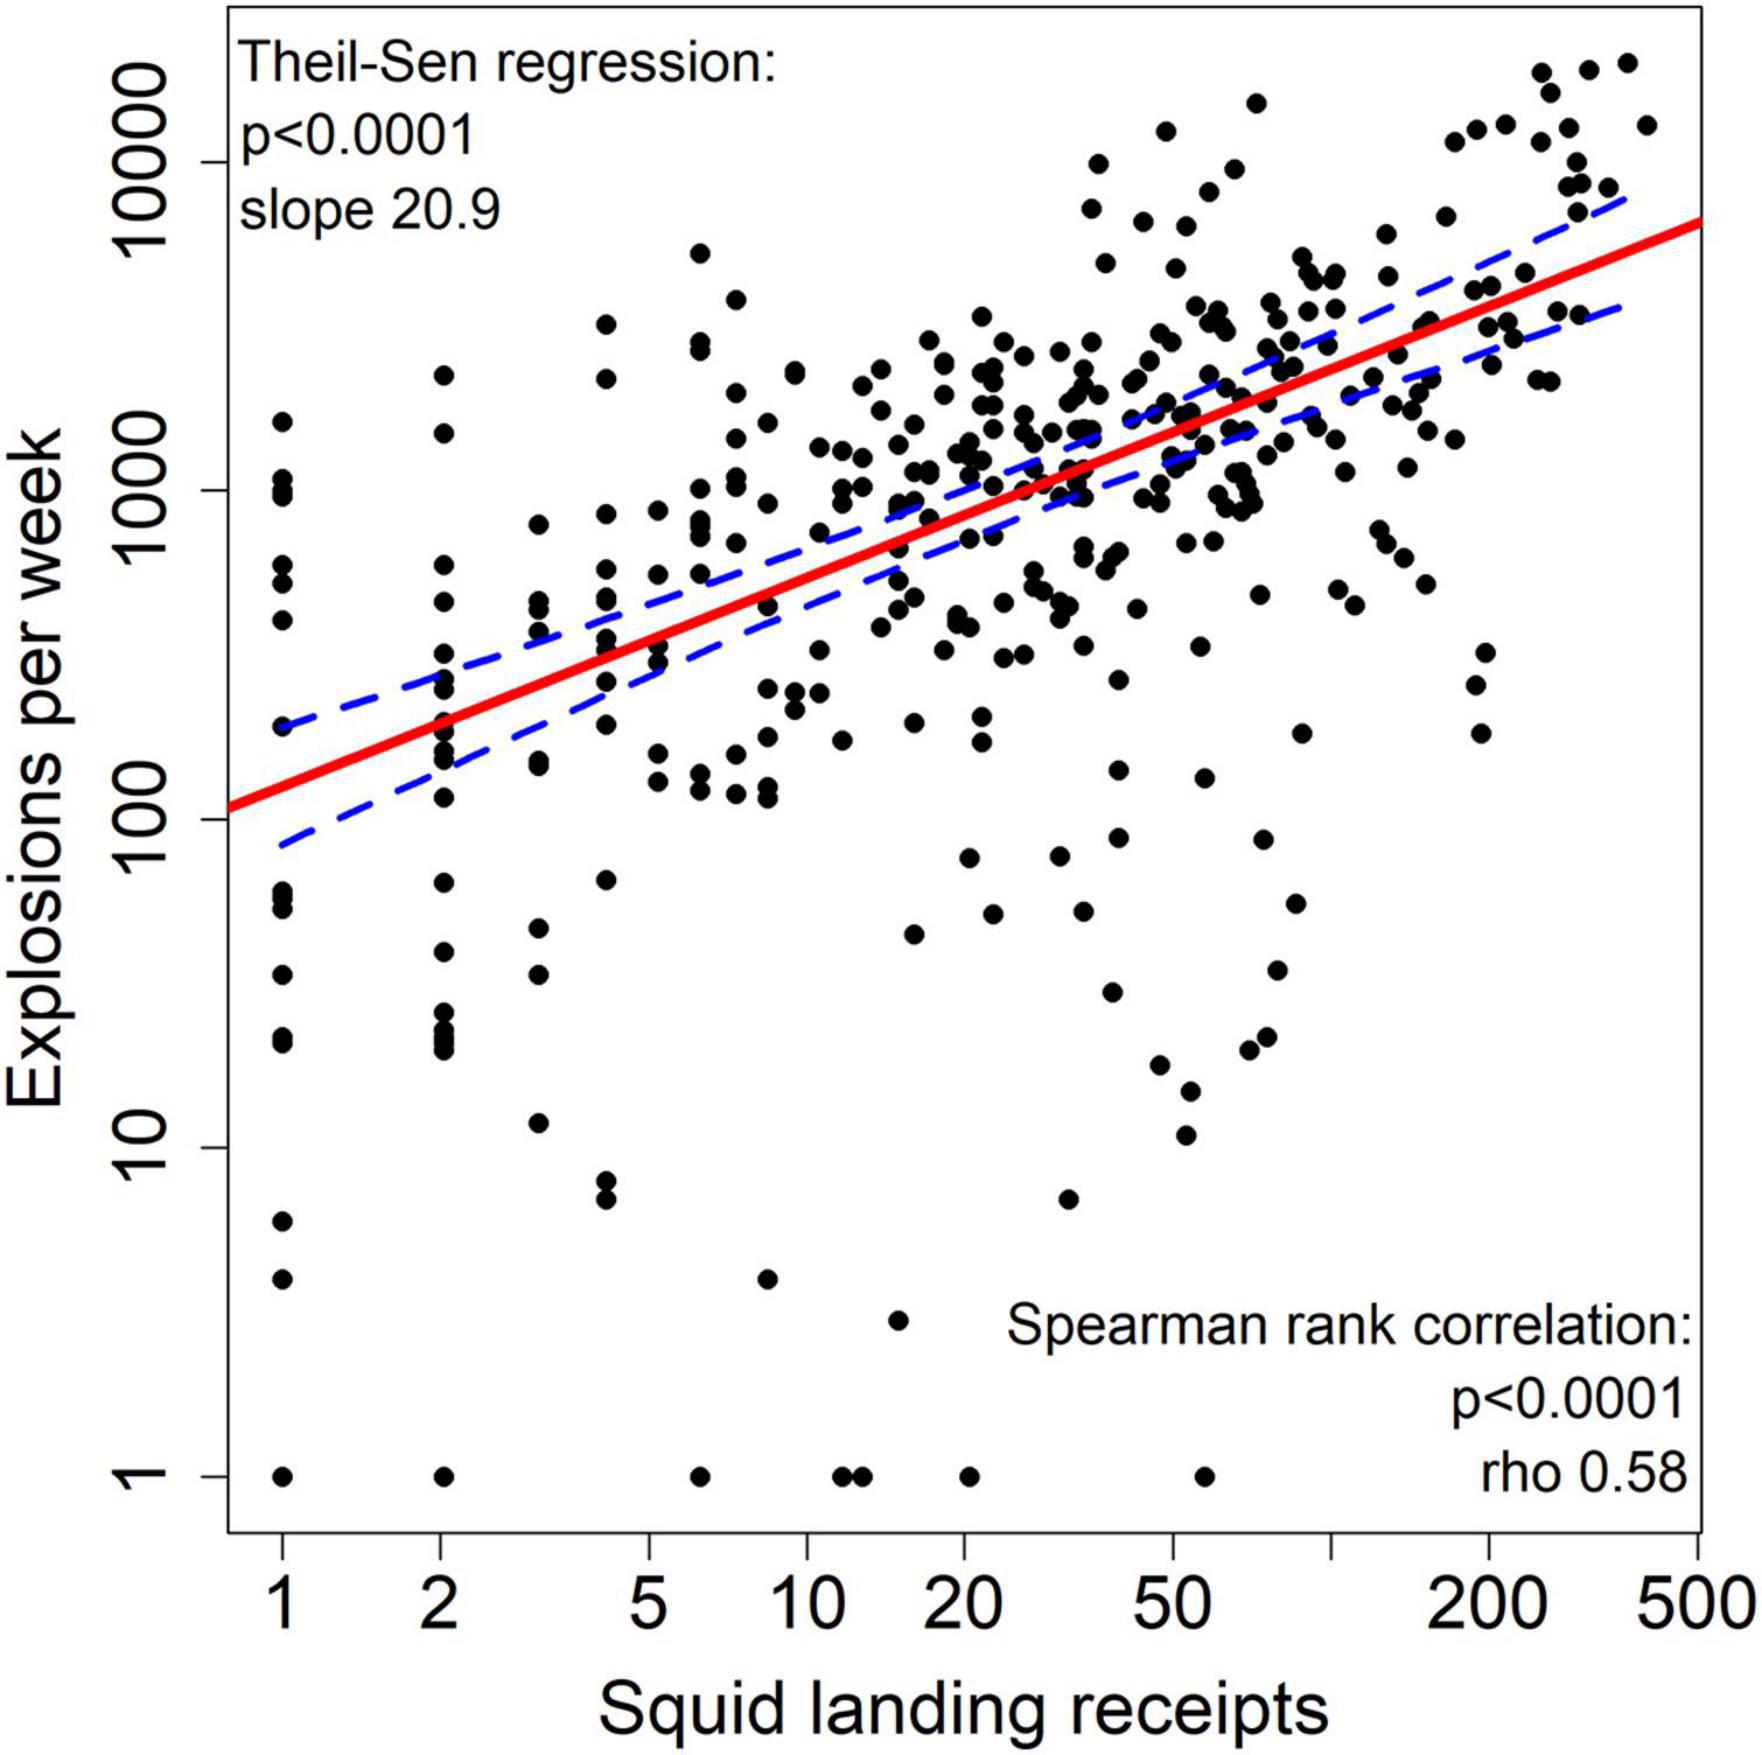
Figure 9. Theil-Sen regression model of explosion counts and market squid landing receipts per week (based on weekly sums of all sites; weeks without squid fishing activity were excluded from the model) with log-scaled axes (red line: regression line, blue dashed line: 95% confidence intervals).
Discussion
Southern California, especially its National Marine Sanctuaries, is home to a diverse array of marine species and habitats. At least thirty species of cetaceans and other marine mammals, like pinnipeds and sea otters, as well as four species of sea turtles are found in the region (Leatherwood et al., 1982). The distribution of these animals is closely linked to the region’s high level of biological production (Munger et al., 2009), which subsequently dictates the distribution of fisheries and, therefore, seal bomb use.
This study is the first to provide long-term results on the distribution, intensity and origin of underwater explosions that occur in Southern California waters. The information provided here can help to assess their influence on marine life as a noise pollutant, the scale of their use in this region, and to identify potential areas of concern. Comparisons of explosion patterns with commercial fishery data have revealed a correlation with the market squid fishery (Figure 9 and Supplementary Table 4). We will discuss known squid fishing practices in California and compare them to our results for the various spatial and temporal patterns of explosions and squid landings. The CPF and HMS fisheries will not be described in depth as no significant correlation was found with the occurrence of explosions.
Explosions as Noise Pollutant
Research on anthropogenic noise off Southern California has mainly focused on shipping and military sonar operations (Croll et al., 2001; McDonald et al., 2006, 2008; McKenna, 2011; Melcón et al., 2012; DeRuiter et al., 2013; Goldbogen et al., 2013; Houser et al., 2013), as these were thought to be the most significant noise sources. Our results suggest that, at least during peak seasons and years, there has been extensive and persistent noise from underwater explosions related to commercial fishing activities. Underwater explosions represent a relevant anthropogenic noise source off Southern California as they were detected on more than one third of all recording days and were also detected in the vicinity, or inside of, the Channel Islands and Monterey Bay National Marine Sanctuaries. Especially around nearshore sites (those close to Santa Cruz, Santa Catalina or San Clemente Island and Santa Monica Bay) high explosion counts of up to 2,800/day were detected and maximum SEL of up to 189 dB re 1 μPa2-s were recorded (Table 1 and Figure 3). Nighttime noise from explosions may also be particularly relevant for marine ecosystems, as this is the time when deep scattering layers rise and various dolphin species focus their foraging effort (for the Southern California Bight, e.g., Soldevilla et al., 2010; Simonis et al., 2017).
Possible impacts from noise include death, physical injury of the auditory systems [Permanent or Temporary Threshold Shift (PTS or TTS)], masking of biologically important sounds, alteration of behavior and habitat exclusion (e.g., Southall et al., 2007). The National Marine Fisheries Service (2018) estimated received acoustic threshold levels for PTS onsets for different marine mammal hearing groups. For impulsive sounds, a dual metric using peak sound pressure level (SPLpeak) and weighted 24 h-cumulative SEL was used. In a recent experiment using seal bombs, source levels exceeded all these thresholds (Wiggins et al., 2021), except for the SEL threshold for otariid pinnipeds. Although weighted and un-weighted, as well as cumulative and non-cumulative, metrics cannot be compared one to one, they are still a reasonable indication for the risk seal bombs pose to marine mammals. The maximum SELs (unweighted, non-cumulative) of 164–189 dB re 1 μPa2-s per site, recorded within this study (Table 1), partly exceed PTS and TTS thresholds for cetaceans as well as for phocid pinnipeds (National Marine Fisheries Service, 2018). Simonis et al. (2020) estimated, based on a local transmission loss model for seal bombs in Monterey Bay, that harbor porpoises would experience a TTS from cumulative exposure of two seal bomb explosions within 1 km or six explosions within 2 km. Taking maximum values of explosion occurrence at high count sites from this study into account, on average, explosions happened multiple times per minute during the night, meaning that nearby porpoises would potentially not have been able to flee before experiencing hearing damage. In Germany, e.g., federal regulations exist for impulsive pile-driving so that a SEL (also unweighted, non-cumulative) threshold of 160 dB re 1 μPa2-s cannot be exceeded, in order to protect endangered harbor porpoises from TTS (Deutsches Bundesministerium für Umwelt, Naturschutz und nukleare Sicherheit, 2013). In this study, median SELs close to and above 160 dB re 1 μPa2-s were recorded at site A2 near Catalina Island and site J within the Channel Islands National Marine Sanctuary. These sites were classified as “high” and “medium” (but with times of high explosion occurrence for the latter case) regarding explosion occurrence, meaning there is the potential for additive or cumulative effects. Moreover, for explosions which have happened very close to the recording site, recorded signals likely have been clipped and actual received SEL were higher, which is indicated by the second smaller peak of received SEL in Figure 3 (the hydrophones clipping level is ∼167 dB SPL). Additionally, since most of the energy of explosions lies within the low-frequency range, the sound can travel great distances and effects on marine mammal behavior might be far more wide-ranging than just physical harm. Other repetitive, low-frequency, impulsive sounds, like air gun blasts or pile-driving strikes, are known to disturb the behavior of marine mammals (e.g., Gordon et al., 2003; Stone and Tasker, 2006; Lucke et al., 2009; Di Iorio and Clark, 2010; Castellote et al., 2012; Dähne et al., 2013).
The focus so far has been on potential effects on marine mammals, as they are known to be particularly sensitive to noise and are, at least in the case of pinnipeds, the main target of seal bomb use. But other marine organisms, down the food chain, are likely to be affected as well; for example, sea turtles, fish (Popper et al., 2014), lobsters (Day et al., 2019), and zooplankton (McCauley et al., 2017). The possible impact of seal bombs on squid species should also be considered, since this study has revealed a positive correlation between explosions and the market squid fishery. Squid have statocysts (otoliths) and are able to “hear” by detecting the particle motion component of a sound field (Mooney et al., 2010). When exposed to anthropogenic noise, different squid species have shown increased alarm responses such as escape and firing ink sacs [using simulated noise for Sepiotheutis lessoniana and Octupus vulgaris: Hu et al. (2009), for Doryteuthis pealeii: Jones et al. (2020)]. For example, McCauley and Fewtrell (2008) reported that some squid reacted to simulated air gun noise by initially swimming faster but then slowing and lying motionless near the surface. Near seismic surveys, strandings of Architeuthis dux (giant squid) have been reported (Guerra et al., 2004) and Solé et al. (2013) described statocyst lesions in four squid species from the Mediterranean after exposure to low-frequency noise (Sepia officinalis, O. vulgaris, Loligo vulgaris, and Illex condietii). These studies show that anthropogenic noise can physically harm and change the behavior of squid, and further research is needed to determine how seal bombs may be impacting squid off Southern California.
Origin of Explosions and Correlation With Fisheries
Explosive deterrents pose a risk to marine life – determining their origin, as well as how and why they are being used, is a necessary step in ensuring they are properly regulated and managed. Our results suggest that most of the recorded explosions come from seal bombs, or similar explosive deterrent devices, being used by the California market squid fishery. However, we cannot rule out that some explosions have sources other than fisheries. The signal detector applied for this study is based on template explosion signals and each signal was manually verified. A mix-up with other signals resembling explosions is unlikely, but potential sources of similar signals are discussed below. Off Southern California, explosions can occur during naval training exercises, but they are not used in high numbers and typically occur during the day (Baumann-Pickering et al., 2013), whereas almost 94% of all explosions recorded in this study occurred at night (Figure 4). There are acoustic similarities between seismic air gun blasts and explosion signals (Guerra et al., 2011), but to our knowledge, no industrial seismic exploration has ever been conducted in California waters. Additionally, air gun blasts are usually executed in a specific periodic sequence, which was not seen within our recordings. Mining operations at a rock quarry at Catalina Island could have produced impulsive signals but blasting almost solely at night seems unlikely. Gunshot calls of North Pacific right whales (Eubalaena japonica) are short, impulsive, broadband (10 Hz to 2 kHz) signals (Rone et al., 2012). They are the rarest of all baleen species and their main distribution range in United States waters lies within the Gulf of Alaska and the Bering Sea; sightings in California waters are rare exceptions (Gendron et al., 1999). Therefore, seal bombs (or similar devices) remain the most likely source for the explosions detected in this study.
Explosions and squid landings were both highest at nearshore sites and lowest offshore (Figure 1 and Table 1). Average SELs above or close to 160 dB re 1 μPa2-s were recorded at some of these nearshore sites as well (sites A2 and J), indicating that explosions were occurring close to the recording site. Market squids inhabit coastal, pelagic zones from Alaska to Baja California and spawn in nearshore, shallow and sandy habitats in Central and Southern California at the end of their lifespan (Vojkovich, 1998). In Southern California, squid fishing activity is concentrated around Santa Catalina Island and the Channel Islands (Santa Rosa, Santa Cruz, and Anacapa Island; Maxwell et al., 2004); locations where high explosion counts were detected. Squid fishing is prohibited within the Channel Islands Marine Protected Areas. Whenever possible, the squid vessels will operate close to Los Angeles port, where they will land and sell their catch. The mainland sides of Catalina Island and Santa Monica Bay are closed for the use of purse-seine gear and so brail vessels are used instead (California Department of Fish and Wildlife, 2020).
There were some exceptions to the spatial pattern of highest squid landings and explosion activity in nearshore and lowest values in offshore areas. At island-associated sites K and K2, high landings of squid were reported, but few or no explosions were recorded. However, this may have been because recording effort was low at these sites (about 4 months per site, but each at least partly within squid fishing season). Although explosion counts were generally lower at offshore sites, site H, located near Tanner Bank, had high explosion counts over several seasons. Almost no squid fishing was reported within fishing blocks around site H. Since we also saw low CPF and HMS landings in this area, it is possible that a different fishery, outside the purse-seine sector, is the main source for explosions around site H. Another potential explanation is that the explosions occurred at a different location but the oceanographic and bathymetric characteristics around site H contributed to basin-wide propagation of the signal’s low-frequency component. This theory is supported by the fact that explosions at site H showed a similar seasonal pattern to explosions and squid landings at other sites. Further analyses of other fishery landings and larger radii for included fishing blocks, as well as sound-propagation modeling taking bathymetric characteristics into account, are required to better understand acoustic detection near Tanner Bank.
We found clear patterns in seal bomb occurrence over various temporal scales. Almost 94% of explosions were detected at night (Table 1 and Figure 4), which indicates their use in a night-time fishery. Simonis et al. (2020) described diel patterns for explosions recorded at the MARS cabled observatory in Monterey Bay during 2015–2018, where the majority of explosions also happened at night. Market squids are usually caught at night with purse-seine, drum-seine or brail vessels assisted by light boats, which use high-intensity lights to attract the spawning squids toward the sea surface, where they are more easily encircled with large nets (California Department of Fish and Game, 2005). Whether sardines and other CPF species are caught during the day or at night depends on the region (Kaltenberg and Benoit-Bird, 2009; Krutzikowsky and Smith, 2012; Lynn et al., 2014). Fishing for HMS (bonito and tuna) is generally possible during day and night (Walker et al., 2010; Hall and Roman, 2013).
Total numbers of explosions were reduced on Fridays and Sundays and were almost absent on Saturdays (Figure 5). This pattern seems to reflect the closures that occur in the squid fishery. There is a weekend closure for the commercial market squid fishery from the United States-Mexico border to the California-Oregon border between Friday noon and Sunday noon each week to allow a period of 48 h of uninterrupted spawning (California Department of Fish and Game, 2005). This weekend closure results in reduced landings on weekends. For squid caught on Sunday evenings, after the closure, it is common to not be landed until Monday. The CPF fishery showed a similar weekly pattern to the squid fishery, with decreased landings on the weekend. Many fishermen for squid and sardines are the same and can use their nets to catch either. Sweetnam (2010) reported that in 2008, during times when both fisheries were active, daily landings of sardines were minimal on weekends. Fishing for market squid is much more profitable, and so it affects the CPF fishing sectors. All fisheries depend on market demand: market squid have a higher volume and value and so, if the processors have to reduce staff on weekends due to the market squid closure, it might result in reduced demand for sardines on weekends as well.
Although peaks in occurrence varied by site, explosions were typically lowest in spring (Figures 6, 7 and Supplementary Table 2). This seasonal pattern is similar to that of market squid landings. In California, the market squid fishery is managed through a state-based management plan. The fishing season runs from 1 April through 31 March the following year with a seasonal catch limitation of 118,000 tons and a subsequent fishing closure after those limits are reached until the end of the season (California Department of Fish and Game, 2005). There are two distinct market squid fisheries in California: one in the Southern California Bight, where most fishing occurs between mid-fall and late winter, and one in Monterey Bay, where the fishery usually spans from late spring to early fall (California Department of Fish and Wildlife, 2020). Accordingly, Simonis et al. (2020) also reported a strong seasonality with peaks in explosion occurrence in Monterey Bay in 2015–2018 mostly during the summer months, but for some years also in late spring and fall.
We considered the ability of fishermen to deploy the large number of explosives detected at some sites. Taking landing receipts per day as a proxy for the number of vessels operating in an area into account, we calculated that on average, per site with “high” explosion occurrence, each vessel may have been responsible for 20–100 explosions per night (assuming an average night duration in Southern California), which is about 2–8 explosions per hour from each vessel. As an example, on the day with maximum recorded explosion counts of 2,800 (February 23, 2009 at site G2) 27 squid landing receipts were issued for that area. This resulted in an average of eight explosions per vessel per hour over the course of the night (night-length was 12.75 h for that day). This assumes that every squid vessel (but no vessels from other fishing sectors) used seal bombs and that they were used evenly throughout the night, which both may not be true (e.g., seal bomb usage could be concentrated during certain actions, like hauling the nets). Even so, when considering the number of potential vessels involved, the number of seal bombs used per squid vessel appears to be feasible. However, exceptionally high rates of confirmed explosions on short time scales (up to ∼400 explosions per hour) attest to the high level of use that can occur sometimes.
The correlation between explosions and squid landings/receipts, as well as the spatial and temporal overlap of explosions and known squid fishing practices, leads us to conclude that the major source of seal bombs detected in this study is the market squid fishery. However, as not all sites showed significant correlations, there is likely another fishery, not analyzed in this study, which uses explosive deterrents. Additionally, it is possible that seal bombs are used to some extent during CPF fishing as well, as fishermen for market squid and CPF are often one and the same. Though this does not seem to be a main source compared to squid fishing over our study period and sites, as no significant correlation was found (Supplementary Table 4). However, CPF fishing seemed to be mostly concentrated around Catalina Island and Santa Monica Bay/San Pedro; sites which were not sampled on a long-term basis.
Sea lions in California prey on squids and CPF (Weise and Harvey, 2008); both fisheries as well as sea lions are concentrated in coastal areas. However, correlations with explosion occurrence only found for squid indicate the possibility that seal bombs are also being used for other reasons beside pinniped deterrence within the squid fishery.
Interannual Variation of Explosions and Fisheries
Explosion counts in the Southern California Bight decreased from 2009 to 2015 with lowest values in 2014 and 2015. Squid landings also decreased around the five sites with long-term recordings, again particularly in 2014 and 2015, although an overall decreasing trend was not as pronounced as it was for explosions (Table 3 and Figure 8). Yearly fluctuations in landings indicate that changes occurred in the commercial fishing industry, which likely impacted seal bombs usage, too.
In 2011, the Bureau of Alcohol, Tobacco, Firearms and Explosives (ATF) began enforcing the regulations of the Safe Explosives Act, making the purchase and handling of seal bombs more difficult for the fishing community (27 Code of Federal Regulations, Part 555, Subpart D, G, and K1). The increased paperwork for permits and reports, as well as specific storage regulations (which may be difficult to implement on fishing vessels), likely made seal bombs a less attractive resource.
Additionally, during the period of this study, there were environmental variations that could have impacted the use of seal bombs: a warm water “blob” between 2013 and 2016 (Gentemann et al., 2017) and El Niño events in 2009/2010 and 2015/2016, which affected the market squid fishery. The market squid fishery is one of the biggest and most important fisheries in California in terms of volume and value: most years it is the number one fishery in the state (California Department of Fish and Game, 2012; California Department of Fish and Wildlife, 2014, 2015). However, market squids are very sensitive to rising ocean temperatures, such as during El Niño events, and so the fishery tends to fluctuate along with environmental variation. Historically, overall squid landings decreased during El Niño and later recovered during La Niña phases (Pacific Fishery Management Council, 2019). During the El Niño of 1997/98, the squid fishery disappeared completely around the Channel Islands (Jackson and Domeier, 2003) and the El Niño of 2015/2016 resulted in greatly reduced squid landings as well (California Department of Fish and Wildlife, 2015). The underlying mechanism for this is not yet completely understood but is most likely linked to reduced food availability (krill species) for juvenile squid during times of reduced upwelling (Perretti and Sedarat, 2016). The warming from the “blob” together with early El Niño signals, also affected the geographic distribution of the squid fishery during our study period (Pacific Fishery Management Council, 2019). During the 2014/2015 season, the fishery moved northward resulting in a peak in squid landings off Central California and, for the first time in recent history, squid catches were reported even further north off Eureka, California (California Department of Fish and Wildlife, 2014; Ryley and Protasio, 2015).
The decrease in seal bomb explosions over the years, especially in 2014 and 2015, can be partly explained by the decline in squid landings due to the 2015/2016 El Niño and the warm “blob” event and the resulting geographic shift. Although there was an El Niño in 2009/2010 as well, landings and explosion counts were high in 2009. However, this event was not as strong as the 2015/2016 El Niño and it was characterized by an unusually fast phase transition (Kim et al., 2011). The 2015/2016 El Niño, on the other hand, was one of the most powerful of such events observed, comparable to the 1997/1998 event (Rupic et al., 2018).
Because the decline in explosions was more pronounced than the decline in squid landings, it is likely that other factors, like enforced ATF regulations, have contributed to the decreased use of seal bombs in more recent years as well. However, of the five sites analyzed for long-term trends, high squid landing amounts were only reported around site B (Figure 1) and the extent of the overall trend for squid landings in the Southern California Bight might be somewhat different. For example, for the CPF fishery, landings decreased strongly between 2009 and 2015 in the Southern California Bight (California Department of Fish and Wildlife, 2015), which is not reflected in landings around the five long-term sites, because they were low for CPF landings.
Even though detections of explosions decreased over the course of this study, it is possible that their use has since increased again once the squid fishery recovered from the El Niño. However, Simonis et al. (2020) did not report increasing counts of explosions in Monterey Bay between 2015 and 2018/2019.
Conclusion and Outlook
This study aims to improve understanding of where and when seal bombs are being utilized and of their likely impact on marine life, so that their future use can be better regulated. Until recently, the few published studies on the use of seal bombs have typically been from the 1990s or earlier, have often not been peer-reviewed, and primarily deal with the effectiveness of seal bombs as a marine mammal deterrent, not as a noise pollutant. However, in recent years, studies have begun to focus on seal bombs as a potential threat to marine life. The present study is the first long-term regional study on seal bomb explosions, and the first to closely examine their use within the purse-seine fishery. More research on impacts and the implementation of potential regulations on their use are greatly needed.
During peak times, seal bombs were likely one of the major anthropogenic noise sources off Southern California, with great potential to affect the marine environment and the behavior of marine animals, like cetaceans, which depend on hearing as their primary sensory mode. Extensive seal bomb noise has also been recorded in the vicinity or even inside National Marine Sanctuaries (the Channel Islands and Monterey Bay), which is especially problematic as anthropogenic interference should be minimal in these protected areas. The Southern California Bight is an important squid fishing ground and local communities depend on it. Fishermen have expressed, that damaged nets and predation on the catch by sea lions is a serious problem that results in significant economic losses. The results of our study suggest that this may be a particular problem for the market squid fishery. Taking an ecosystem-based approach as a basis, management and regulation should ensure that conservation and sustainable use are promoted in an equitable way. Therefore, communication and collaboration with fishermen are of great importance to cooperatively find a solution, as they will be able to add valuable information on the importance of seal bombs to their catch success and possibly on potential alternatives to seal bombs as deterrents.
Kerr and Scorse (2018) recommend that state and federal agencies immediately review their policies and invest more toward research and monitoring of seal bombs, as they pose a risk to the marine environment in California. The results of this study support NOAA in its objective to implement the proposed guidelines for “Safely Deterring Marine Mammals” (NOAA, 2020), as they would be the first to regulate seal bomb usage. The guidelines recommend the following regulations: The use of seal bombs is prohibited when cetaceans are present within a 100 m radius and a visual scan for cetaceans must be repeated before each deployment. For pinnipeds, a minimum safe distance (phocids 20 m, otariids 2 m) and a 180 s silent interval between deployments must be kept. If visibility is poor (<100 m) seal bomb use is prohibited. Additionally, seal bombs must explode behind an animal and not in front of it.
Our research indicates that simultaneous use of seal bombs by multiple fishing vessels in one area should also be considered for regulations, as such an occurrence would increase local impacts and make it difficult to ensure the 180 s silent period between deployments, which is necessary to give animals time to flee before hearing damage due to cumulative exposure is reached. As our results have also shown high sound exposure levels within a National Marine Sanctuary, further regulations to protect these sensitive areas, for example a buffer zone around protected areas, where seal bomb use is restricted or prohibited, could minimize negative impacts.
Not every recording site showed high correlations of explosions and squid landings. This means that there is likely another fishery using seal bombs and landings from other nighttime fisheries outside the purse-seine sector should also be tested for correlation with explosions. Research on more recent explosion occurrence off Southern California is needed to determine if seal bomb use has increased again with the recovery of the squid fishery after the warm water events. Another explosive deterrent, namely cracker shells, has recently (in 2019) been exempted from ATF regulations2. As they can now be purchased without a permit when used for legitimate wildlife control purposes, they might become more attractive for marine mammal deterrence within fisheries.
Data Availability Statement
The raw data supporting the conclusions of this article will be made available by the authors, without undue reservation.
Author Contributions
SB-P and AK designed the study. AK, AR, SB-P, SW, KF, FR, and JT were responsible for signal detection, programming, and data analysis. JR and AS contributed data and information on seal bomb use in Monterey Bay. AK and AR created graphical output. AK wrote the manuscript. SB-P, AD, and H-US provided conceptual guidance. All authors provided comments to improve the manuscript.
Funding
Graduate funding was provided by a doctoral scholarship from the Heinrich Böll Foundation. Dieter Paulmann from the Okeanos Foundation for the Sea granted a gift fund to support the Scripps Acoustic Ecology Laboratory in researching seal bomb use and its impacts on marine life. Funding for instrumentation, data collection and analysis was provided by US Navy Living Marine Resources, Frank Stone, Robert Gisiner, and Anurag Kumar; US Navy Pacific Fleet, Chip Johnson, Jessica Bredvik, Christiana Salles; and the United States Office of Naval Research, Michael Weise. The NSF funded installation and maintenance of the MARS cabled observatory through awards 0739828 and 1114794. Sound recording through the MARS cabled observatory was supported by the Monterey Bay Aquarium Research Institute, with funding from the David and Lucile Packard Foundation.
Conflict of Interest
The authors declare that the research was conducted in the absence of any commercial or financial relationships that could be construed as a potential conflict of interest.
Publisher’s Note
All claims expressed in this article are solely those of the authors and do not necessarily represent those of their affiliated organizations, or those of the publisher, the editors and the reviewers. Any product that may be evaluated in this article, or claim that may be made by its manufacturer, is not guaranteed or endorsed by the publisher.
Acknowledgments
The authors thank C. Garsha, B. Hurley, E. Roth, H. Basset, R. Griswold, B. Thayre, J. Hurwitz, and E. O’Neill for fieldwork, gear, and data processing. Many thanks to CDFW* for preparing and providing the purse-seine fishery landings data. Thanks to M. A. Roch, J. A. Hildebrand, A. Širović, A. J. Debich, J. Carretta, and the entire Scripps Acoustic Ecology Laboratory, especially A. Solsona Berga, A. Kok, and A. Giddings, for insightful scientific advice and discussions. AK would like to thank the Heinrich Böll Foundation for ideational, non-material support including political education and improvement of key qualifications. The authors are grateful to the reviewers for their constructive comments to improve the manuscript. *CDFW acquires data from its own fisheries management activities and from mandatory reporting requirements on the commercial and recreational fishery pursuant to the Fish and Game Code and the California Code of Regulations. These data are constantly being updated, and data sets are constantly modified. CDFW may provide data upon request, but, unless otherwise stated, does not endorse any particular analytical methods, interpretations, or conclusion based upon the data it provides.
Supplementary Material
The Supplementary Material for this article can be found online at: https://www.frontiersin.org/articles/10.3389/fmars.2021.796849/full#supplementary-material
Footnotes
- ^ https://www.atf.gov/explosives/explosives-pest-control-device-requirements (2020/06/25).
- ^ Stoneco Energetic Systems LLC. https://www.stonecowildlifecontrol.com/12-gauge-shellcracker.html (10/04/2021).
References
Alaska Trollers Association (2012). Use of Seal Bombs and New ATF Requirements. Juneau, AK: Alaska Trollers Association.
Andrew, R. K., Howe, B. M., and Mercer, J. A. (2002). Ocean ambient sound: comparing the 1960s with the 1990s for a receiver off the California coast. Acoust. Res. Lett. Onl. 3, 65–70. doi: 10.1121/1.1461915
Awbrey, F. T., and Thomas, J. A. (1987). “Measurements of sound propagation from several acoustic harassment devices,” in Acoustical Deterrents in Marine Mammal Conflicts With Fisheries, eds B. R. Mate and J. T. Harvey (Corvallis, OR: Oregon State University), 85–104.
Baumann-Pickering, S., Debich, A. J., Trickey, J. S., Široviæ, A., Gresalfi, R., Roch, M. A., et al. (2013). Examining Explosions in Southern California and Their Potential Impact on Cetacean Acoustic Behavior. La Jolla, CA: Scripps Insitution of Oceanography, 1–16.
Beeson, M. J., and Hanan, D. A. (1996). An Evaluation of Pinniped-Fishery Interactions in California. Sacramento, CA: California Department of Fish and Game, 1–47.
Benjamini, Y., and Hochberg, Y. (1995). Controlling the false discovery rate: a pratical and powerful approach to multiple testing. J. R. Statist. Soc. B 57, 289–300.
Brown, R., Jeffries, S., Hatch, D., and Wright, B. (2008). Field Report: 2008 Pinniped Management Activities at Bonneville Dam. Olympia, WAS: Washington Department of Fish and Wildlife, 1–9.
Brown, R., Jeffries, S., Hatch, D., Wright, B., and Jonker, S. (2013). Field Report: 2013 Pinniped Research and Management Activities at Bonneville Dam. Olympia, WAS: Washington Department of Fish and Wildlife, 1–12.
Buckstaff, K. C., Wells, R. S., Gannon, J. G., and Nowacek, D. P. (2013). Responses of bottlenose dolphins (Tursiops truncatus) to construction and demolition of coastal marine structures. Aquat. Mamm. 39, 174–186. doi: 10.1578/am.39.2.2013.174
California Department of Fish and Game (2005). Review of Some California Fisheries for 2004: Coastal Pelagic Finfish, Market Squid, Sea Urchin, Lobster, Spot and Ridgeback Prawn, Groundfish, Highly Migratory Species, Ocean Salmon, Nearshore Live-Fish, Pacific Herring, and Recreational. La Jolla, CA: California Department of Fish and Game, 10–31.
California Department of Fish and Game (2012). Review of Selected California Fisheries For 2011: Ocean Salmon, California Sheephead, California Halibut, Longnose Skate, Petrale Sole, California Spiny Lobster, Dungeness Crab, Garibaldi, White Shark, and Algal Blooms. Los Alamitos, CA: California Department of Fish and Game, 15–40.
California Department of Fish and Wildlife (2014). Review of Selected California Fisheries For 2013: Coastal Pelagic Finfish, Market Squid, Groundfish, Highly Migratory Species, Dungeness Crab, Basses, Surfperch, Abalone, Kelp and Edible Algae, and Marine Aquaculture. Los Alamitos, CA: California Department of Fish and Wildlife, 11–50.
California Department of Fish and Wildlife (2015). Review of Selected California Fisheries For 2014: Coastal Pelagic Finfish, Market Squid, Groundfish, Pacific Herring, Dungeness Crab, Ocean Salmon, True Smelts, Hagfish, and Deep Water Rov Surveys of Mpas and Surrounding Nearshore Habitat. Los Alamitos, CA: California Department of Fish and Wildlife, 1–30.
California Department of Fish and Wildlife (2020). Market Squid, Doryteuthis (Loligo Opalescens), Enhanced Status Report. Sacramento, CA: California Department of Fish and Wildlife.
California Department of Fish and Wildlife (2021). Commercial Fishing Licenses and Permits 2010-2019. Sacramento, CA: California Department of Fish and Wildlife.
Carslaw, D. C., and Ropkins, K. (2012). openair – an R package for air quality data analysis. Environ. Modell. Softw. 27-28, 52–61.
Cassano, E. R., Myrick, A. C., Glick, C. B., Holland, R. C., and Lennert, C. E. (1990). The Use of Seal Bombs on Dolphin in the Yellowfin Tuna Purse-Seine Fishery. La Jolla, CA: Southwest Fisheries Center, 1–31.
Castellote, M., Clark, C. W., and Lammers, M. O. (2012). Acoustic and behavioural changes by fin whales (Balaenoptera physalus) in response to shipping and airgun noise. Biol. Conserv. 147, 115–122. doi: 10.1016/j.biocon.2011.12.021
Cleveland, R. B., Cleveland, W. S., McRae, J. E., and Terpenning, I. (1990). STL: a seasonal-trend decomposition procedure based on loess. J. Off. Stat. 6, 3–33.
Cohen, J. (1988). Statistical Power Analysis for the Behavioral Sciences. Hillsdale, NY: Lawrence Erlbaum Associates.
Cole, R. H. (1948). Underwater Explosions. Princeton, NJ: Princeton University Press. doi: 10.5962/bhl.title.48411
Croll, D. A., Clark, C. W., Calambokidis, J., Ellison, W. T., and Tershy, B. R. (2001). Effect of anthropogenic low-frequency noise on the foraging ecology of Balaenoptera whales. Anim. Conserv. 4, 13–27. doi: 10.1017/s1367943001001020
Dahlheim, M. E. (1988). Killer Whale (Orcinus Orca) Depredation on Longline Catches of Sablefish (Anoplopoma Fimbria) in Alaskan Waters. Seattle, WAS: Northwest and Alaska Fisheries Center, 1–31.
Dähne, M., Gilles, A., Lucke, K., Peschko, V., Adler, S., Krugel, K., et al. (2013). Effects of pile-driving on harbour porpoises (Phocoena phocoena) at the first offshore wind farm in Germany. Environ. Res. Lett 8:16.
Day, R. D., McCauley, R. D., Fitzgibbon, Q. P., Hartman, K., and Semmens, J. M. (2019). Seismic air guns damage rock lobster mechanosensory organs and impair righting reflex. Proc. R. Soc. B Biol. Sci. 286:10.
DeRuiter, S. L., Southall, B. L., Calambokidis, J., Zimmer, W. M. X., Sadykova, D., Falcone, E. A., et al. (2013). First direct measurements of behavioural responses by Cuvier’s beaked whales to mid-frequency active sonar. Biol. Lett. 9:5. doi: 10.1098/rsbl.2013.0223
Deutsches Bundesministerium für Umwelt, Naturschutz und nukleare Sicherheit (2013). Konzept Für Den Schutz Der Schweinswale Vor Schallbelastungen Bei Der Errichtung Von Offshore-Windparks in Der Deutschen Nordsee (Schallschutzkonzept). Berlin: BMU.
Di Iorio, L., and Clark, C. W. (2010). Exposure to seismic survey alters blue whale acoustic communication. Biol. Lett. 6, 334–335. doi: 10.1098/rsbl.2009.0967
Dos Santos, M. E., Couchinho, M. N., Luís, A. R., and Gonçalves, E. J. (2010). Monitoring underwater explosions in the habitat of resident bottlenose dolphins. J. Acoust. Soc. Am. 128, 3805–3808. doi: 10.1121/1.3506378
Finneran, J. J., Schlundt, C. E., Carder, D. A., Clark, J. A., Young, J. A., Gaspin, J. B., et al. (2000). Auditory and behavioral responses of bottlenose dolphins (Tursiops truncatus) and a beluga whale (Delphinapterus leucas) to impulsive sounds resembling distant signatures of underwater explosions. J. Acoust. Soc. Am. 108, 417–431. doi: 10.1121/1.429475
Fox, H. E., and Caldwell, R. L. (2006). Recovery from blast fishing on coral reefs: a tale of two scales. Ecol. Appl. 16, 1631–1635. doi: 10.1890/1051-0761(2006)016[1631:rfbfoc]2.0.co;2
Fox, H. E., Pet, J. S., Dahuri, R., and Caldwell, R. L. (2003). Recovery in rubble fields: long-term impacts of blast fishing. Mar. Pollut. Bull. 46, 1024–1031. doi: 10.1016/S0025-326X(03)00246-7
Geiger, A. C., and Jeffries, S. J. (1987). “Evaluation of seal harassment techniques to protect gill netted salmon,” in Acoustical Deterrents in Marine Mammal Conflicts With Fisheries, eds B. R. Mate and J. T. Harvey (Corvallis, OR: Oregon State University), 37–55.
Gendron, D., Lanham, S., and Carwardine, M. (1999). North Pacific right whale (Eubalaena glacialis) sighting South of Baja California. Aquat. Mamm. 25, 31–34.
Gentemann, C. L., Fewings, M. R., and Garcia-Reyes, M. (2017). Satellite sea surface temperatures along the West Coast of the United States during the 2014-2016 northeast Pacific marine heat wave. Geophys. Res. Lett. 44, 312–319. doi: 10.1002/2016gl071039
Goldbogen, J. A., Southall, B. L., DeRuiter, S. L., Calambokidis, J., Friedlaender, A. S., and Hazen, et al. (2013). Blue whales respond to simulated mid-frequency military sonar. Proc. R. Soc. B 280, 1–8. doi: 10.1098/rspb.2013.0657
Gordon, J., Gillespie, D., Potter, J., Frantzis, A., Simmonds, M. P., Swift, R., et al. (2003). A review of the effects of seismic surveys on marine mammals. Mar. Technol. Soc. J. 37, 16–34. doi: 10.1007/978-1-4939-2981-8_16
Götz, T., and Janik, V. M. (2013). Acoustic deterrent devices to prevent pinniped depredation: efficiency, conservation concerns and possible solutions. Mar. Ecol. Prog. Ser. 492, 285–302. doi: 10.3354/meps10482
Govoni, J. J., West, M. A., Settle, L. R., Lynch, R. T., and Greene, M. D. (2008). Effects of underwater explosions on larval fish: implications for a coastal engineering project. J. Coast. Res. 24, 228–233. doi: 10.2112/05-0518.1
Guerra, A., González, A. F., and Rocha, F. (2004). “A review of the records of giant squid in the north-eastern Atlantic and severe injuries in Architeuthis dux stranded after acoustic explorations,” in Proceedings of the International Council for the Exploration of the Sea Annual Science Conference, September 22-25, 2004, Vigo.
Guerra, M., Thode, A. M., Blackwell, S. B., and Macrander, A. M. (2011). Quantifying seismic survey reverberation off the Alaskan North Slope. J. Acoust. Soc. Am. 130, 3046–3058. doi: 10.1121/1.3628326
Hackett, S. C., Hansen, M. D., King, D., and Price, E. (2009). The Economic Structure of California’s Commercial Fisheries. Sacramento, CA: California Department of Fish and Game, 1–87.
Hall, A., Ellis, G., and Trites, A. W. (2002). Harbour Porpoise Interactions With the 2001 Selective Salmon Fisheries in Southern British Columbia and License Holder Reported Small Cetacean By-Catch. Vancouver, BC: Fisheries and Oceans Canada, 1–51.
Hall, M., and Roman, M. (2013). Bycatch and Non-Tuna Catch in the Tropical Tuna Purse Seine Fisheries of the World. FAO Fisheries and Aquaculture Technical Paper No. 568. Rome: FAO, 249.
Haren, A. M. (2007). Reducing noise pollution from commercial shipping in the channel islands national marine sanctuary: a case study in marine protected area management of underwater noise. J. Int. Wildl. Law Policy 10, 153–173. doi: 10.1080/13880290701347432
Helble, T. A., Ierley, G. R., D’Spain, G. L., Roch, M. A., and Hildebrand, J. A. (2012). A generalized power-law detection algorithm for humpback whale vocalizations. J. Acoust. Soc. Am. 131, 2682–2699. doi: 10.1121/1.3685790
Hildebrand, J. A. (2009). Anthropogenic and natural sources of ambient noise in the ocean. Mar. Ecol. Prog. Ser. 395, 5–20. doi: 10.3354/meps08353
Hirsch, A. E., and Ommaya, A. (1972). Head injury caused by underwater explosion of a firecracker – Case report. J. Neurosurg. 37, 95–99. doi: 10.3171/jns.1972.37.1.0095
Houser, D. S., Martin, S. W., and Finneran, J. J. (2013). Behavioral responses of California sea lions to mid-frequency (3250-3450 Hz) sonar signals. Mar. Environ. Res. 92, 268–278. doi: 10.1016/j.marenvres.2013.10.007
Hu, M. Y., Hong Young, Y., Wen-Sung, C., Jen-Chieh, S., and Pung-Pung, H. (2009). Acoustically evoked potentials in two cephalopods inferred using the auditory brainstem response (ABR) approach. Comp. Biochem. Phys. A 153, 278–283. doi: 10.1016/j.cbpa.2009.02.040
Hubbs, C. L., and Rechnitzer, A. B. (1952). Report on experiments designed to determine effects of underwater explosions on fish life. Cal. Fish Game 38, 333–365.
Jackson, G. D., and Domeier, M. L. (2003). The effects of an extraordinary El Niño / La Niña event on the size and growth of the squid Loligo opalescens off Southern California. Mar. Biol. 142, 925–935. doi: 10.1007/s00227-002-1005-4
Jefferson, T. A., and Curry, B. E. (1996). Acoustic methods of reducing or eliminating marine mammal-fishery interactions: Do they work? Ocean Coastal Manage. 31, 41–70. doi: 10.1016/0964-5691(95)00049-6
Jones, I. T., Stanley, J. A., and Mooney, T. A. (2020). Impulsive pile driving noise elicts alarm responses in squid (Doryteuthis pealeii). Mar. Pollut. Bull 150, 110792. doi: 10.1016/j.marpolbul.2019.110792
Kaltenberg, A. M., and Benoit-Bird, K. J. (2009). Diel behavior of sardine and anchovy schools in the California Current System. Mar. Ecol. Prog. Ser. 394, 247–262. doi: 10.3354/meps08252
Kassambara, A. (2020). Ggpubr: ‘ggplot2’ Based Publication Ready Plots. Available online at: https://CRAN.R-project.org/package=ggpubr.
Kemper, C. M., Pemberton, D., Cawthron, M., Heinrich, S., Mann, J., Würsig, B., et al. (2003). “Aquaculture and marine mammals: co-existence or conflict?,” in Marine Mammals: Fisheries, Tourism and Management Issues, eds N. Gales, M. Hindell, and R. Kirkwood (Clayton, VIC: CSIRO Publishing), 208–225.
Kerr, A., and Scorse, J. (2018). The Use of Seal Bombs in California Fisheries: Unknown Impacts Point To An Urgent Need For More Research. Monterey, CA: Center for the Blue Economy, 1–14.
Kim, W., Yeh, S. W., Kim, J. H., Kug, J. S., and Kwon, M. (2011). The unique 2009-2010 El Nino event: a fast phase transition of warm pool El Nino to La Nina. Geophys. Res. Lett. 38, 1–5. doi: 10.1029/2011GL048521
Komsta, L. (2019). Mblm: Median-Based Linear Models. Available online at: https://CRAN.R-project.org/package=mblm.
Koschinski, S. (2012). Underwater noise pollution from munitions clearance and disposal, possible effects on marine vertebrates, and its mitigation. Mar. Technol. Soc. J. 45, 80–88. doi: 10.4031/mtsj.45.6.2
Krutzikowsky, G., and Smith, J. (2012). Oregon’s Sardine Fishery 2009 Summary. Newport: Oregon Department of Fish and Wildlife.
Leatherwood, S., Reeves, R. R., Perrin, W. F., and Evans, W. E. (1982). Whales, Dolphins, and Porpoises of the Eastern North Pacific and Adjacent Arctic Waters: A Guide to Their Identification. NOAA Technical Report NMFS Circular 444. Washington, DC: NOAA.
Lecomte, J. B., Benoit, H. P., Ancelet, S., Etienne, M. P., Bel, L., and Parent, E. (2013). Compound Poisson-gamma vs. delta-gamma to handle zero-inflated continuous data under a variable sampling volume. Methods Ecol. Evol. 4, 1159–1166. doi: 10.1111/2041-210X.12122
Lucke, K., Siebert, U., Lepper, P. A., and Blanchet, M. A. (2009). Temporary shift in masked hearing thresholds in a harbor porpoise (Phocoena phocoena) after exposure to seismic airgun stimuli. J. Acoust. Soc. Am. 125, 4060–4070.
Lynn, K., Porzio, D., and Kesaris, A. (2014). Aerial sardine surveys in the Southern California Bight. Cal. Fish Game 100, 260–275.
Maxwell, M. R., Henry, A., Elvidge, C. D., Safran, J., Hobson, V. R., Nelson, I., et al. (2004). Fishery dynamics of the California market squid (Loligo opalescens), as measured by satellite remote sensing. Fish. Bull. 102, 661–670.
McCauley, R. D., and Fewtrell, J. (2008). Marine invertebrates, intense anthropogenic noise, and squid response to seismic survey pulses. Bioacoustics 17, 315–318. doi: 10.1080/09524622.2008.9753861
McCauley, R. D., Day, R. D., Swadling, K. M., Fitzgibbon, Q. P., Watson, R. A., and Semmens, J. M. (2017). Widely used marine seismic survey air gun operations negatively impact zooplankton. Nat. Ecol. Evol. 1, 1–8. doi: 10.1038/s41559-017-0195
McDonald, M. A., Hildebrand, J. A., and Wiggins, S. M. (2006). Increases in deep ocean ambient noise in the Northeast Pacific west of San Nicolas Island, California. J. Acoust. Soc. Am. 120, 711–718. doi: 10.1121/1.2216565
McDonald, M. A., Hildebrand, J. A., Wiggins, S. M., and Ross, D. (2008). A 50 Year comparison of ambient ocean noise near San Clemente Island: a bathymetrically complex coastal region off Southern California. J. Acoust. Soc. Am. 124, 1985–1992. doi: 10.1121/1.2967889
McKenna, M. F. (2011). Blue Whale Response to Underwater Noise From Commercial Ships. Ph. D. dissertation. La Jolla, CA: University of California San Diego.
Melcón, M. L., Cummins, A. J., Kerosky, S. M., Roche, L. K., Wiggins, S. M., and Hildebrand, J. A. (2012). Blue whales respond to anthropogenic noise. PLoS One 7:6. doi: 10.1371/journal.pone.0032681
Mooney, T. A., Hanlon, R. T., Christensen-Dalsgaard, J., Madsen, P. T., Ketten, D. R., and Nachtigall, P. E. (2010). Sound detection by the longfin squid (Loligo pealeii) studied with auditory evoked potentials: sensitivity to low-frequency particle motion and not pressure. J. Exp. Biol. 213, 3748–3759. doi: 10.1242/jeb.048348
Munger, L. M., Camacho, D., Havron, A., Campbell, G., Calambokidis, J., Douglas, A., et al. (2009). Baleen whale distribution relative to surface temperature and zooplankton abundance off Southern California, 2004-2008. Cal. COFI Rep. 50, 155–168.
Myrick, A. C., Cassano, E. R., and Oliver, C. W. (1990a). Potential For Physical Injury, Other Than Hearing Damage, to Dolphins From Seal Bombs Used in the Yellowfin Tuna Purse-Seine Fishery: Results From Open-Water Tests. La Jolla, CA: Southwest Fisheries Center, 1–28.
Myrick, A. C., Fink, M., and Glick, C. B. (1990b). Identification, Chemistry, and Behavior of Seal Bombs Used to Control Dolphins in the Yellowfin Tuna Purse-Seine Fishery in the Eastern Tropical Pacific: Potential Hazards. La Jolla, CA: Southwest Fisheries Center, 1–25.
National Marine Fisheries Service (2018). 2018 Revision to: Technical Guidance for Assessing the Effects of Anthropogenic Sound on Marine Mammal Hearing (Version 2.0): Underwater Thresholds for Onset of Permanent and Temporary Threshold Shifts. Silver Spring, MD: U.S. Department of Commerce, NOAA, 1–167.
NOAA (1995). Taking and importing of marine mammals; deterrence regulations and guidelines. Federal Register 60, 22345–22348.
NOAA (2020). Proposed guidelines for safely deterring marine mammals. Federal Register 85, 53763–53784.
Nunifu, T., and Fu, L. (2019). Methods and Procedures for Trend Analysis of Air Quality Data. Edmonton, AB: Government of Alberta, Ministry of Environment and Parks.
Pacific Fishery Management Council (2019). Status of the Pacific Coast Coastal Pelagic Species Fishery and Recommended Acceptable Biological Catches. Stock Assessment and Fishery Evaluation 2018. Portland, OR: Pacific Fishery Management Council.
Pemberton, D., and Shaughnessy, P. D. (1993). Interaction between seals and marine fish-farms in Tasmania, and management of the problem. Aquat. Conserv. 3, 149–158. doi: 10.1002/aqc.3270030207
Perretti, C. T., and Sedarat, M. (2016). The influence of the El nino southern oscillation on paralarval market squid (Doryteuthis opalescens). Fish. Oceanogr. 25, 491–499. doi: 10.1111/fog.12167
Popper, A. N., and Hawkins, A. E. (2012). “The effects of noise on aquatic life,” in Advances in Experimental Medicine and Biology. New York, NY: Springer.
Popper, A., Hawkins, A. D., Fay, R. R., Mann, D. A., Bartol, S., and Carlson, et al. (2014). “Sound exposure guidelines for fishes and sea turtles: a technical report prepared by ANSI-Accredited standards committee S3/SC1 and registered with ANSI Introduction,” in Springer Briefs in Oceanography (New York, NY: Springer International Publishing). doi: 10.1007/978-3-319-06659-2_1
R Core Team (2020). R version 4.0.3: A Language and Environment For Statistical Computing. Vienna: R Foundation for Statistical Computing.
Richardson, W. J., Greene, C. R. Jr., Malme, C. I., and Thomson, D. H. (1995). Marine Mammals and Noise. San Diego, CA: Academic Press. doi: 10.1016/B978-0-08-057303-8.50011-2
Roch, M. A., Batchelor, H., Baumann-Pickering, S., Berchok, C. L., Cholewiak, D., Fujioka, E., et al. (2016). Management of acoustic metadata for bioacoustics. Ecol. Inform. 31, 122–136. doi: 10.1016/j.ecoinf.2015.12.002
Rone, B. K., Berchok, C. L., Crance, J. L., and Clapham, P. J. (2012). Using air-deployed passive sonobuoys to detect and locate critically endangered North Pacific right whales. Mar. Mamm. Sci. 28, E528–E538. doi: 10.1111/j.1748-7692.2012.00573.x
Rupic, M., Wetzell, L., Marra, J. J., and Balwani, S. (2018). 2014-2016 El Niño Assessment Report – An Overview of the Impacts of the 2014-16 El Niño on the U.S.-Affiliated Pacific Islands (USAPI). Honolulu, HI: NOAA.
Ryan, J., Cline, D., Dawe, C., McGill, P., Zhang, Y., DeVogelaere, A., et al. (2016). “New passive acoustic monitoring in Monterey Bay National Marine Sanctuary exploring natural and anthropogenic sounds in a deep soundscape,” in Proceedings of the Marine Technology Society/Institute of Electrical and Electronics Engineers Oceans Conference, Monterey, CA, 1–8. doi: 10.1109/OCEANS.2016.7761363
Ryley, L., and Protasio, C. (2015). Eureka! A review of California’s Commercial Market Squid Fishery and the Extension of Effort North in 2014. Sacramento, CA: California Department of Fish and Wildlife.
Saila, S. B., Kocic, V. L., and McManus, J. (1993). Modelling the effects of destructive fishing practices on tropical coral reefs. Mar. Ecol. Prog. Ser. 94, 51–60. doi: 10.3354/meps094051
Schakner, Z. A., and Blumstein, D. T. (2013). Behavioral biology of marine mammal deterrents: a review and prospectus. Biol. Conserv. 167, 380–389. doi: 10.1016/j.biocon.2013.08.024
Scholl, J., and Hanan, D. A. (1987). “Acoustic harassment devices tested in combination with cracker shells on pinnipeds interacting with the Southern California partyboat fishery,” in Acoustical Deterrents in Marine Mammal Conflicts With Fisheries, eds B. R. Mate and J. T. Harvey (Corvallis, OR: Oregon State University), 67–74.
Scordino, J. (2010). West Coast Pinniped Program Investigations on California Sea Lion and Pacific Harbor Seal Impacts on Salmonids and Other Fishery Resources. Portland, OR: Pacific States Marine Fisheries Commission.
Sen, P. K. (1968). Estimates of regression coefficient based on Kendall’s Tau. J. Am. Stat. Assoc. 63, 1379–1389. doi: 10.1080/01621459.1968.10480934
Shannon, G., McKenna, M. F., Angeloni, L. M., Crooks, K. R., Fristrup, K. M., Brown, E., et al. (2015). A synthesis of two decades of research documenting the effects of noise on wildlife. Biol. Rev. 91, 982–1005. doi: 10.1111/brv.12207
Shapiro, A. D., Tougaard, J., Jorgensen, P. B., Kyhn, L. A., Balle, J. D., Bernardez, C., et al. (2009). Transmission loss patterns from acoustic harassment and deterrent devices do not always follow geometrical spreading predictions. Mar. Mamm. Sci. 25, 53–67. doi: 10.1111/j.1748-7692.2008.00243.x
Shaughnessy, P. D., Semmelink, A., Cooper, J., and Frost, P. G. H. (1981). Attempts to develop acoustic methods of keeping cape fur seals Arctocephalus pusillus from fishing nets. Biol. Conserv. 21, 141–158.
Simonis, A. E., Forney, K. A., Rankin, S., Ryan, J., Zhang, Y. W., DeVogelaere, A., et al. (2020). Seal bomb noise as a potential threat to Monterey Bay harbor porpoise. Front. Mar. Sci. 7:142. doi: 10.3389/fmars.2020.00142
Simonis, A. E., Roch, M. A., Bailey, B., Barlow, J., Clemesha, R. E. S., Iacobellis, S., et al. (2017). Lunar cycles affect common dolphin Delphinus delphis foraging in the Southern California Bight. Mar. Ecol. Prog. Ser. 577, 221–235. doi: 10.3354/meps12247
Smyth, G., Hu, Y., Dunn, P., Phipson, B., and Chen, Y. (2021). Statmod: Statistical Modelling. Available online at: https://CRAN.R-project.org/package=statmod.
Soldevilla, M. S., Wiggins, S. M., and Hildebrand, J. A. (2010). Spatial and temporal patterns of Risso’s dolphin echolocation in the Southern California Bight. J. Acoust. Soc. Am. 127, 124–132. doi: 10.1121/1.3257586
Solé, M., Lenoir, M., Durfort, M., Lopez-Bejar, M., Lombarte, A., van der Schaal, M., et al. (2013). Does exposure to noise from human activities compromise sensory information from cephalopod statocysts? Deep Sea Res. Part II Top. Stud. Oceanogr. 95, 160–181. doi: 10.1016/j.dsr2.2012.10.006
Southall, B. L., Bowies, A. E., Ellison, W. T., Finneran, J. J., Gentry, R. L., and Greene, C. R. Jr. et al. (2007). Marine mammal noise exposure criteria: initial scientific recommendations. Aquat. Mamm. 3, 411–521. doi: 10.1578/AM.33.4.2007.411
Stone, C. J., and Tasker, M. L. (2006). The effects of seismic airguns on cetaceans in UK waters. J. Cetacean Res. and Manage. 8, 255–263.
Sweetnam, D. (2010). “Current management and fishery-dependent sampling of the U.S. paci?c sardine fishery,” in Proceedings of the Workshop on Enhancing Stock Assessments of Pacific Sardine in the California Current Through Cooperative Surveys, 1-3 June, 2010, La Jolla, CA.
Todd, S., Stevick, P., Lien, J., Marques, F., and Ketten, D. (1996). Behavioural effects of exposure to underwater explosions in humpback whales (Megaptera novaeangliae). Can. J. Zool. Rev. Can. Zool. 74, 1661–1672. doi: 10.1139/z96-184
Viada, S. T., Hammer, R. A., Racca, R., Hannay, D., Thompson, M. J., Balcom, B. J., et al. (2008). Review of potential impacts to sea turtles from underwater explosive removal of offshore structures. Environ. Impact Assess. Rev. 28, 267–285. doi: 10.1016/j.eiar.2007.05.010
Visser, I. N. (2000). Killer whale (Orcinus orca) interactions with longline fisheries in New Zealand waters. Aquat. Mamm. 26, 241–252.
Vojkovich, M. (1998). The California Fishery for Market Squid (Loligo Opalescens). Santa Barbara, CA: California Department of Fish and Game, 55–60.
Walker, E., Gaertner, D., Gaspar, P., and Bez, N. (2010). Fishing activity of tuna purse seiners estimated from VMS data and validated by observers’ data. Collect. Vol. Sci. Pap. ICCAT 65, 2376–2391.
Weise, M. J., and Harvey, J. T. (2008). Temporal variability in ocean climate and California sea lion diet and biomass consumption: implications for fisheries management. Mar. Ecol. Prog. Ser. 373, 157–172. doi: 10.3354/meps07737
Wiggins, S. M., and Hildebrand, J. A. (2007). “High-frequency acoustic recording package (HARP) for broadband, long-term marine mammal monitoring,” in Proceedings of the International Symposium on Underwater Technology 2007 and International Proceedings of the Workshop on Scientific Use of Submarine Cables and Related Technologies 2007, (Tokyo: Institute of Electrical and Electronics Engineers), 551–557. doi: 10.1109/UT.2007.370760
Wiggins, S. M., and Hildebrand, J. A. (2016). Final Report Living Marine Resources: ID-33 Technology Demonstration For Fleet Passive Acoustic Monitoring. La Jolla, CA: Marine Physical Laboratory Scripps Institution of Oceanography University of California San Diego.
Wiggins, S. M., Debich, A. J., Trickey, J. S., Rice, A. C., Thayre, B. J., Baumann-Pickering, S., et al. (2017). Summary of Ambient and Anthropogenic Sound in the Gulf of Alaska and Northwest Coast. La Jolla, CA: Marine Physical Laboratory, Scripps Institution of Oceanography.
Wiggins, S. M., Krumpel, A., Dorman, L. M., Hildebrand, J. A., and Baumann-Pickering, S. (2021). Seal bomb explosion sound source characterization. J. Acoust. Soc. Am. 150, 1821–1829. doi: 10.1121/10.0006101
Williams, R., Wright, A. J., Ashe, E., Blight, L. K., Bruintjes, R., Canessa, R., et al. (2015). Impacts of anthropogenic noise on marine life: publication patterns, new discoveries, and future directions in research and management. Ocean Coastal Manage. 115, 17–24. doi: 10.1016/j.ocecoaman.2015.05.021
Wood, S. N. (2021). MGCV: Mixed GAM Computation Vehicle With Automatic Smoothness Estimation. Available online at: https://CRAN.R-project.org/package=mgcv.
Woodman, G. H., Wilson, S. C., Li, V. Y. F., and Renneberg, R. (2003). Acoustic characteristics of fish bombing: potential to develop an automated blast detector. Mar. Pollut. Bull. 46, 99–106. doi: 10.1016/s0025-326x(02)00322-3
Zeileis, A., Grothendieck, G., Ryan, J. A., Ulrich, J. M., and Andrews, F. (2021). Zoo: S3 Infrastructure for Regular and Irregular Time Series. Available online at: https://CRAN.R-project.org/package=zoo.
Keywords: underwater explosions, seal bombs, acoustic deterrence, purse-seine fisheries, market squid, Southern California (United States)
Citation: Krumpel A, Rice A, Frasier KE, Reese F, Trickey JS, Simonis AE, Ryan JP, Wiggins SM, Denzinger A, Schnitzler H-U and Baumann-Pickering S (2021) Long-Term Patterns of Noise From Underwater Explosions and Their Relation to Fisheries in Southern California. Front. Mar. Sci. 8:796849. doi: 10.3389/fmars.2021.796849
Received: 17 October 2021; Accepted: 29 November 2021;
Published: 23 December 2021.
Edited by:
Trevor Willis, Stazione Zoologica Anton Dohrn Napoli, ItalyReviewed by:
Francesco Caruso, Stazione Zoologica Anton Dohrn Napoli, ItalyNick Tolimieri, Northwest Fisheries Science Center, National Oceanic and Atmospheric Administration (NOAA), United States
Copyright © 2021 Krumpel, Rice, Frasier, Reese, Trickey, Simonis, Ryan, Wiggins, Denzinger, Schnitzler and Baumann-Pickering. This is an open-access article distributed under the terms of the Creative Commons Attribution License (CC BY). The use, distribution or reproduction in other forums is permitted, provided the original author(s) and the copyright owner(s) are credited and that the original publication in this journal is cited, in accordance with accepted academic practice. No use, distribution or reproduction is permitted which does not comply with these terms.
*Correspondence: Anna Krumpel, YS5rcnVtcGVsQHBvc3Rlby5kZQ==