 Shan Zhou1,2,3
 Chenrong Fan1,2,3Haoming Xia3
 Jian Zhang1Wei Yang1,2,3Dengjie Ji1,2,3Lei Wang1,2,3Li Chen1,2,3*
 Nannan Liu1,2,3*
- 1Jiangsu Key Laboratory of Marine Bioresources and Environment, Jiangsu Ocean University, Lianyungang, China
- 2Co-innovation Center of Jiangsu Marine Bio-Industry Technology, Jiangsu Ocean University, Lianyungang, China
- 3Jiangsu Institute of Marine Resources Development, Jiangsu Ocean University, Lianyungang, China
With the increase in fishing intensity and the intensification of marine pollution, the fishery resources in the Zhoushan Sea are seriously degraded, and the difficulty of censusing fish diversity hampers effective management in marine fishes. Environmental DNA metabarcoding and bottom trawl methods were used to determine the ability of the methods to distinguish fish assemblages in the Zhoushan Sea. The species composition and diversity of the Zhoushan Sea were assessed via high-throughput sequencing analysis of eDNA coupled with bottom trawl fishery survey data, after which the two methods were compared. eDNA screening identified 38.2% more fish species than bottom trawls. Combining these two methods, 33 orders, 65 families, and 130 species of fishes were identified. Perciformes and Clupeiformes, the most abundant orders in the catch, represented 31.5 and 10.0% of the total fish abundance, respectively. The results of ANOSIM and redundancy analyses indicated that the fish community structure varied significantly between summer and winter, however depth and temperature being the main environmental factors influencing fish distribution. The biodiversity index was higher in summer than in winter. Thus, our work provides more detailed seasonal data on biodiversity in the Zhoushan Sea, which is essential for the long-term management and conservation of coastal biodiversity. Compared with traditional survey methods, eDNA determination is highly sensitive, accurate, cost-efficient, and suitable for fish diversity studies in relevant sea areas. Although this approach cannot completely replace traditional methods, our findings demonstrate that it provides a reliable complementary method for assessing fish diversity in marine ecosystems.
Introduction
Fish diversity is an important component of aquatic biodiversity, and its conservation contributes greatly to the health and stability of aquatic ecosystems. Fish species diversity is currently used as a key indicator for monitoring the health of aquatic ecosystems and has important economic and ecological value (Zou et al., 2020). However, the effects of environmental changes on fish stocks must also be accounted for, as water pollution, overfishing, and invasive species have led to dramatic declines in native fish populations over the past decades (Beverton, 1991). Accurate knowledge of fish community composition and its spatial and temporal distribution dynamics in the marine environment is an important prerequisite for marine biodiversity conservation (Lodge et al., 2012).
In the past, fish diversity surveys largely relied on bottom trawling; however, environmental DNA (eDNA) techniques have been increasingly applied in recent years to assess fish diversity (Yamamoto et al., 2017; Stat et al., 2019). eDNA is the free DNA released by organisms in ice cores, soil, air, water, substrate, and other environments (Fahner et al., 2016; Collins et al., 2018; Seymour et al., 2018). eDNA technology consists of sampling DNA from the environment, after which the nucleic acids are preserved, extracted, amplified, sequenced, and classified to determine the distribution of organisms in the sampled location (Deiner et al., 2015). eDNA metabarcoding technology was first applied in microbial ecology in the 1980s (Ogram et al., 1987; Bohmann et al., 2014), but it was not until 2008 that this technique was applied to the study of aquatic organism (Ficetola et al., 2008). The recent development of eDNA technology has thus provided a novel means for ecological and biodiversity monitoring. Particularly, this technology has made fish surveys more time-efficient, cost-effective, and non-invasive, all of which has promoted its widespread adoption. Sigsgaard et al. (2017) successfully monitored seasonal changes in the structure of Danish coastal fish communities using 12S rRNA genetic markers. Thomsen et al. (2016) conducted a comparative study of eDNA technology and trawl surveys of deep-water fish in the subarctic. The authors compared the eDNA method with conventional fish stock survey methods in an offshore environment, and demonstrated that the eDNA method was more sensitive and more suitable for fish diversity studies than conventional survey methods (Thomsen et al., 2012). Holman et al. (2019) surveyed sediment and water samples from United Kingdom coastal docks based on eDNA and compared them with historical results, identifying several non-native species, including several newly introduced species (Djurhuus et al., 2020). However, to the best of our knowledge, no previous research has been conducted to study fish diversity in the East China Sea using eDNA metabarcoding.
The objectives of the present work were to compare the fish taxa identified by the two approaches and to determine the ability of the methods to distinguish fish assemblages in the Zhoushan Sea. Although eDNA technology has many advantages, it cannot completely replace traditional methods. Therefore, this study collected DNA samples from the Zhoushan Sea and analyzed them using high-throughput sequencing technology. Additionally, fishery resources were surveyed using bottom trawls to characterize the species composition and diversity of the fish community in August 2020 and January 2021.
Materials and Methods
Study Area
The Zhoushan Islands are the largest archipelago in China, located in the south of the mouth of the Yangtze River and east of Hangzhou Bay (29°30′–30°50′ N; 120°56′–123°00′ E). The archipelago consists of 1,390 islands with a total area of 22,216 km2 (Huang et al., 2020). The warm Taiwan Current and coastal currents converge here, providing a rich source of nutrients for native fish (Wang S. et al., 2020). As of 2018, Zhoushan City has 7,286 fishing boats and produces a total of 1.46 million tons of marine catches each year. Over the years, however, the Zhoushan Sea ecosystem has deteriorated due to overfishing, environmental pollution, and large-scale marine development activities (Lin et al., 2002; Chen et al., 2014; Wang et al., 2014). Ecosystem degradation and overfishing have led to a decline in fishery resources. In this study, bottom trawling and eDNA metabarcoding were conducted in summer (August 2020) and winter (January 2021) to investigate fish diversity in the areas surrounding the Zhongjieshan islands (Sites 4, 5, 6, 7) and Ma’an islands (Sites 1, 2, 3) of Zhoushan Sea. A total of seven stations were set in each season (Figure 1).
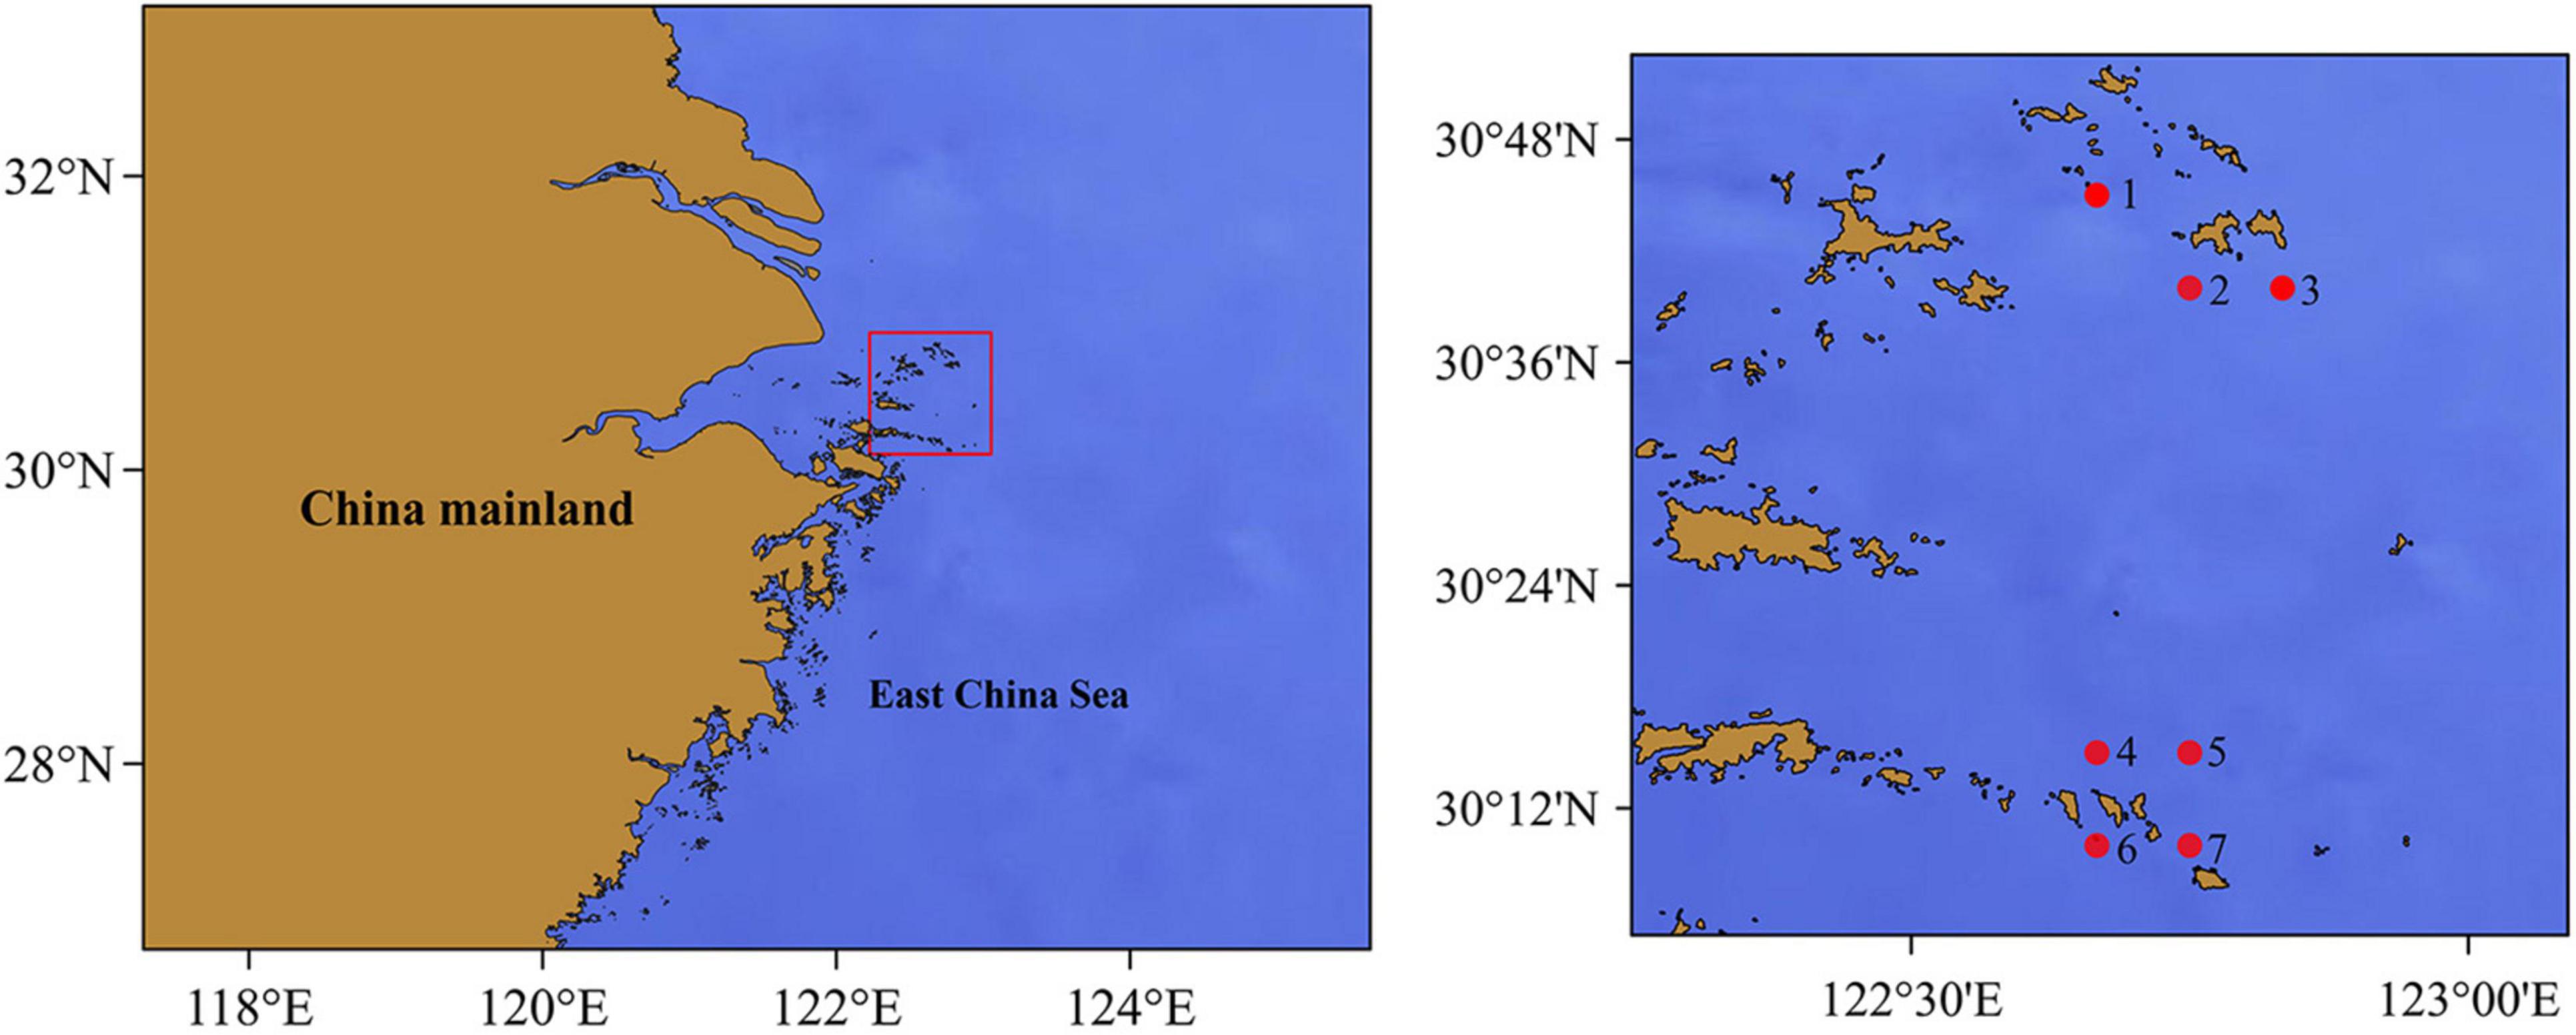
Figure 1. Location of samples collected in the Zhoushan Sea (China). Seawater samples for eDNA analysis and catches for biological identification (the dots represent the coastal water sampling sites and the end position of the bottom trawl).
Sample Collection
Water Sample Collection
The water depths of the survey stations were all between 25 and 50 m. Three samples were collected from each site and stored at −20°C for nutrient determination. Bottom water salinity, temperature, and depth were recorded using a conductivity–temperature–depth (CTD) system (data in the supplementary file).
Trawling Survey
A single-boat bottom trawl was used for the fish survey. The fishing boat was 31 m long, 4.8 m wide, and had 82 tons. The single bag wing trawl had a perimeter of 48 m and a mesh size of 25 mm. The average towing speed was 3 kn/h and the trawls were conducted for approximately 1 h at each station. All samples were retained for analysis for stations with catches of less than 20 kg. For stations with 20–40 kg catches, large individuals and rare species were selected and 1/2 of the remaining samples were randomly selected for retention. For stations with catches exceeding 40 kg, large individuals and rare species were selected and the remaining samples were randomly selected for retention, after which a 20 kg random sample was taken from the remainder. The samples were stored frozen and taken to the laboratory for taxonomic identification and other analyses.
eDNA Collection
At each sampling point, 1 L of surface seawater was taken each time, and water was taken three times (approximately 20 cm below the water surface) was collected in sterile polypropylene bottles (Thermo Fisher Scientific, United States) each time, as described in previous studies (Preston et al., 2011; Rees et al., 2014). All samples were vacuum filtered using 0.45 μm (MCE; Whatman) mixed cellulose filter membranes (Turner et al., 2014; Tsuji et al., 2019), and the membranes were mixed and sent for sequencing. The equipment used in the filtration process was sterile and sterile double-distilled water (ddH2O) was used as a negative control. After processing the water samples, the filtered membranes were placed in 2.0 mL sterile centrifuge tubes and stored in a tank of liquid nitrogen, then transported to the laboratory and stored in a −80°C refrigerator for further analysis.
Laboratory Analyses
DNA Extraction
The DNA extraction and metabarcoding experiments were conducted in the Jiangsu Key Laboratory of Marine Bioresources and Environment, where all utensils were routinely decontaminated with UV and sterilized with bleach. DNA was extracted using the eDNA Extraction Kit (OMEGA, United States) according to the manufacturer’s instructions. The DNA samples were inspected in 1% agarose gel and quantified using the Qubit PicoGreen fluorescence quantification system, then stored at −20°C. Each sample was extracted independently, and a blank filter membrane was used as a negative control.
Polymerase Chain Reaction Amplification and Sequencing
The 12s rDNA region of the mitochondrial genome was amplified via polymerase chain reaction (PCR) using the MiFish-U-F (5′-GTC GGT AAA ACT CGT GCC AGC-3′) and MiFish-U-R (5′-CAT AGT GGG GTA TCT AAT CCC AGT TTG-3′) universal primer pairs (Miya et al., 2015; Collins et al., 2019). The PCR assay volume was 25 μL, including 5 μL of 5× reaction buffer, 5 μL of 5× GC buffer, 2 μL of dNTP (2.5 mM), 1 μL of forward and reverse primers (10 μM), 2 μL of DNA template, 8.75 μL of ddH2O, and 0.25 μL Q5 DNA Polymerase; ddH2O was used as a negative control. For all samples, the first-step PCR protocol consisted of an initial denaturation step at 98°C for 2 min, followed by 25–30 cycles of denaturation at 98°C for 15 s, annealing at 55°C for 30 s, and extension at 72°C for 30 s, followed by a final extension step at 72°C for 5 min, the thermocycling plate was then cooled indefinitely to 10°C. The PCR products were then analyzed in 2% agarose gel. None of the negative controls exhibited target bands, indicating that there was no foreign fish DNA contamination during sampling, filtration, DNA extraction, or PCR amplification. PCR products were purified using the AxyPrep™ Mag PCR Clean-Up Kit (Axygen, United States) and the concentrations of the purified products were quantified. A sequencing library was prepared using the Illumina TruSeq Nano DNA LT Library Prep Kit, then sequenced using an Illumina MiSeq sequencer (Illumina, United States) (Deiner et al., 2017).
High Throughput Sequencing Data Processing
Raw downstream data from high-throughput sequencing were initially screened according to sequence quality, and problematic samples were retested and patched. Bioinformatics were performed with QIIME2 2019.4 (Bolyen et al., 2019), raw sequence data were demultiplexed using the demux plugin following by primers cutting with cutadapt plugin (Martin, 2011). Sequences were then merged, quality filtered and dereplicated using functions of fastq_mergepairs, fastq_filter, and derep_fulllength in Vsearch plugin. All the unique sequences were then clustered at 98% followed by chimera removing. At last, the non_chimera sequences were re_clustered at 97% to generate OTU representative sequences and OTU table. Shannon (1948); Simpson (1949), and Pielou’s (1966) evenness were estimated using the diversity plugin. Taxonomy was assigned to OTUs using the classify-sklearn naïve Bayes taxonomy classifier in feature-classifier plugin (Bokulich et al., 2018) against the Nt (2019.8) Database1, and the annotated species were manually confirmed using survey information of the aquatic organisms of the Zhoushan Sea. All raw sequences were deposited in the NCBI Sequence Read Archive under accession number SRP345144.
Fish Diversity
To analyze and compare the fish diversity levels obtained with different sampling methods and seasons, diversity indices such as the Shannon-wiener index (Wilhm, 1968), the Pielou evenness index (Eberhardt and Pielou, 1971), and the Simpson simplicity index (Simpson, 1949) were calculated. Species were first subjected to detrended correspondence analysis and redundancy analysis was conducted based on the gradient length of each axis (Bárta et al., 2018; Somenahally et al., 2018). Redundancy analysis of fish caught in bottom trawls and environmental factors was carried out using the CANOCO software to analyze the impact of environmental factors on fish community structure, and the similarity of the communities between seasons was examined via ANOSIM analysis.
Results
Analysis of Fish Diversity via eDNA Metabarcoding and Bottom Trawling
Relationships were established between eDNA concentrations and fish density. Overall, the high-throughput sequencing of 12S rDNA genes yielded 966,016 high-quality sequences. The mean number of sequences per sample was 65,429 ± 15,353 (mean ± SD- standard deviation) based on 916,006 reads that passed quality filtering. Considering that 8.7 and 33.8% of the sequences could not be identified to the genus and species levels by eDNA metabarcoding, respectively, all analyses in this study were conducted at the genus level to compare the differences between the methods.
A total of 32 orders, 54 families, and 94 species of fish were identified by eDNA Metabarcoding (Table 1). The top four orders identified via eDNA analyses were Perciformes (19.1%), Clupeiformes (11.7%), Scombriformes (8.5%), and Gobiiformes (8.5%) (Figure 2A). A total of 63 species were identified from the 11,368 fish caught via bottom trawling, which belonged to 13 orders and 31 families. Perciformes (50.8%), Clupeiformes (11.1%), Pleuronectiformes (7.9%), and Anguilliformes (7.9%) were the four dominant orders identified (Figure 2B). Larimichthys was the most strongly represented genus in the Perciformes, with Larimichthys polyactis occurring at particularly high frequencies. When the eDNA metabarcoding and bottom trawling datasets were combined, a total of 33 orders, 65 families, and 130 species of fish were identified (Table 1), among which the top four orders were Perciformes (31.5%), Clupeiformes (10.0%), Pleuronectiformes (7.7%), and Scombriformes (4.6%) (Figure 2C).
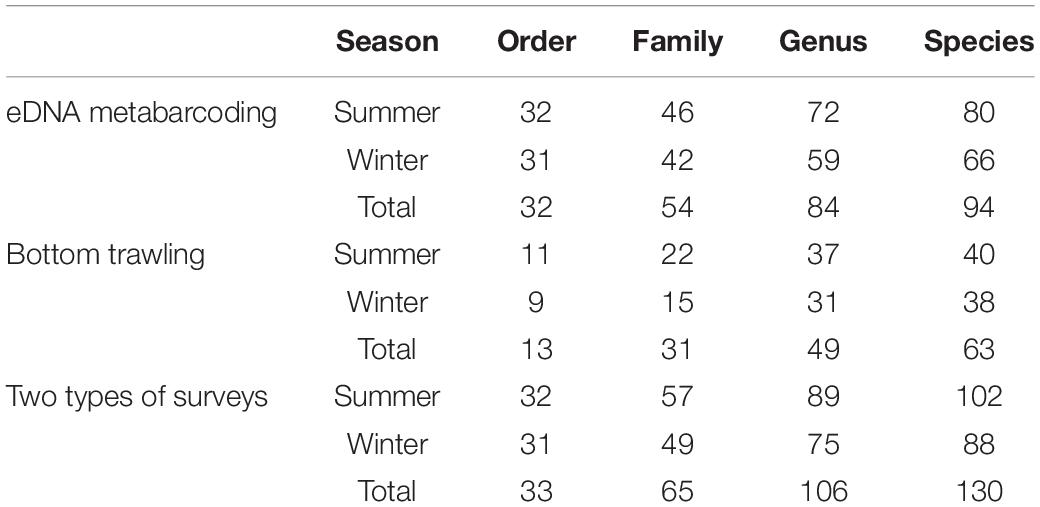
Table 1. Number of fish taxa detected in the Zhoushan Sea (China) area based on eDNA metabarcoding and bottom trawling.
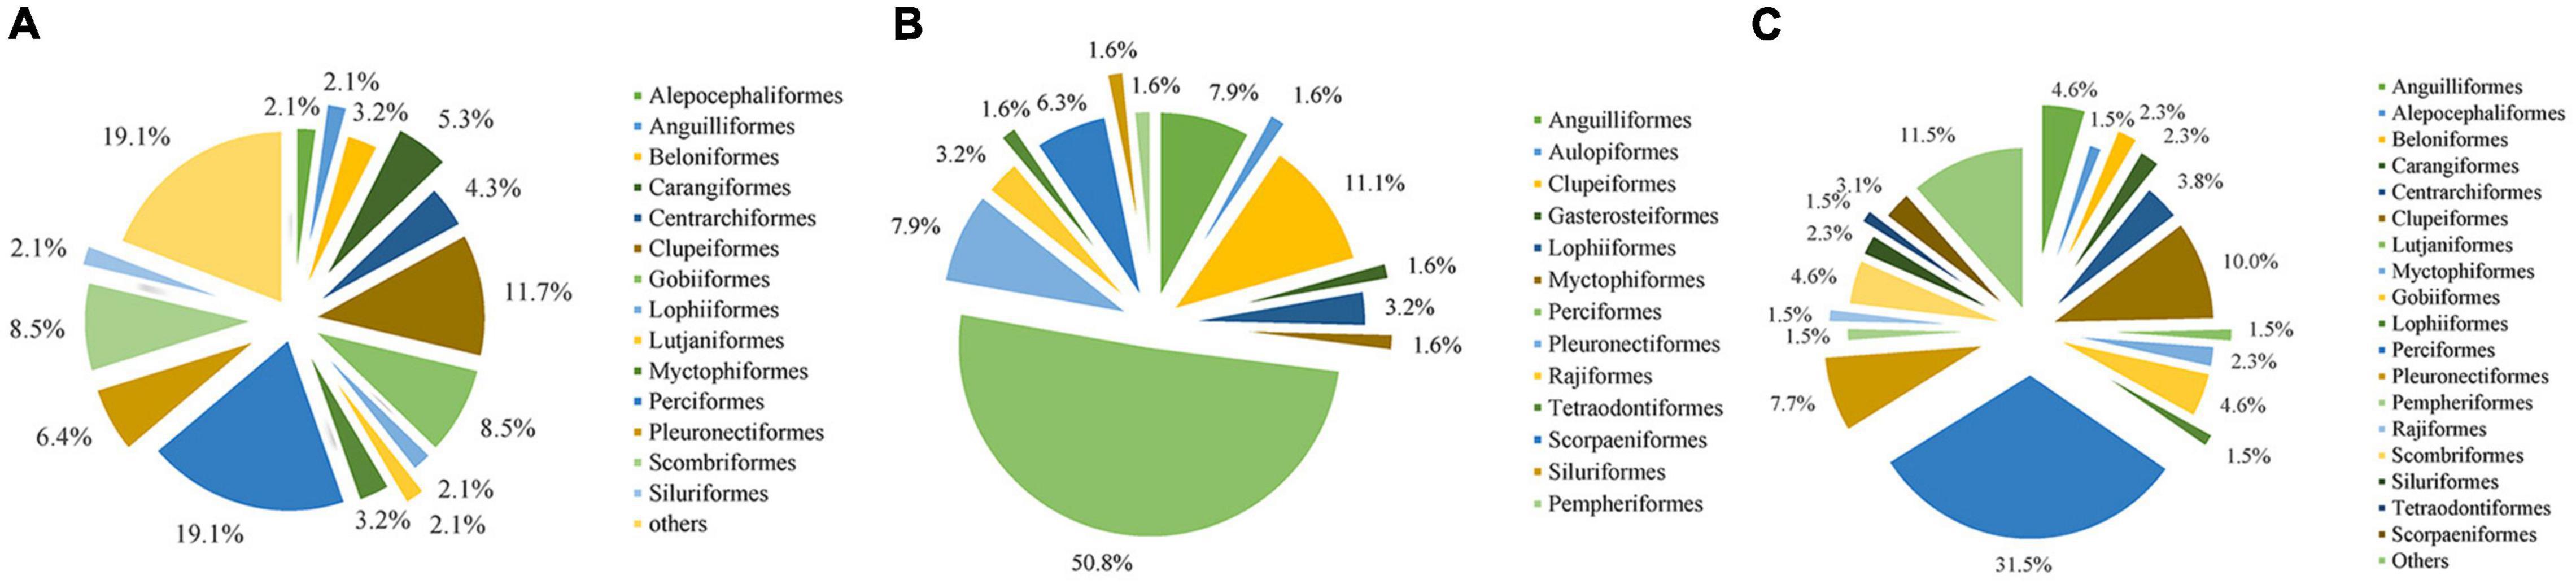
Figure 2. Orders of occurrence frequencies according to (A) eDNA metabarcoding, (B) bottom trawling, and (C) both methods in the Zhoushan Sea (China).
Different species compositions were identified at different sampling sites. More fish genera were identified in the waters of the Zhongjieshan Islands (Sites 4, 5, 6, 7) than in the waters of the Ma’an Islands (Sites 1, 2, 3) (Figure 3). eDNA metabarcoding identified 14 common species at separate sites including Bahaba taipingensis, Chanos chanos, Collichthys lucidus, Harpadon nehereus, Larimichthys crocea, L. polyactis, Leptoderma retropinna, Lophius litulon, Miichthys miiuy, Platycephalus cultellatus, Poecilopsetta plinthus, Setipinna taty, Thryssa hamiltonii, and Thunnus obesus. However, only six common species were identified at different stations using the traditional method, including Chaemrichthys stigmatias, Coilia mystus, Collichthys lucidus, H. nehereus, S. taty, and Stephanolepis cirrhifer. Both methods identified the Harpadon nehereus and Setipinna taty species at separate sites.
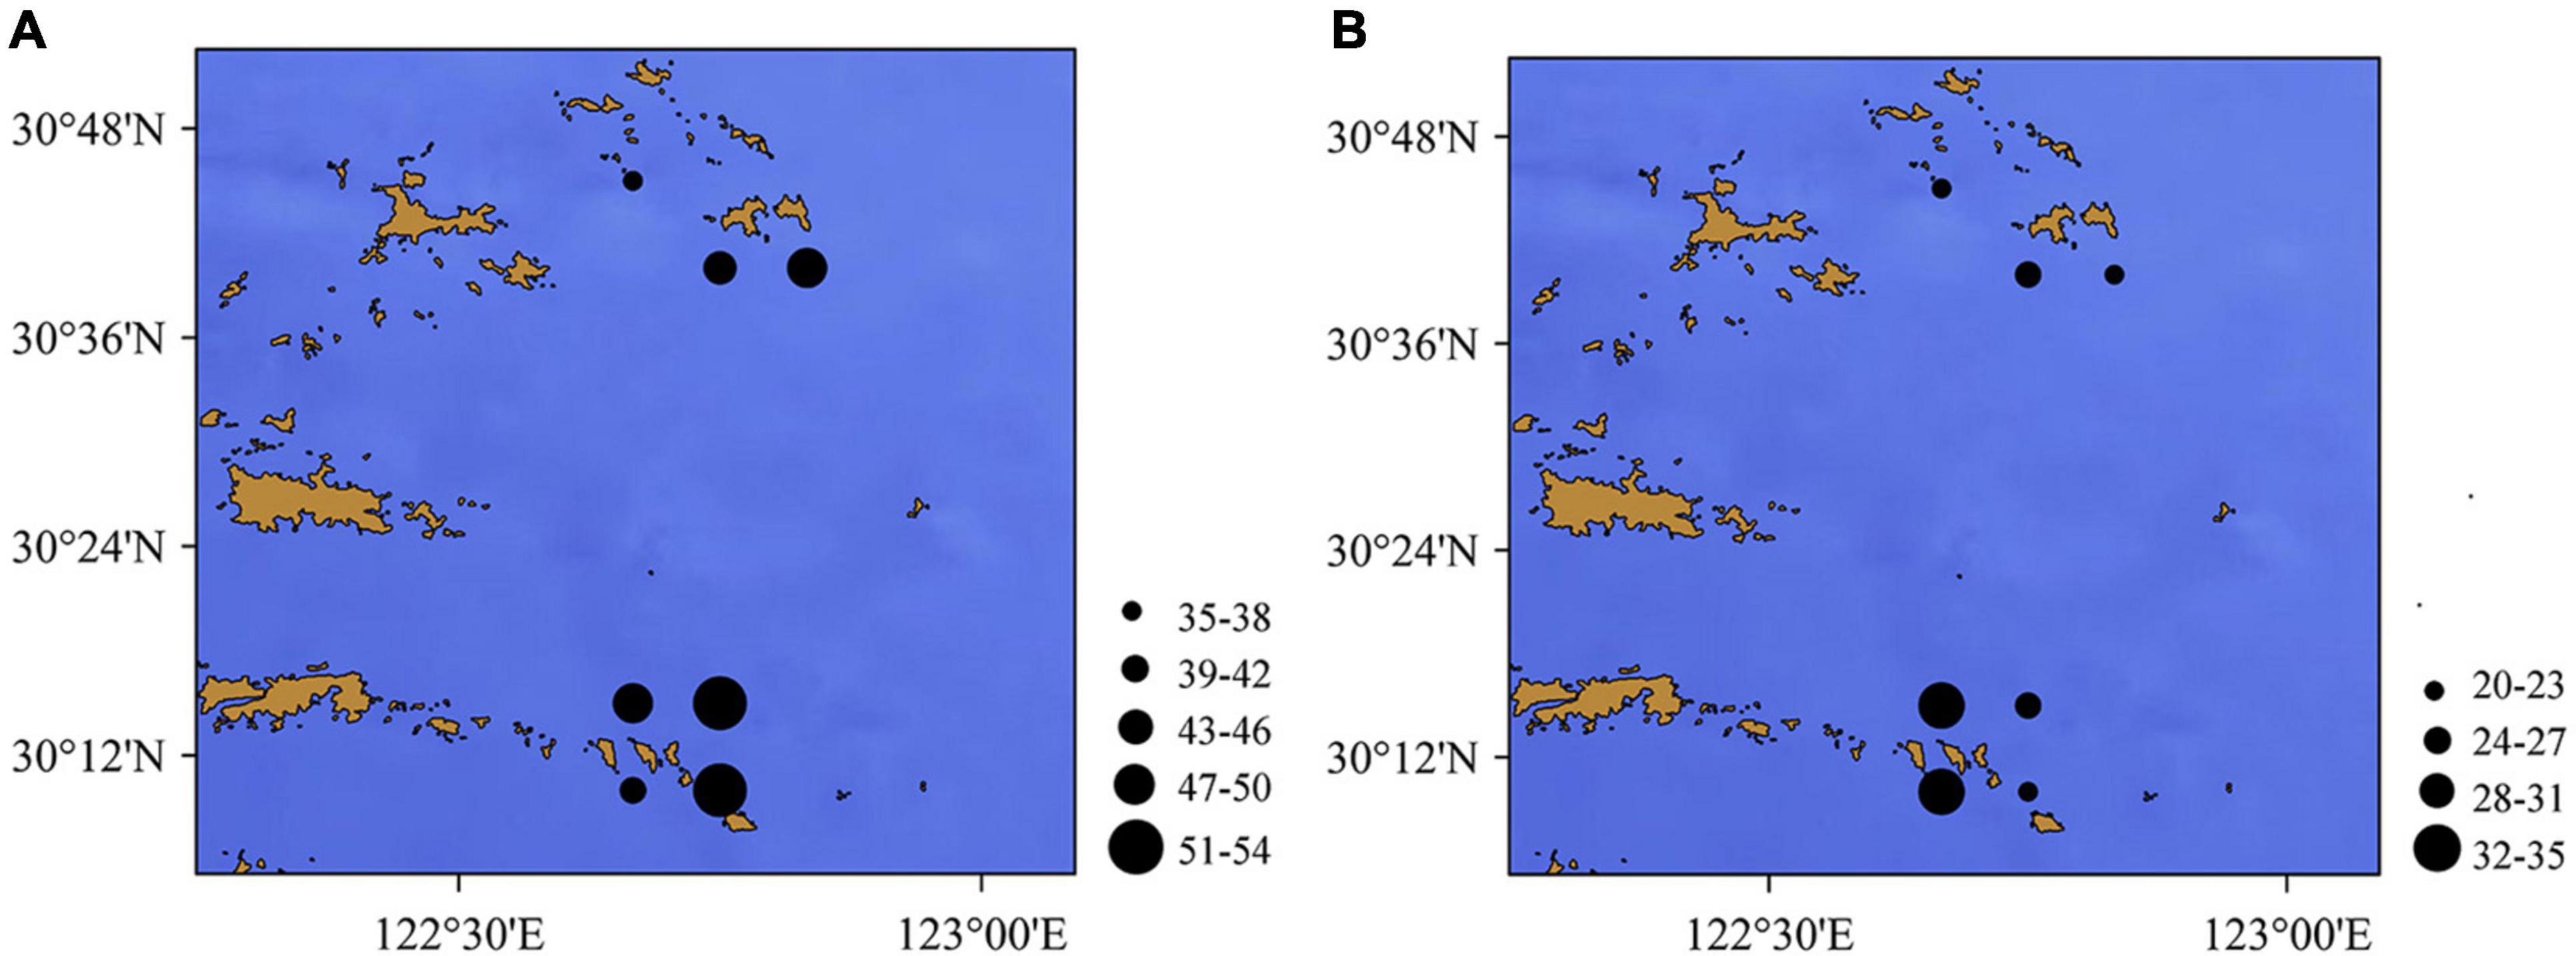
Figure 3. Number of the fish genera according to (A) eDNA metabarcoding and (B) bottom trawling (the dots indicate the number of fish species) in the Zhoushan Sea (China).
Comparison of eDNA Metabarcoding and Bottom Trawling
The number of fish species detected per sample using eDNA (38.6 ± 14.6) was significantly higher than that of bottom trawling (25.4 ± 5.2). Therefore, the eDNA metabarcoding approach captured a higher diversity of fish compared to the traditional method (bottom trawling). The eDNA metabarcoding method identified 80, 66, and 94 fish species in summer, winter, and both seasons, respectively, representing a 100.0, 73.7, and 49.2% increase in detected taxa compared to bottom trawling. Comparison of eDNA and bottom trawl results showed similar fish combinations, however some taxa being detected only by eDNA. Traditional survey methods can only detect species on a regional scale, whereas eDNA surveys integrate signals from fish taxa on a larger scale. A total of 27 (20.8%) species were identified by both bottom trawling and eDNA metabarcoding, whereas eDNA metabarcoding alone identified 67 (51.5%) species and bottom trawling alone identified 36 species (27.8%) (Figure 4). The overlapping fish identified by both eDNA metabarcoding and bottom trawling, including S. taty, Cynoglossus joyneri, Thryssa vitrirostris, Scomber japonicus, L. crocea, Thryssa kammalensis, M. miiuy, L. polyactis, H. nehereus, Amblychaeturichthys hexanema, Conger myriaster, Muraenesox cinereus, C. lucidus, Benthosema pterotum, Pampus argenteus, Trachurus japonicus, Nibea albiflora, Sebastiscus marmoratus, C. mystus, Lateolabrax maculatus, Odontamblyopus lacepedii, Decapterus maruadsi, Johnius belangerii, Engraulis japonicus, L. litulon, Chelidonichthys spinosus, and Antennarius striatus (Figure 5).
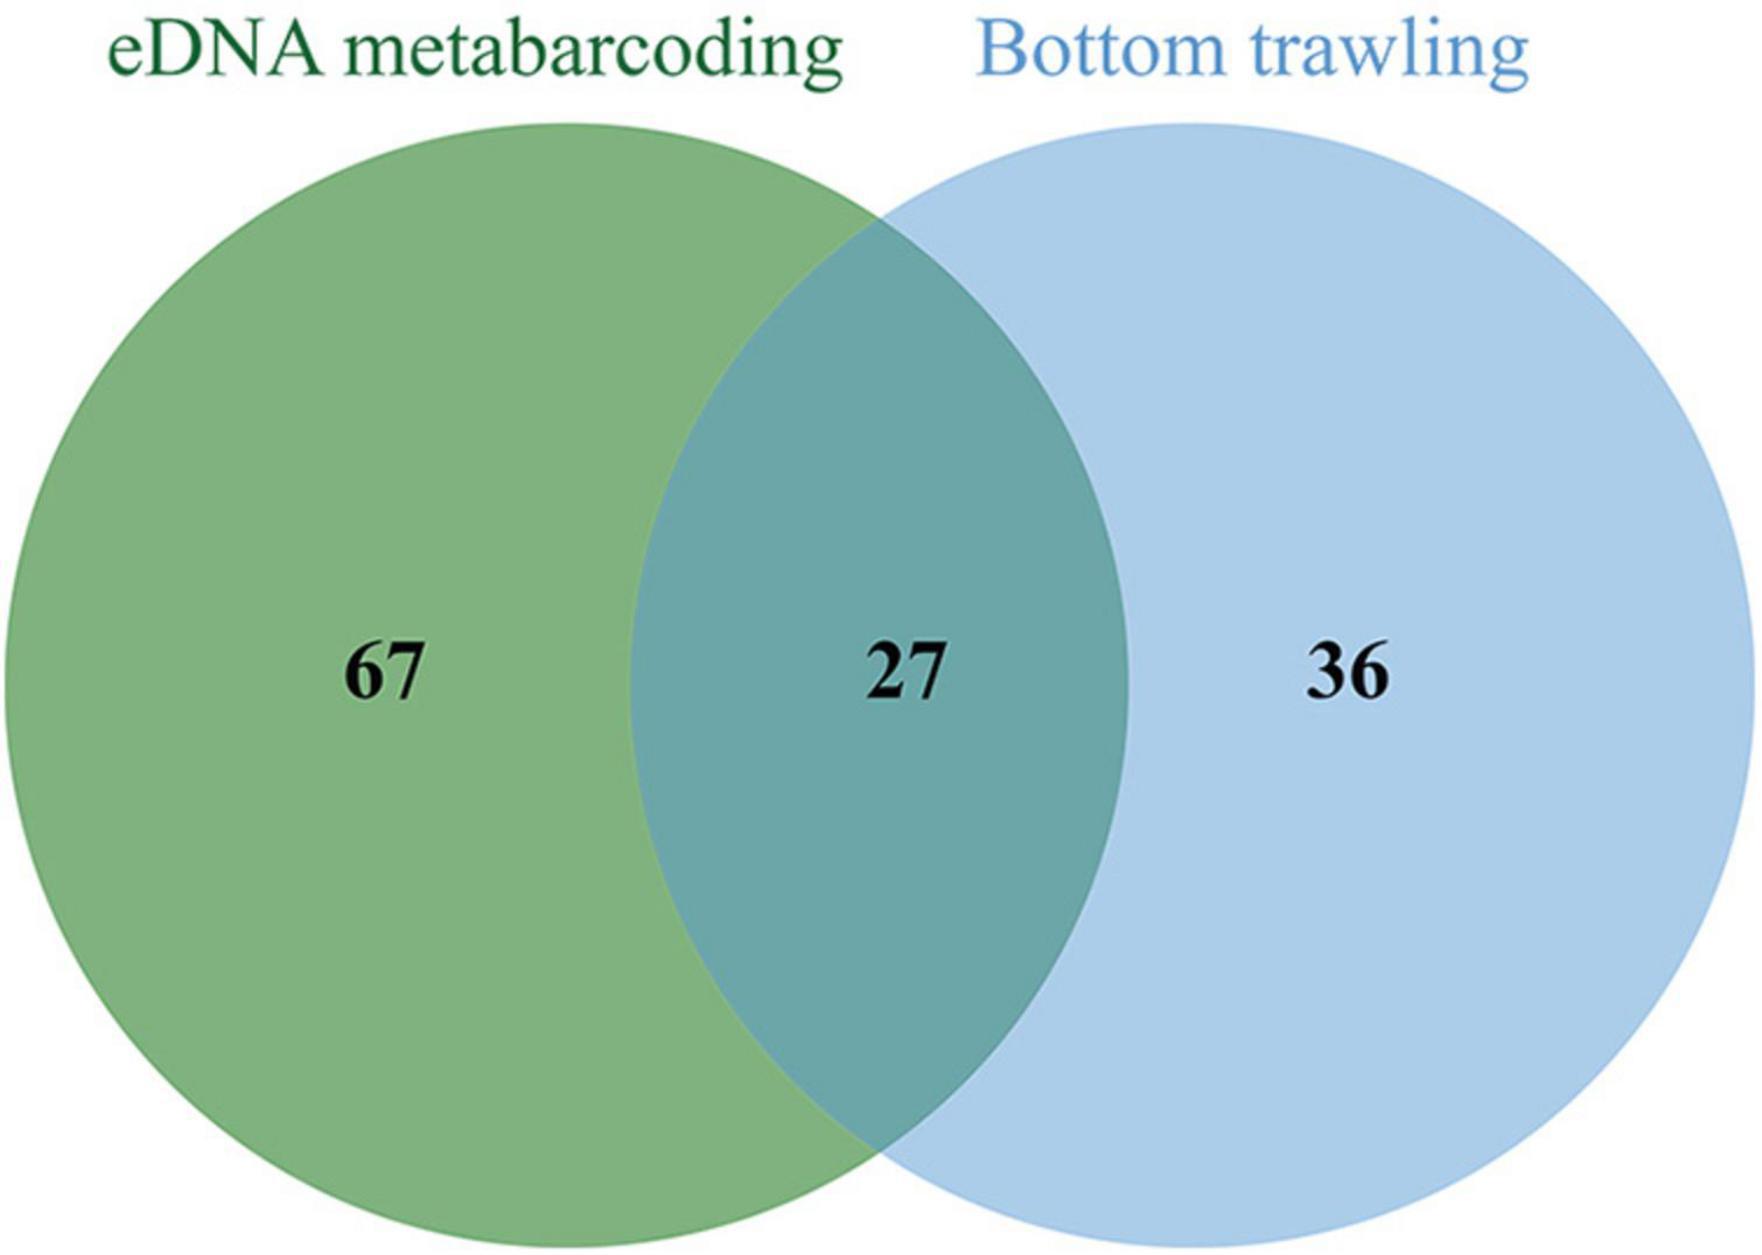
Figure 4. Number of fish species identified by eDNA metabarcoding and bottom trawling in both summer and winter in the Zhoushan Sea (China).
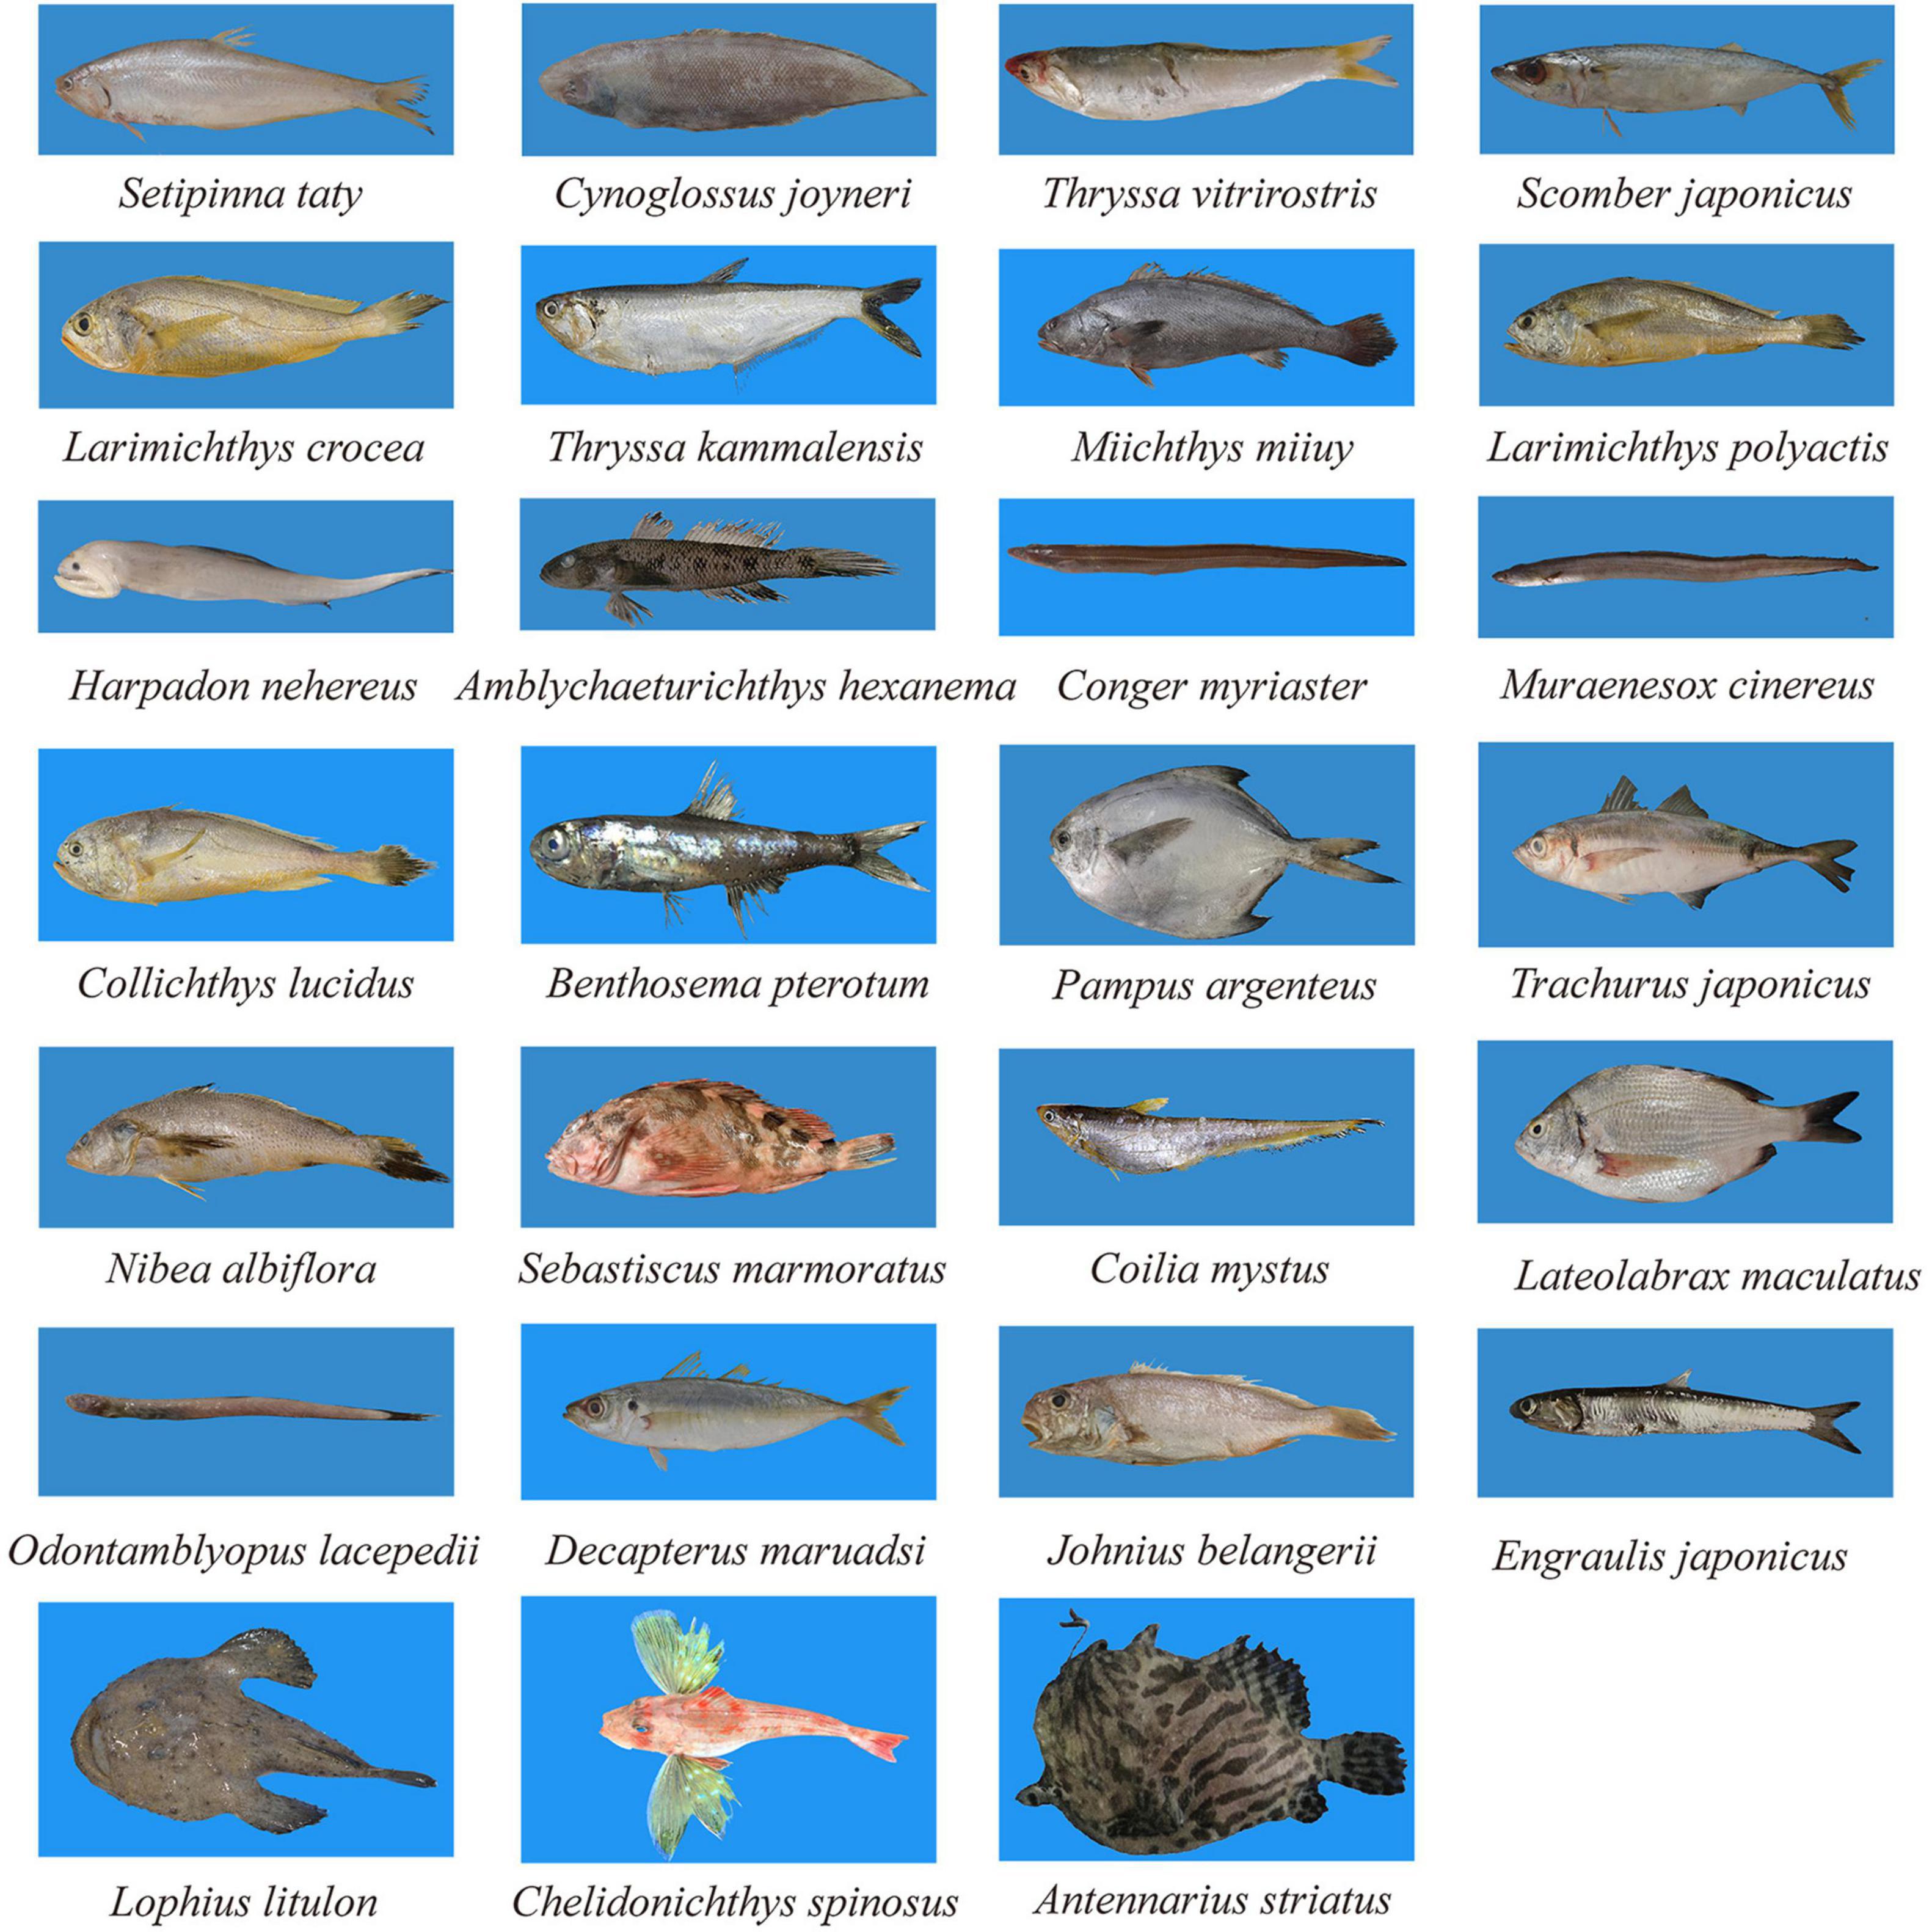
Figure 5. The 27 fish species identified by both eDNA metabarcoding and bottom trawling in the Zhoushan Sea (China).
Correlation Between Environmental Factors and Seasonal Variations in Fish Community Structure
The results of ANOSIM analysis indicated that the fish community structure in Zhoushan Sea differed significantly between summer and winter (R = 0.3, P = 0.012). This was consistent with an early study that reported that only 29.2% of the fish were identified in both seasons. Further, according to the combined eDNA metabarcoding and bottom trawl results, more fish species were identified in summer (102 species) than in winter (88 species). In summer, a total of 9,912 fish were caught by bottom trawling, with the most abundant species being L. polyactis (60.3%), followed distantly by H. nehereus (7.9%) and Argyrosomus argentatus (5.7%) (Figure 6A). However, the species with the highest number of fish according to eDNA metabarcoding was Poecilopsetta plinthus (57.4%), followed by Miichthys miiuy (12.1%), and Chanos chanos (6.9%), with Poecilopsetta plinthus accounting for more than half of the fish diversity. In winter, 1,856 fish were caught in bottom trawls (only 18.7% of the summer season catch), among which the most abundant species were Harpadon nehereus (31.9%), Setipinna taty (15.1%), and Coilia mystus (15.0%). In contrast, the most abundant species according to eDNA metabarcoding were Larimichthys polyactis (28.9%), Miichthys miiuy (28.4%), and Poecilopsetta plinthus (18.7%) (Figure 6B). The spatial distribution of environmental factors was analyzed using redundancy analysis to reveal the spatial heterogeneity of functional groups. In summer, the first axis eigenvalue was 0.79 and the second axis eigenvalue was 0.11. Monte Carlo permutation tests indicated that the two ordination axes were not significantly different (F = 6.7, P = 0.09), and RDA1 and RDA2 explained 91.5% of the total cumulative species-environment variance (Figure 7A). The Harpadon nehereus is strongly influenced by depth, suggesting that depth is an important factor in its distribution. In winter, the first axis eigenvalue was 0.61 and the second axis eigenvalue was 0.26. The Monte Carlo permutation test showed that the two ordination axes were not significantly different (F = 4.6, P = 0.10), and RDA1 and RDA2 explained 87.0% of the total cumulative species-environment variation (Figure 7B). Temperature (F = 2.2, P = 0.13) explained 30.7% of the community variation and can thus be considered the main factor driving the community variation. There were differences in the fish species diversity indices measured for each sample. Species diversity indices can be used as indicators of the effects of environmental variations on fish community structure. The Shannon index and Simpson index were not significantly different in the same survey in summer and winter (Figures 8A,C), but according to the two survey modes, Pielou index is significantly different in the same season (Figure 8B).
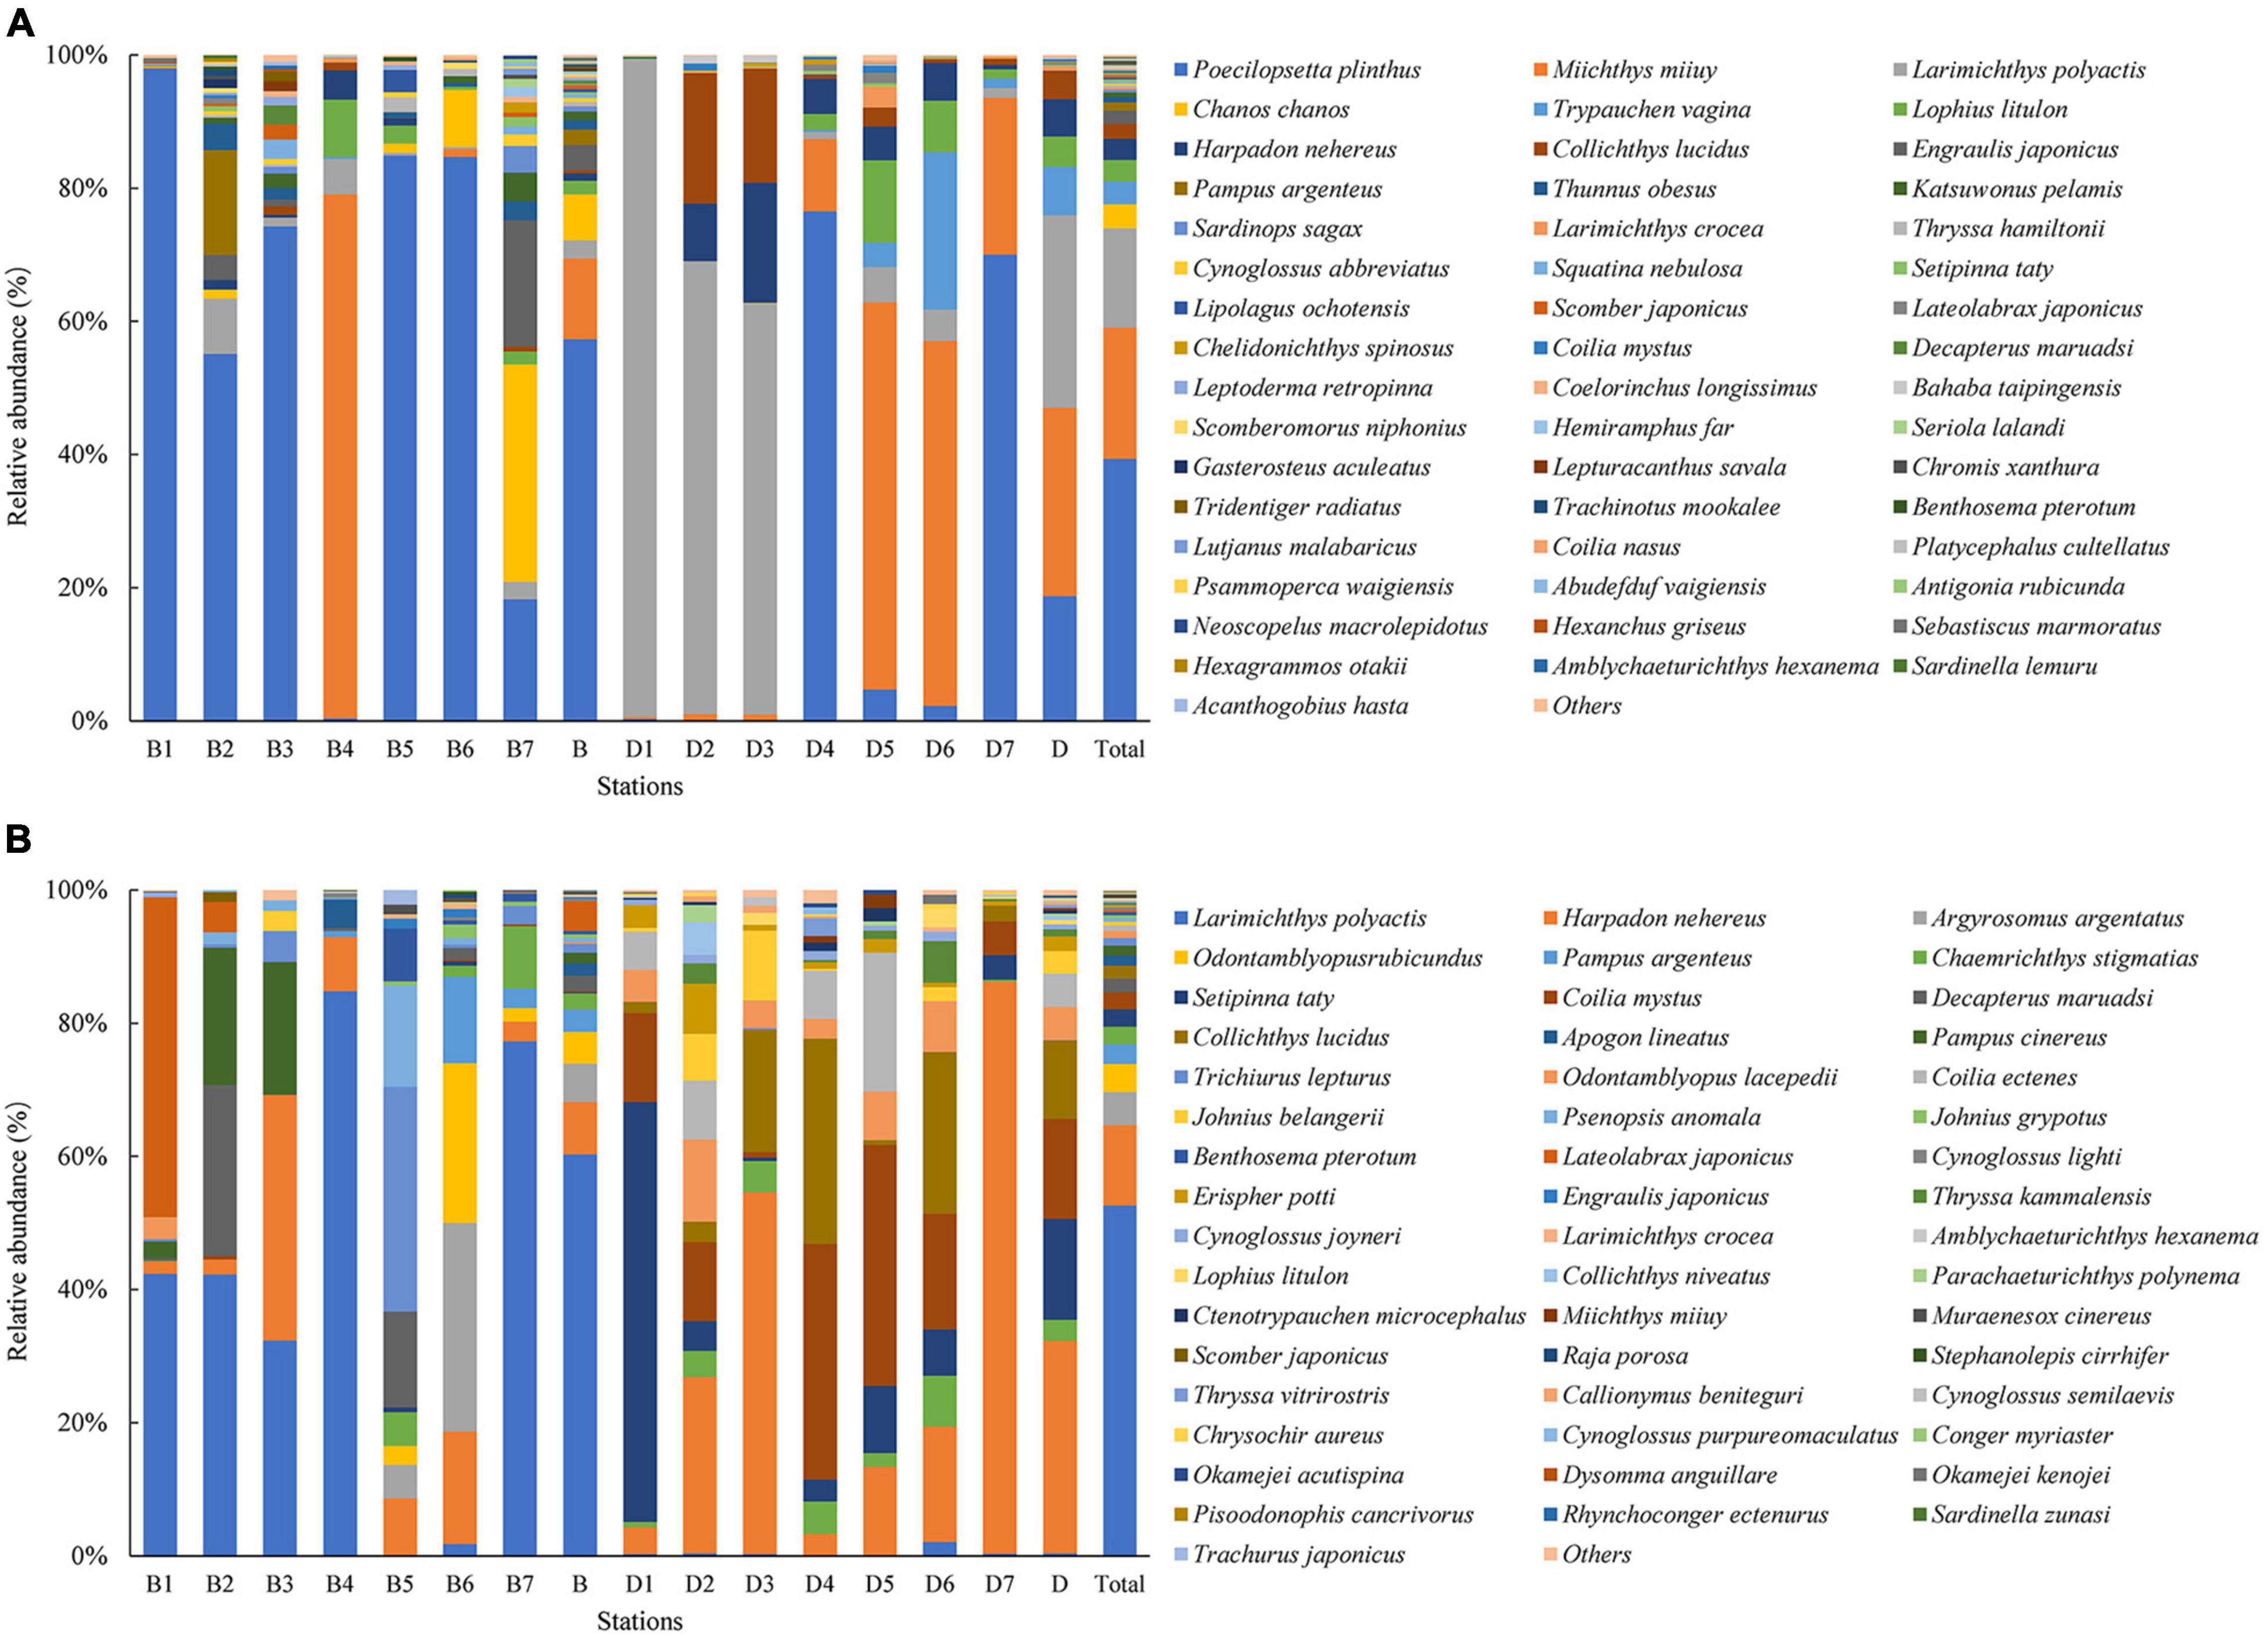
Figure 6. Top 50 relative abundance (%) of fish species in different seasons detected in every sampling site according to (A) eDNA metabarcoding and (B) bottom trawling in the Zhoushan Sea (China). B1–7 are different stations in summer, B stands for the total of all sites in summer. D1–7 are different stations in winter, D stands for the total of all sites in winter.
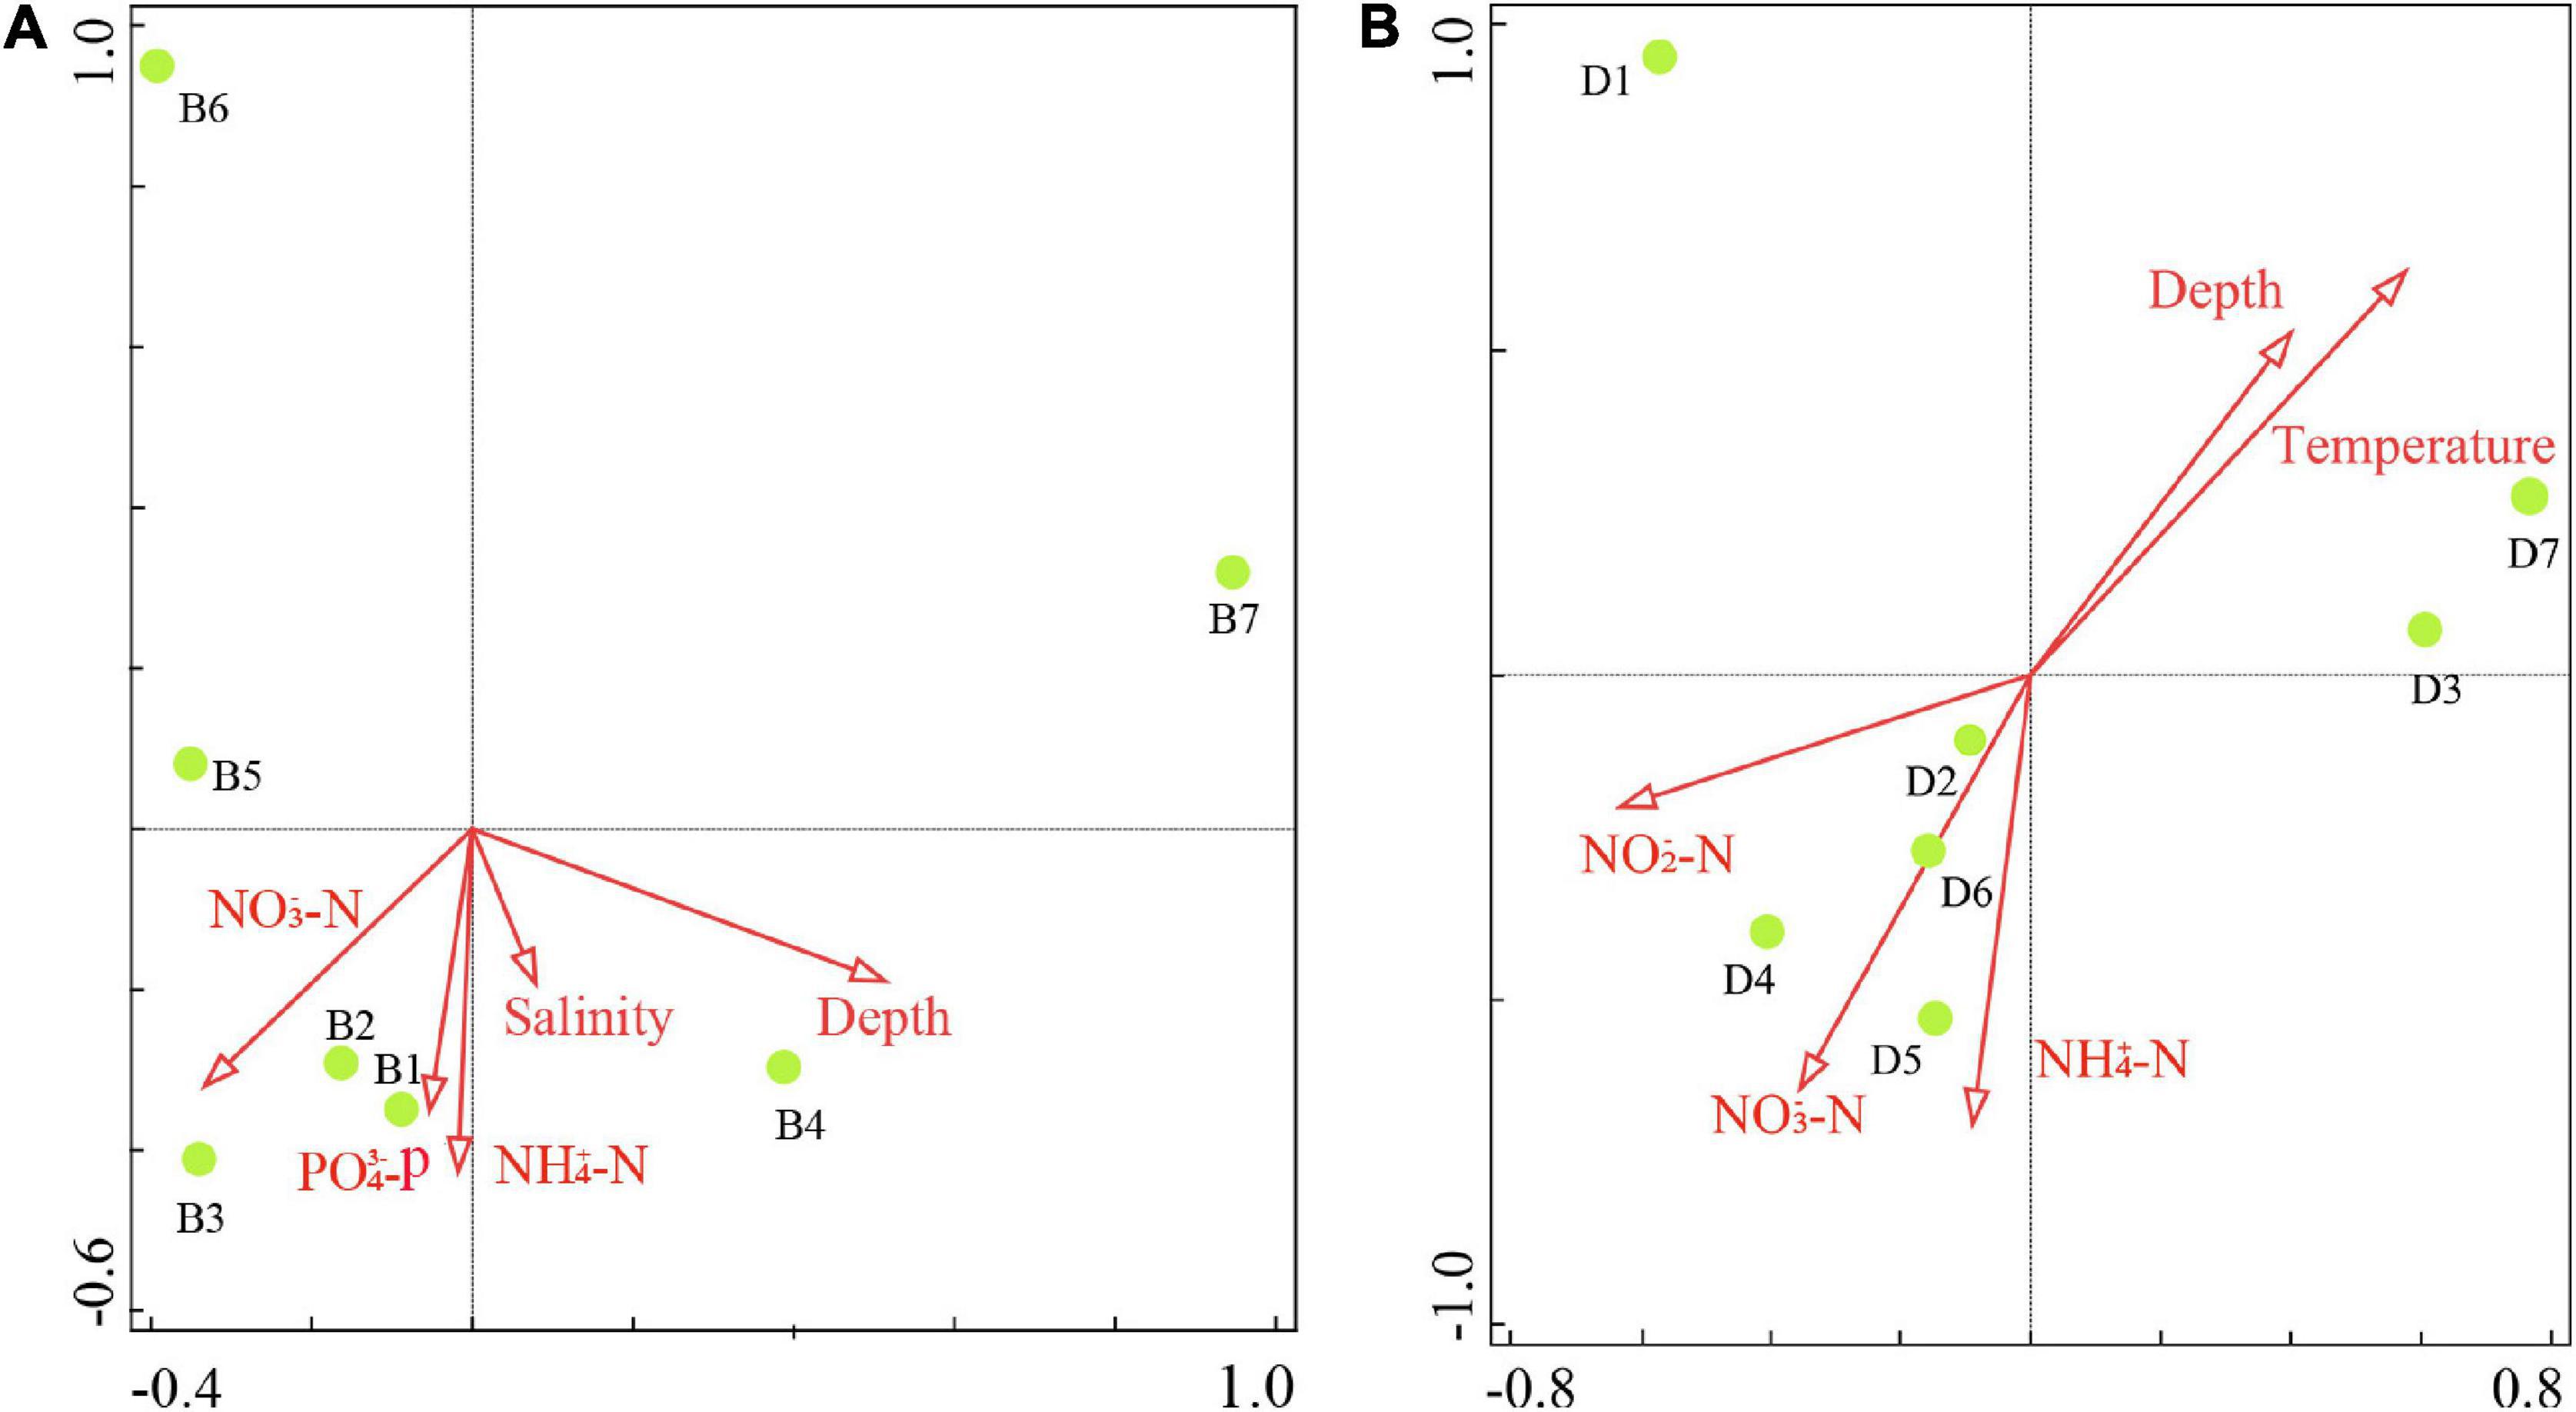
Figure 7. Redundancy analysis of the major environmental factors affecting fish species (obtained through bottom trawling) in (A) summer and (B) winter in the Zhoushan Sea (China).
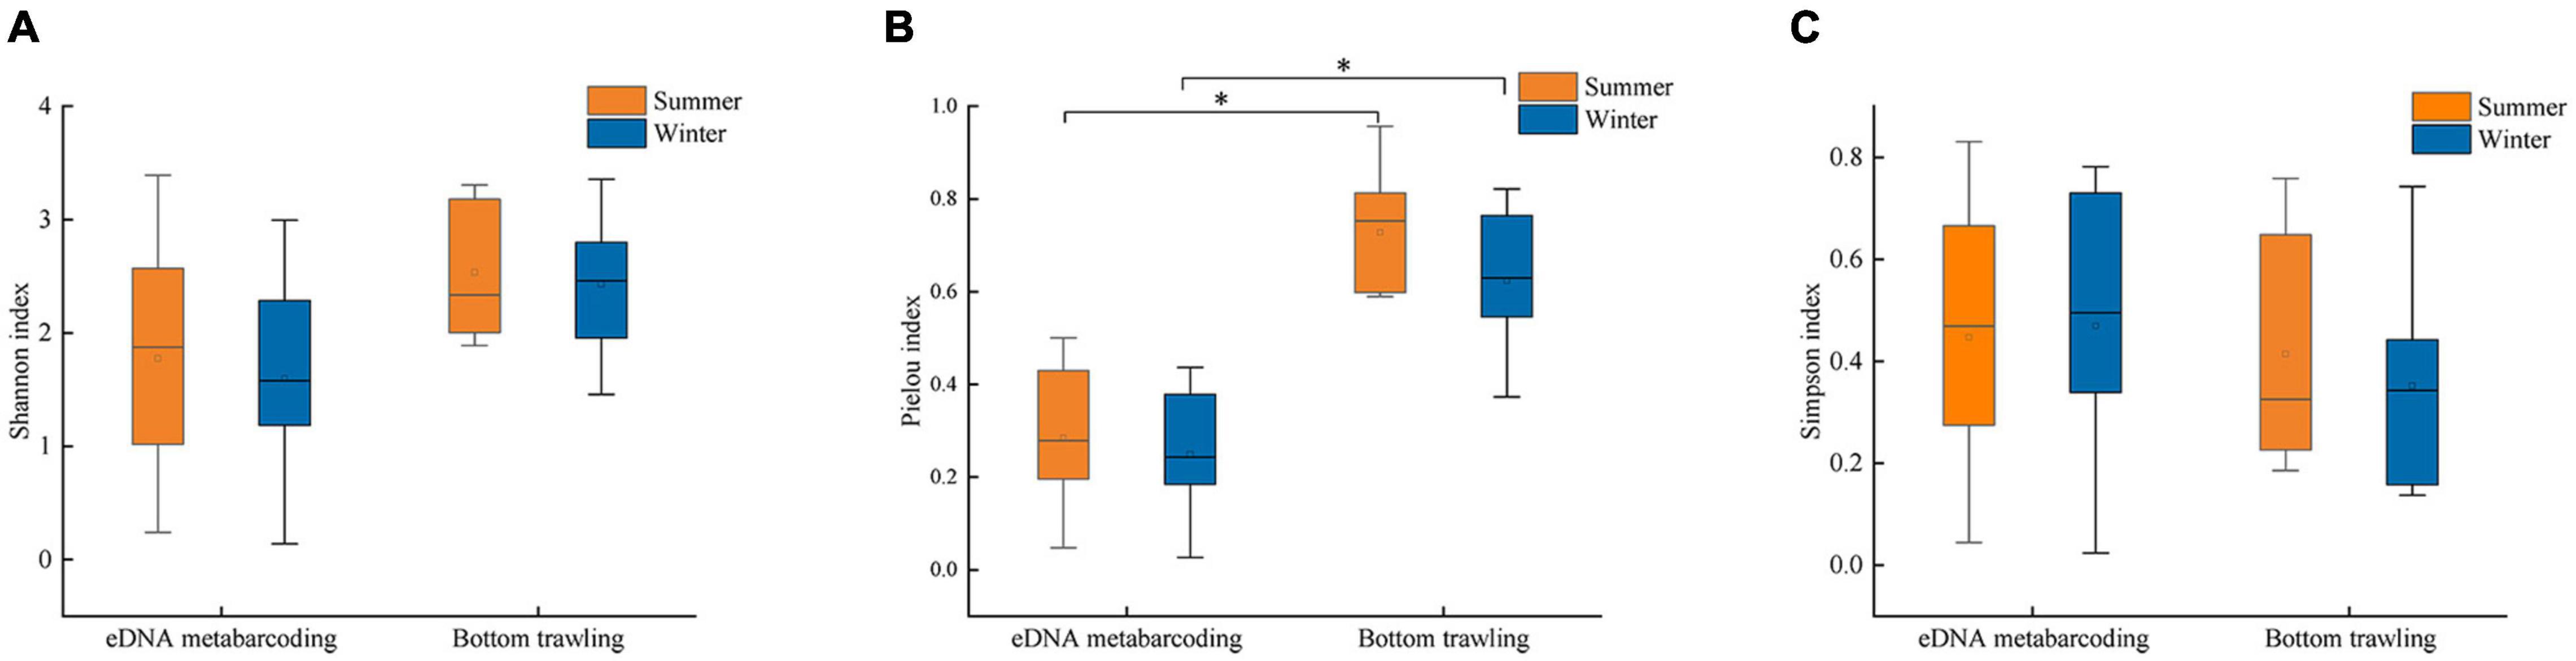
Figure 8. Summer and winter fish biodiversity indices: (A) Shannon index, (B) Pielou index, (C) Simpson index (* indicates p < 0.05) in the Zhoushan Sea (China).
Discussion
In recent years, artificial conservation measures such as stocking and seasonal closures have promoted the ecological restoration of impacted regions. However, the decline in the biomass and diversity of fishery resources continues to be a serious problem. Therefore, additional research on fish community structure and diversity is required to guide future ecological restoration efforts. Nevertheless, very few studies have thus far evaluated the fish diversity in the Zhoushan Sea area (Wang X. et al., 2020; Wang et al., 2021).
Fish Diversity in the Zhoushan Sea
In all ecosystem, particularly aquatic ecosystems, species composition can greatly influence the interpretation of species diversity (Nielson et al., 2011), and variations in species composition estimations can be caused by the erratic occurrence of rare species, sampling design, or sample collection difficulties/limitations (Gu and Swihart, 2004; Hughes et al., 2021). The combination of the two methods identified a total of 33 orders and 130 species of fish. These fish are known to be present in the Zhoushan Sea. The monitored fish orders were largely dominated by Perciformes, followed by Clupeiformes and Scombriformes. The main species found in this study were similar to those identified earlier in adjacent waters, which further confirmed the reliability of our data (Yu and Xian, 2009; Zheng and Kim, 2014; Zhang et al., 2019; Jia et al., 2020). Among these, 27 species common in the Zhoushan Sea were identified by both methods. The eDNA approach rendered results that were generally consistent with those of the bottom trawl surveys. The species L. polyactis accounted for a large proportion of the fish communities according to the bottom trawl surveys, which may be attributed to recent stocking efforts. Specifically, the release of L. polyactis fry, which are important stocking targets in the Zhoushan Sea, takes place in late spring and early summer. After releasing the fry, the population size of the target species in the waters increases significantly within a short time frame, resulting in a significant overall increase in the number of fish in the harbor. The surveyed fish were characteristically young and small, with most catches being young of the year. In the summer bottom trawl survey, the proportion of L. polyactis was high at all stations, and a total of 5,976 L. polyactis specimens were caught during the survey. However, this large catch only accounted for a 16.52 kg total weight and the average individual weight was only 2.76 g. In winter, the eDNA approach still indicated that there was a high proportion of L. crocea, whereas the trawl approach indicated the opposite due to the presence of a L. crocea farming base near the sampling site.
Seasonal Differences in Fish Community Structure
The number of fish species collected in the survey was slightly lower in winter (88 species) than in summer (102 species). Therefore, the winter diversity index was lower and the community structure of the watershed was unstable and highly volatile. The main factors affecting the growth, development, and distribution of fish are temperature, salinity, and water depth, among which water depth is the most important factor affecting the community structure (Colvocoresses and Musick, 1984). Consistent with these observations, our redundancy analysis results indicated that depth and temperature are the main environmental drivers influencing fish distribution. Continuous and intensive overfishing after the end of the fishing moratorium has severely impacted nearshore marine ecosystems and resources (Jaureguizar et al., 2016). In turn, these anthropogenic impacts have weakened the regeneration capacity of major fishery resources and therefore several fish species are currently being captured much quicker than they can reproduce (He and Silliman, 2019). Overfishing has caused the decline of some economically valuable and large species, some of which have collapsed entirely (Jackson et al., 2001). This has resulted in a very uneven distribution of biomass among the various species in the winter catches and low biodiversity and evenness indices.
eDNA Metabarcoding as a Transformative Tool for Assessing Fish Diversity
eDNA metabarcoding has significant advantages over traditional fish monitoring methods for fish diversity assessment and ecological conservation. Trawling is not only time-consuming and labor-intensive, but also influenced by many factors that lead to uncertainty. For example, some fishes are highly mobile and therefore their detection can be highly irregular, and some small fishes and reef-dwelling fishes have special distribution areas and are difficult to catch. At the same time, the morphological identification of species requires a high level of expertise and experience. Additionally, some of the survey methods may cause habitat damage (Hopkins and Freckleton, 2002; Robertson and Smith-Vaniz, 2008). eDNA metabarcoding is generally more suitable for the evaluation of fish diversity than traditional monitoring methods, especially for rare or cryptic species that are difficult to capture by traditional methods, and are more easily detected using eDNA technology (Lacoursière-Roussel et al., 2016a,b; Valentini et al., 2016; Balasingham et al., 2018). However, eDNA metabarcoding can only determine the presence of species from genetic information in environmental samples, and does not provide insights into the population size, age structure, physiological state, or growth stage of the target species (Bohmann et al., 2014). Moreover, eDNA metabarcoding relies on genetic information from environmental samples to determine the presence of a given species. The concentration and distribution of eDNA released in the water column are influenced by various factors such as hydrodynamic conditions, water temperature, light conditions, seasonal changes, and biological activity, all of which are closely linked to the intensity of anthropogenic disturbances (Thomsen et al., 2012). eDNA also tends to degrade over time, which further affects the reliability of this approach (Pilliod et al., 2014). Furthermore, eDNA metabarcoding relies on the integrity of molecular databases, and this can lead to false-negative detection when the database lacks the sequence of the target species (Ammon et al., 2018; Rey et al., 2019; Duarte et al., 2021). Despite the many advantages of eDNA metabarcoding, this technique cannot fully replace traditional fish survey methods. However, it can be used as an important complementary tool, thus reducing ecosystem disturbances, shortening the survey period, and improving detection efficiency. Therefore, eDNA technology and traditional monitoring methods can complement each other, thus providing a robust technical basis for large-scale and efficient biomonitoring.
Conclusion
This study used a combination of eDNA metabarcoding techniques and traditional methods to assess fish diversity in the Zhoushan Sea, and a total of 33 orders and 130 species of fish were identified. More species and higher biodiversity indices were observed in summer than in winter. Importantly, our results demonstrated the applicability of the eDNA metabarcoding approach for the analysis of marine fish diversity. The intensification of human exploitation of offshore fisheries poses an ongoing and serious threat to marine ecosystem stability. Therefore eDNA technology can complement traditional fish survey methods to provide more comprehensive insights into the effects of human activities and other factors on fish community structure and diversity.
Data Availability Statement
The datasets presented in this study can be found in online repositories. The names of the repository/repositories and accession number(s) can be found below: NCBI [accession: SRP345144].
Author Contributions
LC and NL conceived of the presented idea. SZ developed the theory and performed the computations. SZ, CF, HX, WY, DJ, LW, and JZ verified the analytical methods. LC encouraged NL to investigate fish biodiversity in the Zhoushan sea and supervised the findings of this work. All authors discussed the results and contributed to the final manuscript.
Funding
This study was supported by the Special Project of Marine Science and Technology Innovation in Jiangsu Province (HY2018-10).
Conflict of Interest
The authors declare that the research was conducted in the absence of any commercial or financial relationships that could be construed as a potential conflict of interest.
Publisher’s Note
All claims expressed in this article are solely those of the authors and do not necessarily represent those of their affiliated organizations, or those of the publisher, the editors and the reviewers. Any product that may be evaluated in this article, or claim that may be made by its manufacturer, is not guaranteed or endorsed by the publisher.
Supplementary Material
The Supplementary Material for this article can be found online at: https://www.frontiersin.org/articles/10.3389/fmars.2021.809703/full#supplementary-material
Footnotes
References
Ammon, U., von Wood, S. A., Laroche, O., Zaiko, A., Tait, L., Lavery, S., et al. (2018). Combining morpho-taxonomy and metabarcoding enhances the detection of non-indigenous marine pests in biofouling communities. Sci. Rep. 8:16290. doi: 10.1038/s41598-018-34541-1
Balasingham, K. D., Walter, R. P., Mandrak, N. E., and Heath, D. D. (2018). Environmental DNA detection of rare and invasive fish species in two Great Lakes tributaries. Mol. Ecol. 27, 112–127. doi: 10.1111/mec.14395
Bárta, J., Tahovská, K., Šantrůčková, H., and Oulehle, F. (2018). Author correction: microbial communities with distinct denitrification potential in spruce and beech soils differing in nitrate leaching. Sci. Rep. 8:4754. doi: 10.1038/s41598-018-22998-z
Bohmann, K., Evans, A., Gilbert, M. T. P., Carvalho, G. R., Creer, S., Knapp, M., et al. (2014). Environmental DNA for wildlife biology and biodiversity monitoring. Trends Ecol. Evol. 29, 358–367. doi: 10.1016/j.tree.2014.04.003
Bokulich, N. A., Kaehler, B. D., Rideout, J. R., Dillon, M., Bolyen, E., Knight, R., et al. (2018). Optimizing taxonomic classification of marker-gene amplicon sequences with QIIME 2’s q2-feature-classifier plugin. Microbiome 6:90. doi: 10.1186/s40168-018-0470-z
Bolyen, E., Rideout, J. R., Dillon, M. R., Bokulich, N. A., Abnet, C. C., Al-Ghalith, G. A., et al. (2019). Reproducible, interactive, scalable and extensible microbiome data science using QIIME 2. Nat. Biotechnol. 37, 852–857.
Chen, B., Fan, D., Li, W., Wang, L., Zhang, X., Liu, M., et al. (2014). Enrichment of heavy metals in the inner shelf mud of the East China Sea and its indication to human activity. Cont. Shelf Res. 90, 163–169. doi: 10.1016/j.csr.2014.04.016
Collins, R. A., Bakker, J., Wangensteen, O. S., Soto, A. Z., Corrigan, L., Sims, D. W., et al. (2019). Non-specific amplification compromises environmental DNA metabarcoding with COI. Methods Ecol. Evol. 10, 1985–2001. doi: 10.1111/2041-210x.13276
Collins, R. A., Wangensteen, O. S., O’Gorman, E. J., Mariani, S., Sims, D. W., and Genner, M. J. (2018). Persistence of environmental DNA in marine systems. Commun. Biol. 1:185. doi: 10.1038/s42003-018-0192-6
Colvocoresses, J. A., and Musick, J. (1984). Species associations and community composition of Middle Atlantic Bight continental shelf demersal fishes. Fish. Bull. 82, 295–313.
Deiner, K., Bik, H. M., Mächler, E., Seymour, M., Lacoursière-Roussel, A., Altermatt, F., et al. (2017). Environmental DNA metabarcoding: transforming how we survey animal and plant communities. Mol. Ecol. 26, 5872–5895. doi: 10.1111/mec.14350
Deiner, K., Walser, J.-C., Mächler, E., and Altermatt, F. (2015). Choice of capture and extraction methods affect detection of freshwater biodiversity from environmental DNA. Biol. Conserv. 183, 53–63.
Djurhuus, A., Closek, C. J., Kelly, R. P., Pitz, K. J., Michisaki, R. P., Starks, H. A., et al. (2020). Environmental DNA reveals seasonal shifts and potential interactions in a marine community. Nat. Commun. 11:254.
Duarte, S., Vieira, P. E., Lavrador, A. S., and Costa, F. O. (2021). Status and prospects of marine NIS detection and monitoring through (e)DNA metabarcoding. Sci. Total Environ. 751:141729. doi: 10.1016/j.scitotenv.2020.141729
Eberhardt, L. L., and Pielou, E. C. (1971). An introduction to mathematical ecology. J. Wildl. Manag. 35:405.
Fahner, N. A., Shokralla, S., Baird, D. J., and Hajibabaei, M. (2016). Large-scale monitoring of plants through environmental DNA metabarcoding of soil: recovery, resolution, and annotation of four DNA markers. PLoS One 11:e0157505. doi: 10.1371/journal.pone.0157505
Ficetola, G. F., Miaud, C., Pompanon, F., and Taberlet, P. (2008). Species detection using environmental DNA from water samples. Biol. Lett. 4, 423–425. doi: 10.1098/rsbl.2008.0118
Gu, W., and Swihart, R. K. (2004). Absent or undetected? Effects of non-detection of species occurrence on wildlife–habitat models. Biol. Conserv. 116, 195–203.
He, Q., and Silliman, B. R. (2019). Climate change, human impacts, and coastal ecosystems in the Anthropocene. Curr. Biol. 29, R1021–R1035. doi: 10.1016/j.cub.2019.08.042
Holman, L. E., de Bruyn, M., Creer, S., Carvalho, G., Robidart, J., and Rius, M. (2019). Detection of introduced and resident marine species using environmental DNA metabarcoding of sediment and water. Sci. Rep. 9:11559.
Hopkins, G. W., and Freckleton, R. P. (2002). Declines in the numbers of amateur and professional taxonomists: implications for conservation. Anim. Conserv. 5, 245–249. doi: 10.1017/s1367943002002299
Huang, H., Sun, Y., Yu, W., Ma, Z., and Tang, K. (2020). Analysis of the characteristics of Eco-Exergy-based indices and diversity indices in the Zhoushan archipelago, China. Environ. Sci. Pollut. Res. Int. 27, 37278–37285. doi: 10.1007/s11356-019-07544-2
Hughes, R. M., Herlihy, A. T., and Peck, D. V. (2021). Sampling efforts for estimating fish species richness in western USA river sites. Limnologica 87:125859. doi: 10.1016/j.limno.2021.125859
Jackson, J. B., Kirby, M. X., Berger, W. H., Bjorndal, K. A., Botsford, L. W., Bourque, B. J., et al. (2001). Historical overfishing and the recent collapse of coastal ecosystems. Science 293, 629–637. doi: 10.1126/science.1059199
Jaureguizar, A. J., Solari, A., Cortés, F., Milessi, A. C., Militelli, M. I., Camiolo, M. D., et al. (2016). Fish diversity in the Río de la Plata and adjacent waters: an overview of environmental influences on its spatial and temporal structure: environment influence on fish diversity of río de la plata. J. Fish Biol. 89, 569–600. doi: 10.1111/jfb.12975
Jia, H., Wang, Y., Yoshizawa, S., Iwasaki, W., Li, Y., Xian, W., et al. (2020). Seasonal variation and assessment of fish resources in the Yangtze Estuary based on environmental DNA. Water (Basel) 12:2874. doi: 10.3390/w12102874
Lacoursière-Roussel, A., Côté, G., Leclerc, V., and Bernatchez, L. (2016a). Quantifying relative fish abundance with eDNA: a promising tool for fisheries management. J. Appl. Ecol. 53, 1148–1157. doi: 10.1111/1365-2664.12598
Lacoursière-Roussel, A., Rosabal, M., and Bernatchez, L. (2016b). Estimating fish abundance and biomass from eDNA concentrations: variability among capture methods and environmental conditions. Mol. Ecol. Resour. 16, 1401–1414. doi: 10.1111/1755-0998.12522
Lin, S., Hsieh, I.-J., Huang, K.-M., and Wang, C.-H. (2002). Influence of the Yangtze River and grain size on the spatial variations of heavy metals and organic carbon in the East China Sea continental shelf sediments. Chem. Geol. 182, 377–394. doi: 10.1016/s0009-2541(01)00331-x
Lodge, D. M., Turner, C. R., Jerde, C. L., Barnes, M. A., Chadderton, L., Egan, S. P., et al. (2012). Conservation in a cup of water: estimating biodiversity and population abundance from environmental DNA. Mol. Ecol. 21, 2555–2558. doi: 10.1111/j.1365-294X.2012.05600.x
Martin, M. (2011). Cutadapt removes adapter sequences from high-throughput sequencing reads. EMBnet J. 17:10. doi: 10.1089/cmb.2017.0096
Miya, M., Sato, Y., Fukunaga, T., Sado, T., Poulsen, J. Y., Sato, K., et al. (2015). MiFish, a set of universal PCR primers for metabarcoding environmental DNA from fishes: detection of more than 230 subtropical marine species. R. Soc. Open Sci. 2:150088. doi: 10.1098/rsos.150088
Nielson, R. M., Gray, B. R., McDonald, L. L., and Heglund, P. J. (2011). Estimating site occupancy rates for aquatic plants using spatial sub-sampling designs when detection probabilities are less than one. Aquat. Bot. 95, 221–225. doi: 10.1016/j.aquabot.2011.06.004
Ogram, A., Sayler, G. S., and Barkay, T. (1987). The extraction and purification of microbial DNA from sediments. J. Microbiol. Methods 7, 57–66. doi: 10.1016/0167-7012(87)90025-x
Pielou, E. C. (1966). The measurement of diversity in different types of biological collections. J. Theor. Biol. 13, 131–144. doi: 10.1016/0022-5193(66)90013-0
Pilliod, D. S., Goldberg, C. S., Arkle, R. S., and Waits, L. P. (2014). Factors influencing detection of eDNA from a stream-dwelling amphibian. Mol. Ecol. Resour. 14, 109–116. doi: 10.1111/1755-0998.12159
Preston, C. M., Harris, A., Ryan, J. P., Roman, B., Marin, R. III, Jensen, S., et al. (2011). Underwater application of quantitative PCR on an ocean mooring. PLoS One 6:e22522. doi: 10.1371/journal.pone.0022522
Rees, H. C., Maddison, B. C., Middleditch, D. J., Patmore, J. R. M., and Gough, K. C. (2014). Review: the detection of aquatic animal species using environmental DNA - a review of eDNA as a survey tool in ecology. J. Appl. Ecol. 51, 1450–1459. doi: 10.1111/1365-2664.12306
Rey, A., Carney, K. J., Quinones, L. E., Pagenkopp Lohan, K. M., Ruiz, G. M., Basurko, O. C., et al. (2019). Environmental DNA metabarcoding: a promising tool for ballast water monitoring. Environ. Sci. Technol. 53, 11849–11859. doi: 10.1021/acs.est.9b01855
Robertson, D. R., and Smith-Vaniz, W. F. (2008). Rotenone: an essential but demonized tool for assessing marine fish diversity. Bioscience 58, 165–170.
Seymour, M., Durance, I., Cosby, B. J., Ransom-Jones, E., Deiner, K., Ormerod, S. J., et al. (2018). Acidity promotes degradation of multi-species environmental DNA in lotic mesocosms. Commun. Biol. 1:4. doi: 10.1038/s42003-017-0005-3
Sigsgaard, E. E., Nielsen, I. B., Carl, H., Krag, M. A., Knudsen, S. W., Xing, Y., et al. (2017). Seawater environmental DNA reflects seasonality of a coastal fish community. Mar. Biol 164:128. doi: 10.1007/s00227-017-3147-4
Somenahally, A., DuPont, J. I., Brady, J., McLawrence, J., Northup, B., and Gowda, P. (2018). Microbial communities in soil profile are more responsive to legacy effects of wheat-cover crop rotations than tillage systems. Soil Biol. Biochem. 123, 126–135. doi: 10.1016/j.soilbio.2018.04.025
Stat, M., John, J., DiBattista, J. D., Newman, S. J., Bunce, M., and Harvey, E. S. (2019). Combined use of eDNA metabarcoding and video surveillance for the assessment of fish biodiversity. Conserv. Biol. 33, 196–205. doi: 10.1111/cobi.13183
Thomsen, P. F., Kielgast, J., Iversen, L. L., Møller, P. R., Rasmussen, M., and Willerslev, E. (2012). Detection of a diverse marine fish fauna using environmental DNA from seawater samples. PLoS One 7:e41732. doi: 10.1371/journal.pone.0041732
Thomsen, P. F., Møller, P. R., Sigsgaard, E. E., Knudsen, S. W., Jørgensen, O. A., and Willerslev, E. (2016). Environmental DNA from seawater samples correlate with trawl catches of subarctic, deepwater fishes. PLoS One 11:e0165252. doi: 10.1371/journal.pone.0165252
Tsuji, S., Takahara, T., Doi, H., Shibata, N., and Yamanaka, H. (2019). The detection of aquatic macroorganisms using environmental DNA analysis-A review of methods for collection, extraction, and detection. Environ. DNA 1, 99–108. doi: 10.1002/edn3.21
Turner, C. R., Barnes, M. A., Xu, C. C. Y., Jones, S. E., Jerde, C. L., and Lodge, D. M. (2014). Particle size distribution and optimal capture of aqueous macrobial eDNA. Methods Ecol. Evol. 5, 676–684. doi: 10.1111/2041-210x.12206
Valentini, A., Taberlet, P., Miaud, C., Civade, R., Herder, J., Thomsen, P. F., et al. (2016). Next-generation monitoring of aquatic biodiversity using environmental DNA metabarcoding. Mol. Ecol. 25, 929–942.
Wang, J.-Y., Yu, X.-W., and Fang, L. (2014). Organochlorine pesticide content and distribution in coastal seafoods in Zhoushan, Zhejiang Province. Mar. Pollut. Bull. 80, 288–292. doi: 10.1016/j.marpolbul.2013.12.055
Wang, S., Liu, J., Li, J., Xu, G., Qiu, J., and Chen, B. (2020). Environmental magnetic parameter characteristics as indicators of heavy metal pollution in the surface sediments off the Zhoushan Islands in the East China Sea. Mar. Pollut. Bull. 150:110642. doi: 10.1016/j.marpolbul.2019.110642
Wang, X., Lu, G., Zhao, L., Du, X., and Gao, T. (2021). Assessment of fishery resources using environmental DNA: the large yellow croaker (Larimichthys crocea) in the East China Sea. Fish. Res. 235:105813. doi: 10.1016/j.fishres.2020.105813
Wang, X., Lu, G., Zhao, L., Yang, Q., and Gao, T. (2020). Assessment of fishery resources using environmental DNA: small yellow croaker (Larimichthys polyactis) in East China Sea. PLoS One 15:e0244495. doi: 10.1371/journal.pone.0244495
Wilhm, J. L. (1968). Use of biomass units in shannon’s formula. Ecology 49, 153–156. doi: 10.2307/1933573
Yamamoto, S., Masuda, R., Sato, Y., Sado, T., Araki, H., Kondoh, M., et al. (2017). Environmental DNA metabarcoding reveals local fish communities in a species-rich coastal sea. Sci. Rep. 7:40368. doi: 10.1038/srep40368
Yu, H., and Xian, W. (2009). The environment effect on fish assemblage structure in waters adjacent to the Changjiang (Yangtze) River estuary (1998–2001). Chin. J. Oceanol. Limnol. 27, 443–456. doi: 10.1007/s00343-009-9155-6
Zhang, H., Yoshizawa, S., Iwasaki, W., and Xian, W. (2019). Seasonal fish assemblage structure using environmental DNA in the Yangtze estuary and its adjacent waters. Front. Mar. Sci 6:515. doi: 10.3389/fmars.2019.00515
Zheng, R., and Kim, B.-H. (2014). Pharmacokinetics and bioequivalence of sildenafil granules and sildenafil tablets in Korean healthy volunteers. Int. J. Clin. Pharmacol. Ther. 52, 530–536. doi: 10.5414/CP202073
Keywords: environmental DNA, fish diversity, environmental factors, bottom trawl fishery, Zhoushan Sea
Citation: Zhou S, Fan C, Xia H, Zhang J, Yang W, Ji D, Wang L, Chen L and Liu N (2022) Combined Use of eDNA Metabarcoding and Bottom Trawling for the Assessment of Fish Biodiversity in the Zhoushan Sea. Front. Mar. Sci. 8:809703. doi: 10.3389/fmars.2021.809703
Received: 05 November 2021; Accepted: 20 December 2021;
Published: 27 January 2022.
Edited by:
JInghui Fang, Yellow Sea Fisheries Research Institute, Chinese Academy of Fishery Sciences (CAFS), ChinaReviewed by:
Jianwei Chen, Beijing Genomics Institute (BGI), ChinaVânia Baptista, University of Algarve, Portugal
Copyright © 2022 Zhou, Fan, Xia, Zhang, Yang, Ji, Wang, Chen and Liu. This is an open-access article distributed under the terms of the Creative Commons Attribution License (CC BY). The use, distribution or reproduction in other forums is permitted, provided the original author(s) and the copyright owner(s) are credited and that the original publication in this journal is cited, in accordance with accepted academic practice. No use, distribution or reproduction is permitted which does not comply with these terms.
*Correspondence: Li Chen, Y2hlbmxpQGpvdS5lZHUuY24=; Nannan Liu, bG5uMTkwM0AxNjMuY29t