 Mladen Šolić1
 Danijela Šantić1
 Stefanija Šestanović1*
 Grozdan Kušpilić2
 Frano Matić3
 Ana Vrdoljak Tomaš1
 Slaven Jozić1
 Natalia Bojanić4
 Živana Ninčević Gladan4
- 1Laboratory of Microbiology, Institute of Oceanography and Fisheries, Split, Croatia
- 2Laboratory of Chemical Oceanography and Sedimentology, Institute of Oceanography and Fisheries, Split, Croatia
- 3Laboratory of Physical Oceanography, Institute of Oceanography and Fisheries, Split, Croatia
- 4Laboratory of Plankton and Shellfish Toxicity, Institute of Oceanography and Fisheries, Split, Croatia
The mechanisms responsible for the development of various structural and functional features of the microbial food web (MFW) and their dynamics at spatial and temporal scales, which are important for predicting their responses to future environmental changes, are largely unknown. More than 3000 datasets of environmental and microbial variables collected over a decade on a seasonal and large spatial scale in the Adriatic Sea were analyzed. The sets of environmental variables were classified into four clusters (representing different environmental states) using Neural Gas analysis and the differences in MFW structure between the clusters were analyzed. Different variants of MFW evolve in the different clusters in terms of the abundance of MFW components, their ratios, growth and grazing rates, predator preference in prey selection, the strength of predator-prey interaction, and the relative importance of top-down and bottom-up control. However, these clusters are neither spatially nor temporally fixed; rather, the area studied represents a mosaic of different environmental conditions that alternate from one state to another on a time scale. In each of the environmental states, a distinct structure of MFW develops that shows consistent and repeatable changes that strictly follow the switching in environmental conditions from one state to another.
Introduction
Heterotrophic picoplankton (HPP), mainly heterotrophic bacteria (HB) and autotrophic picoplankton (APP) which include prokaryotic cyanobacteria Prochlorococcus (PROC) and Synechococcus (SYN), and pico-eukaryotic algae (PE) constitute the main components of the marine picoplankton community (PP) (Magazzù and Decembrini, 1995; Zubkov et al., 2000), which together with the major protist predators, heterotrophic nanoflagellates (HNF) and ciliates (CIL), constitute the basic elements of the microbial food web (MFW).
Together with the herbivorous food web (HFW), the MFW represents one of the two predominant trophic pathways in the pelagic marine environment (Legendre and Rassoulzadegan, 1995). The former goes from large phytoplankton and zooplankton to fish, resulting in a shorter and simpler food web with a high carbon export potential. The latter is a complex network of small picoplankton organisms and their protist predators (Teira et al., 2003). In general, the relative importance of MFW decreases with increasing trophic status and nutrient recycling within the MFW is less important under high nutrient loading (Cermeño et al., 2006; Vargas et al., 2007). Oligotrophic conditions are characterized by low nutrient concentrations with high proportions of dissolved rather than particulate carbon, which favors prokaryotic heterotrophs over phagotrophic heterotrophs (Cotner and Biddanda, 2002). In addition, the dominant producers in oligotrophic systems are small plankton (<5–10 μm), that are too small to be effectively ingested by mesozooplankton (Finlay and Roff, 2004; Vargas and Gonzalez, 2004). Therefore, protozoan predators (mainly HNF and ciliates) may provide an additional trophic link in oligotrophic systems (Unrein et al., 2007; Zubkov and Tarran, 2008). Further, in oligotrophic systems, interactions between autotrophs and heterotrophs are closely linked because the dominant heterotrophs (bacteria and protozoa) have similar size, growth rate, and nutrient composition to the dominant autotrophs (pico- and nano-sized microorganisms).
In general, the Adriatic Sea is characterized as an oligotrophic, low-productivity ecosystem in the central and southern regions (with the exception of some nutrient-rich coastal zones). Moreover, it has been reported that the Adriatic Sea (Buljan and Zore-Armanda, 1976; Vukadin and Stojanoski, 2001), like the Mediterranean Sea (Thingstad et al., 1998; Van Wambeke et al., 2002; Pinhassi et al., 2006), is severely phosphorus-depleted and bacterial growth has been shown to be P-limited not only in the open Adriatic Sea but also in coastal and estuarine areas (Šolić et al., 2015).
Accordingly, previous studies have confirmed that pico-sized microorganisms, and MFW play an important role in the production and transfer of biomass and energy in pelagic ecosystems of the Adriatic Sea (Šolić and Krstulović, 1994; Šantić et al., 2013). These organisms found at the lower levels of a food web are responsible for strong bottom-up processes that control the structure and dynamics of the upper trophic levels (Lassalle et al., 2011).
However, oligotrophic environments differ in many characteristics besides trophic status, such as depth, temperature, salinity, meteorological conditions, water mass circulation, and water column dynamics (Stenseth et al., 2006), and all of these affect the structure of MFW and consequently its role in biogeochemical processes in aquatic ecosystems (Cotner and Biddanda, 2002; Berglund et al., 2007). Nutrient enrichment generally leads to increased abundance and biomass of all components of the planktonic food web (Berninger et al., 1991), but the response of individual groups can vary widely (Gasol and Vaqué, 1993; Jansson et al., 1996). Therefore, nutrient supply may influence the structure of the MFW and affect the interactions between microbial community components (Šolić et al., 2008).
Temperature, in turn, controls metabolic rate (Gillooly et al., 2001). Therefore, temperature and resources interact in controlling different metabolic rates, such as growth and grazing, in such a way that the influence of resources on these rates depends on temperature (Rhee and Gotham, 1981). In general, the relative influence of nutrient availability on growth rate is positively correlated with temperature up to a certain optimum (Persson et al., 2011). Temperature and nutrient availability also interact with respiration rate, which in turn regulates growth efficiency.
However, we still know too little about the mechanisms structuring the MFW to fully understand the spatial and temporal occurrence of the various structural features of the MFW and to predict their response to future environmental changes. In this paper, we consider the marine environment as a mosaic of certain states defined by environmental variables, such as temperature, salinity, and nutrients. These states show the dynamics of change at spatial and temporal scales, where a given site alternates between multiple states over time. We propose that MFW exhibit a heterogeneous structural and functional response to changes associated with different environmental conditions. For this purpose, we analyzed more than 3000 data sets of environmental variables collected at a large spatial and temporal scale, including transitional/estuarine waters, coastal and open marine areas sampled in all seasons over a decade.
The grouping of these data sets into clusters representing different environmental conditions was performed using Neural Gas (NG) analysis, an unsupervised artificial neural network (Kohonen, 1982; Martinetz and Schulten, 1991). The advantage of this method compared to other methods, such as Self-Organizing Map Analysis (SOM) or Principal Component Analysis (PCA), is that NG is a weak smoothing algorithm and is more suitable for anomaly and outlier detection. Namely, the NG algorithm distributes the neural units homogeneously over the input space and spreads far enough to cover all the data.
After NG analysis generated clusters representing different environmental states, the structural and functional features of MFW in each of the clusters were analyzed. The MFW features we focused on included abundance/biomass of all MFW components (HB, including two physiological groups: HNA—bacteria with high nucleic acid content and LNA—bacteria with low nucleic acid content; APP, which includes two cyanobacterial groups: PROC and SYN, and PE; CHLA—chlorophyll a, which in this study was an indicator of large phytoplankton biomass and HNF as protistan grazers), some characteristic ratios (HNA/LNA, APP/CHLA, APP/HB) as well as growth and grazing rates, relative proportion of individual prey to total grazing by protist predators (HNF, CIL), and preferences in prey selection. In addition, the influence of temperature on MFW elements, the relative importance of top-down (TD) and bottom-up (BU) control in controlling HB, and the strength of predator-prey interactions, as an indicator of biomass flow between prey and predators, were examined in each of the clusters.
We hypothesized that different environmental conditions produce different variants of MFW due to their structural and functional features.
Materials and Methods
Field Study
Field research was based on the comparison of natural systems characterized by sea surface temperature (SST), salinity and concentration of nutrients (N, P, Si). The analysis includes 3420 data sets of environmental parameters (temperature, salinity, oxygen, NO3, NO2, NH4, PO4, SiO4) and microbial food web parameters (HB, HNA, LNA; bacterial production—BP, two cyanobacterial groups: PROC and SYN, PE, and HNF). Ciliates as important predators of pico- and nanoplankton were additionally observed in the in situ growth/grazing experiments.
Sampling was conducted at 81 stations in the central and southern Adriatic Sea in transitional/estuarine waters, the coastal sea and the open sea during the last decade (2010–2019) (Supplementary Figure 1). Samples were collected at 0, 5, and 10 m and integrated mean values were used for analysis.
The distribution of data by season and types of the marine environment is shown in Supplementary Figure 2. Most of the samples are from the coastal sea (62%), while 20% of the samples are from transitional/estuarine waters and 18% of the samples are from the open sea. The distribution by season is fairly uniform for all types of marine environments, as well as for the entire data set.
Characterization of the Studied Area According to Nutrient Status
Potential nutrient limitation at the sampled sites was determined applying concentration and stoichiometric criteria. Limiting concentrations are evaluated by comparing ambient nutrient concentrations to concentrations likely to limit nutrient uptake. Based on studies of the kinetics of nutrient uptake (Rhee, 1973; Perry and Eppley, 1981; Goldman and Gilbert, 1983; Brzezinski, 1985), the concentrations of dissolved inorganic nitrogen (DIN) of 1 μM and dissolved (reactive) phosphorus (P) of 0.1 μM were chosen as threshold values. Stoichiometric limitation is evaluated by calculating two ambient nutrient ratios for each nutrient and applying the following criteria: P limitation = when Si:P > 22 and DIN:P > 22; N limitation = when DIN:P < 10 and Si:DIN > 1 (Justić et al., 1995).
Environmental Variables Clustering Using Neural Gas Analysis
Neural Gas (NG) analysis is an unsupervised artificial neural network (Kohonen, 1982; Martinetz and Schulten, 1991). The method reduces the dimensionality of the data space to a certain number of neurons with weak connections between them, so that the neurons propagate like a gas in the data space. The result of the learning process is the best matching units that reduces data space into a certain number of clusters. Links between the clusters are weak, without a predefined topological structure in the manifold. The lack of a fixed topological structure is the main difference from the commonly used SOM analysis, which maximizes a predefined topological structure. NG analysis is a weak smoothing algorithm that spreads the clusters far enough to cover all the data, including the extreme values, making it more suitable for anomaly and outlier detection.
During the adaptation process, the NG was trained with 5000 training epochs, with default values for the initial step size (0.5) and an initial decay constant (2.5), following Martinetz et al. (1993). The number of best matching units was set to 4 using as minimum of coefficient of variation of the SSIntra quantization error (de Bolt et al., 2002; Matić et al., 2018; Zhuang et al., 2020).
The input data for the NG analysis were vectors with elements of separately normalized environmental parameters (temperature, salinity, NO3, NH4, PO4 N/P, NO3/NH4). The input vector has seven elements and there were 3102 different vectors. The result of the analysis was four NG clusters. The SOM Toolbox version 2.0 for MATLAB used in this study was developed by E. Alhoniemi, J. Himberg, J. Parhankangas, and J. Vesanto at Helsinki University of Technology, Finland, and is available at http://www.cis.hut.fi/projects/somtoolbox/.
Method for Distinguishing the Relative Importance of Bacterial Biomass Control Mechanisms
In order to gain better insight into the mechanisms regulating bacterial biomass, by substrate availability (i.e., BU control) or by predation (i.e., TD control), biological data were analyzed taking into consideration the slopes and significance of Model I (ordinary least squares) linear regression between log-log bacterial biomass (BB) and bacterial production (BP) (Billen et al., 1990; Ducklow, 1992). In this case, bacterial production was taken as an equivalent to the rate of substrate supply. According to this approach, if the mortality caused by predators is low, total BP can be converted into BB. Alternatively, if the grazing on bacteria is very high, BB does not increase with an increase in BP. Therefore, a strong relationship between BP (independent variable) and BB (dependent variable) suggests the domination of BU control on bacteria. On the other hand, no relationship indicates domination of TD control.
In addition, Ducklow (1992) suggested that the slope (b) of a log-log regression between BP and BB indicates the strength of BU control as follows: b > 0.6 indicates strong BU control; b-values from 0.4 to 0.6 indicate moderate BU control; b < 0.4 indicates weak BU control; and b < 0.2 indicates no BU control.
Experimental Study
Growth/Grazing Experiment
In situ growth/grazing experiments were conducted at four sites that well represent the typical environmental conditions of the four clusters created by the NG analysis (Supplementary Figure 3). Growth and grazing parameters were estimated using the size-fraction technique (Wright and Coffin, 1984; Rassoulzadegan and Sheldon, 1986). Sub-samples of the collected seawater were filtered through a 2 μm pore size polycarbonate membrane to remove PP predators, 10 μm pore size polycarbonate membrane to remove HNF predators (mostly CIL) and through 200 μm plankton net to remove large predators. To prevent cell breakage, the size-fraction < 10 μm was filtered by gravity and< 2 μm with a vacuum of < 2 kPa. The numbers of HB and PROC were not changed after the passage through the 2 μm filter, whereas the number of SYN decreased by 5–7%. The size fractionation < 10 μm was chosen based on previous studies at this site to eliminate ciliates but not HNF (Šolić et al., 2017). The filtration process was designed to exclude picoplankton grazers from the 2 μm filtered fraction and allowed them to remain in the 10 μm fraction. We examined the influence of fractionation on HNF and found that about 3–8% of the HNF cells (very small pico-flagellates) passed through the 2 μm filters. Since their number did not change during the experiments, we assumed that these cells did not significantly affect picoplankton growth rates.
Each size fraction was then transferred in triplicate to 1-L dialysis bags anchored 2 m below sea level and incubated in situ for 24 h at ambient temperature and light intensity. Our previous study confirmed exponential growth during the 24-h incubation period (for more information, see Šolić et al., 2018; Supplementary Material). Triplicate samples were taken at the beginning and end of each incubation period to count the number of microbial groups as described below.
Net growth rates (μ, day–1) of each microorganism group were calculated for each dialysis bag, assuming exponential growth (Landry and Hassett, 1982):
where NB and NE represented the number of organisms at the beginning and at the end of the period of exponential growth and t is duration of experiments in days.
Grazing rates (g) were calculated as the difference between growth rates in a predator-free fraction and growth rates in the presence of predators (for more details see Supplementary Table 1). Losses due to grazing (G, μg C L–1 day–1) were estimated using the following equations: G = g × B, where B is the initial cell biomass (μg C L–1).
Calculation of Grazing Preference Index
To evaluate prey selection, the Manly-Chesson preference or selection index (alpha index, α) was calculated (Manly, 1974; Chesson, 1978, 1983):
where:
di = the proportion of prey item i in the diet
ei = the proportion of prey item i in the environment
m = the number of prey items in the environment
Since α values are normalized, they range from 0 (complete avoidance) to 1 (complete preference). If α = 1/m, the predator is feeding randomly and the prey is consumed in proportion to its abundance in the environment; whereas α > 1/m indicates the preference and α < 1/m indicates the avoidance of prey consumption.
Quantifying the Strength of Predator-Prey Interaction
The strength of interaction between predator and prey is generally defined as the per capita measure of the instantaneous abundance/biomass change of the prey due to changes in the predator.
Per capita standardized measure of the strength of consumer interaction on their prey (IS) was calculated according to Bascompte et al. (2005):
where (Q/B)j is the number of times a predator population consumes its own weight per day, DCij is the proportion of prey i in the diet of consumer j, and Bi is the biomass of prey i.
Data Analysis
Environmental Parameters
Temperature and salinity were measured using CTD multiparameter probes (Idronaut and SeaBird) with accuracy > ± 0.01°C and ± 0.02, respectively. Dissolved oxygen concentration was determined by Winkler titration (Strickland and Parsons, 1972). Nutrients (NO3–, NO2–, NH4+, and PO43–) were analyzed on a Bran+Luebbe AutoAnalyser (II and III models) using standard colorimetric methods (Grasshoff, 1976).
Flow Cytometry Analysis
For cell counting, samples were analyzed using a Beckman Coulter CytoFLEX cytometer with a fast flow rate of 60 μL min–1. Fresh samples for autotrophic cell analysis (2 mL) were preserved in 0.5% glutaraldehyde, flash- frozen and stored at –80°C until analysis (within 1 week). Samples for analysis of bacteria were preserved in 2% formaldehyde kept at 4°C until analysis. Autotrophic cells were divided into three groups: two cyanobacteria (SYN and PROC) and PE, distinguished according to light scattering, cellular chlorophyll content, and phycoerythrin-rich cell signals, respectively (Marie et al., 1999). Sybr Green-I-stained non-pigmented (heterotrophic) bacteria were determined according to Marie et al. (1997). According to the cellular nucleic acid content, the bacterial populations were divided into two sub-groups, HNA and LNA bacteria. Abundances of Sybr Green-I-stained HNF were determined according to Christaki et al. (2011).
Ciliates
In order to remove large zooplankton organisms from the ciliate samples, the seawater was filtered through 200 μm mesh. Sample volumes of 2 L were sedimented (Utermöhl, 1958) for 48 h in cylinders and decanted down to a volume of 200 mL. Prior to microscopic analysis, the volume was further reduced to 20 mL. Decanting was carried out using a vacuum pump and a slightly curved pipette that removed water from the surface. Microscopic analysis of samples was carried out in a glass chamber (76 × 47 × 6 mm) using inverted microscopes (Olympus IMT-2), equipped with phase contrast, at 200 × and 400 × magnification. The entire bottom of the sedimentation chamber was analyzed and abundance of non-loricate ciliates and tintinnids was expressed as number of cells per liter. Samples were fixed with acid Lugol’s solution (2% final concentration) and stored in the dark at 4°C until counting (no longer than 2 weeks later).
Chlorophyll a
Chlorophyll a (CHLA) concentration was determined fluorometrically from 90% acetone extracts (Strickland and Parsons, 1972). Subsamples of seawater (500 mL) were filtered through Whatman GF/F glass-fiber filters (0.8 μm pore size) and the filters were frozen until analysis within 1 month of sampling. The filters were homogenized using pestle-type laboratory homogenizer (Omni GLH 850). CHLA was extracted in 90% acetone for 2 h in the dark at room temperature and analyzed using a Turner TD -700 Laboratory Fluorometer.
Because the analysis of CHLA included cells larger than 0.8 μm, this variable can be used as a relative estimate of the biomass of large phytoplankton. Although the biomass of APP includes cells less than 2 μm in size, which partially overlaps with the range of cells captured by the CHLA analysis, we thought that the APP/CHLA ratio might be a good relative indicator of changes in the size composition of the autotrophic component of the plankton community.
Bacterial Production
Bacterial cell production was estimated by measuring the incorporation of 3H-thymidine in bacterial DNA (Fuhrman and Azam, 1982). Methyl-3H-thymidine was added to 10 mL samples at a final concentration of 10 nmol (specific activity: 86 Ci mmol–1). Triplicate samples and a formaldehyde-killed adsorption control (final concentration: 0.5%) were incubated for 1 h. The incubations were stopped with formaldehyde (final concentration: 0.5%). The thymidine samples were extracted with ice-cold trichloroacetic acid (TCA), according to Fuhrman and Azam (1982). The TCA-insoluble fraction was collected by filtering the samples through 0.2 μm pore size polycarbonate filters.
Cell-to-Carbon Biomass Conversion
The biomasses of studied picoplankton groups were calculated using the following cell-to-carbon conversion factors: 20 fgC cell–1 for HB (Lee and Fuhrman, 1987; Kirchman et al., 1993), 36 fgC cell–1 for PROC (Buitenhuis et al., 2012), 255 fgC cell–1 for SYN (Buitenhuis et al., 2012), 2,590 fgC cell–1 for PE (Buitenhuis et al., 2012) and 0.22 pgC μm–3 for HNF (Borsheim and Bratbak, 1987). The size of HNF cells was measured at about 500 specimens per environment type, and their biovolume was estimated by the geometric method, i.e., by comparing the body shape of each organism with the geometric body. These measurements were performed using an Olympus BX51 epifluorescent microscope equipped with an XM10-IR camera at ×1,000 magnification. Ciliate cell sizes were measured on approximately 200 specimens in all samples, using an ocular micrometer and converted into bio-volumes by approximation to the nearest geometric shape from measurements of cell length and width. After measurement of the plasmatic body dimension of non-loricates, bio-volumes were converted into C biomass using 190 fg C μm–3 (Putt and Stoecker, 1989). In addition, the biomass of tintinnids was calculated using the formula 444.5 pgC + (lorica volume in μm–3 × 0.053 pg C) per cell, according to Verity and Langdon (1984).
Statistical Analysis
Statistical operations were performed by STATISTICA 9.0 software. Data normality was assessed by applying the Shapiro-Wilk W normality test. Grazing preference index (alpha index), was calculated using Ecological Methodology Programs (version 7) by Krebs (2009). Neural Gas analysis (Kohonen, 1982; Martinetz and Schulten, 1991) is explained above.
Results
Application of Neural Gas Analysis in Clustering Environmental Variables
The Neural Gas model was run with environmental parameters and after the learning process, the data were classified into four large groups (clusters: CL 1, CL 2, CL 3 and CL 4). Mean values of microbial and environmental variables in four clusters are shown in Supplementary Table 2.
Spatio-Temporal Distribution of Clusters
In general, samples grouped into individual clusters are not strictly spatially defined, but there is an alternation between different environmental conditions at the same site, resulting in the same site being assigned to different clusters over time. Moreover, adjacent sites often belonged to different clusters, suggesting that changes in environmental conditions occur at a small spatial scale. Therefore, samples characterized by similar environmental variables are collected in the four clusters, regardless of their spatio-temporal distribution. The data sets belonging to CL 1 and CL 4 are seasonally biased, so that the data sets from clusters 1 and 4 were mainly collected during the warmer and colder seasons, respectively. Data sets from CL 2 and CL 3 showed no seasonal pattern (Figure 1).
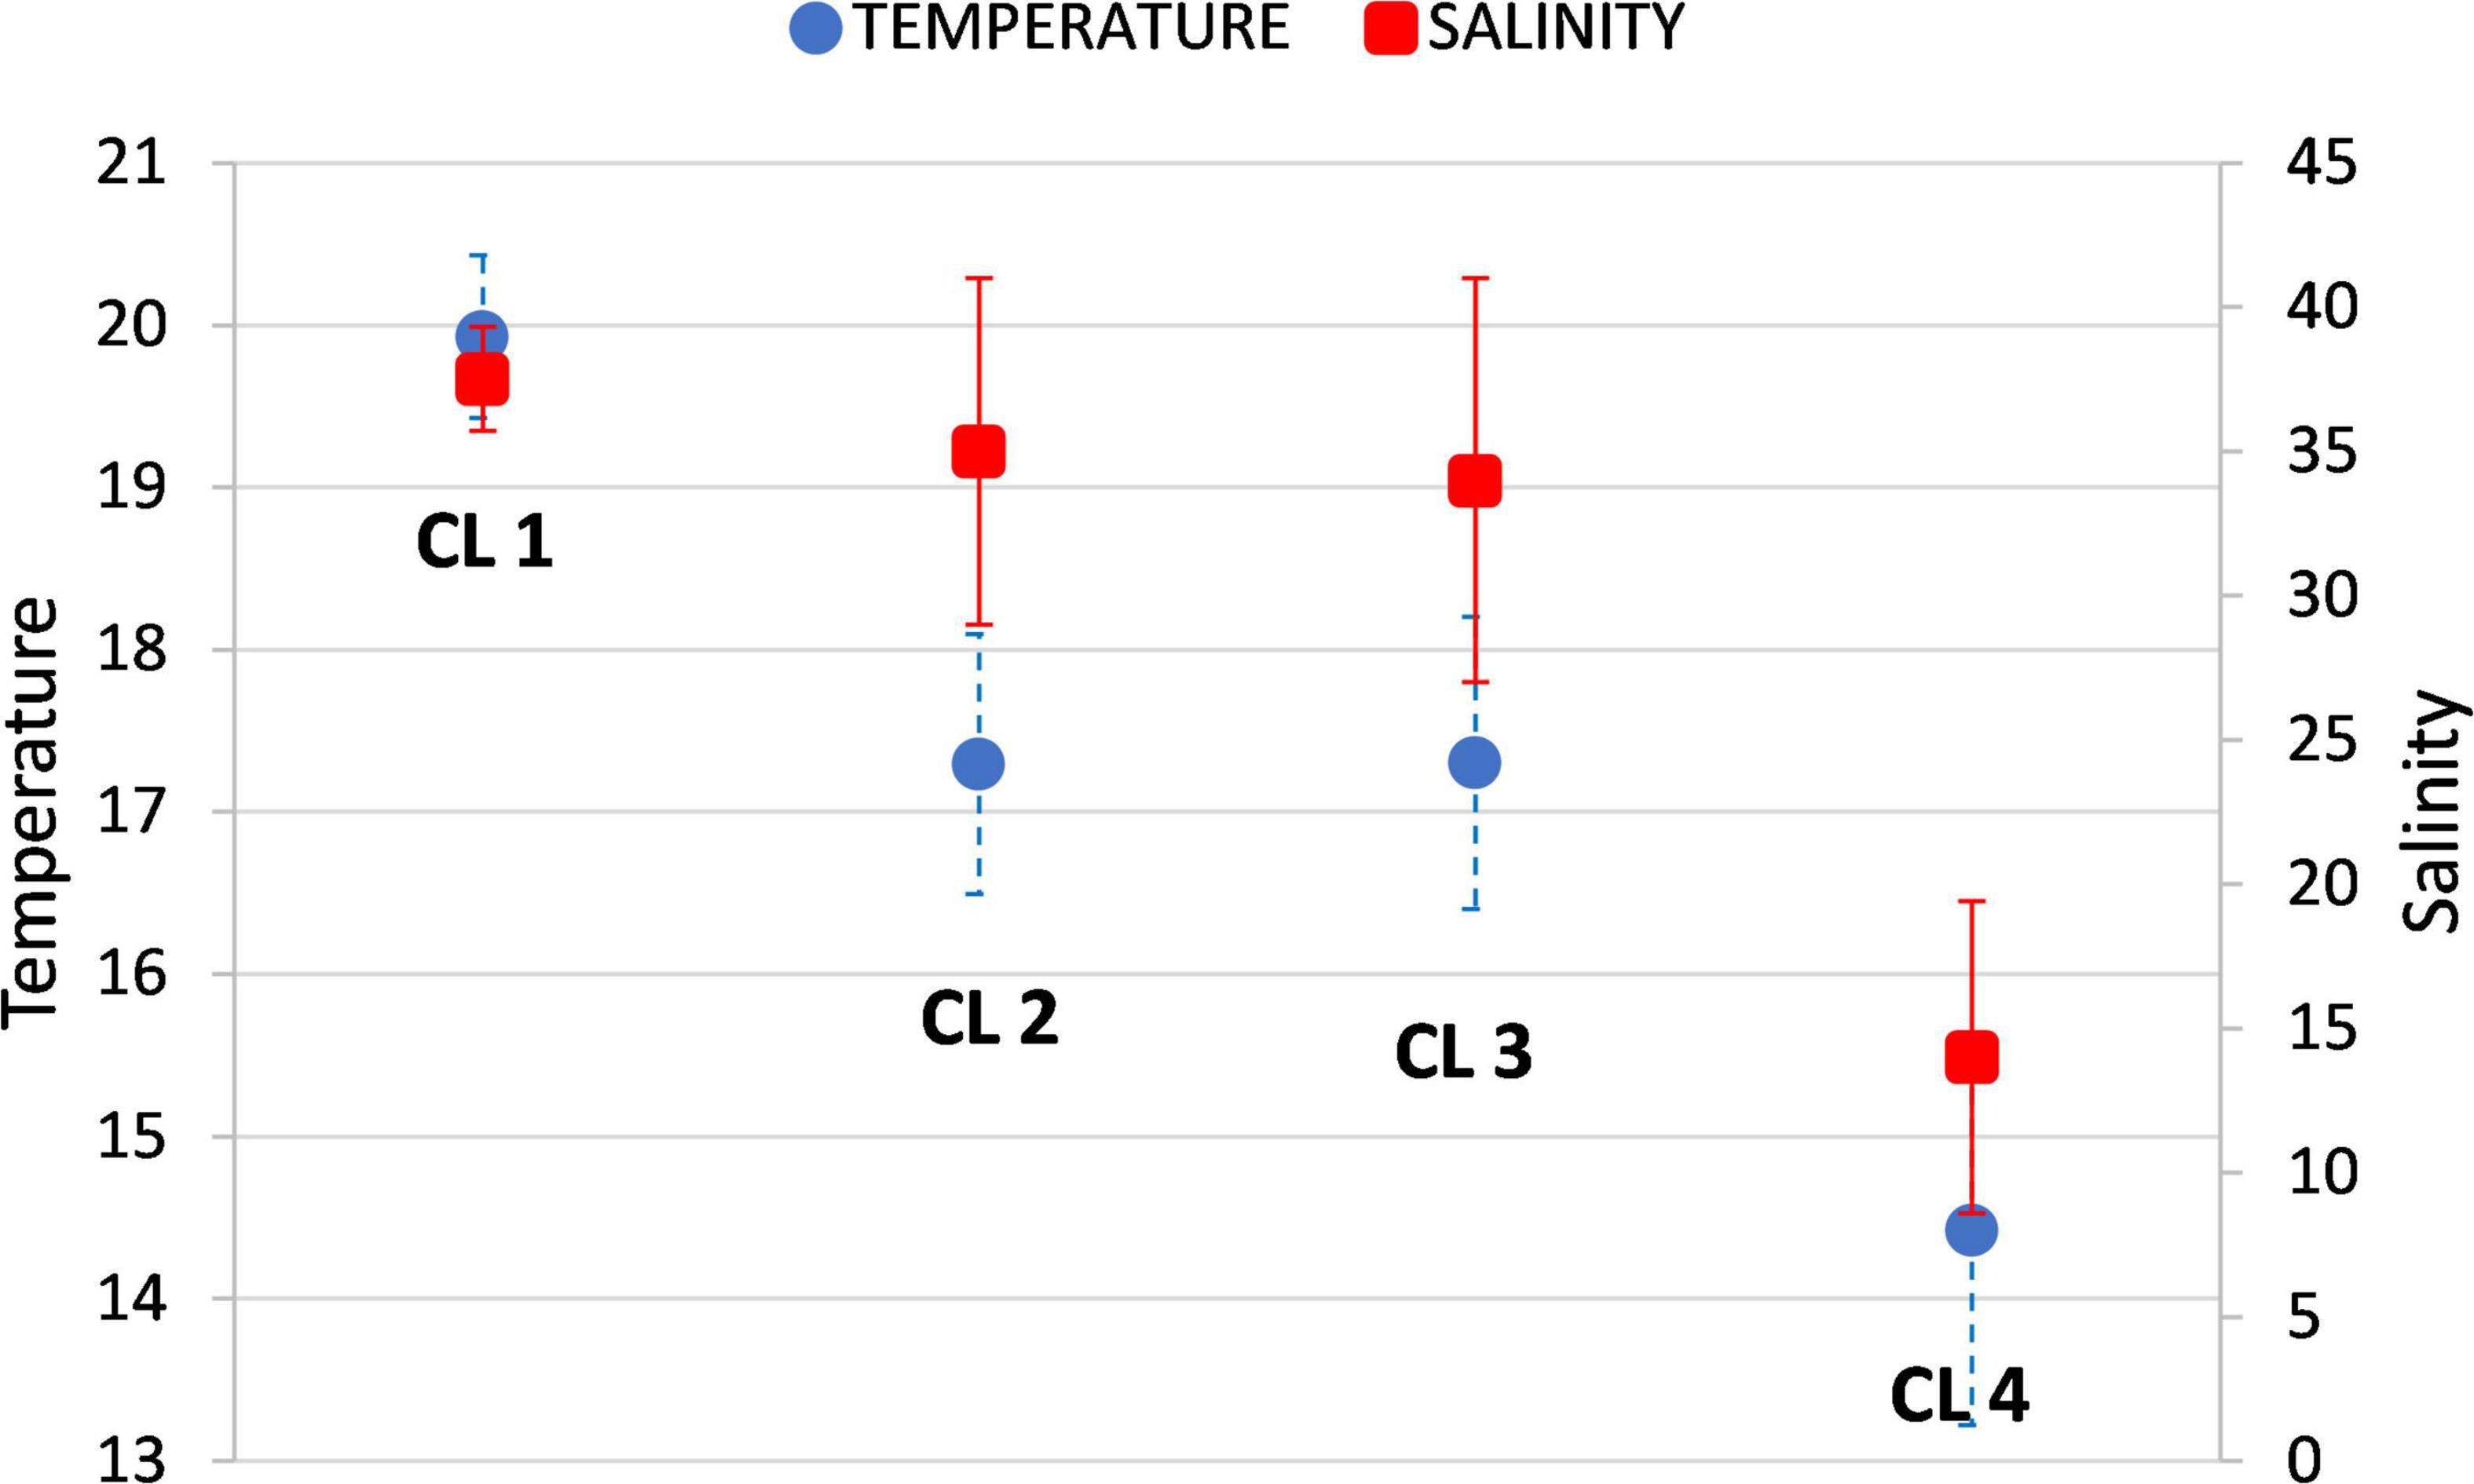
Figure 1. Characterization of clusters in relation to temperature and salinity.
Temporal dynamics of change between different environmental states are illustrated for three sites representative of the three types of marine environment (open sea, coastal sea, transitional/estuarine waters) (Figure 2). Environmental data sets sampled at open sea sites belonged predominantly to CL 1 (58%), but occasionally there was a switch to CL 2 (23%) and CL 3 (19%). No data set from the open sea belonged to CL 4. Data sets from the coastal sea mostly belonged to CL 2 (37%) and CL 3 (36%), but frequently switched to CL 1 (24%) and much less frequently to CL 4 (3%). Finally, most records from transitional/estuarine waters belong to CL 4 (51%), but occasionally switched to CL 2 (23%) and CL 3 (26%). No data set from transitional/estuarine waters belonged to CL 1. These patterns are also confirmed by salinity, which on average has the highest value in CL 1 (37.85) and the lowest in CL 4 (14.83), while the variation in salinity is large in CL 2 and CL 3 (Figure 1).
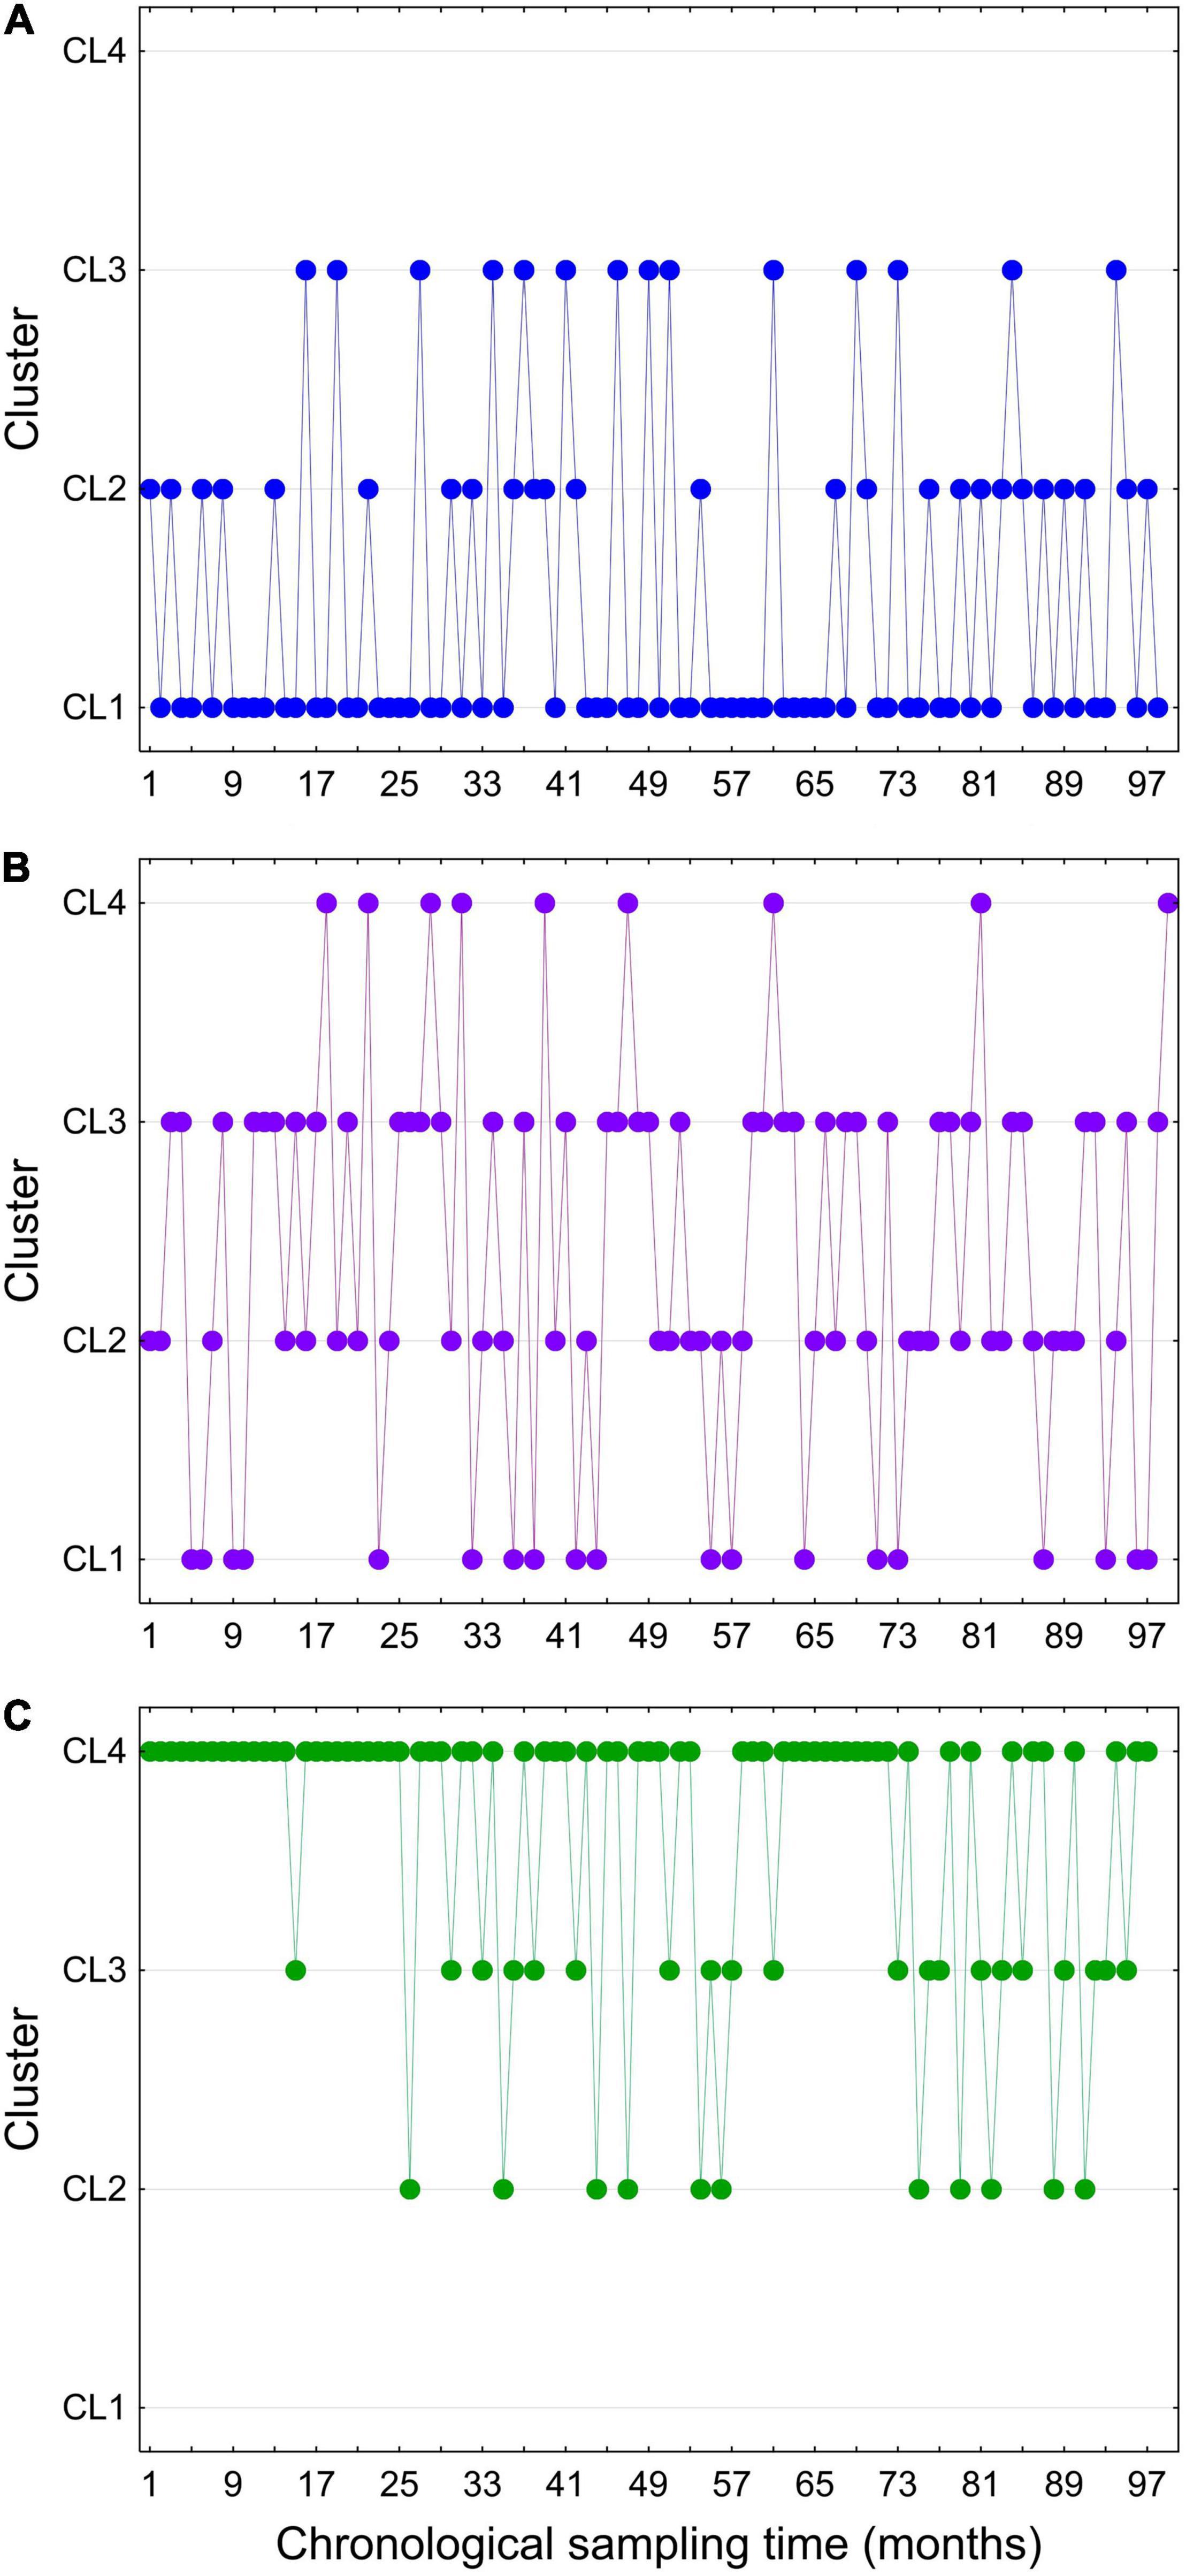
Figure 2. Temporal changes in the state of environmental conditions (expressed as switching between different clusters) at sites typical of the open sea (A), coastal sea (B) and transitional/estuarine waters (C).
Cluster Mapping in Relation to Nutrient Limitation
The marine environment studied is largely limited by phosphorus and partly by nitrogen (Figure 3). Nitrogen limitation is mainly present in CL 1 and CL 2, while phosphorus limitation is most pronounced in CL 3. CL 4 is characterized by maximum concentrations of nitrogen and phosphorus and is mostly not limited by nutrients (Figure 3A).
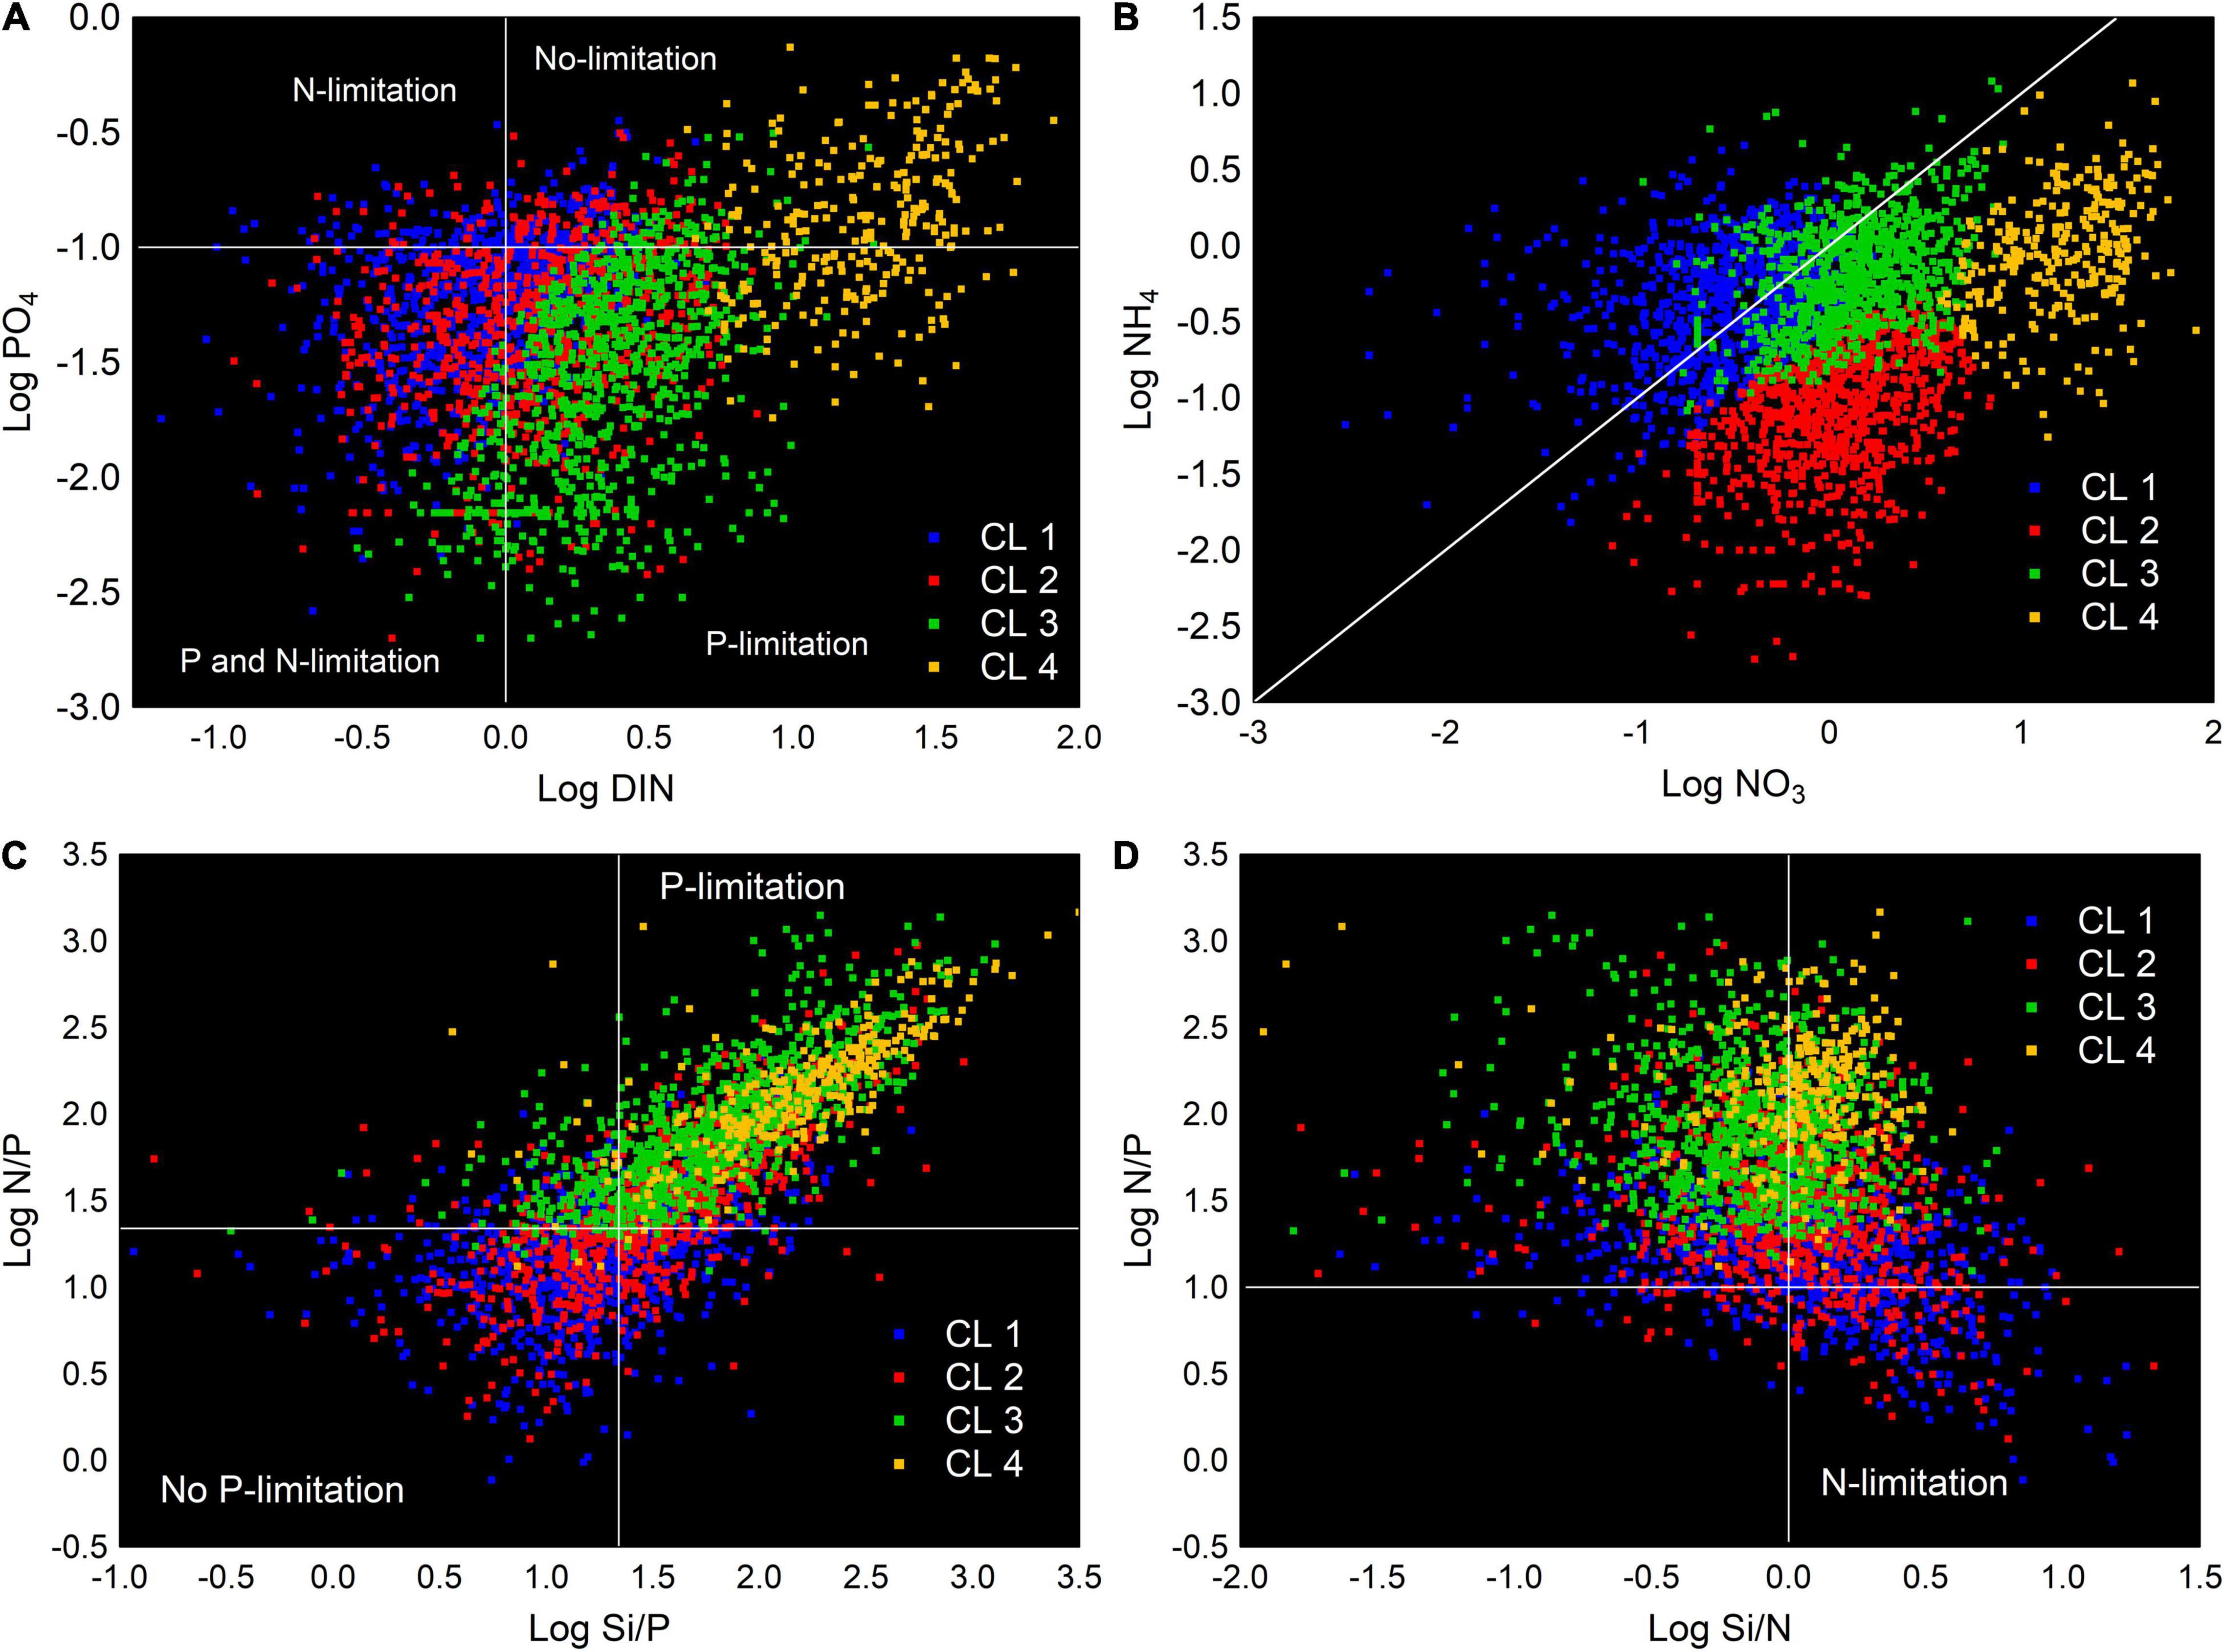
Figure 3. Cluster mapping in relation to ambient nutrient concentrations (dissolved inorganic nitrogen and phosphorus), with concentrations likely limiting nutrient uptake (phosphorus limiting—below horizontal line, nitrogen limiting—left of vertical line) (A). Cluster mapping in the scatter plot showing the relationship between ambient concentrations of allochthonous (NO3–) and regenerated (NH4+) nitrogen. A 1:1 line is indicated (B). Cluster mapping in the atomic nutrient ratio framework with stoichiometric criteria for potential limitation of phosphorus (C) and nitrogen (D). Concentration of nutrients are in μM.
The relative ratios of allochthonous (NO3–) and regenerated (NH4+) nitrogen clearly separated the clusters (Figure 3B). Higher concentrations of regenerated nitrogen compared to allochthonous are characteristic of data sets clustered in CL 1 and partially in CL 3, while allochthonous nitrogen dominates in data sets belonging to CL 2 and CL 4 (with higher concentrations of both allochthonous and regenerated nitrogen in CL 4 than in CL 2).
Application of stoichiometric criteria for potential phosphorus and nitrogen limitation showed that phosphorus limitation was largely absent in the data sets belonging to CL 1 and CL 2, whereas CL 3 and CL 4 were strongly limited by phosphorus (Figure 3C). Conversely, nitrogen limitation was only partially present in the data sets belonging to CL 1 and CL 2 (Figure 3D).
Description of Clusters
We can now summarize the main features of the clusters (Supplementary Table 2). The two clusters related to type of the marine environment and season are CL 1 and CL 4. The records collected in CL 1 are mainly from the open sea and the warmer season (see also Figure 2). This cluster is characterized by relatively low nutrient concentrations, especially nitrogen, so that the N/P ratio is relatively low. An important feature of this cluster is the dominance of regenerated over allochthonous nitrogen (low NO3–/NH4+ ratio) (Figure 4A).
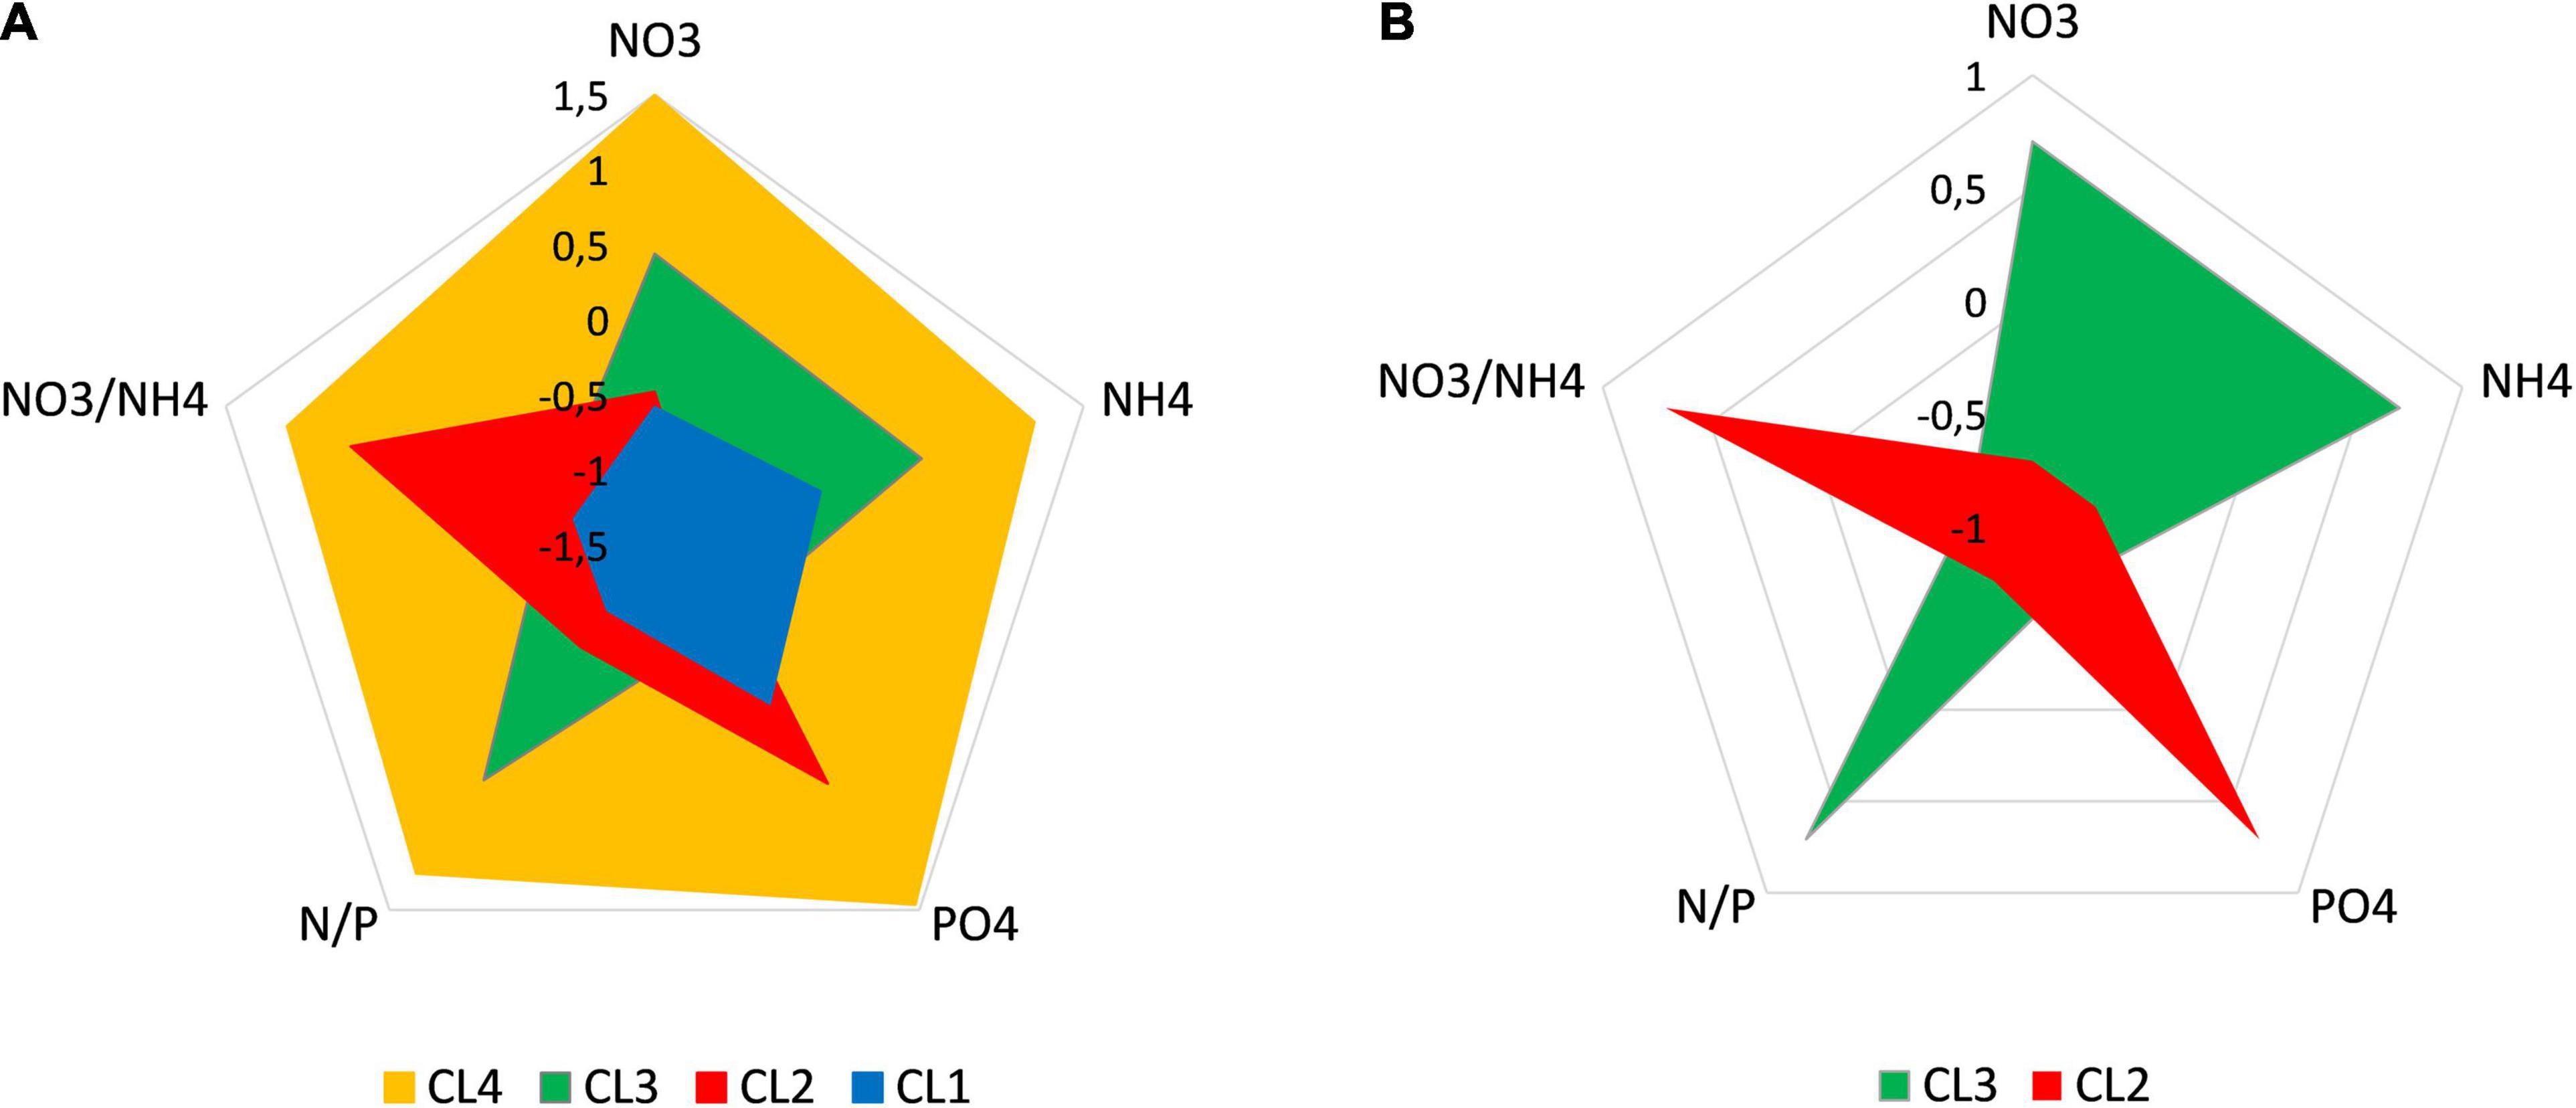
Figure 4. Characterization of clusters by nutrient concentrations and their ratios (A) and better insight into the differences between clusters 2 and 3 (B). Values are standardized as z-scores.
The data sets grouped in CL 4 are mainly from transitional/estuarine waters (lower salinity) and from the colder season (Figures 1, 2). This cluster is characterized by relatively high nutrient concentrations, both of nitrogen and phosphorus, but with a high N/P ratio indicating possible phosphorus limitation according to stoichiometric criteria. In contrast to CL 1, allochthonous nitrogen dominated over regenerated nitrogen (high NO3–/NH4+ ratio) (Figure 4A).
CL 2 and CL 3 contained mostly records from the coastal sea and less frequently from the open sea and transitional/estuarine waters. These clusters were not seasonally influenced and contained an equal amount of data from all seasons and across the range of temperature and salinity. The main differences between these two clusters relate to nutrients (Figure 4B). In general, the data sets grouped in CL 2 are characterized by a stronger limitation by nitrogen than by phosphorus, a relatively low N/P ratio, and a dominance of allochthonous over regenerated nitrogen (high NO3–/NH4+ ratio), while in CL 3 the opposite is the case.
The Response of the Microbial Food Web to Environmental Conditions
Different Variants of the Microbial Food Web Evolved Under Different Environmental Conditions
The analysis revealed different MFW structures in individual clusters (Figure 5). CL 4 is characterized by high relative values of the heterotrophic component of MFW (HB dominated by HNA bacteria, BP, HNF), while the autotrophic component of MFW was dominated by large phytoplankton (indicated by the concentration of CHLA) and the largest group of autotrophic picoplankton (PE). The relative concentrations of the prokaryotic part of the autotrophic picoplankton (cyanobacterial groups PROC and SYN) were low, and consequently the ratios APP/CHLA and APP/HB were also low.
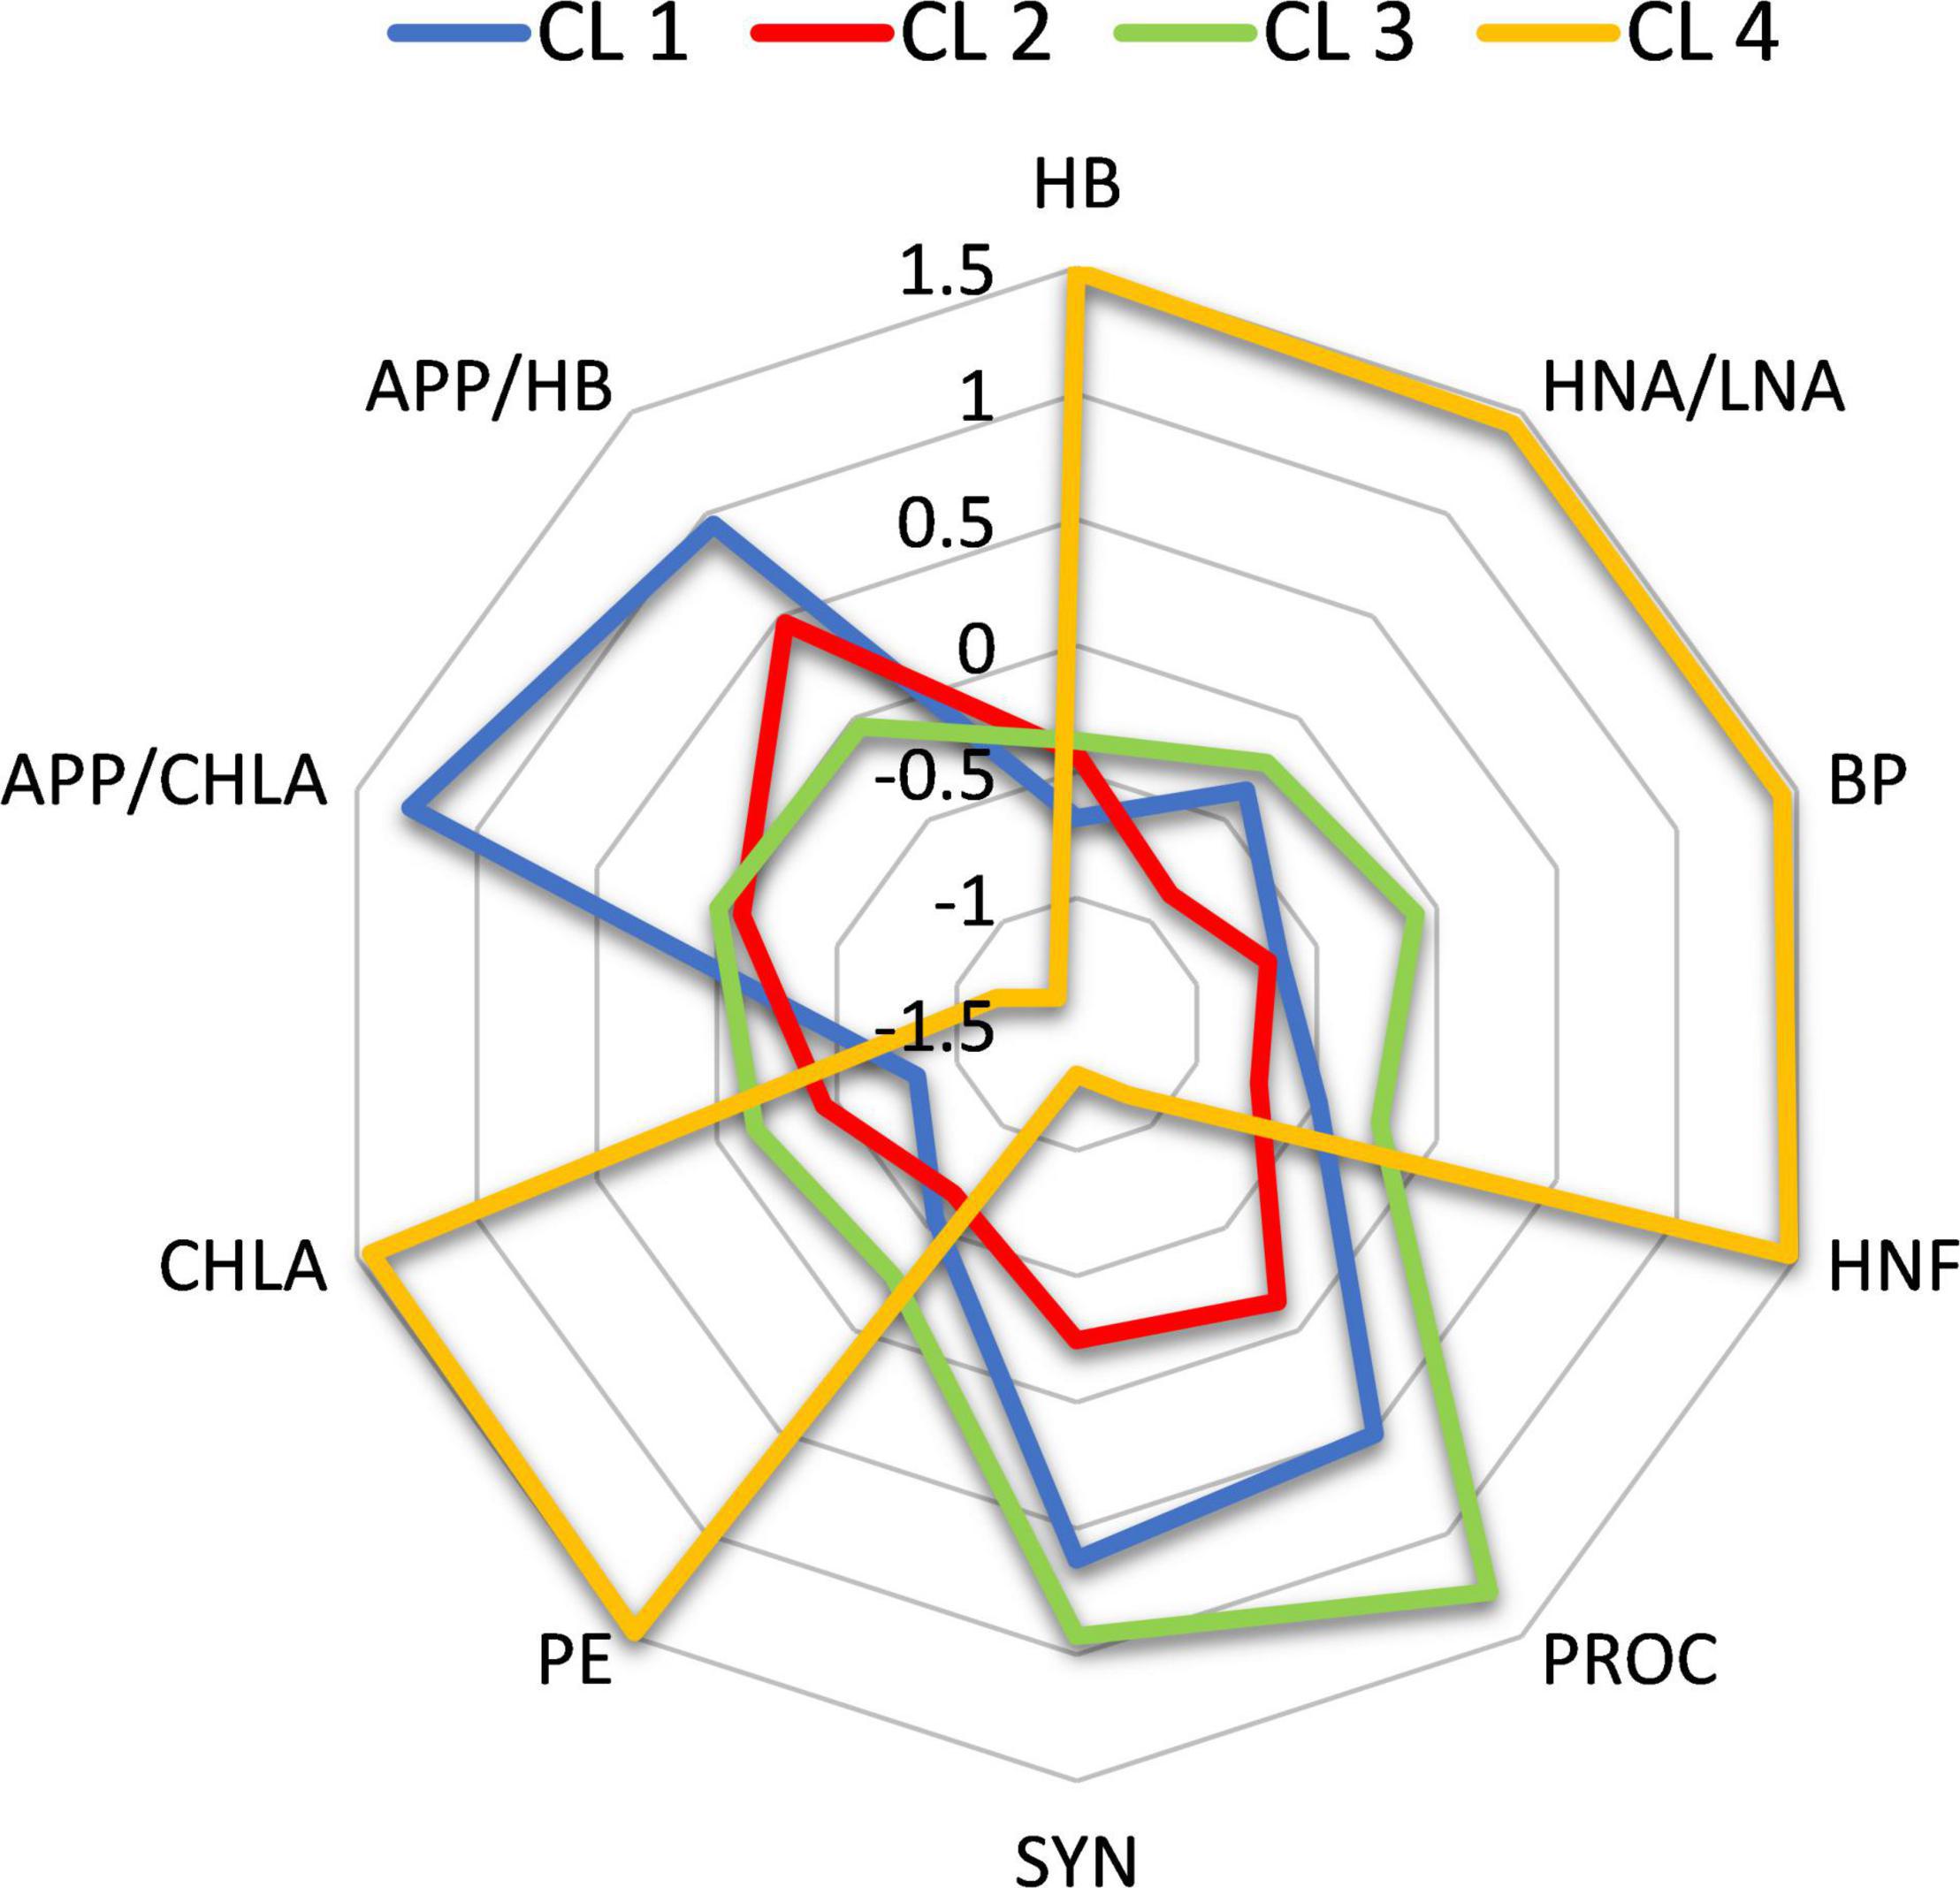
Figure 5. Microbial food web structures in individual clusters. Values are standardized as z-scores.
In contrast, the main feature of CL 3 is the relatively high concentrations of PROC and SYN. In CL 1, the concentrations of PROC and SYN are also relatively high (not as in CL 3), but unlike in CL 3, where the APP/CHLA and APP/HB ratios are very low, in CL 1 the CHLA and HB values are very low, resulting in high APP/CHLA and APP/HB ratios. Finally, in CL 2, most MFW variables have low values, with a maximum contribution of LNA bacteria and higher values of autotrophic than heterotrophic picoplankton (relatively high APP/HB ratio).
Influence of Temperature on the Structure of the Microbial Food Web
The effect of temperature on individual microbial groups within MFW differed between clusters (Supplementary Figure 3). The greatest positive effect of temperature was found in CL 4, where the average temperature was the lowest. The increase in temperature had a positive effect on the heterotrophic components of MFW (HB, BP, HNF) and to a slightly lesser extent, but statistically significant, on the autotrophic components CHLA and SYN. In CL 3, the increase in temperature had a positive effect on HB and HNF, and increased the proportion of LNA bacteria to the detriment of HNA bacteria. In CL 2, autotrophic components (CHLA, PE, SYN) decreased with temperature, resulting in an increase in the HB/APP and APP/CHL ratios. CL 1 is characterized by the highest temperature compared to the other clusters. Under these conditions, the temperature increase had the most negative effect on the large phytoplankton (CHLA), leading to an increase in the APP/CHLA ratio. Furthermore, in CL1, the HB/APP ratio increased and the HNA/LNA ratio decreased with temperature.
Top-Down vs. Bottom-Up Control of Heterotrophic Bacteria
Analysis of the relative importance of TD and BU control revealed a strong BU control (regression slope b = 0.72) of HB in CL 4. A weak BU control was found in CL 3 (b = 0.38) and CL 2 (b = 0.22), and no BU control in CL 1 (b = 0.14), indicating the greater importance of the TD control of HB in these clusters (especially in CL 1, which predominantly represents the open sea in the warmer season) (Supplementary Figure 4).
Comparison of Protistan Grazing in Individual Clusters
Estimates of growth and grazing rates in four clusters based on size fraction experiments are presented in Supplementary Table 3. A significant relationship was found between growth and total grazing rates (R2 = 0.85; p < 0.01). In general, the comparison of growth and grazing rates between the studied microbial groups revealed the following order: HB > PROC > SYN > PE > HNF. Comparison of clusters showed that maximum rates for HB, PE and HNF were found in CL 4, while PROC and SYN had maximum rates in CL 3.
The largest proportion of picoplankton biomass ingested by HNF came from HB (from 53% in CL 1 to 96% in CL 4) (Figure 6). The next large proportion of biomass eaten came from SYN (about 30% in CL 1 and 3) and PROC (11% in CL 1). All prey groups played a significant role in grazing by ciliates, with the exception of PROC, which accounted for less than 1% of ingested biomass in all clusters. HB had the largest contribution to ciliate grazing in CL 2 (73%), CL 3 (34%) and CL 4 (41%).
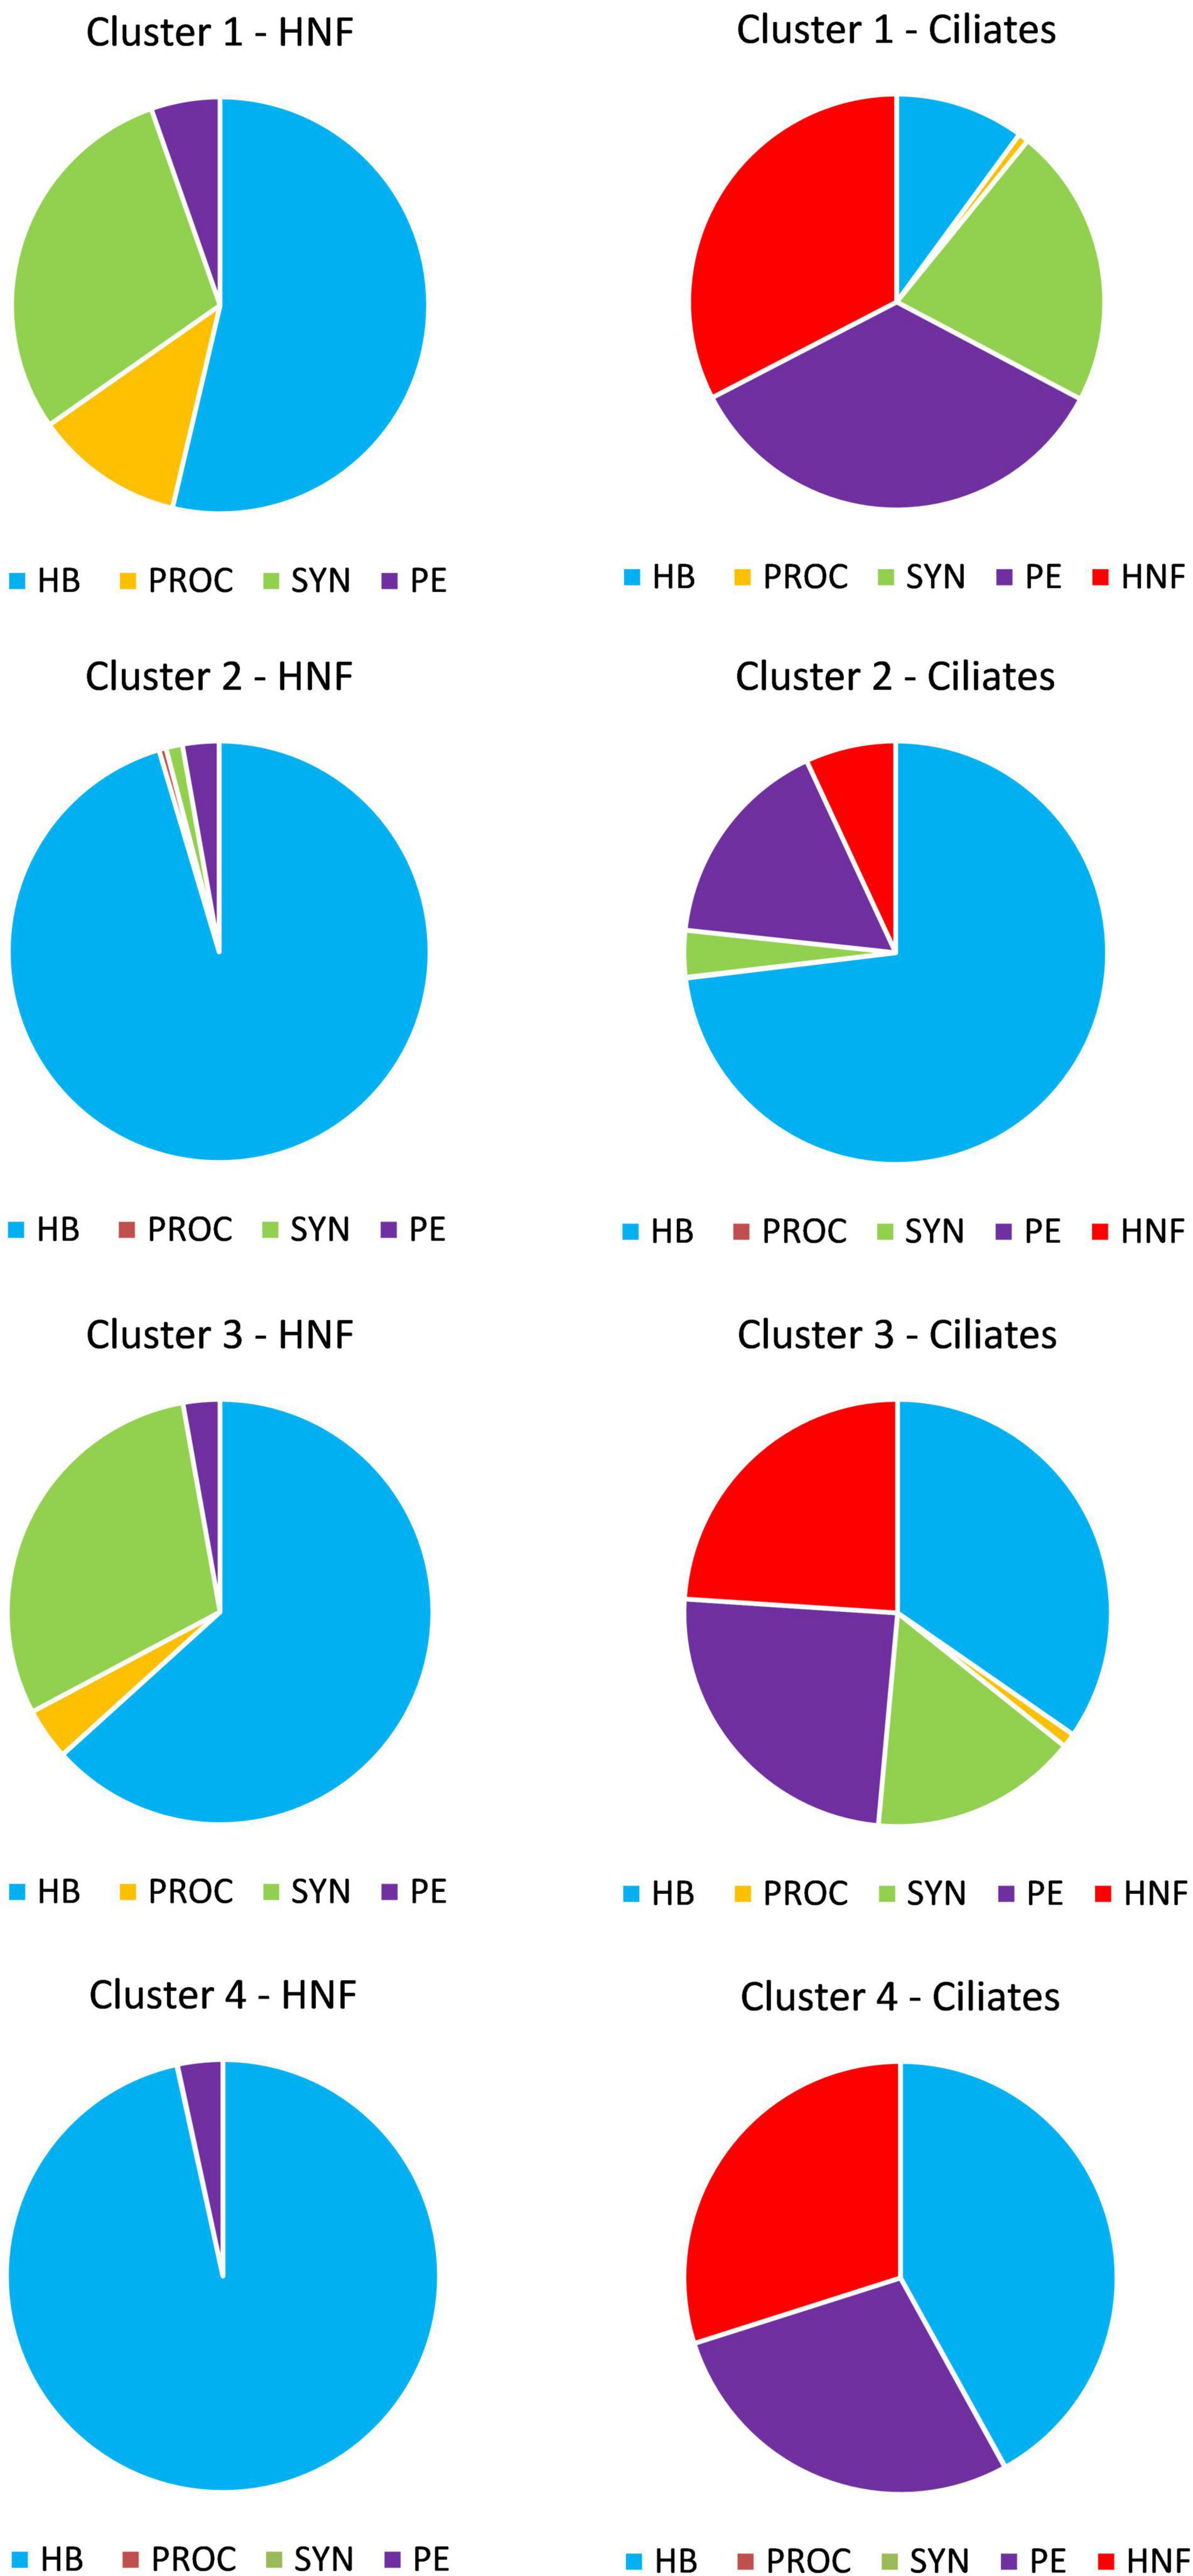
Figure 6. Relative proportion of prey biomass to total biomass ingested by HNF and ciliates in four clusters. HB, heterotrophic bacteria; PROC, Prochlorococcus; SYN, Synechococcus; PE, picoeukaryotes; HNF, heterotrophic nanoflagellates.
Another important proportion of ingested biomass came from HNF (32% in CL 1, 7% in CL 2, 24% in CL 3 and 30% in CL4) and from PE (34% in CL 1, 16% in CL 2, 24% in CL 3 and 28% in CL 4). A smaller proportion of the biomass eaten by ciliates came from SYN (21% in CL 1, 3% in CL 2, 15% in CL 3 and < 1% in CL 4). In general, within the picoplankton groups, HB and PROC were more exposed to HNF grazing (HB from 51% in CL 2 to 75% in CL 1 and PROC from 78% in CL 3 to 93% in CL 4), while PE was more exposed to ciliate grazing (from 88% in CL 2 to 94% in CL 4). Finally, SYN was more heavily grazed by HNF in CL 3 (65%) and by ciliates in the other three clusters (from 57 to 78%) (Supplementary Figure 5).
Preference in Prey Selection
The results of the normalized Manly-Chesson preference or selection index (alpha index) showed that HNF prefer consuming HB and PROC (Figure 7A). In CL 2 and CL 4, HNF consumed a higher proportion of HB than their proportion in the environment, consistent with the fact that HB was the major carbon source for HNF in these two clusters (Figure 6). Although the biomass of PROC was only a small fraction of the total picoplankton biomass consumed, HNF in all clusters except CL 4 showed a preference for PROC. HNF did not prefer SYN and PE, although the biomass of SYN accounted for a significant proportion of the picoplankton biomass consumed in CL 1 and CL 3. Ciliate preferences varied more among clusters. Ciliates preferred SYN in CL 1, HB and SYN in CL 2, PROC in CL 3 and HB, PE and HNF in CL 4 (Figure 7B).
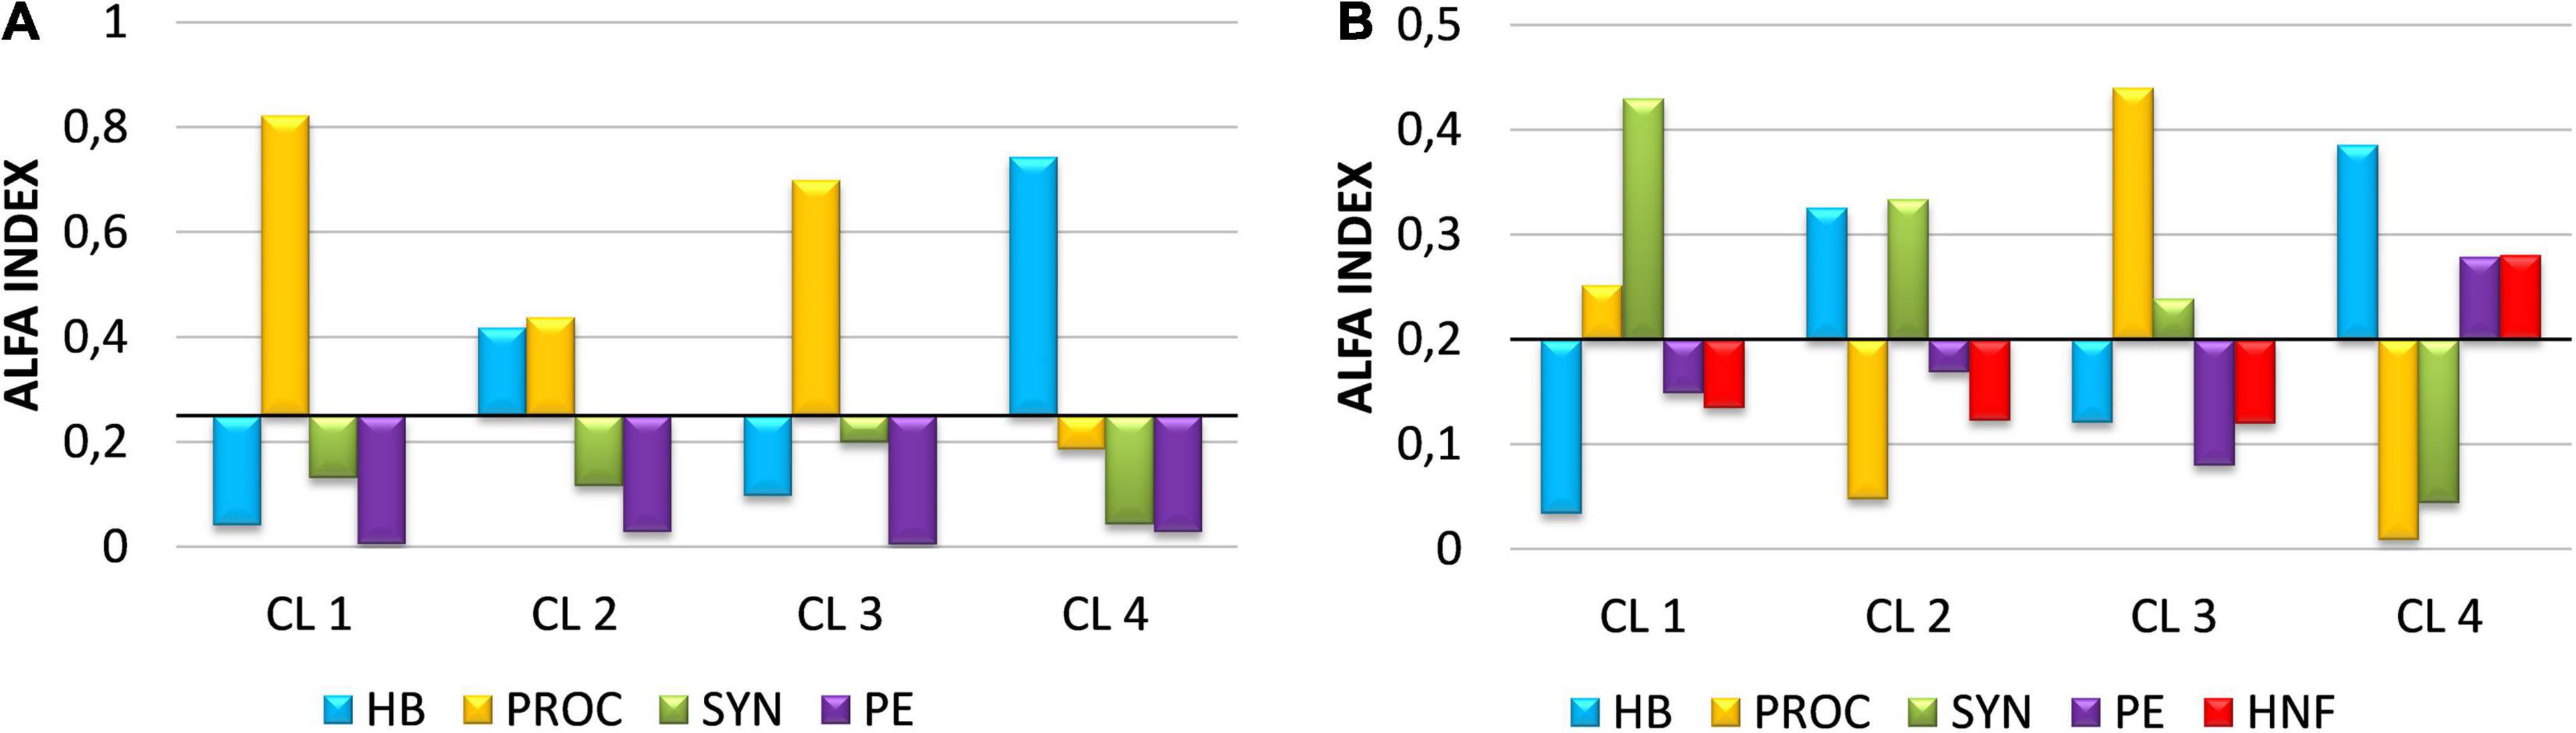
Figure 7. Manly-Chesson normalized alpha index showing preference or prey selection for HNF (A) and ciliates (B). HB, heterotrophic bacteria; PROC, Prochlorococcus; SYN, Synechococcus; PE, picoeukaryotes; HNF, heterotrophic nanoflagellates.
A statistically significant correlation between prey growth rates and alpha index (r = 0.765; p < 0.01) suggests that predator preference for particular prey is not, or not exclusively, related to their abundance/biomass, but to their growth rates, i.e., relative changes in their production (Supplementary Figure 6).
Strength of Predator-Prey Interaction
In general, the strength of interaction between ciliates and prey was greater than the strength of interaction between HNF and prey (Supplementary Figure 7). Furthermore, our results showed that the strength of interaction between predators (HNF and ciliates) and different prey groups varied depending on the clusters. HNF had the strongest interaction with PROC and SYN in CL1, with HB and PROC in CL 2 and with HB, PROC and SYN in CL 3. Interaction strengths were very low with PE in all clusters and with all prey groups in CL 4. Ciliates showed the strongest interaction with SYN in CL1, with HB and SYN in CL 2, with HB, PE and HNF in CL 4 and relatively similar moderate interaction strengths with all prey groups in CL 3. Analysis of the average strength of all trophic interactions within the MFW showed that CL 2 and CL 3 are characterized by a higher strength of interactions compared to CL 1 and CL 4 (Figure 8).
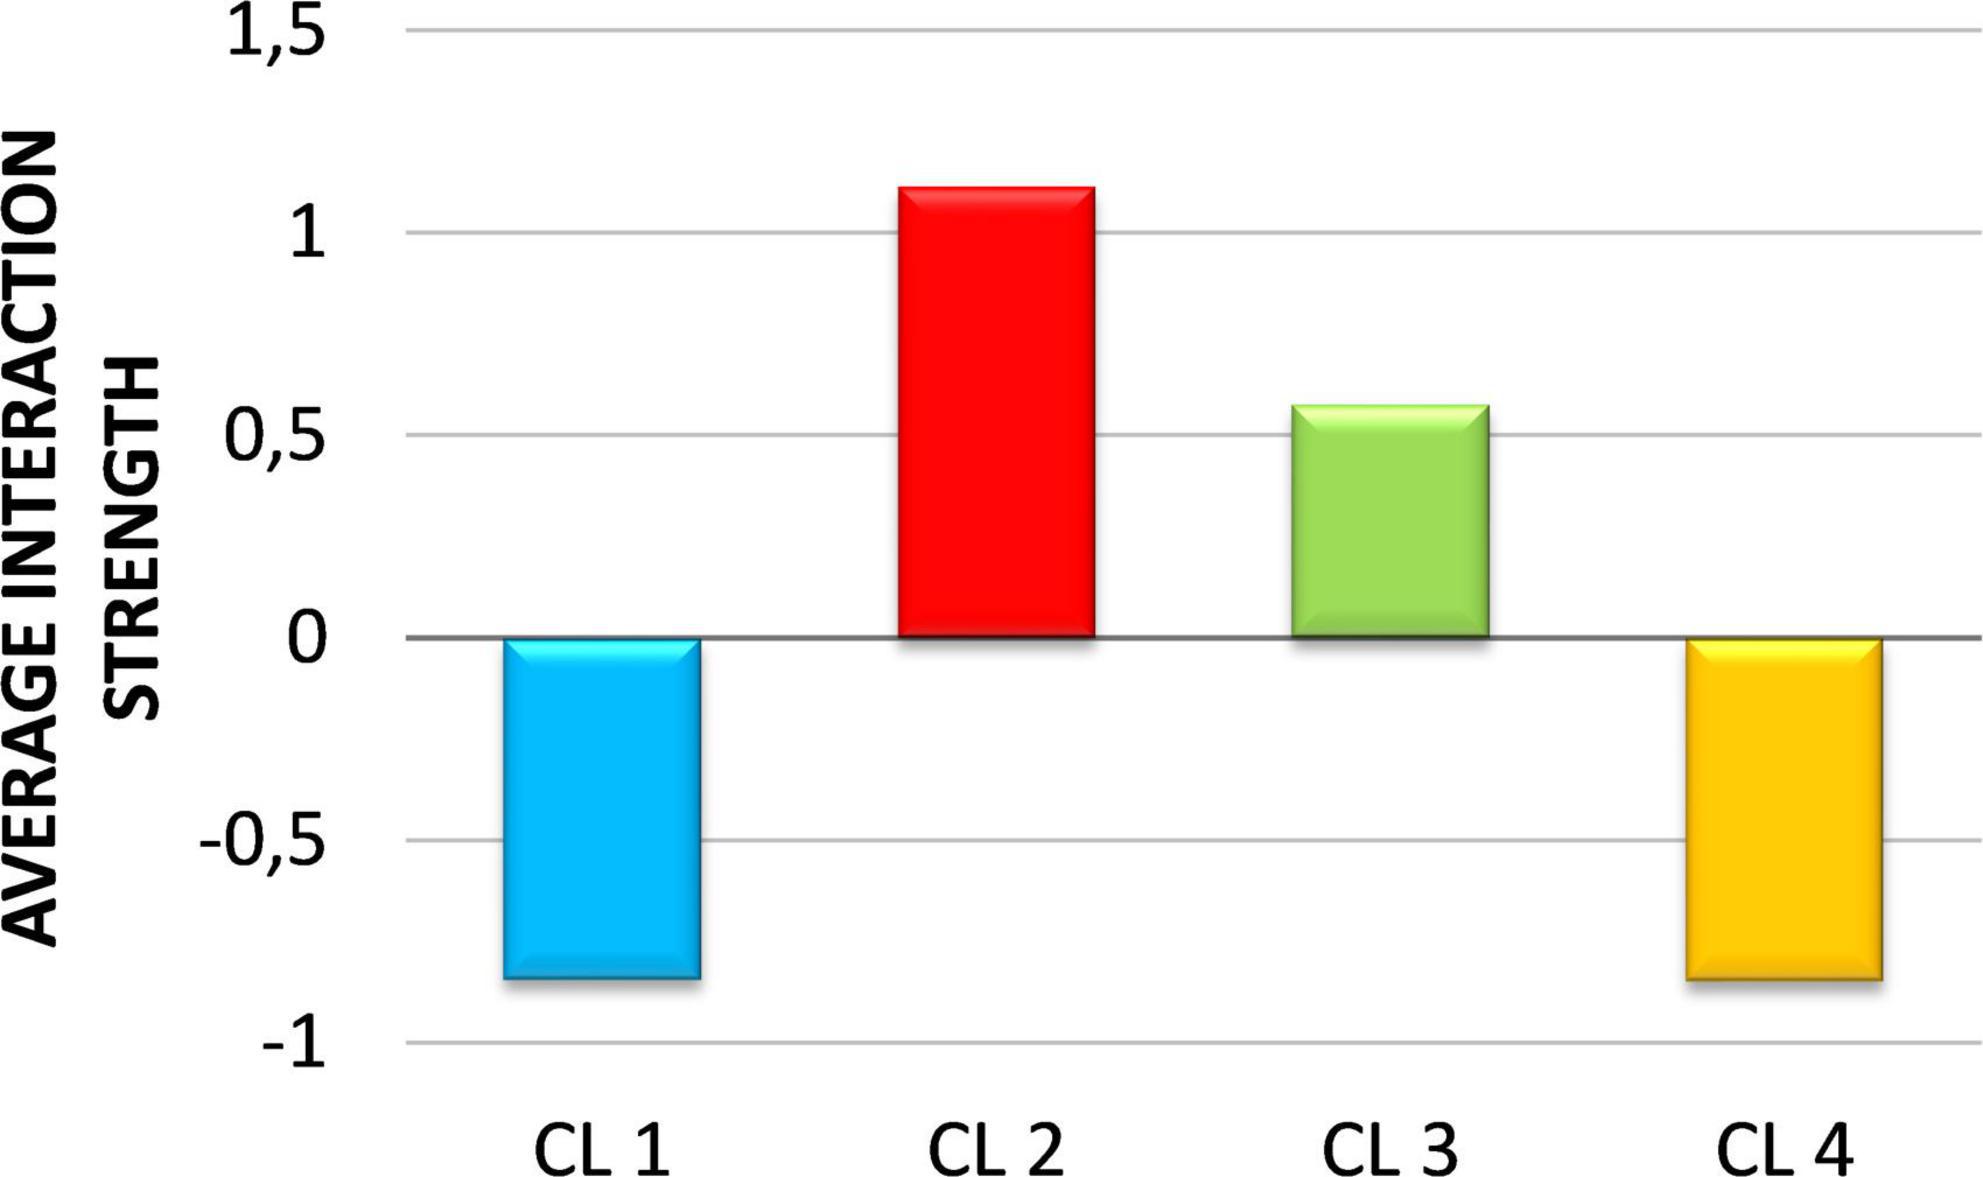
Figure 8. The average strength of all trophic interactions within the microbial food web in the four clusters. Values are standardized as z-scores.
Discussion
Analysis of the large number of environmental variables collected along spatial and temporal scales revealed distinct environmental conditions represented by clusters identified by Neural Gas (NG) analysis. The results showed that these ecological conditions are neither spatially nor temporally fixed, but rather that there is a very vigorous dynamic of change in ecological condition at both spatial and temporal scales. Moreover, each of the identified ecological conditions is characterized by a particular structure of the MFW, which also follows very strictly the changes in environmental conditions and adapts its structure to these changes. For a schematic representation of the characteristics of the four types of MFW and the prevailing environmental conditions under which they develop (see Figure 9). In the following, we will discuss the structural and functional features of MFW that are characteristic of particular ecological conditions.
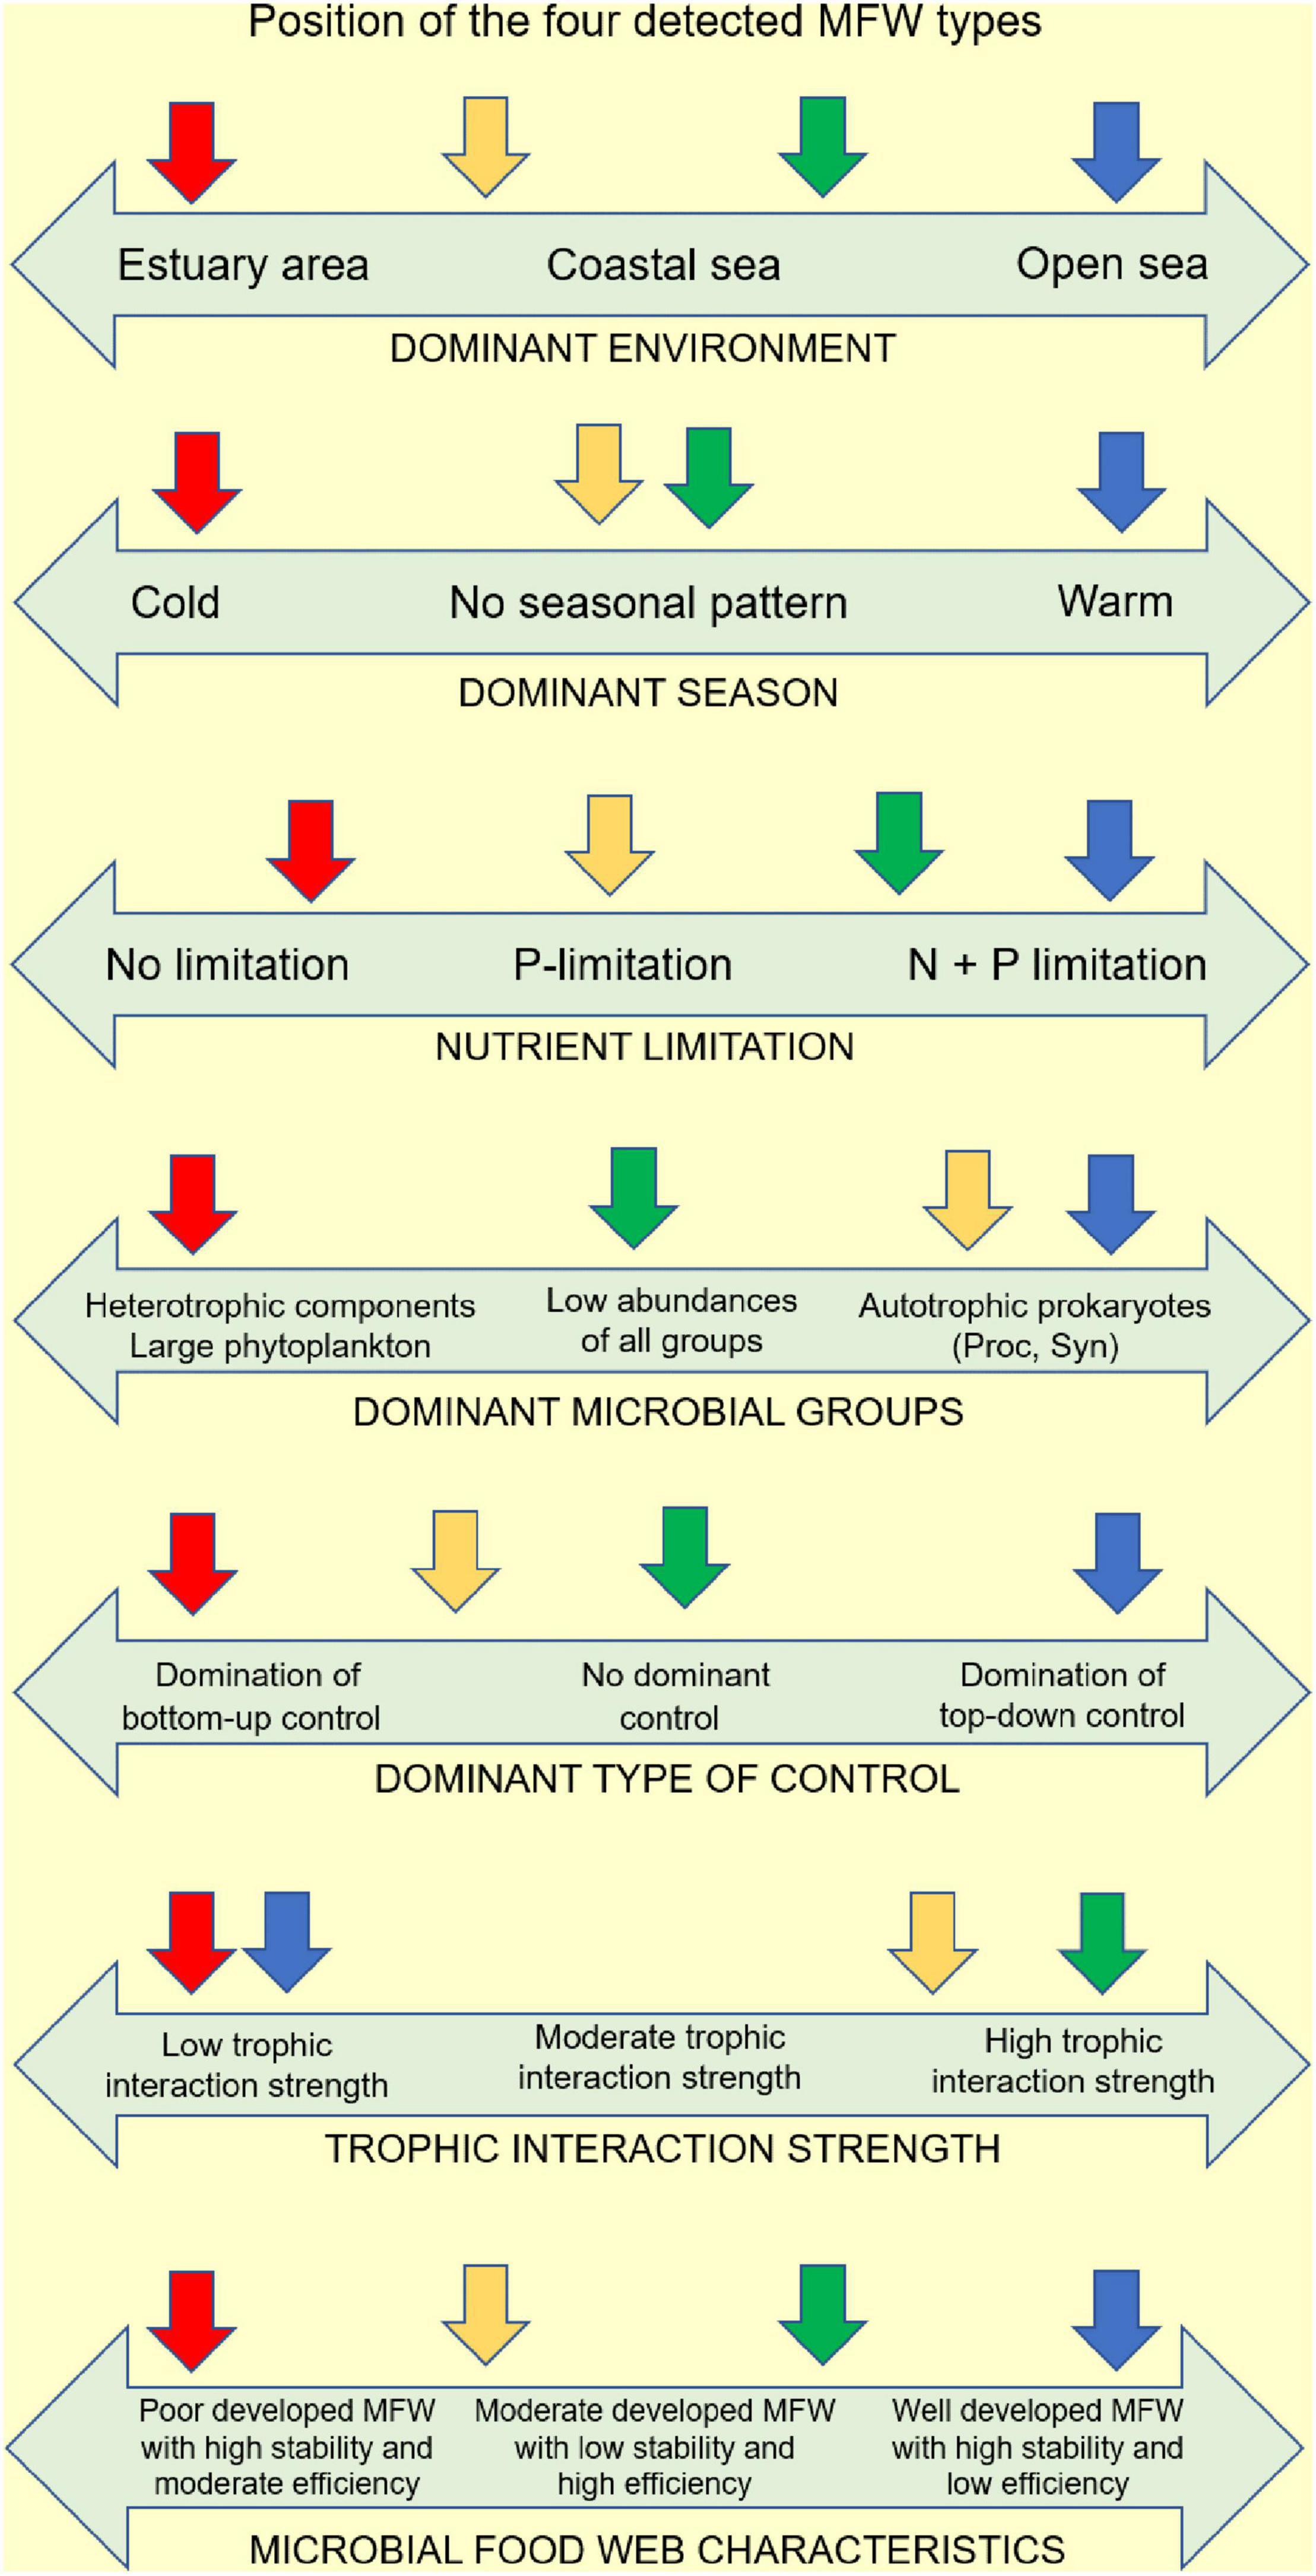
Figure 9. Schematic representation of the features of the four types of MFW and the prevailing environmental conditions in which they develop (CL 1, blue arrow; CL 2, green arrow; CL 3, yellow arrow; CL 4, red arrow).
Impact of Nutrients on the Structure of Microbial Food Web
The structural response of the MFW to environmental conditions is reflected in the dominance of the heterotrophic components and the larger fractions of the autotrophic groups (large phytoplankton and PE as the largest fraction of APP) in eutrophic CL 4, in contrast to the dominance of the prokaryotic part of the autotrophic picoplankton (cyanobacterial groups PROC and SYN) in oligotrophic CL 1. Previous study in the coastal Adriatic Sea has shown that the change from eutrophic to oligotrophic conditions was accompanied by an increase of APP to total Chl a from less than 40% to more than 60% in a relatively short time (Šolić et al., 2010). Agawin et al. (2000) showed that APP dominates biomass and production in oligotrophic, nutrient-poor waters (>50%), but accounts for only 10% of autotrophic biomass and production in nutrient-rich waters. It has been suggested that the lower contribution of APP in productive waters is due to increased loss rates, while the dominance of APP in oligotrophic waters has been attributed to the differential ability to utilize nutrients depending on differences in size and growth rates between APP and larger autotrophic cells (Marañon et al., 2003; Peréz et al., 2006). The availability of nutrients to primary producers and the resulting cell size composition of the plankton community therefore largely determines the nature of the food web (Cermeño et al., 2006). MFW-dominant systems correspond to low production of large phytoplankton and consequently low grazing by large zooplankton. This is the case in CL 1, where the flux of allochthonous nutrients (especially nitrate) is generally low and large autotrophic cells represent a small proportion of the total biomass. Regenerated nutrients (ammonium) favor the production of APP, leading to a dominance of MFW (Liu and Dagg, 2003). Furthermore, oligotrophic CL 1 had the highest proportion of LNA bacteria in the total abundance of HB. This could be explained by a better adaptation of these bacteria to oligotrophic conditions (Kjelleberg et al., 1993; Jochem et al., 2004).
The samples classified at CL 2 and CL 3 were predominantly from the coastal sea, were not seasonally biased, and covered a wide range of temperature and salinity. CL 2 is characterized by the dominance of allochthonous over regenerated nitrogen (high NO3–/NH4+ ratio), a feature it shares with CL 4, in contrast to CL 3, which is characterized by the dominance of regenerated nitrogen (low NO3–/NH4+ ratio) and shares this feature with CL 1. Increased NH4+ concentration may influence phytoplankton preference for NH4+ over NO3– and especially favor the production of APP (Liu and Dagg, 2003). Bacterial regeneration of NH4+ occurred under low DOC/DON conditions, which determine net bacterial excretion rather than NH4+ uptake (Legendre and Rassoulzadegan, 1995). Such conditions were found in spring in the Adriatic Sea (Šolić et al., 2020b). In this study, the changes in NH4+/NO3– ratio showed a very strong positive relationship with PROC and SYN in CL 1 and CL 3. Wafar et al. (2004) found that N uptake by APP was mainly supported by regenerated nitrogen originating from NH4+ (66%) and urea (17%). A strong preference of APP for a reduced form of nitrogen (NH4+) (Probyn et al., 1990; Selmer et al., 1993) is particularly evident in autotrophic prokaryotes (PROC and SYN). For example, Moore et al. (2002) reported that almost all isolates of PROC and SYN are restricted to NH4+ as a nitrogen source.
Our results showed that within APP, prokaryotic autotrophs (PROC and SYN) reached maximum values under P-limited conditions (CL 3), while PE reached higher biomasses under conditions not limited by phosphorus. In eutrophic transitional/estuarine waters (CL 4), the relative contribution of PROC and SYN decreased, consistent with Stockner’s (1988) model suggesting an increase in the biomass of APP and a decrease in their relative importance with an increase in phosphorus concentration in marine and freshwater systems. It is generally accepted that PROC is more abundant in oligotrophic waters (Partensky et al., 1999) and may not be present in low salinity waters (Jochem, 2003). On the other hand, PE is typically associated with higher trophic level environments (Jiao et al., 2002), while SYN has no consistent pattern. SYN has been described as a major component in oligotrophic environments (Callieri and Stockner, 2002), but also in coastal and estuarine waters, including nutrient-rich ecosystems (Phlips et al., 1999). The wide variability in the importance of SYN may be due to the fact that two groups of SYN have been identified in estuarine ecosystems—one rich in phycoerythrin and the other rich in phycocyanin (Wood et al., 1985; Šantić et al., 2018). Numerous studies suggest that phycocyanin-rich cells are only prevalent in low salinity waters, while phycoerythrin-rich cells dominate in higher salinity waters (Wang et al., 2011).
Prokaryotic vs. Eukaryotic Autotrophic Picoplankton Under Different Environmental Conditions
The biomass of SYN dominated the biomass of PROC in all four clusters, with the strongest dominance in CL 4 and the lowest in CL 3 (Supplementary Figure 8). The dominance of SYN biomass over PROC biomass was typically found in mesotrophic and eutrophic waters (Partensky et al., 1999), but the SYN biomass was also found to dominate the PROC biomass in P-depleted environments, as reported in the literature for northern and central Adriatic Sea (Radić et al., 2009) and the Mediterranean Sea (Llabrés et al., 2010). Regardless of the differences in abundance and biomass, PROC and SYN showed a positive relationship in this study, indicating their identical response to environmental conditions.
In the eutrophic CL 4, PE strongly dominated over the prokaryotic cyanobacteria (CB) and accounted for 82% of the total APP biomass, whereas the contribution of CB to the total APP biomass was highest in CL 1 and CL 3 (almost 50%), clusters with low NO3–/NH4+ ratios (Supplementary Figure 8). The dominance of PE in the whole APP is consistent with the fact that PE are highly successful in environments that are not limited by nutrients (Radić et al., 2009). Calvo-Díaz and Morán (2006) found that the proportion of CB in the total number of APP cells increased in nutrient-poor waters. Due to the smaller cells, CB might have an advantage over larger eukaryotic cells in the uptake of nutrients. Therefore, the inverse relationship of PROC and SYN to PE seems to be a general feature along trophic gradients (DuRand and Olson, 2001; Zhang et al., 2008). In addition, the CB/PE ratio in the northwest Mediterranean Sea decreased with increasing NO3– influx (Mouriño-Carballido et al., 2016), indicating the ability of CB to survive under nutrient-poor conditions (Mary et al., 2008). This is also supported by the results of Calvo-Díaz and Morán (2006), who found that CB/PE ratio decreased with increasing phosphate concentration and CB reached its abundance maximum in P-depleted waters.
Impact of Temperature on the Structure of Microbial Food Web
Control of MFW structure and function is also influenced by temperature and the interaction between nutrients and temperature. The availability of resources and their demand by organisms regulates the growth and abundance of populations within the food web (Sterner and Elser, 2002). Temperature, in turn, controls metabolic rates such as production, growth rate, growth efficiency, and grazing rate (Gillooly et al., 2001). In addition, temperature affects complex microbial trophic interactions and alters the topology of the food web, including predator preferences for prey selection, meeting predator carbon requirements, overlap of food niches among predators (i.e., competition for prey), the strength of trophic interactions, the flux of carbon biomass through the MFW, and changes in size structure within microbial groups, which may consequently affect the relative importance of BU and TD control and the potential for cascading effects (Petchey et al., 1999).
In the eutrophic CL 4, most groups within the MFW showed a strong positive correlation with temperature, whereas in the oligotrophic CL 1, this relationship was mostly absent and some groups showed a negative relationship with temperature. These two clusters are seasonally biased, with CL 1 collecting samples from the warmer season (the average temperature in CL 1 was about 20°C) and CL 4 collecting samples from the colder season (the average temperature in CL 1 was about 15°C). Previous studies in the Adriatic Sea have shown that the positive effect of temperature on HB was high at temperatures below 16°C and leveled off at higher temperatures (Šolić et al., 2017). Similar non-linear responses of bacterial growth to temperature, showing a greater positive effect at lower temperatures followed by a plateau or even decline at higher temperatures, have been reported for various marine and freshwater environments (Felip et al., 1996; Pomeroy and Wiebe, 2001). The increase in feeding rate with temperature is generally weaker than that of respiration (Rivkin and Legendre, 2001; Apple et al., 2006). This suggests that warming should result in net energy losses, which could explain the decline in population densities with warming, especially under conditions where temperature is already high, as in CL 1.
Impact of the Interaction Between Temperature and Nutrients on the Structure of Microbial Food Web
An additional explanation for the different influence of temperature on MFW groups between CL 1 and CL 4 are the different trophic conditions in these two clusters with oligotrophic CL 1 and eutrophic CL 4. Therefore, this result is supported by the study of Morán et al. (2018), who found that the increase in temperature stimulates growth only under conditions with sufficient nutrients. This is also supported by the study of Huete-Stauffer et al. (2015) who reported that high nutrient concentrations consistently elicited positive responses of heterotrophic prokaryote growth to temperature during the cooler period, while this response was weaker under the warm, nutrient-limited conditions of summer and early autumn. In addition, Thingstad and Aksnes (2019) suggested low-temperature sensitivity of microbial food web dynamics in nutrient-poor conditions due to diffusion-limited nutrient uptake. An experimental study in the Adriatic Sea showed that the increase in growth rates of autotrophic picoplankton (PROC and SYN) due to an increase in temperature was also observed in summer after the addition of phosphorus (Šolić et al., 2019).
Relative Importance of Bottom-Up and Top-Down Control of Heterotrophic Bacteria Under Different Environmental Conditions
Structural changes in the pelagic food web may lead to shifts in BU and TD control of some groups of microorganisms. The BU control refers to the limitation of microorganisms by resources, and the TD regulation refers to the limitation of microorganisms below a level that can be supported by resources alone, due to predation and/or limitation by temperature. In eutrophic CL 4, bacteria were dominantly under the phytoplankton-mediated BU control whereas HNF were dominantly controlled by ciliate grazing (TD control). In contrast, in oligotrophic CL 1, strong TD control of bacteria by dominantly HNF grazing was observed. At the same time, HNF were spared from strong ciliate predation pressure because the ciliates apparently switched their dominant prey from HNF to other prey groups (especially PE and SYN). Several studies with very large data sets conducted over a wide range of aquatic environments indicate that bacteria appear to be more BU controlled in eutrophic systems and more TD controlled in oligotrophic systems (Billen et al., 1990; Gasol et al., 2002). However, the importance of BU and TD regulation of bacteria can vary seasonally (Ducklow, 1992; Šolić et al., 1998) and even daily (Psenner and Sommaruga, 1992). Therefore, it appears that switching between two types of control follows changes in environmental conditions that occur at both spatial and temporal scales (Šolić et al., 2009).
Grazing and Carbon Biomass Flux Under Different Environmental Conditions
MFW can be considered as a tritrophic food chain with omnivory, in which a top predator (CIL) eats both consumers (HNF) and resources (all picoplankton groups) that take up nutrients. However, these simple trophic rules partially disrupt the broad size spectrum within the main groups of predators (especially within CIL), making it possible to create predator-prey relationships within these groups (intraguild predation) (Bojanić et al., 2005, 2006). In addition, the trophic interactions between HNF and CIL are complex. Since both plankton groups are sympatric predators of picoplankton prey, one might expect strong competition between them (Jezbera et al., 2003). The role of omnivory (top predator also feeds on the resource) for the stability of the food web is still a matter of discussion. While some earlier studies have suggested that omnivory destabilizes food webs (Pimm and Lawton, 1978), more recent studies have shown the opposite results (Fagan, 1997; McCann and Hastings, 1997).
The diet of HNF in CL 4 and CL 2 was predominantly focused on HB, whereas in CL 1 and CL 3 it was far more diverse, with a significant proportion of PROC and SYN in the total grazing. The diet of CIL was generally more diverse than that of HNF, but it also showed greater diversity in CL 1 and CL 3 compared to the other two clusters. However, the preference in prey choice in HNF and CIL did not fully coincide with grazing. The proportion of grazing seemed to depend more on the abundance of the individual group, while prey choice correlated more with the growth rate of the individual group. This result is also supported by experimental results (Šolić et al., 2020a).
CIL can exert powerful control on the picoplankton community, both through direct grazing and trophic cascading (Calbert et al., 2001). Indeed, incorporation of picoplankton carbon biomass into CIL occurs in two ways: via direct grazing of picoplankton prey and indirectly through grazing of HNF. The direct pathway dominated in CL 2 and CL 3 (over 80% of carbon biomass was taken up by direct grazing). In contrast, the indirect pathway via HNF increased significantly in CL 1 and CL 4 (about 50% of carbon biomass was consumed indirectly). Therefore, the efficiency of carbon transfer from picoplankton to CIL will be higher in CL 2 and CL 3. These results suggest that CIL are important predators not only of HNF and picoplankton groups with larger cells (PE), but also of picoplankton groups with smaller cells (PROC and SYN). This is consistent with studies reporting a greater impact of CIL than HNF on picoplankton prey (Zingel et al., 2007; Zoccarato and Fonda Umani, 2015). One possible explanation for the high grazing influence of CIL on picoplankton prey is the change in community size structure of CIL to better adapt to the consumption of faster growing picoplankton groups with smaller cells (Šolić et al., 2020a).
Predator-Prey Interaction Strength Under Different Environmental Conditions
The strength of the interaction, which can be viewed as the rate of biomass flow between prey and predators (e.g., functional per capita response), is an important functional characteristic of MFW that can significantly affect the flow of matter and energy along the food chain. In general, many weak interactions and few strong interactions contribute to system stability (May, 1973; McCann et al., 1998; Berlow, 1999; Kokkoris et al., 1999) because weak interactions effectively mitigate the effects of strong destabilizing interactions in the community. In other words, weak interactions ensure that predators consume their prey at low levels when their abundance is low. On the other hand, the simultaneous occurrence of strong interactions at two successive levels of a trophic chain can alter the structure and dynamics of the entire food web through trophic cascades (Shurin et al., 2002). The distribution of average interaction strength within MFW along clusters indicates a more stable MFW topology in CL 1 and CL 4 compared to CL 2 and CL 3. CL 2 had the highest average interaction strength, for which strong HNF-HB and HNF-PROC interactions and the greater role of direct CIL grazing of picoplankton prey compared to the indirect pathway via HNF are largely responsible. This suggests greater competition and food-niche overlap between HNF and CIL in CL 2 and CL 3. The lowest average interaction strengths in CL 4 and CL 1 are the result of low interactions between HNF and all prey groups and the much greater importance of the flow of picoplankton biomass to CIL indirectly via HNF (especially in CL 4).
It can be concluded that more stable MFW variants develop under the environmental conditions presented by CL 1 and CL 4. In the case of CL 1, it is a well-developed MFW characterized by low efficiency of matter and energy flow along trophic levels, but with greater stability characterized by a greater diversity of trophic interactions with lower average strength. CL 4 also represents a more stable form of MFW that, unlike CL 1, is characterized by less overlap of feeding niches between HNF and CIL and a higher proportion of picoplankton biomass incorporated in CIL that has previously passed through HNF. In contrast, CL 2 and CL 3 are characterized by higher average interaction strengths, lower trophic pathway diversity, greater niche overlap between HNF and CIL, and more pronounced omnivory in CIL (higher proportion of direct picoplankton grazing). These characteristics make these MFW variants more efficient in terms of carbon and energy flow through the food chain, but at the same time less stable.
Data Availability Statement
The original contributions presented in the study are included in the article/Supplementary Material, further inquiries can be directed to the corresponding author/s.
Author Contributions
MŠ was responsible for conceptualization, data analysis and writing. DŠ and SŠ were responsible for formal analysis of microbiological data, proofreading, and editing of the manuscript. AV and SJ were responsible for microbial data collection and grazing experiments performing. NB and ŽN were responsible for phytoplankton and zooplankton data collection and analysis. GK was responsible for chemical data collection and analysis. FM was responsible for physical data collection and Neural Gas analysis. All authors contributed to the article and approved the submitted version.
Funding
This research was supported by the Croatian Science Foundation as part of research projects: UIP-2019-04-8401 “Ecology of the Aerobic Anoxygenic Phototrophs in the Adriatic Sea” (ADRISAAF) and IP-2018-01-9849 “Middle Adriatic Upwelling and Downwelling” (MAUD).
Conflict of Interest
The authors declare that the research was conducted in the absence of any commercial or financial relationships that could be construed as a potential conflict of interest.
Publisher’s Note
All claims expressed in this article are solely those of the authors and do not necessarily represent those of their affiliated organizations, or those of the publisher, the editors and the reviewers. Any product that may be evaluated in this article, or claim that may be made by its manufacturer, is not guaranteed or endorsed by the publisher.
Supplementary Material
The Supplementary Material for this article can be found online at: https://www.frontiersin.org/articles/10.3389/fmars.2021.811155/full#supplementary-material
References
Agawin, N. S., Duarte, C. M., and Agusti, S. (2000). Nutrient and temperature control of the contribution of picoplankton to phytoplankton biomass and production. Limnol. Oceanogr. 45, 591–600. doi: 10.2307/2670836
Apple, J. K., Del Giorgio, P. A., and Kemp, W. M. (2006). Temperature regulation of bacterial production, respiration, and growth efficiency in a temperate salt-marsh estuary. Aquat. Microb. Ecol. 43, 243–254. doi: 10.3354/AME043243
Bascompte, J., Melián, C. J., and Sala, E. (2005). Interaction strength combinations and the overfishing of a marine food web. Proc. Natl. Acad. Sci. U.S.A. 102, 5443–5447. doi: 10.1073/pnas.0501562102
Berglund, J., Müren, U., Båmstedt, U., and Andersson, A. (2007). Efficiency of a phytoplankton-based and a bacteria-based food web in a pelagic marine system. Limnol. Oceanogr 52, 121–131. doi: 10.2307/40006067
Berlow, E. L. (1999). Strong effects of weak interactions in ecological communities. Nature 398, 330–334. doi: 10.1038/18672
Berninger, U.-G., Finlay, B., and Kuuppo-Leinikki, P. (1991). Protozoan control of bacterial abundances in freshwater. Limnol. Oceanogr. 46, 730–739. doi: 10.4319/lo.1991.36.1.0139
Billen, G., Servais, P., and Becquevort, S. (1990). Dynamics of bacterioplankton in oligotrophic and eutrophic aquatic environments: bottom-up or top-down control? Hydrobiologia 207, 37–42. doi: 10.1007/BF00041438
Bojanić, N., Šolić, M., Krstulović, N., Šestanović, S., Marasović, I., and Ninèević, Ž (2005). Temporal variability in abundance and biomass of ciliates and copepods in the eutrophicated part of Kaštela Bay (Middle Adriatic Sea). Helgol. Mar. Res. 59, 107–120. doi: 10.1007/s10152-004-0199-x
Bojanić, N., Šolić, M., Krstulović, N., Šestanović, S., Ninèević Gladan, Ž, Marasović, I., et al. (2006). The role of ciliates within the microbial food web in the eutrophicated part of Kaštela Bay (middle Adriatic Sea). Sci. Mar. 70, 431–442. doi: 10.3989/SCIMAR.2006.70N3431
Borsheim, K. Y., and Bratbak, G. (1987). Cell volume to cell carbon conversion factors for a bacteriovorous Monas sp. Enriched from seawater. Mar. Ecol. Prog. Ser. 36, 171–175. doi: 10.3354/meps036171
Brzezinski, M. A. (1985). The Si:C:N ratio of marine diatoms: interspecific variability and the effect of some environmental variables. J. Phycol. 21, 347–357. doi: 10.1111/j.0022-3646.1985.00347.x
Buitenhuis, E. T., Li, W. K. W., Vaulot, D., Lomas, M. W., Landry, M., Partensky, F., et al. (2012). Picophytoplankton biomass distribution in the global ocean. Earth Syst. Sci. Data 4, 37–46. doi: 10.5194/essdd-5-221-2012
Buljan, M., and Zore-Armanda, M. (1976). Oceanographic properties of the Adriatic Sea. Oceanogr. Mar. Biol. 14, 11–98.
Calbert, A., Landry, M. R., and Ninnery, S. (2001). Bacteria-flagellate interactions in the microbial food web of the oligotrophic subtropical North Pacific. Aquat. Microb. Ecol. 23, 283–292. doi: 10.3354/ame023283
Callieri, C., and Stockner, J. G. (2002). Freshwater autotrophic picoplankton: a review. J. Limnol. 61, 1–14. doi: 10.4081/jlimnol.2002.1
Calvo-Díaz, A., and Morán, X. A. G. (2006). Seasonal dynamics of picoplankton in shelf waters of the southern Bay of Biscay. Aquat. Microb. Ecol. 42, 159–174. doi: 10.3354/ame042159
Cermeño, P., Marañon, E., Péres, V., Serret, P., Fernández, E., and Castro, C. G. (2006). Phytoplankton size structure and primary production in a highly dynamic ecosystem (Rja de Vigo, NW-Spain): seasonal and short-time scale variability. Estuar. Coast. Shelf Sci. 67, 251–266. doi: 10.1016/j.ecss.2005.11.027
Chesson, J. (1978). Measuring preference in selective predation. J. Anim. Ecol. 47, 805–816. doi: 10.2307/1936364
Chesson, J. (1983). The estimation and analysis of preference and its relationship to foraging models. Ecology 64, 1297–1304. doi: 10.2307/1937838
Christaki, U., Courties, C., Massana, R., Catala, P., Lebaron, P., Gasol, J. M., et al. (2011). Optimized routine flow cytometric enumeration of heterotrophic flagellates using SYBR Green I. Limnol. Oceanogr. Methods 9, 329–339. doi: 10.4319/lom.2011.9.329
Cotner, J. B., and Biddanda, B. A. (2002). Small players, large role: microbial influence on biogeochemical processes in pelagic aquatic ecosystems. Ecosystems 5, 105–121. doi: 10.1007/s10021-001-0059-3
de Bolt, E., Cottrell, M., and Verleysen, M. (2002). Statistical tools to assess the reliability of self-organising maps. Neural Netw. 15, 967–978. doi: 10.1016/s0893-6080(02)00071-0
Ducklow, H. W. (1992). Factors regulating bottom-up control of bacteria biomass in open ocean plankton communities. Arch. Hydrobiol. Beih. Ergebn. Limnol. 37, 207–217.
DuRand, M. D., and Olson, R. J. (2001). Phytoplankton population dynamics at the Bermuda Atlantic time-series station in the Sargasso Sea. Deep Sea Res 2 Top. Stud. Oceanogr. 48, 1983–2003. doi: 10.1016/S0967-0645(00)00166-1
Fagan, W. F. (1997). Omnivory as a stabilizing feature of natural communities. Am. Nat. 150, 554–567. doi: 10.1086/286081
Felip, M., Pace, M. L., and Cole, J. J. (1996). Regulation of planktonic bacterial growth rates: the effect of temperature and resources. Microb. Ecol. 31, 15–28. doi: 10.1007/BF00175072
Finlay, K., and Roff, J. C. (2004). Radiotracer determination of the diet of calanoid copepod nauplii and copepodites in a temperate estuary. ICES J. Mar. Sci. 61, 552–562. doi: 10.1016/j.icesjms.2004.03.010
Fuhrman, J. A., and Azam, F. (1982). Thymidine incorporation as a measure of heterotrophic bacterioplankton production in marine surface waters: evaluation and field results. Mar. Biol. 66, 109–120. doi: 10.1007/BF00397184
Gasol, J. M., Pedrós-Alió, C., and Vaqué, D. (2002). Regulation of bacterial assemblages in oligotrophic plankton systems: results from experimental and empirical approaches. Antonie Van Leeuwenhoek 81, 435–452. doi: 10.1023/a:1020578418898
Gasol, J. M., and Vaqué, D. (1993). Lack of coupling between heterotrophic nanoflagellates and bacteria: a general phenomenon across aquatic systems? Limnol. Oceanogr. 38, 657–665.
Gillooly, J. F., Brown, J. H., West, G. B., Savage, V. M., and Charnov, E. L. (2001). Effects of size and temperature on metabolic rate. Science 293, 2248–2251. doi: 10.1126/science.1061967
Goldman, J. C., and Gilbert, P. M. (1983). “Kinetics of inorganic nitrogen uptake by phytoplankton,” in Nitrogen in Marine Environments, eds E. J. Carpenter and D. G. Capone (New York, NY: Academic Press), 233–274.
Huete-Stauffer, T. M., Arandia-Gorostidi, N., Diaz-Perez, L., and Morán, X. A. G. (2015). Temperature dependences of growth rates and carrying capacities of marine bacteria depart from metabolic theoretical predictions. FEMS Microb. Ecol. 91:fiv111. doi: 10.1093/femsec/fiv111
Jansson, M., Blomquist, P., Jonsson, A., and Bergstrom, A. K. (1996). Nutrient limitation of bacterioplankton, autotrophic and mixotrophic phytoplankton, and heterotrophic nanoflagellates in Lake Ortrasket. Limnol. Oceanogr. 41, 1552–1559. doi: 10.4319/lo.1996.41.7.1552
Jezbera, J., Nedoma, J., and Šimek, K. (2003). Longitudinal changes in protistan bacterivory and bacterial production in two canyon-shaped reservoirs of different trophic status. Hydrobiologia 504, 115–130. doi: 10.1023/B:HYDR.0000008502.31554.ef
Jiao, N. Z., Yang, Y. H., Koshikawa, H., and Watanabe, M. (2002). Influence of hydrographic conditions on picoplankton distribution in the East China Sea. Aquat. Microb. Ecol. 30, 37–48. doi: 10.3354/ame030037
Jochem, F. J. (2003). Photo- and heterotrophic pico- and nanoplankton in the Mississippi River Plume: distribution and grazing activity. J. Plankton Res. 25, 1201–1214. doi: 10.1093/plankt/fbg087
Jochem, F. J., Lavrentyev, P. J., and First, M. R. (2004). Growth and grazing rates of bacteria groups with different apparent DNA content in the Gulf of Mexico. Mar. Biol. 145, 1213–1225. doi: 10.1007/s00227-004-1406-7
Justić, D., Rabalais, N. N., Turner, R. E., and Dortch, Q. (1995). Changes in nutrient structure of river dominated coastal waters: stoichiometric nutrient balance and its consequences. Estuar. Coast. Shelf Sci. 50, 339–356. doi: 10.1016/S0272-7714(05)80014-9
Kirchman, D. L., Kell, R. G., Simon, M., and Welschmeyer, N. A. (1993). Biomass and production of heterotrophic bacterioplankton in the oceanic subarctic Pacific. Deep Sea Res. I 40, 967–988. doi: 10.1016/0967-0637(93)90084-G
Kjelleberg, S., Albertson, N., Flaerdh, K., Holmquist, L., Jouper-Jaan, A., Marouga, R., et al. (1993). How do non-differentiating bacteria adapt to starvation? Antonie Van Leeuwenhoek 63, 333–341. doi: 10.1007/BF00871228
Kohonen, T. (1982). Self-organized information of topologically correct features maps. Biol. Cybern. 43, 59–69. doi: 10.1007/BF00337288
Kokkoris, G. D., Troumbis, A. Y., and Lawton, J. H. (1999). Patterns of species interaction strength in assembled theoretical competition communities. Ecol. Lett. 2, 70–74. doi: 10.1046/J.1461-0248.1999.22058.X
Krebs, J. C. (2009). Ecology: The Experimental Analysis of Distribution and Abundance, 6th Edition. (San Francisco: Benjamin Cummings).
Landry, M. R., and Hassett, R. P. (1982). Estimating the grazing impact of marine microzooplankton. Mar. Biol. 67, 283–288. doi: 10.1007/BF00397668
Lassalle, G., Lobry, J., Le Loc’h, F., Bustamante, P., Certain, G., Delmas, D., et al. (2011). Lower trophic levels and detrital biomass control the Bay of Biscay continental shelf food web: implications for ecosystem management. Prog. Oceanogr. 91, 561–575.
Lee, S., and Fuhrman, J. A. (1987). Relationships between biovolume and biomass of naturally derived marine bacterioplankton. Appl. Environ. Microb. 53, 1298–1303. doi: 10.1128/AEM.53.6.1298-1303.1987
Legendre, L., and Rassoulzadegan, F. (1995). Plankton and nutrient dynamics in marine waters. Ophelia 41, 153–172. doi: 10.1080/00785236.1995.10422042
Liu, H., and Dagg, M. (2003). Interactions between nutrients, phytoplankton growth, and micro- and mesozooplankton grazing in the plume of the Mississippi River. Mar. Ecol. Prog. Ser. 258, 31–42. doi: 10.3354/meps258031
Llabrés, M., Agustí, S., Alonso-Laita, P., and Herndl, G. J. (2010). Synechococcus and Prochlorococcus cell death induced by UV radiation and the penetration of lethal UVR in the Mediterranean Sea. Mar. Ecol. Prog. Ser. 399, 27–37. doi: 10.3354/meps08332
Magazzù, G., and Decembrini, F. (1995). Primary production, biomass and abundance of phototrophic picoplankton in the Mediterranean Sea: a review. Aquat. Microb. Ecol. 9, 97–104. doi: 10.3354/ame009097
Manly, B. F. J. (1974). A model for certain types of selection experiments. Biometrics 30, 281–294. doi: 10.2307/2529649
Marañon, E., Behrenfeld, M. J., Gonzalez, N., Mourino, B., and Zubkov, M. V. (2003). High variability of primary production in oligotrophic waters of the Atlantic Ocean: uncoupling from phytoplankton biomass and size structure. Mar. Ecol. Prog. Ser. 257, 1–11. doi: 10.3354/meps257001
Marie, D., Brussaard, C., Partensky, F., and Vaulot, D. (1999). “Flow cytometric analysis of phytoplankton, bacteria and viruses,” in Current Protocols in Cytometry, eds J. P. Robinson, Z. Darzynkiewicz, P. Dean, A. Orfao, and P. Rabinovitch (Hoboken, NJ: John Wiley & Sons, Inc.), 11.11.1–11.11.15.
Marie, D., Partensky, F., Jacquet, S., and Vaulot, D. (1997). Enumeration and cell cycle analysis of natural populations of marine picoplankton by flow cytometry using the nucleic acid stain SYBR Green I. Appl. Environ. Microb. 63, 186–193. doi: 10.1128/aem.63.1.186-193.1997
Martinetz, T., Berkovich, S. G., and Schulten, K. J. (1993). “Neural-gas” network for vector quantization and its application to time-series prediction. IEEE Trans. Neural Netw. 4, 558–569. doi: 10.13140/RG.2.1.2374.8887
Martinetz, T., and Schulten, K. (1991). A “Neural Gas” Network Learns Topologies. Artificial Neural Networks. Amsterdam: Elsevier, 397–402.
Mary, I., Tarran, G. A., Warwick, P. E., Terry, M. J., Scanlan, D. J., Burkill, P. H., et al. (2008). Light enhanced amino acid uptake by dominant bacterioplankton groups in surface waters of the Atlantic Ocean. FEMS Microb. Ecol. 63, 36–45. doi: 10.1111/j.1574-6941.2007.00414.x
Matić, F., Kalinić, H., and Vilibić, I. (2018). Interpreting self-organizing map errors in the classification of ocean pattern. Comput. Geosci. 119, 9–17. doi: 10.1016/j.cageo.2018.06.006
May, R. M. (1973). Stability and Complexity in Model Ecosystems. Princeton, NJ: Princeton University Press.
McCann, K., and Hastings, A. (1997). Re-evaluating the omnivory-stability relationship in food webs. Proc. R. Soc. Lond. Ser. B 264, 1249–1254. doi: 10.1098/rspb.1997.0172
McCann, K., Hastings, A., and Huxel, G. R. (1998). Weak trophic interactions and the balance of nature. Nature 395, 794–798. doi: 10.1038/27427
Moore, L. R., Post, A. F., Rocap, G., and Chisholm, S. W. (2002). Utilization of different nitrogen sources by the marine cyanobacteria Prochlorococcus and Synechococcus. Limnol. Oceanogr. 47, 989–996. doi: 10.4319/lo.2002.47.4.0989
Morán, X. A. G., Calvo-Díaz, A., Arandia-Gorostidi, N., and Huete-Stauffer, T. M. (2018). Temperature sensitivities of microbial plankton net growth rates are seasonally coherent and linked to nutrient availability. Environ. Microbiol. 20, 3798–3810. doi: 10.1111/1462-2920.14393
Mouriño-Carballido, B., Hojas, E., Cermeño, P., Chouciño, P., Fernández-Castro, B., Latasa, M., et al. (2016). Nutrient supply controls picoplankton community structure during three contrasting seasons in the north-wastern Mediterranean Sea. Mar. Ecol. Prog. Ser. 543, 1–19. doi: 10.3354/meps11558
Partensky, F., Blanchot, J., and Vaulot, D. (1999). Differential distribution and ecology of Prochlorococcus and Synechococcus in oceanic waters: a review. Bull. Inst. Océanogr. 19, 457–475.
Peréz, V., Fernandez, E., Marañon, E., Moran, X. A. G., and Zubkov, M. V. (2006). Vertical distribution of phytoplankton biomass, production and growth in the Atlantic subtropical gyres. Deep Sea Res. I 53, 1616–1634. doi: 10.1016/j.dsr.2006.07.008
Perry, M. J., and Eppley, R. W. (1981). Phosphate uptake by phytoplankton in the central North Pacific Ocean. Deep Sea Res. 28, 39–49. doi: 10.1016/0198-0149(81)90109-6
Persson, J., Wojewodzic, M. W., Hessen, D. O., and Andersen, T. (2011). Increased risk of phosphorus limitation at higher temperatures for Daphnia magna. Oecologia 165, 123–129. doi: 10.1007/s00442-010-1756-4
Petchey, O. L., McPhearson, P. T., Casey, T. M., and Morin, P. J. (1999). Environmental warming alters food-web structure and ecosystem function. Nature 402, 69–72. doi: 10.1038/47023
Phlips, E. J., Badylak, S., and Lynch, T. C. (1999). Blooms of the picoplanktonic cyanobacterium Synechococcus in Florida Bay, a subtropical inner-shelf lagoon. Limnol. Oceanogr. 44, 1166–1175. doi: 10.4319/lo.1999.44.4.1166
Pimm, S. L., and Lawton, J. H. (1978). Feeding on more than one trophic level. Nature 275, 542–544. doi: 10.1038/275542a0
Pinhassi, J., Gómez-Consarnau, L., Alonso-Sáez, L., Sala, M. M., Vidal, M., Pedrós-Alió, C., et al. (2006). Seasonal changes in bacterioplankton nutrient limitation and their effects on bacterial community composition in the NW Mediterranean Sea. Aquat. Microb. Ecol. 44, 241–252. doi: 10.1128/AEM.02627-06
Pomeroy, L. R., and Wiebe, W. J. (2001). Temperature and substrates as interactive limiting factors for marine heterotrophic bacteria. Aquat. Microb. Ecol. 23, 187–204. doi: 10.3354/ame023187
Probyn, T. A., Waldron, H. N., and James, A. G. (1990). Size fractionated measurements of nitrogen uptake in aged upwelled waters: implications for pelagic food webs. Limnol. Oceanogr. 35, 202–210. doi: 10.4319/lo.1990.35.1.0202
Psenner, R., and Sommaruga, R. (1992). Are rapid changes in bacterial biomass caused by shifts from top-down to bottom-up control? Limnol. Oceanogr. 37, 1092–1100. doi: 10.4319/lo.1992.37.5.1092
Putt, M., and Stoecker, D. K. (1989). An experimental determined carbon: volume ratio for marine ‘oligotrichous’ ciliates from estuarine and coastal waters. Limnol. Oceanogr. 34, 1097–1103. doi: 10.4319/lo.1989.34.6.1097
Radić, T., Šilović, T., Šantić, D., Fuks, D., and Mièić, M. (2009). Preliminary flow cytometric analyses of phototrophic pico-and nanoplankton communities in the Northern Adriatic. Fresenius Environ. Bull. 18, 715–724.
Rassoulzadegan, F., and Sheldon, R. W. (1986). Predator-prey interactions of nanozooplankton and bacteria in an oligotrophic marine environment. Limnol. Oceanogr. 31, 1010–1021. doi: 10.4319/lo.1986.31.5.1010
Rhee, G. Y. (1973). A continuous culture study of phosphate uptake, growth rate and polyphosphate in Scenedesmus sp. J. Phycol. 9, 495–506. doi: 10.1111/j.1529-8817.1973.tb04126.x
Rhee, G.-Y., and Gotham, I. J. (1981). The effect of environmental factors on phytoplankton growth: temperature and the interactions of temperature with nutrient limitation. Limnol. Oceanogr. 26, 635–648. doi: 10.4319/lo.1981.26.4.0635
Rivkin, R. B., and Legendre, L. (2001). Biogenic carbon cycling in the upper ocean: effects of microbial respiration. Science 291, 2398–2400. doi: 10.1126/science.291.5512.2398
Šantić, D., Krstulović, N., Šolić, M., Ordulj, M., and Kušpilić, G. (2013). Dynamics of prokaryotic picoplankton community in the central and southern Adriatic Sea (Croatia). Helgoland Mar. Res. 67, 471–481. doi: 10.1007/s10152-012-0336-x
Šantić, D., Šolić, M., Marin, I., Vrdoljak, A., Kušpilić, G., and Ninčević Gladan, Ž (2018). Factors affecting distribution of two Synechococcus ecotypes in the coastal Adriatic Sea. Acta Adriat. 59, 51–60. doi: 10.32582/aa.59.1.4
Selmer, J.-S., Ferrier-Pages, C., Cellario, C., and Rassoulzadegan, F. (1993). New and regenerated production in relation to the microbial loop in the NW Mediterranean sea. Mar. Ecol. Prog. Ser. 100, 71–83. doi: 10.3354/meps100071
Shurin, J. B., Borer, E. T., Seabloom, E. W., Anderson, K., Blanchette, C. A., Broitman, B., et al. (2002). A cross-ecosystem comparison of the strength of trophic cascades. Ecol. Lett. 5, 785–791. doi: 10.1046/j.1461-0248.2002.00381.x
Šolić, M., and Krstulović, N. (1994). The role of predation in controlling bacterial and heterotrophic nanoflagellate standing stocks in the coastal Adriatic Sea: seasonal patterns. Mar. Ecol. Prog. Ser. 114, 219–235. doi: 10.3354/meps114219
Šolić, M., Krstulović, N., Bojanić, N., Marasović, I., and Ninèević, Ž (1998). Seasonal switching between relative importance of bottom-up and top-down control of bacterial and heterotrophic nanoflagellate abundance. J. Mar. Biol. Assoc. UK 78, 755–766. doi: 10.1017/S0025315400044763
Šolić, M., Krstulović, N., Kušpilić, G., Ninčević Gladan, Ž, Bojanić, N., Šestanović, S., et al. (2010). Changes in microbial food web structure in response to changed environmental trophic status: a case study of the Vranjic Basin (Adriatic Sea). Mar. Environ. Res. 70, 239–249. doi: 10.1016/j.marenvres.2010.05.007
Šolić, M., Krstulović, N., Šantić, D., Šestanović, S., Kušpilić, G., Bojanić, N., et al. (2017). Impact of 3oC temperature rise on bacterial growth and carbon transfer towards higher trophic levels: empirical models for the Adriatic Sea. J. Mar. Syst. 173, 81–89. doi: 10.1016/j.jmarsys.2017.01.001
Šolić, M., Krstulović, N., Šantić, D., Šestanović, S., Ordulj, M., Bojanić, N., et al. (2015). Structure of microbial communities in phosphorus-limited estuaries along the eastern Adriatic coast. J. Mar. Biol. Assoc. UK 95, 1565–1578. doi: 10.1017/s0025315415000442
Šolić, M., Krstulović, N., Vilibić, I., Bojanić, N., Kušpilić, G., Šestanović, S., et al. (2009). Variability in the bottom-up and top-down control of bacteria on trophic and temporal scale in the middle Adriatic Sea. Aquat. Microb. Ecol. 58, 15–29.
Šolić, M., Krstulović, N., Vilibić, I., Kušpilić, G., Šestanović, S., Šantić, D., et al. (2008). The role of water mass dynamics in controlling bacterial abundance and production in the middle Adriatic Sea. Mar. Environ. Res. 65, 388–404. doi: 10.1016/j.marenvres.2008.01.004
Šolić, M., Šantić, D., Šestanović, S., Bojanić, N., Grbec, B., Jozić, S., et al. (2020b). Impact of water column stability dynamics on the succession of plankton food web types in the offshore area of the Adriatic Sea. J. Sea Res. 158:01860. doi: 10.1016/j.seares.2020.101860
Šolić, M., Šantić, D., Šestanović, S., Bojanić, N., Jozić, S., Ordulj, M., et al. (2020a). Changes in the trophic pathways within the microbial food web in the global warming scenario: an experimental study in the Adriatic Sea. Microorganisms 8:510. doi: 10.3390/microorganisms8040510
Šolić, M., Šantić, D., Šestanović, S., Bojanić, N., Jozić, S., Vrdoljak, A., et al. (2019). Temperature and phosphorus interacts in controlling the picoplankton carbon flux in the Adriatic Sea: an experimental vs. field study. Environ. Microbiol. 21, 2469–2484. doi: 10.1111/1462-2920.14634
Šolić, M., Šantić, D., Šestanović, S., Bojanić, N., Ordulj, M., Jozić, S., et al. (2018). The effect of temperature increase on microbial carbon fluxes in the Adriatic Sea: an experimental approach. FEMS Microb. Ecol. 94:fiy169. doi: 10.1093/femsec/fiy169
Stenseth, N. C., Llope, M., Anadón, R., Ciannelli, L., Chan, K.-S., Hjermann, D. Ø, et al. (2006). Seasonal plankton dynamics along a cross-shelf gradient. Proc. R. Soc. B 273, 2831–2838. doi: 10.1098/rspb.2006.3658
Sterner, R. W., and Elser, J. J. (2002). Ecological Stoichiometry: The Biology of Elements From Molecules to the Biosphere. Princeton, NJ: Princeton University Press.
Strickland, J. D. H., and Parsons, T. R. (1972). A practical handbook of seawater analysis. J. Fish Res. Board Can. 167, 1–311. doi: 10.1002/iroh.19700550118
Stockner, J. G. (1988). Phototrophic picoplankton: an overview from marine and freshwater ecosystems. Limnol. Oceanogr. 33, 765–775. doi: 10.4319/lo.1988.33.4part2.0765
Teira, E., Pazó, M. J., Quevedo, M., Fuentes, M. V., Neill, F. X., and Fernández, E. (2003). Rates of dissolved organic carbon production and bacterial activity in the eastern North Atlantic subtropical gyre during summer. Mar. Ecol. Prog. Ser. 249, 53–67. doi: 10.3354/meps249053
Thingstad, F. T., Zweifel, U. L., and Rassoulzadegan, F. (1998). P limitation of heterotrophic bacteria and phytoplan.kton in the northwest Mediterranean. Limnol. Oceanogr. 43, 88–94. doi: 10.4319/lo.1998.43.1.0088
Thingstad, T. F., and Aksnes, D. L. (2019). Why growth of nutrient-limited micro-organisms should have low-temperature sensitivity. ISME J. 13, 557–558. doi: 10.1038/s41396-018-0271-1
Unrein, F., Massana, R., Alonso-Sáez, L., and Gasol, J. M. (2007). Significant year-round effect of small mixotrophic flagellates on bacterioplankton in an oligotrophic coastal system. Limnol. Oceanogr. 52, 456–469. doi: 10.4319/lo.2007.52.1.0456
Utermöhl, H. (1958). Zur Vervollkommnung der quantitativen Phytoplankton – Methodik. Mitt. Int. Ver. Theor. Angew. Limnol. 9, 1–37.
Van Wambeke, F., Christaki, U., Giannakourou, A., Moutin, T., and Souvemerzoglou, K. (2002). Longitudinal and vertical trends of bacterial limitation by phosphorus and carbon in the Mediterranean Sea. Microb. Ecol. 43, 119–133. doi: 10.1007/s00248-001-0038-4
Vargas, C. A., and Gonzalez, H. E. (2004). Plankton community structure and carbon cycling in a coastal upwelling system. I. Bacteria, microprotozoans and phytoplankton in the diet of copepods and appendicularians. Aquat. Microb. Ecol. 34, 151–164. doi: 10.3354/ame034151
Vargas, C. A., Martínez, R. A., Cuevas, L. A., Pavez, M. A., Cartes, C., González, H. E., et al. (2007). The relative importance of microbial and classical food webs in a highly productive coastal upwelling area. Limnol. Oceanogr. 52, 1495–1510. doi: 10.2307/4502307
Verity, P. G., and Langdon, C. (1984). Relationships between lorica volume, carbon, nitrogen and ATP content of tintinnids in Narragansett Bay. J. Plankton Res. 6, 859–868. doi: 10.1093/plankt/6.5.859
Vukadin, I., and Stojanoski, L. (2001). Phosphorus versus nitrogen limitation in the middle Adriatic Sea. Rapp. Comm. Int. Mer. Medit. 36:174.
Wafar, M., L’Helguen, S., Raikar, V., and Maguer, J.-F. (2004). Nitrogen uptake by size-fractionated plankton in permaqnently well-mixed temperate coastal waters. J. Plankton Res. 26, 1207–1218. doi: 10.1093/plankt/fbh110
Wang, K., Wommack, K. E., and Chen, F. (2011). Abundance and distribution of Synechococcus spp. and cyanophages in the Chesapeake Bay. Appl. Environ. Microb. 77, 7459–7468. doi: 10.1128/AEM.00267-11
Wood, A. M., Horan, P. K., Muirhead, K., Phinney, D. A., Yentsch, C. M., and Waterbury, J. B. (1985). Discrimination between types of pigments in marine Synechococcus spp. by scanning spectroscopy, epifluorescence microscopy, and flow cytometry. Limnol. Oceanogr. 30, 1303–1315.
Wright, R. T., and Coffin, R. B. (1984). Measuring microzooplankton grazing on planktonic marine bacteria by its impact on bacterial production. Microb. Ecol. 10, 137–149. doi: 10.1007/BF02011421
Zhang, Y., Jiao, N. Z., and Hong, N. (2008). Comparative study of picoplankton biomass and community structure in different provinces from subarctic to subtropical oceans. Deep Sea Res. II 55, 1605–1614. doi: 10.1016/j.dsr2.2008.04.014
Zhuang, Z., Zheng, Q., Zhang, X., Yang, G., Xinhua, Z., Cao, L., et al. (2020). Variability of Kuroshio surface axis northeast of Taiwan island derived from satellite altimeter data. Remote Sens. 12:1059. doi: 10.3390/rs12071059
Zingel, P., Agasild, H., Nõges, T., and Kisand, V. (2007). Ciliates are the dominant grazers on pico- and nanoplankton in a shallow, naturally highly eutrophic lake. Microb. Ecol. 53, 134–142. doi: 10.1007/s00248-006-9155-4
Zoccarato, L., and Fonda Umani, S. (2015). Major constrains of the pelagic food web efficiency in the Mediterranean Sea. Biogeosci. Discuss. 12, 4365–4403. doi: 10.5194/bgd-12-4365-2015
Zubkov, M. V., Sleigh, M. A., Burkill, P. H., and Leakey, R. J. G. (2000). Picoplankton community structure on the Atlantic Meridional Transect: a comparison between seasons. Prog. Oceanogr. 45, 369–386. doi: 10.1016/S0079-6611(00)00008-2
Keywords: microbial food web structure, environmental condition, limitation by nutrients, temperature, Neural Gas analysis, Adriatic Sea
Citation: Šolić M, Šantić D, Šestanović S, Kušpilić G, Matić F, Vrdoljak Tomaš A, Jozić S, Bojanić N and Ninčević Gladan Ž (2022) Changing Ecological Conditions in the Marine Environment Generate Different Microbial Food Web Structures in a Repeatable Manner. Front. Mar. Sci. 8:811155. doi: 10.3389/fmars.2021.811155
Received: 08 November 2021; Accepted: 27 December 2021;
Published: 14 January 2022.
Edited by:
Hongbin Liu, Hong Kong University of Science and Technology, Hong Kong SAR, ChinaReviewed by:
Tron Frede Thingstad, University of Bergen, NorwayLasse Mork Olsen, University of Bergen, Norway
Copyright © 2022 Šolić, Šantić, Šestanović, Kušpilić, Matić, Vrdoljak Tomaš, Jozić, Bojanić and Ninčević Gladan. This is an open-access article distributed under the terms of the Creative Commons Attribution License (CC BY). The use, distribution or reproduction in other forums is permitted, provided the original author(s) and the copyright owner(s) are credited and that the original publication in this journal is cited, in accordance with accepted academic practice. No use, distribution or reproduction is permitted which does not comply with these terms.
*Correspondence: Stefanija Šestanović, c2VzdGFAaXpvci5ocg==