 Julie Lattaud
 Timothy Ian Eglinton
 Marie Tallon1
 Lisa Bröder
 Zeynep Erdem
- 1Biogeoscience Group, Swiss Federal Institute of Technology, Zurich (ETHZ), Geological Institute, Zurich, Switzerland
- 2Marine Microbiology and Biogeochemistry Group, Royal Netherlands Institute for Sea Research (NIOZ), Texel, Netherlands
- 3Geology department, Salamanca University, Salamanca, Spain
Long chain alkyl diols (LCDs) are lipid biomarkers that occur ubiquitously in sediments. Their abundance and distributions are increasingly used as the basis of molecular proxies for environmental parameters such as sea surface temperature (SST) via the Long chain Diol Index (LDI), and upwelling intensity and nutrient conditions (parametrized as diol indices, DI-2, and Nutrient Diol Index, NDI, respectively). Their marine producers remain the subject of debate, but in cultures, they can be found within the outer wall (algaenan) of eustigmatophytes or in Proboscia diatoms. LCDs appear to be well preserved in sediments, potentially as a result of their association with algaenan and/or minerals, but little is known of their pre-depositional histories, in particular transport dynamics. Here, 15 surface continental margin sediments as well as one high-deposition-rate sediment core (50 cm, spanning the last ~30 years) were analyzed in order to evaluate the impact of organo-mineral associations, lateral transport, and hydrodynamic sorting on sedimentary LCD signals. The abundance and distribution of LCDs in bulk sediments and corresponding grain-size fractions was determined. The highest proportion of all LCD isomers is found in the fine fraction (2 – 10 µm), which also holds the highest proportion of organic matter in relation to the other grain-size fractions. However, LCDs are also found in the other fractions (sand, coarse silt, and clay), and their concentrations are not correlated with bulk organic carbon content, indicating different preservation or transport mechanisms. LDI-SST in the bulk sediment is comparable to the mean annual SST at all sites except those influenced by upwelling and characterized by strong seasonal SST gradients. To the contrary of other biomarker-related proxies (e.g., alkenones), lateral transport does not appear to strongly affect LDI-SST in size fractions, suggesting that the intimate relationship of LCD with the algaenan may counteract the influence of hydrodynamic mineral sorting processes on related proxy signals. The difference between the fraction-weighted LCD concentration and bulk sedimentary LCD concentration indicates potential release of LCD during laboratory fractionation, suggesting degradation of algaenan or dissolution of opal frustules.
1 Introduction
Long-chain diols (LCDs) are lipids composed of a long n-alkyl chain (34 > nC > 26) and two alcohol groups, one in position 1 and the other most commonly found in position 12, 13, 14, or 15. LCDs occur widely in marine environments and have been shown to mainly consist of C28 and C30 1,13-diols, C30 and C32 1,15-diols (e.g., Versteegh et al., 1997; Versteegh et al., 2000; Gogou and Stephanou, 2004; Rampen et al., 2012; Smith et al., 2013; Rodrigo-Gámiz et al., 2014; De Bar et al., 2020), as well as C28 and C30 1,14-diols (Sinninghe Damsté et al., 2003; Rampen et al., 2011; Rampen et al., 2014b). Culture studies of eustigmatophyte algae showed that these organisms produce 1,13- and 1,15-diols (Volkman et al., 1999; Rampen et al., 2010; Rampen et al., 2014a; Balzano et al., 2017), but present a distribution different than that encountered in marine sediments. For instance, the C32 1,15-diol is dominant in cultures, while the C30 1,15-diol is the most abundant in marine sediments (Balzano et al., 2019; De Bar et al., 2020). Nevertheless, Rampen et al. (2022) found that marine eustigmatophytes such as Nannochloropsis oceanica and closely related species are the likely producers of LCDs in the Mediterranean Sea, as well as in the Atlantic Ocean. For the 1,14-diols, culture studies of Proboscia diatoms indicate that they are the main producers with minor amounts of 1,13-diols (Sinninghe Damsté et al., 2003; Rampen et al., 2007; Rampen et al., 2010). Proboscia diatoms are mainly present in upwelling areas and are likely the main source of 1,14-diols in nutrient-rich marine environments (Rampen et al., 2008; Willmott et al., 2010; Gal et al., 2018). Rampen et al. (2012) showed a correlation between the relative distribution of LCD isomers and sea surface temperature (SST), and proposed the Long-chain Diol Index (LDI) as a proxy ratio now commonly used to reconstruct SST in open ocean. However, this proxy has been shown to be unreliable in some regions such as in upwelling areas, estuaries and deltas, and regions with strong seasonal changes (e.g., Rodrigo-Gámiz et al., 2015; Lattaud et al., 2019; De Bar et al., 2020; Erdem et al., 2021; Versteegh et al., 2022).
In addition to uncertainties regarding the specific precursor organisms of LCDs in marine environments, pre-depositional controls on their distribution and abundance in marine settings are currently poorly understood. In general, organic-mineral associations physically protect organic molecules from biological and chemical degradation during sedimentation and burial (e.g., Mayer, 1994; Hemingway et al., 2019). However, mineral associations can also expose organic matter (OM) to further degradation if the host minerals are prone to resuspension and secondary transport (Bao et al., 2018; Ausín et al., 2021). In this regard, the hydrodynamic behavior of mineral particles is largely determined by their grain size (and density). For instance, mobilization and transport of sand grains (> 63 µm) requires relatively strong current velocities (Van Sebille et al., 2015), whereas the so-called sortable silt fraction (10 – 60 µm, McCave et al., 1995) is selectively transported at flow speeds below 10 – 15 cm s-1 (McCave et al., 2017). At higher current speeds, cohesive fine silt (2 – 10 µm) can also be winnowed, whereas strong cohesive forces hamper resuspension of clay particles (< 2 µm). The intimate relationship between OM and mineral surfaces and their subsequent hydrodynamic sorting during lateral transport can thus exert a strong influence on the spatial distribution, abundance, and radiocarbon (14C) age of OM and specific biomarkers in marine settings (e.g., Ohkouchi et al., 2002; Mollenhauer et al., 2007; Bao et al., 2016; Bröder et al., 2016; Bao et al., 2019; Ausín et al., 2021; Ausín et al., 2022). As LCDs are part of the outer wall of eustigmatophyte membrane (algaenan), their behavior might differ from the expected association with mineral surfaces during sedimentation and transport to their final depositional site.
Here, a set of 15 surface sediment samples from continental margin settings in the Atlantic and the Pacific Ocean is used to explore the potential impact of mineral associations and accompanying hydrodynamic particle sorting processes on the composition and fate of LCDs in marine sediments and the reliability of the LCD-derived environmental signals.
2 Material and methods
2.1 Study sites and sampling
Fifteen surface sediments (from which seven identical to those used in Ausín et al., 2021, Figure 1 and Table 1) originating from ten cruises were studied from continental margins and one pelagic drift deposit. These sites have been chosen to cover a large range of sedimentation and hydrographic settings, i.e. high surface water productivity, deep site (>4500 m depth), and transects with strong underwater currents. The stable isotopic composition of sedimentary organic carbon, i.e. δ13COC, is characteristic of marine primary productivity indicating that the sites are not influenced by terrestrial OM (Table 1, Meyers, 1994). These sites are also characterized by high sedimentation rates (> 20 cm kyr-1, Ausín et al., 2021), which minimizes the impact of bioturbational mixing on preserved particles and related environmental signals. The sediment-water interface was preserved at all sites, they were sampled using a multi-corer, except for the Bermuda rise (BER) which was sampled by a box-corer.
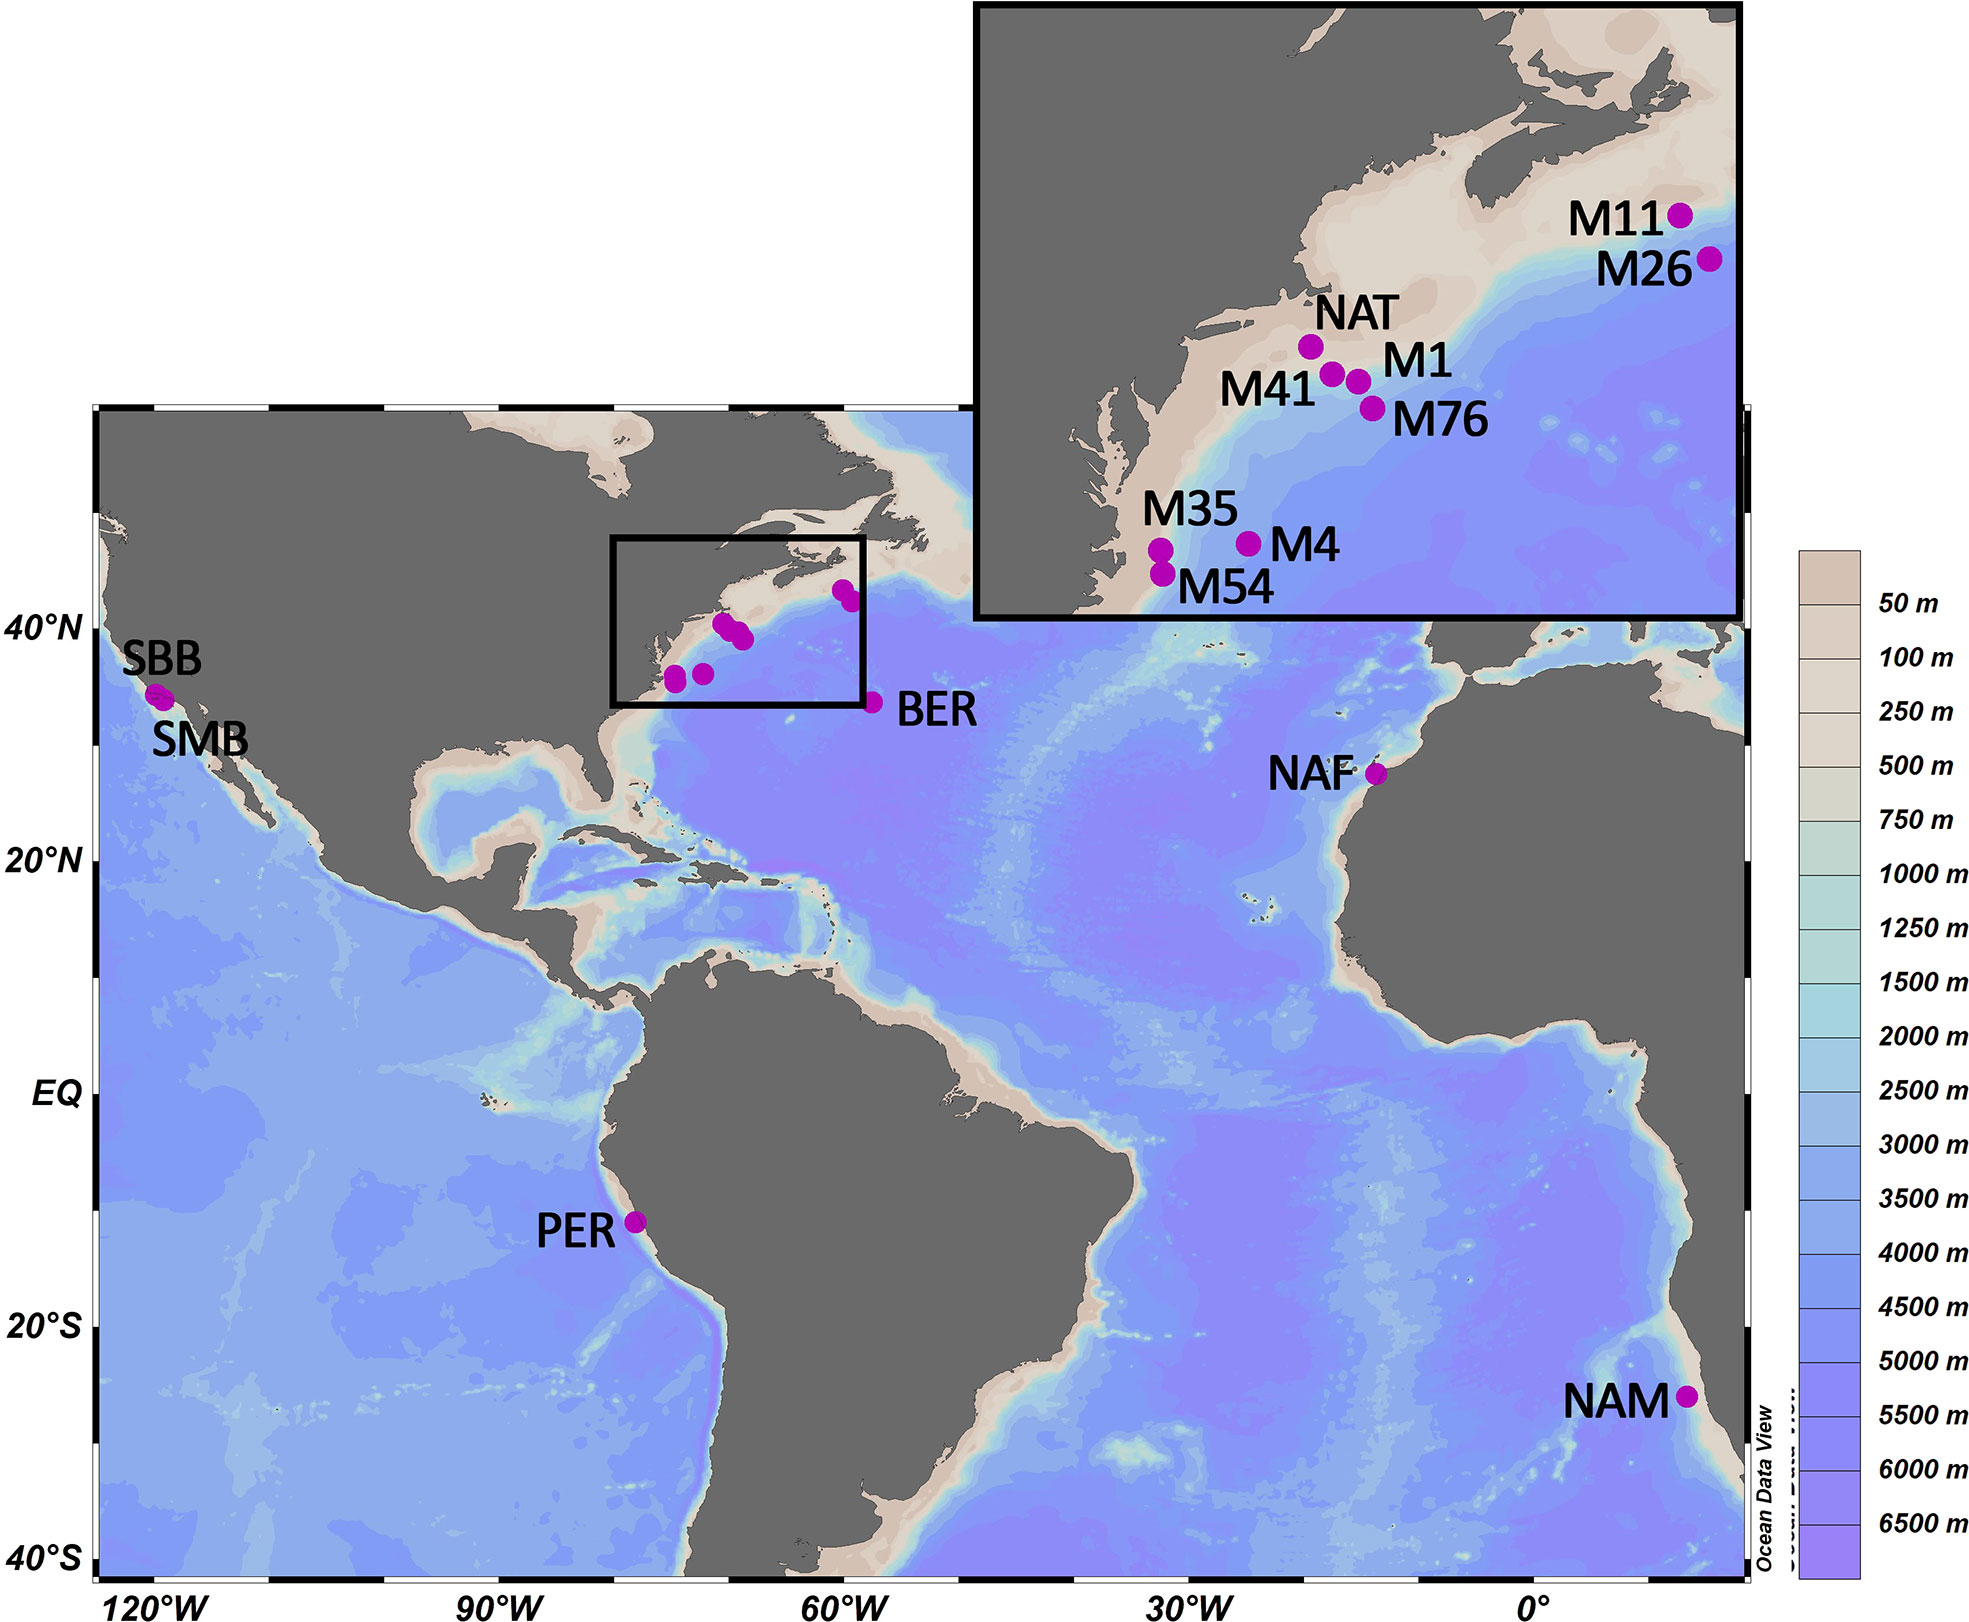
Figure 1 Location of the study sites. Acronyms for each site as explained in the main text.
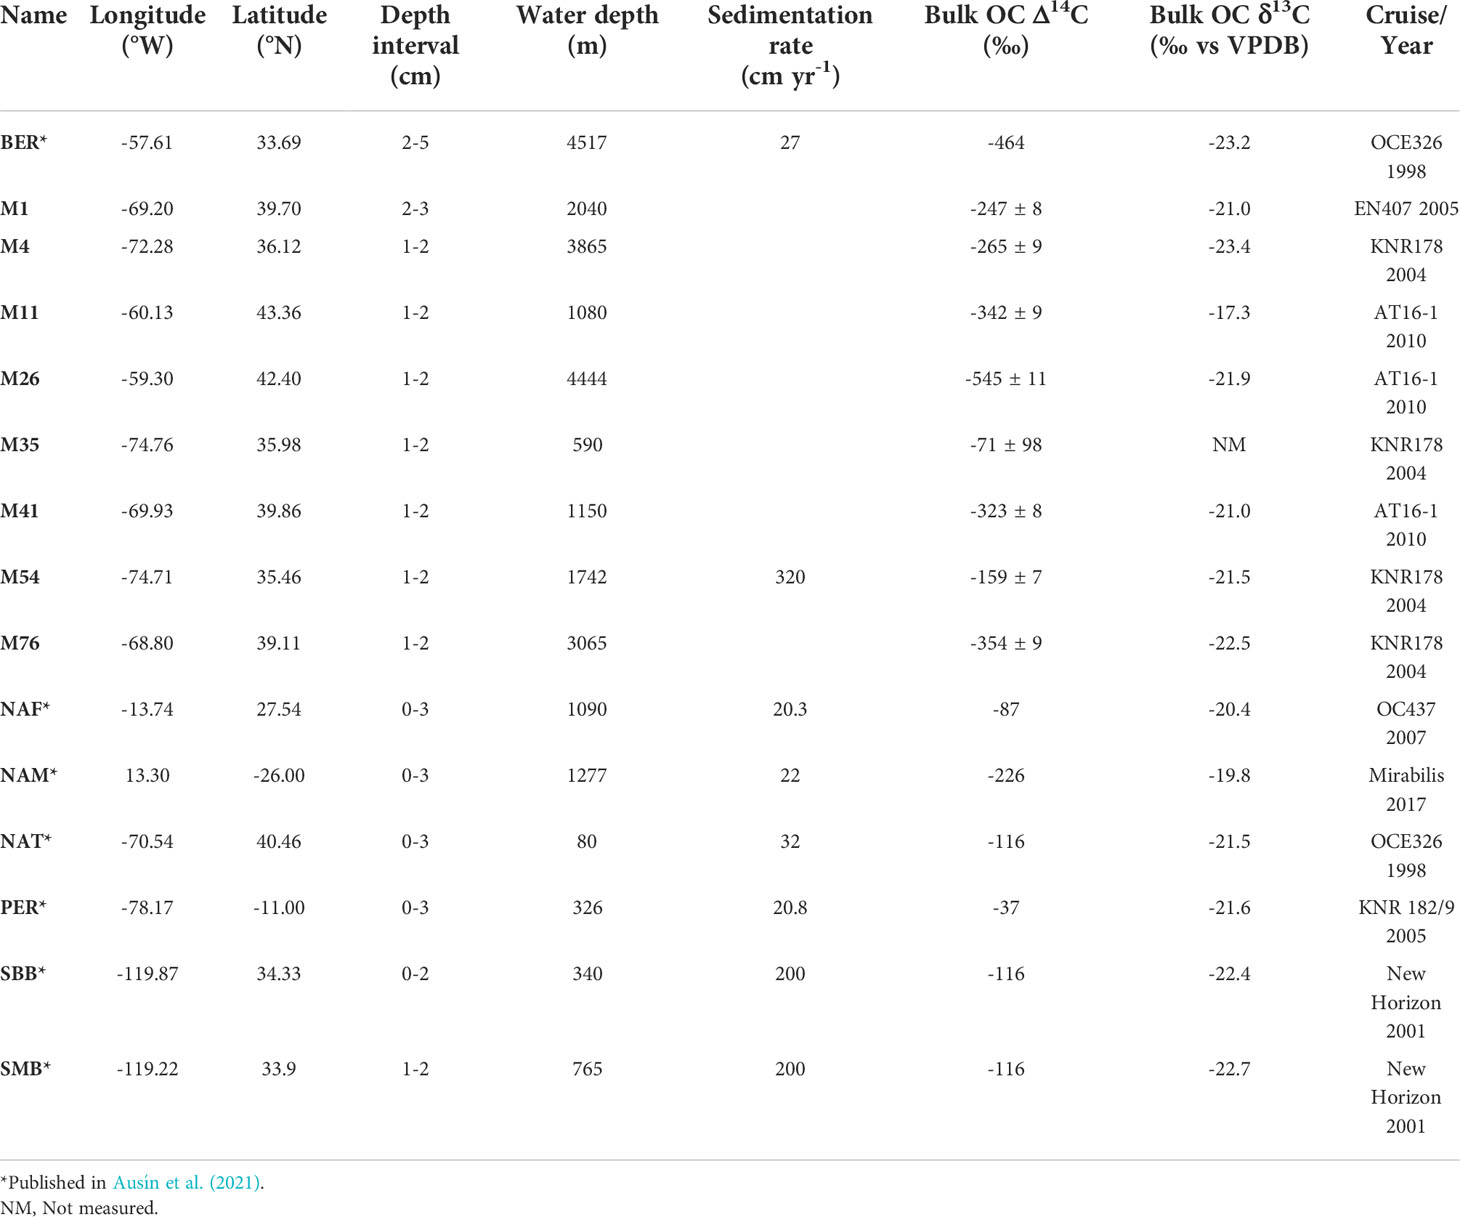
Table 1 Sampling location (coordinate, water depth and cruise), depth studied, sedimentation rate when available, and bulk organic matter carbon isotope signature (stable and radiocarbon).
In addition, five samples from different sediment depths (1 – 2 cm, 2 – 3 cm, 10 – 11 cm, 20 – 21 cm, 30 – 31 cm) of a short multicore M54 (~50 cm long) retrieved from the NW Atlantic margin were studied to assess the effect of sedimentation and in situ degradation on the LCDs and associated proxies. Given the expected high sedimentation rate, the respective depths correspond to approximate ages that covers the last 50 years (approximately 1970 C.E. at 30 cm depth, age model based on the nearby KNR-178-56JPC, Thornalley et al., 2018). See Table 1 for summary of all sites.
High surface primary productivity, and/or water-column oxygen minimum zone, OMZ, with anoxic to sub-oxic bottom waters: The Santa Barbara Basin (SBB) and Santa Monica Basin (SMB) are located near the coast on the California margin in the northeast Pacific Ocean, within a major eastern boundary upwelling system. SBB was recovered from the partially isolated Santa Barbara Basin (340 m water depth, mwd), characterized by sub-oxic to anoxic bottom waters enhancing OM preservation (Mollenhauer and Eglinton, 2007). SMB, located in the Santa Monica Basin, was recovered from 765 mwd from the well-defined OMZ (Mollenhauer and Eglinton, 2007).
The NW African margin (NAF) in the subtropical eastern Atlantic is part of the Canary Upwelling System, characterized by high to moderate rates of biological productivity. NAF was retrieved north of the OMZ at 1090 mwd. This site represent an area with minimal hydrodynamic biases given synchronous signals have been observed between OM and planktonic foraminifera in underlying sediments (Mollenhauer et al., 2005).
NAM was retrieved at 1277 mwd on the upper continental slope of the Namibian margin, where the permanent Benguela Upwelling System sustains very high primary productivity (Moffitt et al., 2015). In this “depocenter” zone, strong lateral transport of OM of shelf sediments has been previously documented (Inthorn et al., 2006).
PER was sampled at 326 mwd on the Peruvian continental shelf, part of the Peruvian wind-driven upwelling, where oxygen-deficient bottom waters result in very high sedimentary OC contents with little carbonate preservation (Arthur et al., 1998).
Deep water site with low surface primary productivity: The Bermuda Rise is a deep-ocean sediment drift in the sub-tropical northwest Atlantic Ocean and BER was sampled at 4517 mwd. It was chosen because of the strong hydrodynamic control on sediment properties in this region (Ohkouchi et al., 2002).
Transects with moderately high surface ocean productivity: The transects are within the Mid-Atlantic Bight, this region sustains high to moderate surface primary productivity and is characterized by high deposition rates of fine-grained sediment (Twichell et al., 1981; Goff et al., 2019). In this zone, the Gulf Stream carries warm water of the Caribbean past Cape Hatteras, whereas beneath (> 1500 mwd) the Deep Western Boundary current transport cold water from the Labrador Sea in the opposite direction (southwards) (e.g., Talley et al., 2011). There are three transects:
i) Off Cape Hatteras, samples M35 (590 mwd), M54 (1742 mwd), and M4 (3865 mwd). This is the only transect directly affected by both Gulf Stream an Deep Western Boundary Current and are influenced by the Mid-Atlantic Bight upwelling (Murphy et al., 2021).
ii) Offshore Cape Cod, NAT (80 mwd), M41 (1150 mwd), M1 (2040 mwd), and M76 (3065 mwd).
iii) From the Nova Scotian margin samples M11 (1080 mwd) and M26 (444 mwd).
Different depths for the surface sediments have been used (see Table 1), but all were from the upper 5 cm depth to avoid resuspension and bioturbation affecting the signal. For PER, NAM, NAT and NAF, the upper 3 cm were sampled. The top 2 cm for SBB, the 2 – 5 cm layer for BER and 2 – 3 cm layer for M1. For all others, the 1 – 2 cm layer has been studied, total organic carbon content (TOC wt. %) ranges from 0.42% for BER to 13.9% for PER (this study, Ausín et al., 2021, Table 2). Since sedimentation rate is different for all sites, the samples reflect different depositional ages (as shown in the bulk OC Δ14C, Table 1).
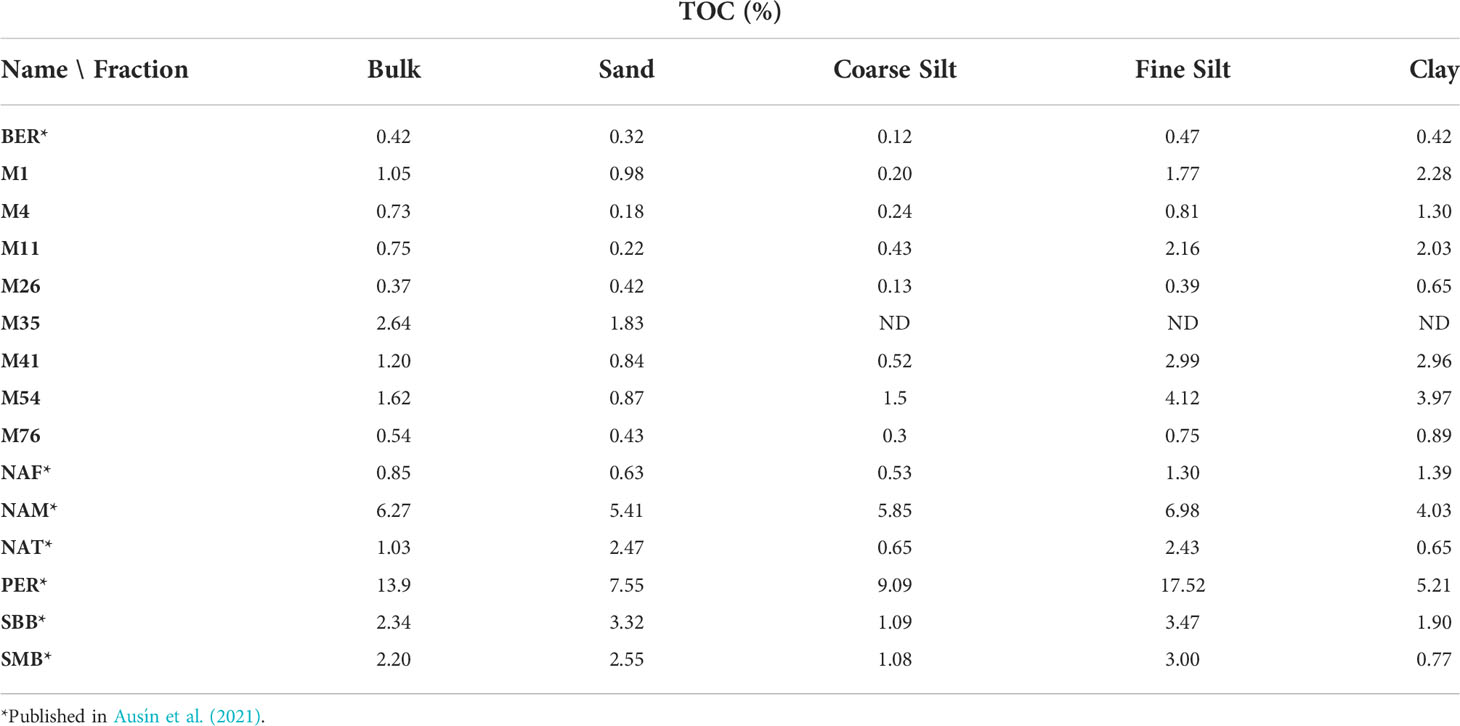
Table 2 TOC (%) content in each fraction of the surface sediments.
2.2 Grain size separation
For this study, 14 – 20 g of freeze-dried sediments were homogenized (well mixed in MilliQ water) and fractionated following Magill et al. (2018) into four different grain size fractions using a combination of wet sieving, centrifugation, settling, and filtration (following Ausín et al., 2021): sand (63– 300 μm); coarse silt (10 – 63 μm); fine silt (3 – 10 μm); and clay (< 2 μm). For all sites, the majority of sediment mass is found in the coarse silt and fine silt fractions, together accounting for > 65% of the bulk sediment (this study, Ausín et al., 2021). For all sites, the fine silt and clay fraction concentrate the most organic carbon (Table 2).
2.3 Mineral surface area and bulk organic carbon
Eight samples and associated size-fractions were measured (MC1, MC4, MC11, MC26, MC35, MC41, MC54, MC76) for mineral surface area (MSA) and TOC for this study (the rest of the samples have been measured and described in Ausín et al., 2021). For MSA, OM was removed from a freeze-dried sample aliquot (ca. 1 g) by combustion (12 h, 450°C) (Freymond et al., 2018). Before MSA measurement, samples were degassed under vacuum (> 2 h, 350°C) to remove any remaining water and adsorbed gases. MSA was measured with N2 using the BET method (Brunauer et al., 1938) with a 5-point adsorption isotherm (p/p0 = 0.05–0.3) on a NOVA 4000 surface area analyzer (Keil et al., 1997). For TOC, 10 to 15 mg of freeze-dried and homogenized sediment was fumigated with concentrated hydrochloric acid (HCl 37%) for 72 h at 60°C to remove inorganic carbon and subsequently neutralized and dried under a basic atmosphere (pH > 7, NaOH) at 60°C for another 72 h. They were measured on an Elemental Analyzer (EA) interface coupled to both a stable isotope analyzer (EA‐IRMS, Elementar vario MICRO cube—Isoprime Precision) (Lattaud et al., 2021).
2.4 Long-chain diols
2.4.1 Long-chain diol extraction
All surface sediments have been extracted as described in Ausín et al. (2022). Briefly, 0.5 – 30 g of freeze-dried bulk sediment and sediment for each grain-size fraction was used for total lipid extraction (TLE) with dichloromethane (DCM): methanol (MeOH) (9:1, v/v) using an energized dispersive guided extraction (EDGE®) (CEM) automated system. The TLE was saponified and the neutral fraction was subsequently separated over silica column in three fractions using hexane, DCM and DCM : MeOH (1:1 v/v). LCDs were eluted in the most polar fraction.
2.4.2 Long-chain diol analysis
Long-chain diols were derivatized by silylating the polar fraction with 10 µL N,O-Bis(trimethylsilyl)trifluoro-acetamide (BSTFA), heated for 30 min at 60°C and adding 100 µL of ethyl acetate. The analysis of LCDs was performed at the Surface water research and Management department at EAWAG, using a gas chromatograph (Agilent 7890B GC) coupled to a mass spectrometer (Agilent 5977B MSD) (GC-MS) and equipped with a fused silica capillary column (30 m x 250 µm) coated with CP Sil-5 (film thickness 0.25 µm). The temperature regime for the oven was as follows (Rampen et al., 2012): held at 70°C for 1 min, increased to 130°C at 20°C/min, increased to 320°C at 4°C/min, held at 320°C during 25 min. The flow of hydrogen was held constant at 2 mL/min. The MS source temperature was held at 250°C and the MS quadrupole at 150°C. The electron impact ionization energy of the source was 70 eV. The diols were quantified via SIM (Single Ion Monitoring) of the m/z = 187 (internal standard, C22 5,16-diol, from Interbioscreen) 299.3 (C26 1,12, C28:1 1,14, C28 1,14), 313.3 (C28 1,13, C30 1,15), 327.3 (C28 1,12, C30:1 1,14, C30 1,14) and 341.3 (C30 1,13, C32 1,15) ions (Versteegh et al., 1997; Rampen et al., 2012).
Several proxies have been developed using LCDs to reconstruct environmental parameters such as SST (using the long-chain diol index, LDI [Eq. 1], Rampen et al., 2012), upwelling strength and Proboscia diatoms productivity (diol indices, DI-2 [Eq. 2], Willmott et al., 2010) and nutrient concentration and Proboscia diatoms productivity (nutrient diol index, NDI [Eq. 3], (Gal et al., 2018; De Bar et al., 2020).
The global calibration to obtain SST is as follows [Eq. 4] (De Bar et al., 2020):
Nitrate and phosphate concentration calibrations of NDI have been originally developed for the north western Pacific using a set of surface sediments and surface particulate matter (SPM) (Gal et al., 2018). A recent sediment trap study from the East Sea evidenced the need of a regional calibration (Gal et al., 2021), hence NDI [Eq. 3] seems to be region-specific, and might reflect the local Proboscia diatom productivity, which, in turn, is linked to nutrient regimes. Proboscia spp. In cultures present different LCD distribution amongst species and growth temperatures (Rampen et al., 2009; Rampen et al., 2014b). At low growth temperatures (2 – 8°C), P. alata presents 93% of C28:1 1,14-diol and no C30 1,14-diol, while another Proboscia species presents 68% of C28:1 1,14-diol and 1% of C30 1,14-diol (Rampen et al., 2009). In P. indica, the relative proportion of C28:1 1,14- and C30 1,14-diols decreases with growth temperature while those of C30:1 1,14 and C28 1,14-diols increase. However, this relationship with temperature has not been found in globally distributed surface sediments (Rampen et al., 2014a). Hence, NDI will be used here as an indicator of changes in Proboscia community. The last LCD indices commonly used is FC32 which is the fractional abundance of C32 1,15-diol relatively to all other diols except 1,14-diols (Lattaud et al., 2017). It indicates the relative amount of riverine/lacustrine input to coastal seas, it is not commonly used in open water environments and will only be briefly described in this study.
2.5 Statistical analyses
The data were processed through statistical analysis with R using Rstudio 1.4. Correlations have been evaluated with Pearson r values and considered significant if p values< 0.05.
3 Results
3.1 Mineral surface area and total organic carbon
For the eight measured mineral surface areas, the fine silt fraction always has the highest MSA (clay size-fraction was not measured due to very low amounts of sample, Table 4). There is no clear trend in the transect offshore the Eastern USA coast. For the bulk sediments, MSA are lowest for MC41 (1150 mbsl) and MC54 (1742 mbsl), no trend with depth or distance from the coast is observed. In regard to TOC (Table 2), highest measured TOC content in the bulk sediment is measured in M35 (2.64%), followed by M54 (1.62%). Fine silt and clay fractions always have higher TOC content than their respective bulk sediment, whereas coarse silt is always lower.
3.2 LCD concentration
Surface sediments LCDs are detected in all bulk sediments except in M76, and all fractions except in BER in the clay and sand fractions (Figure 2 and Supplementary Figure 1). For the bulk sediments, LCD concentrations and loadings (concentration normalized by MSA in ng m-2) are highest in NAT (3859 ng g-1 and 199 ng m-2, respectively), followed by PER (485 ng g-1 and 17 ng m-2), SBB (200 ng g-1 and 10 ng m-2), NAM (150 ng g-1 and 7 ng m-2), SMB (45 ng g-1 and 2 ng m-2), M54 (38 ng g-1 and 4 ng m-2), M35 (29 ng g-1 and 2 ng m-2), NAF (19 ng g-1 and 1 ng m-2), M41 (16 ng g-1 and 2 ng m-2). All the other samples (M1, M11, M26, M4, M76, BER) contained< 5 ng g-1 (Figure 2). Organic carbon (OC)-normalized concentrations correlate significantly with mass-normalized concentrations (r = 0.75, p< 0.05), but mass-normalized concentration does not correlate significantly with TOC (r = 0.33, p = 0.02). LCD distributions in bulk sediment samples are generally similar to those reported in previous studies. For example, large proportions of 1,14-diols (Rampen et al., 2014a; De Bar et al., 2020; Erdem et al., 2021; Gal et al., 2021; Versteegh et al., 2022) are observed in strong upwelling sites such as the Benguela upwelling (NAM = 78% of all LCDs), Peruvian upwelling system (PER = 33% of all LCDs), and the Mid-Atlantic Bight upwelling (M4 = 26%, M54 = 31%, and M35 = 26%, Murphy et al., 2021). In addition, BER also presents a relatively higher amount of 1,14-diols (39% of all LCDs) compared to the other non-upwelling sites, which may be linked to lateral export of diatomaceous particles from the Mid-Atlantic Bight upwelling (Murphy et al., 2021).
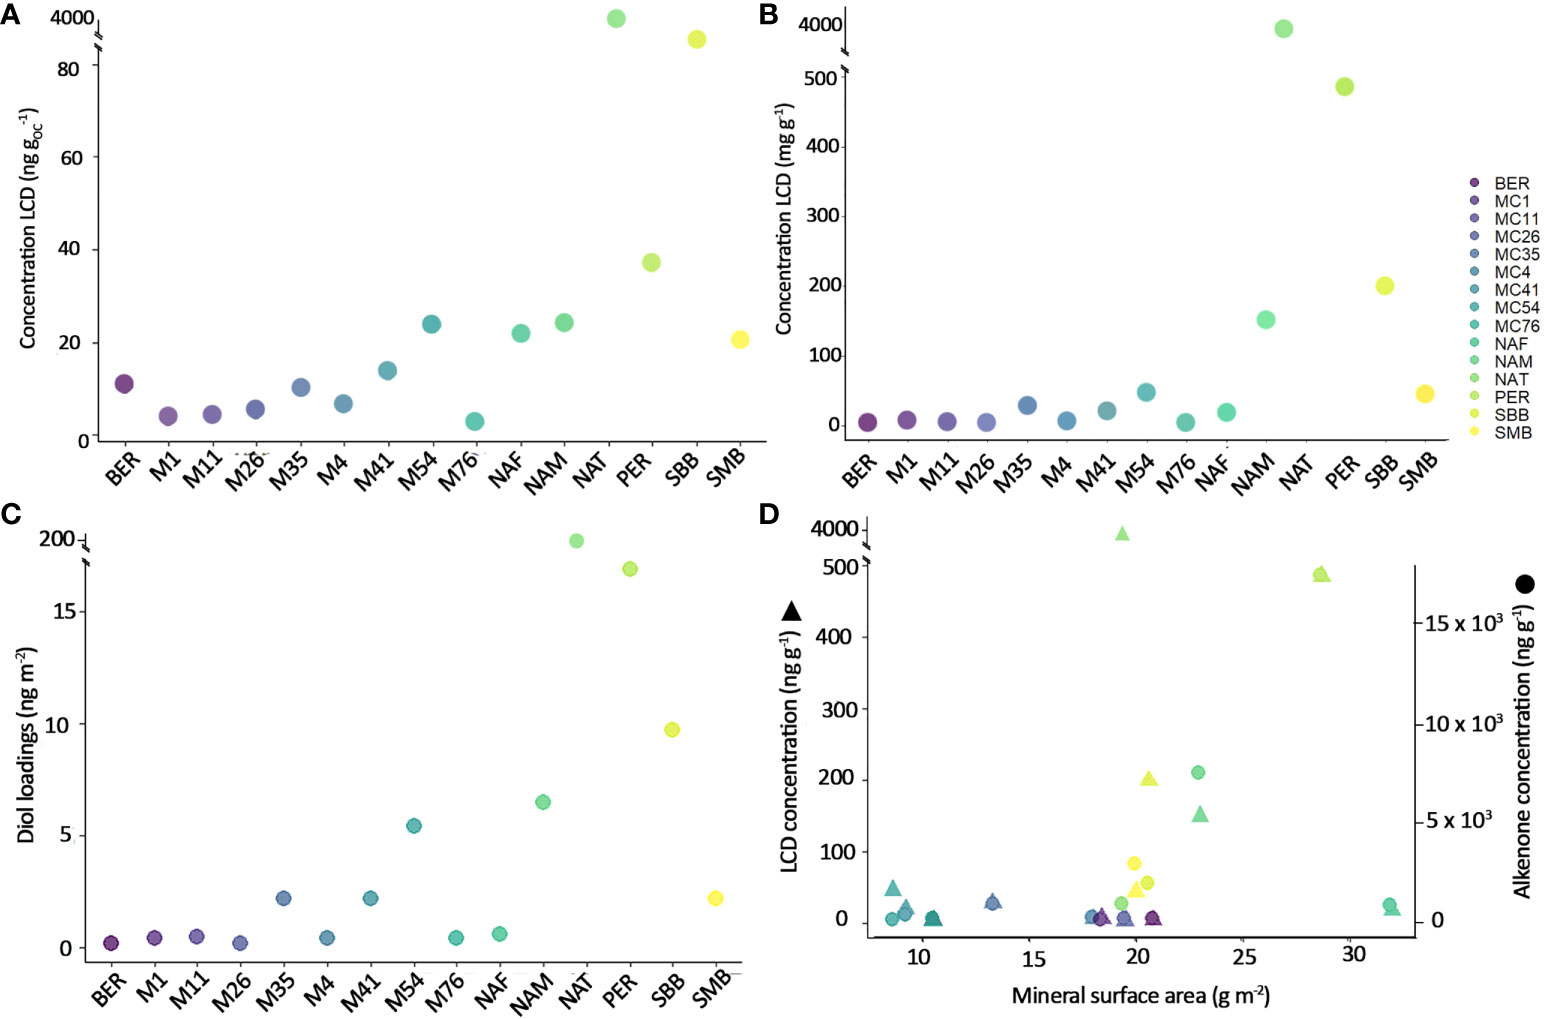
Figure 2 Total LCD concentration in bulk sediments (A) OC-normalized and (B) mass-normalized (C) LCD loadings and (D) LCD and alkenone concentration (ng g-1) in relation with mineral surface area (alkenone concentrations from Ausín et al., 2021).
In the grain size fractions, all LCDs preferentially reside in the fine silt fraction for all sites (Supplementary Figures 1, 2). The only exception is NAF where 1,14- and 1,15-diols are slightly more abundant in the clay fraction than the fine silt fraction. The second fraction where LCDs are most abundant is the sand fraction for PER and NAM (all LCDs), and clay for SBB, SMB, NAT, and NAF (all LCDs). For M1, M4, M11, M26, M35, M41, M54, and M76, only coarse and fine silt have been measured for LCDs due to low amount of sand and clay fractions. For the core-tops for which all fractions have been measured for LCDs (BER, NAF, NAT, NAM, SBB, SMB, PER), the relative proportion of the different LCDs is similar between the fractions at the same site. Exceptions are PER, where there is relatively more C30 1,15-diol in the clay (70%) followed by the FS (50%), and the CS (20%), whereas the 1,14-diols are relatively more abundant in the coarse silt followed by fine silt and clay (Supplementary Figure 1). This is driven by the very low concentration in 1,14-diols in the clay fraction compared to the other fractions.
M54 depth profile There is an increase in LCD concentration observed in the fine silt fraction of the down-core record of M54 (from 45 ng g-1 in the 1 – 2 cm layer to 330 ng g-1 in the 30 – 31 cm layer), whereas the bulk LCD concentration remains similar (49 ± 8 ng g-1) and the coarse silt slightly increases (from 23 ng g-1 in the 1 – 2 cm layer to 107 ng g-1 in the 30 – 31 cm layer) (Figure 3). This increase is mainly driven by an increase in the abundance of 1,15-diols.
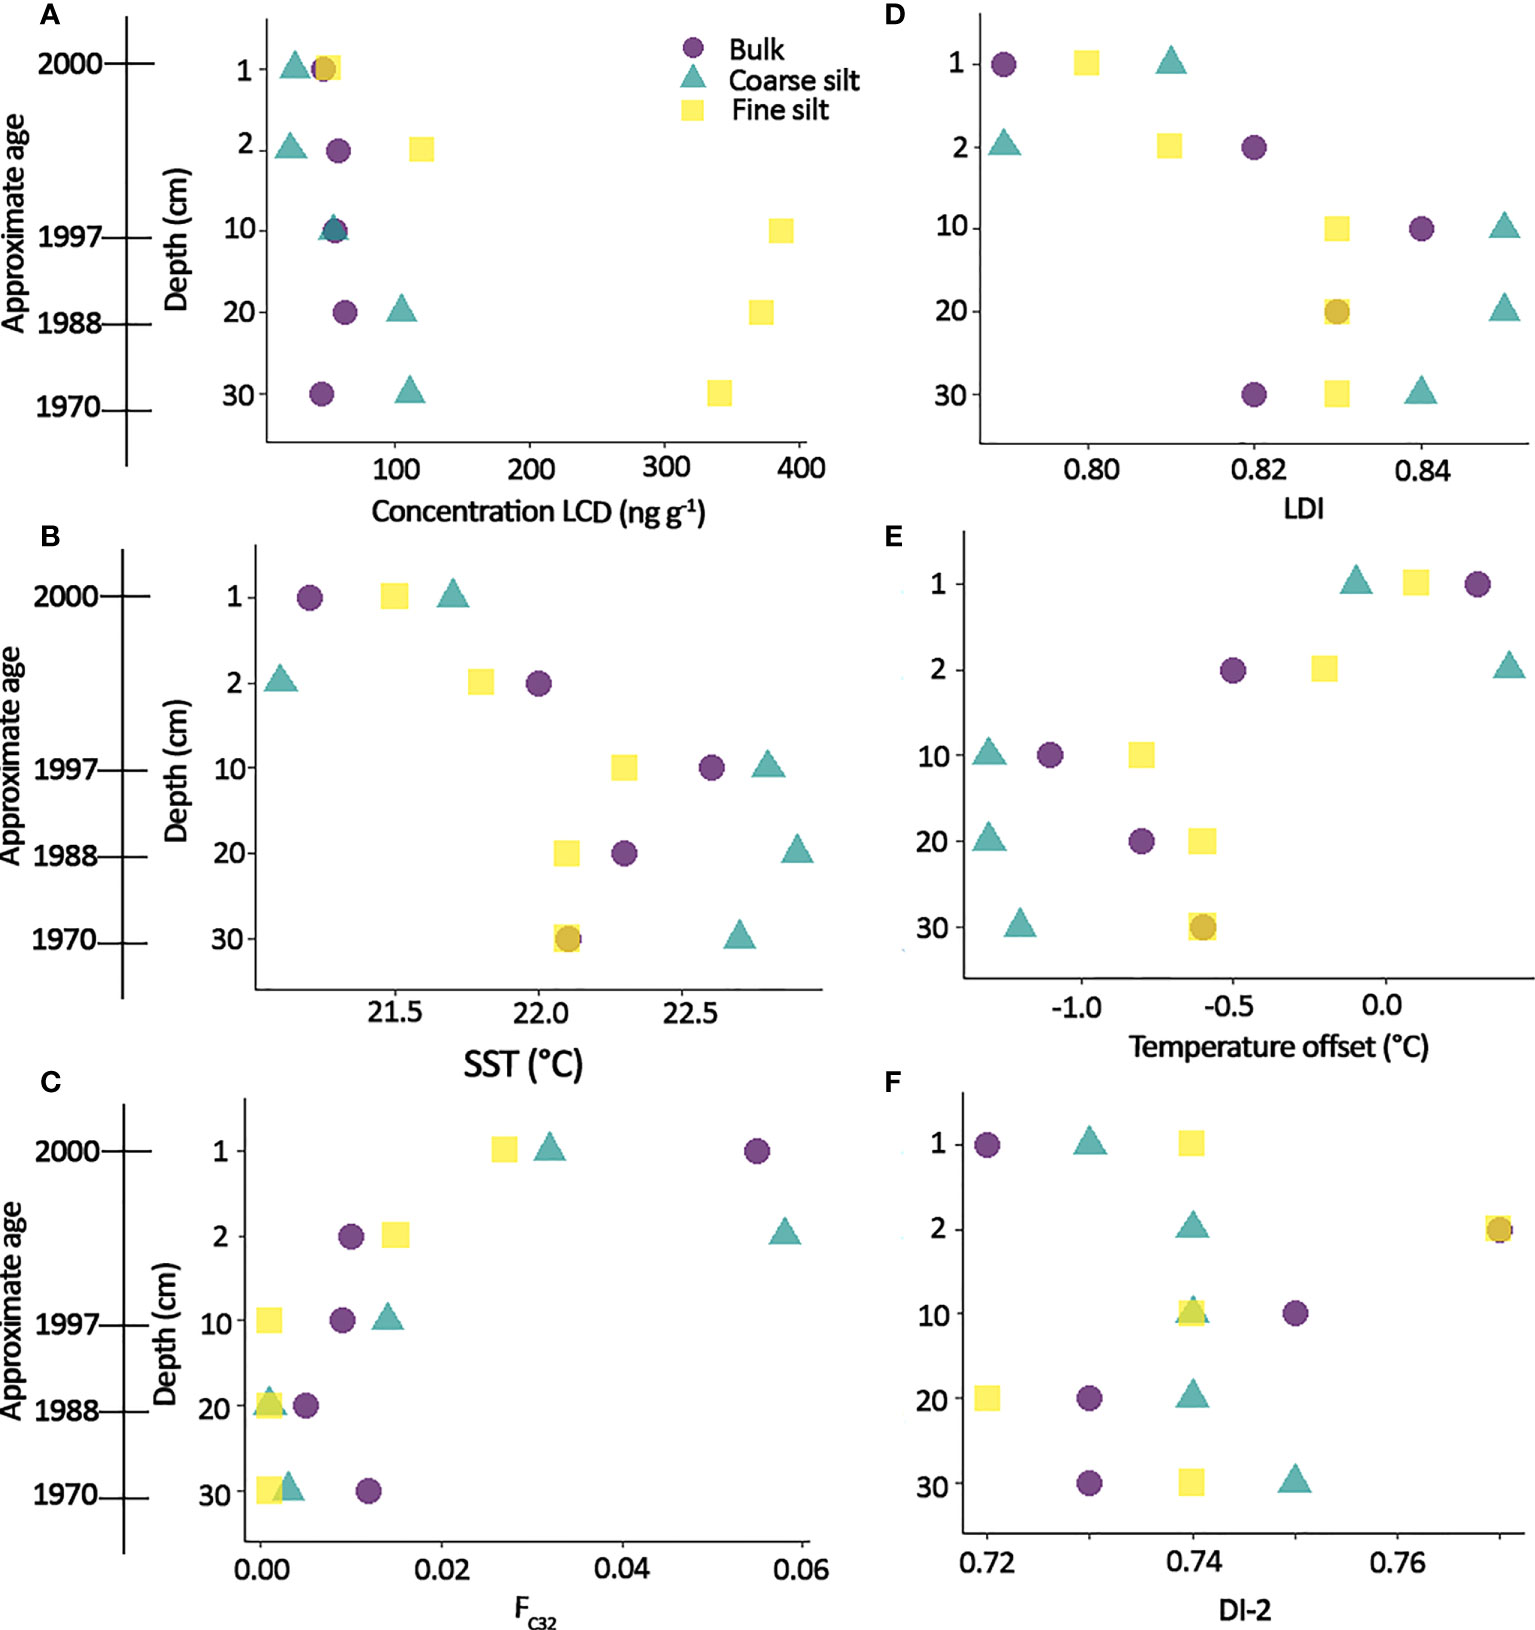
Figure 3 (A) LCD concentration in the depth profile of M54, with the potential age of the sediment indicated (deducted from sedimentation rate from Thornalley et al., 2018) (B) SST-LDI (using the calibration equation of De Bar et al., 2020) (C) FC32 (Lattaud et al., 2017) (D) LDI (Rampen et al., 2012), (E) Temperature offset from WOAA 2018 (Locarnini et al., 2018) and (F) DI-2 (Willmott et al., 2010).
3.3 Proxy variation
LDI Bulk sedimentary LDI values vary from 0.48 in NAM to 0.89 in BER (Figure 4 and Table 3). Amongst the fractions, there is no particular trend, except for fine silt and clay that seem to show the opposite signal (relative to the bulk LDI), i.e., if LDI in clay is higher than the bulk then LDI in fine silt is lower and vice versa, but it is to be noted that few samples have a studied clay fraction. Some bulk LDI-SST values (from M11, M26, M76) shows an offset of more than 7°C with annual-averaged SST from World Ocean Atlas (WOA) 2018 (Locarnini et al., 2018) (Figure 4B). Yet, the majority of LDI-SST from bulk and fractions fit well within the global LDI-SST calibration (De Bar et al., 2020) (Figure 4C).
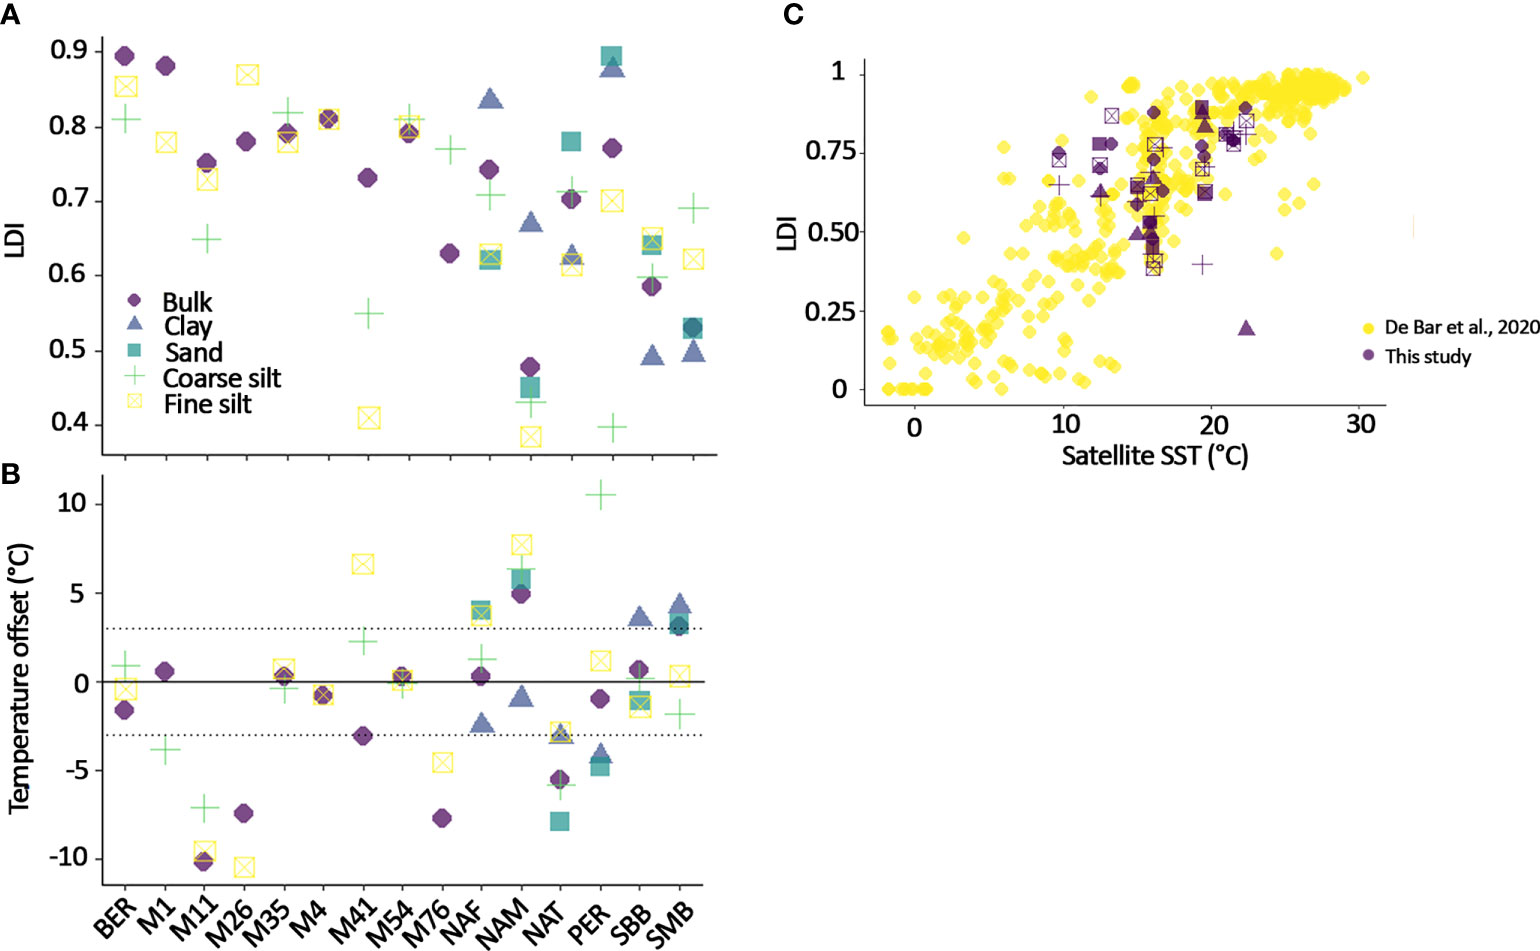
Figure 4 (A) LDI in fractions, (B) Offset with SST from World Ocean Atlas (WOA) 2018 (Locarnini et al., 2018) resulting from the difference between SST-WOA and LDI-SST, the dashed grey line indicates the error associated with the LDI calibration (± 3°C), and (C) LDI in our study compared with the global calibration of De Bar et al. (2020).
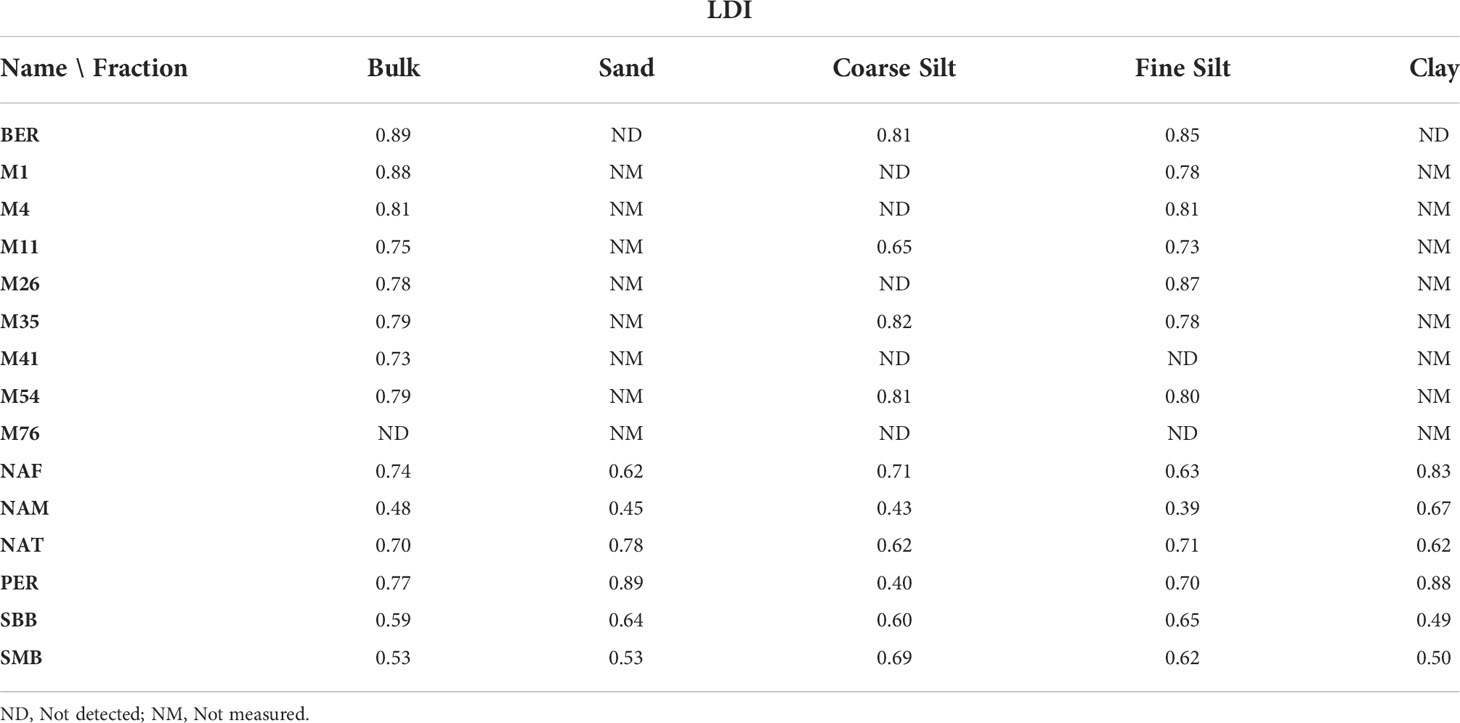
Table 3 LDI in the surface sediments.
NDI Bulk NDI values vary from 0.12 in M41 to 0.66 in M26 (Figure 5A). There are some differences in NDI between the fraction and the bulk, especially in NAT, M1, M11, M26, M4, M41where the coarse silt and fine silt fractions are off by at least 0.1 units. In addition, the sand fraction in NAT and the clay fraction in SMB deviate from the bulk by +0.1 and -0.1 units, respectively.
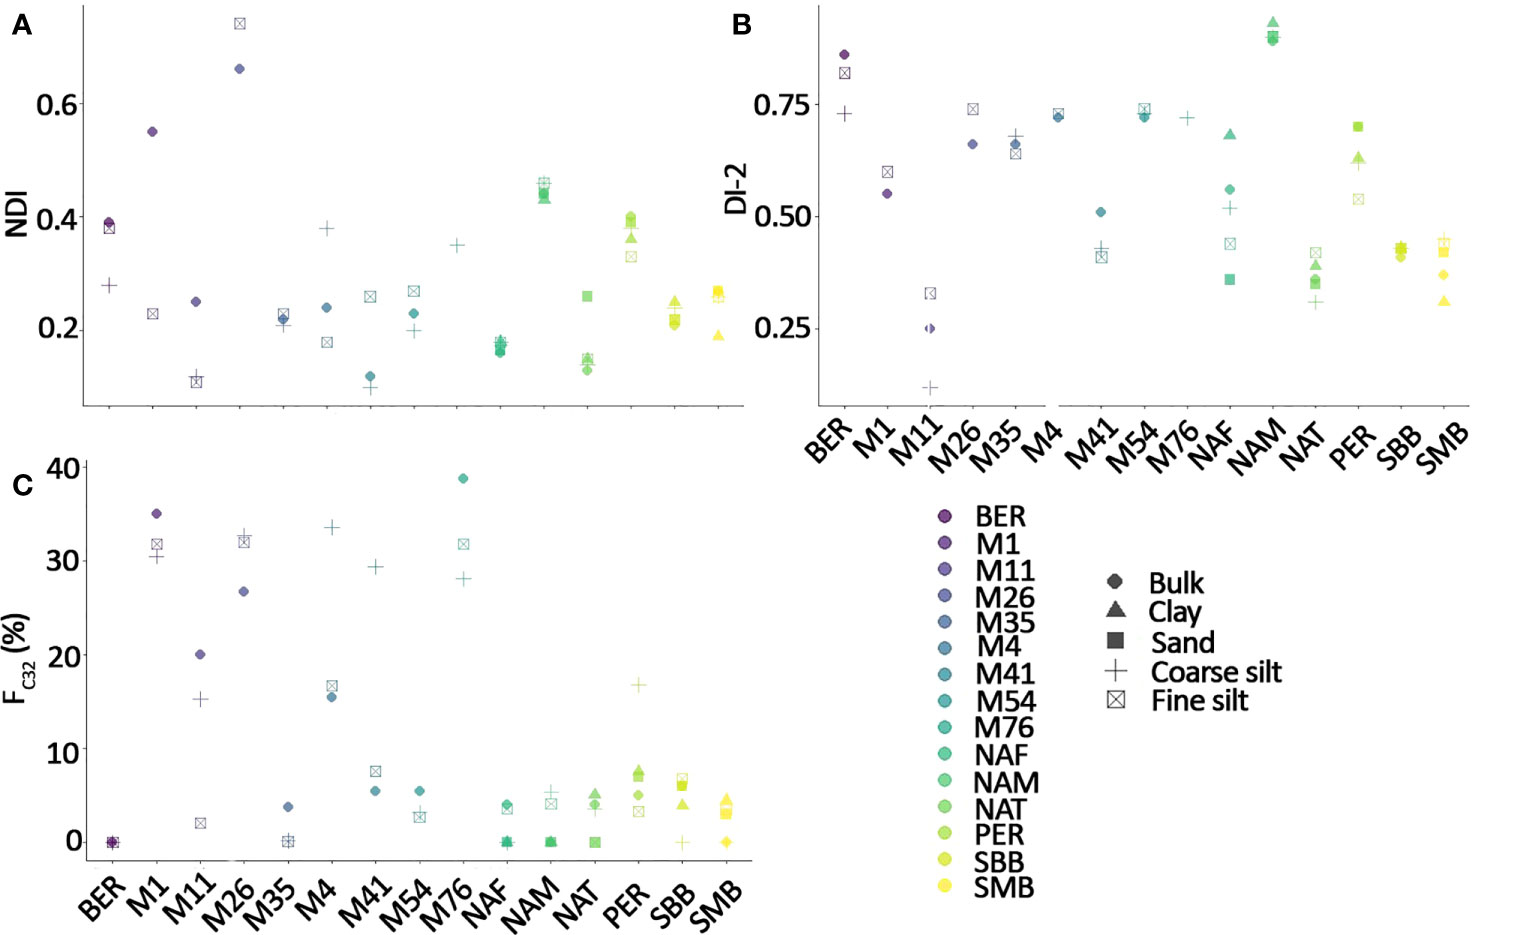
Figure 5 Effect of grain-size on (A) NDI (Gal et al., 2018), (B) DI-2 (Willmott et al., 2010), and (C) FC32 (Lattaud et al., 2017).
DI-2 Bulk DI-2 values vary from 0.25 in M11 to 0.89 in NAM (Figure 5B), with little difference between the fractions and the bulk, except for the sand and clay fractions in NAF (difference with the bulk DI-2 of 0.2 and 0.1, respectively).
FC32 The FC32 varies from 0 (SMB, NAM, BER) to 0.39 in M76 (Figure 5C), but most surface sediments are below 0.2, as expected from regions distal from riverine input (Lattaud et al., 2017). Nevertheless, there is a notable discrepancy between the fractions and the bulk sediment.
Depth profile The LDI slightly decreases in bulk sediment from the deepest layer (> 10 cm depth) to the top of the core, varying from 0.82 at 30 – 31 cm to 0.79 in the 1 – 2 cm layer. The LDI in the coarse and fine silts fractions show a similar trend. This decrease corresponds to a ~ 0.5 °C difference in SST (using the equation of De Bar et al., 2020) between the deepest and top layer, which is within the error (3°C) associated with LDI SST reconstruction. DI-2 in the fractions and bulk of the depth profile are all within 0.2 (average of 0.74 ± 0.01). Only FC32 shows a slight difference between the top (1 – 2 cm layer) and downcore with values in the bulk, CS and FS fractions of ~ 0.05 versus 0.01 (Figure 3).
4 Discussion
4.1 Stabilization of LCDs
Overall, the LCDs are found to preferentially reside in the fine silt fraction (which is also the fraction of highest LCD loadings, i.e., LCD concentration normalized to mineral surface area, expressed as ng m-2, Figure 2D), and the fraction containing most of the OM (highest TOC, Ausín et al., 2021; this study). The fine silt fraction is generally characterized by the highest MSA at most sites, between 14.6 m2 g-1 in SMB to 42.1 m2 g-1 in PER, only after clay in some samples (Ausín et al., 2021, Table 4), albeit noting that clay fractions were too small to determine MSA in most samples. Previous studies have shown that mineral-bound OM is stabilized and protected from degradation, with larger surface areas affording a greater the degree of protection (Blattmann et al., 2019). Thus, sand fractions, which in theory have the smallest surface area (due to the low amount of sand in the samples, its surface area is not measured) would offer less protection to OM than finer grain sizes. However, we find that LCDs are relatively abundant in this fraction. The sand fraction at these sites is likely composed of significant amount of biogenic minerals such as opal frustules, which could explain the presence of LCDs, assuming that they predominantly originate from diatoms (Ingalls et al., 2003; Rampen et al., 2008; Rampen et al., 2014a; Rampen et al., 2022). When compared with TOC, LCD concentrations (mass-normalized, either individual mid-alcohol position or all LCD together) are not correlated (Pearson r< 0.05), indicating a different behaviour than the bulk OM or that LCD production is not linked to major productivity events (Supplementary Figure 3). This also differs from alkenone distributions in the same samples (Pearson r = 0.81, Ausín et al., 2022), and may imply that the fate of LCDs in marine sediments is controlled by other mechanisms than those that control OM and alkenones (e.g., hydrodynamic processes, Ausín et al., 2022).
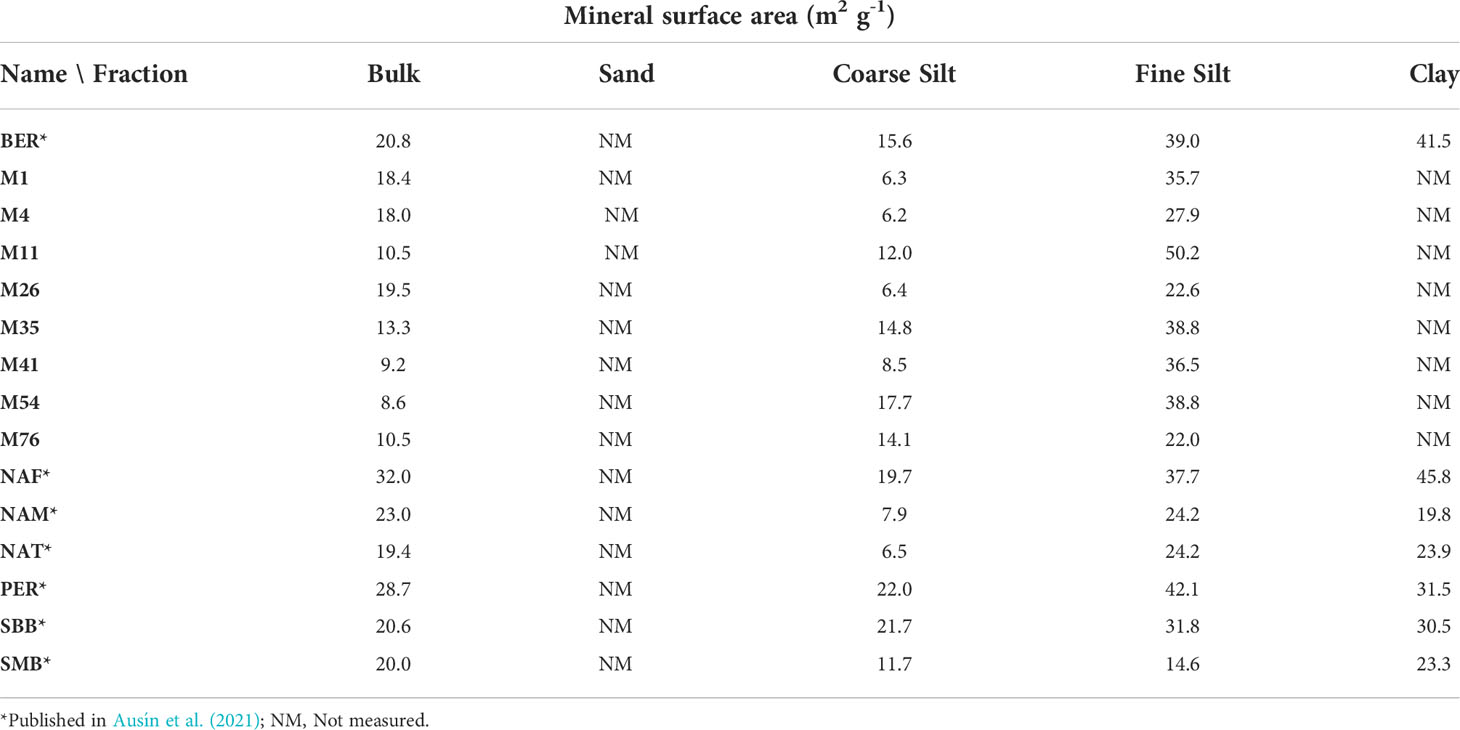
Table 4 Mineral surface area in each fraction of the surface sediments, the error associated with the measurements is ± 1 m2 g-1.
4.2 Transport and preferential degradation effects on LCD proxies
LCDs are mainly present in the fine silt fraction, which in turn contributes substantially to the bulk sediment mass (Supplementary Figure 2). Despite potential loss of LCDs during the fractionation process that may impart differences in their total concentration in grain-size fractions (see §4.4.), fine silt has also shown to host the highest amounts of alkenones in this sample suite (Ausín et al., 2022). Given this fraction is prone to resuspension and lateral transport (McCave et al., 1995; McCave et al., 2017), this implies that the accuracy of LCD-based proxy reconstruction in regions with strong lateral transport might be compromised, as observed in alkenone- and GDGT-derived proxies (e.g., Benthien and Müller, 2000; Ohkouchi et al., 2002; Rühlemann and Butzin, 2006; Mollenhauer et al., 2007; Mollenhauer et al., 2008; Kim et al., 2009; Ausín et al., 2021). We therefore further assess the fidelity of the LCD-based SST proxy in bulk sediments and specific grain size fractions in the following sections.
4.2.1 Site-specific LCD-temperature in bulk sediments
LDI-SST in bulk sediments reflects annual-mean satellite-derived SST at most of the sites (within the ± 3°C error margin of the calibration, De Bar et al., 2020), except in NAM (LDI-SST is 5°C colder than SST in the WOA2018) and NAT, M11, M26, M76 (LDI-SST are 5°C warmer than SST in the WOA2018) (Figure 4). Two effects are likely at play here: 1) for NAM it is the effect of Proboscia spp that produce small amount of 1,13-diols (in addition to their dominant 1,14-diols) which will affect the LDI calculation and reconstructed temperature (e.g., Rampen et al., 2014a; Rodrigo-Gámiz et al., 2015; De Bar et al., 2020). The relative abundance of 1,13-diols is generally increasing in colder water in comparison to warmer water, hence if their abundance increases, LDI will reflect a colder signal. NAM is characterized by 78% of 1,14-diols, and likely large amount of Proboscia diatoms which will produce a biased LDI-SST towards colder than measured temperatures (De Bar et al., 2020; Erdem et al., 2021). 2) For the Mid-Atlantic Bight area, all surface sediments north of Cape Cod yield warmer LDI-SST values than observed. This has also been observed in NAT using alkenones, where reconstructed Uk’37-SST yield warmer temperatures (+ 4°C, Supplementary Figure 4, Ausín et al., 2022). For alkenones, this warmer bias has been mainly ascribed to seasonality in the production reflecting summer temperatures, and lateral transport of alkenones from warmer southern waters (Goni et al., 2001; Sachs and Anderson, 2003; Conte et al., 2006). Preferential degradation of the C37:3 alkenone compared with the C37:2 alkenone (Rosell-Melé et al., 1995) has also been proposed as a possible explanation (Ausín et al., 2022). LCDs have been shown to degrade homogenously between isomers when the oxygen state of the environment is stable, i.e., always oxic or always anoxic (Rodrigo-Gámiz et al., 2016; Reiche et al., 2018), hence preferential isomer degradation is an unlikely cause of the warm LDI-SST signal. The western North Atlantic margin is characterized by a strong seasonal variation in temperature (7°C in winter, 11 °C in spring, 20 °C in summer and 14 °C in the fall, Locarnini et al., 2018) and a strong surface current emanating from southern warmer regions (Twichell et al., 1981; Goff et al., 2019). The LDI-SST (18°C) suggests a bias towards summer temperature (which has been shown before for LCDs in other regions, e.g., Lattaud et al., 2019), and warmer water from the south. It is interesting to note that M4, M54 and M35 do not show this warm bias although these locations could be more influenced by the southern warm current, although hydrography is very complex in this area (Hwang et al., 2021).
4.2.2 LCD proxies in grain-size fractions
The fraction-weighted LDI-temperatures are similar to the bulk LDI-temperature (within error of the calibration: ± 3°C), except in BER (+ 6°C) (Figure 4). In BER, no LCDs were measured in the clay and sand fractions due to low absolute concentrations, compromising the calculation of fraction-weighted LDI-SST. For all other sites, temperature offset in the fraction compared to the bulk is on average (for all sites) smaller in the sand (1.8°C)< fine silt (2.1°C)< clay (2.6°C)< coarse silt (3.5°C). The sand and coarse silt fractions have the largest difference from satellite temperatures (3.8°C and 3.4°C, respectively), while fine silt and clay fractions are the closest to satellite data (2.9 °C and 2.7 °C, respectively). These results might reflect the effect of lateral transport on the coarse silt fraction (i.e., allochthonous LCDs), preferential preservation of diatom frustules in the sand fraction (and so effect of the 1,14-diols on the LDI), and selective degradation in the sand fraction (less mineral surface protection, Blattmann et al., 2019), although the temperatures reconstructed from the sand fractions are relatively similar to those of the other fractions, which is contrary to observations for alkenones (Ausín et al., 2022).
In comparison with the alkenone based Uk’37-SST (Ausín et al., 2022), the most similar fraction is the clay with on average ± 1.7 °C, and the largest differences are found in the coarse and fine silts fractions (± 4.5°C for both, Supplement Figure 2). The clay fraction is less prone to degradation and to transport. In addition, alkenones in the clay fraction are likely derived from overlying waters and thus reflecting local temperatures (indicated also by the fact that they showed the youngest radiocarbon ages – albeit noting that alkenone in the sand fraction has not been measured, Ausín et al., 2022). This indicates that LCDs are less likely to be either degraded or transported and better reflect local surface ocean temperatures.
For the other LCD proxies (not related to temperature), NDI (Proboscia spp. presence), and DI-2 (upwelling and nutrient conditions) seems to be influenced by grain size (Figure 5). For example, DI-2 show up to a 0.3 unit difference which, for example, is equivalent to the difference that can be observed between the Younger Dryas and surface sediment in the Arabian Sea (Erdem et al., 2021). In most sites, proxy values in the fine silt fraction are more similar to the bulk proxies (in comparison to coarse silt fraction), which is in agreement with the preponderance of LCDs residing in the fine silt fraction.
4.3 Post-depositional influences on LCD-proxies
In the short core (at location M54), LCD concentrations for the bulk do not change with depth (49 ± 8 ng g-1, Figure 3) while they strongly vary for the grain-size fractions, especially in the fine silt fraction (from 45 ng g-1 to 330 ng g-1). TOC in the core remains constant at ~ 4%, indicating no large change in degradation/deposition of OM. The coarse silt fraction show a similar behaviour, yet with smaller changes. The increase in LCD concentration might indicates a change in sediment source or surface ocean productivity as diagenetic effect are likely to have minor effects due to such high sedimentation rate (50 cm in 30 years).
LDI values of bulk sediment and corresponding grain size fractions are slightly but systematically lower in the top part (bulk, 0.81 ± 0.01) than in the bottom part (> 10 cm depth, bulk LDI, 0.83 ± 0.01) of core M54 which results in a difference in reconstructed absolute temperature of 0.7°C, i.e., well within the uncertainty of the calibration (De Bar et al., 2020). This offset is also present in the fractions. Furthermore, there is no significant difference between the fraction in the other LCD-derived proxies. This indicates that grain-size specific degradation in the timescale of our short core, i.e., decades, has no substantial effect on LDI and LDI-derived temperatures.
4.4 Effect of laboratory fractionation of the sediments
Although recovery of sediments after fractionation was not directly monitored by Ausín et al. (2021), previous studies have reported recovery percentages in excess of 80% (Tesi et al., 2016; Magill et al., 2018). To study the effect of potential release or loss of dissolved organic carbon and increase reactivity of organic matter following the fractionation procedure (Stemmer et al., 1998; Xu et al., 2009), we investigated the fraction-weighted concentrations of LCDs and compared these to bulk concentrations.
The fraction-weighted LCD concentration (calculated by adding LCD concentration found in each fraction normalized by the relative percentage of each fraction size found in the bulk) ranges between -90% and +60%, except for NAM where it is significantly higher (~ +700%). This observation indicates the loss (for all negative values) or apparent gain (all positive values) of LCDs in the fractions in relation to the bulk. Loss of LCDs can be explained by loss during sediment fractionation due to desorption, similar to what has been observed for alkenones (Ausín et al., 2022). Enhanced availability of LCDs for solvent extraction following the fractionation procedure could explain the positive differences relative to bulk (gain of LCD). Two possibilities for releasing LCDs exist: 1) the degradation of the cell wall biopolymer algaenan where LCDs form its building blocks (linked by ether bonds, Gelin et al., 1997; Reiche, 2020), and 2) the dissolution of biogenic minerals (such as opal frustules) that may be associated with some LCD (1,14-diols in particular). For 1), Reiche et al. (2018) observed a release of LCDs (1,13- and 1,15-diols) during a 271-day oxic incubation experiment of eustigmatophyte biomass, with up to a 30-fold increase of LCDs after 125 days, indicating the potential for algaenan to be degraded. For 2) Proboscia spp. are large diatoms that make thin shell of opal (frustule, Koning et al., 2001; Tarazona et al., 2003), and that produce 1,14-diols and traces of 1,13-diols (Rampen et al., 2014a). It is likely that, when the diatoms die and sink to the seafloor, LCDs could be locally concentrated on (and even in) these biogenic opal particles. In turn, these biogenic particles could have been dissolved during the grain size fractionation process since it was performed using MilliQ water, which is undersaturated with respect to opal. Hence, partial dissolution of opal during the sample processing (i.e., grain size fractionation) might have liberated LCDs (mainly 1,14-diols) in diatom-rich samples (e.g., such as NAM and PER) that were hitherto not accessible to solvent extraction. The higher fraction-weighted concentration than for the bulk might represent a release of LCD from the recalcitrant algaenan biopolymer and opal frustule dissolution during the fractionation protocol. Future such studies involving grain size fraction may therefore benefit from replacement of MilliQ water with artificial seawater to minimize dissolution of biogenic minerals.
5 Conclusion
LCDs are mostly present in the fine silt fraction in all sediment samples investigated which also comprises the fraction containing the most organic matter. However, LCD concentrations do not correlate with organic matter content, or with alkenone concentration, implying that they exhibit different behavior in terms of production, transport, and/or degradation. Consistent with prior observations, LDI-reconstructed temperatures are subject to bias in upwelling/nutrient-rich regions in both bulk sediments and grain size fractions. Furthermore, results suggest that LCD concentrations and corresponding proxies are not significantly impacted by lateral transport and hydrodynamic particle sorting, implying that they may serve as robust proxies in hydrodynamically complex settings. Further investigations are needed to understand potential artefacts associated with sample processing, specifically mineral dissolution or organic matter degradation effects, on LCD concentrations and distributions.
Data availability statement
All data generated during this study are available in the manuscript and at the ETH data repository at the DOI: 10.3929/ethz-b-000574232.
Author contributions
JL, TE, and BA designed the study. BA and MT extracted the sediments, JL performed the analysis. LB, ZE, MT and TE contributed to the interpretation. The manuscript has been written with the help of all co-authors. All authors contributed to the article and approved the submitted version.
Funding
JL was funded by a Rubicon grant [019.183EN.002] from NWO, Netherlands Organization for scientific research. B.A. was supported by the project “TRAMPOLINE” (200021_175823) funded by the Swiss National Science Foundation. Open access funding provided by ETH Zurich.
Acknowledgments
We thank Nathalie Dubois, Céline Martin and the Surface Waters Research and Management of EAWAG for access to the GC-MS. We acknowledge Daniel Montluçon for onboard processing many of the sediment cores used in this study. We thank Lloyd Keigwin for provision of core M54.
Conflict of interest
The authors declare that the research was conducted in the absence of any commercial or financial relationships that could be construed as a potential conflict of interest.
Publisher’s note
All claims expressed in this article are solely those of the authors and do not necessarily represent those of their affiliated organizations, or those of the publisher, the editors and the reviewers. Any product that may be evaluated in this article, or claim that may be made by its manufacturer, is not guaranteed or endorsed by the publisher.
Supplementary material
The Supplementary Material for this article can be found online at: https://www.frontiersin.org/articles/10.3389/fmars.2022.1004096/full#supplementary-material
References
Arthur M. A., Dean W. E., Laarkamp K. (1998). Organic carbon accumulation and preservation in surface sediments on the Peru margin. Chem. Geol 152 (3–4), 273–286. doi: 10.1016/S0009-2541(98)00120-X
Ausín B., Bruni E., Haghipour N., Welte C., Bernasconi S. M., Eglinton T. I. (2021). ‘Controls on the abundance, provenance and age of organic carbon buried in continental margin sediments’. Earth Planetary Sci. Lett. 558, 116759. doi: 10.1016/j.epsl.2021.116759
Ausín B., Haghipour N., Bruni E., Eglinton T. (2022). The influence of lateral transport on sedimentary alkenone paleoproxy signals. Biogeosciences 19 (3), 613–627. doi: 10.5194/bg-19-613-2022
Balzano S., Villanueva L., de Bar M. W., Sahonero-Canavesi D., Yildiz C., Engelmann J., et al. (2019). ‘Biosynthesis of long chain alkyl diols and long chain alkenols in Nannochloropsis spp. (Eustigmatophyceae)’. Plant Cell Physiol., 60, pcz078. doi: 10.1093/pcp/pcz078
Balzano S., Villanueva L., de Bar M., Sinninghe Damsté J. S., Schouten S. (2017). ‘Impact of culturing conditions on the abundance and composition of long chain alkyl diols in species of the genus Nannochloropsis’. Organic Geochem 108, 9–17. doi: 10.1016/j.orggeochem.2017.02.006
Bao R., Blattmann T. M., McIntyre C., Zhao M., Eglinton T. I. (2019). Relationships between grain size and organic carbon 14C heterogeneity in continental margin sediments. Earth Planetary Sci. Lett. 505, 76–85. doi: 10.1016/j.epsl.2018.10.013
Bao R., McIntyre C., Zhao M., Zhu C., Kao S. J., Eglinton T. I. (2016). Widespread dispersal and aging of organic carbon in shallow marginal seas. Geology 44 (10), 791–794. doi: 10.1130/G37948.1
Bao R., van der Voort T. S., Zhao M., Guo X., Montluçon D. B., McIntyre C., et al. (2018). Influence of hydrodynamic processes on the fate of sedimentary organic matter on continental margins. Global Biogeochem Cycles 32 (9), 1420–1432. doi: 10.1029/2018GB005921
Benthien A., Müller P. J. (2000). Anomalously low alkenone temperatures caused by lateral particle and sediment transport in the malvinas current region, western Argentine basin. Deep-Sea Res. Part I: Oceanogr Res. Papers 47 (12), 2369–2393. doi: 10.1016/S0967-0637(00)00030-3
Blattmann T. M., Liu Z., Zhang Y., Zhao Y., Haghipour N., Montluçon D. B., et al. (2019). Mineralogical control on the fate of continentally derived organic matter in the ocean. Science 366 (6466), 742–745. doi: 10.1126/science.aax5345
Bröder L., Tesi T., Andersson A., Eglinton T. I., Semiletov I. P., Dudarev O. V., et al. (2016). Historical records of organic matter supply and degradation status in the East Siberian Sea. Organic Geochem 91, 16–30. doi: 10.1016/j.orggeochem.2015.10.008
Brunauer S., Emmett P. H., Teller E. (1938). ‘Adsorption of gases in multimolecular layers’. J. Am. Chem. Soc. 60 (2), 309–319. doi: 10.1021/ja01269a023
Conte M. H., Sicre M. A., Rühlemann C., Weber J. C., Schulte S., Schulz-Bull D., et al. (2006). Global temperature calibration of the alkenone unsaturation index (Uk37) in surface waters and comparison with surface sediments. Geochem Geophys Geosystems 7 (2). doi: 10.1029/2005GC001054
De Bar M. W., Weiss G., Yildiz C., Rampen S. W., Lattaud J., Bale N. J., et al. (2020). ‘Global temperature calibration of the long chain diol index in marine surface sediments’. Organic Geochem 142, 103983. doi: 10.1016/j.orggeochem.2020.103983
Erdem Z., Lattaud J., Erk M. R., Mezger E., Reichart G., Lückge A., et al. (2021). ‘Applicability of the long chain diol index (LDI) as a sea surface temperature proxy in the Arabian sea’. Paleoceanogr Paleoclimatol, 36, 1–15. doi: 10.1029/2021pa004255
Freymond C. V., Kündig N., Stark C., Peterse F., Buggle B., Lupker M., et al. (2018). Evolution of biomolecular loadings along a major river system. Geochim Cosmochim Acta 223, 389–404. doi: 10.1016/j.gca.2017.12.010
Gal J. K., Kim J. H., Kim S., Hwang J., Shin K. H. (2021). Assessment of the nutrient diol index (NDI) as a sea surface nutrient proxy using sinking particles in the East Sea. Mar. Chem. 231, 103937. doi: 10.1016/j.marchem.2021.103937
Gal J.-K. K., Kim J.-H. H., Shin K.-H. H. (2018). Distribution of long chain alkyl diols along a south-north transect of the northwestern pacific region: insights into a paleo sea surface nutrient proxy. Organic Geochem 119, 80–90. doi: 10.1016/j.orggeochem.2018.01.010
Gelin F., Boogers I., Noordeloos A. A. M., Sinninghe Damsté J. S., Riegman R., De Leeuw J. W. (1997). Resistant biomacromolecules in marine microalgae of the classes eustigmatophyceae and chlorophyceae: Geochemical implications. Organic Geochem 26 (11–12), 659–675. doi: 10.1016/S0146-6380(97)00035-1
Goff J. A., Reed A. H., Gawarkiewicz G., Wilson P. S., Knobles D. P. (2019). ‘Stratigraphic analysis of a sediment pond within the new England mud patch: New constraints from high-resolution chirp acoustic reflection data’. Mar. Geol 412 (March), 81–94. doi: 10.1016/j.margeo.2019.03.010
Gogou A., Stephanou E. G. (2004). Marine organic geochemistry of the Eastern Mediterranean: 2. polar biomarkers in Cretan Sea surficial sediments. Mar. Chem. 85 (1–2), 1–25. doi: 10.1016/j.marchem.2003.08.005
Goni M. A., Hartz D. M., Thunell R. C., Tappa E. (2001). Oceanographic considerations for the application of the alkenone-based paleotemperature U37K index in the gulf of California. Geochim Cosmochim Acta 65 (4), 545–557. doi: 10.1016/S0016-7037(00)00559-7
Hemingway J. D., Rothman D. H., Grant K. E., Rosengard S. Z., Eglinton T. I., Derry L. A., et al. (2019). Mineral protection regulates long-term global preservation of natural organic carbon. Nature 570 (7760), 228–231. doi: 10.1038/s41586-019-1280-6
Hwang J., Blusztajn J., Giosan L., Kim M., Manganini S. J., Montluçon D., et al. (2021). Lithogenic particle transport trajectories on the Northwest Atlantic margin. J. Geophys Research: Oceans 126 (1), 1–11. doi: 10.1029/2020JC016802
Ingalls A. E., Lee C., Wakeham S. G., Hedges J. I. (2003). ‘The role of biominerals in the sinking flux and preservation of amino acids in the southern ocean along 170 1 w’. Deep Sea Res. Part II: Topical Stud. Oceanogr 50, 713–738. doi: 10.1016/S0967-0645(02)00592-1
Inthorn M., Wagner T., Scheeder G., Zabel M. (2006). Lateral transport controls distribution , quality , and burial of organic matter along continental slopes in high-productivity areas. Geology 3), 205–208. doi: 10.1130/G22153.1
Keil R. G., Mayer L. M., Quay P. D., Richey J. E., Hedges J. I. (1997). Loss of organic matter from riverine particles in deltas. Geochim Cosmochim Acta 61 (7), 1507–1511. doi: 10.1016/S0016-7037(97)00044-6
Kim J. H., Crosta X., Michel E., Schouten S., Duprat J., Sinninghe Damsté J. S. (2009). Impact of lateral transport on organic proxies in the southern ocean. Quaternary Res. 71 (2), 246–250. doi: 10.1016/j.yqres.2008.10.005
Koning E., van Iperen J. M., van Raaphorst W., Helder W., Brummer G.-J. A., van Weering T. C. E. (2001). ‘Selective preservation of upwelling-indicating diatoms in sediments off Somalia, NW Indian ocean’. Deep Sea Res. Part I: Oceanogr Res. Papers 48 (11), 2473–2495. doi: 10.1016/s0967-0637(01)00019-x
Lattaud J., Bröder L., Haghipour N., Rickli J., Giosan L., Eglinton T. I. (2021). Influence of hydraulic connectivity on carbon burial efficiency in Mackenzie delta lake sediments. J. Geophys Research: Biogeosci 126 (3), e2020JG006054. doi: 10.1029/2020jg006054
Lattaud J., Kim J., Jonge C., Zell C. (2017). ‘The C32 alkane-1,15-diol as a tracer for riverine input in coastal seas’. Climate Past 202 (12), 146–158. doi: 10.1016/j.gca.2016.12.030
Lattaud J., Lo L., Zeeden C., Liu Y. J., Song S. R., van der Meer M. T. J., et al. (2019). ‘A multiproxy study of past environmental changes in the Sea of Okhotsk during the last 1.5 Ma’. Organic Geochem 132, 50–61. doi: 10.1016/j.orggeochem.2019.04.003
Locarnini R. A., Mishonov A. V., Baranova O. K., Boyer T. P., Zweng M. M., Garcia H. E., et al. (2018). ‘World ocean atlas 2018, volume 1: Temperature’, in World ocean atlas 2018, volume 1: Temperature. a. Mishono 81, 52.
Magill C. R., Ausín B., Wenk P., McIntyre C., Skinner L., Martínez-García A., et al. (2018). Transient hydrodynamic effects influence organic carbon signatures in marine sediments. Nat. Commun. 9 (1), 1–8. doi: 10.1038/s41467-018-06973-w
Mayer L. M. (1994). Surface area control of organic carbon accumulation in continental shelf sediments. Geochimica and Cosmochimica Acta 58, 4, 1271–1284. doi: 10.1016/0016-7037(94)90381-6
McCave I. N., Manighetti B., Robinson S. G. (1995). Sortable silt and fine sediment size/composition slicing: Parameters for palaeocurrent speed and palaeoceanography. Paleoceanography 10 (3), 593–610. doi: 10.1029/94PA03039
McCave I. N., Thornalley D. J. R., Hall I. R. (2017). Relation of sortable silt grain-size to deep-sea current speeds: Calibration of the “Mud current meter”. Deep-Sea Res. Part I: Oceanogr Res. Papers 127, 1–12. doi: 10.1016/j.dsr.2017.07.003
Meyers P. A. (1994). Preservation of elemental and isotopic source identification of sedimentary organic matter. Chem. Geol 114 (3–4), 289–302. doi: 10.1016/0009-2541(94)90059-0
Moffitt S. E., Moffitt R. A., Sauthoff W., Davis C. V., Hewett K., Hill T. M. (2015). Paleoceanographic insights on recent oxygen minimum zone expansion: Lessons for modern oceanography. PloS One 10 (1), 1–39. doi: 10.1371/journal.pone.0115246
Mollenhauer G., Eglinton T. I. (2007). ‘Diagenetic and sedimentological controls on the composition of organic matter preserved in California borderland basin sediments’. Limnol Oceanogr 52 (2), 558–576. doi: 10.4319/lo.2007.52.2.0558
Mollenhauer G., Eglinton T. I., Hopmans E. C., Sinninghe Damsté J. S. (2008). A radiocarbon-based assessment of the preservation characteristics of crenarchaeol and alkenones from continental margin sediments. Organic Geochem 39 (8), 1039–1045. doi: 10.1016/j.orggeochem.2008.02.006
Mollenhauer G., Inthorn M., Vogt T., Zabel M., Sinninghe Damsté J. S., Eglinton T. I. (2007). Aging of marine organic matter during cross-shelf lateral transport in the benguela upwelling system revealed by compound-specific radiocarbon dating. Geochem Geophys Geosystems 8 (9), Q09004. doi: 10.1029/2007GC001603
Mollenhauer G., Kienast M., Lamy F., Meggers H., Scheider R. R., Hayes J. M., et al. (2005). An evaluation of 14C age relationships between co-occurring foraminifera, alkenones, and total organic carbon in continental margin sediments. Paleoceanography 20 (1), PA1016. doi: 10.1029/2004PA001103
Murphy S., Nazzaro L., Simkins J., Oliver M., Kohut J., Crowley M., et al. (2021). Persistent upwelling in the mid-Atlantic bight detected using gap-filled, high-resolution satellite SST. Remote Sens. Environ. 262, 112487. doi: 10.1016/j.rse.2021.112487
Ohkouchi N., Eglinton T. I., Keigwin L. D., Hayes J. M. (2002). Spatial and temporal offsets between proxy records in a sediment drift. Science 298 (5596), 1224–1227. doi: 10.1126/science.1075287
Rampen S. W., Abbas B. A., Schouten S., Damsté J. S. S. (2010). A comprehensive study of sterols in marine diatoms (Bacillariophyta): Implications for their use as tracers for diatom productivity. Limnol Oceanogr 55 (1), 91–105. doi: 10.4319/lo.2010.55.1.0091
Rampen S. W., Datema M., Rodrigo-Gámiz M., Schouten S., Reichart G. J., Sinninghe Damsté J. S. (2014a). Sources and proxy potential of long chain alkyl diols in lacustrine environments. Geochim Cosmochim Acta 144, 59–71. doi: 10.1016/j.gca.2014.08.033
Rampen S. W., Friedl T., Rybalka N., Thiel V. (2022). ‘The long chain diol Index : A marine palaeotemperature proxy based on eustigmatophyte lipids that records the warmest seasons’. Proc. Natl. Acad. Sci. 119 (16), 1–11. doi: 10.1073/pnas.2116812119/-/DCSupplemental.Published
Rampen S. W., Schouten S., Koning E., Brummer G. J. A., Sinninghe Damsté J. S. (2008). A 90 kyr upwelling record from the northwestern Indian ocean using a novel long-chain diol index. Earth Planetary Sci. Lett. 276 (1–2), 207–213. doi: 10.1016/j.epsl.2008.09.022
Rampen S. W., Schouten S., Schefuß E., Sinninghe Damsté J. S. (2009). Impact of temperature on long chain diol and mid-chain hydroxy methyl alkanoate composition in Proboscia diatoms: Results from culture and field studies. Organic Geochem 40 (11), 1124–1131. doi: 10.1016/j.orggeochem.2009.08.005
Rampen S. W., Schouten S., Sinninghe Damsté J. S. (2011). Occurrence of long chain 1,14-diols in Apedinella radians. Organic Geochem 42 (5), 572–574. doi: 10.1016/j.orggeochem.2011.03.009
Rampen S. W., Schouten S., Wakeham S. G., Sinninghe Damsté J. S. (2007). Seasonal and spatial variation in the sources and fluxes of long chain diols and mid-chain hydroxy methyl alkanoates in the Arabian Sea. Organic Geochem 38 (2), 165–179. doi: 10.1016/j.orggeochem.2006.10.008
Rampen S. W., Willmott V., Kim J. H., Rodrigo-Gámiz M., Uliana E., Mollenhauer G., et al. (2014b). Evaluation of long chain 1,14-alkyl diols in marine sediments as indicators for upwelling and temperature. Organic Geochem 76, 39–47. doi: 10.1016/j.orggeochem.2014.07.012
Rampen S. W., Willmott V., Kim J. H., Uliana E., Mollenhauer G., Schefuß E., et al. (2012). Long chain 1,13- and 1,15-diols as a potential proxy for palaeotemperature reconstruction. Geochim Cosmochim Acta 84, 204–216. doi: 10.1016/j.gca.2012.01.024
Reiche S. (2020). The impact of diagenesis and sequestration on long- chain diols and derived marine proxies. Doctoral dissertation, Utrecht University.
Reiche S., Rampen S. W., Dorhout D. J. C., Sinninghe Damsté J. S., Schouten S. (2018). The impact of oxygen exposure on long-chain alkyl diols and the long chain diol index (LDI) – a long-term incubation study. Organic Geochem 124, 238–246. doi: 10.1016/j.orggeochem.2018.08.003
Rodrigo-Gámiz M., Martinez-Ruiz F., Rampen S. W., Schouten S., Damsté J. S. S. (2014). Sea Surface temperature variations in the western Mediterranean Sea over the last 20 kyr: a dual-organic proxy (UK’37 and LDI) approach. Paleoceanography 29 (2), 87–98. doi: 10.1002/2013pa002466
Rodrigo-Gámiz M., Rampen S. W., De Haas H., Baas M., Schouten S., Sinninghe Damsté J. S. (2015). Constraints on the applicability of the organic temperature proxies UK’37, TEX86 and LDI in the subpolar region around Iceland. Biogeosciences 12 (22), 6573–6590. doi: 10.5194/bg-12-6573-2015
Rodrigo-Gámiz M., Rampen S. W., Schouten S., Sinninghe Damsté J. S. (2016). The impact of oxic degradation on long chain alkyl diol distributions in Arabian Sea surface sediments. Organic Geochem 100, 1–9. doi: 10.1016/j.orggeochem.2016.07.003
Rosell-Melé A., Eglinton G., Pflaumann U., Sarnthein M. (1995). Atlantic Core-top calibration of the U37K index as a sea-surface palaeotemperature indicator. Geochim Cosmochim Acta 59 (15), 3099–3107. doi: 10.1016/0016-7037(95)00199-a
Rühlemann C., Butzin M. (2006). Alkenone temperature anomalies in the Brazil-malvinas confluence area caused by lateral advection of suspended particulate material. Geochem Geophys Geosystems 7 (10), Q10015. doi: 10.1029/2006GC001251
Sachs J. P., Anderson R. F. (2003). Fidelity of alkenone paleotemperatures in southern cape basin sediment drifts. Paleoceanography 18 (4), 1–19. doi: 10.1029/2002PA000862
Sinninghe Damsté J. S., Rampen S., Irene W., Rijpstra C., Abbas B., Muyzer G., et al. (2003). A diatomaceous origin for long-chain diols and mid-chain hydroxy methyl alkanoates widely occurring in quaternary marine sediments: Indicators for high-nutrient conditions. Geochim Cosmochim Acta 67 (7), 1339–1348. doi: 10.1016/S0016-7037(02)01225-5
Smith M., Deckker P., Rogers J., Brocks J., Hope J., Schmidt S., et al. (2013). ‘Comparison of TEX86, and LDI temperature proxies for reconstruction of south-east Australian ocean temperatures’. Organic Geochem 64, 94–104. doi: 10.1016/j.orggeochem.2013.08.015
Stemmer M., Gerzabek M. H., Kandeler E. (1998). Organic matter and enzyme activity in particle-size fractions of soils obtained after low-energy sonication. Soil Biol. Biochem. 30 (1), 9–17. doi: 10.1016/S0038-0717(97)00093-X
Talley L., Pickard G., Emery W., Swift J. E. (2011). “Chapter 9 - Atlantic ocean’ in Descriptive physical oceanography, Sixth Edition (Academic Press), 245–301. doi: 10.1016/B978-0-7506-4552-2.10009-5
Tarazona J., Gutiérrez D., Paredes C., Indacochea A. (2003). ‘Overview and challenges of marine biodiversity research in peru’. Gayana (Concepción) 67 (2), 206–231. doi: 10.4067/s0717-65382003000200009
Tesi T., Semiletov I., Dudarev O., Andersson A., Gustafsson Ö. (2016). Matrix association effects on hydrodynamic sorting and degradation of terrestrial organic matter during cross-shelf transport in the laptev and East Siberian shelf seas. J. Geophys Research: Biogeosci 121 (3), 731–752. doi: 10.1002/2015JG003067
Thornalley D. J. R., Oppo D. W., Ortega P., Robson J. I., Brierley C. M., Davis R., et al. (2018). Anomalously weak Labrador Sea convection and Atlantic overturning during the past 150 years. Nature 556 (7700), 227–230. doi: 10.1038/s41586-018-0007-4
Twichell D. C., McClennen C. E., Butman B. (1981). Morphology and processes associated with the accumulation of the fine-grained sediment deposit on the southern new England shelf. J. Sedimentary Petrol 51 (1), 269–280. doi: 10.1306/212F7C6B-2B24-11D7-8648000102C1865D
Van Sebille E., Scussolini P., Durgadoo J. V., Peeters F. J. C., Biastoch A., Weijer W., et al. (2015). Ocean currents generate large footprints in marine palaeoclimate proxies. Nat. Commun. 6, 4–11. doi: 10.1038/ncomms7521
Versteegh G. J. M., Bosch H.-J., Leeuw J. W. D. E. (1997). ‘Potential palaeoenvironmental information of C24 to C36 mid-chain diols, keto-ols and mid-chain hydroxy fatty acids: a critical review’. Organic Geochem 27 (97), 1–13. doi: 10.1016/S0146-6380(97)00063-6
Versteegh G. J. M., Jansen J. H. F., De Leeuw J. W., Schneider R. R. (2000). Mid-chain diols and keto-ols in SE Atlantic sediments: A new tool for tracing past sea surface water masses? Geochim Cosmochim Acta 64 (11), 1879–1892. doi: 10.1016/S0016-7037(99)00398-1
Versteegh G., Zonneveld K., Hefter J., Romero O., Fisher G., Mollenhauer G. (2022). Performance of temperature and productivity proxies based on long-chain alkane-1, mid-chain diols at test: a 5-year sediment trap record from the Mauritanian upwelling. Biogeosciences 19, 1587–1610. doi: 10.5194/bg-19-1587-2022
Volkman J. K., Barrett S. M., Blackburn S. I. (1999). Eustigmatophyte microalgae are potential sources of C29 sterols, C22-C28 n-alcohols and C28-C32 n-alkyl diols in freshwater environments. Organic Geochem 30 (5), 307–318. doi: 10.1016/S0146-6380(99)00009-1
Willmott V., Rampen S. W., Domack E., Canals M., Sinninghe Damst J. S., Schouten S. (2010). Holocene Changes in proboscia diatom productivity in shelf waters of the north-western Antarctic peninsula. Antarctic Sci. 22 (1), 3–10. doi: 10.1017/S095410200999037X
Keywords: hydrodynamic sorting, LDI, SST, DI, long-chain diols
Citation: Lattaud J, Eglinton TI, Tallon M, Bröder L, Erdem Z and Ausín B (2022) Grain size controls on long-chain diol distributions and proxy signals in marine sediments. Front. Mar. Sci. 9:1004096. doi: 10.3389/fmars.2022.1004096
Received: 26 July 2022; Accepted: 12 September 2022;
Published: 06 October 2022.
Edited by:
Renato S. Carreira, Pontifical Catholic University of Rio de Janeiro, BrazilReviewed by:
Li Lo, National Taiwan University, TaiwanCaitlyn R. Witkowski, University of Bristol, United Kingdom
Copyright © 2022 Lattaud, Eglinton, Tallon, Bröder, Erdem and Ausín. This is an open-access article distributed under the terms of the Creative Commons Attribution License (CC BY). The use, distribution or reproduction in other forums is permitted, provided the original author(s) and the copyright owner(s) are credited and that the original publication in this journal is cited, in accordance with accepted academic practice. No use, distribution or reproduction is permitted which does not comply with these terms.
*Correspondence: Julie Lattaud, amxhdHRhdWRAZXRoei5jaA==