 Edy Setyawan1*
 Ben C. Stevenson2
 Mark V. Erdmann3
 Abdi W. Hasan4Abraham B. Sianipar5Imanuel Mofu6Mochamad I. H. Putra7Muhamad Izuan4Orgenes Ambafen6
 Rachel M. Fewster2Robin Aldridge-Sutton2Ronald Mambrasar4
 Rochelle Constantine1,8
- 1Institute of Marine Science, The University of Auckland, Auckland, New Zealand
- 2Department of Statistics, The University of Auckland, Auckland, New Zealand
- 3Conservation International Aotearoa, The University of Auckland, Auckland, New Zealand
- 4West Papua Program, Konservasi Indonesia, Sorong, Papua Barat, Indonesia
- 5School of Veterinary and Life Sciences, Murdoch University, Perth, WA, Australia
- 6Jaga Laut, Badan Layanan Umum Daerah Unit Pelaksana Teknis Daerah (BLUD UPTD) Pengelolaan Kawasan Konservasi Perairan (KKP) Kepulauan Raja Ampat, Waisai, Papua Barat, Indonesia
- 7Elasmobranch and Charismatic Species Program, Konservasi Indonesia, Jakarta, Indonesia
- 8School of Biological Sciences, The University of Auckland, Auckland, New Zealand
The 6.7-million-hectare Raja Ampat archipelago is home to Indonesia’s largest reef manta ray (Mobula alfredi) population and a representative network of nine marine protected areas (MPAs). However, the population dynamics of M. alfredi in the region are still largely unknown. Using our photo-identification database, we fitted modified POPAN mark-recapture models with transience and per capita recruitment parameters to estimate key demographic characteristics of M. alfredi from two of Raja Ampat’s largest MPAs: Dampier Strait and South East (SE) Misool. A total of 1,041 unique individuals were photo-identified over an 11-year period (2009–2019) from Dampier Strait (n = 515) and SE Misool (n = 536). In our models, apparent survival probabilities and per capita recruitment rates were strongly linked with El Niño–Southern Oscillation (ENSO) events. Our models also estimated high apparent survival probabilities and significant increases in (sub)population sizes in both MPAs over a decade. In Dampier Strait, the estimated population size increased significantly (p = 0.018) from 226 (95% CI: 161, 283) to 317 (280, 355) individuals. Likewise, the estimated population size in SE Misool increased significantly (p = 0.008) from 210 (137, 308) to 511 (393, 618) individuals. Regardless of variation in the percentage change in population size between years throughout the study, the estimated overall population change shows a compound growth of 3.9% (0.7, 8.6) per annum in Dampier Strait and 10.7% (4.3, 16.1) per annum in SE Misool. Despite the global decline in oceanic sharks and rays due to fishing pressure in the last five decades, our study demonstrates the positive impact of a suite of long-term conservation efforts, coupled with the influence of ENSO events, on increasing M. alfredi abundance in Raja Ampat MPAs. Our study also underscores the importance of long-term monitoring to evaluate the effectiveness of conservation management measures on manta ray populations. Our modification of the standard POPAN model by incorporating per capita recruitment and transience parameters represents an important advance in mark-recapture modelling that should prove useful when examining other manta ray populations and other highly migratory species that are likely to have a substantial percentage of transient individuals.
Introduction
Understanding population dynamics, particularly abundance and growth, through demographic modelling is crucial in evaluating the effectiveness of management strategies for threatened marine species in marine protected areas (MPAs) (Beissinger and Westphal, 1998; Norris, 2004). MPAs have long been known to provide protection to sessile benthos (e.g., hard corals) and to increase the abundance and biomass of relatively sedentary fish and invertebrate species (e.g., snappers, groupers and lobsters) both within and outside their boundaries (Gell and Roberts, 2003; PISCO, 2007). Recently, MPAs have also been shown to promote the recovery of populations of large mobile species (e.g., reef sharks) particularly when the MPAs themselves are large (Knip et al., 2012; Edgar et al., 2014; Jaiteh et al., 2016; Speed et al., 2018). Nonetheless, in large and remote MPAs, where enforcement is costly and difficult, the populations of those species with large home ranges are potentially more exposed to illegal fishing activities (Graham et al., 2010; Jacoby et al., 2020).
Estimating the abundance of highly mobile and migratory marine megafauna can be challenging, as individuals are capable of traveling vast distances, often remain submerged, and commonly use different habitats on a seasonal basis (Carroll et al., 2013; Couturier et al., 2014; Armstrong et al., 2019). Given these challenges, investigating predictable aggregation sites regularly occupied by these species provides an excellent opportunity to estimate demographic parameters such as population abundance through mark-recapture studies (Dudgeon et al., 2008; Williams et al., 2011).
The reef manta ray Mobula alfredi, listed as Vulnerable (VU) (Marshall et al., 2019) on the IUCN Red List, is distributed throughout the Indo-Pacific around nearshore areas in tropical and subtropical regions (Marshall et al., 2009). At a regional scale, M. alfredi frequently demonstrates seasonal movement patterns (Jaine et al., 2014; Setyawan et al., 2018; Armstrong et al., 2020; Harris et al., 2020). At a local scale, this philopatric species shows high site fidelity to key aggregation sites such as cleaning sites and feeding grounds (Dewar et al., 2008; Couturier et al., 2011; Setyawan et al., 2018; Peel et al., 2019). The predictable presence of M. alfredi at known and accessible aggregation sites facilitates the compilation of photographic identification (photo-ID) databases (Marshall and Pierce, 2012; Stevens, 2016), similar to those used extensively for population studies of whale sharks (Rhincodon typus) and white sharks (Carcharodon carcharias) (Graham and Roberts, 2007; Towner et al., 2013; McKinney et al., 2017).
Photo-ID techniques have been used to study the population demographics of manta rays in many regions. This non-invasive technique uses the patterns of natural ventral markings that are unique to each individual (Marshall et al., 2011). These markings remain unchanged throughout the individual’s life, or at least for periods of 30 years or more (Couturier et al., 2014). These characteristics have enabled long-term photo-ID data to be used extensively to examine life history traits and reproductive strategies, and determine the fecundity and age at maturity of M. alfredi (Stevens, 2016). Long-term photo-ID datasets have also been used to estimate M. alfredi population size and survival probabilities using mark-recapture models in several countries (Deakos et al., 2011; Kitchen-Wheeler et al., 2011; Marshall et al., 2011; Couturier et al., 2014; Peel, 2019; Venables, 2020).
The Raja Ampat archipelago in West Papua, Indonesia, harbours large populations of both M. alfredi and oceanic manta rays M. birostris (Setyawan et al., 2020). Although manta rays have been subject to targeted fisheries in several regions of Indonesia (Heinrichs et al., 2011; Lewis et al., 2015), historically, they have not been systematically targeted by local fisheries in Raja Ampat waters (Beale et al., 2019). Nonetheless, there are anecdotal reports of sporadic targeting of manta ray aggregations in the early 2000s by shark fishers in northern Raja Ampat (Varkey et al., 2010). Local fishers also reported that manta rays were frequently observed as bycatch when outsider fishing boats using large drift nets occasionally operated in Raja Ampat in the 1990s and early 2000s (Setyawan et al., 2022a). Importantly, Raja Ampat’s manta rays have been protected since 2007, when the Raja Ampat local government and local stakeholders started to implement a series of conservation measures in the region that began with the implementation of a network of MPAs, progressed to the declaration of all of Raja Ampat’s regency waters as Southeast Asia’s first shark and ray sanctuary in 2012, and culminated with the Indonesian government granting full national-level protection to both species of manta ray in 2014 (Setyawan et al., 2022a). As a result, Raja Ampat’s manta rays have enjoyed increasingly strict protections for over a decade. However, the impact of these management measures on M. alfredi in one of Indonesia’s most popular manta diving tourism destinations (O’Malley et al., 2013) has not yet been formally assessed. Setyawan et al. (2020) provided a broad overview of the natural history and basic demographic features of the M. alfredi population in Raja Ampat; however, no analysis of population dynamics was conducted. The only study to date on manta ray population dynamics in Raja Ampat was focused on M. birostris. Using mark-recapture models, Beale et al. (2019) estimated high survival probabilities for both females and males in annual population surveys from 2011–2016. This research highlighted the impact of the 2015–2016 major El Niño-Southern Oscillation (ENSO) event in significantly increasing M. birostris sightings in southern Raja Ampat at the time.
In a recent assessment, Pacoureau et al. (2021) reported the global abundance of 31 species of oceanic sharks and rays (including M. alfredi and M. birostris) declined by 71% over the past five decades, primarily due to an 18-fold increase in relative fishing pressure. Similarly, Rohner et al. (2013; 2017) reported dramatic declines in M. alfredi sightings in southern Mozambique (with a 98% decrease between 2003 and 2016), while numerous authors have noted that the life history characteristics of manta rays (including late maturation and extremely low fecundity) make them highly vulnerable to population decline (Ward-Paige et al., 2013; Dulvy et al., 2014; Croll et al., 2015). While anecdotal evidence and testimonies by local communities and marine tourism operators suggest that Raja Ampat’s M. alfredi population has been spared such a fate (Setyawan et al., 2022a), the aim of this paper is to examine manta ray population trends in Raja Ampat in a quantitative manner. Here, we used open population mark-recapture models based on photo-ID sighting data of M. alfredi sourced from citizen science and active surveys by the authors to explicitly examine the potential impacts of manta ray conservation and management efforts in the extensive Raja Ampat MPA network. The use of sightings data contributed by the public through citizen science, integrated with those collected by researchers, has been shown to be accurate and robust in mark-recapture studies (Davies et al., 2012; Robinson et al., 2018), and have been used in studies involving a range of different species including whale sharks (Meekan et al., 2006; Holmberg et al., 2009; Magson et al., 2022), manta rays (Beale et al., 2019), and sperm whales (Physeter macrocephalus) (Boys et al., 2019).
Using a modified version of the POPAN model (Schwarz and Arnason, 1996), we aimed to estimate the annual population sizes, survival probabilities, sighting probabilities, and per capita recruitment rates of M. alfredi (sub)populations using 11 years of sightings data from the two MPAs in Raja Ampat with the highest manta ray survey effort: Dampier Strait and South East (SE) Misool. Importantly, Raja Ampat’s M. alfredi population is best described as a metapopulation consisting of at least four (and up to seven) local subpopulations, including those in the Dampier Strait and SE Misool (Setyawan et al., 2020). While individuals have been recorded moving between Dampier Strait and SE Misool MPAs using both photo-ID and acoustic telemetry, such movements are rare (only 10 recorded in fifteen years’ of survey effort (Setyawan et al., 2020)), leading us to fit separate POPAN models for these two subpopulations. In general, the subpopulation in SE Misool MPA is relatively isolated (over 160 km between the closest known manta ray aggregation sites in SE Misool and Dampier Strait and with deep water to the south of the SE Misool MPA). By comparison, the Dampier Strait subpopulation shows the strongest connections to other subpopulations in Raja Ampat based upon evidence of movement of individuals from photo-ID and acoustic telemetry data (Setyawan et al., 2018; Setyawan et al., 2020). Given the proximity of the Dampier Strait to other hypothesised subpopulations (12-20 km to the West Waigeo and Fam subpopulations, respectively) and the frequent observation in Dampier Strait of large seasonal feeding aggregations of up to 112 individuals (Setyawan et al., 2020), we expected a significant number of “transient” individuals pass through Dampier Strait and might not be recorded there again – a situation that violates one of the key assumptions of the standard POPAN model. Based upon this concern, we have also incorporated a transience parameter in modelling the Dampier Strait subpopulation (described further below in the POPAN methods section).
2 Material and methods
2.1 Study area
The Raja Ampat Archipelago covers an area of ~6.7 million hectares and is situated on the northwestern tip of West Papua Province in eastern Indonesia (Figure 1). The region is protected by a network of nine MPAs (including Dampier Strait and SE Misool) that cover nearly two million hectares; this network is part of a larger network of 26 MPAs covering 5.2 million hectares of a region commonly referred to as the Bird’s Head Seascape of West Papua (Mangubhai et al., 2012; Setyawan et al., 2022a). In Raja Ampat, M. alfredi sightings have been documented from at least 101 different sites within the archipelago (Setyawan et al., 2020), while ventral photo-IDs of M. alfredi were captured from 51 sites (Figure 1).
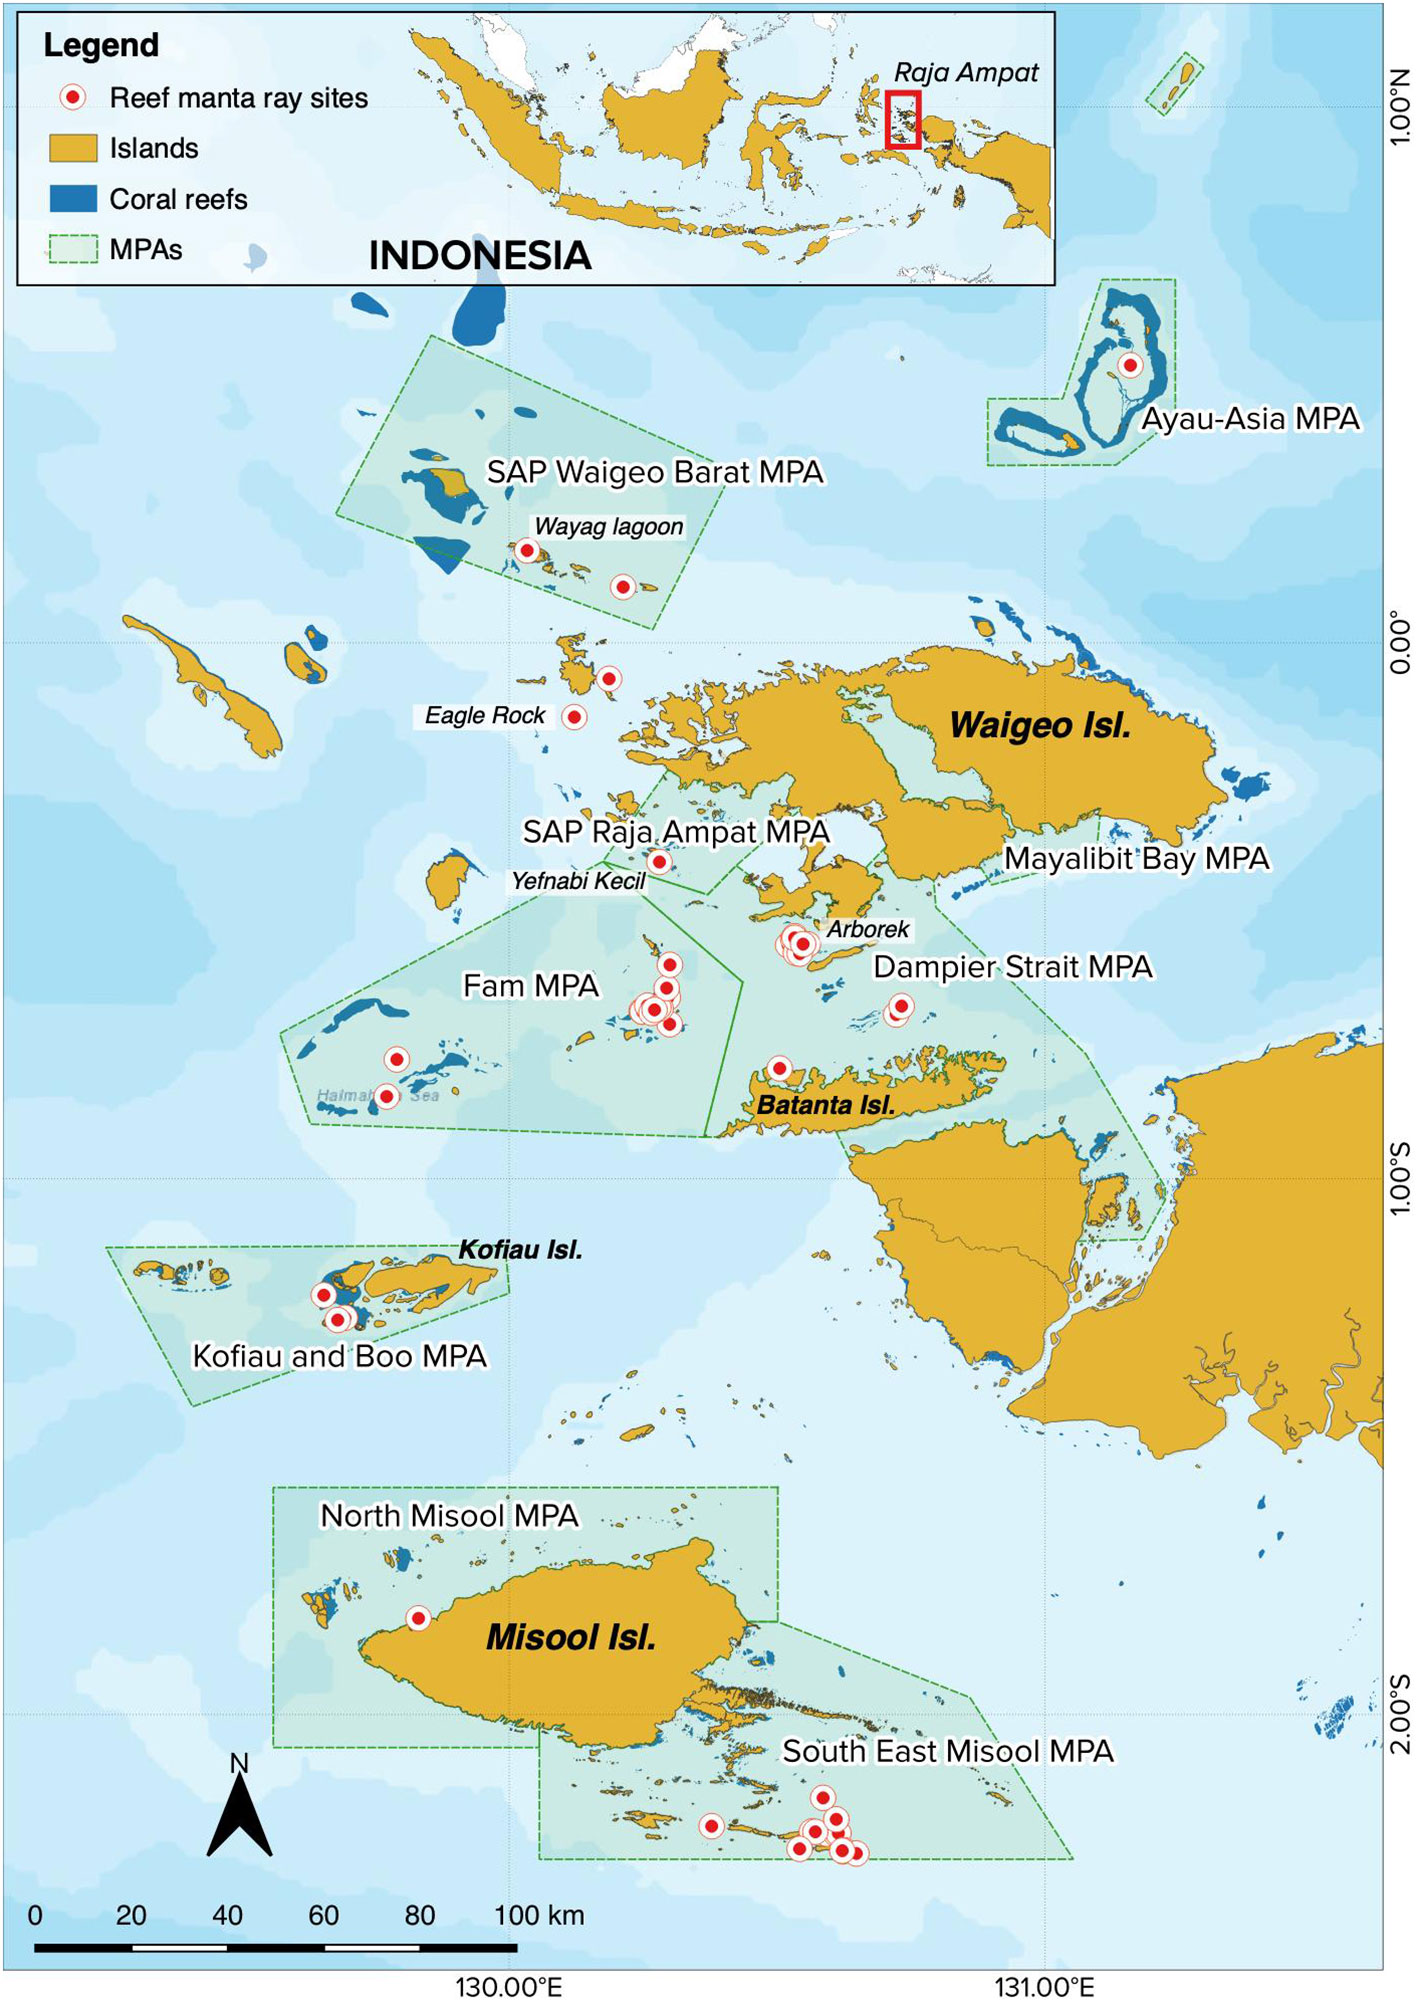
Figure 1 Map of the Raja Ampat Archipelago in West Papua, Indonesia, denoting both the network of nine MPAs (shaded green polygons) and the 51 sites from which M. alfredi photo-ID data have been collected (red dots with white outline).
2.2 Data collection
2.2.1 Photo-ID
We collected M. alfredi ventral identification photos or videos (Stevens, 2016; Stevens et al., 2018) from three primary sources (active surveys by the authors, submissions from collaborating dive resorts and liveaboard vessels, and contributions from citizen scientists) and entered into the Raja Ampat M. alfredi photo-ID database using the protocols developed by Stevens (2016). We determined the sex of individual manta rays from the presence (male) or absence (female) of claspers. We further used the length and extent of calcification of the claspers and development of clasper glands to estimate maturity in males (Marshall and Bennett, 2010). We recorded the presence of mating scars or visible signs of pregnancy and used these as indicators of sexual maturity in females (Marshall and Bennett, 2010; Stevens, 2016).
As detailed in Setyawan et al. (2020), each M. alfredi sighting in the Raja Ampat database included photographs of the ventral surface of the individual and associated metadata including date, time, location, estimated size (wingspan), sex, notes on maturity, and a number of other variables not pertinent to the present study. Sightings data contributed by citizen scientists consisted of photo-ID images, date and time, and location. We (ES and MI) manually matched all photo-ID images from each M. alfredi sighting, including those from collaborators and citizen scientists, to the Raja Ampat M. alfredi identification catalogue. We then recorded either as a resighted individual or assigned a new unique identification code if sighted for the first time.
Here we used M. alfredi sightings data from only two MPAs (SE Misool and Dampier Strait) (Figure 1), where the collection of photo-ID data was the most consistent and where the most M. alfredi sightings data were recorded (Setyawan et al., 2020). Furthermore, we restricted our modelling to sightings data collected only from 2009–2019, due to the small amount of data available before 2009 (Supplementary Figure 1). These 2009–2019 data from SE Misool and Dampier Strait MPAs were from 27 of the 51 sites in Raja Ampat from which M. alfredi ventral ID photos were recorded. Here we used the same M. alfredi sightings data reported in Setyawan et al. (2020), together with additional historical sightings data collected subsequently from professional underwater photographers.
2.3 POPAN models for Dampier Strait and SE Misool
2.3.1 Overview
First described by Schwarz and Arnason (1996), POPAN is an open population capture-recapture model capable of estimating population size, and how it changes, over a number of sampling occasions. The parameters directly estimated by a POPAN model are M, the superpopulation size of individuals available for sighting on at least one occasion; p, sighting probability; ϕ, apparent survival probability; and pe, the entry probability (i.e., the expected proportion of the M individuals that are first available for sighting on any given occasion). Estimates of these parameters are used to derive estimates of the expected population size for each occasion, denoted E(Nt) for occasion t. See Supplementary Materials for further details.
Under the simplest POPAN model, sighting probabilities, survival probabilities, and entry probabilities are assumed to be constant over time. Alternatively, POPAN models allow us to estimate how these demographic parameters change between occasions, either by modelling how they relate to occasion-level covariates or by estimating a separate parameter for each occasion. They also allow us to estimate separate parameters and expected population sizes for males and females, choosing to either share parameters across sexes or estimate them separately. We denote pt, ϕt, and pe,t as the parameters for occasion t, noting that we require one fewer ϕ parameter than the number of occasions, because ϕt denotes the probability of survival between one occasion and the next, and the number of intervals between occasions is one fewer than the number of occasions.
Standard POPAN models require us to assume that sighting and survival probabilities are the same for all individuals within the same occasion. Because survey effort varied between Dampier Strait and SE Misool, we expected sighting probabilities for individuals typically resident at each location to be different. Differing environmental conditions may also induce spatial variation in survival. We therefore analyzed sighting data from Dampier Strait and SE Misool separately, allowing us to estimate different model parameters (including population size) at each location. We considered each year to be an occasion, and so the data required by our model is a capture history for each detected individual, indicating the years in which each individual was detected.
2.3.2 Goodness-of-fit
We assessed goodness-of-fit for standard POPAN models using the suite of tests implemented in the R package R2ucare (Gimenez et al., 2018). Tests applied included an overall test for goodness-of-fit and TEST 3.SR that is often interpreted as a test for transience.
2.3.3 POPAN models with transience
As mentioned above, we considered transience is a likely scenario in the Dampier Strait M. alfredi subpopulation. The presence of transient individuals violates the assumption of constant survival probability required by standard POPAN models: transient individuals are only available for a single occasion before they permanently emigrate, thus, upon recruitment, they have apparent survival probabilities of zero. See Pradel et al. (1997) and Genovart and Pradel (2019) for the treatment of transience effects in capture-recapture models, although their focus is on models that estimate survival and recruitment only; here we focused on models that additionally estimate abundance.
We developed an extension to the standard POPAN model to accommodate transient individuals. Technical details of our new model are available in the Supplementary Materials. We used a two-component discrete mixture to model survival probabilities (similar to “Parameterisation B” proposed by Genovart and Pradel (2019)), which introduces a new parameter, γt, the probability that an individual recruited on occasion t is a transient. Newly-recruited individuals have apparent survival probabilities of zero with probability γt, and the usual apparent survival probability of ϕt with probability 1-γt. By considering transience a latent state, our model does not require us to determine which individuals are transients and which are not.
2.3.4 POPAN models with per capita recruitment
We made one further modification to the standard POPAN model. Typically, recruitment is estimated using the parameter pe,t, the expected proportion of the M individuals in the superpopulation that are recruited on occasion t. Under a null-model specification for recruitment, the same number of individuals is expected to be recruited each year, regardless of the underlying population size.
However, it is common for population dynamics models to link recruitment to the size of the population, because larger populations have the capacity to recruit more individuals (Snider and Brimlow, 2013). We included this feature by reparametrizing the POPAN model to directly estimate per capita recruitment, denoted ψt for occasion t, rather than the probabilities of entry, pe,t, so that the expected number of new recruits in year t+1 is given by ψtNt. One advantage of our specification over the standard POPAN model is that per capita recruitment rates are more easily interpreted and are more biologically relevant than probabilities of entry. See Supplementary Materials for further details, including how to calculate the usual probabilities of entry from our model as derived parameters.
2.3.5 Incorporating covariates
We considered the effects of an environmental covariate, the bimonthly Multivariate ENSO Index (MEI), on apparent survival, per capita recruitment, and sighting probabilities. We used the bimonthly MEI obtained from the NOAA Physical Sciences Laboratory (https://psl.noaa.gov/enso/mei/) to represent environmental conditions in the region. High positive values (>0.5) of the bimonthly MEI denote El Niño events, while low negative values (<-0.5) denote La Niña events (Supplementary Figure 2). We then averaged the bimonthly MEI into annual indices to be consistent with the annual values of demographic parameters.
2.3.6 Candidate models
We first fitted models without transience and considered eight different model specifications (Table 1) for the sighting probabilities, survival probabilities, and per capita recruitment rates. We used a log link function to model per capita recruitment rates, and logit link functions for sighting and survival probabilities. With eight possible specifications for each of the three parameters, we obtained a total of 512 total candidate models. We did not consider models including effects of both time and MEI, because the parameters of such a model are not identifiable.
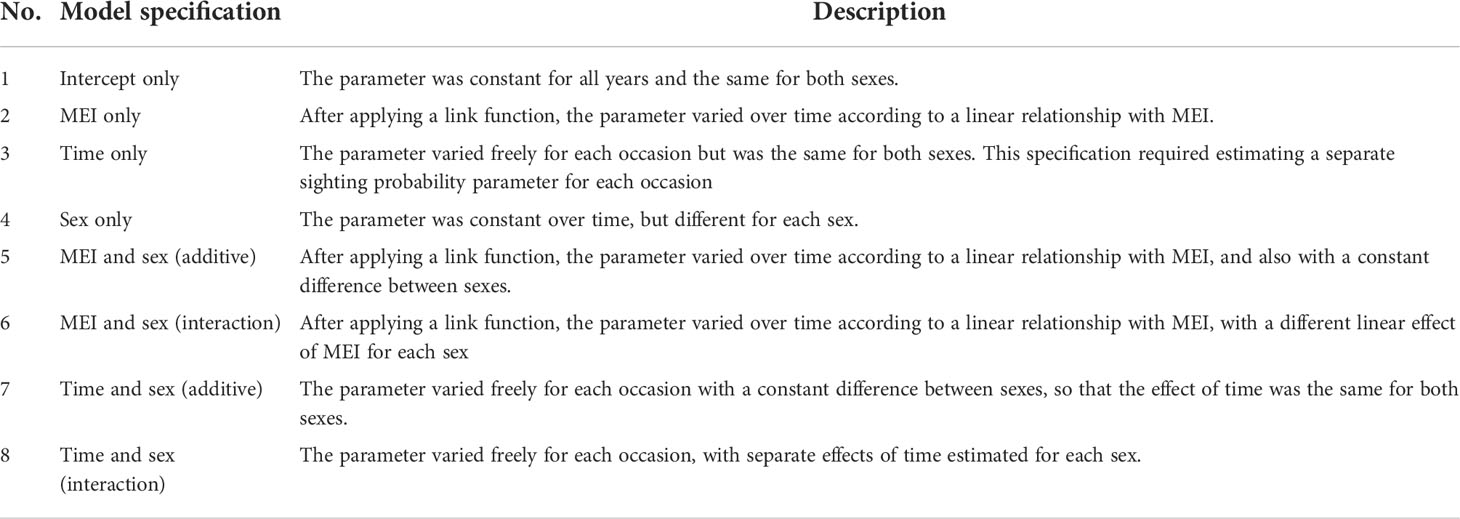
Table 1 Description of model specifications for the sighting probabilities, survival probabilities, and per capita recruitment rates of M. alfredi subpopulations in Dampier Strait and SE Misool MPAs.
In the event that goodness-of-fit tests provided evidence for lack-of-fit, and in particular indicated the presence of transient individuals, we then additionally considered the same 512 model specifications, but also accommodated the effects of transience using our new model. We considered models that have a different transience probability for the first year of the study, then a constant transience probability for the remaining years. In the first year of our study, all individuals present are considered newly available for sighting, including those that were recruited that year (a mixture of transients and non-transients) and those that were recruited in previous years (all of which must be non-transients, because transients do not survive from one year to the next). On later occasions, only the mixture of transients and non-transients recruited that year are newly available for sighting, thus we expected a higher proportion of these new individuals to be transients compared to the first occasion.
2.3.7 Model selection and model averaging
We used AIC to assess the degree to which each model is supported by the data, or QAIC if goodness-of-fit tests indicated the presence of overdispersion (Cooch and White, 2001). In the event that (Q)AIC did not identify a single model with considerably more support than all others, we calculated model-averaged estimates using the bootstrap approach recommended by Buckland et al. (2001).
Under this procedure, we selected a final candidate set of models within 10 (Q)AIC units of the model with the highest support (i.e., lowest (Q)AIC value). For each of 1,000 bootstrap iterations, we resampled n capture histories with replacement, where n is the number of capture histories in the original data. To each new data set, we fitted all the final candidate models. We retained estimates from the model with highest (Q)AIC support from each iteration. We then calculated the model-averaged point estimates by taking the mean of these retained estimates across the bootstrap resamples. Furthermore, we obtained 95% confidence interval (CI) limits from the 2.5th (lower CI limit) and 97.5th percentiles (upper CI limit) of these retained point estimates.
We also used the bootstrap procedure for hypothesis testing. We conducted hypothesis tests comparing males and females in terms of population size, survival probability, per capita recruitment rate, and sighting probability. For each, the null hypothesis was no difference between the sexes. We also tested for changes in these parameters over time. Again, each null hypothesis tested was for no difference between two specified occasions. To calculate a p-value, we obtained the proportion of estimates retained across the 1,000 bootstrap iterations that were in the tail of the distribution beyond the hypothesised value and multiplied this proportion by 2 for a two-sided test.
We conducted all analyses of goodness-of-fit, model fitting, model selection, model averaging, and hypothesis testing using custom code written in R version 4.1.2 (R Core Team, 2021), available in GitHub (https://github.com/b-steve/manta-popan).
2.3.8 Environmental variables
We examined two environmental variables, sea surface temperature (SST) and chlorophyll-a (chl-a) concentration to characterize the occurrence of El Niño events in the study area, as ENSO is a known contributor to the interannual variability of surface chl-a concentration and SST (Setiawan et al., 2020). We obtained annual SST Level 3 data between 2009 and 2019 from Moderate Resolution Imaging Spectroradiometer (MODIS) (https://oceancolor.gsfc.nasa.gov/) and plotted these using QGIS 3.22.3 (QGIS.org, 2021). Similarly, we used seasonal SST and chl-a distribution to examine the distribution changes of these variables every quarter between 2014 and 2016. The spatial resolution of both SST and chl-a was 4 km x 4 km.
3 Results
3.1 Population demographics and pregnancy rates
A total of 1,041 unique M. alfredi individuals were identified from 3,759 sightings recorded over 11 years of observations (2009–2019) in both Dampier Strait and SE Misool MPAs. Of these, more sightings were recorded in Dampier Strait (n = 2,580 sightings) than in SE Misool (n = 1,179 sightings). Despite this, the number of unique individuals identified was slightly higher in SE Misool (n = 536) than in Dampier Strait (n = 515), with 10 individuals recorded in both MPAs. Of these, 256 individuals (47.8%) in SE Misool and 332 individuals (64.5%) in Dampier Strait were resighted at least once.
The proportion of pregnant M. alfredi that were sighted and resighted in Dampier Strait, SE Misool, and both MPAs combined fluctuated over time from 2009–2019 (Figure 2). In Dampier Strait, the percentage of pregnant M. alfredi ranged from 0–26.9% (mean ± SD = 12.8 ± 8.7%). In SE Misool, the percentage of pregnant M. alfredi ranged from 3.2–41.4% (mean ± SD = 23.9 ± 12.9%) with high pregnancy rates in 2011 and 2015–2016. The lowest percentage of pregnancies were recorded in 2016 (Dampier Strait) and 2017 (SE Misool). Combining pregnancy rates in both MPAs, the rate declined after a peak in 2011 before rising sharply to the highest rate (35.1%) in 2016.
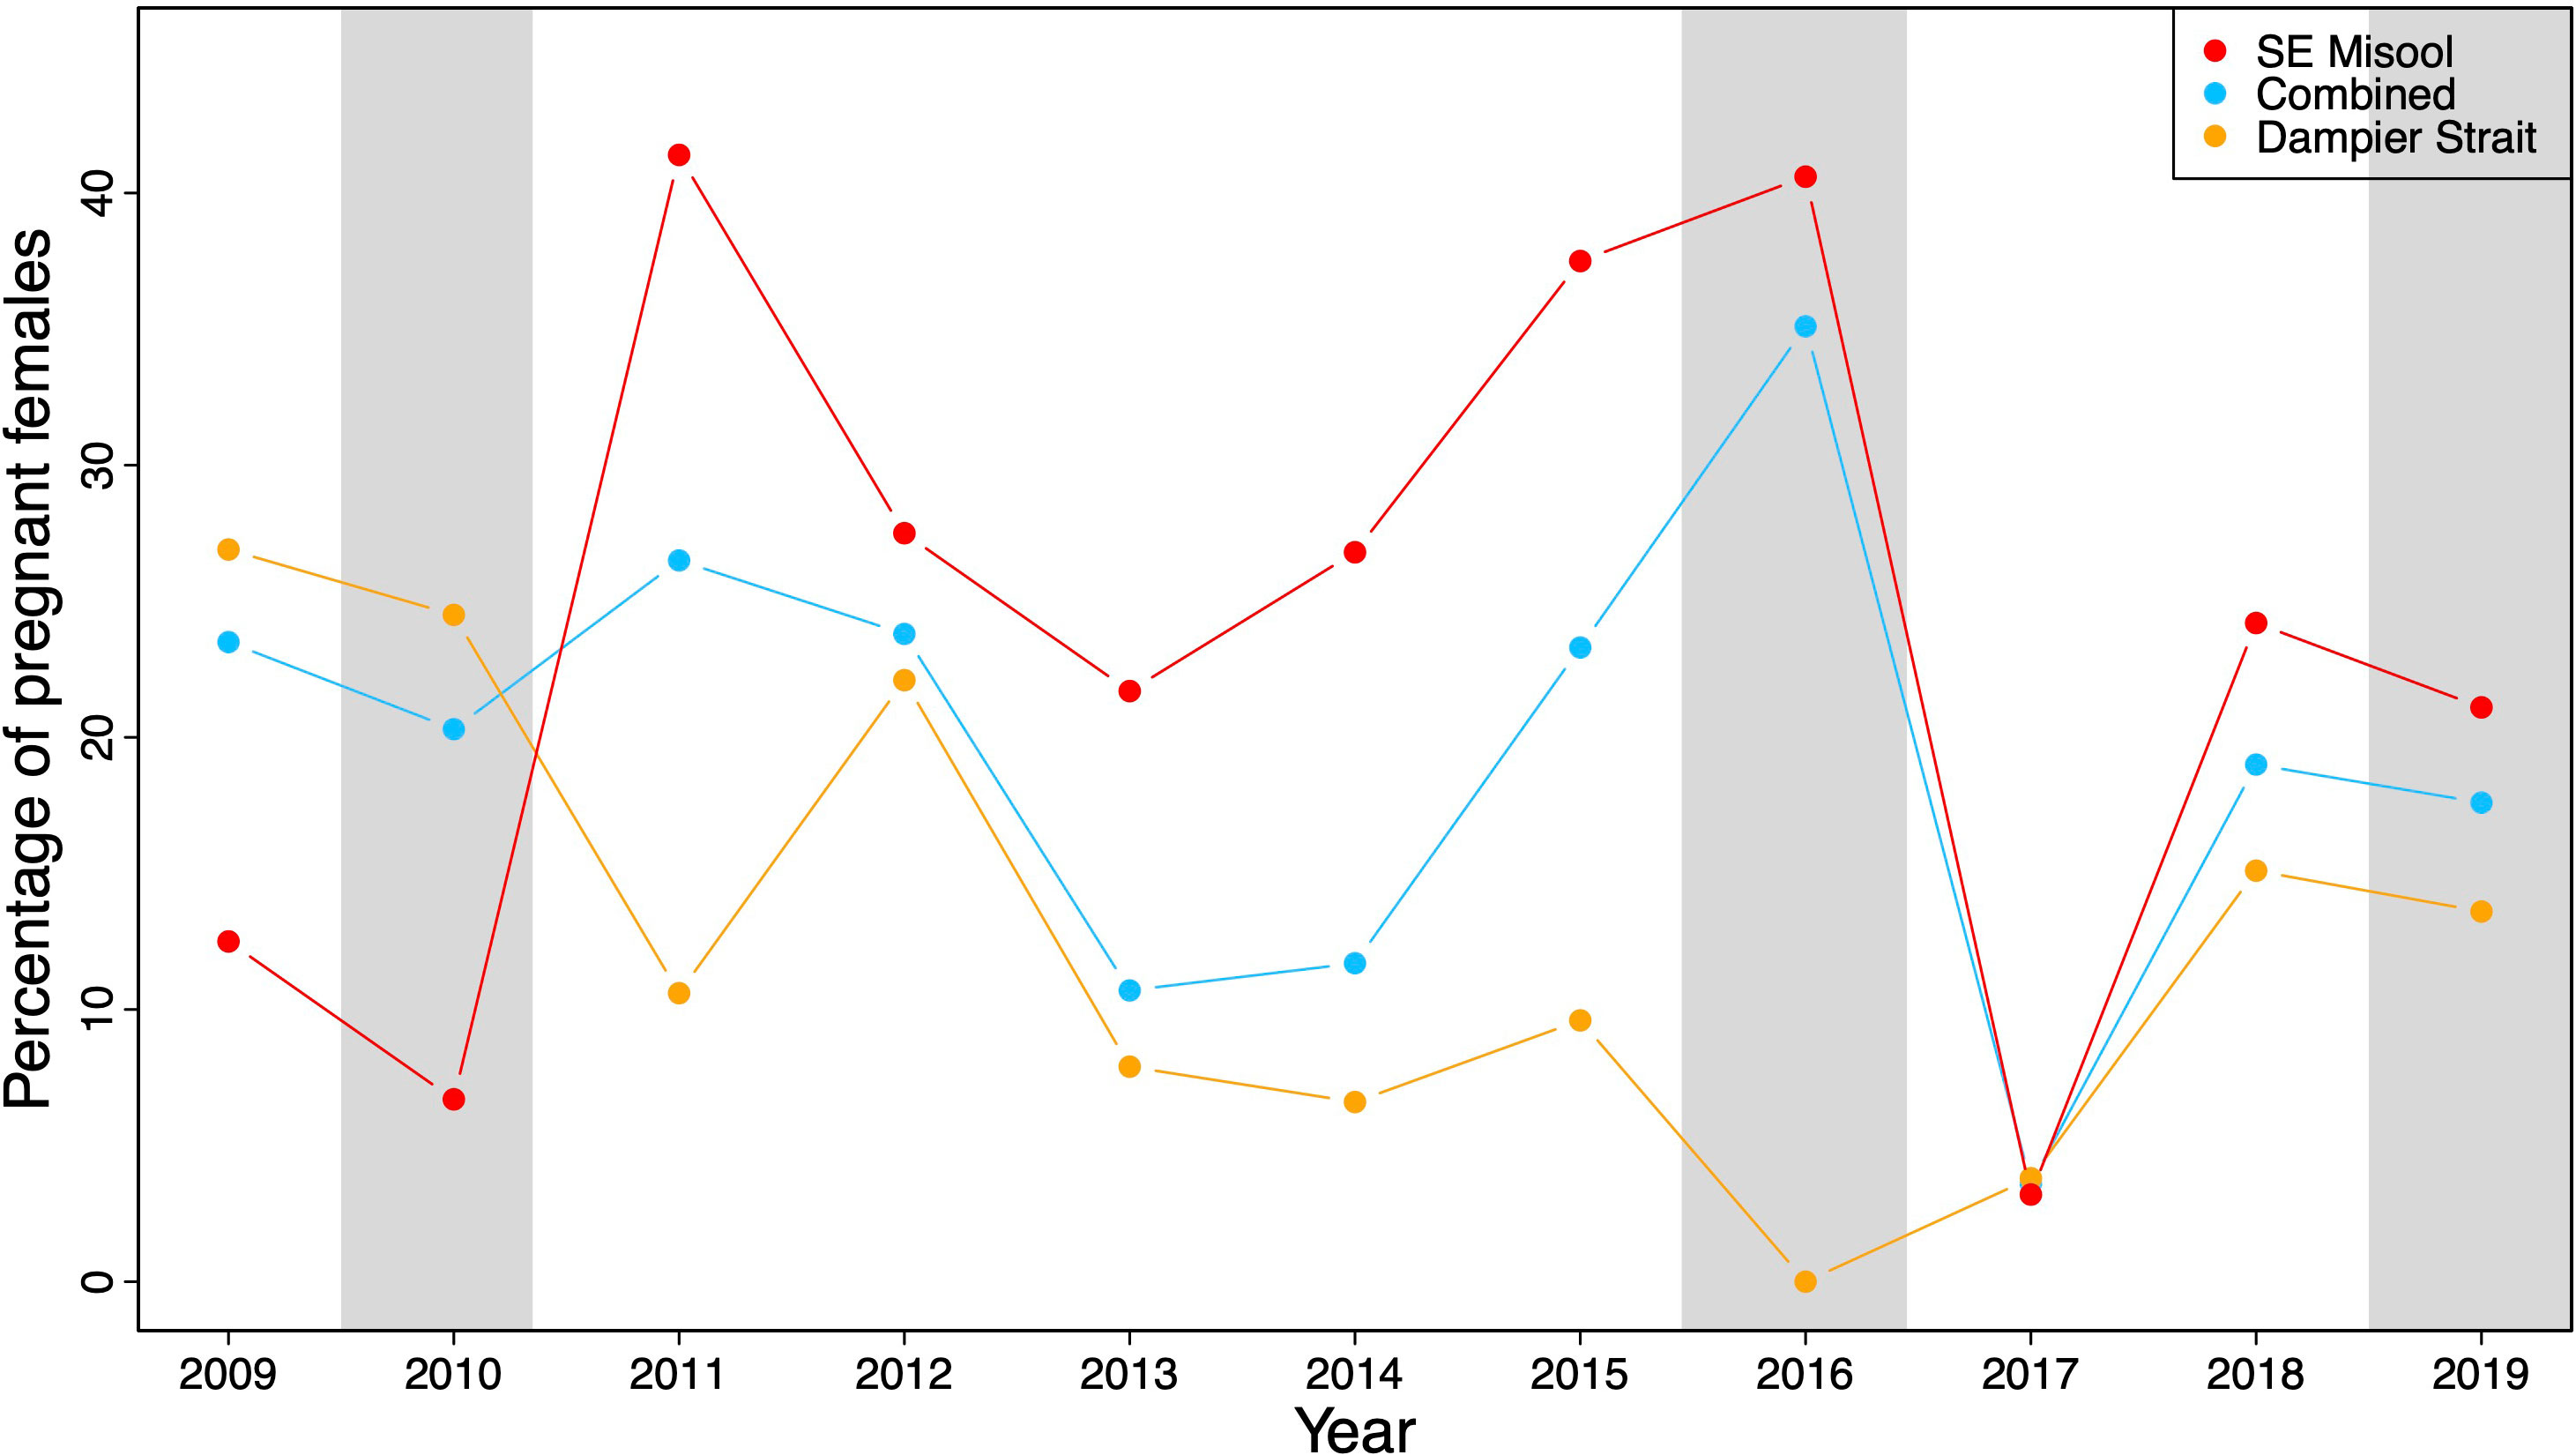
Figure 2 The percentage of pregnant M. alfredi relative to the total number of females in South East (SE) Misool (in red), Dampier Strait (in orange), and both MPAs (in blue) combined in 2009–2019. Grey shading represents three different El Niño events based on MEI.
3.2 Goodness-of-fit (GOF) tests
The GOF tests on capture history data showed contrasting results between SE Misool and Dampier Strait. The overall test was not significant (= 65.462, p = 0.631) for SE Misool, but was significant (= 187.003, p < 0.001) for Dampier Strait. Further tests for Dampier Strait showed that TEST 3.SR for females was significant (= 46.682, p < 0.001, z = 5.339), and likewise TEST 3.SR for males was significant (= 30.482, p < 0.001, z = 3.357), which can be explained by the presence of transient individuals (Genovart and Pradel, 2019). This provided evidence of lack-of-fit for a standard POPAN model, which is unsurprising given that we expected the presence of transient individuals in Dampier Strait.
3.3 Population modelling
We considered models that accommodate transients for Dampier Strait MPA because the GOF tests indicated that the standard POPAN models did not fit well. Model selection did not clearly identify a single combination of covariates that was best supported by the data. For each location, we retained models with an AIC/QAIC value within 10 units of the model with the highest AIC/QAIC support, resulting a total of 33 best-fitting models for Dampier Strait and 32 best-fitting models for SE Misool. Nevertheless, all retained models estimated similar increasing population trajectories for both MPAs, with variations in several years over the study period (Supplementary Figures 3, 4).
In Dampier Strait, the annual estimated population sizes varied slightly amongst all best models (Supplementary Figure 3). Several models showed a steady increase during the study period; some showed a considerable increase in 2010–2012 followed by a slight drop in 2016. Several other models showed two declines in the estimated population size in 2011, before a sharp increase in 2012–2014, despite an overall increasing trend over time. In comparison, the population sizes in SE Misool were relatively stable or increased steadily over the study period (Supplementary Figure 4). Most models demonstrated substantial increases in 2016–2017 following the relatively stable rise in 2010–2015. Because the data did not clearly support one model over the others, we used a model-averaging procedure to calculate final estimates (Buckland et al., 2001). In the following three subsections, we report estimates obtained from the model averaging procedure described in subsection 2.3.7 (Model selection and model averaging) using the following format: point estimate (lower 95% CI limit, upper 95% CI limit).
3.4 Estimated population size
The total estimated population of females and males showed an increasing trend throughout the survey both in Dampier Strait (Figures 3A, B) and SE Misool (Figures 4A, B). In Dampier Strait, due to high uncertainty in the estimated population size in 2009 (which was likely caused by the low survey effort in that year), we did not include the estimates from 2009 when examining the population changes over time. Over the period 2010–2019, the estimated total population size increased significantly (p = 0.018) from 226 (161, 283) to 317 (280, 355), with a difference of 90 (18, 179) individuals over the decade. Although the percentage change in population size between years varied throughout the study, the estimated overall increase between 2010 and 2019 is the same as we would observe from a population with a compound growth of 3.9% (0.7, 8.6) per annum. A particularly steep rise occurred between 2011 and 2014, with a significant (p = 0.012) increase of 58 (7, 135) individuals and a compound annual growth of 8.1% (0.9, 20.5). The highest rate of change was estimated between 2013 and 2014, during which the population increased significantly (p = 0.006) at a rate of 11.8% (0.94, 39.3) in one year. Between sexes, there was no significant difference (p = 0.968) in the compound annual growth between males (4.0%; 0.7, 8.7) and females (3.9%; 0.2, 8.8) in 2010–2019. Furthermore, the mean population size of females (137 individuals; 125, 151) was not significantly (p = 0.264) larger than that of males (130 individuals; 114, 148), with a mean expected female to male ratio of 1.06:1 (0.96:1, 1.24:1) (Figure 3F).
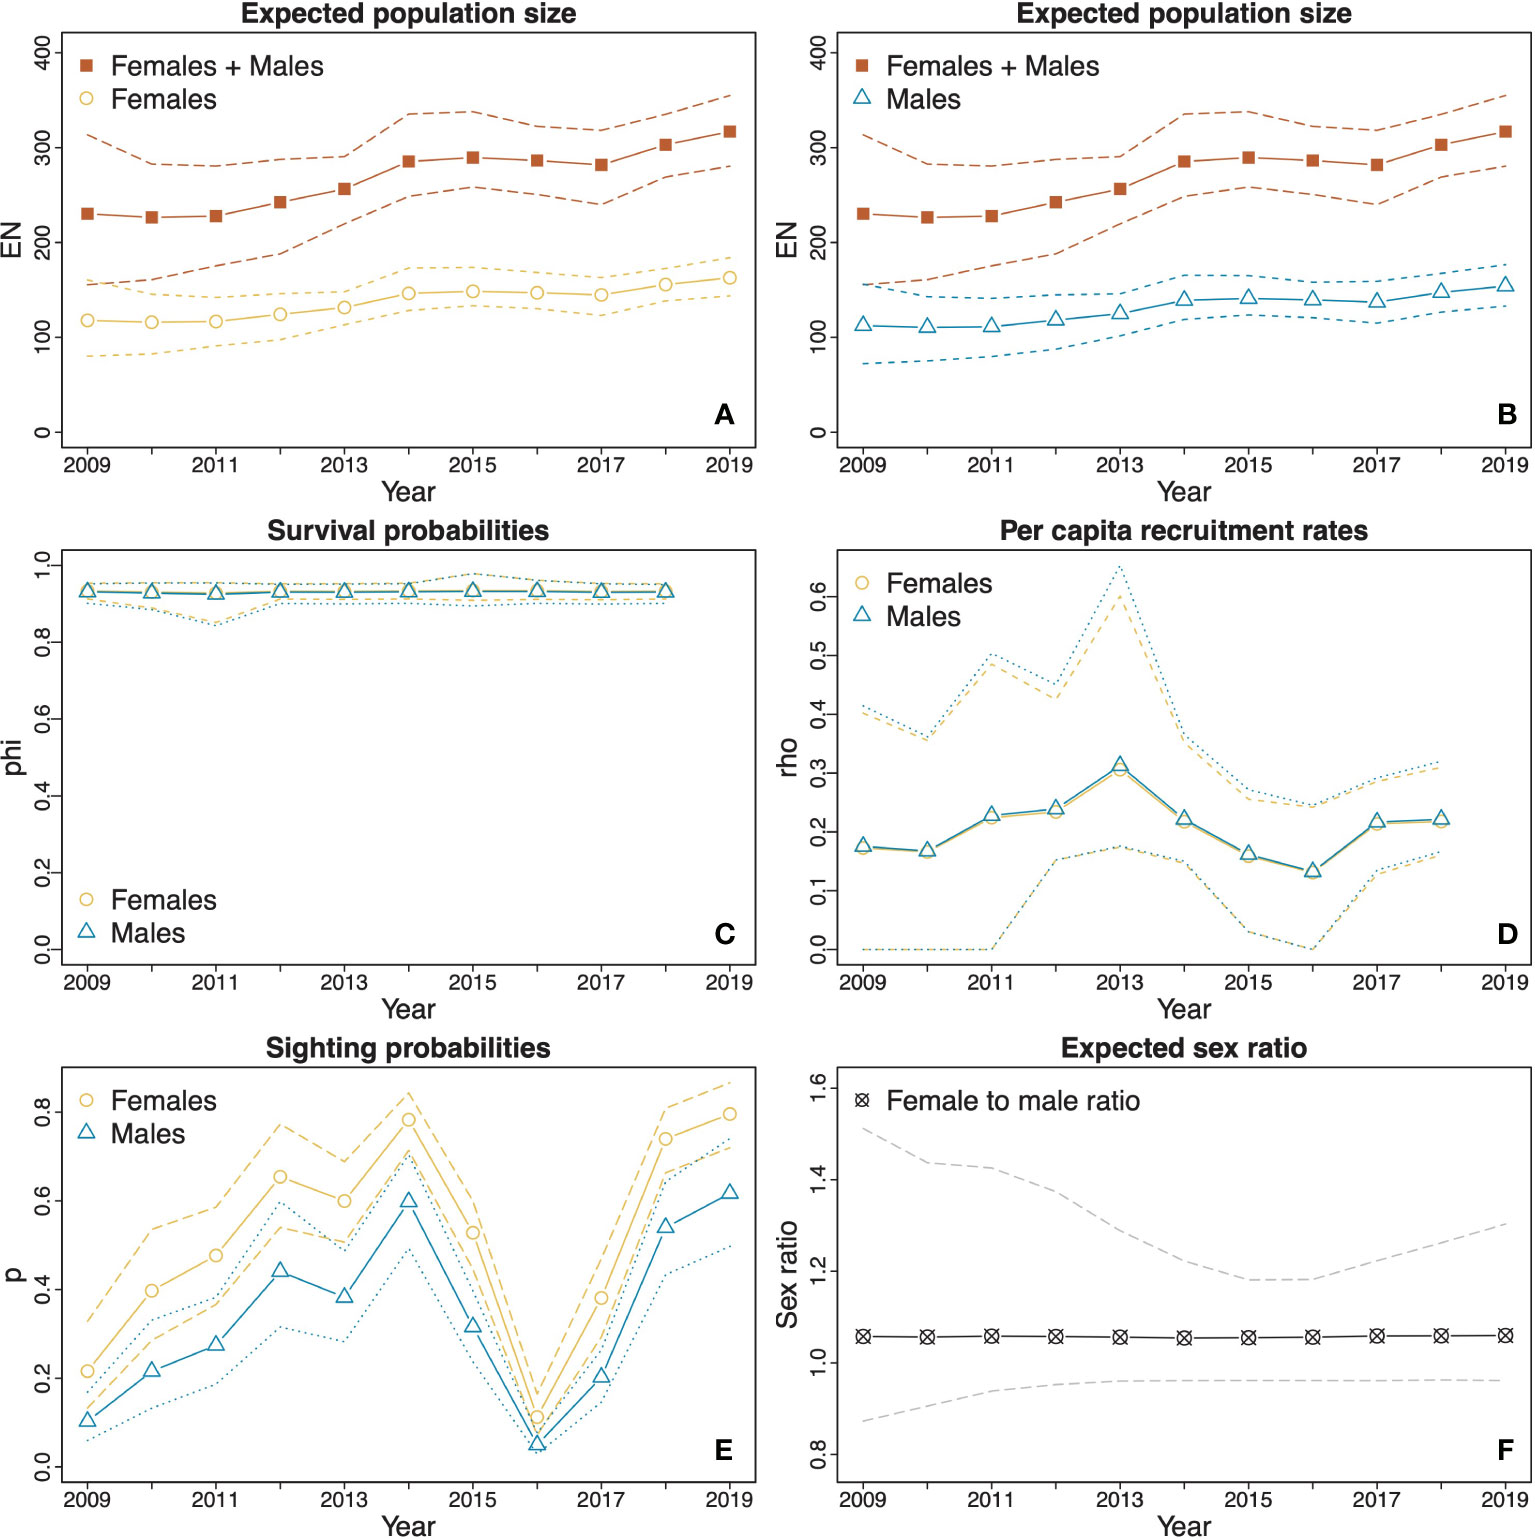
Figure 3 Estimates (solid lines) and CIs (dotted and dashed lines) derived from model averaging procedures for the M. alfredi subpopulation in the Dampier Strait MPA. (A and B) The estimated expected population sizes of females and males relative to the estimated expected overall population sizes of both sexes combined; (C) Survival probabilities of females and males; (D) Per capita recruitment rates of males and females; (E) Sighting probabilities of females and males; and (F) Expected female to male ratio. The orange lines represent female estimates, blue lines represent male estimates, and red lines represent total estimates of females and males. Black and grey lines represent sex ratio estimates (female to male). Dotted lines represent upper and lower confidence intervals.
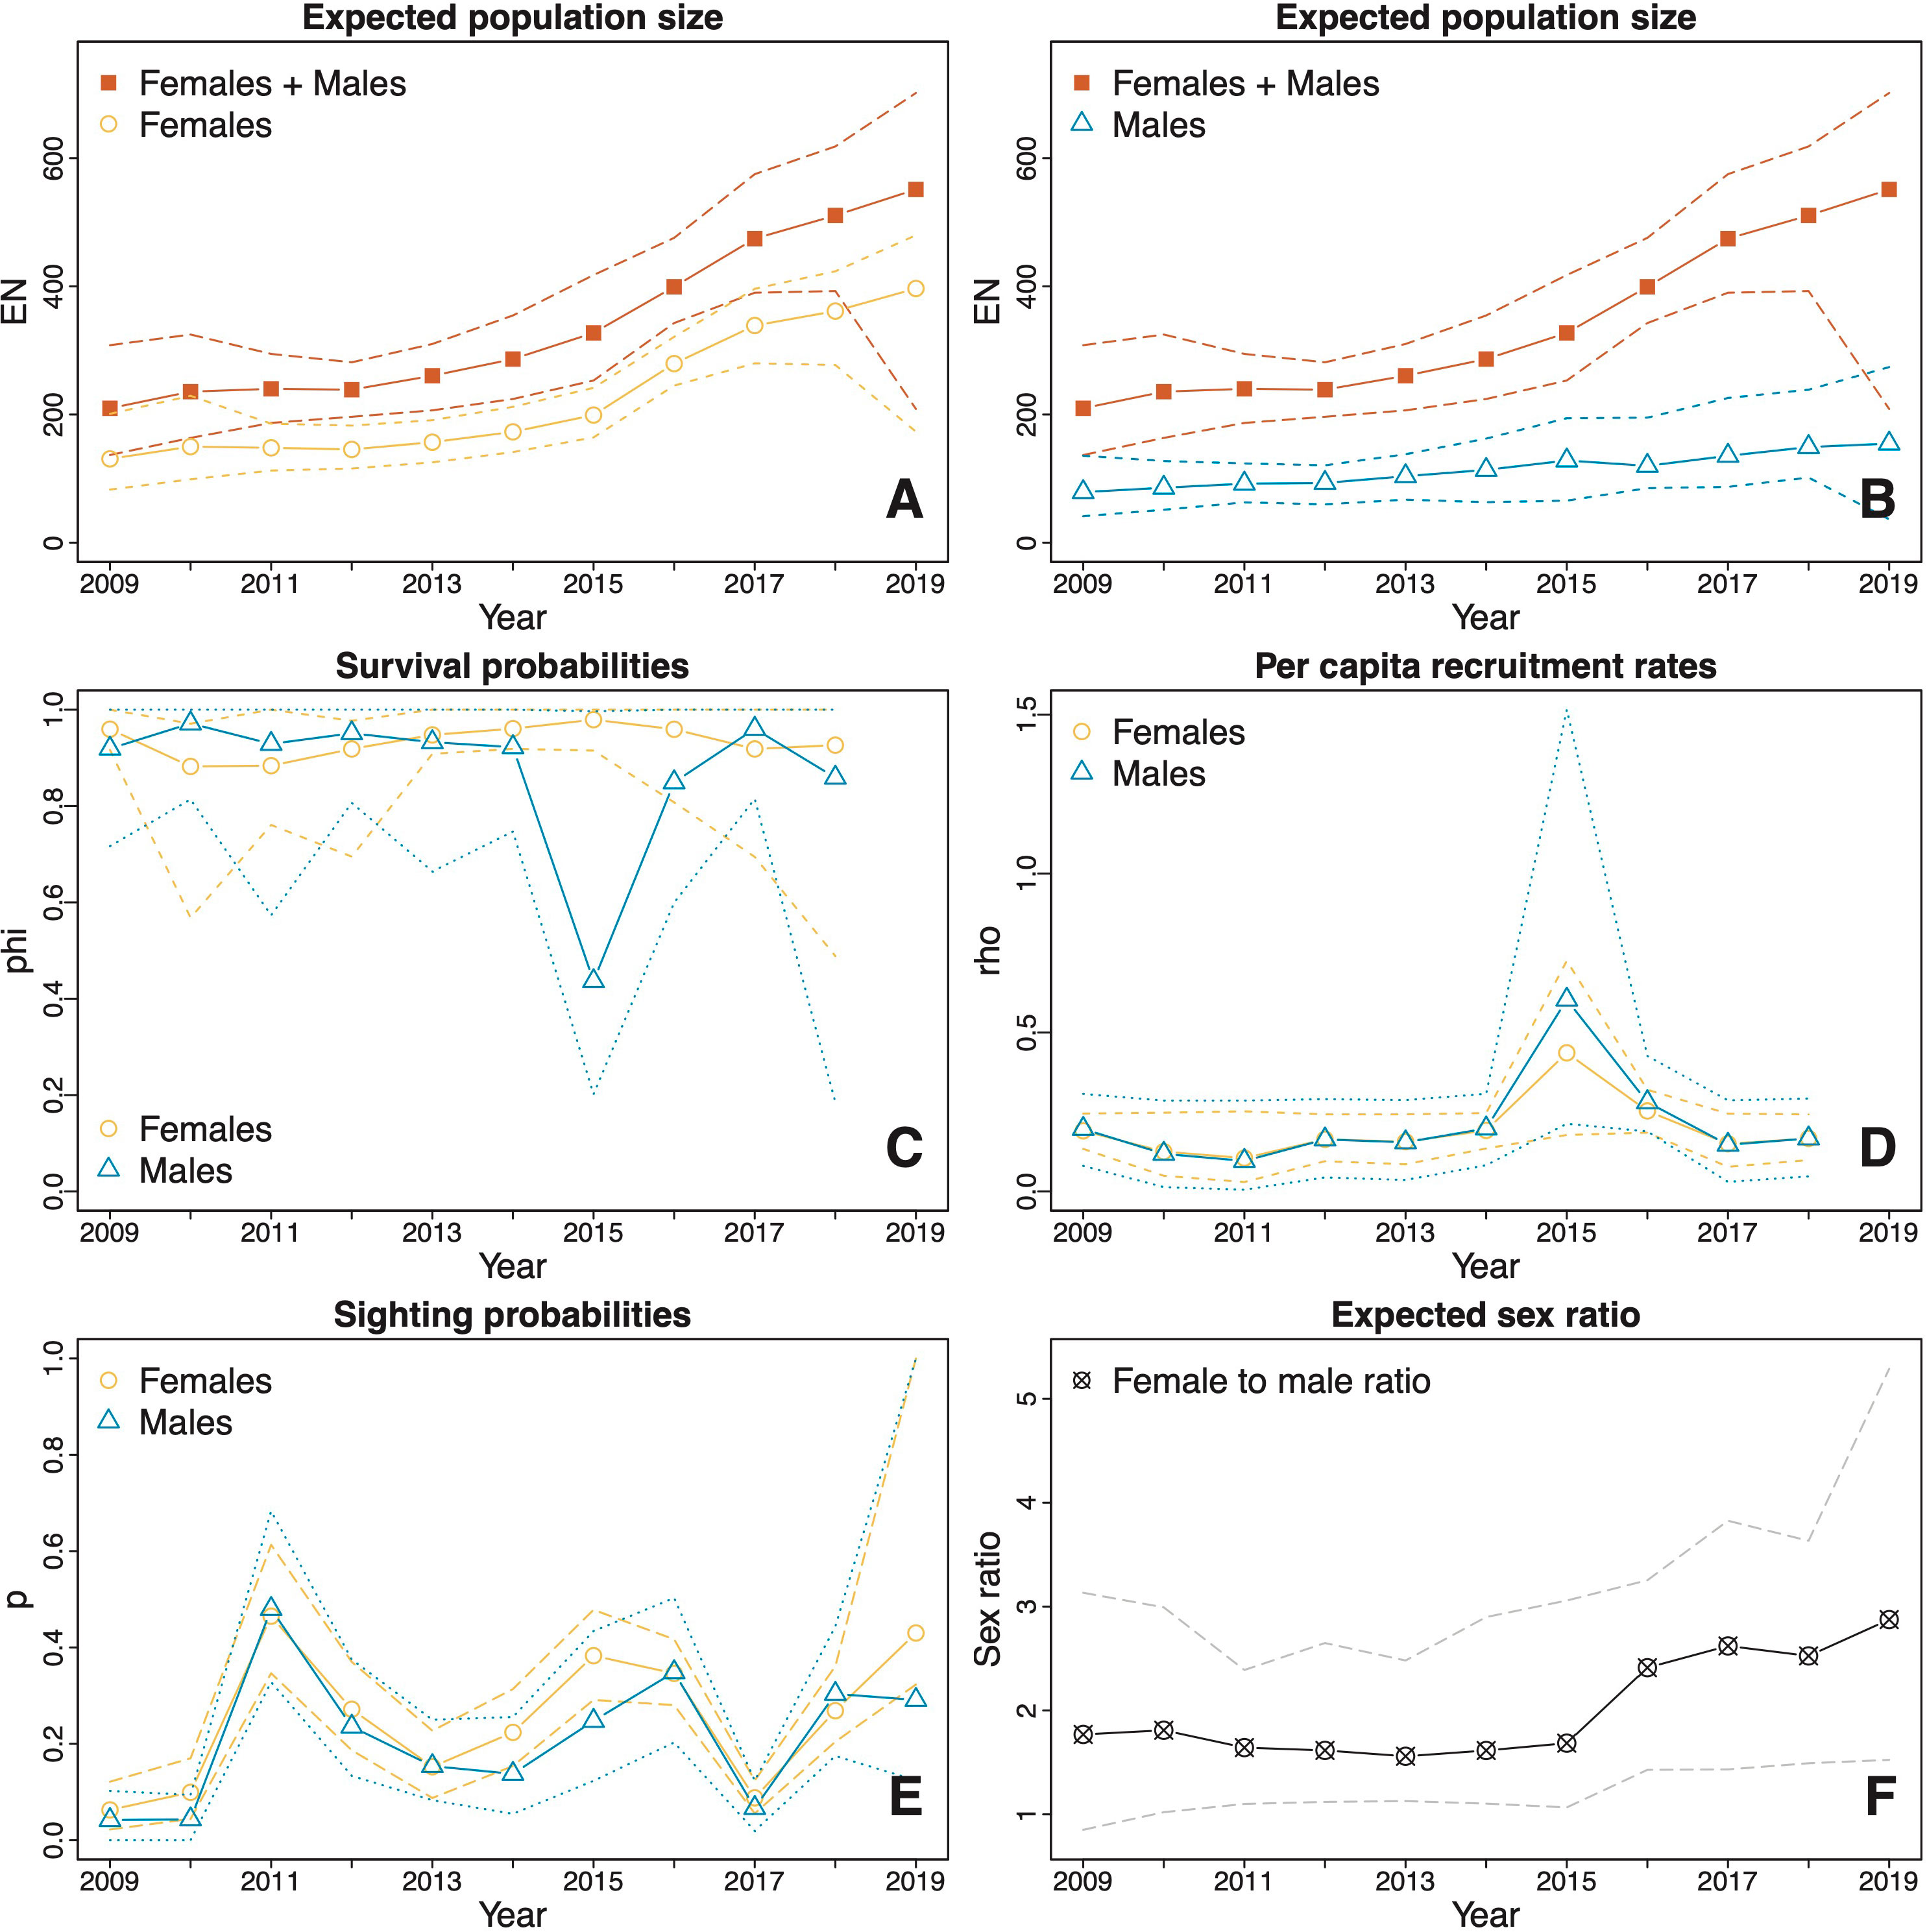
Figure 4 Estimates (solid lines) and CIs (dotted and dashed lines) derived from model averaging procedures for the M. alfredi subpopulation in the SE Misool MPA. (A, B) The estimated expected population sizes of females and males relative to the estimated expected overall population sizes of both sexes combined; (C) Survival probabilities of females and males; (D) Per capita recruitment rates of males and females; (E) Sighting probabilities of females and males; and (F) Expected female to male ratio. The orange lines represent female estimates, blue lines represent male estimates, and red lines represent total estimates of females and males. Black and grey lines represent sex ratio estimates (female to male). Dotted lines represent upper and lower confidence intervals.
In SE Misool, due to high uncertainty in the estimated population size in 2019, we did not include the estimates from 2019 when examining the population changes over time. Over the period 2009–2018, the estimated total (female and male) population size increased significantly (p = 0.008) from 210 (137, 308) to 511 (393, 618), with an estimated difference of 300 (139, 427) individuals over a decade. Despite variation in the percentage change in population size between years throughout the study, the estimated overall change during this period is the same as we would observe from a population with a compound annual growth of 10.7% (4.3, 16.1). A steep rise occurred between 2015 and 2017, during which the estimated population size increased significantly (p = 0.034) from 327 (253, 418) to 474 (390, 575) in just two years, with an estimated difference of 147 (5, 277) individuals and a compound annual growth of 21.1% (0.6, 41.8). In 2015–2017, the compound annual growth of females (30.8%, 13.7, 47.4) was higher than that of males (5.7%, -26.3, 62.4). In 2016, in particular, the estimated female population size increased at the highest rate (41.5%; 15.0, 71.7). Additionally, the estimated mean population size of females was significantly (p < 0.001) larger than that of males, with a difference of 111 (70, 149) individuals and a mean expected female to male ratio of 2.01:1 (1:48:1, 2.59:1) (Figure 4F).
3.5 Survival probabilities and per capita recruitment rates
The estimated apparent survival probabilities in both MPAs showed no significant differences between years or sexes. In Dampier Strait, the estimated survival probabilities were similar across all years and the difference between sexes was not significant (Figure 3C). The estimated mean apparent survival probability was 0.93 (0.91, 0.95) for females and 0.93 (0.90, 0.95) for males with no significant difference between the sexes (p = 0.940). In SE Misool, the estimated mean apparent survival probability for females (0.93; 0.87, 0.97) was higher than that of males (0.87; 0.76, 0.94), however, the difference was also not significant (p = 0.216) (Figure 4C). The estimated apparent survival probability for males decreased to 0.44 (0.20, 1.00) in 2015, however, the drop was not significant as seen from the wide CI.
The estimated per capita recruitment rates in both MPAs were typically around 0.20 for both sexes (Figures 3D and 4D). There were no significant differences between years or sexes. In Dampier Strait, the estimated mean per capita recruitment rate for females was slightly higher than that of males, but the difference was not significant (p = 0.959). In SE Misool, the sharp increases in per capita recruitment rates in 2015 were not significant given the wide CIs.
3.6 Sighting and transient probabilities
The estimates of sighting probabilities in Dampier Strait (Figure 3E) overall were higher than those in SE Misool (Figure 4E). For both MPAs, the estimated sighting probabilities varied depending on sex and years. In Dampier Strait, the estimated mean sighting probabilities of females p̂f= 0.52 (0.47, 0.57) was significantly (p < 0.001) higher than that of males p̂m= 0.34 (0.28, 0.38). The sighting probabilities showed a similar trend over time, with general increase from 2009 to 2014, reaching the lowest probability in 2016 and rising again in the following years. In SE Misool, the estimated mean sighting probability of females p̂f = 0.25 (0.21, 0.31) was slightly higher than that of males p̂m = 0.21 (0.16, 0.30), but the difference was not significant (p = 0.294). A significant dip was estimated in 2017 for both sexes.
Transient probabilities were only estimated for Dampier Strait MPA following the GOF test results. As per the Methods subsection POPAN models with transience, we estimated a constant transience probability across all occasions, aside from the first occasion (2009), for which we estimated a separate probability. The estimated transience probability for the first occasion was 0.10 (0.00, 0.30) and was 0.49 (0.32, 0.63) for the remaining occasions.
4 Discussion
Over a decade during the study period, the estimates of the population size of M. alfredi in both the Dampier Strait and SE Misool MPAs showed increasing trends, with slightly different growth patterns between populations. In Dampier Strait, the population exhibited a significant growth in size, particularly between 2011 and 2014. In comparison, the population in SE Misool was estimated to have increased substantially after 2015. The increased estimated population size in both MPAs over a decade suggests that these are robust findings. Setyawan et al. (2020) reported a higher proportion of pregnant females in Raja Ampat than in other studied populations of M. alfredi across the Indo-Pacific. Despite several studies reporting biennial or longer reproductive periodicities (Marshall and Bennett, 2010; Deakos et al., 2011; Stevens, 2016), a total of 16 female M. alfredi in Raja Ampat were recorded with annual reproductive periodicity, including one exceptional individual which had four consecutive-year pregnancies and a total of five pregnancies confirmed in seven years. Setyawan et al. (2020; 2022b) reported four M. alfredi nurseries in Raja Ampat, and 65 young-of-the-year (YoY) were identified between 2011 and 2019, a number that surpasses other published studies (Marshall and Bennett, 2010; Couturier et al., 2014; Stevens, 2016; Germanov et al., 2019; Germanov et al., 2022). These findings all support the suggestions of our models that M. alfredi (sub)populations are growing in both Raja Ampat MPAs studied here, with high fecundity and per capita recruitment rates. Importantly, the overall rates of annual population increase estimated in our study (3.9% in Dampier Strait and 10.7% in SE Misool) match well with the theoretical rates of increase calculated by previous authors. Dulvy et al. (2014) calculated the maximum intrinsic rate of population increase (rmax) of manta rays, with the median rmax of 0.116 per year (notably, one of the lowest rmax of 106 species of sharks and rays examined), while Ward-Paige et al. (2013) estimated an intrinsic rate of population increase of M. alfredi of 5% per year.
The 2016–2017 increase in estimated population size in SE Misool, which was largely driven by females, is likely associated with favorable environmental conditions in Raja Ampat, particularly in the southern region. This coincides with the occurrence of an intense El Niño event between May 2015 and May 2016, as indicated by high positive MEI values (Supplementary Figure 2). Beale et al. (2019) showed that El Niño conditions lead to a drop in SST and an increase in wind-driven vertical mixing in SE Misool, which in turn leads to a shallowing of the thermocline and apparent increases in plankton density. With this in mind, we posit that the intense El Niño in 2016–2017 likely enhanced the environmental conditions for feeding for M. alfredi and therefore attracted migrants into the study area from neighboring regions or unmonitored areas in SE Misool. This can be seen from the spikes in the per capita recruitment rates estimated for both females and males in SE Misool in 2015 (Figure 4D). Among all 32 best models in SE Misool, the per capita recruitment rates in 29 models and survival probabilities in 18 models varied depending on MEI (Supplementary Table 2). Similarly, among the 33 best models in Dampier Strait, the per capita recruitment rates in 14 models and the survival probabilities in 19 models varied depending on MEI (Supplementary Table 1). Given the small number of YoY and juveniles observed in the study area, it is possible that the high per capita recruitment rates in this period may not reflect YoY individuals entering the existing study populations but are rather indicative of the immigration of adult or subadult individuals, as observed for M. birostris during the extreme El Niño event in 2015–2016 (Beale et al., 2019). The sharp spike of estimated per capita recruitment rates in 2015 led to the substantial increase in the estimated population size in 2016. This increase, however, only occurred with female M. alfredi mainly due to the drop in male survival probability regardless of the high per capita recruitment rates. One possibility is that in 2015 several males in the population left the SE Misool study area, but at the same time males immigrated from neighboring regions outside the study area. However, our estimates of per capita recruitment rate and survival probability for males in 2015 are imprecise, as indicated by their wide CIs, and so care should be taken when interpreting patterns in these estimates.
The 2015–2016 El Niño also likely led to the increase in sighting probabilities in SE Misool (Figure 4E). This extreme El Niño, combined with the southeast monsoon at a regional scale, generated upwelling-induced cooler SSTs, and high chl-a concentrations. These were indicative of higher-than-normal productivity (Gordon, 2005; Setiawan et al., 2020), especially in the third and last quarter of 2015 (Supplementary Figures 6, 7). Chl-a concentrations were positively correlated with the number of M. alfredi sighted (Jaine et al., 2012; Harris et al., 2020) and the high number of sightings is most likely due to increases in zooplankton density, attracting foraging aggregations (Weeks et al., 2015).
In comparison to the SE Misool population, the extreme 2015–2016 El Niño likely affected the M. alfredi in Dampier Strait differently. In this region, the sighting probabilities for both females and males were estimated to drop significantly in 2015 and were lowest in 2016 (Figure 3E), despite the high and stable apparent survival probabilities for both sexes. Moreover, the per capita recruitment was also estimated to be declining after reaching a peak in 2013 and was lowest in 2016 for both sexes. In 2015–2016, the relatively low sighting probabilities and per capita recruitment rates in Dampier Strait were likely driven by fewer individuals sighted due to temporary emigration to areas of high productivity to maximize foraging activities, possibly to west Waigeo Island. Setyawan et al. (2018) found that M. alfredi tracked using passive acoustic telemetry moved seasonally between Dampier Strait and areas in the west of Waigeo. During the second half of 2015, the west Waigeo region and southwestern Raja Ampat waters were substantially cooler than in the Dampier Strait (Figure 1; Supplementary Figure 6). During this time period, which coincided with the southeast monsoon and the extreme El Niño event, considerably fewer acoustic tagged M. alfredi were detected by the receiver at Manta Ridge in Dampier Strait compared to the same period in the previous year, and there were more detections on receivers located at Yefnabi Kecil and Eagle Rock in west Waigeo region, situated less than 70 km from Manta Ridge (Setyawan et al., 2018) (Figure 1).
The cooler waters and higher productivity measured in SE Misool during El Niño events likely resulted in highly abundant prey for M. alfredi during these periods. Based on our field observations, these periods of increased prey availability also seem to have caused more frequent and larger M. alfredi aggregations, leading to increases in the opportunities for mating (Setyawan et al., 2020). We hypothesize that increased pregnancy rates, in particular those in SE Misool in 2011 and 2015–2016, were likely caused by the El Niño events leading to greater foraging opportunities, better body condition and more mating opportunities in the cooler waters (Supplementary Figures 5, 6). This is supported by per capita recruitment rates and apparent survival probabilities in SE Misool that are strongly linked with MEI (Supplementary Table 2). In the same region and period, Beale et al. (2019) reported a significant increase in M. birostris sightings as a result of the favorable feeding conditions created by the ENSO event.
The high pregnancy rates occurred during and/or shortly after the El Niño events, with an elevated number of YoY individuals expected to enter the population approximately 1–2 years thereafter. However, only small numbers of juveniles were observed in the Dampier Strait and SE Misool, the majority of which were newly identified sub-adults or adults >2.4 m disc width (DW) (Setyawan et al., 2020). This apparent lack of YoY individuals in the study areas following periods of high pregnancy rates is perhaps not surprising. As observed in other countries (Couturier et al., 2014; Stevens, 2016; Peel, 2019), primary M. alfredi feeding and cleaning sites such as those in Dampier Strait and SE Misool tend to be dominated by adults, while YoY and juvenile individuals are generally believed to occupy nursery areas, where they are assumed to have a reduced risk of predation, until they are large enough to join adult aggregations (Marshall and Bennett, 2010; Heupel et al., 2019). With this in mind, we hypothesize that the expected high number of YoY manta rays following these periods of high pregnancy rates were most probably born and remained in nursery areas adjacent to Dampier Strait and SE Misool. For example, many juveniles <2.4 m DW have been observed in Yefnabi Kecil (Figure 1) in West Waigeo (Setyawan et al., 2022c), while three other nursery habitats have been identified in areas adjacent to the Dampier Strait, with juvenile residency periods up to 28 months (Setyawan et al., 2020). Despite being further away from Dampier Strait and SE Misool, the best studied manta ray nursery in Raja Ampat, the Wayag lagoon nursery (Setyawan et al., 2022b), may also have hosted a number of the YoY expected after the high pregnancy rates seen during El Niño events. Indeed, Setyawan et al. (2020) also documented the movement of a YoY first identified in the Wayag lagoon nursery as a 1.8 m DW male and then resighted six years later as a 2.6 m DW young adult male in SE Misool, 296 km south of the nursery.
As the 2015–2016 El Niño event ceased, the environmental conditions changed and a La Niña event ensued from mid 2016 until early 2018, indicated by negative MEI values in that time period. This may be associated with decreases in the sighting probabilities in 2017 and gradual declines in per capita recruitment rates between 2016 and 2017 in SE Misool, slightly slowing the rate of increase of the population towards the end of the study period. In Dampier Strait, the situation was reversed, where the per capita recruitment rates and also the sighting probabilities increased in 2017 and 2018. During the La Niña event, the surface waters in southern (around Misool) and western Raja Ampat (West Waigeo) were relatively warmer and less productive (Setiawan et al., 2020), and hence less favorable to manta ray feeding. A decrease in the amount of food might lead to two different possible scenarios. First, fewer individuals immigrated to the study area in SE Misool from neighboring regions, therefore the per capita recruitment rates declined. At the same period, more individuals immigrated into the study area in the Dampier Strait from neighboring regions in western Raja Ampat. Second, Chapman et al. (2012) highlights that partial migration is extremely common in fishes, in which some individuals in the population are residents and some are migratory. Andrzejaczek et al. (2020) suggested that M. alfredi may be partial migrants, from which we might conclude that resident individuals in SE Misool and West Waigeo stayed and exploited deeper water to forage, while migratory individuals left these areas to forage in more productive areas around Raja Ampat, including the Dampier Strait.
The high apparent survival probabilities of non-transient female and male M. alfredi in both MPAs implies a relatively low rate of individual mortality, or a low rate of permanent emigration from the core study areas, or likely a combination of both. The low rates of mortality and permanent emigration are reflected in the high frequency of resighting, with several individuals sighted regularly over periods of more than ten years. Setyawan et al. (2020) reported that 46% of the M. alfredi identified were resighted at least once after they were first sighted, with some individuals resighted up to 13 years later. High apparent survival was also reported from eastern Australia (Couturier et al., 2014) and Hawaii (Deakos et al., 2011), where M. alfredi showed strong site fidelity to aggregation sites and targeted fisheries were absent. By comparison, M. alfredi in Mozambique were targeted in subsistence fisheries (O'Malley et al., 2017), and the population showed a decreasing trend in annual estimated apparent survival from 0.76 to 0.65 over 15 years (2003–2018), suggesting high mortality associated with continuing pressure from targeted fisheries and insufficient conservation efforts to protect the population (Rohner et al., 2013; Venables, 2020). Increasing fishing pressure is responsible for major global declines in oceanic shark and ray populations in the last five decades (Dulvy et al., 2021; Pacoureau et al., 2021). M. alfredi is a long-lived and late-maturing species that only becomes sexually mature at 11 (males) and 15 years (females) of age (Stevens, 2016); therefore, a high survival probability over a long period of time is required to ensure that populations persist and continue to thrive (Kanive et al., 2015).
Overall, the estimated sighting probabilities were higher in Dampier Strait than in SE Misool, which likely reflects the higher survey effort and substantially larger amount of sightings data collected in Dampier Strait than in SE Misool. The estimated sighting probabilities for females were in general higher than those for males, in particular in Dampier Strait. This is likely because most M. alfredi sightings collected in both MPAs were from cleaning sites, and females, especially adults, visit cleaning sites more frequently than males (Couturier et al., 2014; Stevens, 2016; Perryman et al., 2019). Indeed, the majority of the 20 most-sighted individuals in Raja Ampat were females (Setyawan et al., 2020).
Using TEST 3.SR, we found evidence to suggest that new individuals sighted for the first time had a lower probability of being resighted in comparison with individuals that had been sighted previously, and the presence of transient individuals is one explanation for this effect (Genovart and Pradel, 2019). Using our model, we estimated that approximately half of individuals (0.49; 95% CI: 0.32, 0.63) recruited to the population in Dampier Strait were transients. Transience might be higher in wide-ranging species capable of travelling long distances (Armstrong et al., 2019) and in large aggregations (Setyawan et al., 2020), thereby increasing the challenge of photo-identifying all individuals. Future studies using long-term photo-ID and incorporating photos from other regions may reveal the transient individuals as permanent or temporary migrants (Hupman et al., 2018). Our modification of the standard POPAN model by incorporating per capita recruitment and transience parameters represents an important advance in mark-recapture modelling that should prove useful when examining other manta ray populations and other highly migratory species that are likely to have a significant percentage of transient individuals.
Science-based management, MPA enforcement, and protection of aggregation sites and critical habitats (e.g., nursery areas) are each considered critical to ensure the recovery of elasmobranch populations (Ward-Paige et al., 2013). The adoption of each of these components in a holistic approach to manta ray conservation and management by the Raja Ampat MPA Management Authority likely helps explain the significant population increase reported in our study (Setyawan et al., 2022a). These management measures were responsible for effectively forcing shark fishers to relocate to areas outside Raja Ampat or change their livelihoods (Jaiteh et al., 2016). While limited shark fishing (and the resulting potential for manta ray bycatch) undoubtedly still occurs in the more remote and unpatrolled areas outside of Raja Ampat’s MPA boundaries, almost all known manta ray aggregation sites and all known nurseries are located within the actively-patrolled MPA network – suggesting that Raja Ampat’s M. alfredi are indeed well-protected (Setyawan et al., 2020). By contrast, the reef regions in closest proximity to Raja Ampat (including Halmahera to the west and Seram to the south) both host local populations of manta rays, but they are currently not protected by MPAs. M. alfredi in Raja Ampat exhibit a strong pattern of residency, likely due to the year-round presence of reliable and abundant food sources precluding any need to risk crossing the deep-water barriers to these adjacent islands and reef systems (Setyawan et al., 2018; Setyawan et al., 2020). As such, while occasional movements to unprotected reef areas are certainly possible, we suggest that the current MPA network and associated manta ray protection measures in Raja Ampat (Setyawan et al., 2022a) are seemingly sufficient to ensure this population is both protected and in fact actively growing. Viewed in the context of the Pacoureau et al. (2021) report of a major global decline in oceanic shark and ray populations (including M. alfredi) over the last five decades, primarily due to increasing fishing pressure, the reverse situation in Raja Ampat provides a reason for optimism when a holistic approach is adopted for elasmobranch conservation initiatives. This study also underlines the importance of long-term monitoring to evaluate the effectiveness of conservation management measures on M. alfredi populations.
5 Conclusions
We found strong evidence that the populations of M. alfredi in both the Dampier Strait and SE Misool MPAs in the Raja Ampat archipelago have increased significantly over our decade-long study period. Our results suggest that the series of conservation and management measures implemented in Raja Ampat since 2007 (Setyawan et al., 2022a), including the creation and enforcement of a large-scale network of nine MPAs, the designation of Southeast Asia’s first shark and ray sanctuary, a national manta ray protection regulation, and the formulation of gear restrictions and manta tourism regulations in Raja Ampat MPAs, have substantially reduced fisheries-related pressures on the M. alfredi populations there. Coupled with El Niño–Southern Oscillation events that are strongly associated with increased per capita recruitment rates and high apparent survival probabilities, all these factors have enabled the M. alfredi (sub)populations in the Dampier Strait and SE Misool MPAs to thrive. Finally, we made substantial advances in the use of POPAN models to estimate the population size of large migratory species like manta rays by incorporating transience and per capita recruitment parameters.
Data availability statement
The datasets presented in this study can be found in the https://github.com/b-steve/manta-popan]. Further inquiries can be directed to the corresponding author.
Ethics statement
The animal study was reviewed and approved by The University of Auckland Animal Ethics Committee.
Author contributions
ES, BS, RC, ME conceived the ideas and conceptualization. ES, RM, AH, AS, IM, OA, MI, and MP collected the data. ES curated the data. ES, BS, RF, and RA-S performed the statistical analysis. ES created figures, tables, and map with guidance from BS. ES, BS, RC, ME drafted the manuscript. ME, RC, and BS provided guidance and supervision, reviewed, and edited drafts of the manuscript. All authors contributed to the article and approved the submitted version.
Funding
Funding for this work was provided by the following donors: the Sunbridge Foundation, MAC3 Impact Philanthropies, the David and Lucile Packard Foundation, the MacArthur Foundation, the Wolcott Henry Foundation, Audrey and Shannon Wong and Save the Blue Foundation, the Walton Family Foundation, Dawn Arnall, Marie-Elizabeth Mali and the Alchemy of Change Fund, Ray and Barbara Dalio, Katrine Bosley, Seth Neiman, Michael Light and Stellar Blue Fund, Daniel Roozen, the O’Connor family and the Charles Engelhard Foundation, the Paine Family Trust, Save Our Seas Foundation, the Misool Manta Project, Sea Sanctuaries Trust, and the National Geographic Society.
Acknowledgments
We thank the Government of Indonesia (including the Ministry of Marine Affairs and Fisheries and the Ministry of Environment and Forestry), the West Papua Conservation Agency (BBKSDA Papua Barat), the Raja Ampat MPA Management Authorities (BLUD UPTD Pengelolaan KKP Kepulauan Raja Ampat and Balai Kawasan Konservasi Perairan Nasional (BKKPN) Kupang), and the adat communities and government of Raja Ampat for hosting this work. Thanks to the many collaborators and citizen scientists who helped collect manta sighting data, especially Misool Resort, Papua Diving, Arborek Dive Shop, Barefoot Conservation, Sabine Templeton, Calvin Beale, Hendrik Heuschkel, Edi Frommenwiler, Shawn Heinrichs, Don Silcock, Alex Mustard, David Reubush, “SeaDoc” Steve Genkins, Douglas Keim, Douglas Seifert, and Mary O’Malley. We also thank Burt Jones and Maurine Shimlock and Joel and Jennifer Penner for supporting the online database and various articles about the program on www.birdsheadseascape.com. We moreover extend a warm thanks to the owners and crews of all dive liveaboards and ships which ably assisted with manta surveys over the past decade, particularly the Pindito, Putiraja, Dewi Nusantara, Silolona, Si Datu Bua, Amira, Rascal Voyages, Alucia and Umbra, as well as the following staff of Yayasan Konservasi Indonesia that tirelessly assisted our manta survey work: Urias Tuhumena, Timore Kristiani, Demas Fiay, Pak Poerwanto, Nugraha Maulana, Yulius Thonak, Yakonias Thonak, and Marselinus Uskono. We especially thank Sarah Lewis, the Indonesian Manta Project and the Manta Trust for the initiation and continued support of this long-term study. We also note that this research was made possible thanks to funding to ES from WWF’s Russell E. Train Education for Nature Program (EFN). Lastly, the first author’s PhD is supported by Manaaki New Zealand Scholarships.
Conflict of interest
The authors declare that the research was conducted in the absence of any commercial or financial relationships that could be construed as a potential conflict of interest.
Publisher’s note
All claims expressed in this article are solely those of the authors and do not necessarily represent those of their affiliated organizations, or those of the publisher, the editors and the reviewers. Any product that may be evaluated in this article, or claim that may be made by its manufacturer, is not guaranteed or endorsed by the publisher.
Supplementary material
The Supplementary Material for this article can be found online at: https://www.frontiersin.org/articles/10.3389/fmars.2022.1014791/full#supplementary-material
References
Andrzejaczek S., Chapple T. K., Curnick D. J., Carlisle A. B., Castleton M., Jacoby D. M., et al. (2020). Individual variation in residency and regional movements of reef manta rays Mobula alfredi in a large marine protected area. Mar. Ecol. Prog. Ser. 639. doi: 10.3389/fmars.2020.00558
Armstrong A. O., Armstrong A. J., Bennett M. B., Richardson A. J., Townsend K. A., Dudgeon C. L. (2019). Photographic identification and citizen science combine to reveal long distance movements of individual reef manta rays Mobula alfredi along Australia’s east coast. Mar. Biodivers. Rec. 12 (1), 14. doi: 10.1186/s41200-019-0173-6
Armstrong A. J., Armstrong A. O., McGregor F., Richardson A. J., Bennett M. B., Townsend K. A., et al. (2020). Satellite tagging and photographic identification reveal connectivity between two UNESCO world heritage areas for reef manta rays. Front. Mar. Sci. 7. doi: 10.3389/fmars.2020.00725
Beale C. S., Stewart J. D., Setyawan E., Sianipar A. B., Erdmann M. V. (2019). Population dynamics of oceanic manta rays (Mobula birostris) in the Raja Ampat archipelago, West Papua, Indonesia, and the impacts of the El Niño-Southern Oscillation on their movement ecology. Divers. Distrib. 25, 1472–1487. doi: 10.1111/ddi.12962
Beissinger S. R., Westphal M. I. (1998). On the use of demographic models of population viability in endangered species management. J. Wildl. Manage. 62, 821–841. doi: 10.2307/3802534
Boys R. M., Oliveira C., Pérez-Jorge S., Prieto R., Steiner L., Silva M. A. (2019). Multi-state open robust design applied to opportunistic data reveals dynamics of wide-ranging taxa: the sperm whale case. Ecosphere 10 (3), e02610. doi: 10.1002/ecs2.2610
Buckland S. T., Anderson D. R., Burnham K. P., Laake J. L., Borchers D. L., Thomas L. (2001). Introduction to distance sampling: estimating abundance of biological populations (United Kingdom: Oxford University Press).
Carroll E., Childerhouse S., Fewster R., Patenaude N., Steel D., Dunshea G., et al. (2013). Accounting for female reproductive cycles in a superpopulation capture–recapture framework. Ecol. Appl. 23 (7), 1677–1690. doi: 10.1890/12-1657.1
Chapman B., Skov C., Hulthén K., Brodersen J., Nilsson P. A., Hansson L. A., et al. (2012). Partial migration in fishes: definitions, methodologies and taxonomic distribution. J. Fish Biol. 81 (2), 479–499. doi: 10.1111/j.1095-8649.2012.03349.x
Cooch E., White G. (2001). “"Goodness of fit testing…,",” in Program MARK: A gentle introduction, 1–36. (Colorado, USA: Colorado State University).
Couturier L. I. E., Dudgeon C. L., Pollock K. H., Jaine F. R. A., Bennett M. B., Townsend K. A., et al. (2014). Population dynamics of the reef manta ray Manta alfredi in eastern Australia. Coral Reefs 33 (2), 329–342. doi: 10.1007/s00338-014-1126-5
Couturier L. I. E., Jaine F. R. A., Townsend K. A., Weeks S. J., Richardson A. J., Bennett M. B. (2011). Distribution, site affinity and regional movements of the manta ray, Manta alfredi (Krefft, 1868), along the east coast of Australia. Mar. Freshwat. Res. 62 (6), 628–637. doi: 10.1071/MF10148
Croll D. A., Dewar H., Dulvy N. K., Fernando D., Francis M. P., Galván-Magaña F., et al. (2015). Vulnerabilities and fisheries impacts: the uncertain future of manta and devil rays. Aquat. Conserv.: Mar. Freshwat. Ecosyst. 26 (3), 562–575. doi: 10.1002/aqc.2591
Davies T. K., Stevens G., Meekan M. G., Struve J., Rowcliffe J. M. (2012). Can citizen science monitor whale-shark aggregations? investigating bias in mark–recapture modelling using identification photographs sourced from the public. Wildlife Res. 39 (8), 696–704. doi: 10.1071/WR12092
Deakos M. H., Baker J. D., Bejder L. (2011). Characteristics of a manta ray Manta alfredi population off Maui, Hawaii, and implications for management. Mar. Ecol. Prog. Ser. 429, 245–260. doi: 10.3354/MEPS09085
Dewar H., Mous P., Domeier M., Muljadi A., Pet J., Whitty J. (2008). Movements and site fidelity of the giant manta ray, Manta birostris, in the Komodo Marine Park, Indonesia. Mar. Biol. 155 (2), 121–133. doi: 10.1007/s00227-008-0988-x
Dudgeon C. L., Noad M. J., Lanyon J. M. (2008). Abundance and demography of a seasonal aggregation of zebra sharks stegostoma fasciatum. Mar. Ecol. Prog. Ser. 368, 269–281. doi: 10.3354/meps07581
Dulvy N. K., Pacoureau N., Rigby C. L., Pollom R. A., Jabado R. W., Ebert D. A., et al. (2021). Overfishing drives over one-third of all sharks and rays toward a global extinction crisis. Curr. Biol. 31, 4773–4787. doi: 10.1016/j.cub.2021.08.062
Dulvy N. K., Pardo S. A., Simpfendorfer C. A., Carlson J. K. (2014). Diagnosing the dangerous demography of manta rays using life history theory. PeerJ 2, e400. doi: 10.7717/peerj.400
Edgar G. J., Stuart-Smith R. D., Willis T. J., Kininmonth S., Baker S. C., Banks S., et al. (2014). Global conservation outcomes depend on marine protected areas with five key features. Nature 506 (7487), 216–220. doi: 10.1038/nature13022
Gell F. R., Roberts C. M. (2003). Benefits beyond boundaries: the fishery effects of marine reserves. Trends Ecol. Evol. 18 (9), 448–455. doi: 10.1016/S0169-5347(03)00189-7
Genovart M., Pradel R. (2019). Transience effect in capture-recapture studies: The importance of its biological meaning. PloS One 14 (9), e0222241. doi: 10.1371/journal.pone.0222241
Germanov E. S., Bejder L., Chabanne D. B., Dharmadi D., Hendrawan I. G., Marshall A. D., et al. (2019). Contrasting habitat use and population dynamics of reef manta rays within the Nusa Penida marine protected area, Indonesia. Front. Mar. Sci. 6. doi: 10.3389/fmars.2019.00215
Germanov E. S., Pierce S. J., Marshall A. D., Hendrawan I. G., Kefi A., Bejder L., et al. (2022). Residency, movement patterns, behavior and demographics of reef manta rays in Komodo National Park. PeerJ 10, e13302. doi: 10.7717/peerj.13302
Gimenez O., Lebreton J.-D., Choquet R., Pradel R. (2018). R2ucare: An R package to perform goodness-of-fit tests for capture-recapture models. Methods Ecol. Evol 9, 1749–54. doi: 10.1111/2041-210X.13014
Gordon A. L. (2005). Oceanography of the Indonesian seas and their throughflow. Oceanography 18 (4), 14–27. doi: 10.5670/oceanog.2005.01
Graham R. T., Roberts C. M. (2007). Assessing the size, growth rate and structure of a seasonal population of whale sharks (Rhincodon typus Smith 1828) using conventional tagging and photo identification. Fish. Res. 84 (1), 71–80. doi: 10.1016/j.fishres.2006.11.026
Graham N. A., Spalding M. D., Sheppard C. R. (2010). Reef shark declines in remote atolls highlight the need for multi-faceted conservation action. Aquat. Conserv.: Mar. Freshwat. Ecosyst. 20 (5), 543–548. doi: 10.1002/aqc.1116
Harris J. L., McGregor P. K., Oates Y., Stevens G. M. (2020). Gone with the wind: Seasonal distribution and habitat use by the reef manta ray (Mobula alfredi) in the Maldives, implications for conservation. Aquat. Conserv.: Mar. Freshwat. Ecosyst. doi: 10.1002/aqc.3350
Heinrichs S., O’Malley M., Medd H., Hilton P. (2011). The Global Threat to Manta and Mobula Rays. (USA: Manta Ray of Hope).
Heupel M. R., Kanno S., Martins A. P., Simpfendorfer C. A. (2019). Advances in understanding the roles and benefits of nursery areas for elasmobranch populations. Mar. Freshwat. Res. 70 (7), 897–907. doi: 10.1071/MF18081
Holmberg J., Norman B., Arzoumanian Z. (2009). Estimating population size, structure, and residency time for whale sharks Rhincodon typus through collaborative photo-identification. Endanger. Species Res. 7 (1), 39–53. doi: 10.3354/esr00186
Hupman K., Stockin K. A., Pollock K., Pawley M. D. M., Dwyer S. L., Lea C., et al. (2018). Challenges of implementing mark-recapture studies on poorly marked gregarious delphinids. PloS One 13 (7), e0198167. doi: 10.1371/journal.pone.0198167
Jacoby D. M., Ferretti F., Freeman R., Carlisle A. B., Chapple T. K., Curnick D. J., et al. (2020). Shark movement strategies influence poaching risk and can guide enforcement decisions in a large, remote marine protected area. J. Appl. Ecol. 57 (9), 1782–1792. doi: 10.1111/1365-2664.13654
Jaine F. R., Couturier L. I., Weeks S. J., Townsend K. A., Bennett M. B., Fiora K., et al. (2012). When giants turn up: sighting trends, environmental influences and habitat use of the manta ray Manta alfredi at a coral reef. PloS One 7 (10), e46170. doi: 10.1371/journal.pone.0046170
Jaine F., Rohner C., Weeks S., Couturier L., Bennett M., Townsend K., et al. (2014). Movements and habitat use of reef manta rays off eastern Australia: Offshore excursions, deep diving and eddy affinity revealed by satellite telemetry. Mar. Ecol. Prog. Ser. 510, 73–86. doi: 10.3354/meps10910
Jaiteh V. F., Lindfield S. J., Mangubhai S., Warren C., Fitzpatrick B., Loneragan N. R. (2016). Higher abundance of marine predators and changes in fishers' behavior following spatial protection within the world's biggest shark fishery. Front. Mar. Sci. 3. doi: 10.3389/fmars.2016.00043
Kanive P. E., Rotella J. J., Jorgensen S. J., Chapple T. K., Anderson S. D., Klimley A. P., et al. (2015). Estimating apparent survival of sub-adult and adult white sharks (Carcharodon carcharias) in central California using mark-recapture methods. Front. Mar. Sci 2 (19). doi: 10.3389/fmars.2015.00019
Kitchen-Wheeler A., Ari C., Edwards A. J. (2011). Population estimates of Alfred mantas (Manta alfredi) in central Maldives atolls: North Male, Ari and Baa. Environ. Biol. Fishes 93 (4), 557–575. doi: 10.1007/s10641-011-9950-8
Knip D. M., Heupel M. R., Simpfendorfer C. A. (2012). Evaluating marine protected areas for the conservation of tropical coastal sharks. Biol. Conserv. 148 (1), 200–209. doi: 10.1016/j.biocon.2012.01.008
Lewis S. A., Setiasih N., Dharmadi D., O'Malley M. P., Campbell S. J., Yusuf M., et al. (2015). Assessing Indonesian manta and devil ray populations through historical landings and fishing community interviews. PeerJ Preprints 6, e1334v1. doi: 10.7287/peerj.preprints.1334v1
Magson K., Monacella E., Scott C., Buffat N., Arunrugstichai S., Chuangcharoendee M., et al. (2022). Citizen science reveals the population structure and seasonal presence of whale sharks in the Gulf of Thailand. J. Fish Biol 3, 540–549. doi: 10.1111/jfb.15121
Mangubhai S., Erdmann M. V., Wilson J. R., Huffard C. L., Ballamu F., Hidayat N. I., et al. (2012). Papuan Bird’s Head Seascape: Emerging threats and challenges in the global center of marine biodiversity. Mar. pollut. Bull. 64 (11), 2279–2295. doi: 10.1016/j.marpolbul.2012.07.024
Marshall A., Barreto R., Carlson J., Fernando D., Fordham S., Francis M. P., et al. (2019) Mobula alfredi. the IUCN red list of threatened species 2019: e.T195459A68632178. Available at: https://dx.doi.org/10.2305/IUCN.UK.2019-3.RLTS.T195459A68632178.en (Accessed 09 April 2021).
Marshall A. D., Bennett M. B. (2010). Reproductive ecology of the reef manta ray Manta alfredi in southern Mozambique. J. Fish Biol. 77 (1), 169–190. doi: 10.1111/j.1095-8649.2010.02669.x
Marshall A. D., Compagno L. J., Bennett M. B. (2009). Redescription of the Genus manta with resurrection of Manta alfredi (Krefft 1868) (Chondrichthyes; Myliobatoidei; Mobulidae). Zootaxa 2301, 1–28. doi: 10.11646/ZOOTAXA.2301.1.1
Marshall A. D., Dudgeon C., Bennett M. (2011). Size and structure of a photographically identified population of manta rays Manta alfredi in southern Mozambique. Mar. Biol. 158 (5), 1111–1124. doi: 10.1007/s00227-011-1634-6
Marshall A. D., Pierce S. J. (2012). The use and abuse of photographic identification in sharks and rays. J. Fish Biol. 80 (5), 1361–1379. doi: 10.1111/j.1095-8649.2012.03244.x
McKinney J. A., Hoffmayer E. R., Holmberg J., Graham R. T., Driggers W. B. III, de la Parra-Venegas R., et al. (2017). Long-term assessment of whale shark population demography and connectivity using photo-identification in the Western Atlantic ocean. PloS One 12 (8), e0180495. doi: 10.1371/journal.pone.0180495
Meekan M. G., Bradshaw C. J., Press M., McLean C., Richards A., Quasnichka S., et al. (2006). Population size and structure of whale sharks Rhincodon typus at ningaloo reef, Western Australia. Mar. Ecol. Prog. Ser. 319, 275–285. doi: 10.3354/meps319275
Norris K. (2004). Managing threatened species: the ecological toolbox, evolutionary theory and declining-population paradigm. J. Appl. Ecol. 41 (3), 413–426. doi: 10.1111/j.0021-8901.2004.00910.x
O'Malley M. P., Townsend K. A., Hilton P., Heinrichs S., Stewart J. D. (2017). Characterization of the trade in manta and devil ray gill plates in China and South-east Asia through trader surveys. Aquat. Conserv.: Mar. Freshwat. Ecosyst. 27 (2), 394–413. doi: 10.1002/aqc.2670
O’Malley M. P., Lee-Brooks K., Medd H. B. (2013). The global economic impact of manta ray watching tourism. PloS One 8 (5), e65051. doi: 10.1371/journal.pone.0065051
Pacoureau N., Rigby C. L., Kyne P. M., Sherley R. B., Winker H., Carlson J. K., et al. (2021). Half a century of global decline in oceanic sharks and rays. Nature 589 (7843), 567–571. doi: 10.1038/s41586-020-03173-9
Peel L. R. (2019). Movement patterns and feeding ecology of the reef manta ray (Mobula alfredi) in Seychelles (University of Western Australia, Perth, Australia: PhD Dissertation).
Peel L. R., Stevens G. M. W., Daly R., Daly C. A. K., Lea J. S. E., Clarke C. R., et al. (2019). Movement and residency patterns of reef manta rays Mobula alfredi in the Amirante Islands, Seychelles. Mar. Ecol. Prog. Ser. 621, 169–184. doi: 10.3354/meps12995
Perryman R. J., Venables S. K., Tapilatu R. F., Marshall A. D., Brown C., Franks D. W. (2019). Social preferences and network structure in a population of reef manta rays. Behav. Ecol. Sociobiol. 73 (8), 114. doi: 10.1007/s00265-019-2720-x
PISCO (2007). The science of marine reserves, 2nd Edition.(California and Oregon, USA: Oregon State University; University of California Santa Barbara; University of California Santa Cruz; and Stanford University).
Pradel R., Hines J. E., Lebreton J.-D., Nichols J. D. (1997). Capture-recapture survival models taking account of transients. Biometrics 53, 60–72. doi: 10.2307/2533097
QGIS.org (2021)QGIS geographic information system. QGIS association. In: . Available at: https://www.qgis.org/.
R Core Team (2021). “R: A language and environment for statistical computing,” (Vienna, Austria: R Foundation for Statistical Computing). Available at: http://www.R-project.org/.
Robinson O. J., Ruiz-Gutierrez V., Fink D., Meese R. J., Holyoak M., Cooch E. G. (2018). Using citizen science data in integrated population models to inform conservation. Biol. Conserv. 227, 361–368. doi: 10.1016/j.biocon.2018.10.002
Rohner C. A., Flam A. L., Pierce S. J., Marshall A. D. (2017). Steep declines in sightings of manta rays and devilrays (Mobulidae) in southern Mozambique. PeerJ PrePrints doi: 10.7287/peerj.preprints.3051v1
Rohner C., Pierce S., Marshall A., Weeks S., Bennett M., Richardson A. (2013). Trends in sightings and environmental influences on a coastal aggregation of manta rays and whale sharks. Mar. Ecol. Prog. Ser. 482, 153–168. doi: 10.3354/meps10290
Schwarz C. J., Arnason A. N. (1996). A general methodology for the analysis of capture-recapture experiments in open populations. Biometrics 52, 860–873. doi: 10.2307/2533048
Setiawan R., Wirasatriya A., Hernawan U., Leung S., Iskandar I. (2020). Spatio-temporal variability of surface chlorophyll-a in the halmahera Sea and its relation to ENSO and the Indian ocean dipole. Int. J. Remote Sens. 41 (1), 284–299. doi: 10.1080/01431161.2019.1641244
Setyawan E., Erdmann M. V., Gunadharma N., Gunawan T., Hasan A. W., Izuan M., et al. (2022a). A holistic approach to manta ray conservation in the Papuan Bird’s Head Seascape: Resounding success, ongoing challenges. Mar. Policy 137, 104953. doi: 10.1016/j.marpol.2021.104953
Setyawan E., Erdmann M. V., Lewis S. A., Mambrasar R., Hasan A. W., Templeton S., et al. (2020). Natural history of manta rays in the bird's head seascape, Indonesia, with an analysis of the demography and spatial ecology of Mobula alfredi (Elasmobranchii: Mobulidae). J. Ocean Sci. Found. 36, 49–83. doi: 10.5281/zenodo.4396260
Setyawan E., Erdmann M. V., Mambrasar R., Hasan A. W., Sianipar A. B., Constantine R., et al. (2022b). Residency and use of an important nursery habitat, Raja Ampat’s Wayag Lagoon, by juvenile reef manta rays (Mobula alfredi). Front. Mar. Sci. 9. doi: 10.3389/fmars.2022.815094
Setyawan E., Sianipar A. B., Erdmann M. V., Fischer A. M., Haddy J. A., Beale C. S., et al. (2018). Site fidelity and movement patterns of reef manta rays (Mobula alfredi: Mobulidae) using passive acoustic telemetry in northern Raja Ampat, Indonesia. Nat. Conserv. Res. 3 (4), 17–31. doi: 10.24189/ncr.2018.043
Setyawan E., Stevenson B. C., Izuan M., Constantine R., Erdmann M. V. (2022c). How big is that Manta ray? A novel and non-invasive method for measuring reef manta rays using small drones. Drones 6 (3), 63. doi: 10.3390/drones6030063
Speed C. W., Cappo M., Meekan M. G. (2018). Evidence for rapid recovery of shark populations within a coral reef marine protected area. Biol. Conserv. 220, 308–319. doi: 10.1016/j.biocon.2018.01.010
Stevens G. M. W. (2016). Conservation and population ecology of manta rays in the Maldives (University of York: PhD Dissertation).
Stevens G. M. W., Hawkins J. P., Roberts C. M. (2018). Courtship and mating behaviour of manta rays Mobula alfredi and M. birostris in the Maldives. J. Fish Biol. 93 (2), 344–359. doi: 10.1111/jfb.13768
Towner A. V., Wcisel M. A., Reisinger R. R., Edwards D., Jewell O. J. (2013). Gauging the threat: the first population estimate for white sharks in South Africa using photo identification and automated software. PloS One 8 (6), e66035. doi: 10.1371/journal.pone.0066035
Varkey D. A., Ainsworth C. H., Pitcher T. J., Goram Y., Sumaila R. (2010). Illegal, unreported and unregulated fisheries catch in Raja Ampat Regency, Eastern Indonesia. Mar. Policy 34 (2), 228–236. doi: 10.1016/j.marpol.2009.06.009
Venables S. K. (2020). Ecology and conservation of a threatened reef manta ray (Mobula alfredi) population in southern Mozambique (The University of Western Australia, Perth, Australia: PhD Dissertation).
Ward-Paige C. A., Davis B., Worm B. (2013). Global population trends and human use patterns of Manta and Mobula rays. PloS One 8 (9), e74835. doi: 10.1371/journal.pone.0074835
Weeks S. J., Magno-Canto M. M., Jaine F. R. A., Brodie J., Richardson A. J. (2015). Unique sequence of events triggers manta ray feeding frenzy in the Southern Great Barrier Reef, Australia. Remote Sens. 7 (3), 3138–3152. doi: 10.3390/rs70303138
Keywords: marine protected areas (MPA), marine megafauna, mark-recapture, citizen science, Indonesia, conservation, abundance estimation, population dynamics
Citation: Setyawan E, Stevenson BC, Erdmann MV, Hasan AW, Sianipar AB, Mofu I, Putra MIH, Izuan M, Ambafen O, Fewster RM, Aldridge-Sutton R, Mambrasar R and Constantine R (2022) Population estimates of photo-identified individuals using a modified POPAN model reveal that Raja Ampat’s reef manta rays are thriving. Front. Mar. Sci. 9:1014791. doi: 10.3389/fmars.2022.1014791
Received: 08 August 2022; Accepted: 25 October 2022;
Published: 15 November 2022.
Edited by:
Nuno Queiroz, Centro de Investigacao em Biodiversidade e Recursos Geneticos (CIBIO-InBIO), PortugalReviewed by:
Ana Filipa Sobral, University of the Azores, PortugalAbigail Mary Moore, Hasanuddin University, Indonesia
Copyright © 2022 Setyawan, Stevenson, Erdmann, Hasan, Sianipar, Mofu, Putra, Izuan, Ambafen, Fewster, Aldridge-Sutton, Mambrasar and Constantine. This is an open-access article distributed under the terms of the Creative Commons Attribution License (CC BY). The use, distribution or reproduction in other forums is permitted, provided the original author(s) and the copyright owner(s) are credited and that the original publication in this journal is cited, in accordance with accepted academic practice. No use, distribution or reproduction is permitted which does not comply with these terms.
*Correspondence: Edy Setyawan, ZWR5LnNldHlhd2FuQGF1Y2tsYW5kLmFjLm56