Abstract
Dissolved organic matter (DOM) in the land–ocean interface plays a critical role in the global carbon cycle, yet its dynamic is not well understood. Dissolved organic carbon (DOC) in the northern Beibu Gulf was measured seasonally from April 2020 to January 2021. Chromophoric and fluorescent DOM (CDOM and FDOM) were synchronously characterized by absorption and fluorescence spectroscopy. Three fluorescent components were identified from 597 samples using parallel factor analysis, including two humic-like and one protein-like component. DOC displays a significant seasonality with the average level being highest in summer (177 μmol/L) and lowest in winter (107 μmol/L). CDOM and FDOM levels in summer are also higher than those in winter. Although the variation ranges of DOC, CDOM, and FDOM in surface water are generally greater than in bottom water, the difference between the two layers is statistically insignificant. River discharge and anthropogenic input are important external sources of DOM in the low-salinity nearshore waters (i.e., estuaries and coast), whereas DOM in offshore waters is mainly produced by in situ biological activity. The mixing behavior of DOM in the northern Beibu Gulf varies spatially but minimally on a seasonal scale. Two distinct conservative mixing behaviors of DOC, CDOM, and humic-like FDOM occur in the nearshore waters from Tieshangang Bay and excluding Tieshangang Bay, respectively. The removal of protein-like FDOM along the salinity gradient and the negative correlation between protein-like FDOM intensity and apparent oxygen utilization are pronounced in the nearshore waters excluding Tieshangang Bay, jointly indicating that oxygen is consumed by microbial communities. In contrast, a net addition of DOC occurs in the high-salinity offshore waters, whereas the CDOM and humic-like FDOM undergoes quasi-conservative mixing. Overall, this study reveals notable spatial and seasonal variations in the concentration, source, and mixing of DOM at the land–ocean interface and highlights the importance of sources and processes in shaping the amount and composition of DOM exported to the ocean margin.
Introduction
Marine dissolved organic matter (DOM) at 662 ± 32 petagrams of carbon (Pg C) is one of Earth’s major, reduced, and exchangeable carbon reservoirs, comparable to atmospheric CO2 storage (Hedges et al., 1997; Hansell et al., 2009). DOM consists of a heterogeneous mixture of organic molecules originating from a wide variety of sources, such as autochthonous biological production and allochthonous input (Hansell, 2013). The export of riverine DOM from land to the ocean is a crucial pathway of reduced carbon to coastal environments (Raymond and Spencer, 2015). The allochthonous DOM can undergo a variety of biogeochemical reactions in estuaries and coastal sea that ultimately determines both the concentration of dissolved organic carbon (DOC) and the composition of DOM reaching the ocean (Raymond and Spencer, 2015). Unsurprisingly, the behavior of terrestrial DOM during estuarine and coastal mixing varies significantly. The nonconservative mixing of DOM occurs in numerous estuaries and coastal regions because of additions, such as anthropogenic pollution, phytoplankton production, and desorption from sediments (Chen and Gardner, 2004; Spencer et al., 2007; Guo et al., 2014), and removals including flocculation, adsorption onto suspended sediments, and microbial and photochemical degradation (Shank et al., 2005; Yang et al., 2013a). Moreover, the export flux, composition, and fate of riverine DOM are dramatically affected by intensified human activities (Guo et al., 2014), the discharge of organic by-products (Levshina, 2008), dam construction (Zhang et al., 2014), and global climate change (Tian et al., 2013), which significantly impact coastal carbon cycling (Liu et al., 2020).
In addition to bulk DOC, measurements of chromophoric DOM (CDOM) and fluorescent DOM (FDOM) are widely reported from inland watersheds to the deep ocean (Massicotte et al., 2017; Wang et al., 2021a; Wang et al., 2021b; Qu et al., 2022). CDOM absorption coefficients at different wavelengths (e.g., 254, 280, 325, 350, 355, and 443 nm), and fluorescence intensities at specific excitation/emission wavelength pairs are commonly used as good indicators of DOM level (Coble, 1996; Guo et al., 2007; Yang et al., 2013b; Wang et al., 2017; Wang et al., 2021a; Wang et al., 2021b). The qualitative parameters, such as the spectral slope (e.g., S275–295), carbon-normalized absorbance (e.g., SUVA254), fluorescence index (FI), humification index (HIX), and biological index (BIX), are good proxies for the molecular weight, humification degree, DOM freshness in natural aquatic environments, and its associated photochemical and biological processes (Zsolnay et al., 1999; Weishaar et al., 2003; Cory and Mcknight, 2005; Helms et al., 2008; Huguet et al., 2009). Specifically, FDOM excitation-emission matrices (EEMs) coupled with parallel factor (PARAFAC) analysis are used to characterize the natural DOM in numerous estuaries and coastal gulfs around the world, such as the Yangtze River estuary (Guo et al., 2014), Pearl River estuary (Li et al., 2019), Jiulong River estuary (Guo et al., 2011), Taiwan estuaries (Yang et al., 2013b), Gulf of Mexico (Yamashita et al., 2015), and Gulf of Alaska (Dainard and Guéguen, 2013). The humic-like components tend to be resistant to microbial use but are sensitive to solar radiation (Rochelle-Newall and Fisher, 2002; Helms et al., 2013), whereas the protein-like components are rapidly consumed by microorganisms (Xiao et al., 2021). Thus, bulk DOC combined with its specific optical properties can provide valuable information regarding the quantity, quality, and biogeochemical reactivity of DOM in natural aquatic environments.
Estuaries and coastal gulf waters comprise some of the most biologically productive yet anthropogenically stressed ecosystems from inland watersheds to the global ocean continuum. Besides the in situ production of DOM, terrestrial inputs of nutrients and organic carbon are important components driving estuarine and coastal biogeochemical cycling and have implications ranging from degraded ecosystem health to food web perturbations (Beusen et al., 2016). The Beibu Gulf, in the northwestern South China Sea, is located near the rapidly urbanizing and industrializing Beibu Gulf urban cluster. It is a tropical gulf and receives large freshwater discharge with marked seasonal fluctuation and a huge amount of industrial and domestic sewage (See Study area). Biogeochemical studies of the Beibu Gulf have thus far mainly focused on nutrient distribution (Kaiser et al., 2014; Lai et al., 2014; Lao et al., 2021a), heavy metals, and organic pollutants (Meng et al., 2013; Zhu and Zheng, 2013; Yang et al., 2015a; Lao et al., 2019; Lao et al., 2021b; Lao et al., 2022; Zhu et al., 2022a, b) and the associated ecological responses (Xu et al., 2019; Li et al., 2020). The results show that these materials are concentrated in the coastal areas of the Beibu Gulf, suggesting a significant impact of river runoff discharge and human activity on the Beibu Gulf. Nevertheless, the distribution of DOC, CDOM, and FDOM and their seasonality in the Beibu Gulf has not been studied. It greatly limits our understanding of the carbon cycling and ecological effect of a human-influenced coastal gulf in a changing climate background.
For this study, water samples were collected at a high spatial resolution over the four seasons from April 2020 to January 2021 in the northern Beibu Gulf. Our major goals were to (1) provide the first baseline data set on DOC concentrations, CDOM, and EEMs-PARAFAC-derived FDOM parameters in the northern Beibu Gulf; (2) evaluate the sources and mixing behaviors of DOC, CDOM, and FDOM in the northern Beibu Gulf; and (3) reveal the seasonal variabilities of DOM dynamics in the northern Beibu Gulf. The results of this study further increase our understanding of DOM cycling in human-impacted estuarine and coastal waters.
Materials and methods
Study area
The Beibu Gulf is a shallow, semi-enclosed gulf located in the northwestern South China Sea and has an average depth of about 40 m and a total area of about 128,000 km2. Southwesterly winds prevail in summer, and northeasterly winds in winter are influenced by the East Asian monsoon (Chen et al., 2011). The circulation pattern of the Beibu Gulf is mainly controlled by the East Asian monsoon with cyclonical circulation in winter, causing water accumulation near the western coast of the gulf. The westward water transport from the Qiongzhou Strait could influence the most northern part of the gulf in winter. In contrast, water from the coastal area tends to move offshore and undergoes strong mixing in the center of the gulf in summer (Wang et al., 2018). Several rivers flow into the northern coastal area of the Beibu Gulf, including the Nanliu, Dafeng, Qin, Maoling, and Fangcheng Rivers. The total river runoff discharge is up to 3.3 ×10¹¹ m3 yr-1, and more than 80% of the water discharge occurs in the wet season (April to October) (Lai et al., 2014). Consequently, the water in the northern Beibu Gulf falls into two categories: diluted and mixed water. The diluted water is found along the northern coast of the Beibu Gulf, and the mixed water mainly occupies the northern Beibu Gulf (Chen et al., 2011). The Beibu Gulf is also an important fishing ground and aquaculture base in China because of its year-round warm temperatures and rich nutrients. Additionally, the northern coastal area hosts numerous developing ports and cities (Beihai, Qinzhou, Fangcheng; see Figure 1). The intensive human activity in this area has led to a high loading of nutrients (Lao et al., 2020), metals (Lao et al., 2019), and organic pollutants (Lao et al., 2021a) in the Beibu Gulf, which has a dramatical impact on the biogeochemistry and ecology of the gulf.
Figure 1

Map of the northern Beibu Gulf showing its topography (color background) and the locations of the sampling stations (green dots) in spring (April–May 2020), summer (July–August 2020), autumn (October–November 2020), and winter (December 2020 to January 2021). The blue lines and labels represent major rivers that flow into the northern Beibu Gulf, and the red stars represent cities. Sampling stations were divided into three regions: Region I (nearshore stations with a bottom depth of < 5 m excluding Tieshangang Bay, yellow circles), Region II (Tieshangang Bay, red circles), and Region III (offshore stations with a bottom depth of > 5 m, green circles).
Sample collection and pretreatment
The sampling area covered the northern Beibu Gulf, stretching from the upper estuaries and bays to near the center of the gulf with a total of 127 stations (Figure 1). The labels and coordinates of the stations alongside other sampling information are given in the Supplementary Material. Water temperature and salinity were recorded by using a calibrated SBE 911 plus conductivity–temperature–depth profiler. Water samples were collected from the surface (approximately 1 m deep) and near the bottom (approximately 1 m above the seabed) using a 5 L Niskin sampler in April–May 2020 (spring), July–August 2020 (summer), October–November 2020 (autumn), and December 2020–January 2021 (winter). The samples were analyzed for dissolved oxygen (DO), DOC, CDOM, and FDOM. At 10% of the sampling stations, samples were collected in duplicate to ensure sampling and data reliability. The relative deviations of oxygen, DOC, CDOM, and FDOM for all duplicate samples were <2%. Samples for DO analysis were preferentially collected and measured on board by using the Winkler titration method (Carpenter, 1965). Apparent oxygen utilization (AOU) was calculated as the difference between the oxygen saturation concentration and measured DO concentration using algorithms from Ocean Data View (version 5.2.0). Samples for DOC, CDOM, and FDOM analyses were filtered immediately through precombusted (500°C, 5 h) GF/F filters (nominal pore size ≈0.7 μm) into precombusted amber glass vials with Teflon-lined screw caps under a gentle vacuum of <150 mm Hg (Wang et al., 2017). DOC samples were acidified to pH ≈ 2 with H3PO4 (85%, Merck) and stored frozen until analysis. CDOM and FDOM samples were stored in the dark at 4°C until analysis, which was done within 1 week of collection.
Analysis of DOC concentrations
DOC concentration for each sample was determined in triplicate by using an Elementar Vario TOC cube (Germany) in high-temperature catalytic oxidation mode with coefficients of variance of <2% (Wang et al., 2021b). A five-point standard curve was generated by using potassium hydrogen phthalate standards daily. The running blank was determined as the average of the peak area of the Milli-Q water acidified with H3PO4. DOC concentrations were obtained by subtracting the running blank from the average peak area of the samples and dividing by the slope of the standard curve. The analytical precision of the DOC analysis was <3% based on DOC consensus reference material provided by the Hansell Lab from the University of Miami, USA.
Measurements of CDOM and FDOM and data processing
The CDOM absorbance spectra were measured by using a Shimadzu UV-1780 dual-beam spectrophotometer and 10 cm quartz cuvettes at room temperature. Absorbance Aλ was obtained from 240 and 800 nm at 0.5 nm intervals. The Milli-Q water was used for baseline correction and all absorbance spectra were corrected for baseline offsets by subtracting the average absorbance between 690 and 700 nm (Guo et al., 2007). A Napierian absorption coefficient aλ (m−1) was calculated as 2.303 times the absorbance Aλ divided by the light path length L of the cell in meters (0.1 m) to quantify CDOM concentration. Absorption coefficients at the wavelengths 254, 280, 300, 325, 350, 355, and 412 nm are widely reported from watershed to the open ocean continuum (Massicotte et al., 2017). The spectral slope between 275 and 295 nm (S275–295, nm−1) was calculated based on a linear fit of the log-transformed absorption coefficient, which is a good proxy of the relative molecular weight of the DOM (Helms et al., 2008). Specific ultraviolet absorbance at 254 nm (SUVA254, mg C L−1) was calculated to indicate the aromaticity of the DOM by dividing the decadal absorption coefficient [i.e., A(λ)/L] by the concentration of DOC (Weishaar et al., 2003).
Fluorescence EEMs were acquired by using a Hitachi F-7100 spectrofluorometer with a 1-cm quartz cuvette at room temperature. The excitation (Ex) wavelengths spanned from 240 to 450 nm in 5-nm increments, and the emission (Em) wavelengths spanned from 280 to 600 nm in 2-nm increments. Excitation and emission slit widths were set to 10 and 5 nm, respectively. Raman scattering was compensated for by subtracting Milli-Q water EEMs that were scanned on the same day as the samples. The spectral fluorescence intensities presented in arbitrary units were then normalized to Raman units (RU) following the procedure of Lawaetz and Stedmon (2009). The normalized EEMs were calibrated for potential inner filter effects by using an absorbance-based approach (Kothawala et al., 2013). The HIX and BIX were calculated from the EEMs (Zsolnay et al., 1999; Huguet et al., 2009). The HIX, which is the ratio of fluorescence signals over the emission range 435–480 nm to those over the range of 300–345 nm with excitation at 254 nm, is an indicator of the extent of humification (Zsolnay et al., 1999). The BIX is a surrogate for the autochthonous FDOM and is the ratio of emission intensity at 380 nm to that at 430 nm upon excitation at 310 nm (Huguet et al., 2009).
A PARAFAC analysis was conducted on a total of 597 normalized and calibrated EEMs using the DOMFluor toolbox in MathWorks® MATLAB (R2020b) (Stedmon and Bro, 2008; Murphy et al., 2013; Wang et al., 2017). The models were constrained to nonnegative values. The number of PARAFAC components was determined based on split-half validation. The fluorescence intensity of each component was expressed as Fmax in RU (Stedmon and Bro, 2008). Based on the analysis of duplicate samples, the uncertainty of Fmax for each modeled component was <2%. The PARAFAC result was compared with known PARAFAC components taken from the online OpenFluor data set (https://openfluor.lablicate.com/, last access: August 8, 2022) to enhance the robustness of and confidence in the PARAFAC model (Murphy et al., 2014).
Statistical analyses
The significance of DOM comparisons between surface- and bottom-water samples was tested by using Student’s t-test (two-tailed, α = 0.05) in IBM SPSS Statistics 23. A one-way analysis of variance test was conducted to determine the differences in the mean values of the respective parameters at the sampling stations in the different seasons. Correlations between DOM variables were assessed based on Pearson’s correlation coefficient r, and the significant level p was determined by applying a two-sided test.
Results
Hydrological and environmental backgrounds
As shown by the potential temperature-salinity (θ-S) diagram in Figure 2 and by the spatial distributions of θ (Figures 3A–H) and salinity (Figures 3I–P), the hydrographic properties of waters differ distinctively over the four seasons. The θ in the northern Beibu Gulf varies from 20.8 to 31.6, 25.9 to 33.7, 17.2 to 25.5, and 12.7 to 22.2°C in spring, summer, autumn, and winter, respectively (Figure 2). The θ of surface waters is almost homogeneous in summer but develops greater spatial differences over the other three seasons (Figures 3A–D). In spring and winter, surface water in the northern Tieshangang Bay, Naliu estuary, and Qinzhou Bay has low θ, which also occurs near the Fangchenggang and eastern coasts of the sampling area. The θ of bottom waters varies over smaller spatial scales but otherwise follows a spatial pattern similar to that of the surface water (Figures 3E–H). The salinity varies over the minimal range of 21.0–32.1 in winter, 10.0–31.8 in autumn, 4.1–34.2 in spring, and 2.2–32.4 in summer (Figure 2). Qinzhou Bay has the lowest salinity surface water over the four seasons, followed by the Nanliu–Dafeng estuary and then Tieshan Bay. High surface salinity is measured in the southwest of the study area in spring and autumn and in the southeast in summer (Figures 3I–L). The low-salinity river plumes are much weaker in bottom water but the spatial distribution of salinity in the bottom water is similar to that of the surface water (Figures 3M–P).
Figure 2
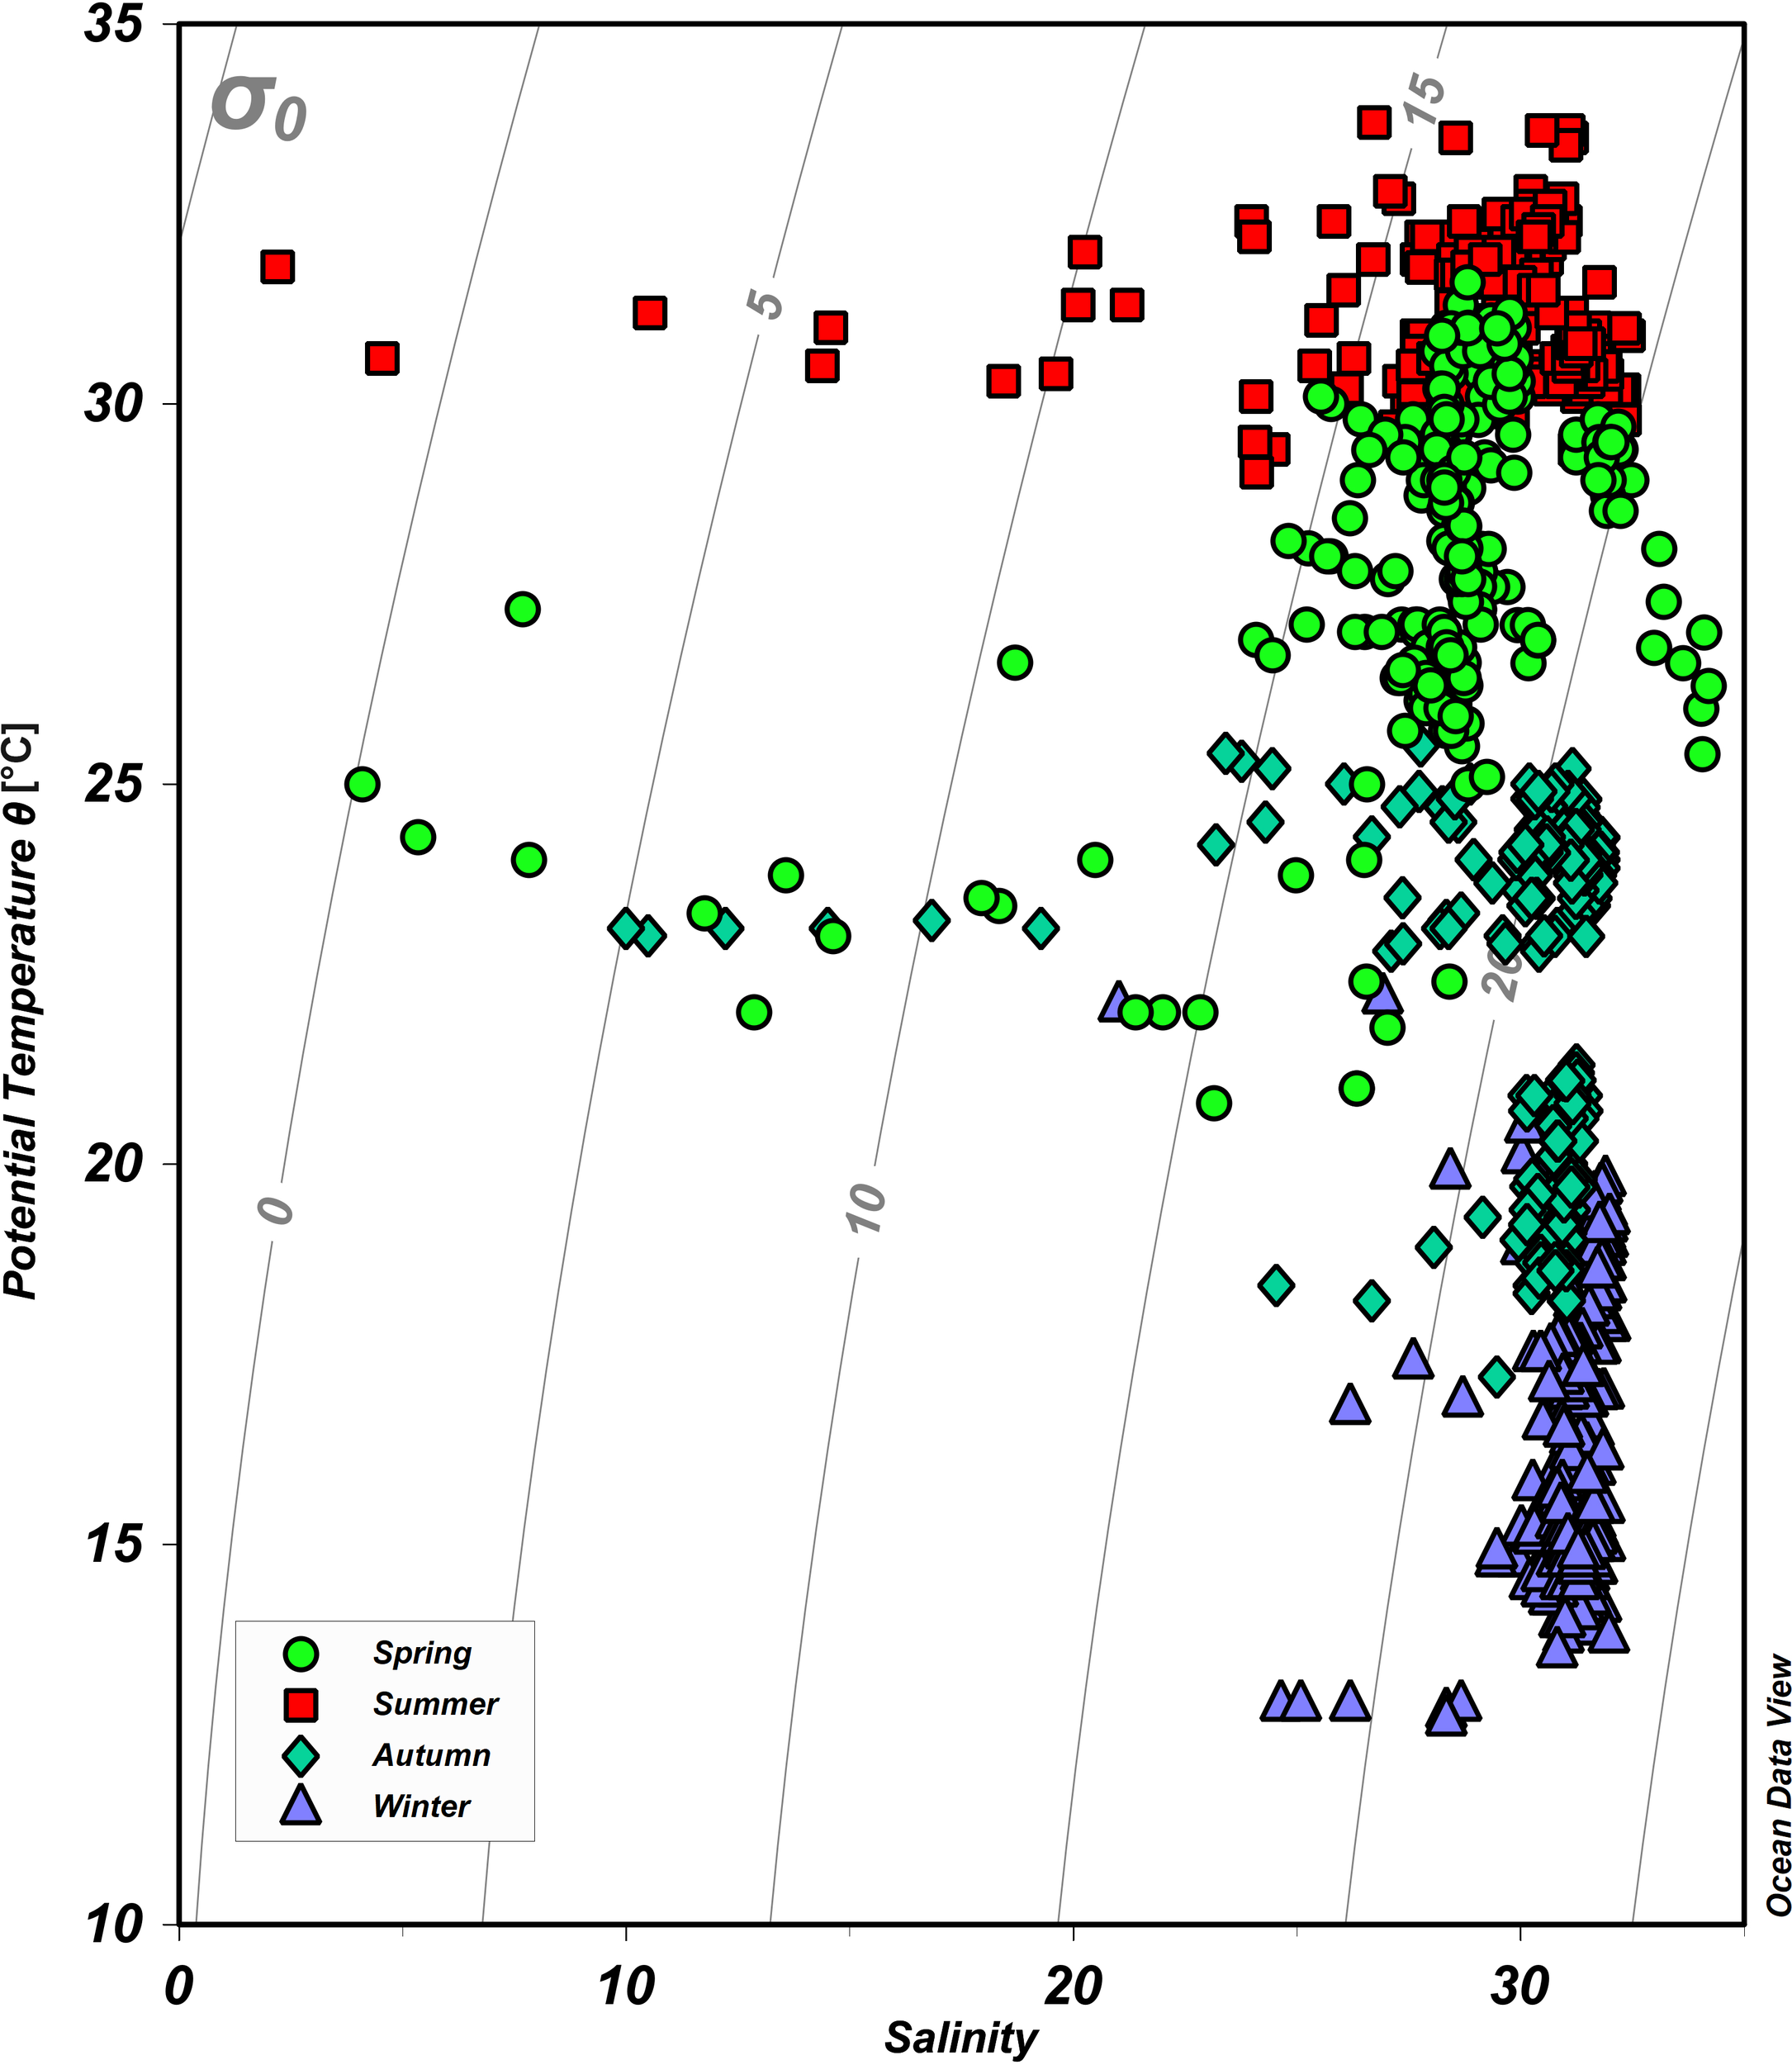
Potential temperature versus salinity plot (θ-S diagram) for the sampling stations on the northern Beibu Gulf. Green circles, red squares, cyan diamonds, and purple triangles denote spring, summer, autumn, and winter, respectively. The gray lines indicate the isopycnals (σ0). The plot was created by using Ocean Data View (https://odv.awi.de).
Figure 3
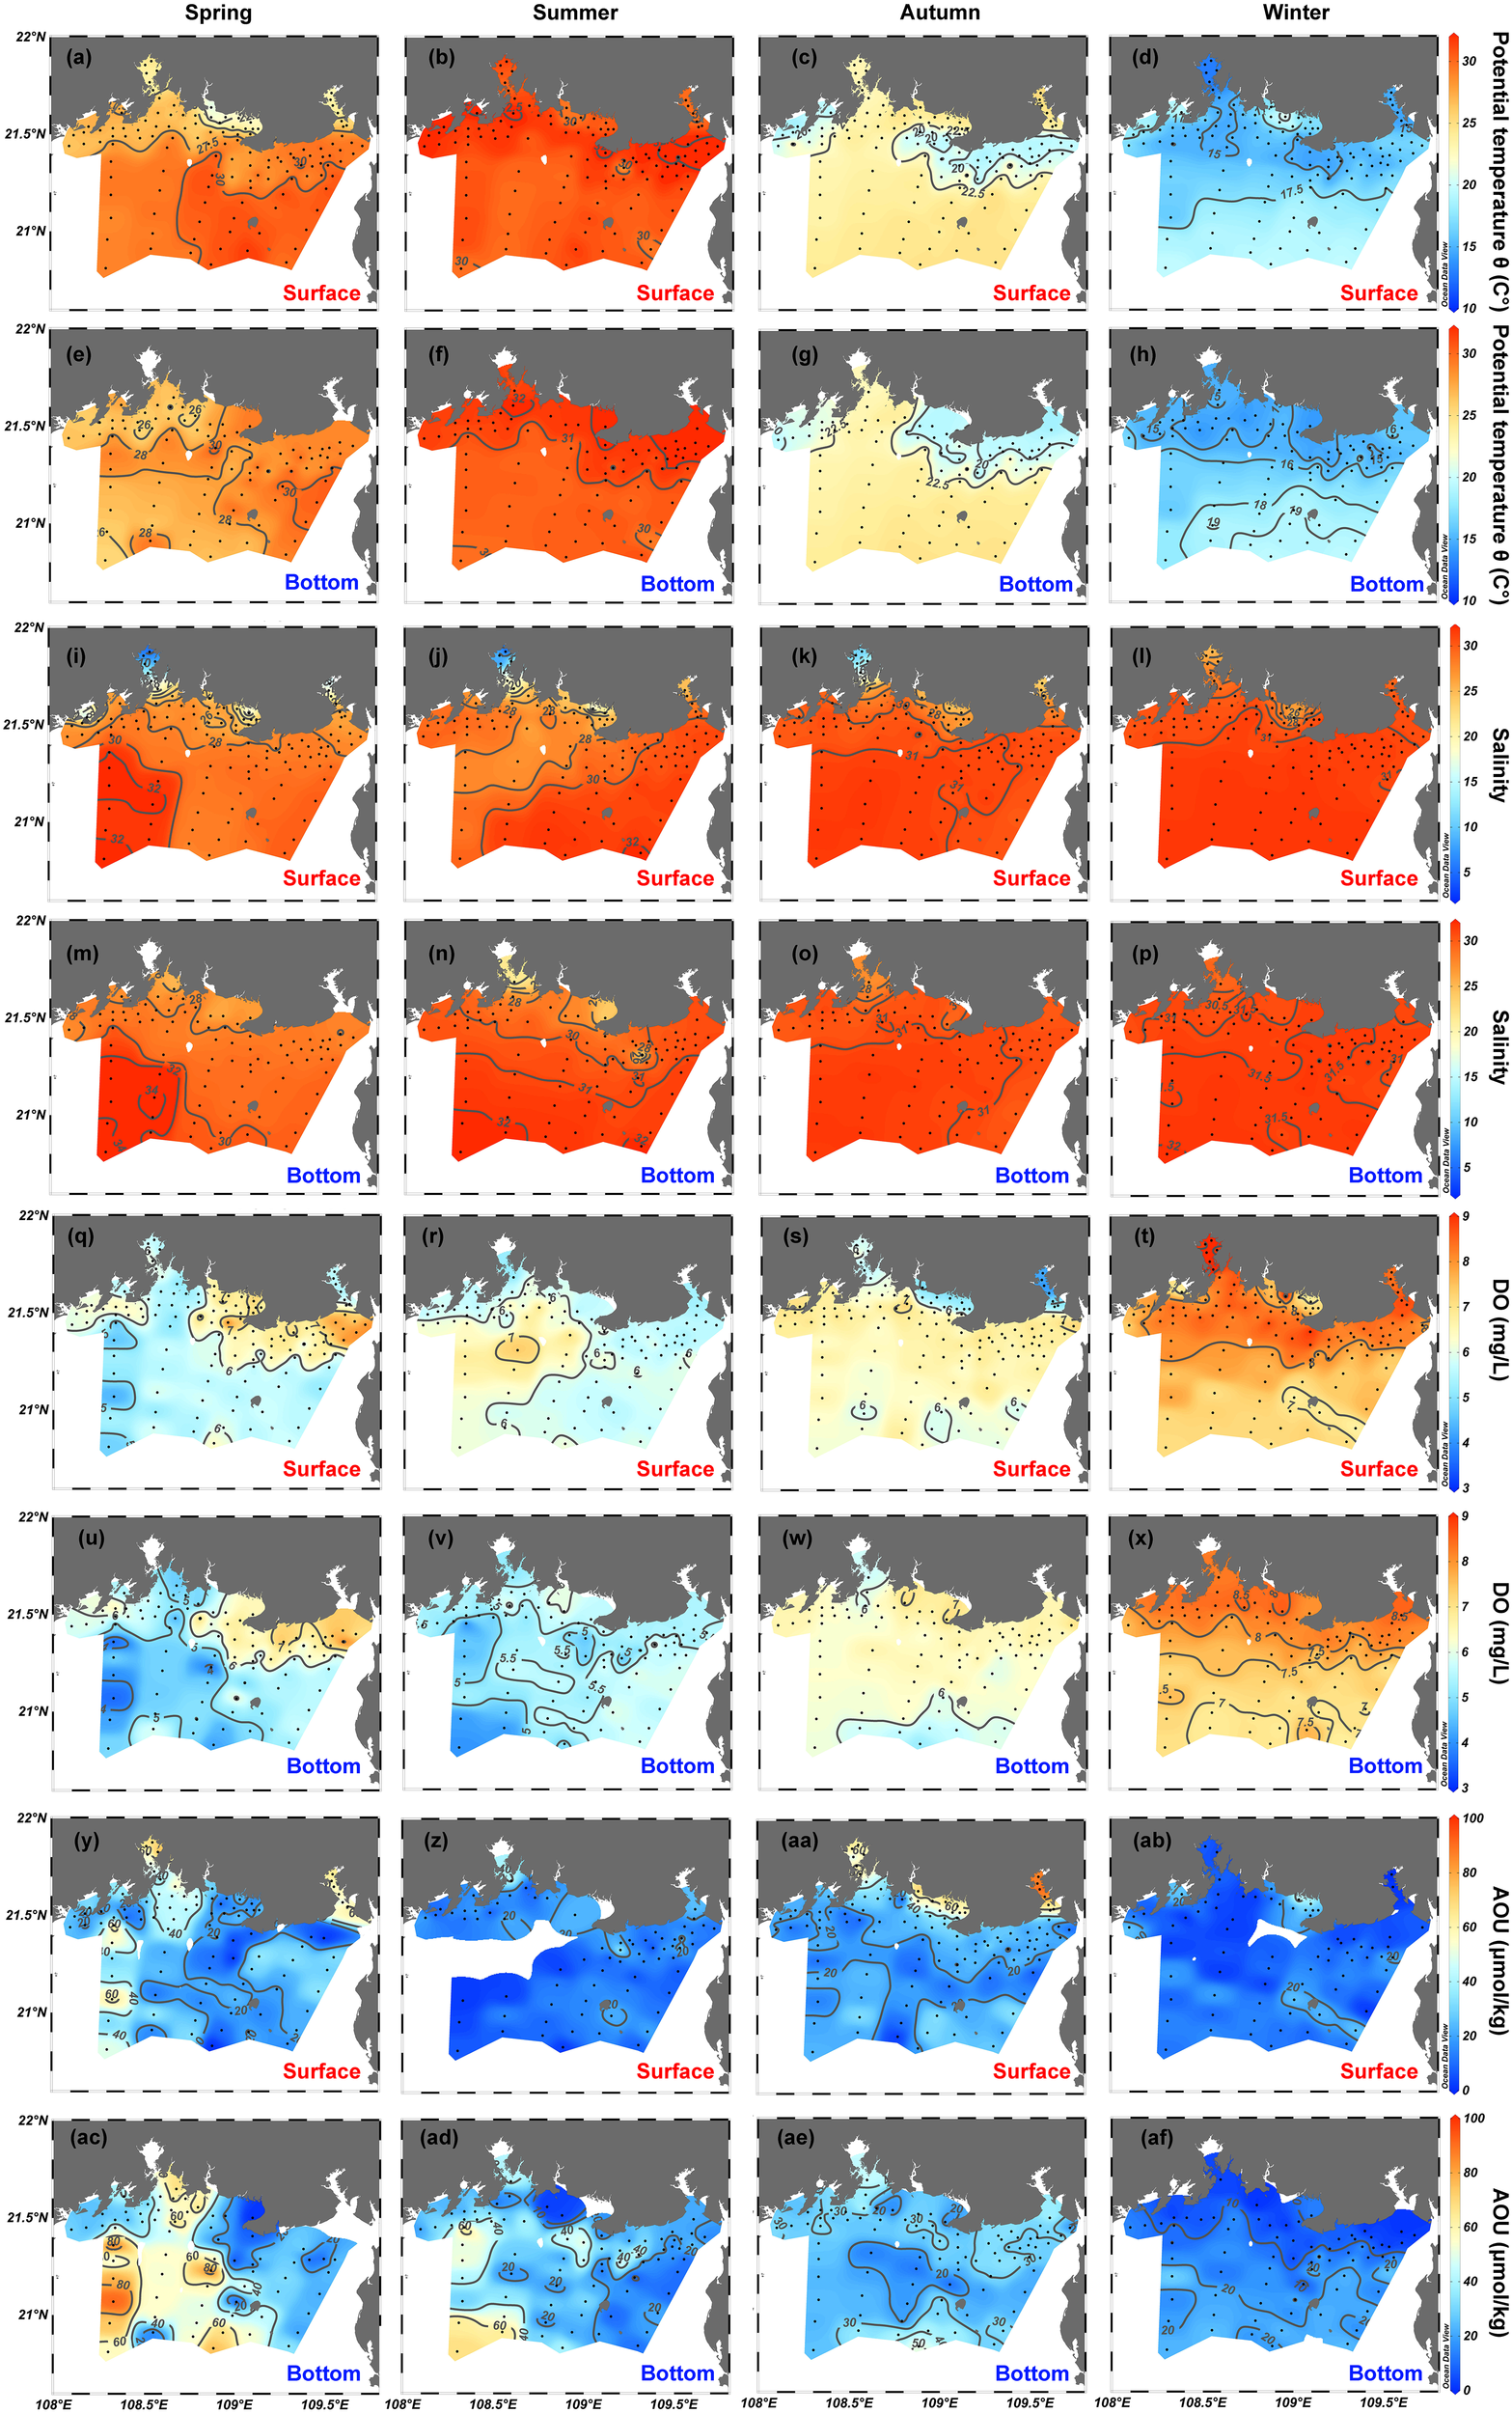
Spatial distributions of (A–H) potential temperature θ, (I–P) salinity, (Q–X) dissolved oxygen (DO) and (Y–AF) apparent oxygen utilization (AOU) in the surface and bottom layers of the northern Beibu Gulf in spring, summer, autumn, and winter. Surface layer is 1 m deep and is labeled by red text. Bottom layer extends about 1 m above the seafloor and is labeled by blue text. The plot was created by using Ocean Data View (https://odv.awi.de).
DO concentrations range from 3.5 to 8.7, 5.0 to 7.3, 4.0 to 7.7, and 6.5 to 10.3 mg/L in surface water in spring, summer, autumn, and winter, respectively (Figures 3Q–T). In spring, DO concentrations of surface waters are lower in Tieshangang Bay, Qinzhou Bay, and offshore regions but are higher in the coastal stations near Tieshangang Bay and the cities of Beihai and Fangchenggang (Figure 3Q). However, the distribution characteristics of the DO concentration in surface water in summer are generally opposite those in spring (Figure 3R). In autumn, low surface DO concentrations occur in Tieshangang Bay, Naliu estuary, and Qinzhou Bay, whereas surface water at other sampling stations has either high or comparable DO concentrations (Figure 3S). The DO concentration of surface water generally decreases in going from nearshore to offshore in winter (Figure 3T). The variation ranges and spatial patterns of DO concentrations in bottom waters are very similar to those in spring, autumn, and winter, whereas DO concentrations of bottom water in summer are much less (3.4–6.7 mg/L) and follow completely different spatial distribution patterns than surface-water DO concentrations (Figures 3R,V). AOU in this study is greater than zero (18.5 ± 22.4 μmol/kg), suggesting that oxygen consumption occurs both in the surface and bottom waters over the four seasons. The AOU is greater in bottom water (22.5 ± 22.2 μmol/kg) than in surface water (15.0 ± 23.7 μmol/kg) and follows a pattern that is roughly opposite that of the DO. Notably, AOU reaches up to about 90 μmol/kg in some bottom waters in spring and summer (southwest of the study region) and in the surface water in autumn (Tieshangang Bay).
Distributions of DOC and CDOM
Figure 4 depicts the spatial (surface vs. bottom) and seasonal distributions of DOC concentration and CDOM variables. The DOC concentration of surface water over four seasons varies largely within the range 59.1–509 μmol/L (spring), 95.6–616 μmol/L (summer), 73.2–512 μmol/L (autumn), and 70.8–292 μmol/L (winter) (Figures 4A–D). In comparison, the bottom DOC concentration varies over a smaller range of 69.7–300 μmol/L in spring, 83.3–347.6 μmol/L in summer, 72–540 μmol/L in autumn, and 60.2–414 μmol/L in winter (Figures 4E–H). In terms of spatial distribution, the DOC concentration in spring, autumn, and winter generally follows a similar pattern in both the surface and bottom layers, that is, high DOC concentrations in estuaries and coastal water and low DOC concentrations in offshore water (Figures 4A, B, D–F, H). The horizontal distribution of DOC concentrations in autumn differs slightly with the highest concentrations in coastal water near Beihai and Fangchenggang but moderate concentrations in the Nanliu–Dafeng estuary, Qinzhou Bay, and Tieshan Bay in the surface layers (Figure 4C) and speckled features in the bottom layers (Figure 4G).
Figure 4
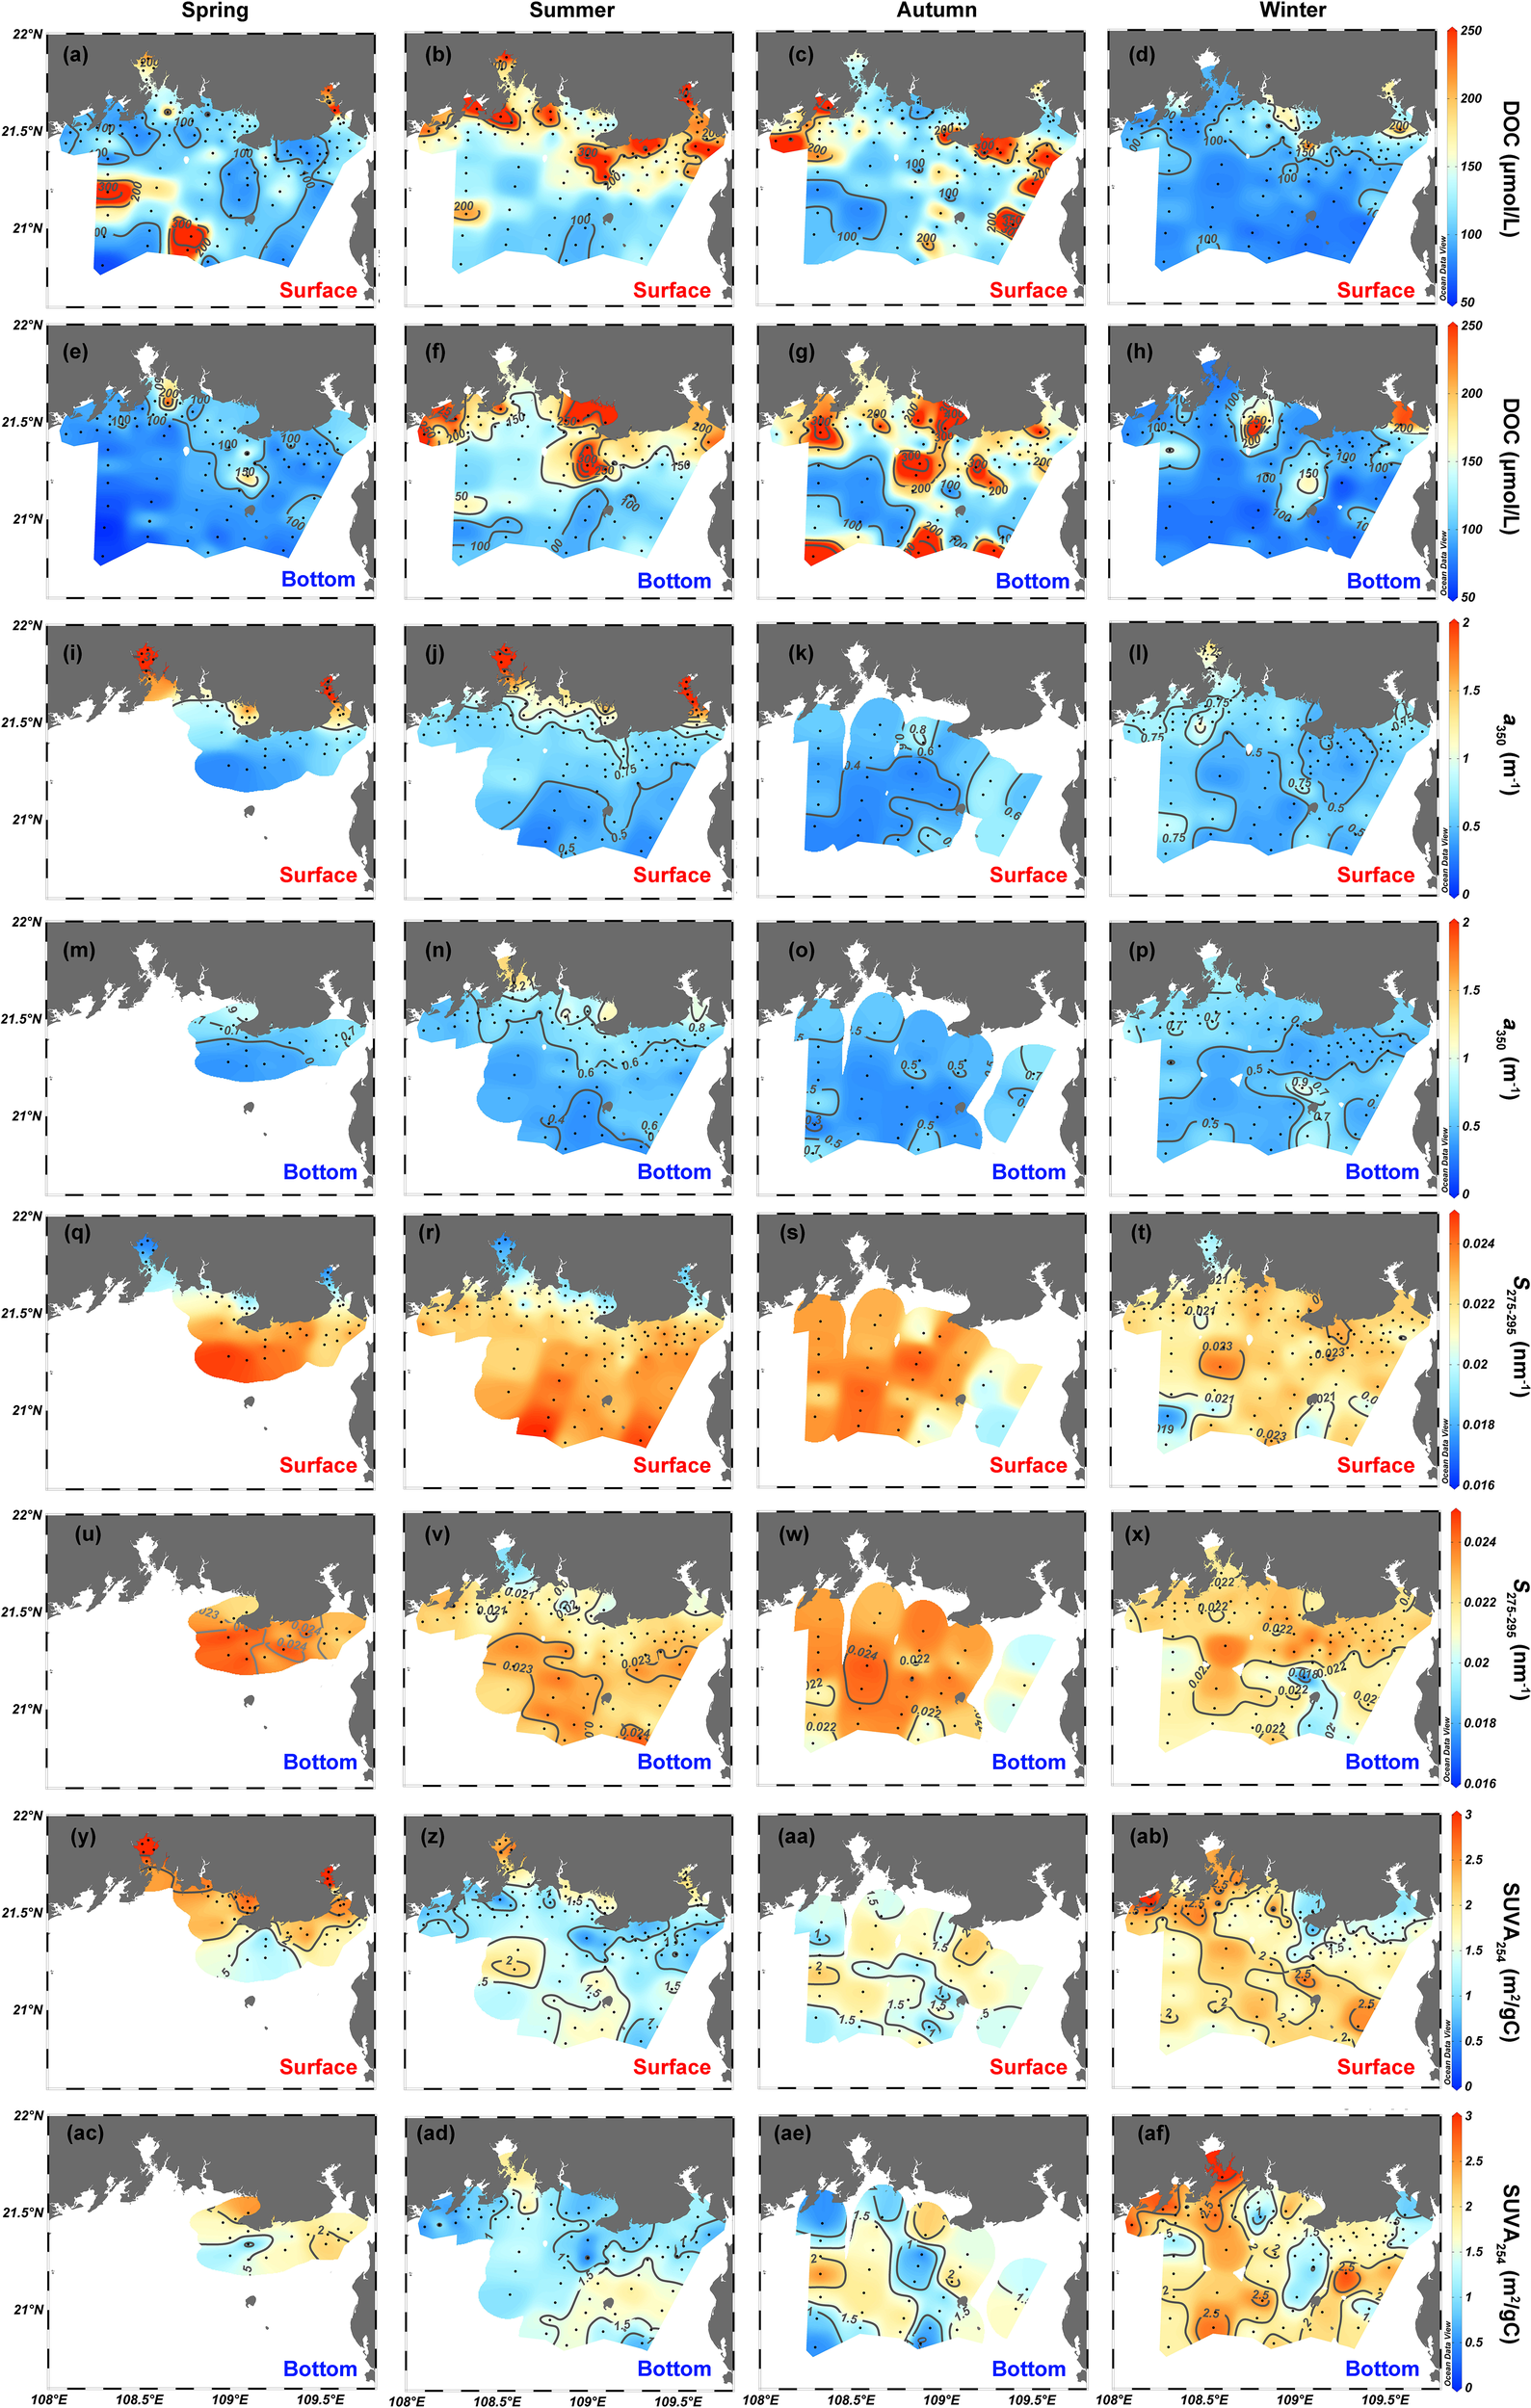
Spatial distributions of (A–H) DOC, (I–P)a350, (Q–X)S275–295, and (Y–AF) SUVA254 in the northern Beibu Gulf in spring, summer, autumn, and winter. Surface layer is 1 m deep and labeled by red text. Bottom layer extends about 1 m above the seafloor and is labeled by blue text. The plot was created by using Ocean Data View (https://odv.awi.de).
Strong positive correlations (p <.001, n = 590, r = 0.83–0.99) occur among CDOM absorption coefficients at the seven selected wavelengths (254, 280, 300, 325, 350, 355, and 412 nm). Thus, for simplicity, we choose the absorption coefficient a350 at 350 nm as the indicator of CDOM abundance, and the CDOM absorption coefficients at the other six wavelengths are presented in the Supplementary Material. The coefficient a350 is maximal in estuaries and coastal waters and generally decreases with increasing offshore distance over the four seasons (Figures 4I–P). For summer and winter, when CDOM data are available at almost all stations, a350 in surface waters varies from 0.28 to 4.0 m−1 in summer and from 0.33 to 1.6 m−1 in winter (Figures 4J, L), and a350 in bottom water varies over a smaller range of 0.31–1.5 m−1 in summer and 0.34–1.1 m−1 in winter (Figures 4N, P). The coefficient a350 varies over the range 0.31–4.6 m−1 in all water (excluding the offshore water without data in spring) and over the range 0.29–0.85 m−1 [excluding the estuarine and coastal waters without data in autumn; see Figures 4I, K.
The spatial pattern of the spectral slope S275–295 contrasts with that of a350 (Figures 4Q–X), with a range of variation of 0.0161–0.0253 nm−1 in surface water (Figures 4Q–T). The spectral slope S275–295 in bottom water varies over a range of 0.0170–0.0247 nm−1, which is comparable to that in surface water (Figures 4U–X). The specific ultraviolet absorbance SUVA254, with surface and bottom combined, varies over a large range of 0.26–3.87 m2/g C. High SUVA254 values occur in estuarine and coastal water for spring and summer and in almost the entire study area except for the coastal water near Beihai and Tieshangang Bay in winter (Figures 4Y–AF).
PARAFAC results and distribution of FDOM
Three distinct FDOM components are identified by using the EEM-PARAFAC approach (Figure 5) and are compared with FDOM components from the online OpenFluor data set based on the Tucker congruence coefficient (TCC) between different PARAFAC models (Murphy et al., 2014). Component 1 (C1) has two Ex maxima at ≤250 and 280 nm and one Em maximum at 390 nm. It resembles the humic-like C2 component of Murphy et al. (2011); Gueguen et al. (2015), and Yang et al. (2019) (TCC > 0.97). Its EEM contour covers Peak M areas (290–310/370–410 nm) and part of Peak A areas (260/400–460 nm) defined in Coble et al. (1998), which were previously recognized as a traditionally marine-derived humic-like fluorophore. Component 2 (C2, Ex/Em = 250, 345/440 nm) is highly similar to humic-like C1 in Jorgensen et al. (2011); Chen et al. (2017), and Amaral et al. (2021) (TCC > 0.98) and is close to the traditional terrestrial Peak A and Peak C (320–360/420–460 nm). Recently, two humic-like components have been found to be widely distributed in natural aquatic systems from inland watersheds to open oceans and correlate strongly with microbial activities (Qu et al., 2022; Catalá et al., 2015). C3 has Ex/Em maxima at 275/318 nm and is attributed to a combination of the autochthonous tyrosine-like peak B (275/305 nm) and the tryptophan-like peak T (275/340 nm) (Coble, 2007). C3 is highly similar to C4 (TCC > 0.95) in Gao and Guéguen (2018), to C3 in Gueguen et al. (2015), and to C4 in Dainard et al. (2015).
Figure 5
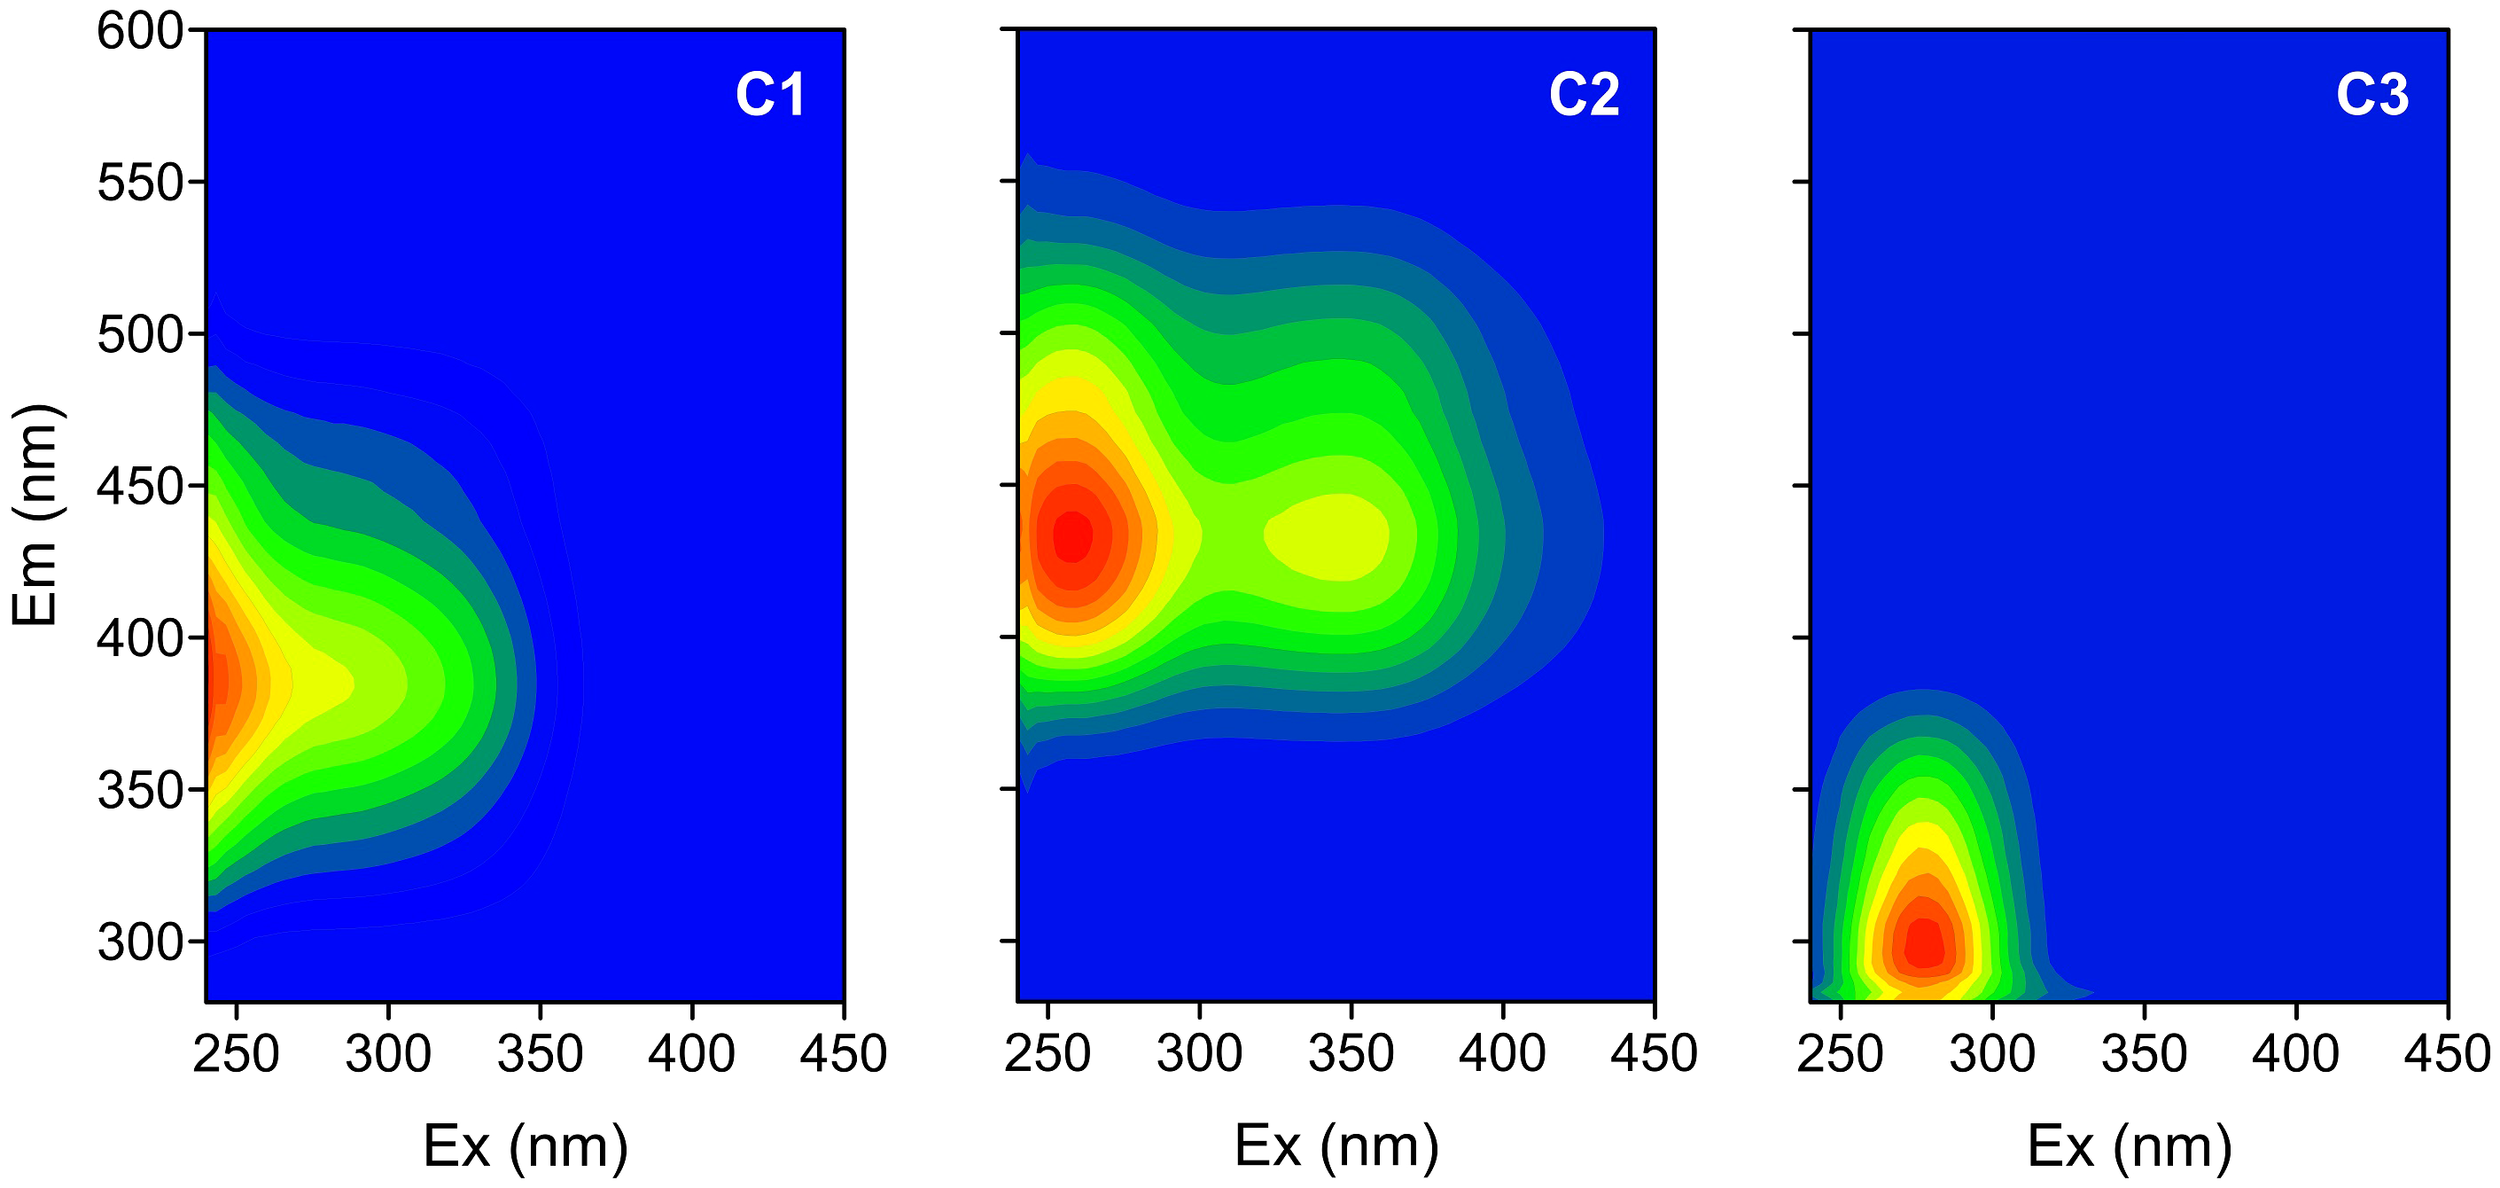
Excitation-emission contours of three components identified by PARAFAC model.
The fluorescence intensities of two humic-like components (C1 and C2) correlate significantly (r = 0.94, p < 0.001, n = 539) and follow spatial distribution characteristics very similar to those of a350 (Figures 4I–P). The range of variation of C1 and C2 in surface waters over the four seasons is 0.023–0.32 and 0.009–0.18 RU, respectively, whereas C1 and C2 for bottom waters vary over smaller ranges of 0.03–0.19 RU (C1) and 0.008–0.10 RU (C2) (Figures 6A–H). The intensity of protein-like C3 ranges from 0.024 to 0.17 RU in surface waters and from 0.014 to 0.17 RU in bottom waters (Figures 6Q–X). Although weak correlations exist between the intensity of C3 and the two humic-like components (r = 0.25 for C3 vs. C1 and r = 0.33 for C3 vs. C2, p <.001, n = 539), the coefficients generally have spatial features like those of humic-like C1 and C2 both in surface and bottom water (Figure 6). In all four seasons, high values of C3 have been measured in estuarine and coastal water near cities [e.g., Nanliu–Dafeng estuary, Beihai, Tieshangang Bay, and Qinzhou Bay; Figures 6Q–X).
Figure 6
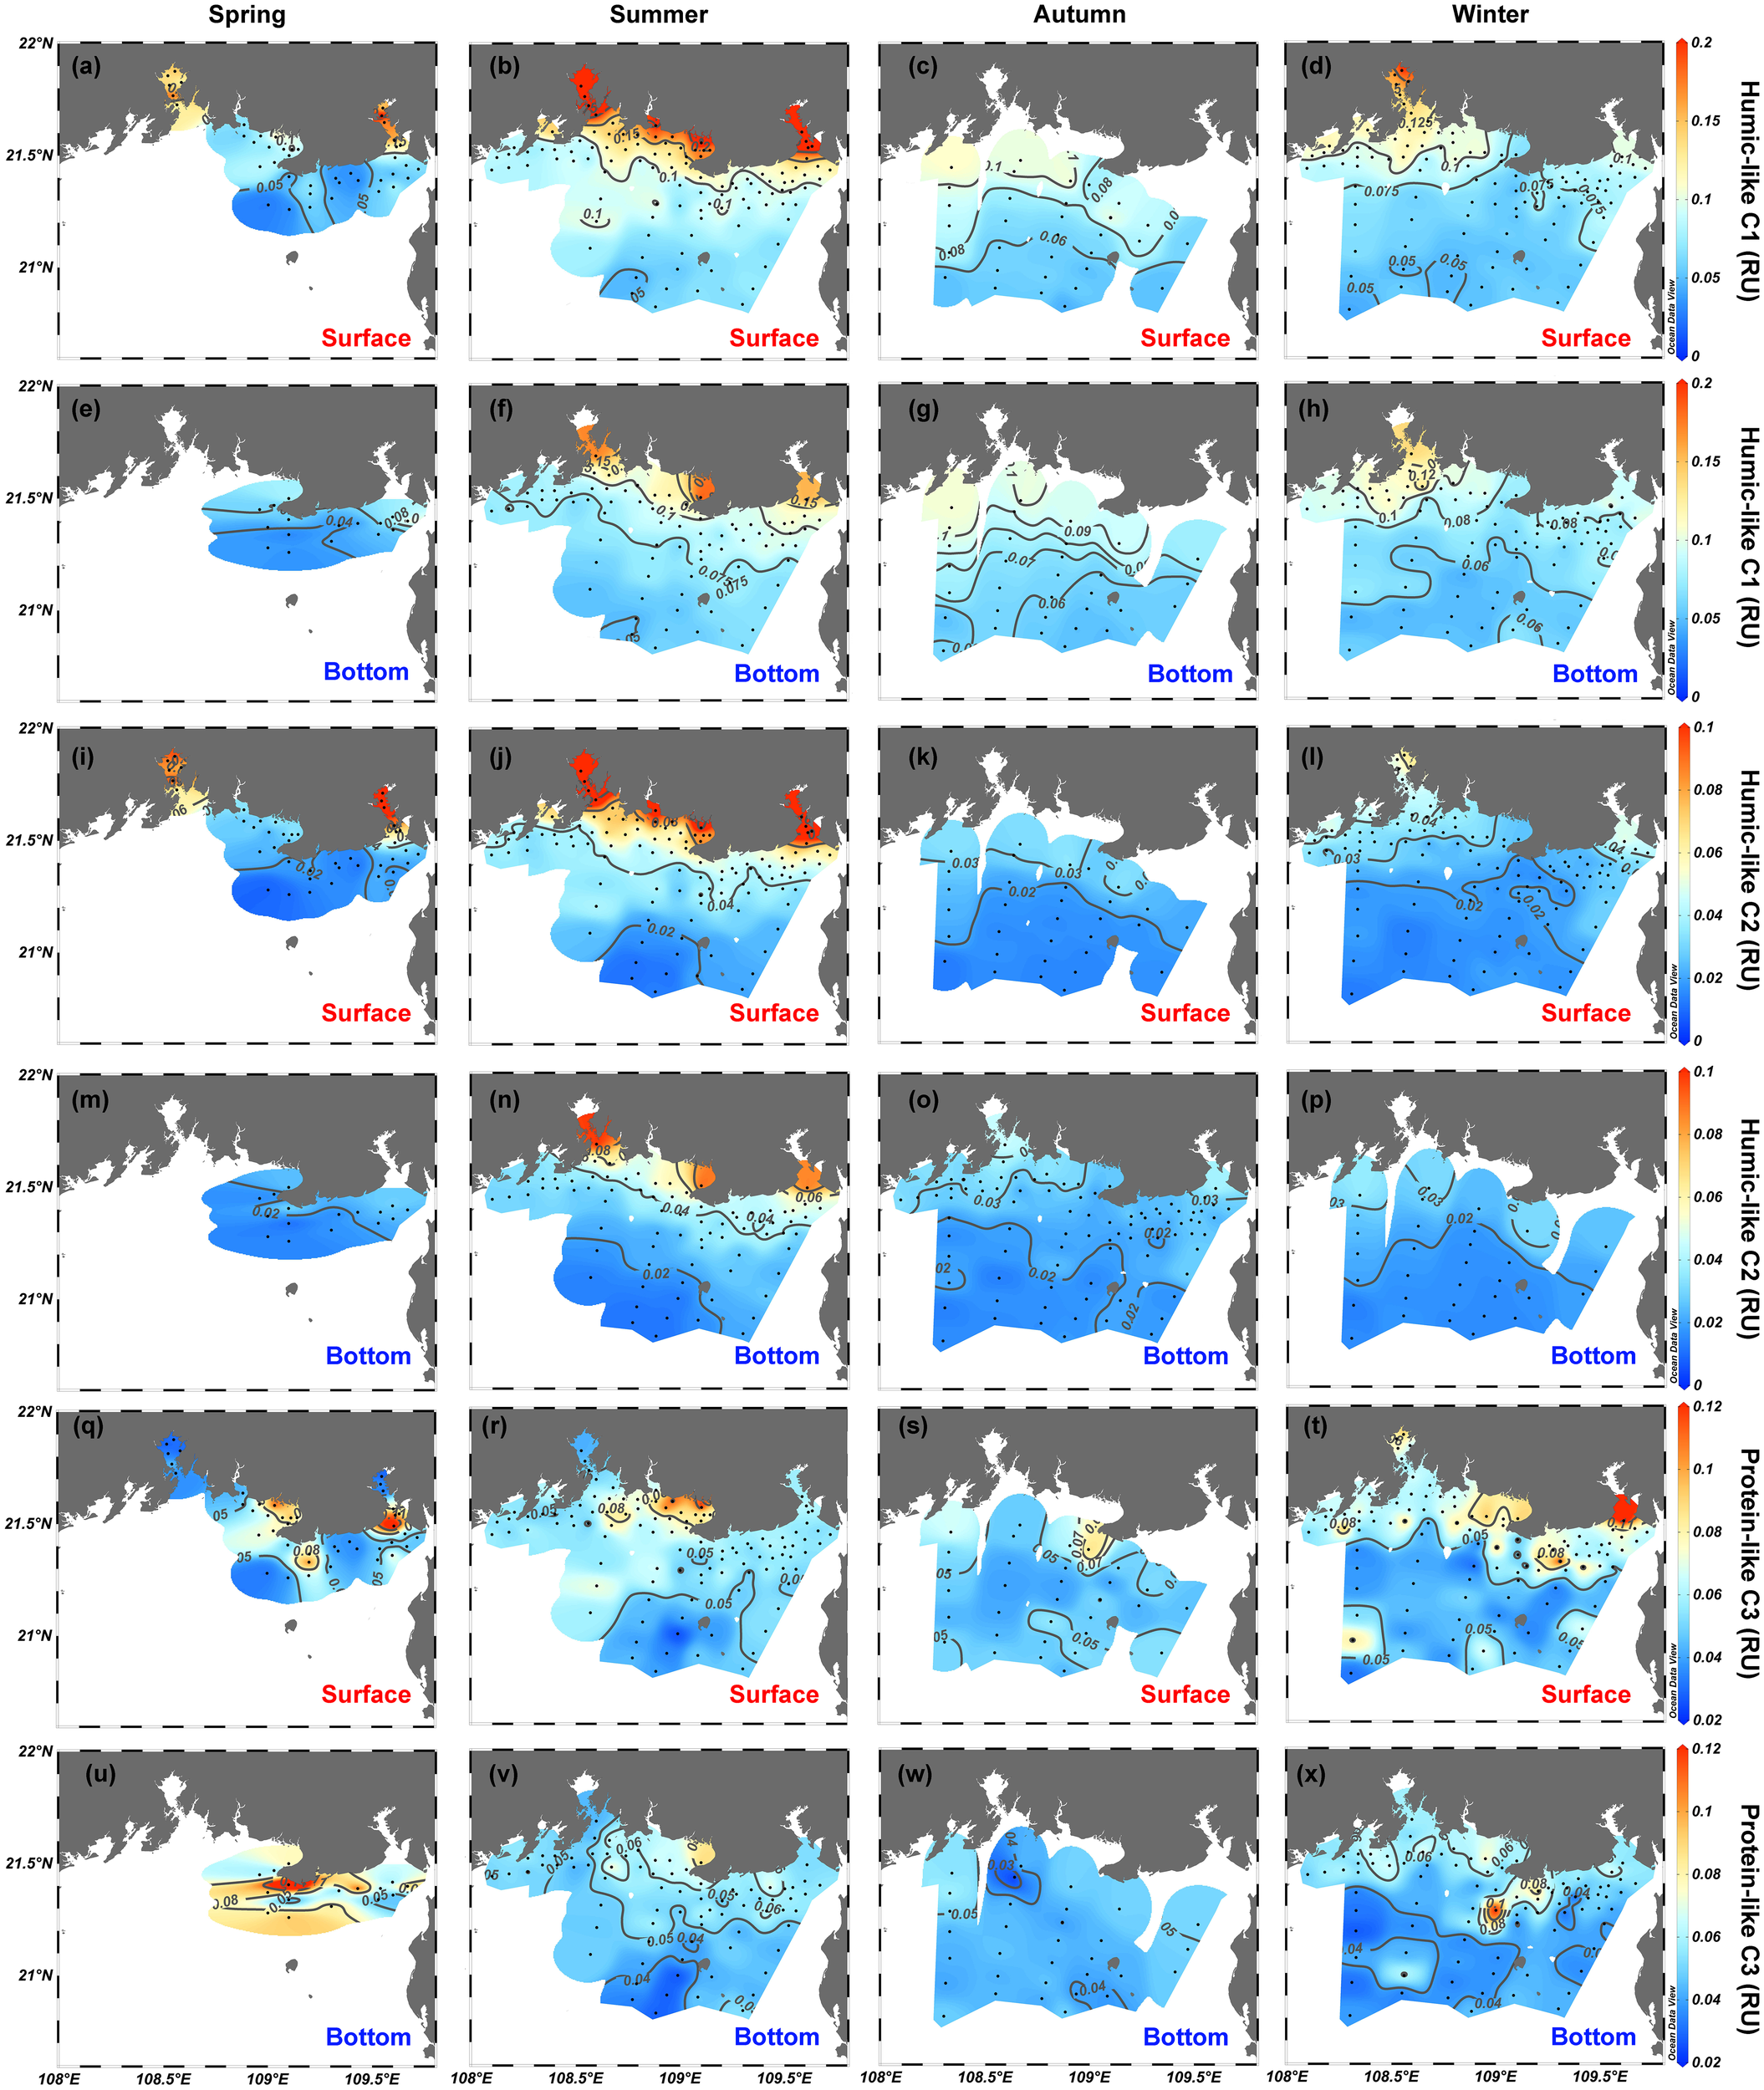
Spatial distributions of (A–H) humic-like C1 intensity, (I–P) humic-like C2 intensity, and (Q–X) protein-like C3 intensity in the northern Beibu Gulf in spring, summer, autumn, and winter. Surface layer is 1 m deep and is labeled by red text. Bottom layer extends about 1 m above the seafloor and is labeled by blue text. The plot was created using Ocean Data View (https://odv.awi.de).
Compared with the quantitative variables of FDOM, the EEM-derived qualitative metrics (i.e., the HIX and BIX) also reveal clear variations in the horizontal gradient from estuaries and coastal water to offshore water both at the surface and at the bottom (Figures 7A–P). The HIX ranges from 0.4 to 4.3 and from 0.3 to 3.1 in surface and bottom water, respectively. The HIX correlates positively with the intensities of C1 (r = 0.74, p <.001, n = 539) and C2 (r = 0.85, p <.001, n = 539) and shares similar spatial distribution patterns (Figures 7A–H). The BIX varies from 0.88 to 1.54 and 1.04 to 4.33 in surface and bottom water, respectively, and shows a moderate negative correlation with the HIX (r = −0.39, p <.001, n = 560). Except for extremely high values in Qinzhou Bay in winter, the BIX generally increases in going from estuaries and coastal waters to offshore water (Figures 7I−P). The FI is everywhere greater than 1.9 and varies over a small range in surface waters (2.17−2.79) and bottom waters (2.18−2.74). The FI does not correlate with other FDOM-derived variables (p >.05) and does not exhibit clear spatial gradients for any of the four seasons (Figures 7Q−X).
Figure 7
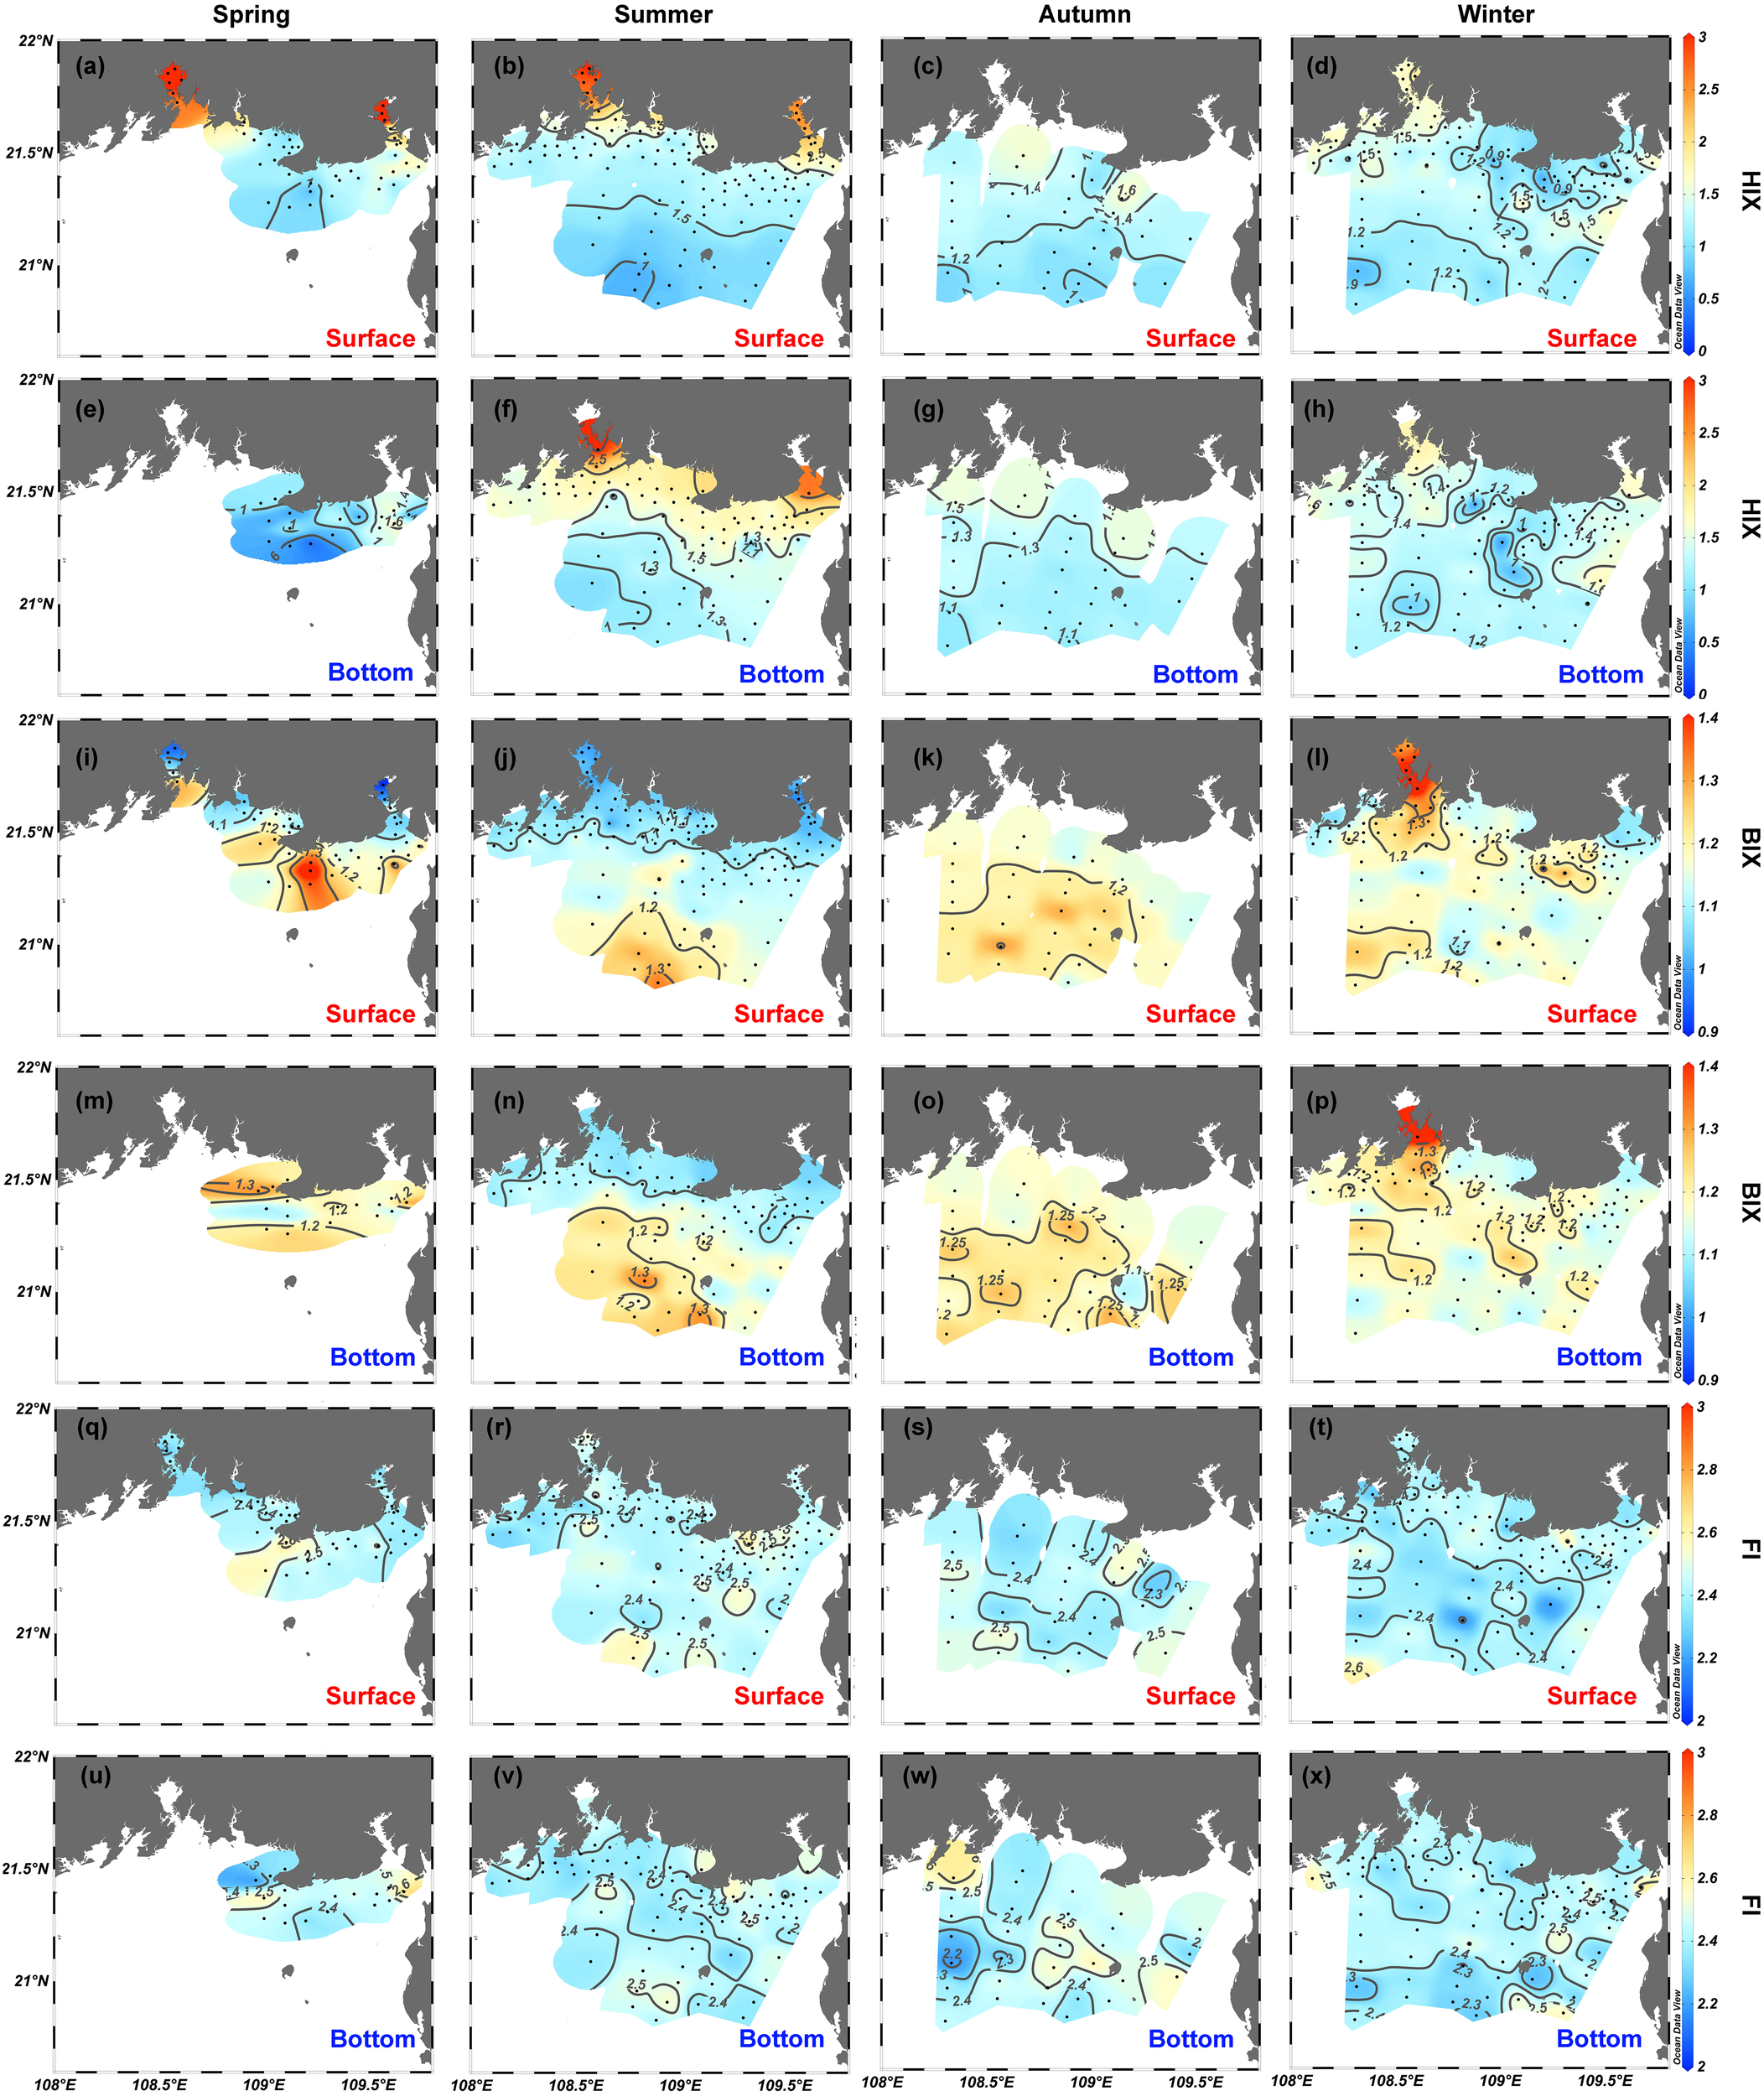
Spatial distributions of (A–H) humification index (HIX), (I–P) biological index (BIX), and (Q–X) fluorescence index (FI) in the northern Beibu Gulf in spring, summer, autumn, and winter. Surface layer is 1 m deep and is labeled by red text. Bottom layer extends about 1 m above the seafloor and is labeled by blue text. The plot was created by using Ocean Data View (https://odv.awi.de).
Relationships between DOC, CDOM, and FDOM
DOC linearly correlates with a350 in spring (r = 0.66, p <.001, n = 62), summer (r = 0.30, p <.001, n = 204), and autumn (r = 0.32, p <.001, n = 79) but does not correlate with a350 in winter (p >.05). The DOC has a moderate linear correlation with two humic-like components (C1 and C2) in spring (r = 0.63 and 0.68, p <.001, n = 59), very weak correlations with C1 and C2 in summer (r = 0.17 and 0.20, p <.001, n = 195) and winter (r = 0.21 and 0.26, p <.001, n = 59), and no correlation with C1 and C2 in autumn (p >.05). DOC correlates weakly with protein-like C3 in summer (r = 0.16, p <.001, n = 195) and winter (r = 0.29, p <.001, n = 206) but does not correlate with C3 in spring and autumn (p >.05). Separately, a350 correlates strongly with the intensities of humic-like C1 and C2 over the four seasons (p <.001) with high Pearson r values in spring (0.77 and 0.86), summer (0.94 and 0.95), and winter (0.74 and 0.74) and low r values in autumn (0.30 and 0.38). However, the significant correlations between a350 and C3 occur only in summer (r = 0.48, p <.001, n = 195) and winter (r = 0.31, p <.001, n = 206).
Discussion
Sources of DOM in northern Beibu Gulf
The θ-S plots and their spatial distribution patterns confirm that multiple water endmembers (≥3) coexist in the northern Beibu Gulf, and their seasonal differences are evident (Figures 2, 3A−Q). The levels of DOC, CDOM, and FDOM in the northern Beibu Gulf vary by more than one order of magnitude from the estuaries and coastal waters to offshore waters (Figures 4, 6), which further indicates the various sources and processes in shaping the distribution and composition of DOM. The weak or nonexistent correlations between DOC, CDOM, and FDOM suggest that these components are subjected to different sources and processes in the northern Beibu Gulf. For example, anthropogenic input could supply many labile compounds, such as DOC and protein-like FDOM but less refractory humic-like components (Guo et al., 2014). The in situ primary production and microbial activity cooperatively drive the transformation of DOM from a labile to refractory nature, resulting in the decoupling of relationships between DOC, CDOM, and FDOM (Wang et al., 2021a; Wang et al., 2021b).
Clearly, low-salinity waters (<20) are entrenched in Qinzhou Bay, the Nanliu–Dafeng estuary, and upper Tieshangang Bay and are most prominent in summer and spring, likely because of major river discharge in the wet season (April−October) (Lai et al., 2014). Correspondingly, the levels of DOC, CDOM, and humic-like FDOM are almost maximal in these three regions over two seasons (i.e., summer and spring), concurrent with low S275−295 and BIX but high HIX and SUVA254 (Figures 4, 7). This suggests that the terrigenous molecules with high molecular weight, humification degree, and aromaticity are very popular in DOM pools of the low-salinity regions over two seasons. By comparison with the reported DOC and CDOM data along the global aquatic continuum summarized by Massicotte et al. (2017), both DOC and a350 in the low-salinity estuarine and coastal water of the northern Beibu Gulf fall within the range of river–estuary–coastal ecosystems but are lower than those in the inland wetlands and lakes with high productivity. In addition, the riverine terrigenous CDOM and humic-like FDOM signals are limited to a smaller region near the upper estuaries during autumn and winter (Figures 4, 6), which is consistent with the low water discharges of several rivers to the northern Beibu Gulf in the dry season (Lai et al., 2014). Annually, it differs from other coastal areas with large river runoff, such as that the Yangtze River (Guo et al., 2014), Pearl River (Li et al., 2019), and Amazon River (Nelson et al., 2010), where river discharge makes a remarkable contribution to coastal DOM pools. Even so, considering the characteristics that river-borne organic material degrades easily in the sea by photochemical transformation and biomineralization (Fichot and Benner, 2014), the turnover of riverine DOM might significantly impact the budget of the nutrients and carbon in the estuaries and coast of the northern Beibu Gulf, especially in spring and summer.
Except for the low-salinity Qinzhou Bay, Tieshanggang Bay, and Nanliu–Dafeng estuary, high salinity (>25) was measured at other sampling stations of the northern Beibu Gulf over the four seasons (Figures 3I−P). Although the levels of DOC, CDOM, and FDOM are much lower than those in the low-salinity estuarine and coastal water (Figures 4, 6), they are also significantly greater than those in the adjacent ocean-dominated surface of the South China Sea (Wu et al., 2015; Wang et al., 2017). S275−295 in particular is a reliable proxy tracing terrestrial input and photochemical degradation of DOM in the marine environment (Stedmon and Markager, 2003; Helms et al., 2013). Here, S275−295 values are less than 0.025 nm−1 at all high-salinity stations, which were comparable to the levels in rivers and estuaries dominated by terrestrial organic molecules (Stedmon et al., 2010) and the levels in the deep ocean where the DOM was fully reworked by microbial activities (Wang et al., 2017). However, they were far less than the value of > 0.04 nm−1 in photodegraded surface oceanic water (Catala et al., 2016; Wang et al., 2021b). Thus, we conclude that DOM in the high-salinity water of the northern Beibu Gulf is dominated by terrestrial input and microbial reworking. Cultural experiments confirm that both terrestrial and microbial-derived DOM with low S275−295 can be easily degraded by light radiation (Helms et al., 2013; Yang et al., 2020). It can be expected that DOM in the high-salinity water of the northern Beibu Gulf also has a large potential for photodegradation, when it was transported into the upper stratified layer of the adjacent South China Sea (Chen et al., 2011). (Figures 4Q−X). Although no direct evidence links DOM and primary productivity, the relatively high chlorophyll concentration (average of 3.0 μg/L in the wet season and 1.5 μg/L in the dry season) measured in the same region (Lao et al., 2021b) supports the hypothesis that the in situ primary production and subsequent microbial transformation might be an important source of DOM (Wang et al., 2021b). The high FI (>1.9), high BIX, and low HIX over four seasons further confirm that humic-like FDOM in high-salinity waters of the northern Beibu Gulf is mainly sourced from recent microbial activities (Figure 7). A strong correlation between humic-like FDOM and a350 demonstrates that CDOM is subjected to sources and processes similar to those of humic-like FDOM in the northern Beibu Gulf. In contrast, weak or zero correlation between DOC, CDOM, and humic-like FDOM in this study also occurs in coastal and oceanic environments (Massicotte et al., 2017). The most likely explanation is that the kinetic processes (e.g., physical mixing, photochemical transformation, and microbial degradation) operate at different rates on DOC and optical fractions of the DOM pool, which as a result may cause the mentioned decoupling or nonlinear relationship between these pools (Stedmon and Nelson, 2015).
Notably, the high levels of protein-like C3 but low levels of humic-like components were apparent in the outer Tieshangang Bay during spring and winter and on the Beihai coast over four seasons (Figure 6), suggesting the obvious contribution of anthropogenic input and/or enhanced primary production (Guo et al., 2014). The sediment release may also have a considerable contribution to DOM pools in the northern Beibu Gulf as indicated by the elevated levels of DOC, CDOM, and FDOM in the bottom layer (Figures 4, 6) and high concentration of organic carbon in the surface sediment (Liao et al., 2018). The impact of submarine groundwater discharge and atmospheric deposition on the DOM pool in the northern Beibu Gulf has large variability owing to the lack of supporting data. In addition, water intrusions by currents from the adjacent South China Sea considerably affect the water volume of the reservoir and nutrients in the northern Beibu Gulf (Lao et al., 2022) as well as the DOM pool. Thus, these sources and processes should be considered in future research on the DOM budget in the Beibu Gulf.
Mixing of DOM in the northern Beibu Gulf
The mixing behavior based on the relationships between DOM variables and salinity has been used for decades to estimate the apparent removal or addition of DOM in land–ocean interfaces (Noureddin and Courtot, 1989; Guo et al., 2007; Yang et al., 2015b; Li et al., 2019). The hydrological cycle of the northern Beibu Gulf is complex (Figures 2, 3) and is influenced by multiple riverine and low-salinity water sources mixing with water from the adjacent South China Sea with the help of variable wind and circulation patterns (Chen et al., 2011; Wang et al., 2018; Lao et al., 2022). As a result, simple two-end-member mixing of constituents may be unsuitable to describe the mixing behaviors of DOC, CDOM, and FDOM in the northern Beibu Gulf. Over four seasons, DOM at all sampling stations appears remarkably nonconservative with net additions of DOC over four seasons, net additions of CDOM and humic-like FDOM during spring and summer, and net removal of protein-like C3 in spring and summer (Figure 8). However, upon dividing sample stations into the three categories (Figure 1), the convincing mixing of DOM appears clearly in the northern Beibu Gulf.
Figure 8
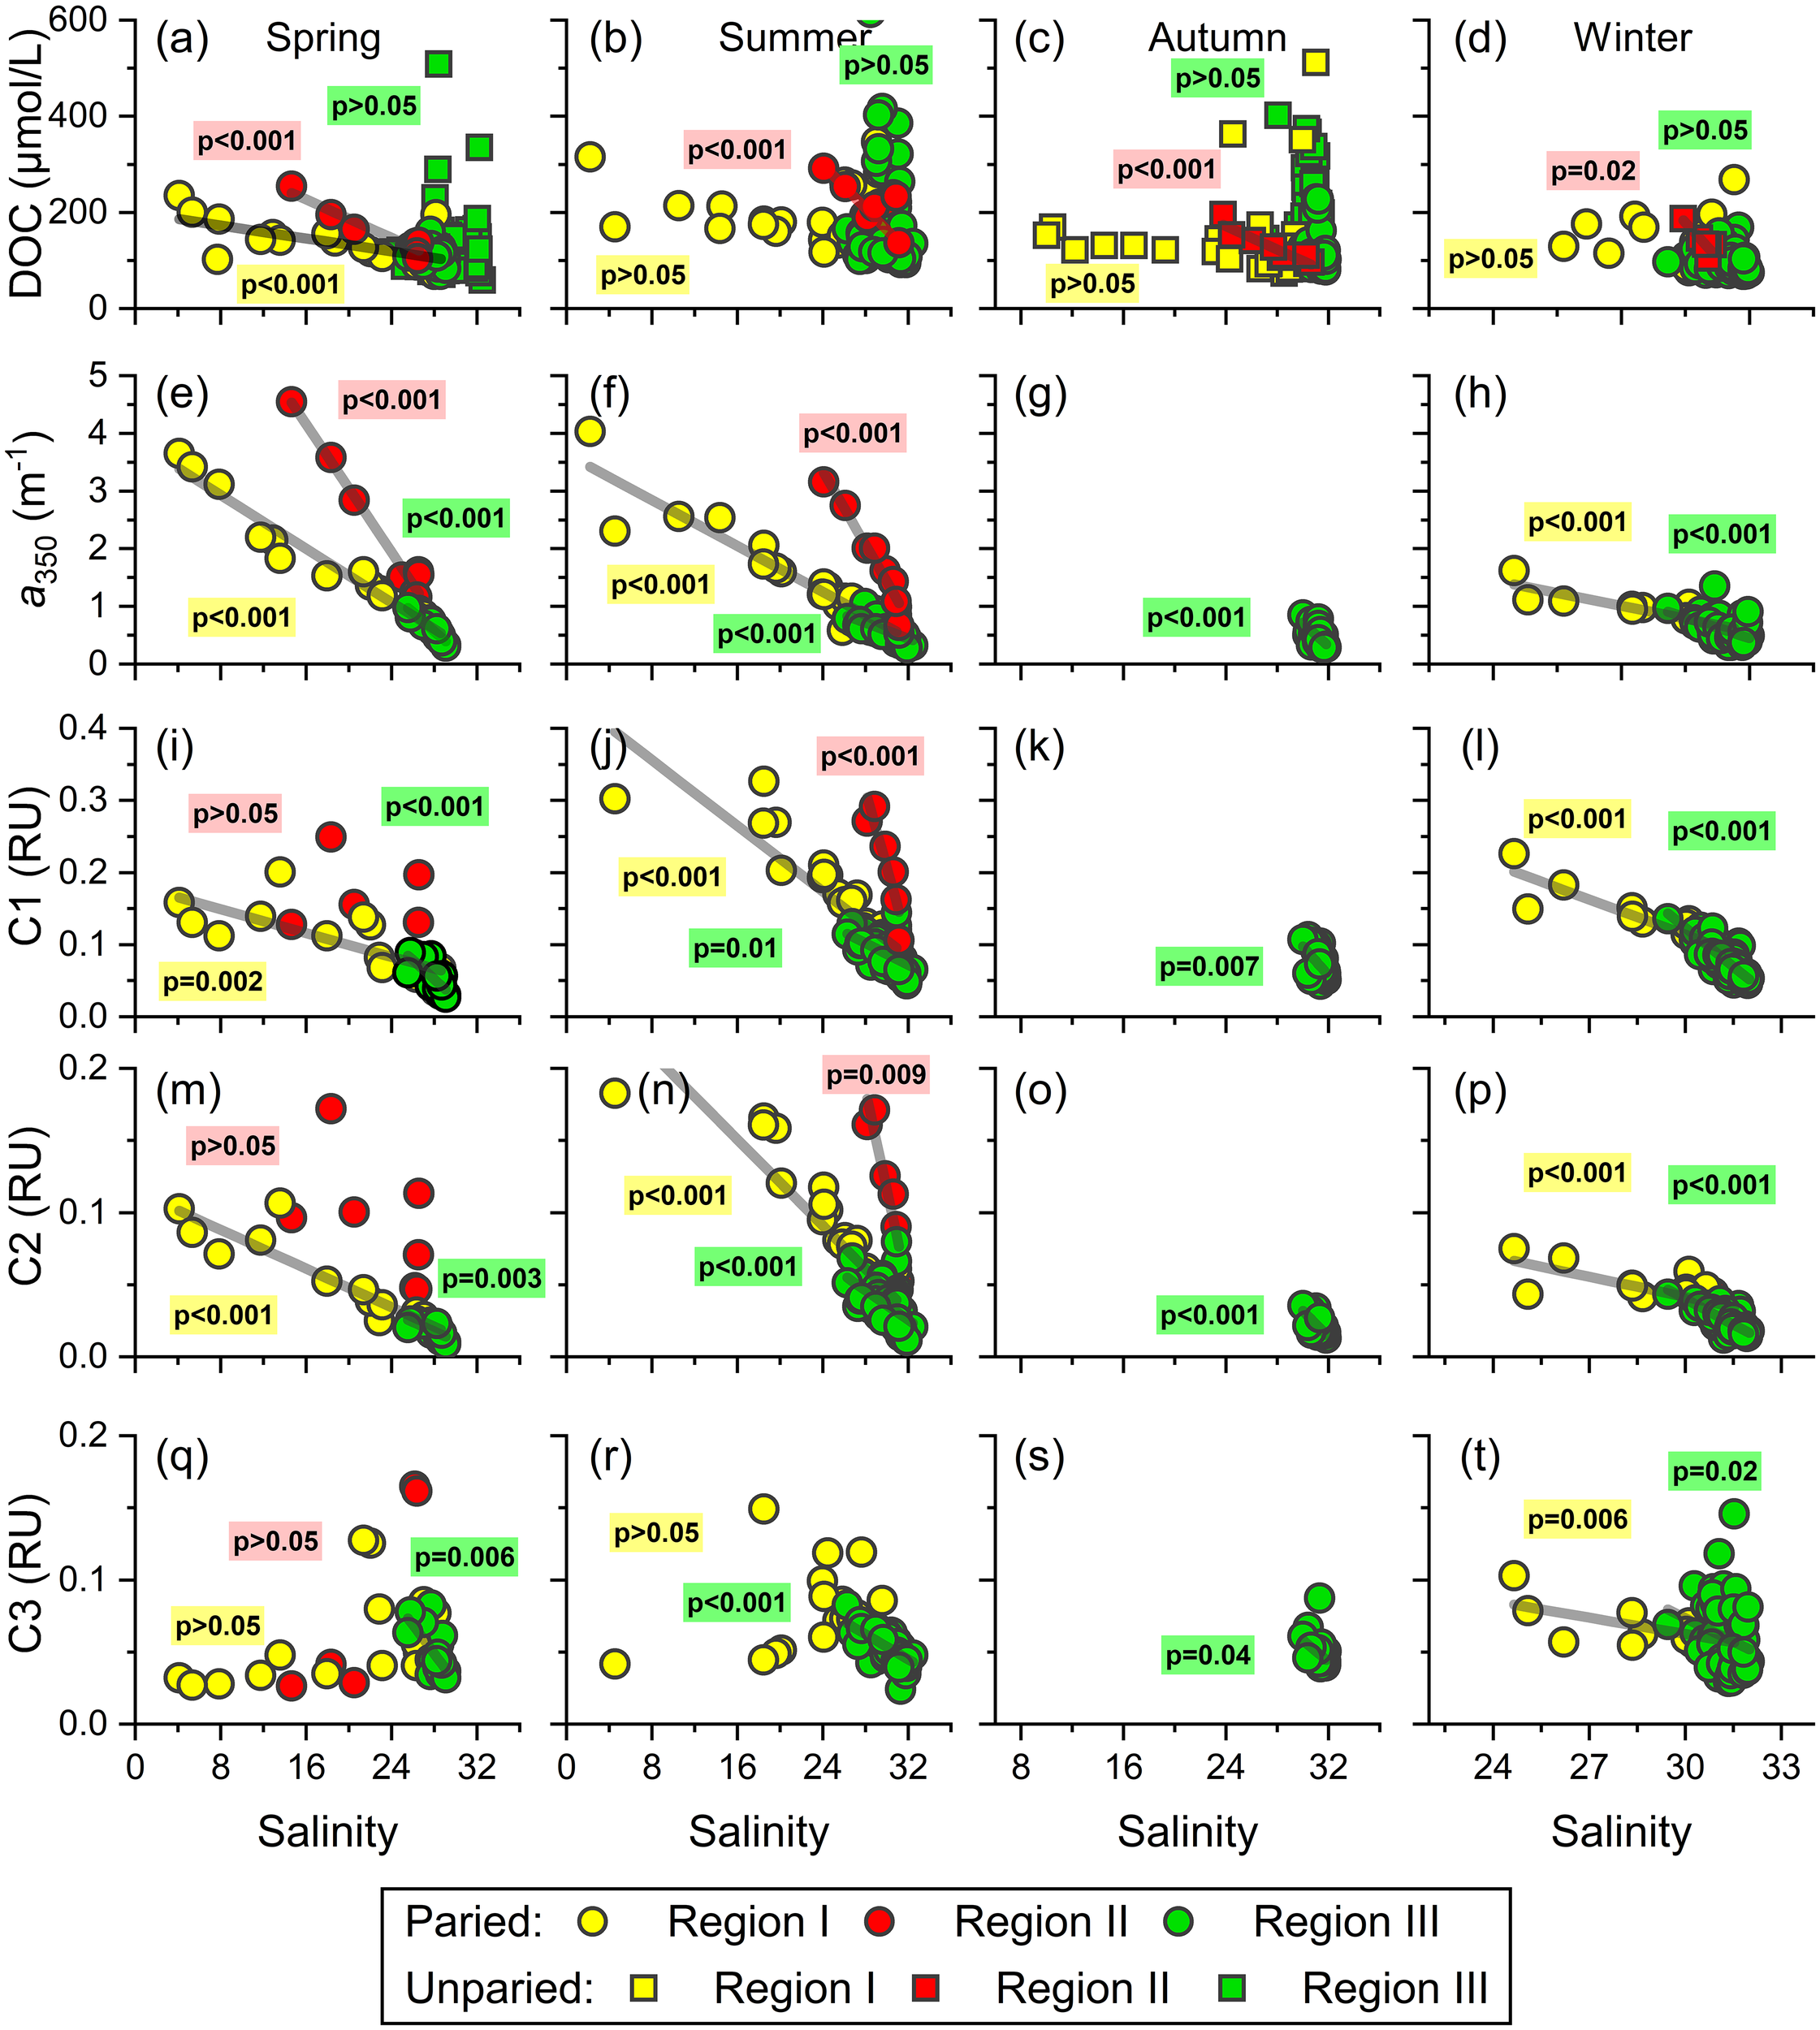
Relationships between DOM parameters and salinity in three regions of the northern Beibu Gulf over four seasons. (A–D) DOC vs. salinity, (E–H) a350 vs. salinity, (I–L) humic-like C1 vs. salinity, (M–P) humic-like C2 vs. salinity, (Q–T) protein-like C3 vs. salinity. The paired data including DOC, CDOM, and FDOM and unpaired data (only DOC) are denoted by circles and squares, respectively.
In region I, the conservative mixing behavior of bulk DOC, CDOM, and humic-like FDOM occurs over four seasons (Figures 8A–P), which may reflect the fewer changes in these variables along the estuaries. Similar behavior during estuarine mixing was reported in other estuarine and coastal systems (Jaffe et al., 2004; Guo et al., 2007; Guo et al., 2011; Li et al., 2019; Yang et al., 2019; Amaral et al., 2020). Such mixing patterns indicate that the physical mixing of fresh river water and coastal water dominates the distributions of DOC, CDOM, and humic-like FDOM in estuaries and coastal ecosystems. In contrast, the protein-like C3 points in region I in spring and summer fall below the theoretical mixing line, which indicates the removal of C3 during the estuarial mixing process (Figures 8Q, R). The protein-like FDOM components have been recognized as the labile fraction of DOM as indicated by the gradual decrease of its level during the microbial dark incubation (Yamashita and Tanoue, 2003; Xiao et al., 2021). Coupled with the negative relationships between C3 intensity and AOU in this region in spring and summer (r = −0.65, p <.001), we conclude that protein-like C3 is degraded by bacteria in estuaries.
In region II (i.e., Tieshangang Bay), no CDOM and FDOM data were measured in autumn and winter (Figures 4, 6). The quasi-conservative mixing behavior was determined for DOC over the four seasons and for CDOM and humic-like FDOM in spring and summer (Figures 8A–P). However, the protein-like FDOM does not correlate with salinity in spring (Figures 8Q, R), which might be attributed to the abovementioned anthropogenic input during the sampling period (Figure 6Q). Similar nonconservative addition from human activities has been found in other estuaries and coasts, such as the Yangtze estuary (Guo et al., 2014), thereby potentially impacting the local coastal ecosystem when consumed by microbes. Notably, the conservative mixing lines between DOM and salinity are separated into two regions (Figure 8). The slopes of DOC, CDOM, and humic-like FDOM with respect to salinity in region I are less than those in region II, suggesting that the northern Beibu Gulf receives lower levels of DOM from rivers near the region (Qin River, Maowei River, Dafeng River, and Nanliu River) relative to those from the upper Tieshangang Bay (Figures 8A–N). Conversely, the different slopes for DOC versus salinity in the two regions is lower than slopes for its optical fractions versus salinity, which implies that the two major terrigenous DOM pools delivered into the northern Beibu Gulf differ in their nature and composition. DOM from rivers surrounding region I have higher DOC-normalized CDOM and humic-like FDOM values compared with region II, and, presumably, a high potential for photochemical degradation in the coastal shelf (Helms et al., 2013).
In region III, which contains high-salinity mixing waters from the coast and the adjacent South China Sea, the additions of DOC are highlighted over the four seasons (Figures 8A–D). This result reinforces the hypothesis that DOC in the offshore water of northern Beibu Gulf comes mainly from in situ biological activities. However, the CDOM and humic-like FDOM maintain quasi-conservative behavior like those in low-salinity estuarine and coastal waters. Except for the measured low spectral slopes S275–295 (<0.025 nm−1), the lack of correlation between CDOM, humic-like FDOM, and AOU is also a noticeable feature in this region. Thus, the biogeochemical processes, such as photochemical bleaching and microbial transformation, should make a minor impact on the distribution patterns of CDOM and humic-like FDOM in the northern Beibu Gulf.
Conclusions
This study demonstrates seasonal and spatial variations of DOC and DOM optical fractions in the northern Beibu Gulf, South China Sea. The DOC and CDOM absorption coefficients and the FDOM intensities range over more than one order of magnitude. Except for spring, DOC correlates weakly with CDOM and FDOM components, indicating that different sources and processes shape their distributions in the northern Beibu Gulf. River discharges are major sources of DOM in several estuaries and coastal waters, especially in spring and summer. Anthropogenic input makes a remarkable contribution to protein-like FDOM in some specific coastal waters near cities, whereas in situ biological activity acts as a major source of DOM in offshore waters. The mixing of DOM in the northern Beibu Gulf separates spatially into three regions but does not separate seasonally. The conservative mixing dominates the distributions of DOC, CDOM, and humic-like FDOM in the nearshore waters, excluding Tieshangang Bay (region I) and Tieshangang Bay (region II). This implies that two terrestrial DOM pools with distinct optical properties are transferred into the northern Beibu Gulf. However, the protein-like FDOM in region I is nonconservative and is removed by microbes coupled with the net consumption of oxygen. In the high-salinity offshore waters (region III), the net addition of DOC suggests that it comes from in situ biological sources, whereas the CDOM and humic-like FDOM forms a quasi-conservative mixing pattern. The multiple sources and complexity of mixing for various DOM components demonstrate the dynamics of DOM in the estuarine and coastal ecosystem, which make a considerable and varied impact on the carbon cycle in ocean margins.
Funding
This work was supported by the National Natural Science Foundation of China (U20A20103), an open grant from Guangxi Key Laboratory of Beibu Gulf Marine Resources, Environment and Sustainable Development (MRESD-2022-B01), the Guangxi Funding Project (304024XM20N0006, 2019GXNSFBA185036, 2018AD19280, 2018AD19321), and the Beihai Science & Technology Project (201995037, 202082022, 202082042).
Acknowledgments
We thank all the crews on the R/V Yueke 1, R/V Yuexiayuzhi 20028, and R/V Haike 68 for their assistance with the sampling during the cruises in 2020 and 2021.
Publisher’s note
All claims expressed in this article are solely those of the authors and do not necessarily represent those of their affiliated organizations, or those of the publisher, the editors and the reviewers. Any product that may be evaluated in this article, or claim that may be made by its manufacturer, is not guaranteed or endorsed by the publisher.
Statements
Data availability statement
The raw data supporting the conclusions of this article will be made available by the authors, without undue reservation.
Author contributions
ZhZ: Conceptualization, Sampling, Sample analysis, Writing. HW: Sampling, Sample analysis, Draft preparation. YG: Data management, Editing. LZ, RJ, PS, YY, ZZ, and QZ: Conceptualization. All authors contributed to the article and approved the submitted version.
Conflict of interest
The authors declare that the research was conducted in the absence of any commercial or financial relationships that could be construed as a potential conflict of interest.
Supplementary material
The Supplementary Material for this article can be found online at: https://www.frontiersin.org/articles/10.3389/fmars.2022.1023953/full#supplementary-material
References
1
Amaral V. Romera-Castillo C. Forja J. (2021). Submarine mud volcanoes as a source of chromophoric dissolved organic matter to the deep waters of the gulf of cadiz. Sci. Rep.11, 3200. doi: 10.1038/s41598-021-82632-3
2
Amaral V. Romera-Castillo C. Garcia-Delgado M. Gomez-Parra A. Forja J. (2020). Distribution of dissolved organic matter in estuaries of the southern Iberian Atlantic basin: Sources, behavior and export to the coastal zone. Mar. Chem.226, 103857. doi: 10.1016/j.marchem.2020.103857
3
Beusen A. H. W. Bouwman A. F. Van Beek L. P. H. Mogollon J. M. Middelburg J. J. (2016). Global riverine n and p transport to ocean increased during the 20th century despite increased retention along the aquatic continuum. Biogeosciences13, 2441–2451. doi: 10.5194/bg-13-2441-2016
4
Carpenter J. H. J. L. (1965). The Chesapeake bay institute technique for the winkler dissolved oxygen method. Limnol. Oceanogr.10, 141–143. doi: 10.4319/lo.1965.10.1.0141
5
Catala T. S. Reche I. Ramon C. L. Lopez-Sanz A. Alvarez M. Calvo E. et al . (2016). Chromophoric signatures of microbial by-products in the dark ocean. Geophys. Res. Lett.43, 7639–7648. doi: 10.1002/2016GL069878
6
Catalá T. S. Reche I. Fuentes-Lema A. Romera-Castillo C. Nieto-Cid M. Ortega-Retuerta E. et al (2015). Turnover time of fluorescent dissolved organic matter in the dark global ocean. Nature Communications6. doi: 10.1038/ncomms6986.
7
Chen R. F. Gardner G. B. (2004). High-resolution measurements of chromophoric dissolved organic matter in the Mississippi and atchafalaya river plume regions. Mar. Chem.89, 103–125. doi: 10.1016/j.marchem.2004.02.026
8
Chen M. Kim S.-H. Jung H.-J. Hyun J.-H. Choi J. H. Lee H.-J. et al . (2017). Dynamics of dissolved organic matter in riverine sediments affected by weir impoundments: Production, benthic flux, and environmental implications. Water Res.121, 150–161. doi: 10.1016/j.watres.2017.05.022
9
Chen S. L. Li Y. Hu J. Y. Zheng A. R. Huang L. F. Lin Y. S. (2011). Multiparameter cluster analysis of seasonal variation of water masses in the eastern beibu gulf. J. Oceanogr.67, 709–718. doi: 10.1007/s10872-011-0071-y
10
Coble P. G. (1996). Characterization of marine and terrestrial DOM in seawater using excitation emission matrix spectroscopy. Mar. Chem.51, 325–346. doi: 10.1016/0304-4203(95)00062-3
11
Coble P. G. (2007). Marine optical biogeochemistry: The chemistry of ocean color. Chem. Rev.107, 402–418. doi: 10.1021/cr050350+
12
Coble P. G. Del Castillo C. E. Avril B. (1998). Distribution and optical properties of CDOM in the Arabian Sea during the 1995 southwest monsoon. Deep-Sea. Res. Part Ii-Topical. Stud. Oceanogr.45, 2195–2223. doi: 10.1016/S0967-0645(98)00068-X
13
Cory R. M. Mcknight D. M. (2005). Fluorescence spectroscopy reveals ubiquitous presence of oxidized and reduced quinones in dissolved organic matter. Environ. Sci. Technol.39, 8142–8149. doi: 10.1021/es0506962
14
Dainard P. G. Guéguen C. (2013). Distribution of PARAFAC modeled CDOM components in the north pacific ocean, Bering, chukchi and Beaufort seas. Mar. Chem.157, 216–223. doi: 10.1016/j.marchem.2013.10.007
15
Dainard P. G. Guéguen C. Mcdonald N. Williams W. J. (2015). Photobleaching of fluorescent dissolved organic matter in Beaufort Sea and north Atlantic subtropical gyre. Mar. Chem.177, 630–637. doi: 10.1016/j.marchem.2015.10.004
16
Fichot C. G. Benner R. (2014). The fate of terrigenous dissolved organic carbon in a river-influenced ocean margin. Global Biogeochem. Cycles.28, 300–318. doi: 10.1002/2013GB004670
17
Gao Z. Guéguen C. (2018). Distribution of thiol, humic substances and colored dissolved organic matter during the 2015 Canadian Arctic GEOTRACES cruises. Mar. Chem.203, 1–9. doi: 10.1016/j.marchem.2018.04.001
18
Gueguen C. Itoh M. Kikuchi T. Eert J. Williams W. J. (2015). Variability in dissolved organic matter optical properties in surface waters in the amerasian basin. Front. Mar. Sci.2, 78. doi: 10.3389/fmars.2015.00078
19
Guo W. Stedmon C. A. Han Y. Wu F. Yu X. Hu M. (2007). The conservative and non-conservative behavior of chromophoric dissolved organic matter in Chinese estuarine waters. Mar. Chem.107, 357–366. doi: 10.1016/j.marchem.2007.03.006
20
Guo W. Yang L. Hong H. Stedmon C. A. Wang F. Xu J. et al . (2011). Assessing the dynamics of chromophoric dissolved organic matter in a subtropical estuary using parallel factor analysis. Mar. Chem.124, 125–133. doi: 10.1016/j.marchem.2011.01.003
21
Guo W. Yang L. Zhai W. Chen W. Osburn C. L. Huang X. et al . (2014). Runoff-mediated seasonal oscillation in the dynamics of dissolved organic matter in different branches of a large bifurcated estuaryThe changjiang estuary. J. Geophys. Research-Biogeosci.119, 776–793. doi: 10.1002/2013JG002540
22
Hansell D. A. (2013). Recalcitrant dissolved organic carbon fractions. Rev. Marine Sci.5, 421–445. doi: 10.1146/annurev-marine-120710-100757
23
Hansell D. A. Carlson C. A. Repeta D. J. Schlitzer R. (2009). Dissolved organic matter in the ocean a controversy stimulates new insights. Oceanography22, 202–211. doi: 10.5670/oceanog.2009.109
24
Hedges J. I. Keil R. G. Benner R. (1997). What happens to terrestrial organic matter in the ocean? Organic. Geochem.27, 195–212. doi: 10.1016/S0146-6380(97)00066-1
25
Helms J. R. Stubbins A. Perdue E. M. Green N. W. Chen H. Mopper K. (2013). Photochemical bleaching of oceanic dissolved organic matter and its effect on absorption spectral slope and fluorescence. Mar. Chem.155, 81–91. doi: 10.1016/j.marchem.2013.05.015
26
Helms J. R. Stubbins A. Ritchie J. D. Minor E. C. Kieber D. J. Mopper K. (2008). Absorption spectral slopes and slope ratios as indicators of molecular weight, source, and photobleaching of chromophoric dissolved organic matter. Limnol. Oceanogr.53, 955–969. doi: 10.4319/lo.2008.53.3.0955
27
Huguet A. Vacher L. Relexans S. Saubusse S. Froidefond J. M. Parlanti E. (2009). Properties of fluorescent dissolved organic matter in the gironde estuary. Organic. Geochem.40, 706–719. doi: 10.1016/j.orggeochem.2009.03.002
28
Jaffe R. Boyer J. N. Lu X. Maie N. Yang C. Scully N. M. et al . (2004). Source characterization of dissolved organic matter in a subtropical mangrove-dominated estuary by fluorescence analysis. Mar. Chem.84, 195–210. doi: 10.1016/j.marchem.2003.08.001
29
Jorgensen L. Stedmon C. A. Kragh T. Markager S. Middelboe M. Sondergaard M. (2011). Global trends in the fluorescence characteristics and distribution of marine dissolved organic matter. Mar. Chem.126, 139–148. doi: 10.1016/j.marchem.2011.05.002
30
Kaiser D. Unger D. Qiu G. (2014). Particulate organic matter dynamics in coastal systems of the northern beibu gulf. Continental. Shelf. Res.82, 99–118. doi: 10.1016/j.csr.2014.04.006
31
Kothawala D. N. Murphy K. R. Stedmon C. A. Weyhenmeyer G. A. Tranvik L. J. (2013). Inner filter correction of dissolved organic matter fluorescence. Limnol. Oceanogr.: Methods11, 616–630. doi: 10.4319/lom.2013.11.616
32
Lai J. Jiang F. Ke K. Xu M. Lei F. Chen B. (2014). Nutrients distribution and trophic status assessment in the northern beibu gulf, China. Chin. J. Oceanol. Limnol.32, 1128–1144. doi: 10.1007/s00343-014-3199-y
33
Lao Q. Liu G. Shen Y. Su Q. Gao J. Chen F. (2020). Distribution characteristics and fluxes of nutrients in the rivers of the beibu gulf. Acta Oceanol. Sin.42, 93–100. doi: 10.3969/j.issn.0253–4193.2020.12.010
34
Lao Q. Liu G. Shen Y. Su Q. Lei X. (2021a). Biogeochemical processes and eutrophication status of nutrients in the northern beibu gulf, south China. J. Earth Syst. Sci.130, 199. doi: 10.1007/s12040-021-01706-y
35
Lao Q. Liu G. Zhou X. Chen F. Zhang S. (2021b). Sources of polychlorinated biphenyls (PCBs) and dichlorodiphenyltrichloroethanes (DDTs) found in surface sediment from coastal areas of beibu gulf: A reflection on shipping activities and coastal industries. Mar. Pollut. Bull.167, 112318. doi: 10.1016/j.marpolbul.2021.112318
36
Lao Q. Su Q. Liu G. Shen Y. Chen F. Lei X. et al . (2019). Spatial distribution of and historical changes in heavy metals in the surface seawater and sediments of the beibu gulf, China. Mar. Pollut. Bull.146, 427–434. doi: 10.1016/j.marpolbul.2019.06.080
37
Lao Q. Zhang S. Li Z. Chen F. Zhou X. Jin G. et al . (2022). Quantification of the seasonal intrusion of water masses and their impact on nutrients in the beibu gulf using dual water isotopes. J. Geophys. Research-Oceans.127, e2021JC018065. doi: 10.1029/2021JC018065
38
Lawaetz A. J. Stedmon C. A. (2009). Fluorescence Intensity Calibration Using the Raman Scatter Peak of Water. Applied Spectroscopy63, 936–40. doi: 10.1366/000370209788964548
39
Levshina S. I. (2008). Dissolved and suspended organic matter in the amur and songhua river water. Water Resour.35, 716–724. doi: 10.1134/s0097807808060110
40
Liao W. Hu J. Zhou H. Hu J. Peng P. A. Deng W. (2018). Sources and distribution of sedimentary organic matter in the beibu gulf, China: Application of multiple proxies. Mar. Chem.206, 74–83. doi: 10.1016/j.marchem.2018.09.006
41
Li N. Chen X. Zhao H. Tang J. Jiang G. Li Z. et al . (2020). Spatial distribution and functional profile of the bacterial community in response to eutrophication in the subtropical beibu gulf, China. Mar. Pollut. Bull.161, 111742. doi: 10.1016/j.marpolbul.2020.111742
42
Li Y. Song G. Massicotte P. Yang F. Li R. Xie H. (2019). Distribution, seasonality, and fluxes of dissolved organic matter in the pearl river (Zhujiang) estuary, China. Biogeosciences16, 2751–2770. doi: 10.5194/bg-16-2751-2019
43
Liu D. Bai Y. He X. Q. Chen C. T. A. Huang T. H. Pan D. L. et al . (2020). Changes in riverine organic carbon input to the ocean from mainland China over the past 60 years. Environ. Int.134, 105258. doi: 10.1016/j.envint.2019.105258
44
Massicotte P. Asmala E. Stedmon C. Markager S. (2017). Global distribution of dissolved organic matter along the aquatic continuum: Across rivers, lakes and oceans. Sci. Total. Environ.609, 180–191. doi: 10.1016/j.scitotenv.2017.07.076
45
Meng F. Wang Z. Cheng F. Du X. Fu W. Wang Q. et al . (2013). The assessment of environmental pollution along the coast of beibu gulf, northern south China Sea: An integrated biomarker approach in the clam meretrix meretrix. Mar. Environ. Res.85, 64–75. doi: 10.1016/j.marenvres.2013.01.003
46
Murphy K. R. Hambly A. Singh S. Henderson R. K. Baker A. Stuetz R. et al . (2011). Organic matter fluorescence in municipal water recycling schemes: Toward a unified PARAFAC model. Environ. Sci. Technol.45, 2909–2916. doi: 10.1021/es103015e
47
Murphy K. R. Stedmon C. A. Graeber D. Bro R. (2013). Fluorescence spectroscopy and multi-way techniques. PARAFAC. Anal. Methods5, 6557–6566. doi: 10.1039/c3ay41160e
48
Murphy K. R. Stedmon C. A. Wenig P. Bro R. (2014). OpenFluor–an online spectral library of auto-fluorescence by organic compounds in the environment. Anal. Methods6, 658–661. doi: 10.1039/C3AY41935E
49
Nelson N. B. Siegel D. A. Carlson C. A. Swan C. M. (2010). Tracing global biogeochemical cycles and meridional overturning circulation using chromophoric dissolved organic matter. Geophys. Res. Lett.37, L03610. doi: 10.1029/2009GL042325
50
Noureddin S. Courtot P. (1989). Conservative behavior of humic substances in a macrotidal estuary–composition of particulate and dissolved phases. Oceanol. Acta12, 381–391.
51
Qu L. He C. Wu Z. Dahlgren R. A. Ren M. Li P. et al . (2022). Hypolimnetic deoxygenation enhanced production and export of recalcitrant dissolved organic matter in a large stratified reservoir. Water Res.219, 118537. doi: 10.1016/j.watres.2022.118537
52
Raymond P. A. Spencer R. G. M. (2015). “Chapter 11 - riverine DOM,” in Biogeochemistry of marine dissolved organic matter (Second edition). Eds. HansellD. A.CarlsonC. A. (Cambridge: Academic Press), 509–533. doi: 10.1016/B978-0-12-405940-5.00011-X.
53
Rochelle-Newall E. J. Fisher T. R. (2002). Production of chromophoric dissolved organic matter fluorescence in marine and estuarine environments: An investigation into the role of phytoplankton. Mar. Chem.77, 7–21. doi: 10.1016/S0304-4203(01)00072-X
54
Shank G. C. Zepp R. G. Whitehead R. F. Moran M. A. (2005). Variations in the spectral properties of freshwater and estuarine CDOM caused by partitioning onto river and estuarine sediments. Estuar. Coast. Shelf. Sci.65, 289–301. doi: 10.1016/j.ecss.2005.06.009
55
Spencer R. G. M. Baker A. Ahad J. M. E. Cowie G. L. Ganeshram R. Upstill-Goddard R. C. et al . (2007). Discriminatory classification of natural and anthropogenic waters in two UK estuaries. Sci. Total. Environ.373, 305–323. doi: 10.1016/j.scitotenv.2006.10.052
56
Stedmon C. A. Bro R. (2008). Characterizing dissolved organic matter fluorescence with parallel factor analysis: a tutorial. Limnol. Oceanography-Methods.6, 572–579. doi: 10.4319/lom.2008.6.572
57
Stedmon C. A. Markager S. (2003). Behaviour of the optical properties of coloured dissolved organic matter under conservative mixing. Estuar. Coast. Shelf. Sci.57, 973–979. doi: 10.1016/S0272-7714(03)00003-9
58
Stedmon C. A. Nelson N. B. (2015). “Chapter 10 - the optical properties of DOM in the ocean,” in Biogeochemistry of marine dissolved organic matter (Second edition). Eds. HansellD. A.CarlsonC. A. (Cambridge: Academic Press), 481–508. doi: 10.1016/B978-0-12-405940-5.00010-8
59
Stedmon C. A. Osburn C. L. Kragh T. (2010). Tracing water mass mixing in the Baltic-north Sea transition zone using the optical properties of coloured dissolved organic matter. Estuar. Coast. Shelf. Sci.87, 156–162. doi: 10.1016/j.ecss.2009.12.022
60
Tian Y. Q. Yu Q. Feig A. D. Ye C. Blunden A. (2013). Effects of climate and land-surface processes on terrestrial dissolved organic carbon export to major U.S. coastal rivers. Ecol. Eng.54, 192–201. doi: 10.1016/j.ecoleng.2013.01.028
61
Wang C. Guo W. Li Y. Dahlgren R. A. Guo X. Qu L. et al . (2021a). Temperature-regulated turnover of chromophoric dissolved organic matter in global dark marginal basinsGeophysical Research Letters48, e2021GL094035. doi: 10.1029/2021GL094035.
62
Wang C. Guo W. D. Li Y. Stubbins A. Li Y. Z. Song G. D. et al . (2017). Hydrological and biogeochemical controls on absorption and fluorescence of dissolved organic matter in the northern south China Sea. J. Geophys. Research-Biogeosci.122, 3405–3418. doi: 10.1002/2017JG004100
63
Wang C. Li Y. Li Y. Zhou H. Stubbins A. Dahlgren R. A. et al . (2021b). Dissolved organic matter dynamics in the epipelagic northwest Pacific low-latitude western boundary current system: Insights from optical analyses. J. Geophys. Res.: Oceans.126, e2021JC017458. doi: 10.1029/2021JC017458
64
Wang L. Pan W. Zhuang W. Yan X.-H. Klemas V. V. (2018). Analysis of seasonal characteristics of water exchange in beibu gulf based on a particle tracking model. Regional. Stud. Mar. Sci.18, 35–43. doi: 10.1016/j.rsma.2017.12.009
65
Weishaar J. L. Aiken G. R. Bergamaschi B. A. Fram M. S. Fujii R. Mopper K. (2003). Evaluation of specific ultraviolet absorbance as an indicator of the chemical composition and reactivity of dissolved organic carbon. Environ. Sci. Technol.37, 4702–4708. doi: 10.1021/es030360x
66
Wu K. Dai M. H. Chen J. H. Meng F. F. Li X. L. Liu Z. Y. et al . (2015). Dissolved organic carbon in the south China Sea and its exchange with the Western pacific ocean. Deep-Sea. Res. Part Ii-Topical. Stud. Oceanogr.122, 41–51. doi: 10.1016/j.dsr2.2015.06.013
67
Xiao X. Guo W. Li X. Wang C. Chen X. Lin X. et al . (2021). Viral lysis alters the optical properties and biological availability of dissolved organic matter derived from Prochlorococcus picocyanobacteria. Appl. Environ. Microbiol.87, e02271–e02220. doi: 10.1128/AEM.02271-20
68
Xu Y. Zhang T. Zhou J. (2019). Historical occurrence of algal blooms in the northern beibu gulf of China and implications for future trends. Front. Microbiol.10, 451. doi: 10.3389/fmicb.2019.00451
69
Yamashita Y. Fichot C. G. Shen Y. Jaffe R. Benner R. (2015). Linkages among fluorescent dissolved organic matter, dissolved amino acids and lignin-derived phenols in a river-influenced ocean margin. Front. Mar. Sci.2, 92. doi: 10.3389/fmars.2015.00092
70
Yamashita Y. Tanoue E. (2003). Distribution and alteration of amino acids in bulk DOM along a transect from bay to oceanic waters. Mar. Chem.82, 145–160. doi: 10.1016/S0304-4203(03)00049-5
71
Yang L. Cheng Q. Zhuang W.-E. Wang H. Chen W. (2019). Seasonal changes in the chemical composition and reactivity of dissolved organic matter at the land-ocean interface of a subtropical river. Environ. Sci. Pollut. Res.26, 24595–24608. doi: 10.1007/s11356-019-05700-2
72
Yang L. Chen C.-T. A. Hong H. Chang Y.-C. Lui H.-K. (2015b). Mixing behavior and bioavailability of dissolved organic matter in two contrasting subterranean estuaries as revealed by fluorescence spectroscopy and parallel factor analysis. Estuar. Coast. Shelf. Sci.166, 161–169. doi: 10.1016/j.ecss.2014.10.018
73
Yang L. Guo W. Hong H. Wang G. (2013a). Non-conservative behaviors of chromophoric dissolved organic matter in a turbid estuary: Roles of multiple biogeochemical processes. Estuar. Coast. Shelf. Sci.133, 285–292. doi: 10.1016/j.ecss.2013.09.007
74
Yang L. Hong H. Chen C.-T. A. Guo W. Huang T.-H. (2013b). Chromophoric dissolved organic matter in the estuaries of populated and mountainous Taiwan. Mar. Chem.157, 12–23. doi: 10.1016/j.marchem.2013.07.002
75
Yang F. Song G. Massicotte P. Wei H. Xie H. (2020). Depth-resolved photochemical lability of dissolved organic matter in the Western tropical pacific ocean. J. Geophys. Res.: Biogeosci.125, e2019JG005425. doi: 10.1029/2019JG005425
76
Yang J. Wang W. Zhao M. Chen B. Dada O. A. Chu Z. (2015a). Spatial distribution and historical trends of heavy metals in the sediments of petroleum producing regions of the beibu gulf, China. Mar. pollut. Bull.91, 87–95. doi: 10.1016/j.marpolbul.2014.12.023
77
Zhang L. Xue M. Wang M. Cai W.-J. Wang L. Yu Z. (2014). The spatiotemporal distribution of dissolved inorganic and organic carbon in the main stem of the changjiang (Yangtze) river and the effect of the three gorges reservoir. J. Geophys. Research-Biogeosci.119, 741–757. doi: 10.1002/2012JG002230
78
Zhu Z. Wei H. Guan Y. Zhang L. Sun P. Zhang Q. (2022a). Spatial and seasonal characteristics of dissolved heavy metals in the seawater of beibu gulf, the northern south China Sea. 9. doi: 10.3389/fmars.2022.996202
79
Zhu Z. Wei H. Huang W. Wu X. Guan Y. Zhang Q. (2022b). Occurrence of microplastic pollution in the beibu gulf, the northern of south China Sea. Front. Mar. Sci. 8 . doi: 10.3389/fmars.2021.821008
80
Zhu Z. Zheng A. (2013). Distributions and sources of heavy metals in seawater of the northern beibu gulf. Adv. Mater. Res.807-809, 7–13. doi: 10.4028/www.scientific.net/AMR.807-809.7
81
Zsolnay A. Baigar E. Jimenez M. Steinweg B. Saccomandi F. (1999). Differentiating with fluorescence spectroscopy the sources of dissolved organic matter in soils subjected to drying. Chemosphere38, 45–50. doi: 10.1016/S0045-6535(98)00166-0
Summary
Keywords
northern Beibu Gulf, dissolved organic carbon, chromophoric dissolved organic matter, fluorescent dissolved organic matter, parafac, seasonality
Citation
Zhu Z, Wei H, Guan Y, Zhang L, Jia R, Sun P, Yang Y, Zhang Z and Zhang Q (2022) Distribution, spectral characteristics, and seasonal variation of dissolved organic matter in the northern Beibu Gulf, South China Sea. Front. Mar. Sci. 9:1023953. doi: 10.3389/fmars.2022.1023953
Received
20 August 2022
Accepted
26 September 2022
Published
19 October 2022
Volume
9 - 2022
Edited by
Guangzhe Jin, Guangdong Ocean University, China
Reviewed by
Xilin Xiao, Xiamen University, China; Liyin Qu, Wenzhou University, China
Updates
Copyright
© 2022 Zhu, Wei, Guan, Zhang, Jia, Sun, Yang, Zhang and Zhang.
This is an open-access article distributed under the terms of the Creative Commons Attribution License (CC BY). The use, distribution or reproduction in other forums is permitted, provided the original author(s) and the copyright owner(s) are credited and that the original publication in this journal is cited, in accordance with accepted academic practice. No use, distribution or reproduction is permitted which does not comply with these terms.
*Correspondence: Yao Guan, guanyao@4io.org.cn
This article was submitted to Marine Biogeochemistry, a section of the journal Frontiers in Marine Science
Disclaimer
All claims expressed in this article are solely those of the authors and do not necessarily represent those of their affiliated organizations, or those of the publisher, the editors and the reviewers. Any product that may be evaluated in this article or claim that may be made by its manufacturer is not guaranteed or endorsed by the publisher.